the need to increase ghana's per capita electricity generation substantially to sustain...
TRANSCRIPT

THE NEED TO INCREASE GHANA’S PER CAPITA ELECTRICITY GENERATION SUBSTANTIALLY TO
SUSTAIN DEVELOPMENT AND GROWTH
By: Dr. -‐ Ing. J. K. D. Annan, FGhIE; JKD NANNA CONSULT m: +(233)244317182 +(233)541719555 e: [email protected] [email protected]
JKD NANNA CONSULT, Version 21 Sunday, September 15th, 2013
2 © 2013 JKD NANNA CONSULT
Foreword
I have had various technical and scientific discussions and arguments, and my concerns have been buttressed as follows:
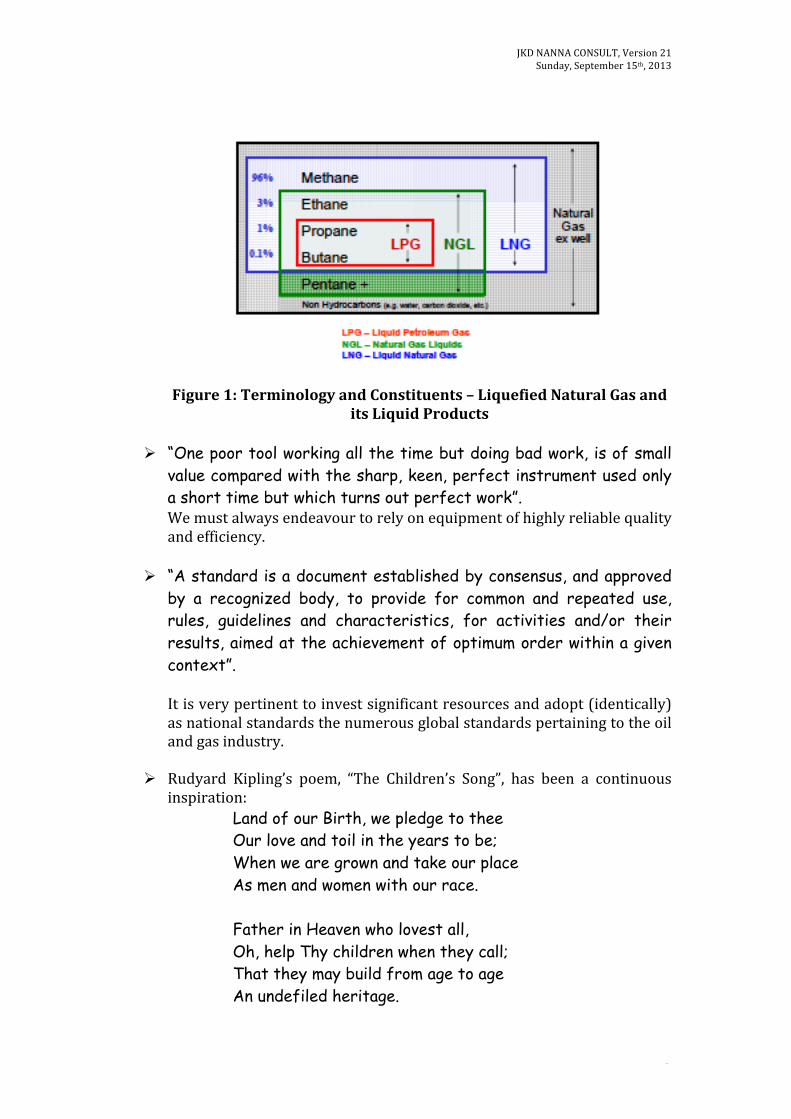
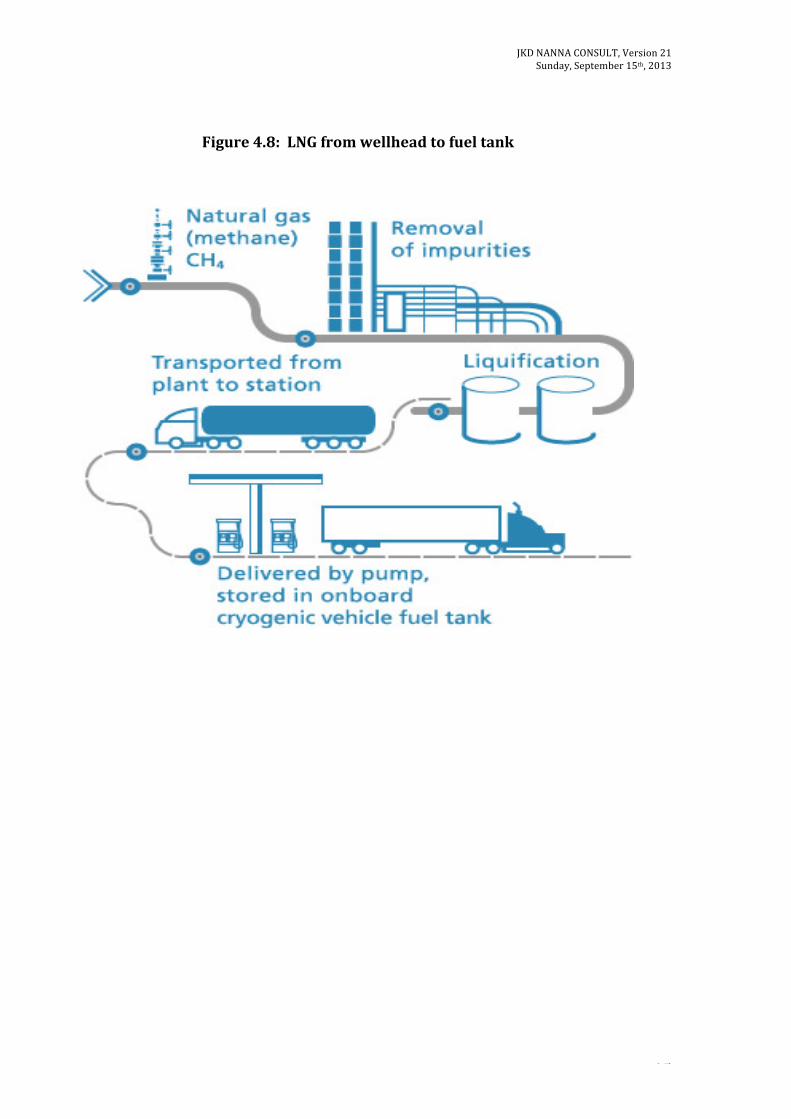
Ø “Knowledge that cannot be utilized by the ignorant is best utilized by the wise”. We must eschew charlatanism. An example is the fact that as an emerging country in the oil and gas industry, so many people associated with this sector do not understand the difference between LNG (liquefied natural gas) and LPG (liquefied petroleum gas). Very serious blunders are apt to be committed because of this basic and fundamental error, and affect process design and equipment selection. What is LNG (Liquefied Natural Gas)? Natural gas is composed primarily of methane, but may also contain ethane, propane and heavier hydrocarbons. Small quantities of nitrogen, oxygen, carbon dioxide, sulfur compounds, and water may also be found in “pipeline” natural gas. The liquefaction process removes the oxygen, carbon dioxide, sulfur compounds, and water. The process can also be designed to purify the LNG to almost 100% methane. When natural gas is cooled to a temperature of approximately -‐259oF (-‐161oC) at atmospheric pressure, it condenses to a clear, colourless, odourless liquid called liquefied natural gas (LNG). One unit volume of this liquid takes up about 1/600th the volume of natural gas. LNG is neither corrosive nor toxic. LNG yields about 40% more heating value than any liquid fuel derived from the chemical conversion of natural gas. What is LPG (Liquefied Petroleum Gas)? Liquefied petroleum gas (LPG) is often confused with LNG and vice versa. They are not the same and the differences are significant. LPG is composed primarily of propane (upwards to 95%) and smaller quantities of butane. (Reference: Figure 1) LPG can be stored as a liquid in tanks by applying pressure alone.
JKD NANNA CONSULT, Version 21 Sunday, September 15th, 2013
3 © 2013 JKD NANNA CONSULT
Figure 1: Terminology and Constituents – Liquefied Natural Gas and its Liquid Products
Ø “One poor tool working all the time but doing bad work, is of small
value compared with the sharp, keen, perfect instrument used only a short time but which turns out perfect work”. We must always endeavour to rely on equipment of highly reliable quality and efficiency.
Ø “A standard is a document established by consensus, and approved by a recognized body, to provide for common and repeated use, rules, guidelines and characteristics, for activities and/or their results, aimed at the achievement of optimum order within a given context”. It is very pertinent to invest significant resources and adopt (identically) as national standards the numerous global standards pertaining to the oil and gas industry.
Ø Rudyard Kipling’s poem, “The Children’s Song”, has been a continuous inspiration:
Land of our Birth, we pledge to thee Our love and toil in the years to be; When we are grown and take our place As men and women with our race. Father in Heaven who lovest all, Oh, help Thy children when they call; That they may build from age to age An undefiled heritage.

JKD NANNA CONSULT, Version 21 Sunday, September 15th, 2013
4 © 2013 JKD NANNA CONSULT
Teach us to bear the yoke in youth, With steadfastness and careful truth; That, in our time, Thy Grace may give The Truth whereby the Nations live. Teach us to rule ourselves alway, Controlled and cleanly night and day; That we may bring, if need arise, No maimed or worthless sacrifice. Teach us to look in all our ends On Thee for judge, and not our friends; That we, with Thee, may walk uncowed By fear or favour of the crowd. Teach us the Strength that cannot seek, By deed or thought, to hurt the weak; That, under Thee, we may possess Man's strength to comfort man's distress. Teach us Delight in simple things, And Mirth that has no bitter springs; Forgiveness free of evil done, And Love to all men 'neath the sun! Land of our Birth, our faith, our pride, For whose dear sake our fathers died; Oh, Motherland, we pledge to thee Head, heart and hand through the years to be!
JKD NANNA CONSULT, Version 21 Sunday, September 15th, 2013
5 © 2013 JKD NANNA CONSULT
Chapter 1. Introduction Ghana as a developing and emerging economy faces a three-fold energy challenge, namely:
I. Meeting the needs of people who still lack access to basic, modern energy services;
II. Meeting the country’s industrial and economic development agenda; and III. Participating in a global transition to clean, low-carbon energy systems.
All these aspects of this challenge demand urgent attention. Firstly, access to reliable, affordable and socially acceptable energy services is a pre-requisite to alleviating extreme poverty and meeting other societal development goals. Secondly, the country’s avowed aim of attaining a standard of living akin to a middle-income country would hinge upon the corresponding economic and industrial activities. Thirdly, global emissions are purported to be contributing to environmental problems, such as climate change and poor air quality, that put the health and prosperity of people around the world—but especially those in poor countries—at grave risk. Historically, humanity’s use of energy has been marked by four broad trends:
1. Rising consumption and a transition from traditional sources of energy (e.g., wood, dung, agricultural residues) to commercial forms of energy (e.g., electricity, fossil fuels);
2. Steady improvement in the power and efficiency of energy technologies; 3. A tendency (at least for most of the 20th century) toward fuel diversification,
and de-carbonization, especially for electricity production; and 4. Improved pollution control and lower emissions.
Ghana has to maximize the effective use of natural energy resources to sustain economic growth and improve the quality of life of the people. It would be necessary to accelerate the use of energy efficiency and lower-carbon energy sources, especially natural gas. This acceleration would have many concurrent benefits for Ghana in terms of reducing pollution and improving public health, making feasible a broad expansion of access to basic energy services and laying the foundation for more competitive industries and sustainable economic growth. Moreover, to the extent that sustainable energy policies promote the development of indigenous renewable-energy industries, when feasible, there would be the additional benefit of creating new economic opportunities, reducing Ghana’s exposure to volatile world energy markets and help in conserving resources for internal investment by curbing outlays for imported fuel.

JKD NANNA CONSULT, Version 21 Sunday, September 15th, 2013
6 © 2013 JKD NANNA CONSULT
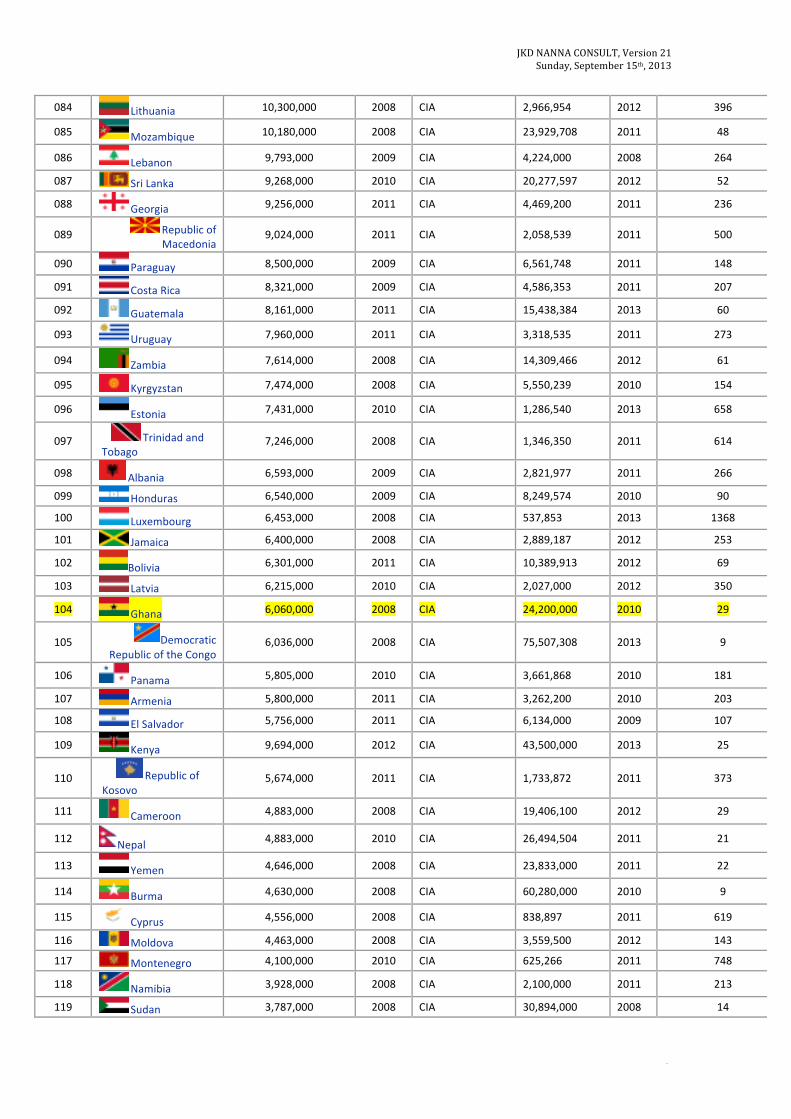
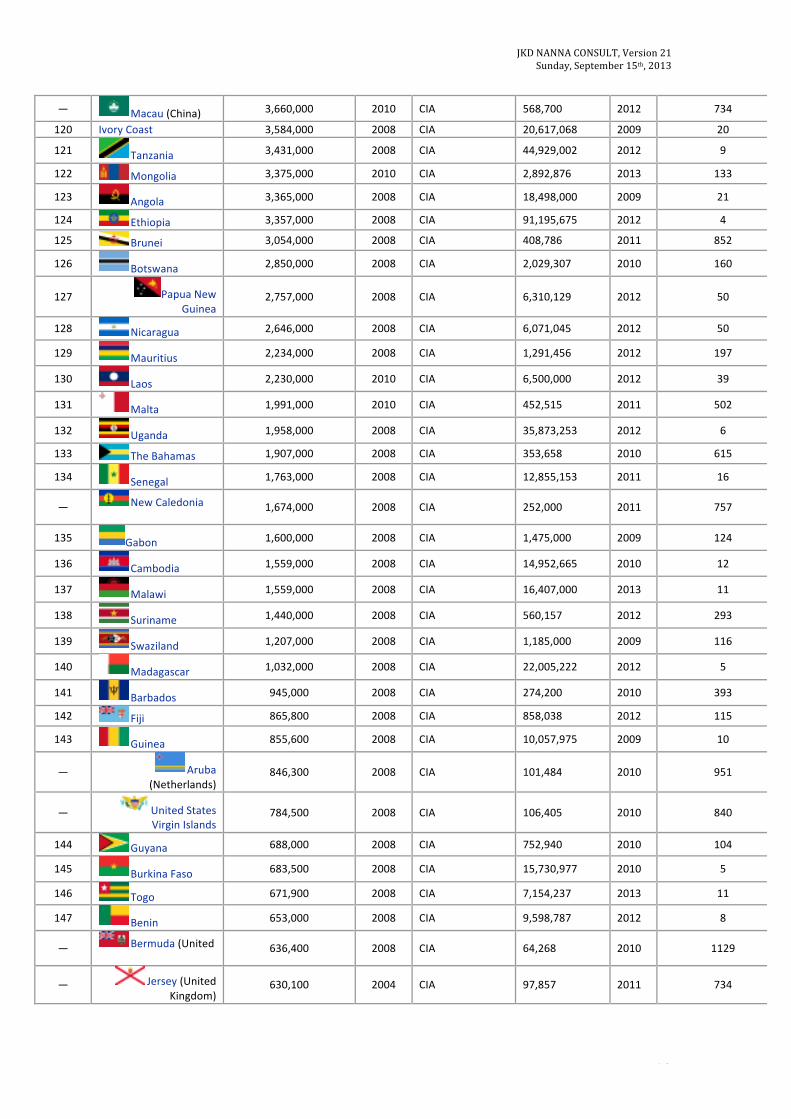
Chapter 2. Current Situation Ghana is currently being confronted with significant challenges in the energy sector, with per capita electricity consumption levels far lower than the expected levels to enable Ghana assert and sustain the requisite development agenda consistent with such expectations. Data provided in Table 2-1. confirms this current assertion. Table 2-2. indicates a sample calculation of electricity consumption per capita. Electricity demand is rising and there are no indications that this demand will be curbed significantly in the short and medium term. At the same time, the electricity generating capacity is aging and new electricity generating capacity should be developed to fill the gap that has developed between electricity demand and supply. Our power generation sector will therefore continue to be under severe strain in the coming years, and the expected consequences for the Ghanaian economy and the standard of living of Ghana’s citizens.
Table 2-‐1. Electricity consumption per capita worldwide Electric power per capita [ in watt ] = Total population electricity consumption [ in MW·∙h/yr ] ·∙ 1,000,000/(365.25 x 24)/population.
Electric power per capita [ in watt ] = Total population electricity consumption [ in MW·∙h/yr ] ·∙ 114.077116/population.
1 MW·∙h/yr = 1,000,000 Wh/(365.25 x 24)h = 114.077116 Watt
Rank Country Electricity consumption (MW·∙h/yr)
Year of Data Source Population As of Average power per
capita (watts per person)
— World 19,320,360,620 2002-‐10 all sources ~7,035,000,000 2005-‐12 313
001 China 4,693,000,000 2011 CIA 1,353,821,000 2012 395
002 United States 3,886,400,000 2010 US DoE 316,090,000 2013 1402
— European Union 3,037,000,000 2009 CIA 503,492,041 2012 688
003 Russia 1,016,500,000 2012 [Ministry of Energy (Russia)] 143,400,000 2013 808
004 India 959,070,000 2011 MOSPI 1,210,193,422 2011 90
005 Japan 859,700,000 2011 CIA 126,659,683 2012 774
006 Germany 607,000,000 2011 BDEW 80,333,700 2012 861
007 Canada 549,500,000 2008 CIA 33,476,688 2011 1871
008 France 460,900,000 2008 CIA 65,350,000 2012 804
009 Brazil 455,700,000 2010 CIA 193,946,886 2012 268
010 South Korea 455,100,000 2011 CIA 50,004,441 2012 1038
011 United Kingdom 344,700,000 2008 CIA 63,181,775 2011 622
012 Italy 309,900,000 2010 CIA 59,530,464 2012 581

JKD NANNA CONSULT, Version 21 Sunday, September 15th, 2013
7 © 2013 JKD NANNA CONSULT
013 Spain 267,500,000 2008 CIA 47,265,321 2012 645
014 Turkey 242,000,000 2012 75,627,384 2013 365
015 Australia 225,400,000 2008 CIA 23,060,903 2013 1114
016 Taiwan 220,800,000 2009 CIA 23,315,822 2012 1080
017 South Africa 212,200,000 2008 CIA 52,982,000 2013 457
018 Iran 206,700,000 2009 CIA 77,356,669 2013 305
019 Ukraine 181,500,000 2009 CIA 44,854,065 2012 461
020 Saudi Arabia 174,500,000 2008 CIA 29,195,895 2012 681
021 Mexico 134,600,000 2009 CIA 117,409,830 2013 131
022 Poland 132,200,000 2008 CIA 38,501,000 2011 391
023 Sweden 132,100,000 2008 CIA 9,555,893 2012 1576
024 Thailand 131,600,000 2008 CIA 66,720,153 2011 225
025 Indonesia 126,100,000 2008 CIA 237,424,363 2011 61
026 Norway 115,600,000 2008 CIA 5,063,709 2013 2603
027 Netherlands 112,500,000 2008 CIA 16,788,973 2013 764
028 Egypt 109,100,000 2008 CIA 84,550,000 2013 147
029 Argentina 104,700,000 2008 CIA 41,737,066 2012 286
030 Vietnam 101,000,000 2011 CIA 90,388,000 2012 127
031 Malaysia 93,800,000 2009 CIA 28,334,135 2010 377
032 Kazakhstan 88,110,000 2011 CIA 16,967,000 2013 593
033 Venezuela 85,850,000 2011 CIA 28,946,101 2011 338
034 Belgium 84,780,000 2008 CIA 11,035,948 2012 876
035 Finland 83,090,000 2008 CIA 5,421,827 2012 1747
036 Pakistan 74,350,000 2010 CIA 180,440,005 2012 47
037 United Arab Emirates
70,580,000 2008 CIA 8,264,070 2010 974
038 Austria 65,670,000 2009 CIA 8,414,638 2011 890
039 Greece 59,530,000 2008 CIA 10,815,197 2011 627
040 Czech Republic 59,260,000 2010 CIA 10,513,209 2012 643
041 Switzerland 57,500,000 2009 CIA 8,014,000 2012 818
042 Chile 56,350,000 2008 CIA 17,402,630 2012 369
043 Iraq 55,660,000 2010 CIA 31,129,225 2012 204
044 Philippines 54,400,000 2009 CIA 103,775,517 2013 60
045 Romania 51,460,000 2010 CIA 18,631,386 2013 315
046 Portugal 48,270,000 2008 CIA 10,581,949 2012 520
047 Israel 47,160,000 2008 CIA 8,002,300 2013 672
— Hong Kong (China)
43,140,000 2011 CIA 7,061,200 2010 696

JKD NANNA CONSULT, Version 21 Sunday, September 15th, 2013
8 © 2013 JKD NANNA CONSULT
048 Kuwait 42,580,000 2008 CIA 2,818,042 2012 1723
049 Hungary 42,570,000 2010 CIA 9,942,000 2012 488
050 Singapore 41,200,000 2010 CIA 5,312,400 2012 884
051 Uzbekistan 40,100,000 2009 CIA 29,559,100 2012 155
052 Bangladesh 39,100,000 2012 BP 161,083,804 2012 28
053 Colombia 38,820,000 2008 CIA 47,072,915 2012 94
054 New Zealand 38,271,000 2009 MED 4,468,200 2013 976
055 Serbia 35,500,000 2011 CIA 7,186,862 2011 563
056 Peru 34,250,000 2011 CIA 30,475,144 2013 128
057 Denmark 32,070,000 2010 CIA 5,687,591 2012 643
058 Belarus 31,070,000 2008 CIA 9,457,500 2012 375
059 Algeria 30,500,000 2008 CIA 37,900,000 2012 92
060 Syria 28,990,000 2008 CIA 22,530,746 2012 147
061 Slovakia 28,760,000 2010 CIA 5,410,836 2012 606
062 Bulgaria 28,300,000 2009 CIA 7,364,570 2011 438
063 Republic of Ireland
26,100,000 2011 CIA 4,588,252 2011 648
064 Libya 22,890,000 2008 CIA 5,670,688 2006 460
065 Morocco 21,470,000 2008 CIA 32,878,400 2012 74
— Puerto Rico (United States)
19,460,000 2008 CIA 3,667,084 2012 605
066 Croatia 18,870,000 2010 CIA 4,284,889 2011 502
067 North Korea 18,850,000 2008 CIA 24,554,000 2011 88
068 Azerbaijan 18,800,000 2008 CIA 9,356,500 2013 229
069 Qatar 18,790,000 2008 CIA 1,903,447 2013 1125
070 Nigeria 18,140,000 2008 CIA 170,123,740 2012 12
071 Tajikistan 16,700,000 2009 CIA 7,616,000 2011 250
072 Iceland 16,480,000 2009 CIA 321,857 2012 5837
073 Ecuador 14,920,000 2008 CIA 15,223,680 2011 112
074 Slovenia 14,700,000 2009 CIA 2,055,496 2012 815
075 Cuba 14,200,000 2008 CIA 11,163,934 2012 145
076 Oman 13,250,000 2008 CIA 2,773,479 2010 545
077 Turkmenistan 13,000,000 2009 CIA 5,125,693 2012 289
078 Dominican Republic
12,870,000 2008 CIA 9,445,281 2010 155
079 Tunisia 12,490,000 2008 CIA 10,732,900 2012 136
080 Zimbabwe 12,470,000 2008 CIA 12,619,600 2012 113
081 Jordan 11,300,000 2008 CIA 6,508,887 2012 198
082 Bosnia and Herzegovina
10,800,000 2009 CIA 3,839,737 2011 321
083 Bahrain 10,480,000 2008 CIA 1,234,571 2010 968
JKD NANNA CONSULT, Version 21 Sunday, September 15th, 2013
9 © 2013 JKD NANNA CONSULT
084 Lithuania 10,300,000 2008 CIA 2,966,954 2012 396
085 Mozambique 10,180,000 2008 CIA 23,929,708 2011 48
086 Lebanon 9,793,000 2009 CIA 4,224,000 2008 264
087 Sri Lanka 9,268,000 2010 CIA 20,277,597 2012 52
088 Georgia 9,256,000 2011 CIA 4,469,200 2011 236
089 Republic of Macedonia
9,024,000 2011 CIA 2,058,539 2011 500
090 Paraguay 8,500,000 2009 CIA 6,561,748 2011 148
091 Costa Rica 8,321,000 2009 CIA 4,586,353 2011 207
092 Guatemala 8,161,000 2011 CIA 15,438,384 2013 60
093 Uruguay 7,960,000 2011 CIA 3,318,535 2011 273
094 Zambia 7,614,000 2008 CIA 14,309,466 2012 61
095 Kyrgyzstan 7,474,000 2008 CIA 5,550,239 2010 154
096 Estonia 7,431,000 2010 CIA 1,286,540 2013 658
097 Trinidad and Tobago
7,246,000 2008 CIA 1,346,350 2011 614
098 Albania 6,593,000 2009 CIA 2,821,977 2011 266
099 Honduras 6,540,000 2009 CIA 8,249,574 2010 90
100 Luxembourg 6,453,000 2008 CIA 537,853 2013 1368
101 Jamaica 6,400,000 2008 CIA 2,889,187 2012 253
102 Bolivia 6,301,000 2011 CIA 10,389,913 2012 69
103 Latvia 6,215,000 2010 CIA 2,027,000 2012 350
104 Ghana 6,060,000 2008 CIA 24,200,000 2010 29
105 Democratic Republic of the Congo
6,036,000 2008 CIA 75,507,308 2013 9
106 Panama 5,805,000 2010 CIA 3,661,868 2010 181
107 Armenia 5,800,000 2011 CIA 3,262,200 2010 203
108 El Salvador 5,756,000 2011 CIA 6,134,000 2009 107
109 Kenya 9,694,000 2012 CIA 43,500,000 2013 25
110 Republic of Kosovo
5,674,000 2011 CIA 1,733,872 2011 373
111 Cameroon 4,883,000 2008 CIA 19,406,100 2012 29
112 Nepal 4,883,000 2010 CIA 26,494,504 2011 21
113 Yemen 4,646,000 2008 CIA 23,833,000 2011 22
114 Burma 4,630,000 2008 CIA 60,280,000 2010 9
115 Cyprus 4,556,000 2008 CIA 838,897 2011 619
116 Moldova 4,463,000 2008 CIA 3,559,500 2012 143
117 Montenegro 4,100,000 2010 CIA 625,266 2011 748
118 Namibia 3,928,000 2008 CIA 2,100,000 2011 213
119 Sudan 3,787,000 2008 CIA 30,894,000 2008 14
JKD NANNA CONSULT, Version 21 Sunday, September 15th, 2013
10 © 2013 JKD NANNA CONSULT
— Macau (China) 3,660,000 2010 CIA 568,700 2012 734
120 Ivory Coast 3,584,000 2008 CIA 20,617,068 2009 20
121 Tanzania 3,431,000 2008 CIA 44,929,002 2012 9
122 Mongolia 3,375,000 2010 CIA 2,892,876 2013 133
123 Angola 3,365,000 2008 CIA 18,498,000 2009 21
124 Ethiopia 3,357,000 2008 CIA 91,195,675 2012 4
125 Brunei 3,054,000 2008 CIA 408,786 2011 852
126 Botswana 2,850,000 2008 CIA 2,029,307 2010 160
127 Papua New Guinea
2,757,000 2008 CIA 6,310,129 2012 50
128 Nicaragua 2,646,000 2008 CIA 6,071,045 2012 50
129 Mauritius 2,234,000 2008 CIA 1,291,456 2012 197
130 Laos 2,230,000 2010 CIA 6,500,000 2012 39
131 Malta 1,991,000 2010 CIA 452,515 2011 502
132 Uganda 1,958,000 2008 CIA 35,873,253 2012 6
133 The Bahamas 1,907,000 2008 CIA 353,658 2010 615
134 Senegal 1,763,000 2008 CIA 12,855,153 2011 16
— New Caledonia (France)
1,674,000 2008 CIA 252,000 2011 757
135 Gabon 1,600,000 2008 CIA 1,475,000 2009 124
136 Cambodia 1,559,000 2008 CIA 14,952,665 2010 12
137 Malawi 1,559,000 2008 CIA 16,407,000 2013 11
138 Suriname 1,440,000 2008 CIA 560,157 2012 293
139 Swaziland 1,207,000 2008 CIA 1,185,000 2009 116
140 Madagascar 1,032,000 2008 CIA 22,005,222 2012 5
141 Barbados 945,000 2008 CIA 274,200 2010 393
142 Fiji 865,800 2008 CIA 858,038 2012 115
143 Guinea 855,600 2008 CIA 10,057,975 2009 10
— Aruba (Netherlands)
846,300 2008 CIA 101,484 2010 951
— United States Virgin Islands
784,500 2008 CIA 106,405 2010 840
144 Guyana 688,000 2008 CIA 752,940 2010 104
145 Burkina Faso 683,500 2008 CIA 15,730,977 2010 5
146 Togo 671,900 2008 CIA 7,154,237 2013 11
147 Benin 653,000 2008 CIA 9,598,787 2012 8
— Bermuda (United Kingdom)
636,400 2008 CIA 64,268 2010 1129
— Jersey (United Kingdom)
630,100 2004 CIA 97,857 2011 734

JKD NANNA CONSULT, Version 21 Sunday, September 15th, 2013
11 © 2013 JKD NANNA CONSULT
148 Niger 626,000 2008 CIA 17,129,076 2012 4
— French Polynesia 623,100 2008 CIA 267,000 2010 266
149 Andorra 598,700 2009 CIA 85,082 2011 802
150 Palestinian National Authority
550,000 2011 CIA 2,124,515 2012 30
151 Maldives 542,000 2009 CIA 328,536 2012 188
— Cayman Islands (United Kingdom)
537,500 2008 CIA 54,878 2010 1117
152 Republic of the Congo
534,000 2008 CIA 4,366,266 2012 14
153 Mauritania 508,700 2008 CIA 3,359,185 2012 17
154 Mali 455,700 2008 CIA 14,517,176 2009 4
155 Liberia 311,600 2008 CIA 4,128,572 2011 9
156 Haiti 309,000 2010 CIA 9,719,932 2011 4
157 Saint Lucia 308,000 2008 CIA 173,765 2009 202
158 Somalia 293,000 2008 CIA 10,085,638 2012 3
159 Burundi 273,400 2008 CIA 8,749,000 2012 4
— Faroe Islands (Denmark)
268,800 2010 CIA 49,267 2011 622
160 Djibouti 260,400 2008 CIA 792,198 2012 37
161 Seychelles 241,800 2008 CIA 84,000 2009 328
— Greenland (Denmark)
239,400 2010 CIA 56,370 2012 484
162 Cape Verde 238,600 2008 CIA 523,568 2013 52
163 Rwanda 236,800 2008 CIA 11,689,696 2012 2
164 Lesotho 236,000 2008 CIA 2,067,000 2009 13
165 Afghanistan 231,100 2009 CIA 30,419,928 2012 1
166 Eritrea 224,900 2008 CIA 6,086,495 2012 4
167 The Gambia 204,600 2008 CIA 1,782,893 2009 13
168 Belize 200,400 2008 CIA 312,698 2010 73
169 Bhutan 184,000 2009 CIA 742,737 2012 28
170 Federated States of Micronesia
178,600 2002 CIA 106,104 2013 192
171 Grenada 177,400 2009 CIA 110,000 2005 184
— American Samoa (United States)
176,700 2008 CIA 55,519 2010 363
— Turks and Caicos Islands (United Kingdom)
162,800 2008 CIA 46,400 2012 400
— Gibraltar (United Kingdom)
156,000 2008 CIA 29,752 2011 598
172 Central African Republic
148,800 2008 CIA 4,422,000 2009 4

JKD NANNA CONSULT, Version 21 Sunday, September 15th, 2013
12 © 2013 JKD NANNA CONSULT
173 Saint Vincent and the Grenadines
122,700 2008 CIA 120,000 2008 117
174 Saint Kitts and Nevis
120,900 2008 CIA 51,300 2005 269
175 Antigua and Barbuda
107,000 2008 CIA 81,799 2011 149
176 Samoa 98,580 2008 CIA 194,320 2012 58
177 Chad 93,000 2008 CIA 10,329,208 2009 1
178 Equatorial Guinea
85,560 2008 CIA 1,622,000 2010 6
179 Sahrawi Arab Democratic Republic
83,700 2008 CIA 301,293 2010 32
180 Dominica 80,910 2008 CIA 71,293 2011 129
181 Solomon Islands 72,540 2008 CIA 523,000 2009 16
182 East Timor 67,590 2011 CIA 1,066,582 2010 7
183 Guinea-‐Bissau 65,100 2008 CIA 1,647,000 2010 5
184 Sierra Leone 53,940 2008 CIA 6,000,000 2012 1
185 Tonga 52,288 2012 TongaPowerLtd 103,036 2011 58
— Saint Pierre and Miquelon (France)
49,290 2008 CIA 5,774 2011 973
186 Comoros 48,360 2008 CIA 798,000 2010 7
— British Virgin Islands
41,850 2008 CIA 27,800 2012 172
187 Vanuatu 39,990 2008 CIA 224,564 2011 20
188 São Tomé and Príncipe
38,130 2008 CIA 183,176 2011 24
189 Nauru 29,760 2008 CIA 9,378 2011 362
— Cook Islands (New Zealand)
29,760 2008 CIA 19,569 2006 173
— Montserrat (United Kingdom)
20,460 2008 CIA 5,164 2012 452
190 Kiribati 20,460 2008 CIA 103,500 2010 23
— Falkland Islands (United Kingdom)
15,810 2008 CIA 2,932 2012 615
— Saint Helena (United Kingdom)
7,440 2008 CIA 4,255 2008 199
— Niue (New Zealand)
2,790 2008 CIA 1,398 2009 228

JKD NANNA CONSULT, Version 21 Sunday, September 15th, 2013
13 © 2013 JKD NANNA CONSULT
Table 2-‐2. Calculation of Per Capita Electricity Consumption
(i) Electric power per capita [ in watt ] = Total population electricity consumption [ in MW·∙h/yr ] ·∙ 1,000,000/(365.25 x 24)/population. (ii) Electric power per capita [ in watt ] = Total population electricity consumption [ in MW·∙h/yr ] ·∙ 114.077116 /population. (iii) 1 MW·∙h/yr = 1,000,000 Wh/(365.25 x 24)h = 114.077116 Watt
Sample Calculation From equations (i), (ii) and (iii):-‐
(a) Ghana’s total population electricity consumption of, say, 6,060,000 MW.h/yr, is equivalent to: 6,060,000×114.077116 𝑊𝑎𝑡𝑡.
(b) With a stipulated population of 24,200,000, Ghana’s per capita electricity consumption is: 6,060,000×114.077116 𝑊𝑎𝑡𝑡/24,200,000 = 0.25041322×114.077116 𝑊𝑎𝑡𝑡 = 28.57 𝑊𝑎𝑡𝑡
JKD NANNA CONSULT, Version 21 Sunday, September 15th, 2013
14 © 2013 JKD NANNA CONSULT
Chapter 3. How to Mitigate the Challenges The challenge of renewing and expanding the electricity generating capacity has corresponding linkages to current and future technologies, standards, and fuel mix, which will bind the sector in the long term, influencing the path to sustainability, competitiveness, and energy security. Concerning the future fuel mix, it is expected that fossil fuel power plants will become increasingly important in Ghana’s electricity-generating sector, with natural gas being the fuel to focus on. In this context, a comparative assessment/analysis is a prerequisite for planning the future energy and electricity facilities of the country in order to make timely decisions. It requires the identification of the expected levels of energy and electricity demand and the options that are available to meet these demands, taking special note of the national energy resources and potential imported sources. Further analysis would be needed for the optimization of the supply options to meet the demand in the most efficient and economic manner with due consideration of the environmental impacts and resource requirements. The scope of this total energy system analysis would involve the following:
i. The energy supply sectors (oil, gas, and renewable energy sources); ii. The energy conversion sectors (oil refining, gas processing, and power
generation); iii. Energy transportation and distribution (distribution and transportation of oil,
gas, and refinery products, electricity transmission and distribution); iv. Energy use at the demand side; and v. Emissions.
The necessary actions ought to be taken:
• To undertake a detailed analysis of overall energy and electricity demand, and
its future evolution;
• To project the need for fossil energy in Ghana that is driven by the expected demand and development growth for all appropriate energy sources;
• To undertake an assessment of future supply potential of indigenous energy resources – and provide, by considering several alternative scenarios, a set of possible scenarios as input to national decision-making in the energy sector;
• To identify domestic fossil fuel energy supply sufficiency and the potential for
energy exports;
• To undertake the analysis of possibilities of import of various fuels;

JKD NANNA CONSULT, Version 21 Sunday, September 15th, 2013
15 © 2013 JKD NANNA CONSULT
• To undertake fossil fuel energy infrastructure development to support the
growing energy use in Ghana;
• To analyze, in view of the projected high reliance of the power system and other demand sectors on natural gas, the development of the gas sector in detail in order to identify possible supply constraints, price implications and relevant policy measures;
• To identify the potential role of renewable energy sources in the Ghanaian
energy system;
• To quantify environmental emissions of the whole energy sector associated with the expected growth of energy consumption and possible emission mitigation measures;
• To analyze the evolution of future options for electricity generation;
• To evaluate the formulation of alternative expansion plans for the electric
sector development; and The specific objectives of this study would be:
• To study and implement energy infrastructure development to support the growing energy use;
• To accelerate, in view of the projected high reliance of the power system and other demand sectors on natural gas, the holistic development of the gas sector, after identifying all possible supply constraints, price implications and relevant policy measures:
• To identify the potential role of renewable energy sources in the energy system;
• To provide, by considering several alternative scenarios, a set of possible scenarios as input to national decision-making in the energy sector.
The reference case — baseline scenario — should correspond to the unlimited supply of natural gas, either domestic or imported natural gas or both. The main assumptions for this scenario are:
o Utilize domestic resources to the extent possible;
o Maintain energy diversity and avoid dependency on a single source;
o Increase the use of natural gas, considering unlimited supply of natural gas; not just in the availability of this energy source but also for availability of the infrastructure for the transportation and distribution of the energy source;
o Consider utilization of advanced environmentally friendly technologies in the
energy supply system.
JKD NANNA CONSULT, Version 21 Sunday, September 15th, 2013
16 © 2013 JKD NANNA CONSULT
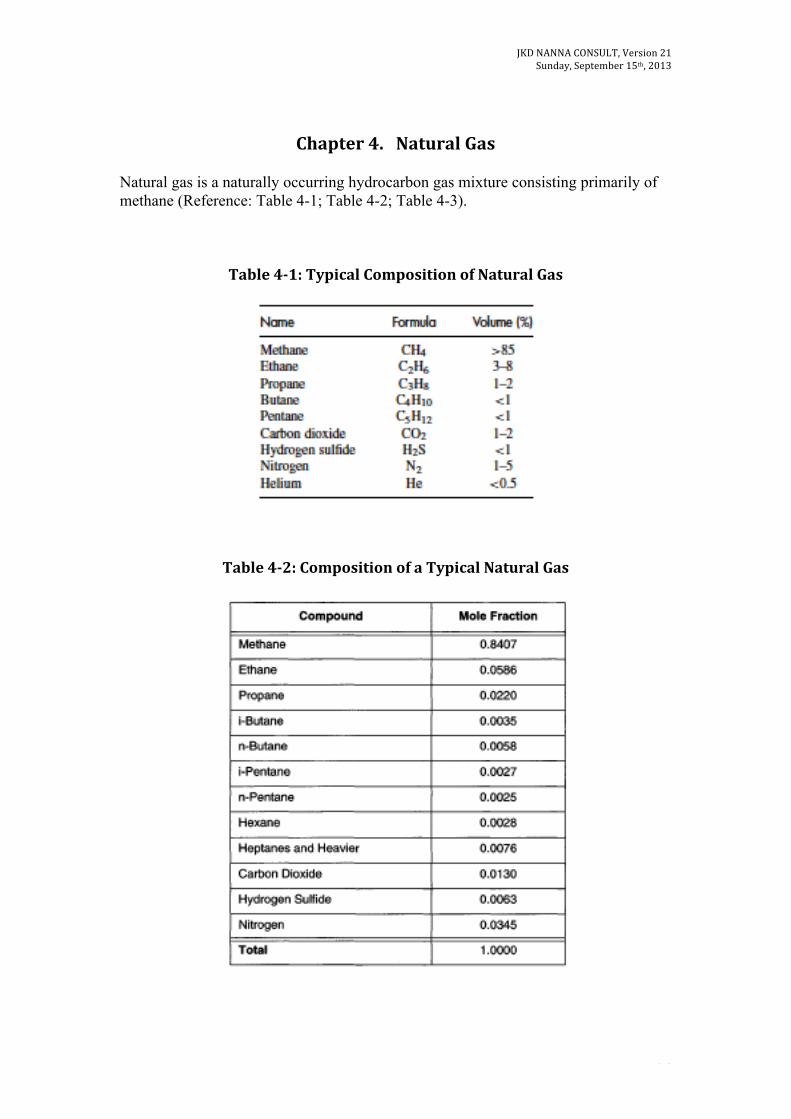
Chapter 4. Natural Gas Natural gas is a naturally occurring hydrocarbon gas mixture consisting primarily of methane (Reference: Table 4-1; Table 4-2; Table 4-3).
Table 4-‐1: Typical Composition of Natural Gas
Table 4-‐2: Composition of a Typical Natural Gas

JKD NANNA CONSULT, Version 21 Sunday, September 15th, 2013
17 © 2013 JKD NANNA CONSULT
Table 4-‐3: Composition of Typical Petroleum Gases

JKD NANNA CONSULT, Version 21 Sunday, September 15th, 2013
18 © 2013 JKD NANNA CONSULT
Natural gas is becoming the preferred fuel for power generation in a lot of countries. Natural gas is an efficient fuel source that produces lower pollutant emissions than many other fuel sources. Additionally, gains in efficiency of power generation using natural gas and the comparatively low initial investment costs of building natural gas based power generation facilities, make natural gas an attractive alternative to other fuels. Storage and Distribution Natural gas storage and distribution should be a critical component of Ghana's energy infrastructure and this would be very instrumental in helping to meet the fluctuating demands of the country’s energy market. The storage and distribution of an adequate supply of natural gas are important for the establishment of power generation facilities. Other methods of storing and supplying natural gas are used because of the high volumes involved in storing natural gas. The most common method of storing natural gas is in its liquefied state. Liquefied natural gas (“LNG”) is produced when natural gas is cooled to a cold, colourless liquid at -162.2oC (-260oF). Liquefying natural gas reduces its volume by more than 600 times, making it more practical to store and transport. LNG is stored at very low (near atmospheric) pressure in double-walled, insulated tanks. LNG tanks are classified in three different types, which are:
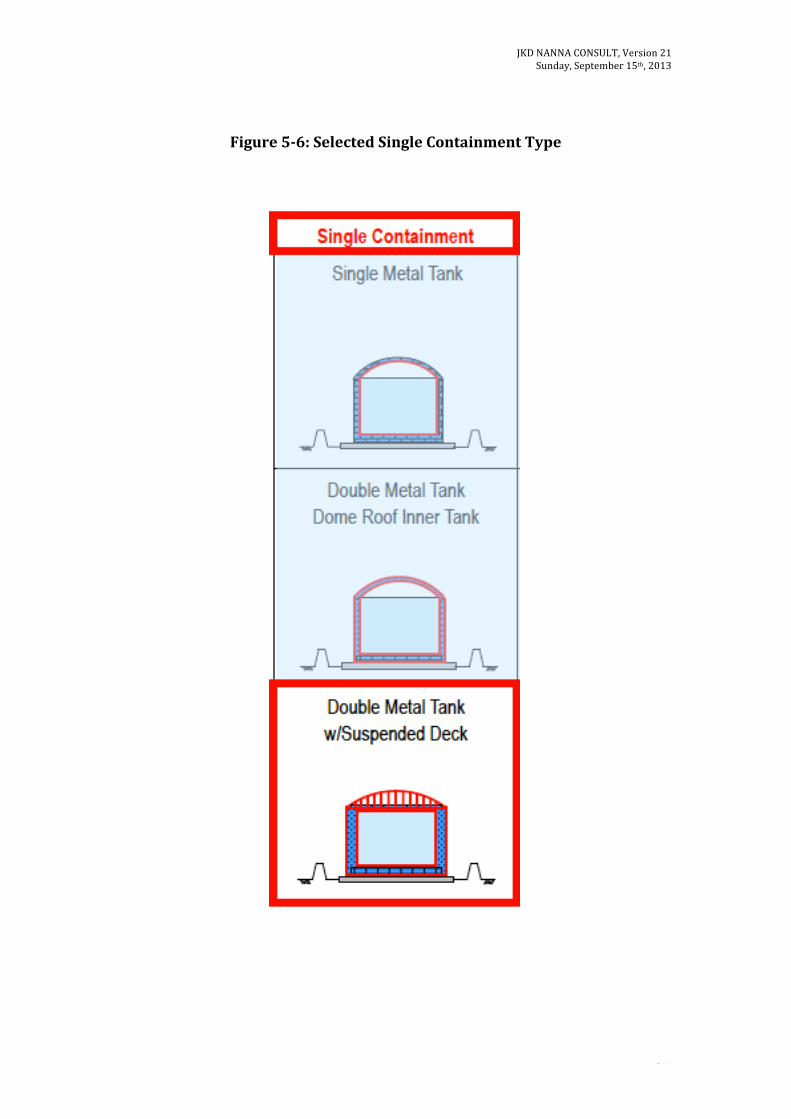
• A single containment tank; • A double containment tank; and • A full containment tank.
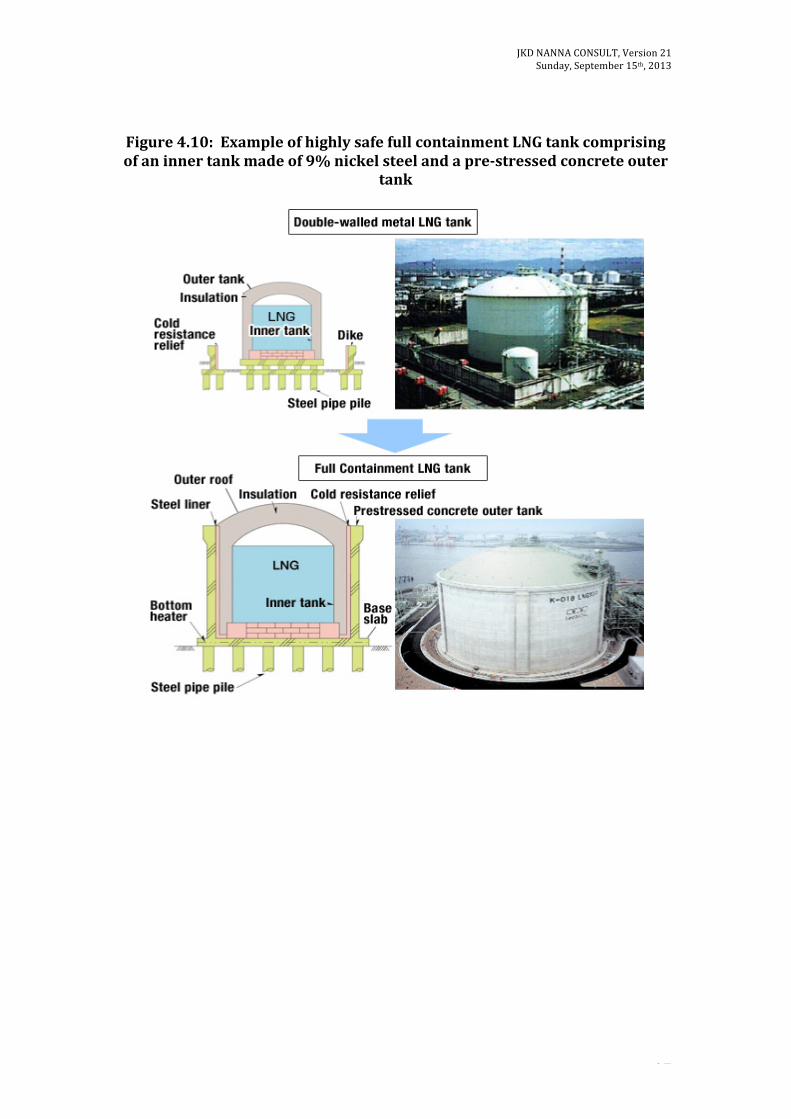
A single containment tank is either a single tank or a tank comprising an inner tank and an outer container designed and constructed so that only the inner tank is required to meet the low temperature ductility requirements for the storage of the product. A double containment tank is a tank designed and constructed so that both the inner tank and the outer tank are capable of independently containing the refrigerated liquid stored. A full containment tank is a double tank designed and constructed so that both the inner tank and the outer tank are capable of independently containing the refrigerated liquid stored. The difference between the double containment and full containment is that the outer tank of a full containment tank is intended to be capable of both containing the refrigerated liquid and of controlled venting of the vapour resulting from product leakage after a credible event. The full containment tank is regarded as the most advanced type among these three types of LNG tanks. The tanks are also classified by the elevations above ground level:
Ø above-ground type; Ø in-ground type; and

JKD NANNA CONSULT, Version 21 Sunday, September 15th, 2013
19 © 2013 JKD NANNA CONSULT
Ø under-ground type.
v Primary containment is the first and most important requirement for
containing the LNG product. This first layer of protection involves the use of appropriate materials for LNG facilities as well as proper engineering design of storage tanks onshore and on LNG ships and elsewhere.
v Secondary containment ensures that if leaks or spills occur at the onshore LNG facility, the LNG can be fully contained and isolated from the public.
In order to use LNG as a power source, the LNG is converted to its gaseous state using a re-vaporization process. The re-vaporized LNG is then distributed through pipelines to various end users. Figure 4.1, Figure 4.2, Figure 4.3, Figure 4.4, and Figure 4.5 are illustrations of the LNG value chain.

JKD NANNA CONSULT, Version 21 Sunday, September 15th, 2013
20 © 2013 JKD NANNA CONSULT
Figure 4.1: Natural Gas – From Production & Processing, Transmission
& Storage, to Distribution
Figure 4.2: The entire flow from exploration and development of natural
gas to utilization is called the LNG chain

JKD NANNA CONSULT, Version 21 Sunday, September 15th, 2013
21 © 2013 JKD NANNA CONSULT
Figure 4.3: LNG Value Chain
Upstream: gas reservoir exploration, natural gas production and liquefaction Middle stream: LNG transportation Downstream: LNG receiving, storage and distribution.
Figure 4.4: Traditional LNG Value Chain

JKD NANNA CONSULT, Version 21 Sunday, September 15th, 2013
22 © 2013 JKD NANNA CONSULT
Figure 4.5: LNG Supply Chain
JKD NANNA CONSULT, Version 21 Sunday, September 15th, 2013
23 © 2013 JKD NANNA CONSULT
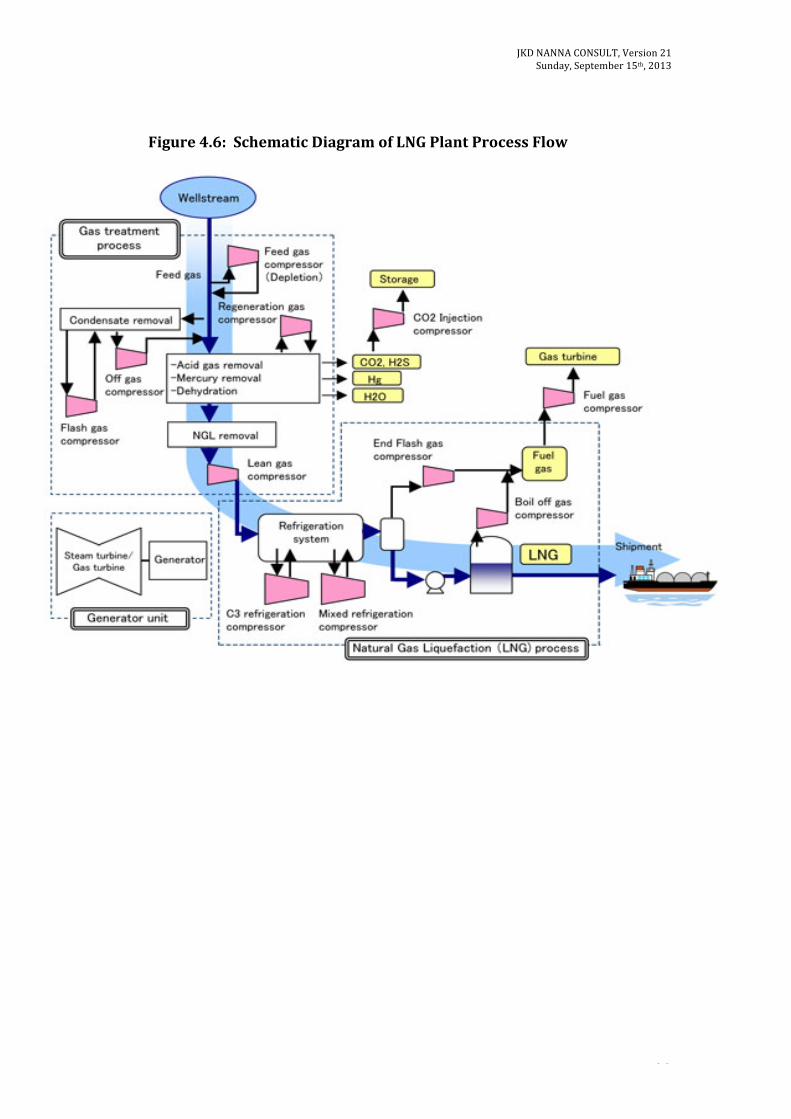
Figure 4.6: Schematic Diagram of LNG Plant Process Flow

JKD NANNA CONSULT, Version 21 Sunday, September 15th, 2013
24 © 2013 JKD NANNA CONSULT
Figure 4.7: This LNG Train refers to the Compressors Train used in the Industrial Process to convert Natural Gas to Liquefied Natural Gas (LNG)
JKD NANNA CONSULT, Version 21 Sunday, September 15th, 2013
25 © 2013 JKD NANNA CONSULT
Figure 4.8: LNG from wellhead to fuel tank

JKD NANNA CONSULT, Version 21 Sunday, September 15th, 2013
26 © 2013 JKD NANNA CONSULT
Figure 4.9: Typical Structure of an LNG Storage Tank
JKD NANNA CONSULT, Version 21 Sunday, September 15th, 2013
27 © 2013 JKD NANNA CONSULT
Figure 4.10: Example of highly safe full containment LNG tank comprising of an inner tank made of 9% nickel steel and a pre-‐stressed concrete outer
tank
JKD NANNA CONSULT, Version 21 Sunday, September 15th, 2013
28 © 2013 JKD NANNA CONSULT
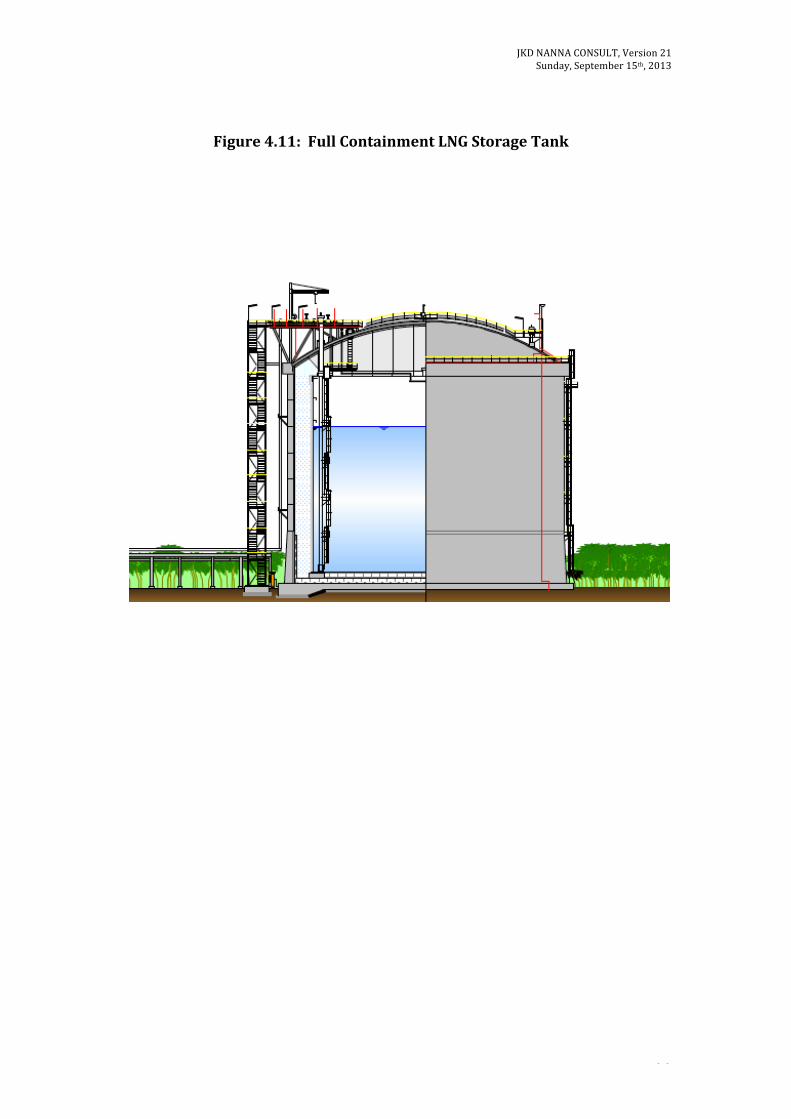
Figure 4.11: Full Containment LNG Storage Tank
JKD NANNA CONSULT, Version 21 Sunday, September 15th, 2013
29 © 2013 JKD NANNA CONSULT
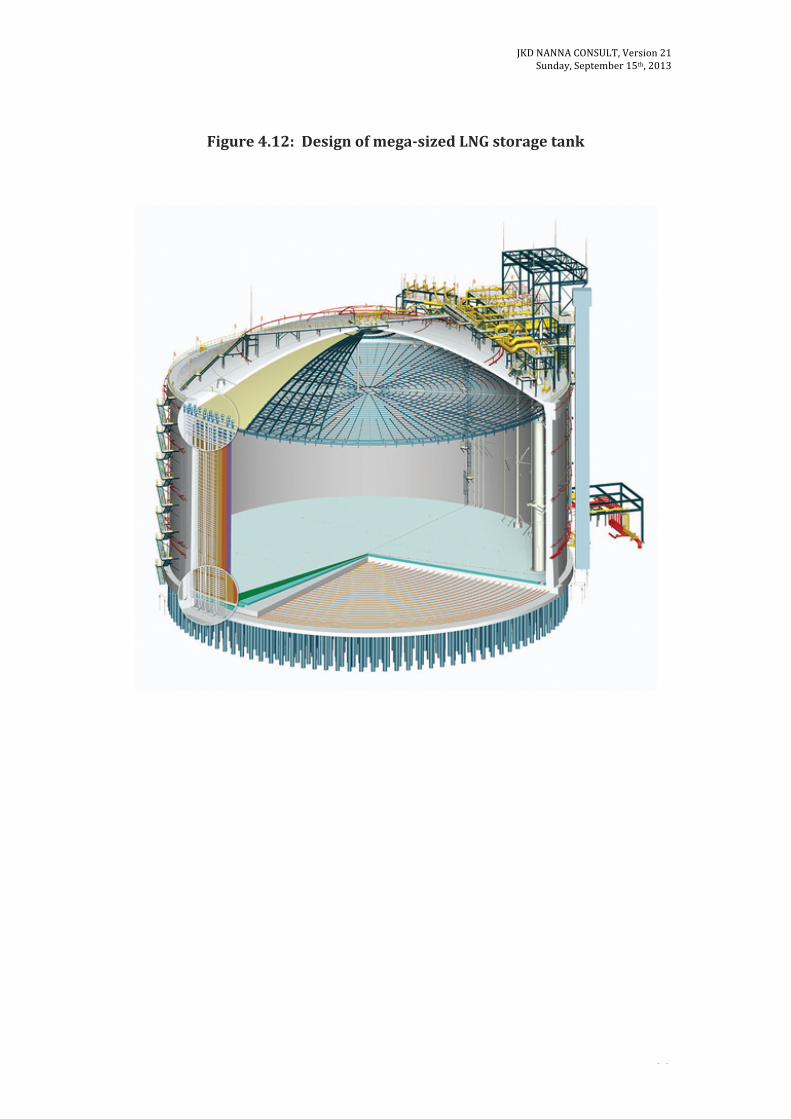
Figure 4.12: Design of mega-‐sized LNG storage tank

JKD NANNA CONSULT, Version 21 Sunday, September 15th, 2013
30 © 2013 JKD NANNA CONSULT
Figure 4.6, Figure 4.7, and Figure 4.8 are schematic diagrams of LNG plant process flows.
Figure 4.9, Figure 4.10, Figure 4.11, and Figure 4.12 are illustrations of typical structures of LNG storage tanks.
One advantage of LNG is that LNG may be transported by ship to markets further than would be practicable with pipelines. This technology allows customers who operate a long way from natural gas reserves to enjoy the benefits of natural gas. The importation of LNG by ship would require the construction of LNG import terminals for LNG storage and re-vaporization facilities at on-shore locations that are close to the shipping lanes.

JKD NANNA CONSULT, Version 21 Sunday, September 15th, 2013
31 © 2013 JKD NANNA CONSULT
Chapter 5. Types of Liquefied Natural Gas (LNG) Storage Tanks
Table 5-‐1: Definitions of types of LNG storage tanks
Table 5-‐2: Types of LNG storage tanks

JKD NANNA CONSULT, Version 21 Sunday, September 15th, 2013
32 © 2013 JKD NANNA CONSULT
Figure 5-‐3: Types of containment

JKD NANNA CONSULT, Version 21 Sunday, September 15th, 2013
33 © 2013 JKD NANNA CONSULT
Table 5-‐4: LNG storage tank containment and progression of bund wall
Table 5-‐5: Examples of Single Containment LNG storage tanks
JKD NANNA CONSULT, Version 21 Sunday, September 15th, 2013
34 © 2013 JKD NANNA CONSULT
Figure 5-‐6: Selected Single Containment Type

JKD NANNA CONSULT, Version 21 Sunday, September 15th, 2013
35 © 2013 JKD NANNA CONSULT
Figure 5-‐7: Typical Single Containment – Double Metal Tank

JKD NANNA CONSULT, Version 21 Sunday, September 15th, 2013
36 © 2013 JKD NANNA CONSULT
Figure 5-‐8: Typical Bottom Corner of Single Containment – Double Metal
Tank

JKD NANNA CONSULT, Version 21 Sunday, September 15th, 2013
37 © 2013 JKD NANNA CONSULT
Figure 5-‐9: Selected Double Containment Type
JKD NANNA CONSULT, Version 21 Sunday, September 15th, 2013
38 © 2013 JKD NANNA CONSULT
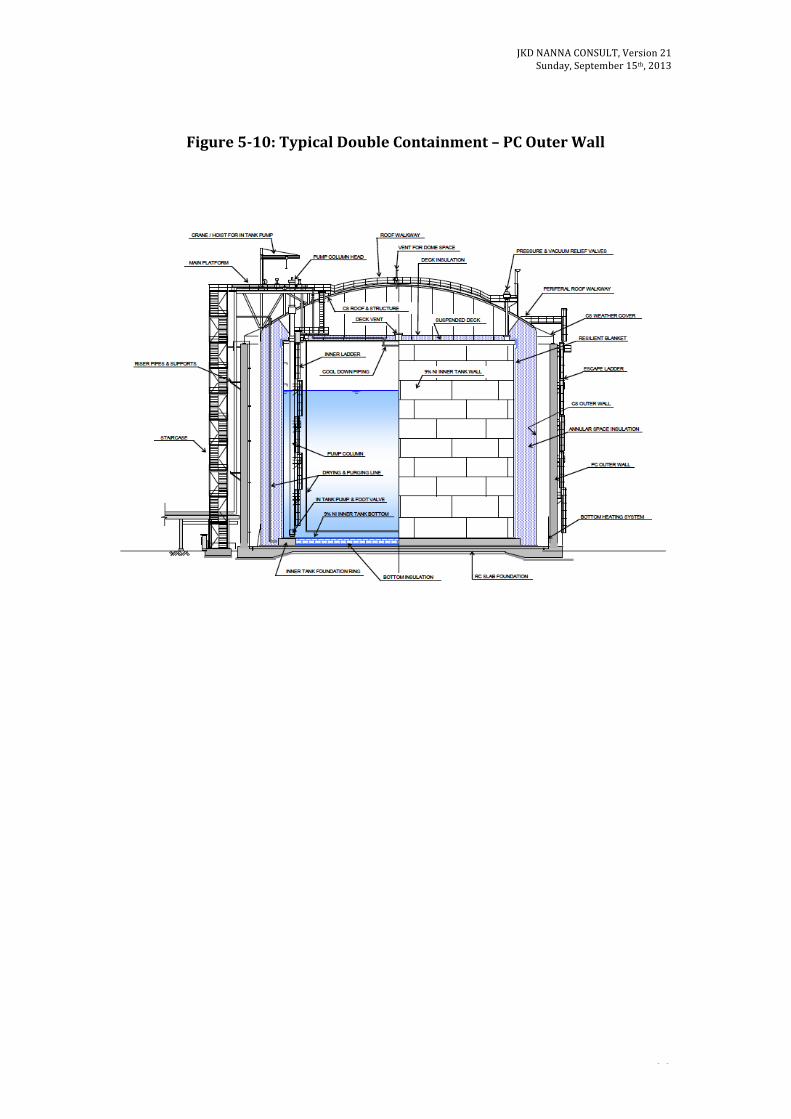
Figure 5-‐10: Typical Double Containment – PC Outer Wall
JKD NANNA CONSULT, Version 21 Sunday, September 15th, 2013
39 © 2013 JKD NANNA CONSULT
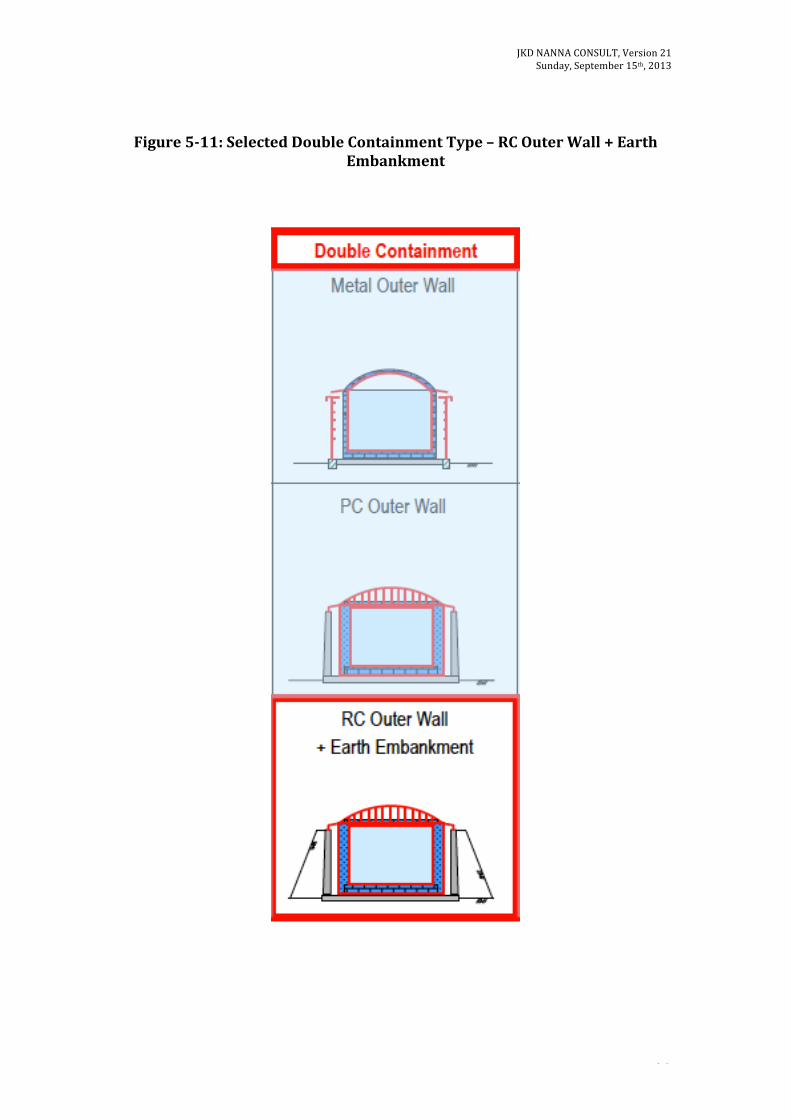
Figure 5-‐11: Selected Double Containment Type – RC Outer Wall + Earth Embankment

JKD NANNA CONSULT, Version 21 Sunday, September 15th, 2013
40 © 2013 JKD NANNA CONSULT
Figure 5-‐12: Typical Double Containment Type – RC Outer Wall + Earth Embankment
JKD NANNA CONSULT, Version 21 Sunday, September 15th, 2013
41 © 2013 JKD NANNA CONSULT
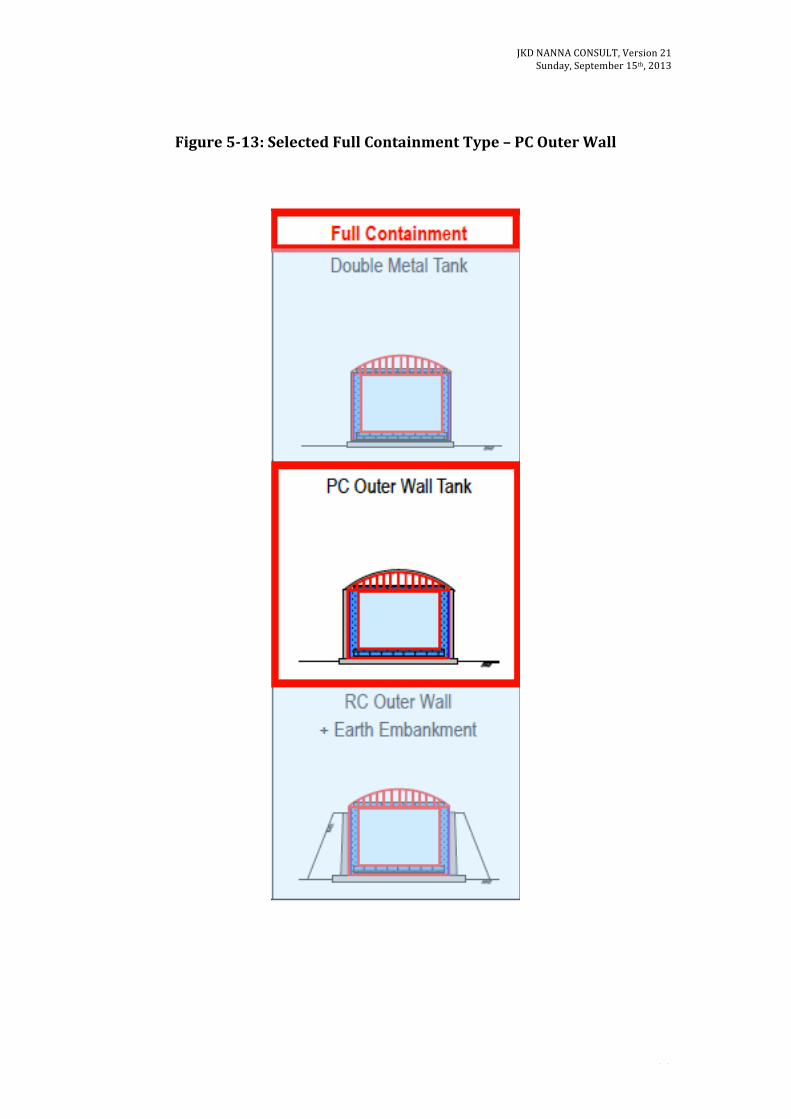
Figure 5-‐13: Selected Full Containment Type – PC Outer Wall

JKD NANNA CONSULT, Version 21 Sunday, September 15th, 2013
42 © 2013 JKD NANNA CONSULT
Figure 5-‐14: Typical Full Containment Type – PC Outer Wall

JKD NANNA CONSULT, Version 21 Sunday, September 15th, 2013
43 © 2013 JKD NANNA CONSULT
Figure 5-‐15: Typical Bottom Corner of Full Containment Type – PC Outer
Wall

JKD NANNA CONSULT, Version 21 Sunday, September 15th, 2013
44 © 2013 JKD NANNA CONSULT
Figure 5-‐16: Typical Roof Corner of Full Containment Type – PC Outer Wall
JKD NANNA CONSULT, Version 21 Sunday, September 15th, 2013
45 © 2013 JKD NANNA CONSULT
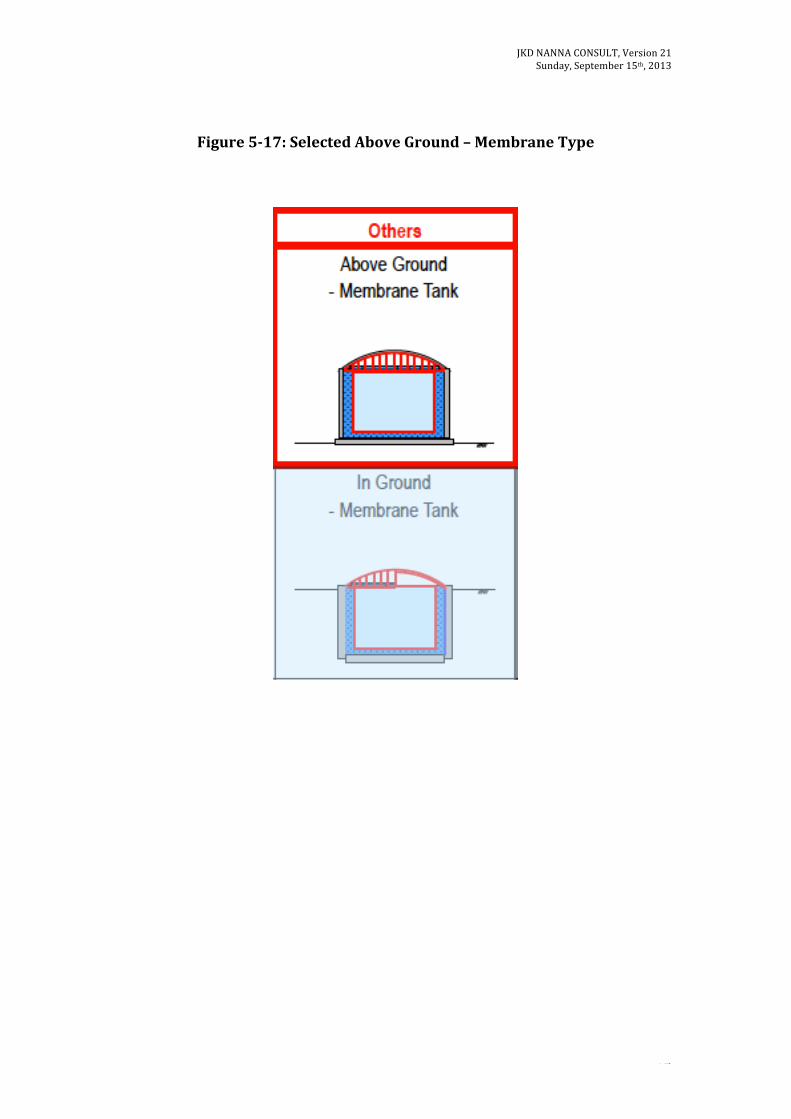
Figure 5-‐17: Selected Above Ground – Membrane Type
JKD NANNA CONSULT, Version 21 Sunday, September 15th, 2013
46 © 2013 JKD NANNA CONSULT
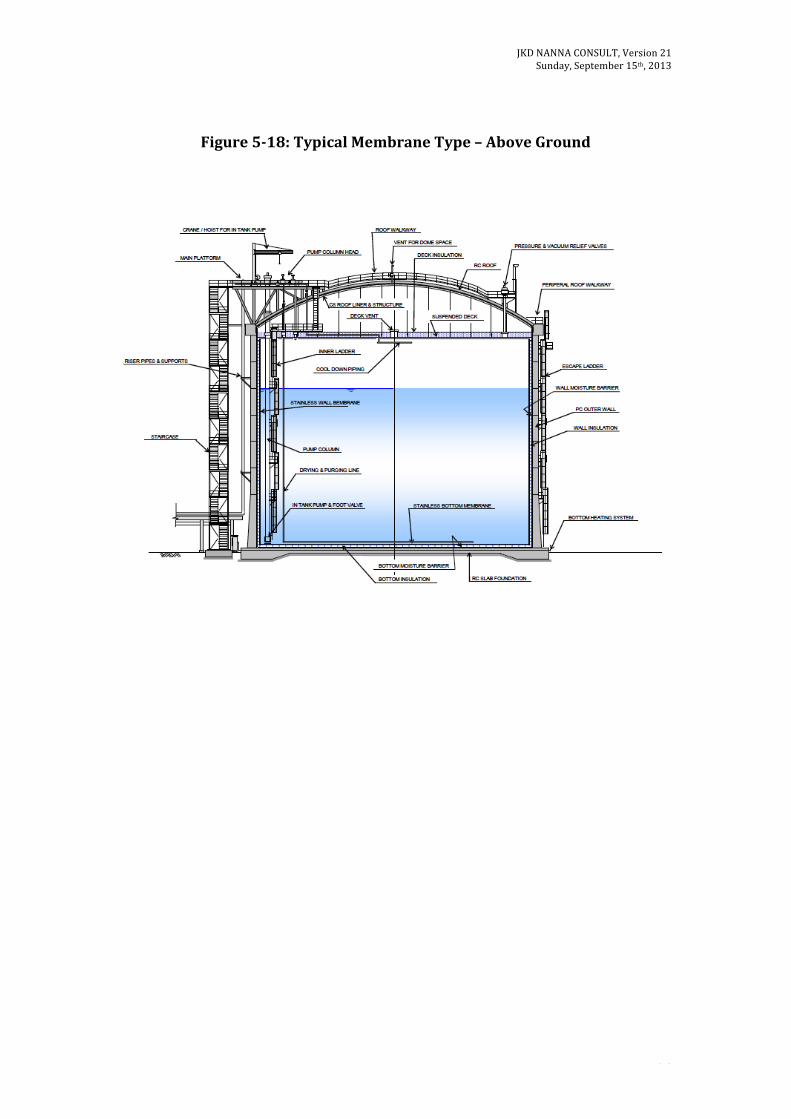
Figure 5-‐18: Typical Membrane Type – Above Ground

JKD NANNA CONSULT, Version 21 Sunday, September 15th, 2013
47 © 2013 JKD NANNA CONSULT
Figure 5-‐19: Typical Bottom Wall of Membrane Type Containment System
Figure 5-‐20: Comparison of each container type

JKD NANNA CONSULT, Version 21 Sunday, September 15th, 2013
48 © 2013 JKD NANNA CONSULT
Figure 5-‐21: Comparison of each container type (continued)