the nature of finland’s economic crisis and the
TRANSCRIPT
1
Bengt Holmström, Sixten Korkman and Matti Pohjola 21.2.2014 The nature of Finland’s economic crisis and the prerequisites for growth Introduction Finland has not recovered from the industrial collapse that began in 2008 and led to the loss of a significant part of the country’s economic base. The structural crisis in the manufacturing industry is widely reflected in Finland’s economy and its prospects. The present crisis is very different from the recession of the 1990s. The present crisis is in some respects even more difficult, because productivity growth has halted in an unprecedented way and there is a lack of ideas to improve the situation – the “recipe” for growth has been lost. Achieving new growth will require time and exceptional efforts. This memorandum presents an expert assessment of Finland’s economic crisis. In addition, it addresses the demands that economic development sets for different parties and economic policy. This memorandum does not attempt to give a comprehensive list of recommendations for action (a number of which have been proposed in Finland in recent years). Summary Briefly, our assessment of the background to the crisis can be summed up as follows: the success of the Nokia-led ICT cluster maintained favourable, even deceptively favourable, economic growth in Finland for a long time. The budget surpluses were large and unemployment was on a downward path. As is now apparent, these conditions created a setting in which wages rose more – and public spending grew faster – than was desirable in terms of sustainable development. With the collapse of the electronics industry, exports and output have declined sharply at the same time as the contraction of the paper industry has continued and metals processing has suffered from low market prices. All this has been reflected in a deterioration of profitability in manufacturing. In the good years, Finland accumulated a high level of general-purpose expertise and international experience, which the country should be able to utilise in future. Finland has the prerequisites to return to the pre-crisis growth path – if the crisis provokes an adequate response. There is no single and fast way, however, to recover from the crisis and return to rapid growth. In economic policy, a goal-directed, long-term and patient approach is required. The state can make a real contribution to economic growth by improving general operating conditions for business, promoting labour mobility and supporting research and innovation. We also underline the significance of high-growth enterprises in economic renewal and the public sector’s role in encouraging such enterprises. Anticipated public spending cannot be sustainably funded at the current tax rates. The growth objective means that there is no scope for increasing taxation. The target level (services, income transfers) of the welfare state must therefore be set in accordance with financial sustainability.

2
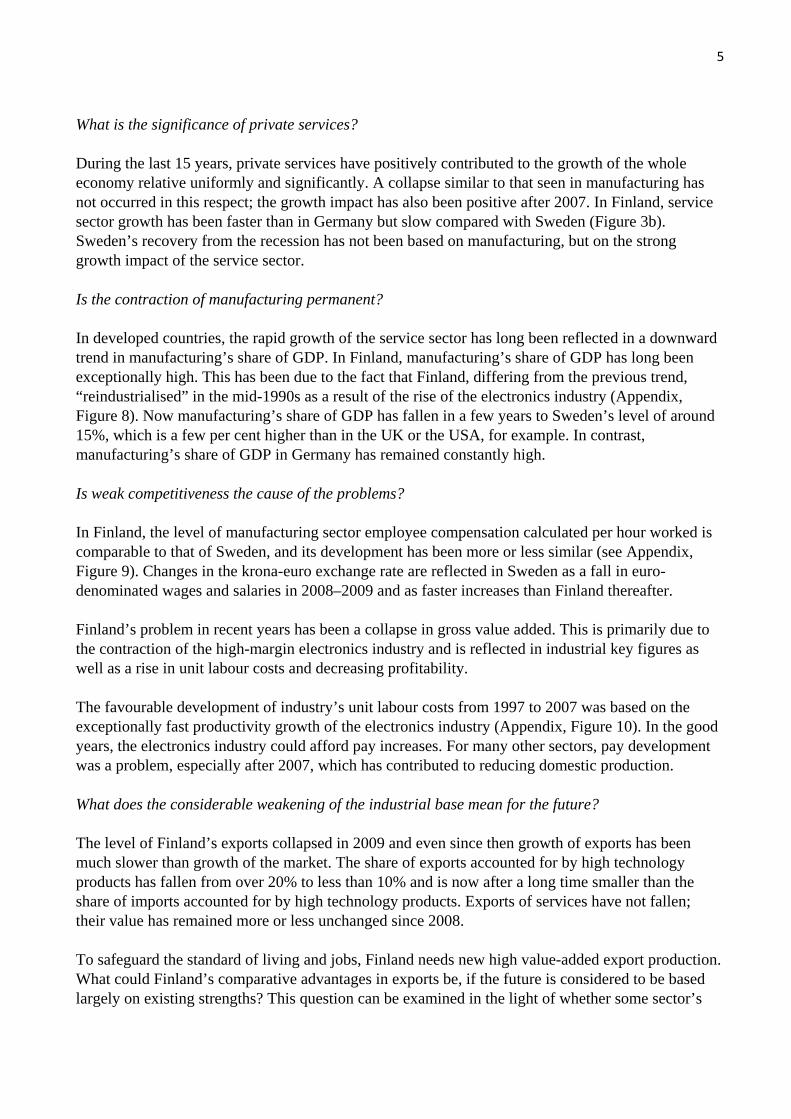
Restating the promise of the welfare state would clarify both public and private decision-making. It is important to try and improve the productivity of public services and to raise the labour participation rate. This time, the main reasons for Finland’s economic plight lie largely outside its borders; corrective measures, however, must be found at home. Raising productivity and accelerating economic growth is an imperative of Finland’s economic policy. Based on good preparation, economic policy must make painful choices, set targets in order of importance and act in accordance with priorities. 1. How did it come to this?1 Finland’s economy grew rapidly after the 1990s’ recession until 2007, at the same rate as Sweden and clearly faster than Germany (Figure 1). As a result of the global financial crisis, however, Finland’s GDP declined in 2009 by nearly 9%, reflecting the vulnerability of the country’s economy to international trends. Even more worrying is the fact that growth remained modest in 2010–2011 and output declined once again in 2012–2013. As matters stand, it will take many years before the Finnish economy reaches the level of output from which the collapse began in autumn 2008. Economic development in Finland in recent years raises many questions. Figure 1. Cumulative growth of total output of the economy, %2
Why has output collapsed? The weakness of economic growth is due to a uniquely sharp decline in economic growth; at the same time, the deterioration of employment has been less than expected. Moreover, total factor productivity, which measures the efficiency of use of production factors, has also declined sharply:
1 There follows a concise account of Finland’s crisis; it is analysed in more detail in the Appendix. 2 Total output is measured by the volume of gross value added. Growth is presented as the cumulative sum of annual logarithmic percentage changes instead of the customary index presentation, because calculated in this way the growth contributions of the sectors and production factors presented below are highlighted better.
0
5
10
15
20
25
30
35
40
1997 1998 1999 2000 2001 2002 2003 2004 2005 2006 2007 2008 2009 2010 2011 2012
SwedenFinlandGermany

3
with the available production factors, as much or as valuable output can no longer be obtained as was possible even a few years ago (see Appendix, Figure 3). A sectoral analysis traces the problems to the manufacturing sector and particularly to the metal industry (Figure 2). As much as half of the growth in the economy in 1998–2007 came from manufacturing, and 60% of this contribution arose in the electronics industry and 20% from other metal industry. Since then, however, the situation has changed dramatically, with manufacturing output declining sharply. The rest of the economy, particularly private services, has maintained its growth. Figure 2. Cumulative contributions to growth of total output of the economy, % points
3
The decline is greatest in the electronics industry, but also basic metals as well as production of machinery, metal products and transport equipment has fallen. In the electronics industry, a key element is Nokia and its ability to compete in intense international competition. The profitability of basic metals has deteriorated (after the 2007 price bubble) as a result of a steep fall in world market prices. The paper industry has long faced falling demand in Europe as well as weak development of prices. Finland’s manufacturing industry as a whole has suffered from a number of mutually independent, exceptionally strong and, from Finland’s point of view, negative changes in the world market situation.
3 A sector’s contribution to growth of the economy’s total output is calculated by multiplying the sector’s output growth by its share of the value of total output.
‐2
0
2
4
6
8
10
12
14
16
18
1997199819992000200120022003200420052006200720082009201020112012
Manufacturing (total)
Electronics industry
Metal industry (excl. electronics)
Forest industry
Other manufacturing

4
The development of Finland’s manufacturing sector differs from both Sweden and Germany in two ways, which the recession highlights (Figure 3a). In Finland, the growth contribution was clearly greatest before the problems that began in 2007. The recession had a strong impact in all countries, but Finland’s manufacturing sector has not yet recovered from it. In Sweden, the growth contribution has risen to its former level, and in Germany it has grown. A comparison between Finland and Sweden reveals a difference that stems from the fact that in Sweden the growth contributions of the metal industry and the chemical industry have been greater, and from the fact that the significance of the electronics industry has not declined there. Swedish manufacturing has not been so dependent on a single industry (see Appendix, Figure 6).
Figure 3. Cumulative growth contributions of manufacturing industry and private services, % points (a) Manufacturing
(b) Private services
0
2
4
6
8
10
12
14
16
18
20
1997 1998 1999 2000 2001 2002 2003 2004 2005 2006 2007 2008 2009 2010 2011 2012
SwedenFinlandGermany
0
2
4
6
8
10
12
14
16
18
20
1997 1998 1999 2000 2001 2002 2003 2004 2005 2006 2007 2008 2009 2010 2011 2012
Sweden
Finland
Germany
5
What is the significance of private services? During the last 15 years, private services have positively contributed to the growth of the whole economy relative uniformly and significantly. A collapse similar to that seen in manufacturing has not occurred in this respect; the growth impact has also been positive after 2007. In Finland, service sector growth has been faster than in Germany but slow compared with Sweden (Figure 3b). Sweden’s recovery from the recession has not been based on manufacturing, but on the strong growth impact of the service sector. Is the contraction of manufacturing permanent? In developed countries, the rapid growth of the service sector has long been reflected in a downward trend in manufacturing’s share of GDP. In Finland, manufacturing’s share of GDP has long been exceptionally high. This has been due to the fact that Finland, differing from the previous trend, “reindustrialised” in the mid-1990s as a result of the rise of the electronics industry (Appendix, Figure 8). Now manufacturing’s share of GDP has fallen in a few years to Sweden’s level of around 15%, which is a few per cent higher than in the UK or the USA, for example. In contrast, manufacturing’s share of GDP in Germany has remained constantly high. Is weak competitiveness the cause of the problems? In Finland, the level of manufacturing sector employee compensation calculated per hour worked is comparable to that of Sweden, and its development has been more or less similar (see Appendix, Figure 9). Changes in the krona-euro exchange rate are reflected in Sweden as a fall in euro-denominated wages and salaries in 2008–2009 and as faster increases than Finland thereafter. Finland’s problem in recent years has been a collapse in gross value added. This is primarily due to the contraction of the high-margin electronics industry and is reflected in industrial key figures as well as a rise in unit labour costs and decreasing profitability. The favourable development of industry’s unit labour costs from 1997 to 2007 was based on the exceptionally fast productivity growth of the electronics industry (Appendix, Figure 10). In the good years, the electronics industry could afford pay increases. For many other sectors, pay development was a problem, especially after 2007, which has contributed to reducing domestic production. What does the considerable weakening of the industrial base mean for the future? The level of Finland’s exports collapsed in 2009 and even since then growth of exports has been much slower than growth of the market. The share of exports accounted for by high technology products has fallen from over 20% to less than 10% and is now after a long time smaller than the share of imports accounted for by high technology products. Exports of services have not fallen; their value has remained more or less unchanged since 2008. To safeguard the standard of living and jobs, Finland needs new high value-added export production. What could Finland’s comparative advantages in exports be, if the future is considered to be based largely on existing strengths? This question can be examined in the light of whether some sector’s

6
share of Finland’s exports is greater than the share of world trade accounted for by trade in the said sector. From this perspective, in Finland’s case 10 sectors of comparative advantage can be identified. The traditional industrial sectors paper and wood as well as basic metals are to be found among these, but IT services, business services and construction are also included (see Appendix, Figure 11). Compared with Sweden, Finland’s strengths are on a narrow base; the neighbouring country has a relatively strong position not only in Finland’s areas of strength, but also in the pharmaceutical industry as well as in exports of furniture and cultural and recreational services. Compared with Germany, the difference is even more pronounced; Germany’s position is strong in as much as half of the examined industries, particularly in the manufacturing industries. The narrowness of the Finland’s export production has once again proved to be problematic. What is the significance of exports and investment? Strengthening the export sector is necessary to limit the current account deficit. The open sector must be able to attract sufficient resources for its use. To boost conditions for private sector growth, the size of general government finances must be limited. Growth of exports and investment is also indirectly important in terms of reducing the general government deficit (cf. Appendix, pp. 28–29). If profitability and competitiveness are insufficient for increasing investment and exports, there is a risk of entering a spiral in which ailing growth leads to ever-larger deficits. It will not be possible to break this spiral by increasing taxation or cutting expenditure. 2. How to boost economic growth? Finland is badly in need of new high value-added jobs in order to increase exports and output. Competitive, growth-oriented business activity is a prerequisite for preserving both citizens’ standard of living and jobs as well as the welfare state. Finland has fallen a long way: the model country for innovation is no longer a net exporter of high technology products. Finland still has, however, a well-educated labour force and ICT skills as well as business leaders who have experience of the international market. From this foundation, it should be possible to recover part of the productivity losses of recent years. Economic growth is largely the generation and adoption of knowledge and its utilisation. In a competitive market, companies are best equipped to identify and develop knowledge that generates innovations. The state should generally refrain from targeted industrial support and focus on safeguarding for the business community the best possible operating conditions. Public authorities are not well equipped to identify future winners, and subsidy policies might adversely affect economic renewal. The state has an important role to play in promoting growth in areas that have extensive social externalities. Below we focus on covering a few such areas, mainly on an indicative level and through examples. Decisions require more detailed studies, partly on the basis of previous reports.
7
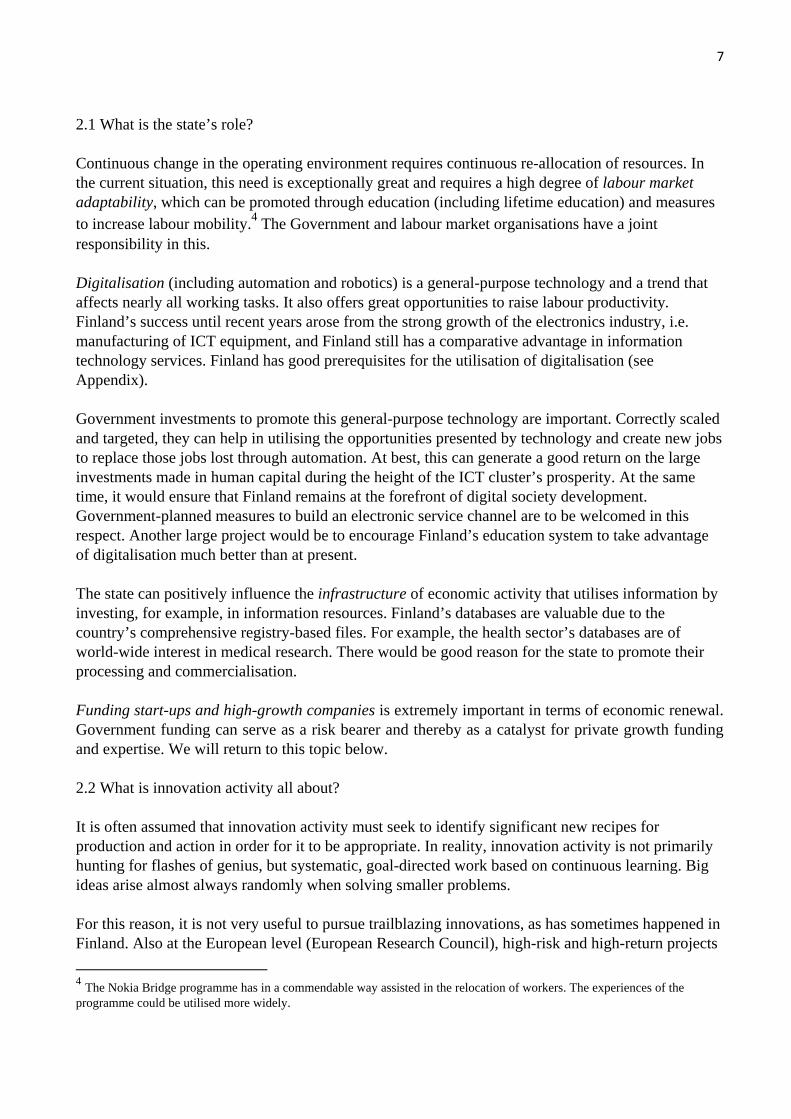
2.1 What is the state’s role? Continuous change in the operating environment requires continuous re-allocation of resources. In the current situation, this need is exceptionally great and requires a high degree of labour market adaptability, which can be promoted through education (including lifetime education) and measures to increase labour mobility.4 The Government and labour market organisations have a joint responsibility in this. Digitalisation (including automation and robotics) is a general-purpose technology and a trend that affects nearly all working tasks. It also offers great opportunities to raise labour productivity. Finland’s success until recent years arose from the strong growth of the electronics industry, i.e. manufacturing of ICT equipment, and Finland still has a comparative advantage in information technology services. Finland has good prerequisites for the utilisation of digitalisation (see Appendix). Government investments to promote this general-purpose technology are important. Correctly scaled and targeted, they can help in utilising the opportunities presented by technology and create new jobs to replace those jobs lost through automation. At best, this can generate a good return on the large investments made in human capital during the height of the ICT cluster’s prosperity. At the same time, it would ensure that Finland remains at the forefront of digital society development. Government-planned measures to build an electronic service channel are to be welcomed in this respect. Another large project would be to encourage Finland’s education system to take advantage of digitalisation much better than at present. The state can positively influence the infrastructure of economic activity that utilises information by investing, for example, in information resources. Finland’s databases are valuable due to the country’s comprehensive registry-based files. For example, the health sector’s databases are of world-wide interest in medical research. There would be good reason for the state to promote their processing and commercialisation. Funding start-ups and high-growth companies is extremely important in terms of economic renewal. Government funding can serve as a risk bearer and thereby as a catalyst for private growth funding and expertise. We will return to this topic below. 2.2 What is innovation activity all about? It is often assumed that innovation activity must seek to identify significant new recipes for production and action in order for it to be appropriate. In reality, innovation activity is not primarily hunting for flashes of genius, but systematic, goal-directed work based on continuous learning. Big ideas arise almost always randomly when solving smaller problems. For this reason, it is not very useful to pursue trailblazing innovations, as has sometimes happened in Finland. Also at the European level (European Research Council), high-risk and high-return projects
4 The Nokia Bridge programme has in a commendable way assisted in the relocation of workers. The experiences of the programme could be utilised more widely.

8
are sought and supported. The danger is that this results in projects that seem big but have only limited chances of success. It is more productive to choose a more modest path and to learn from elsewhere by utilising ideas developed in other parts of the world and by employing imitation as a means to make a return, for example, to the forefront of ICT expertise. This is not new: Finland became one of the 20th century’s fastest growing countries by going abroad to learn and by copying solutions, and also by acquiring the best technologies, which were then improved in small steps rather than through large leaps and bounds. Borrowing good ideas and continually improving them does not mean that the bar is lowered with respect to the final objective. This path is simply different and often better. There are plenty of examples of this from both the corporate world and the research community. Another misconception is that the results of innovation activity improve merely by increasing funding and degrees of freedom. On the contrary, suitable scarcity of resources and correctly set challenges and constraints can be inspiring. When there is too much money and time, the entrepreneurship hunger disappears. More than half of the 500 most valuable US companies were set up when the economy and the stock market were subdued. The re-emergence of Nokia is another example of this. The old principles of scarcity and hunger are worth keeping in mind when designing policies to boost innovation. Funding is important, but it should never be too much. In the light of history, large concrete state-supported projects (regrettably often connected with wars) have from time to time promoted innovation significantly. The “Man on the Moon” project in the 1960s is a classic example of this. The project spawned countless inventions and new products in different fields. The competitive situation, the urgency of the project, the degree of challenge and the clarity of the objective tend to stimulate enthusiasm and inspiration. Today’s robot competitions have accelerated the development of automation for the same reasons. A working autonomous vehicle arose in an astonishingly short period of time. Idea competitions sponsored by governments and benefactors have increasingly been held during the internet era. Their utilisation should also be considered in Finland. 2.3 How can Finland’s innovation chain be developed?5 Start-ups are important for creating innovations and for economic renewal. Although start-ups’ share of GDP is modest – even in the United States, less than one per cent of GDP is invested in them – their importance for economic growth has been proven over time to be considerable (of the 20 largest US-based companies in terms of market value, six began with the support of venture funds). In Finland, too, growth of start-ups should be seen as an important opportunity to raise productivity and create new jobs.
5 This section is partly based on interviews with experts in Finnish high-growth company activity, because there appears to be little publicly available information. It would be good to gather more systematic information, so that activities could be monitored more sensitively on the decision-making level.

9
In recent years, start-up activity in Finland has been gratifying buoyant. Prominent roles have been played by the Aalto Entrepreneurship Society, Startup Sauna and Slush events. Much has been achieved in a short time at the beginning of the innovation chain, thanks to the initiative of students. This work has been dynamic and has even attracted world-wide attention. As a result, foreign investors have become interested in Finnish start-ups. Start-up activity is about much more than money: difficult-to-obtain information is required to assess projects and to make funding decisions as well as to monitor the company’s activities and use of funding. What is needed is informed, expert money – investors who have expertise as well as money at their disposal. With their expertise, investors also contribute actively to the company’s activities, advice and creation of contacts. Networking is particularly important. The law of exponential growth applies to networks. The rate of growth accelerates as the network grows. This characteristic is transmitted via the providers of funding into the whole of innovation activity. Expert money is always scarce. Because Finland’s start-up activity is still young, there is a particularly large shortage of expert money. This is most evident at the stage of the innovation chain in which the company intends to start to market its product and grow its business. In Finland, there are not many venture capital companies able to gather sufficient money to finance this growth stage. Growth funding is perceived as a bottleneck in the sector. Foreign expertise is available for the best projects, which is a good thing; foreign money brings experience and knowledge. But foreign investors have not acquired an extensive investment portfolio in Finland, and to date their commitment to Finnish start-up activity has not been deep. The focus is on cherry-picking the best projects. Experience and contacts, and partly the size of investments, give foreigners an advantage. The Finnish start-up entrepreneur readily jumps onto the wagon of experience and contacts.
A spiral of positive growth entrepreneurship arises when successful domestic entrepreneurs return to act as business angels or venture capital investors. In this way, domestic expert money will accumulate and may over time bear greater responsibility for overall funding. A dynamic innovation chain also requires serial entrepreneurs, whose successes and failures accumulate knowledge and lead to best-practice operating models. Entrepreneurship does not depend on genes; it can be learned from the experiences of others. The beginning of the innovation chain is already being codified in Finland, but in the growth stage there is a lack of experienced experts. The accumulation of domestic expert money will naturally take time, and patience is required in this respect. In the light of (inadequate) statistics, development has been slow, however. This is partly due to the global economic downturn, but also to shortcomings in operating models. Continually-evolving operating models and forms of investment are an important part of the innovation system. This must be supported through legislation. The state also has an important role in direct support for high-growth entrepreneurship. A model example of this is Israel, where high-growth entrepreneurship took off with strong state support. Like many other countries, the Finnish government has (wisely) adopted the Israeli fund of funds model. Israel’s commitment to risk financing, however, has been more extensive and more comprehensive. At the beginning, the Israeli government attracted foreign investors by doubling their investment and by granting them tax exemptions. Foreign investors brought important skills to the country and laid the foundation for growth of the domestic innovation chain.
10
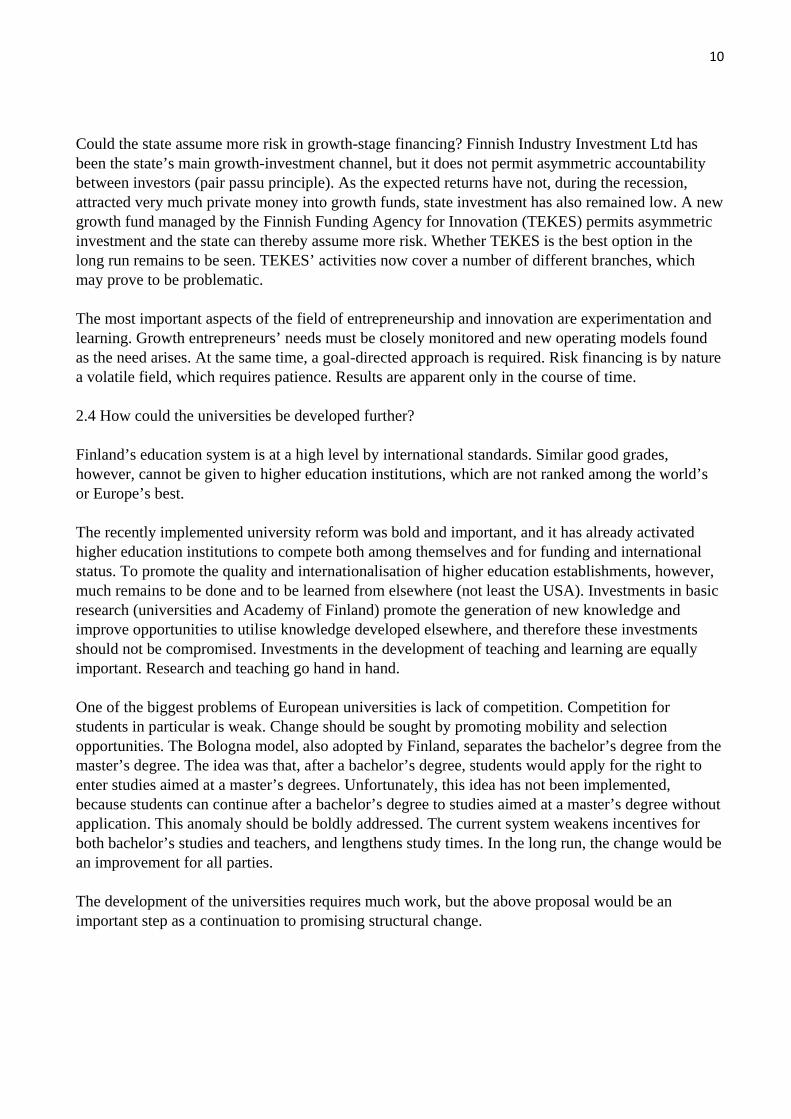
Could the state assume more risk in growth-stage financing? Finnish Industry Investment Ltd has been the state’s main growth-investment channel, but it does not permit asymmetric accountability between investors (pair passu principle). As the expected returns have not, during the recession, attracted very much private money into growth funds, state investment has also remained low. A new growth fund managed by the Finnish Funding Agency for Innovation (TEKES) permits asymmetric investment and the state can thereby assume more risk. Whether TEKES is the best option in the long run remains to be seen. TEKES’ activities now cover a number of different branches, which may prove to be problematic. The most important aspects of the field of entrepreneurship and innovation are experimentation and learning. Growth entrepreneurs’ needs must be closely monitored and new operating models found as the need arises. At the same time, a goal-directed approach is required. Risk financing is by nature a volatile field, which requires patience. Results are apparent only in the course of time. 2.4 How could the universities be developed further? Finland’s education system is at a high level by international standards. Similar good grades, however, cannot be given to higher education institutions, which are not ranked among the world’s or Europe’s best. The recently implemented university reform was bold and important, and it has already activated higher education institutions to compete both among themselves and for funding and international status. To promote the quality and internationalisation of higher education establishments, however, much remains to be done and to be learned from elsewhere (not least the USA). Investments in basic research (universities and Academy of Finland) promote the generation of new knowledge and improve opportunities to utilise knowledge developed elsewhere, and therefore these investments should not be compromised. Investments in the development of teaching and learning are equally important. Research and teaching go hand in hand. One of the biggest problems of European universities is lack of competition. Competition for students in particular is weak. Change should be sought by promoting mobility and selection opportunities. The Bologna model, also adopted by Finland, separates the bachelor’s degree from the master’s degree. The idea was that, after a bachelor’s degree, students would apply for the right to enter studies aimed at a master’s degrees. Unfortunately, this idea has not been implemented, because students can continue after a bachelor’s degree to studies aimed at a master’s degree without application. This anomaly should be boldly addressed. The current system weakens incentives for both bachelor’s studies and teachers, and lengthens study times. In the long run, the change would be an improvement for all parties. The development of the universities requires much work, but the above proposal would be an important step as a continuation to promising structural change.

11
3. How to bridge the sustainability gap? Initiating economic growth and raising the employment rate are prerequisites for restoring public finances. Otherwise, a spiral of recession and budget deficits that cannot be broken by expenditure cuts and tax increases lies ahead. At the same time, it holds that limiting the size of general government finances and financial deficits is necessary for the favourable development of the economy. Ever-rising public indebtedness undermines conditions for economic growth, increases the economy’s vulnerability to crises and distorts intergenerational distribution of income. The Ministry of Finance estimates that the sustainability gap in Finland’s general government finances is just under 5% of GDP or nearly EUR 10 billion. Uncertainty surrounds the figures in both directions, but the sustainability gap is in any case large; reducing it is essential for safeguarding economic growth and the welfare state. Economic recovery and improving productivity will contribute to reducing the general government budget deficit, but they will not remove it, particularly as a large part of the deficit is due to a change in the population’s age structure. What is required are the clearest possible plans as well as broad common understanding and decisions on how the sustainability gap can be bridged over time. In this way, it will be possible to reduce the threat of falling subject to financial market doubts that increase the interest rate risk premium – provided that economic policy as a whole is credible. Below we draw attention to some issues that are considered to be important in terms of the sustainability of public finances. 3.1 Public expenditure Public expenditure is too high with respect to the size the economy. Strict spending discipline must be constantly maintained in public finances. Legislation and policy commitments should be reconsidered in order to stem the spending pressures of the coming years. There must be scope to reduce spending pressures by adjusting the quality of services and the level of benefits. In the reform of social and health care and local government, the goal is to increase the size of municipalities significantly through mergers of several municipalities. Creating units of sufficient size by this means is not plausible, however. We must return to the fundamental questions: How can the required national-level control be ensured? Can this happen within the framework of five specific catchment areas? Should responsibility for arranging certain duties be transferred as per the Swedish model to a limited number of regional operators, which would have decision-making authority and independent funding (a directly-elected council and the right to levy taxes). They would be responsible for, among other things, health care and major transport decisions as well as control of land use. Partial optimisation caused by multi-channel funding should be avoided. Irrespective of the progress of local government reform, the 5-year rule, which adversely affects operational efficiency in connection with municipal mergers, should be discontinued. As part of

12
change security, those made redundant could instead be paid, for example, compensation corresponding to a year’s pay, which would be usable for retraining. Particularly in the Helsinki Metropolitan Area, a sufficiently strong metropolitan authority is required to decided on, among other things, land use, transport and housing. Effective decisions with respect to the whole area are necessary both to avoid partial optimisation and to ensure the competitiveness of the whole of Finland. Studies have found that urbanisation contributes significantly to the development of productivity in the economy. A shortage of affordable rental housing in the Helsinki Metropolitan Area tends to increase the structural unemployment of the whole country. Pension insurance companies have the prerequisites and are interested in financing rental housing, but there is a lack of zoned well-situated land for the construction of housing. As part of housing policy, the Government should set planning obligations that are binding on the Helsinki Metropolitan Area’s municipalities with respect to the supply of land for construction. The option of imposing a tax sanction on owners of zoned but unbuilt land should, if necessary, be forcefully exercised. With respect to publicly arranged services, there is a need for clarification in prioritisation. As there is not enough money in health care for everything, a position should be taken, with the aid of experts, on what forms of care can be financed with public funds (cf. Sweden’s National Centre for Priority Setting in Health Care). In terms of care for the elderly, it would be useful to clarify the level or package of services that citizens can in their advanced years expect will be available to them (and on what conditions). Restating the promise of the welfare state would facilitate an assessment of the adequacy of public funding and would enable the development of private solutions (e.g. insurance) that complement public services. Public expenditure pressures can be partly reduced by improving the efficiency of services provision. It is estimated that improving the annual productivity development of public services provision (e.g. by 0.25%) could reduce expenditure pressures on public finances in the long term and thereby the sustainability gap very significantly (0.7-1.5% of GDP). At the same time, it should be noted that the public sector has more difficult duties and more diverse objectives than the private sector, as a result of which improving private sector efficiency is a challenging task. Productivity should be improved by cutting administration and by enhancing processes without giving up the most important services for citizens. In local government services provision, it is important to promote alternatives and competition by increasing freedom of choice wherever possible. The offering of alternatives has been found to improve the quality of services and the efficiency of processes, regardless of whether the provider is a municipality, the private sector or the third sector. Where competitive tendering is difficult, better methods (productivity, quality, cost-effectiveness) of evaluating publicly-funded services should be developed. Steps should be taken to ensure the implementation of the competition neutrality of different providers and an effective challenge procedure for public services. The local government sector’s ability to utilise information technology in its activities (including electronic services) has so far been disappointingly weak. The structures controlled by the public authorities can be rationalised by cutting units or enhancing the division of responsibilities (for example higher education establishments, ports).

13
The Government’s legislative proposal on discretionary government transfers to develop business activity offers a welcome initiative for the critical assessment and pruning of business aid. Effective implementation requires, however, improved methods of assessing the effectiveness of aid. More emphasis should be given to easing regulation and to promoting competition (for example, construction, trade, energy). 3.2 Taxation High tax rates weaken incentives to work and entrepreneurship and are therefore economically harmful. It is impossible to determine the economy’s “tolerance” for taxation, because the significance of taxes depends on both the forms of tax and expenditure funded by them. Finland’s tax ratio, however, is so high that relying on tax increases is not a means to bridging the sustainability gap. Of the Government’s economic policy measures, one of the most significant is a significant lowering of the corporate tax rate. Over time, this will increase companies’ readiness to remit their profits to Finland and invest and employ in Finland. The impact will be positive, even though its significance for domestic shareholders has been reduced by tightening dividend taxation. In terms of growth policy, a reduction of earned income taxation as well as corporate and capital income taxation would be a step in the right direction. There is no margin for increasing these forms of tax if growth is deemed to be a key objective. There are good justifications, in principle, for environmental taxes. The real-estate tax is an economically efficient tax (one cannot be a tax exile from land), and in Finland it is low by international standards. The real-estate tax threshold should be raised and its based expanded (forest land). The taxation of low-value properties could remain unchanged. The taxation of rental income received from housing investments could be reduced and the capital transfer tax on housing sales abolished. An effort should be made to scale down tax subsidies, including the tax deduction right on housing loan interest. 3.3 Increasing labour supply and expanding the tax base Raising the rate of participation in work must be viewed as a very significant means of expanding the tax base. The sustainability gap in general government finances results mainly from a lengthening of average life expectancy. Fortunately, we are living longer, and in most cases are also healthy for longer. This should therefore provide a good basis for extending working careers. Finland’s employment rate is still lower than the other Nordic countries, particularly with respect to older workers (although the situation has improved in recent years). An effort should be made, however, to extend working careers at all stages of life. More of the studies at universities could, in line with international practice, end with a bachelor’s degree instead of a master’s degree. This could be promoted by relaxing eligibility requirements for public positions and through guidance given to higher education establishments. In addition, Finland’s exceptionally long study times can be shortened by changing financial aid for students to a loan basis. The state would give a loan guarantee, the interest rate would be low, and repayment

14
would be linked to an individual’s earnings development. The development of apprenticeship training has not progressed as expected. It should be possible to shorten periods of unemployment by bringing forward activation measures and by tightening obligations to accept work (cf. Denmark). The role of municipalities in mitigating long-term unemployment could be strengthened. The matching of labour demand and supply can be promoted by increased labour mobility both occupationally (lifetime education) and regionally (housing policy). For the economy, a key project is the reform of the pension system. This is necessary both to limit the upward pressure on pension contributions and, in particular, to broaden the tax base. The essential elements of the reform are raising the pension system’s age limits (and indexation to life expectancy) and restricting the use of routes that lead people away from working life before the old-age pension. In addition, thought should be given to the timing of elevated accruals over a lifetime, from the perspective of their incentive and income distribution effects. The reform of the pension system has been carefully prepared and conditions for implementing the reform are in this respect good. On this issue, however, the labour market organisations have to some extent divergent interests, which may adversely affect decision-making. In connection with the reform of the pension system, it would be useful to agree on a decision rule that safeguards its financial sustainability. One course of action could be for the financial sustainability of the pension system to be assessed at regular intervals. If it turns out that the financial sustainability of the system is threatened, corrective measures would be taken. Unless otherwise agreed in negotiations, index increases to pensions would not be made (or at least only in part) and pension contributions would be increased in accordance with the rule (cf. Swedish and Canadians models). This would continue until the funding of the system was, according to estimates, on a sustainable basis. A major advantage would be that corrective measures would be initiated more flexibly than at present – abdicating responsibility, not addressing sustainability, is not an option. The Government should proceed on the basis that the next Government can, as its first task, submit to Parliament pension reform legislation, which would come into force in 2017. If labour market organisations do not reach agreement by the autumn on a sufficiently ambitious reform, the Government should assign the completion of preparations to an expert group. It would be highly desirable for pension policy not to be one of the major themes of the parliamentary elections; commitments extending far into future should be submitted for political debate only on the basis of a proposal founded on careful preparatory work. 4. Conclusion Raising productivity and restoring the Finnish economy to a growth path will require a lot of time, which is why there is urgency surrounding the preparation of measures and decisions. In formulating policy, patience, determination and perseverance are needed. Many key issues call for broad common understanding of policy priorities – across the boundaries of Government and Opposition.

15
Appendix: Finland’s economic growth 1998–20126 Finland’s economy grew rapidly after the 1990s’ recession until 2007, at the same rate as Sweden and clearly faster than Germany (Figure 1). As a result of the global financial crisis, however, Finland’s GDP declined in 2009 by nearly 9%, reflecting the vulnerability of the country’s economy to international trends. Even more worrying is the fact that growth remained modest in 2010–2011 and output declined once again in 2012–2013. As matters stand, it will take many years before the Finnish economy reaches the level of output from which the collapse began in autumn 2008. Figure 1. Cumulative growth of the total output of the economy, %7
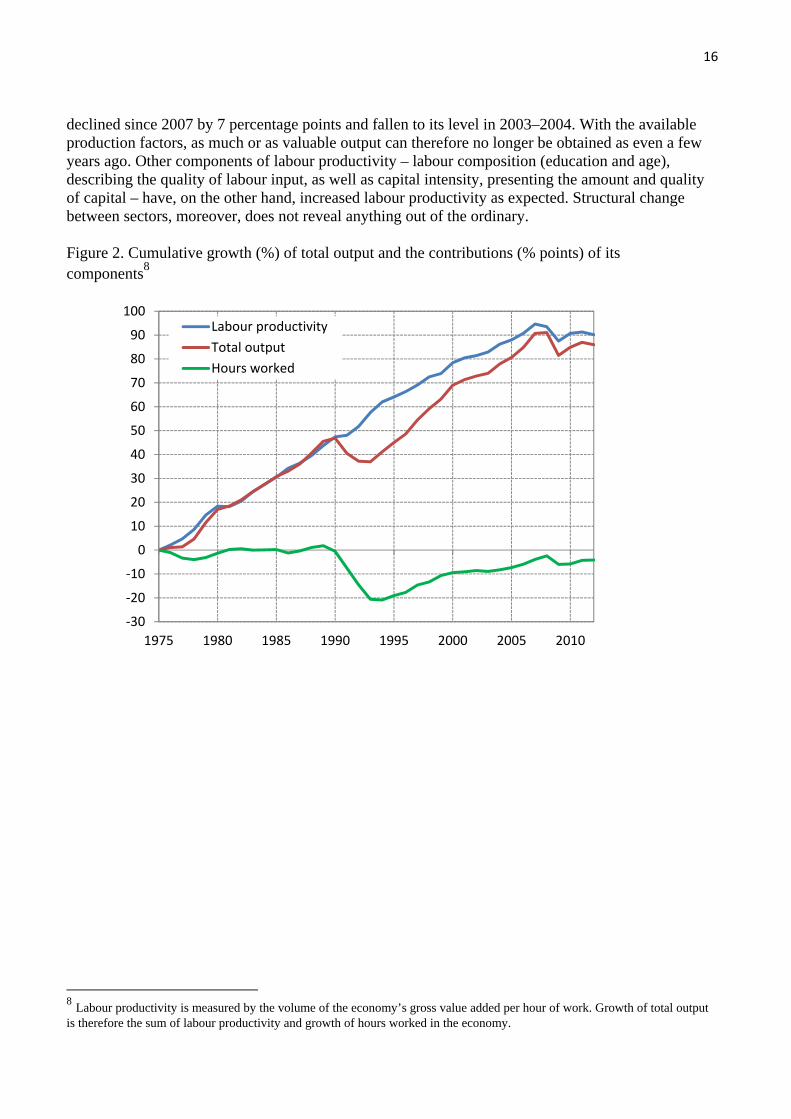
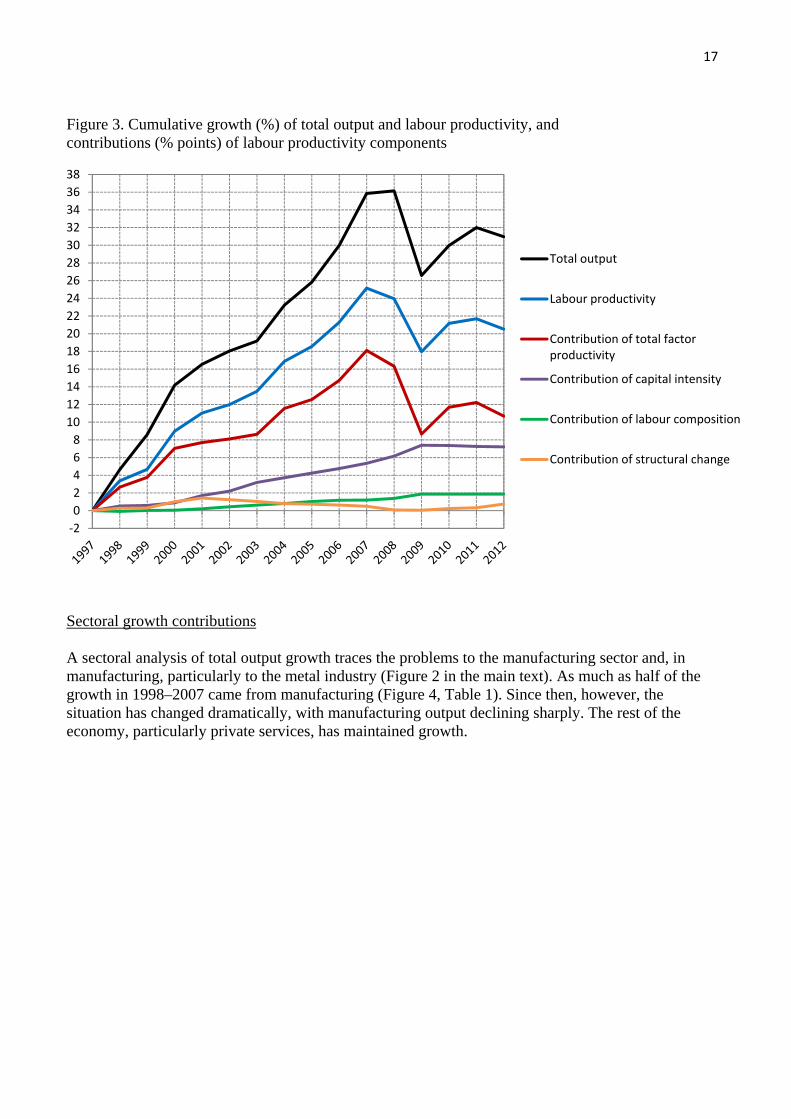
Labour productivity and its sources The present crisis is unique, because the economic stagnation is due to a decline in labour productivity, which has never happened before in the manner now experienced (Figure 2). This did not happen even during the recession of the 1990s. A consequence of the decline in productivity is that employment has deteriorated less than feared. The exceptional nature of development in recent years is best seen against the period of good growth that preceded it (Figure 3). Total output grew 36% from 1997 to 2008, but thereafter it declined to stand at 31%. The reasons for the collapse of growth can be found through two complementary approaches. The first is to see which of the components of labour productivity have collapsed. The second approach is to identify the sectors of the economy where the problems are greatest. An examination of the components of work productivity in Figure 3 immediately reveals the bleak situation: total factor productivity, which measures the efficiency of use of production factors, has
6 The data sources of the calculations are the Eurostat Statistics Database and Statistics Finland’s national accounting and productivity studies. 7 Total output is measured by the volume of gross value added. Growth is presented as the cumulative sum of annual logarithmic percentage changes instead of the customary index presentation, because calculated in this way the growth contributions of the sectors and production factors presented below are highlighted better.
0
5
10
15
20
25
30
35
40
1997 1998 1999 2000 2001 2002 2003 2004 2005 2006 2007 2008 2009 2010 2011 2012
Sweden
Finland
Germany
16
declined since 2007 by 7 percentage points and fallen to its level in 2003–2004. With the available production factors, as much or as valuable output can therefore no longer be obtained as even a few years ago. Other components of labour productivity – labour composition (education and age), describing the quality of labour input, as well as capital intensity, presenting the amount and quality of capital – have, on the other hand, increased labour productivity as expected. Structural change between sectors, moreover, does not reveal anything out of the ordinary. Figure 2. Cumulative growth (%) of total output and the contributions (% points) of its components8
8 Labour productivity is measured by the volume of the economy’s gross value added per hour of work. Growth of total output is therefore the sum of labour productivity and growth of hours worked in the economy.
‐30
‐20
‐10
0
10
20
30
40
50
60
70
80
90
100
1975 1980 1985 1990 1995 2000 2005 2010
Labour productivity
Total output
Hours worked
17
Figure 3. Cumulative growth (%) of total output and labour productivity, and contributions (% points) of labour productivity components
Sectoral growth contributions A sectoral analysis of total output growth traces the problems to the manufacturing sector and, in manufacturing, particularly to the metal industry (Figure 2 in the main text). As much as half of the growth in 1998–2007 came from manufacturing (Figure 4, Table 1). Since then, however, the situation has changed dramatically, with manufacturing output declining sharply. The rest of the economy, particularly private services, has maintained growth.
‐2
0
2
4
6
8
10
12
14
16
18
20
22
24
26
28
30
32
34
36
38
Total output
Labour productivity
Contribution of total factor productivity
Contribution of capital intensity
Contribution of labour composition
Contribution of structural change

18
Figure 4. Cumulative growth (%) of total output and the contributions (% points) of the main sectors9
Table 1: Cumulative growth (%) of total output, and contributions of sectors (% points) 1988-2007 2008-2012 1998-2012 Total output 35.8 -4.8 31.0 Manufacturing 17.1 -6.6 10.5 Electronics industry 10.0 -2.9 7.1 Other metal industry 4.0 -2.3 1.7
Machinery, metal products, and transport equipment 2.5 -1.0 1.5
Electrical equipment 0.6 -0.1 0.5 Basic metals 0.9 -1.2 -0.3 Forest industry 1.3 -0.7 0.6 Other industry 1.8 -0.7 1.1 Private services 12.6 1.3 13.9 Government and household services 1.7 -0.2 1.5 Rest of the economy 4.4 0.7 5.1
9 A sector’s contribution to growth of the economy’s total output is calculated by multiplying the sector’s output growth by its share of the value of total output.
‐202468
101214161820222426283032343638
Total output
Private services
Manufacturing
Real estate activities
Primary and secondary production excluding manufacturing
Government and household services

19
The growth contribution and collapse of the manufacturing sector arose mainly in the metal industry (Table 1). The decline in the electronics industry is greatest, but also basic metals as well as production of machinery, metal products and transport equipment have fallen. In the electronics industry, a key element is Nokia and its ability to compete in intense international competition. The profitability of basic metals has deteriorated (after the 2007 price bubble) as a result of a steep fall in world market prices. The paper industry has long faced falling demand in Europe as well as weak development of prices. Finland’s manufacturing as a whole has suffered from a number of mutually independent, exceptionally strong and, from Finland’s point of view, negative changes in the world market situation. The development of Finland’s manufacturing sector differs from both Sweden and Germany in two ways, which the recession highlights (Figure 5a). In Finland, the growth contribution was clearly greatest before the problems that began in 2007. The recession had a strong impact in all countries, but Finland’s manufacturing sector has not yet recovered from it. In Sweden, the growth contribution has risen to its former level, and in Germany it has grown. Figure 5. Cumulative growth contributions of manufacturing industry and private services, % points
(a) Manufacturing
(b) Private services
0
2
4
6
8
10
12
14
16
18
20
1997 1998 1999 2000 2001 2002 2003 2004 2005 2006 2007 2008 2009 2010 2011 2012
Sweden
Finland
Germany
0
2
4
6
8
10
12
14
16
18
20
1997 19981999 20002001 2002 20032004 20052006 20072008 2009 20102011 2012
Sweden
Finland
Germany

20
A comparison between Finland and Sweden reveals a difference that stems from the fact that in Sweden the growth contributions of the metal industry and the chemical industry have been greater, and from the fact that the significance of the electronics industry has not declined (Figure 6). Swedish industry has not been so dependent on a single industry. Figure 6. Cumulative growth (%) of manufacturing output and cumulative contributions of subsectors, % points
(a) Finland
(b) Sweden
‐10
‐5
0
5
10
15
20
25
30
35
40
45
50
55
60
65
70
75
1997199819992000200120022003200420052006200720082009201020112012
Manufacturing output
Electronics industry
Other metal industry
Forest industry
Chemical industry
Other manufacturing
‐10
‐5
0
5
10
15
20
25
30
35
40
45
50
55
60
65
70
75
1997199819992000200120022003200420052006200720082009201020112012
Manufacturing output
Electronics industry
Other metal industry
Forest industry
Chemical industry
Other manufacturing

21
Significance of services output During the last 15 years, private services have positively contributed to the growth of the whole economy relative uniformly and significantly. A collapse similar to that seen in manufacturing has not occurred in this respect; the growth impact has also been positive after 2007. In Finland, service sector growth has been faster than in Germany but slow compared with Sweden (Figure 5b). The faster growth of Sweden’s economy is explained by the higher contribution of the service sector. Also of note is that Sweden’s recovery from the recession has not been based on manufacturing, but on the strong growth impact of the service sector. Business services as well as finance and insurance have developed weakly in Finland (Table 2). Finland’s services output growth has been faster than in Sweden only in ICT services.
Table 2: Growth contributions of private services in Finland and in Sweden, % points Finland Sweden 1998–2007 2008–2012 1998–2012 1998–2007 2008–2012 1998–2012 Distribution services10 6.1 0.1 6.2 6.4 0.9 7.3 Business services 2.3 0.5 2.8 4.1 1.1 5.2
Information and communications 3.9 0.9 4.8 3.4 1.1 4.5
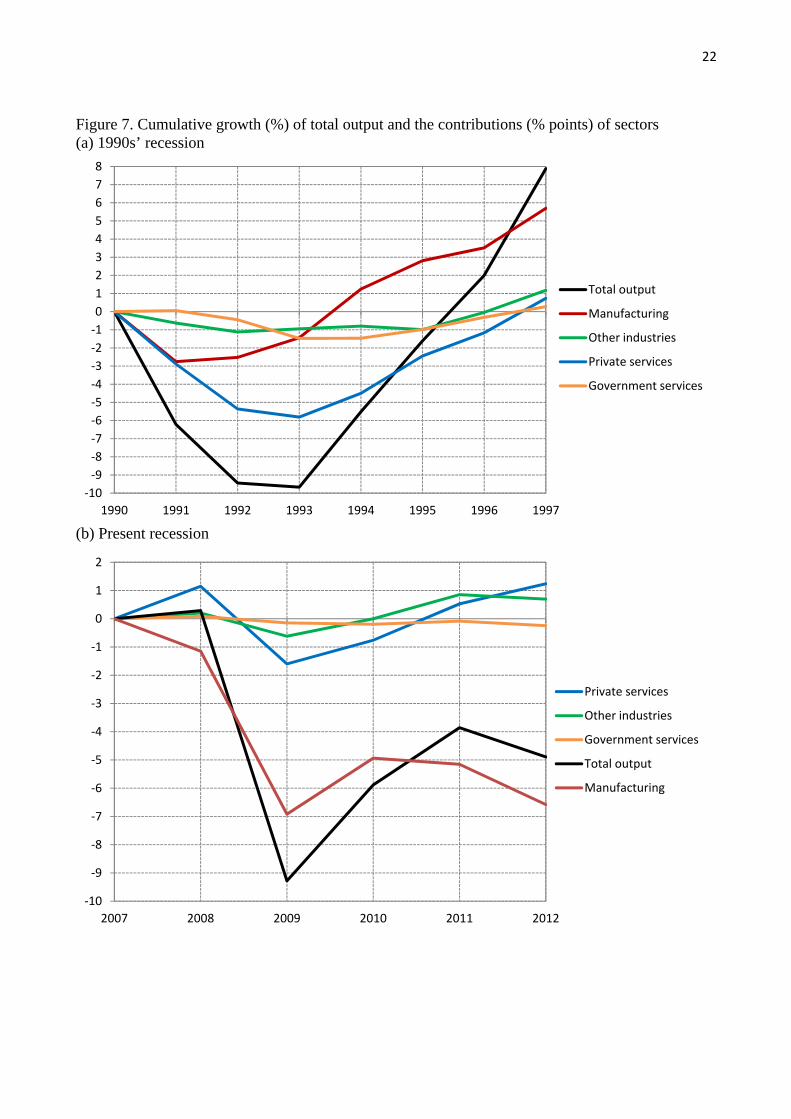
Finance and insurance 0.2 -0.1 0.1 1.8 0.6 2.4 Private services, total 12.5 1.3 13.8 15.7 3.7 19.4 A comparison of the 1990s’ recession and present situation The present crisis is very different from the recession of the 1990s (Figure 7). During the 1990s’ recession, manufacturing contracted only modestly and temporarily, whereas the decline in private services was deep and long. The recession was directed mainly at the domestic market, and was due to high real interest rates. In addition, exports were boosted by international economic recovery, and price competition improved through exchange rates. The 1990s’ recession was to a significant extent home made (excluding the collapse of the Soviet Union). Now the issue is the weak development of the world economy and related restructuring. As matters stand, economic weakness will be more protracted this time than in the 1990s. During the current crisis, services have contracted only slightly and temporarily, whereas the decline of manufacturing has been dramatic. The domestic market, moreover, may remain weak as exports hopefully return to growth.
10 Distribution services include wholesale and retail trade, transport and storage as well as accommodation and food service activitites.
22
Figure 7. Cumulative growth (%) of total output and the contributions (% points) of sectors (a) 1990s’ recession
(b) Present recession
‐10
‐9
‐8
‐7
‐6
‐5
‐4
‐3
‐2
‐1
0
1
2
3
4
5
6
7
8
1990 1991 1992 1993 1994 1995 1996 1997
Total output
Manufacturing
Other industries
Private services
Government services
‐10
‐9
‐8
‐7
‐6
‐5
‐4
‐3
‐2
‐1
0
1
2
2007 2008 2009 2010 2011 2012
Private services
Other industries
Government services
Total output
Manufacturing
23
80
85
90
95
100
105
110
1997 1998 1999 2000 2001 2002 2003 2004 2005 2006 2007 2008 2009 2010 2011 2012
Germany
Finland
Sweden
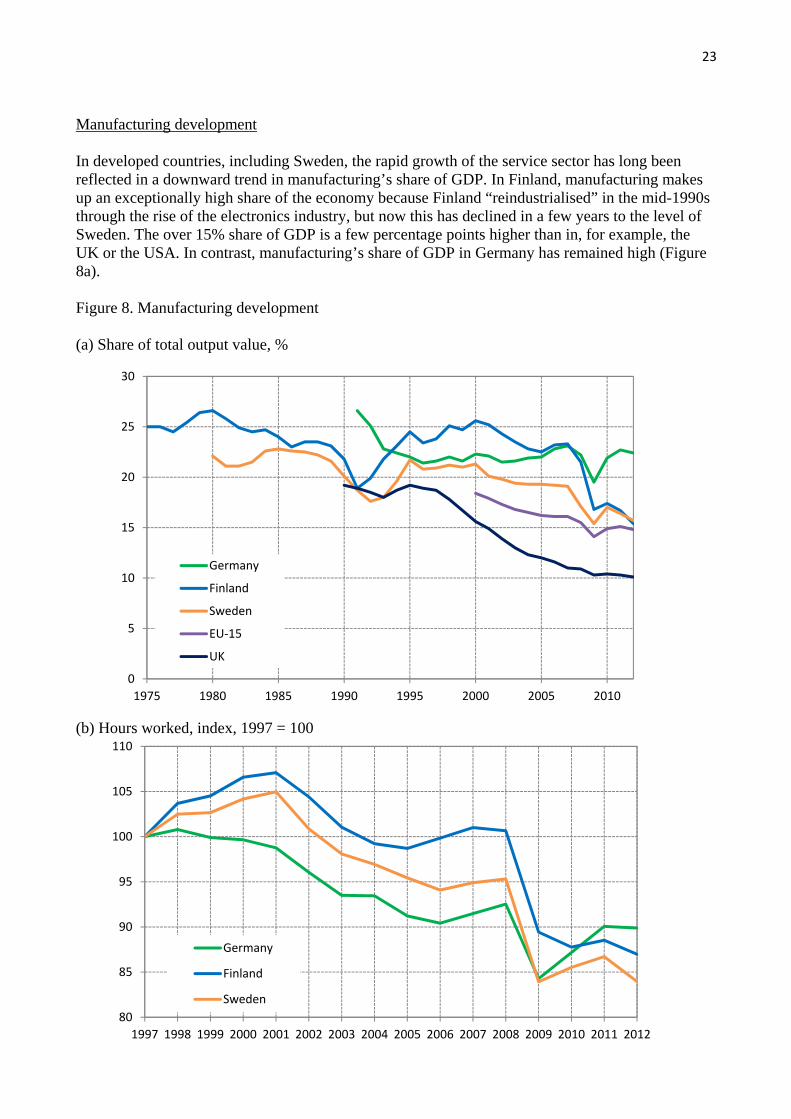
Manufacturing development In developed countries, including Sweden, the rapid growth of the service sector has long been reflected in a downward trend in manufacturing’s share of GDP. In Finland, manufacturing makes up an exceptionally high share of the economy because Finland “reindustrialised” in the mid-1990s through the rise of the electronics industry, but now this has declined in a few years to the level of Sweden. The over 15% share of GDP is a few percentage points higher than in, for example, the UK or the USA. In contrast, manufacturing’s share of GDP in Germany has remained high (Figure 8a). Figure 8. Manufacturing development (a) Share of total output value, %
(b) Hours worked, index, 1997 = 100
0
5
10
15
20
25
30
1975 1980 1985 1990 1995 2000 2005 2010
Germany
Finland
Sweden
EU‐15
UK
24
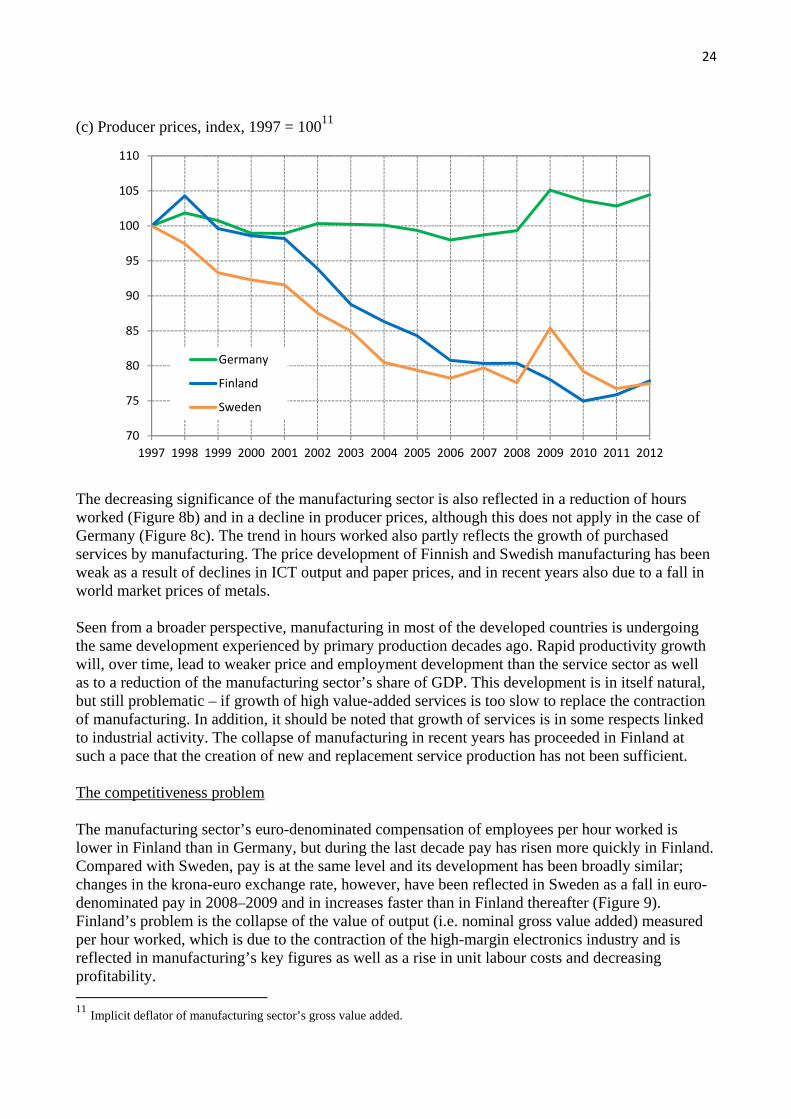
(c) Producer prices, index, 1997 = 10011
The decreasing significance of the manufacturing sector is also reflected in a reduction of hours worked (Figure 8b) and in a decline in producer prices, although this does not apply in the case of Germany (Figure 8c). The trend in hours worked also partly reflects the growth of purchased services by manufacturing. The price development of Finnish and Swedish manufacturing has been weak as a result of declines in ICT output and paper prices, and in recent years also due to a fall in world market prices of metals. Seen from a broader perspective, manufacturing in most of the developed countries is undergoing the same development experienced by primary production decades ago. Rapid productivity growth will, over time, lead to weaker price and employment development than the service sector as well as to a reduction of the manufacturing sector’s share of GDP. This development is in itself natural, but still problematic – if growth of high value-added services is too slow to replace the contraction of manufacturing. In addition, it should be noted that growth of services is in some respects linked to industrial activity. The collapse of manufacturing in recent years has proceeded in Finland at such a pace that the creation of new and replacement service production has not been sufficient. The competitiveness problem The manufacturing sector’s euro-denominated compensation of employees per hour worked is lower in Finland than in Germany, but during the last decade pay has risen more quickly in Finland. Compared with Sweden, pay is at the same level and its development has been broadly similar; changes in the krona-euro exchange rate, however, have been reflected in Sweden as a fall in euro-denominated pay in 2008–2009 and in increases faster than in Finland thereafter (Figure 9). Finland’s problem is the collapse of the value of output (i.e. nominal gross value added) measured per hour worked, which is due to the contraction of the high-margin electronics industry and is reflected in manufacturing’s key figures as well as a rise in unit labour costs and decreasing profitability. 11 Implicit deflator of manufacturing sector’s gross value added.
70
75
80
85
90
95
100
105
110
1997 1998 1999 2000 2001 2002 2003 2004 2005 2006 2007 2008 2009 2010 2011 2012
Germany
Finland
Sweden
25
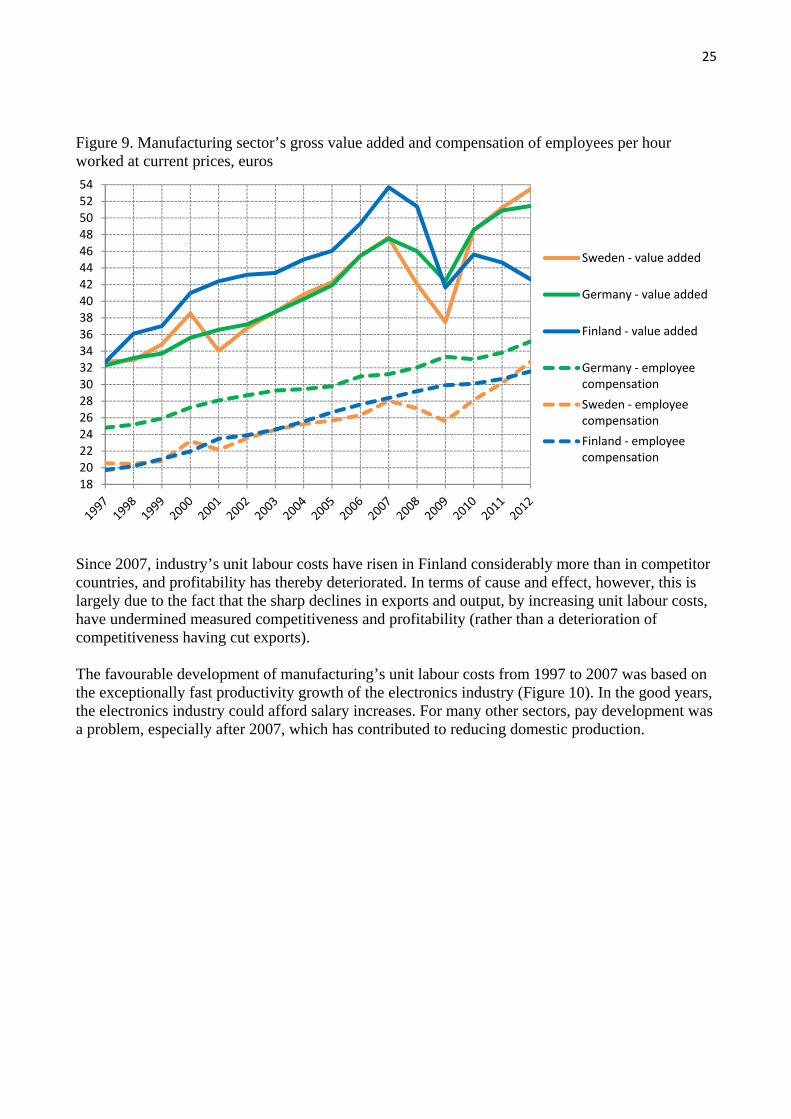
Figure 9. Manufacturing sector’s gross value added and compensation of employees per hour worked at current prices, euros
Since 2007, industry’s unit labour costs have risen in Finland considerably more than in competitor countries, and profitability has thereby deteriorated. In terms of cause and effect, however, this is largely due to the fact that the sharp declines in exports and output, by increasing unit labour costs, have undermined measured competitiveness and profitability (rather than a deterioration of competitiveness having cut exports). The favourable development of manufacturing’s unit labour costs from 1997 to 2007 was based on the exceptionally fast productivity growth of the electronics industry (Figure 10). In the good years, the electronics industry could afford salary increases. For many other sectors, pay development was a problem, especially after 2007, which has contributed to reducing domestic production.
18
20
2224
26
2830
3234
36
3840
42
4446
48
5052
54
Sweden ‐ value added
Germany ‐ value added
Finland ‐ value added
Germany ‐ employee compensation
Sweden ‐ employee compensation
Finland ‐ employee compensation

26
Figure 10. Unit labour costs in Finland’s manufacturing sector, index, 1997 = 10012
Exports and the economy’s comparative advantage The level of Finland’s exports collapsed in 2009 and even since then growth of exports has been much slower than growth of the market. The electronics industry, basic metals and the forest industry have contributed to this. The share of exports accounted for by high technology products has fallen from over 20% to less than 10% and is now, after a long time, smaller than the share of imports accounted for by high technology products. Exports of services have not fallen; their value has remained more or less unchanged since 2008. In recent years, the structure of exports has evolved in an unfavourable direction, in the sense that the proportion of products intended for end-use has fallen and the proportion of intermediate products has increased. In Sweden and Germany, in contrast, this has not happen, which means that Finland’s real competitiveness relative to these countries has deteriorated. To safeguard the standard of living and jobs, Finland needs new high value-added export production. What could be Finland’s comparative advantages in exports, if the future is considered to be based largely on existing strengths? This question can be examined in the light of whether some sector’s share of Finland’s exports is greater than the share of world trade accounted for by trade in the said sector. From this perspective, in Finland’s case 10 sectors of comparative advantage can be identified. These include the traditional industrial sectors paper and wood as well as basic metals, but also IT services, business services and construction (Figure 11).
12 Source: Tukuseto.
0
10
20
30
40
50
60
70
80
90
100
110
120
130
1997 1998 1999 2000 2001 2002 2003 2004 2005 2006 2007 2008 2009 2010 2011 2012
Manufacturing excluding electronics
Manufacturing
Electronics industry

27
Figure 11. Economy’s comparative advantage in 201013
Compared with Sweden, Finland’s strengths are on a narrow base; the neighbouring country also has a relatively strong position in the pharmaceutical industry as well as in exports of furniture and cultural and recreational services. Compared with Germany, the difference is even more pronounced; Germany’s position is strong in as many as half of the examined industries, particularly in manufacturing industries. This strength of Germany was revealed above in the development of manufacturing’s GDP share and producer prices (Figure 8). In terms of export production, Finland is still a rather unbalanced country, which has once again proved to be problematic for the stable development of the economy.
13 Comparative advantage lies in those sectors where the index value is greater than 1. Figures for manufacturing industries have been calculated from international trade in goods, figures for service industries from world trade in services. They are not therefore mutually comparable in terms of their absolute values. Source: European Competitiveness Report 2012, European Commission.
0 1 2 3 4 5 6 7 8 9 10
Tobacco
Culture and recreation
Clothing
Insurance
Leather and footwear
Furniture
Motor vehicles
Textiles
Finance
Food
Communications
Beverages
Other manufacturing
Computers and optical eq.
Pharmaceuticals
Transportation
Non‐metallic minerals
Printing
Rubber and plastics
Chemicals
Metal products
Other transport
Electrical equipment
Machinery
Other business services
Refined petroleum
Construction
Basic metals
Computer and information
Wood and wood products
Paper
Finland
Sweden
Germany

28
It is evident that strengthening the export sector is necessary not only from the perspective of economic growth or to limit current account deficits. It is also necessary to enable the strengthening of public sector funding. In understanding this, it is good to be aware that a current account surplus is (by definition) equal to the sum of public and private sector financial surpluses. The public sector’s financial balance is equal to the excess of tax and other revenue over expenditure, and the private sector’s financial balance is equal to financial savings less real investment. Sector-specific financial balances are presented in Figure 12, where the private sector is divided into households and corporations (including financial and insurance institutions). Figure 12. Sector-specific financial balances relative to GDP, %
In Finland, the private and public sectors long enjoyed financial surpluses from the late-1990s, and this was reflected from time to time in even substantial current account surpluses. Since then, the current account has turned into deficit, which has been accompanied by a shift in general government finances from surplus to deficit. The private sector financial balance strengthened significantly in crisis year 2009 (when private consumption and private investment contracted strongly), after which it has been quite stable and small. In contrast with the 1990s’ recession, the private sector continues to be in financial surplus despite the recession. Taking into account the present budget deficits and the expenditure pressures arising from population ageing, the Ministry of Finance estimates that safeguarding the funding of Finland’s public finances will require a strengthening of the financial balance by an amount corresponding to

29
nearly 5% of GDP. This must be accompanied by either a reduction of the private sector financial balance or by a strengthening of the current account. The former can be achieved mainly through a significant increase in companies’ willingness to invest (the household savings ratio is relatively stable). A particular prerequisite for the latter is strong growth of exports. And what if profitability and competitiveness are insufficient to increase investment and/or exports? In that case, measures to strengthen public finances will inevitably prove to be ineffective; as a result, instead of smaller deficits there will be a spiral of ailing growth and ever-larger deficits, which it will not be possible to break by raising taxes and cutting expenditure. Competitive, growth-oriented business activity is, all told, a prerequisite for preserving both citizens’ standard of living and jobs as well as the funding of the welfare state. Finland has lost to a significant extent high value-added export production, which must be replaced. In this, improving competitiveness by containing costs will have a significant role to play. It is regrettable that wage moderation was adopted very slowly in the Finnish labour market. In the longer term, as well as cost development, competitiveness will depend on many economic and social characteristics such as infrastructure, public institutions, public trust, education and market efficiency. Comparisons of competitiveness in a broader sense are published by many international organisations and foreign think tanks. In such comparisons, Finland is often rated as highly competitive. Given the last decade’s weak economic development, attention has been drawn to the fact that Finland appears to underperform the findings of these competitiveness comparisons. On the other hand, the development of Finland’s exports and economy has been extremely favourable over the last 20 or 50 or 150 years. In Finland, many fundamentals are on a strong footing, and this has supported economic development. Good fundamentals will not, however, protect the country from rapid changes in the global economy. Instead, they give reason to ponder whether Finland over time also has the prerequisites to overcome this crisis. Information technology and digitalisation as a source of new growth Finland’s strong growth success arose from the strong growth of the electronics industry, namely the manufacture of ICT equipment, but this collapsed when Nokia lost its market share in high-margin smartphones. Finland still has a comparative advantage in IT services, however. Could information technology and digitalisation – the automation of information work with the aid of digital technology – create new economic growth? As a general-purpose technology, ICT increases labour productivity via three channels. The first is growth of total factor productivity (TFP) in ICT equipment manufacturing and service provision, which arises from the rapid development of technology. The second channel of influence is the replacement of other capital with higher-productivity ICT capital, namely computers, software and information systems. The third is the change in behaviour that new technology makes possible. Through digitalisation, information work disappears completely, shifted to be done by customers themselves and outsourced to countries with lower wage levels. The significance of the first two channels can be analysed by measuring their effects on labour productivity growth in the same way as was done earlier when assessing the significance of production factors and total factor productivity (Figure 3). It is noteworthy that, calculated in this
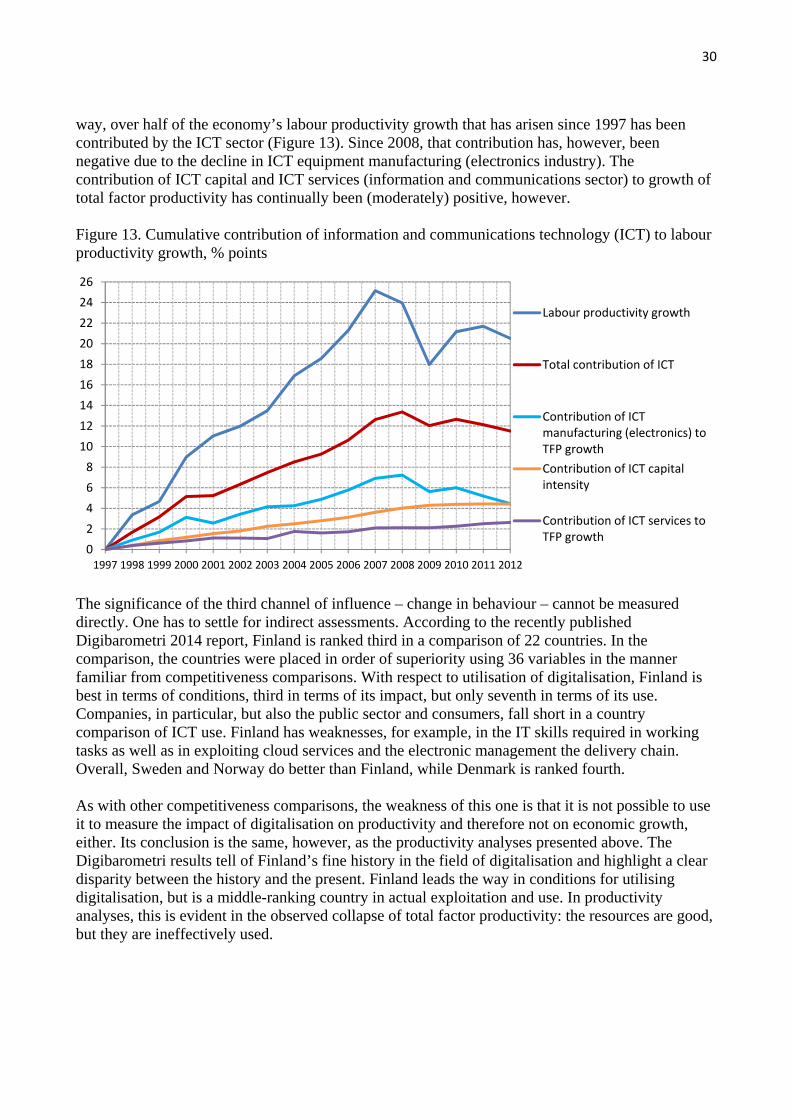
30
way, over half of the economy’s labour productivity growth that has arisen since 1997 has been contributed by the ICT sector (Figure 13). Since 2008, that contribution has, however, been negative due to the decline in ICT equipment manufacturing (electronics industry). The contribution of ICT capital and ICT services (information and communications sector) to growth of total factor productivity has continually been (moderately) positive, however. Figure 13. Cumulative contribution of information and communications technology (ICT) to labour productivity growth, % points
The significance of the third channel of influence – change in behaviour – cannot be measured directly. One has to settle for indirect assessments. According to the recently published Digibarometri 2014 report, Finland is ranked third in a comparison of 22 countries. In the comparison, the countries were placed in order of superiority using 36 variables in the manner familiar from competitiveness comparisons. With respect to utilisation of digitalisation, Finland is best in terms of conditions, third in terms of its impact, but only seventh in terms of its use. Companies, in particular, but also the public sector and consumers, fall short in a country comparison of ICT use. Finland has weaknesses, for example, in the IT skills required in working tasks as well as in exploiting cloud services and the electronic management the delivery chain. Overall, Sweden and Norway do better than Finland, while Denmark is ranked fourth. As with other competitiveness comparisons, the weakness of this one is that it is not possible to use it to measure the impact of digitalisation on productivity and therefore not on economic growth, either. Its conclusion is the same, however, as the productivity analyses presented above. The Digibarometri results tell of Finland’s fine history in the field of digitalisation and highlight a clear disparity between the history and the present. Finland leads the way in conditions for utilising digitalisation, but is a middle-ranking country in actual exploitation and use. In productivity analyses, this is evident in the observed collapse of total factor productivity: the resources are good, but they are ineffectively used.
0
2
4
6
8
10
12
14
16
18
20
22
24
26
1997 1998 1999 2000 2001 2002 2003 2004 2005 2006 2007 2008 2009 2010 2011 2012
Labour productivity growth
Total contribution of ICT
Contribution of ICT manufacturing (electronics) to TFP growth
Contribution of ICT capital intensity
Contribution of ICT services to TFP growth