the nation’s report card: a first look: 2013 mathematics ... · the nation’s report card >...
TRANSCRIPT
A First Look: 2013 Mathematics and ReadingNATIONAL ASSESSMENT OF EDUCATIONAL PROGRESS AT GRADES 4 AND 8
U.S. Department of Education
NCES 2014–451
http://nationsreportcard.gov/reading_math_2013
A New Approach to ReportingNAEP results are now easier than ever to access in a new interactive website at http://nationsreportcard .gov/reading_math_2013. The results from the 2013 assessments in mathematics and reading at grades 4 and 8 highlighted on the following pages can be explored in more detail with interactive graphics, downloadable data, and enhanced features for viewing state results.
What Is The Nation’s Report CardTM?The Nation’s Report Card™ informs the public about the academic achievement of elementary and secondary students in the United States. Report cards communicate the findings of the National Assessment of Educational Progress (NAEP), a continuing and nationally representative measure of achievement in various subjects over time.
Since 1969, NAEP assessments have been conducted periodically in reading, mathematics, science, writing, U.S. history, civics, geography,
and other subjects. NAEP collects and reports information on student performance at the national and state levels, making the assessment an integral part of our nation’s evaluation of the condition and progress of education. Only academic achievement data and related background information are collected. The privacy of individual students and their families is protected.
NAEP is a congressionally authorized project of the National Center for Education Statistics (NCES) within the Institute of Education Sciences of the U.S. Department of Education. The Commissioner of Education Statistics is responsible for carrying out the NAEP project. The National Assessment Governing Board oversees and sets policy for NAEP.
To stay up-to-date with the latest results and advances in NAEP assessments, follow us on Facebook and Twitter.
Photo Credits:
© Franckreporter/iStockphoto #21058060; © American Images Inc./ Digital Vision/Getty #72724181; © Aldo Murillo/iStockphoto #6614201; © Nastco/iStockphoto #22522027
2

THE NATION’S REPORT CARD > 2013 MATHEMATICS AND READING
What knowledge and skills are assessed?The National Assessment Governing Board oversees the development of NAEP frameworks that describe the specific knowledge and skills to be assessed in each subject.
The NAEP mathematics assessment measures students’ knowledge and skills in mathematics and students’ ability to apply their knowledge in problem-solving situations. At each grade, students responded to multiple-choice and constructed-response questions designed to measure what they know and can do across five mathematics content areas:
Number properties and operations
Measurement
Geometry
Data analysis, statistics, and probability
Algebra
The NAEP reading assessment measures students’ reading comprehension by asking them to read selected grade-appropriate materials and answer questions based on what they have read. At each grade, students responded to multiple-choice and constructed-response questions designed to measure their reading comprehension across two types of texts:
Literary texts include fiction, literary nonfiction, and poetry.
Informational texts include expository, argumentative and persuasive, procedural, and document texts.
The complete subject area frameworks are available on the National Assessment Governing Board website at http://www.nagb.org/publications/frameworks.html.
How are results reported?NAEP results in mathematics and reading are based on nationally representative samples of fourth- and eighth-graders. The chart below shows the number of school and student participants in 2013.
Mathematics Reading
Number of schools Number of students Number of schools Number of students
4th Grade 7,930 186,500 7,920 190,400
8th Grade 6,520 170,100 6,510 171,800
NOTE: The number of schools is rounded to the nearest ten. The number of students is rounded to the nearest hundred.
SOURCE: U.S. Department of Education, Institute of Education Sciences, National Center for Education Statistics, National Assessment of Educational Progress (NAEP), 2013 Mathematics and Reading Assessments.
Student performance is reported as average scores on separate 0 to 500 scales in mathematics and reading, and as the percentages of students performing at or above three achievement levels (Basic, Proficient, and Advanced). Changes in students’ performance over time are noted only if the differences in scores or percentages are determined to be statistically significant (p < .05). Because NAEP scales and achievement levels are developed independently for each subject, results cannot be compared across subjects.
3
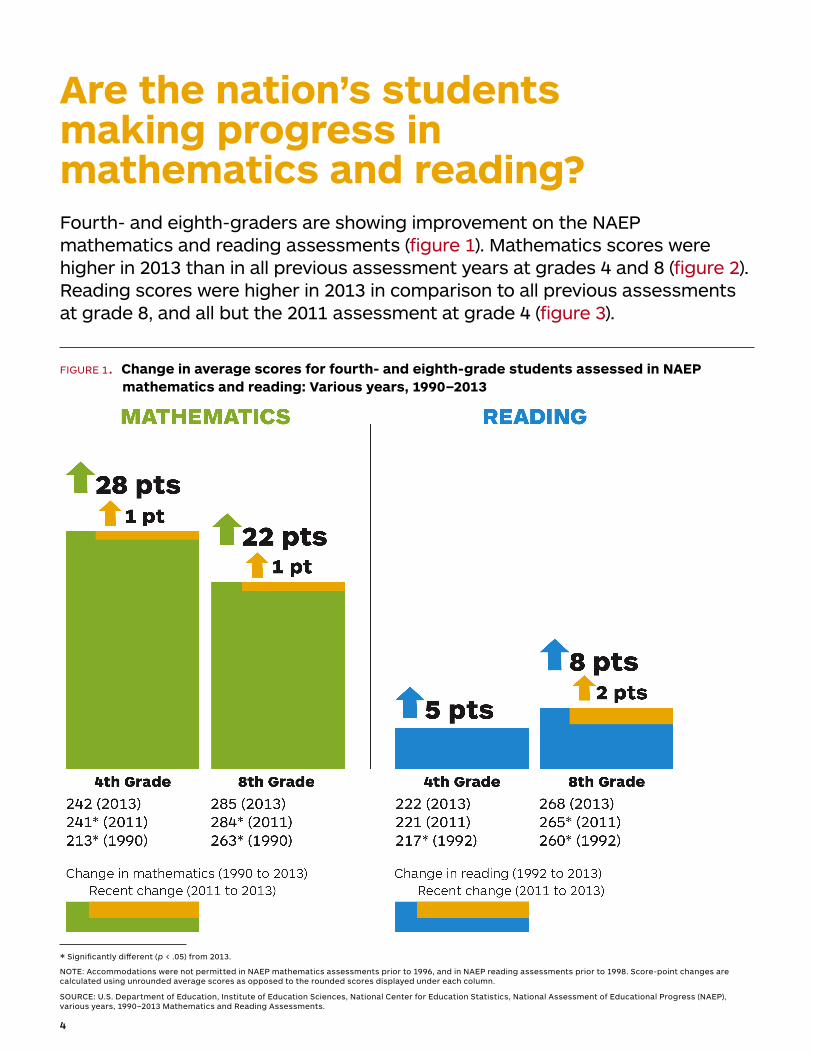
Are the nation’s students making progress in mathematics and reading?Fourth- and eighth-graders are showing improvement on the NAEP mathematics and reading assessments (figure 1). Mathematics scores were higher in 2013 than in all previous assessment years at grades 4 and 8 (figure 2). Reading scores were higher in 2013 in comparison to all previous assessments at grade 8, and all but the 2011 assessment at grade 4 (figure 3).
FIGURE 1. Change in average scores for fourth- and eighth-grade students assessed in NAEP mathematics and reading: Various years, 1990–2013
4
* Significantly different (p < .05) from 2013.
NOTE: Accommodations were not permitted in NAEP mathematics assessments prior to 1996, and in NAEP reading assessments prior to 1998. Score-point changes are calculated using unrounded average scores as opposed to the rounded scores displayed under each column.
SOURCE: U.S. Department of Education, Institute of Education Sciences, National Center for Education Statistics, National Assessment of Educational Progress (NAEP), various years, 1990–2013 Mathematics and Reading Assessments.
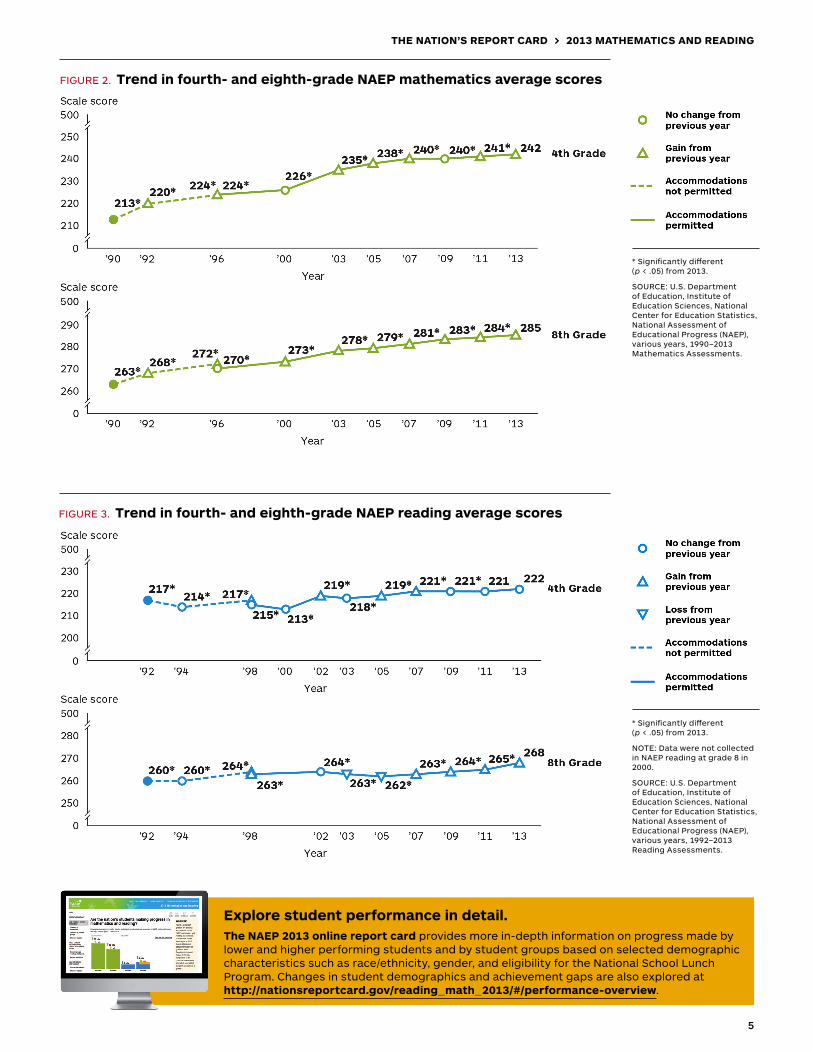
FIGURE 2. Trend in fourth- and eighth-grade NAEP mathematics average scores
* Significantly different (p < .05) from 2013.
SOURCE: U.S. Department of Education, Institute of Education Sciences, National Center for Education Statistics, National Assessment of Educational Progress (NAEP), various years, 1990–2013 Mathematics Assessments.
FIGURE 3. Trend in fourth- and eighth-grade NAEP reading average scores
* Significantly different (p < .05) from 2013.
NOTE: Data were not collected in NAEP reading at grade 8 in 2000.
SOURCE: U.S. Department of Education, Institute of Education Sciences, National Center for Education Statistics, National Assessment of Educational Progress (NAEP), various years, 1992–2013 Reading Assessments.
Explore student performance in detail.The NAEP 2013 online report card provides more in-depth information on progress made by lower and higher performing students and by student groups based on selected demographic characteristics such as race/ethnicity, gender, and eligibility for the National School Lunch Program. Changes in student demographics and achievement gaps are also explored at http://nationsreportcard.gov/reading_math_2013/#/performance-overview.
5
THE NATION’S REPORT CARD > 2013 MATHEMATICS AND READING

What level of knowledge and skills have the nation’s students achieved?NAEP achievement levels are performance standards describing what students should know and be able to do at the Basic, Proficient, and Advanced levels. The cut score indicating the lower end of the score range for each level is noted after the description.
4th Grade 8th Grade
Mathematics
Basic Fourth-grade students performing at the Basic level should show some evidence of understanding the mathematical concepts and procedures in the five NAEP content areas. (214)
Eighth-grade students performing at the Basic level should exhibit evidence of conceptual and procedural understanding in the five NAEP content areas. This level of performance signifies an understanding of arithmetic operations—including estimation—on whole numbers, decimals, fractions, and percents. (262)
Proficient Fourth-grade students performing at the Proficient level should consistently apply integrated procedural knowledge and conceptual understanding to problem solving in the five NAEP content areas. (249)
Eighth-grade students performing at the Proficient level should apply mathematical concepts and procedures consistently to complex problems in the five NAEP content areas. (299)
Advanced Fourth-grade students performing at the Advanced level should apply integrated procedural knowledge and conceptual understanding to complex and nonroutine real-world problem solving in the five NAEP content areas. (282)
Eighth-grade students performing at the Advanced level should be able to reach beyond the recognition, identification, and application of mathematical rules in order to generalize and synthesize concepts and principles in the five NAEP content areas. (333)
Reading
Basic Fourth-grade students performing at the Basic level should be able to locate relevant information, make simple inferences, and use their understanding of the text to identify details that support a given interpretation or conclusion. Students should be able to interpret the meaning of a word as it is used in the text. (208)
Eighth-grade students performing at the Basic level should be able to locate information; identify statements of main idea, theme, or author’s purpose; and make simple inferences from texts. They should be able to interpret the meaning of a word as it is used in the text. Students performing at this level should also be able to state judgments and give some support about content and presentationof content. (243)
Proficient Fourth-grade students performing at the Proficient level should be able to integrate and interpret texts and apply their understanding of the text to draw conclusions and make evaluations. (238)
Eighth-grade students performing at the Proficient level should be able to provide relevant information and summarize main ideas and themes. They should be able to make and support inferences about a text, connect parts of a text, and analyze text features. Students performing at this level should also be able to fully substantiate judgments about content and presentation of content. (281)
Advanced Fourth-grade students performing at the Advanced level should be able to make complex inferences and construct and support their inferential understanding of the text. Students should be able to apply their understanding of a text to make and support a judgment. (268)
Eighth-grade students performing at the Advanced level should be able to make connections within and across texts and to explain causal relations. They should be able to evaluate and justify the strength of supporting evidence and the quality of an author’s presentation. Students performing at the Advanced level also should be able to manage the processing demands of analysis and evaluation by stating, explaining, and justifying. (323)
6
7
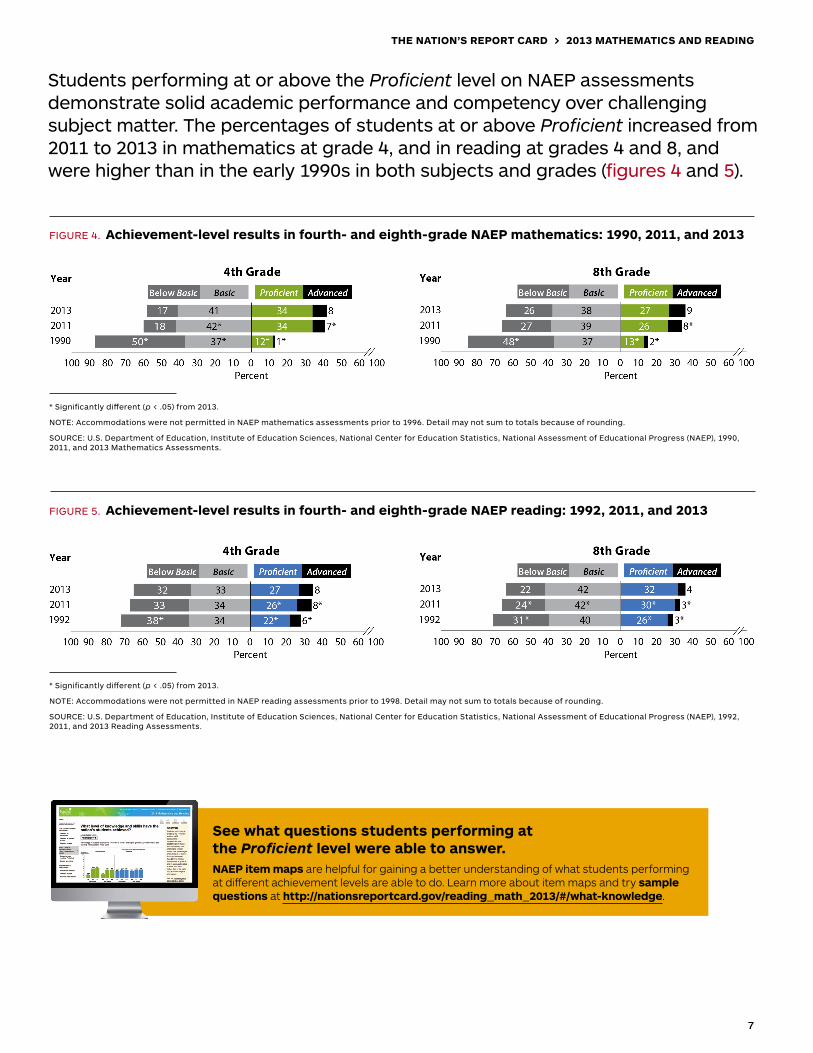
Students performing at or above the Proficient level on NAEP assessments demonstrate solid academic performance and competency over challenging subject matter. The percentages of students at or above Proficient increased from 2011 to 2013 in mathematics at grade 4, and in reading at grades 4 and 8, and were higher than in the early 1990s in both subjects and grades (figures 4 and 5).
FIGURE 4. Achievement-level results in fourth- and eighth-grade NAEP mathematics: 1990, 2011, and 2013
* Significantly different (p < .05) from 2013.
NOTE: Accommodations were not permitted in NAEP mathematics assessments prior to 1996. Detail may not sum to totals because of rounding.
SOURCE: U.S. Department of Education, Institute of Education Sciences, National Center for Education Statistics, National Assessment of Educational Progress (NAEP), 1990, 2011, and 2013 Mathematics Assessments.
FIGURE 5. Achievement-level results in fourth- and eighth-grade NAEP reading: 1992, 2011, and 2013
* Significantly different (p < .05) from 2013.
NOTE: Accommodations were not permitted in NAEP reading assessments prior to 1998. Detail may not sum to totals because of rounding.
SOURCE: U.S. Department of Education, Institute of Education Sciences, National Center for Education Statistics, National Assessment of Educational Progress (NAEP), 1992, 2011, and 2013 Reading Assessments.
THE NATION’S REPORT CARD > 2013 MATHEMATICS AND READING
See what questions students performing at the Proficient level were able to answer.NAEP item maps are helpful for gaining a better understanding of what students performing at different achievement levels are able to do. Learn more about item maps and try sample questions at http://nationsreportcard.gov/reading_math_2013/#/what-knowledge.
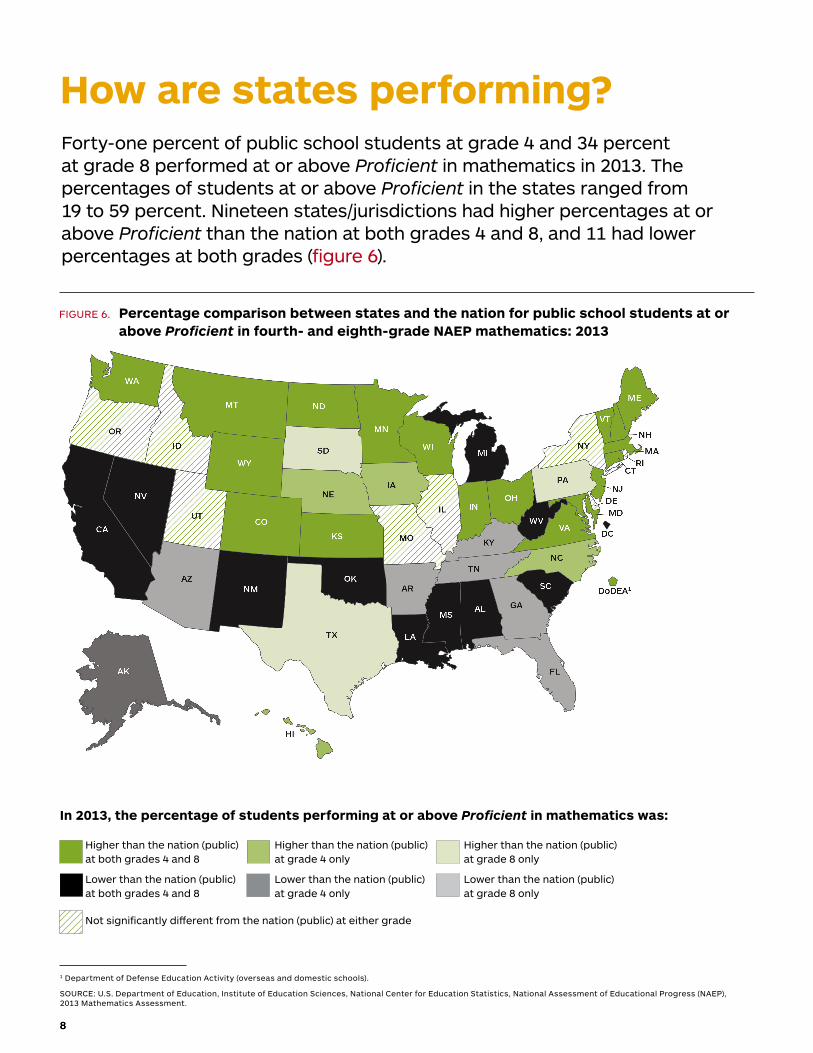
How are states performing?Forty-one percent of public school students at grade 4 and 34 percent at grade 8 performed at or above Proficient in mathematics in 2013. The percentages of students at or above Proficient in the states ranged from 19 to 59 percent. Nineteen states/jurisdictions had higher percentages at or above Proficient than the nation at both grades 4 and 8, and 11 had lower percentages at both grades (figure 6).
FIGURE 6. Percentage comparison between states and the nation for public school students at or above Proficient in fourth- and eighth-grade NAEP mathematics: 2013
In 2013, the percentage of students performing at or above Proficient in mathematics was:
Higher than the nation (public) at both grades 4 and 8
Lower than the nation (public) at both grades 4 and 8
Not significantly different from the nation (public) at either grade
Higher than the nation (public) at grade 4 only
Lower than the nation (public) at grade 4 only
Higher than the nation (public) at grade 8 only
Lower than the nation (public) at grade 8 only
1 Department of Defense Education Activity (overseas and domestic schools).
SOURCE: U.S. Department of Education, Institute of Education Sciences, National Center for Education Statistics, National Assessment of Educational Progress (NAEP), 2013 Mathematics Assessment.
88
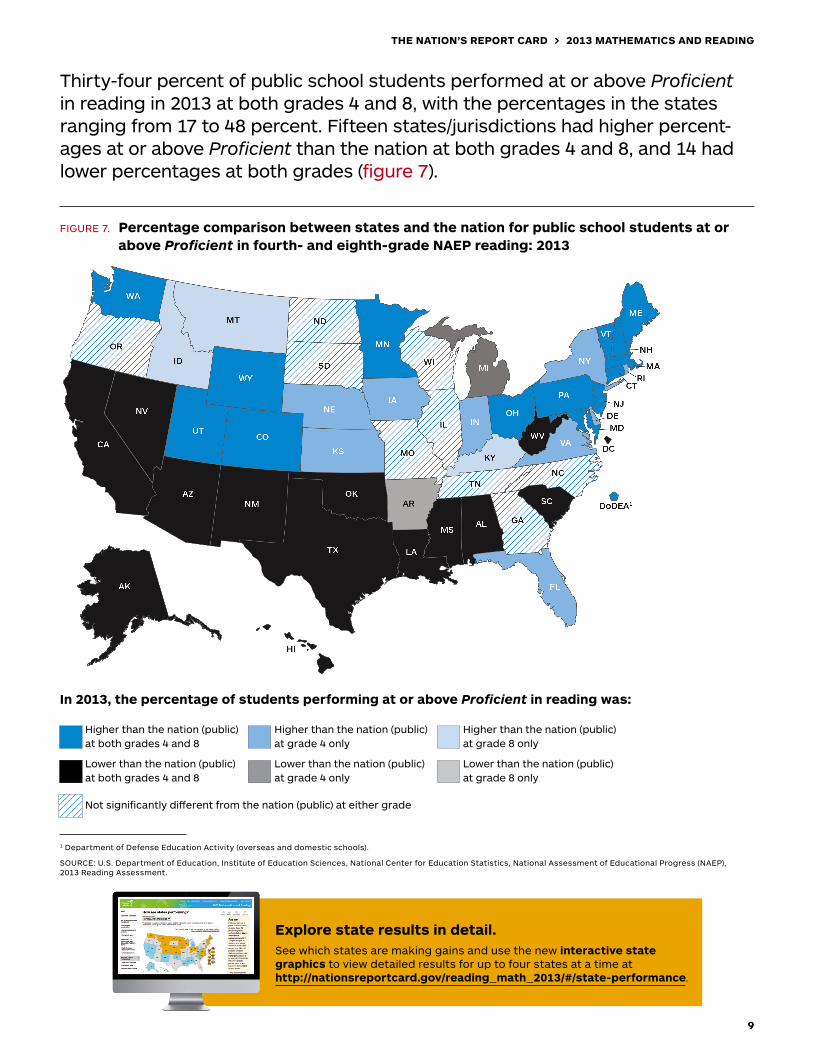
Thirty-four percent of public school students performed at or above Proficient in reading in 2013 at both grades 4 and 8, with the percentages in the states ranging from 17 to 48 percent. Fifteen states/jurisdictions had higher percent- ages at or above Proficient than the nation at both grades 4 and 8, and 14 had lower percentages at both grades (figure 7).
FIGURE 7. Percentage comparison between states and the nation for public school students at or above Proficient in fourth- and eighth-grade NAEP reading: 2013
In 2013, the percentage of students performing at or above Proficient in reading was:
Higher than the nation (public) at both grades 4 and 8
Lower than the nation (public) at both grades 4 and 8
Not significantly different from the nation (public) at either grade
Higher than the nation (public) at grade 4 only
Lower than the nation (public) at grade 4 only
Higher than the nation (public) at grade 8 only
Lower than the nation (public) at grade 8 only
1 Department of Defense Education Activity (overseas and domestic schools).
SOURCE: U.S. Department of Education, Institute of Education Sciences, National Center for Education Statistics, National Assessment of Educational Progress (NAEP), 2013 Reading Assessment.
Explore state results in detail.See which states are making gains and use the new interactive state graphics to view detailed results for up to four states at a time at http://nationsreportcard.gov/reading_math_2013/#/state-performance.
99
THE NATION’S REPORT CARD > 2013 MATHEMATICS AND READING
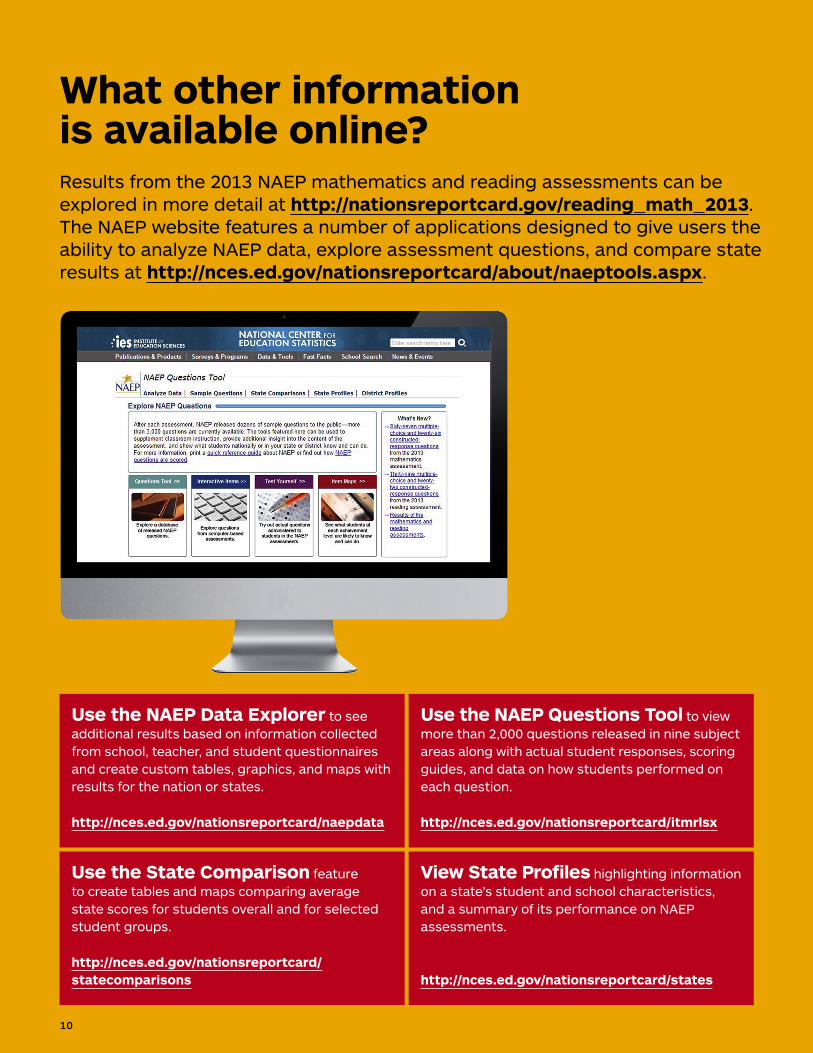
What other information is available online?Results from the 2013 NAEP mathematics and reading assessments can be explored in more detail at http://nationsreportcard.gov/reading_math_2013.The NAEP website features a number of applications designed to give users the ability to analyze NAEP data, explore assessment questions, and compare state results at http://nces.ed.gov/nationsreportcard/about/naeptools.aspx.
Use the NAEP Data Explorer to see additional results based on information collected from school, teacher, and student questionnaires and create custom tables, graphics, and maps with results for the nation or states.
http://nces.ed.gov/nationsreportcard/naepdata
Use the NAEP Questions Tool to view more than 2,000 questions released in nine subject areas along with actual student responses, scoring guides, and data on how students performed on each question.
http://nces.ed.gov/nationsreportcard/itmrlsx
Use the State Comparison feature to create tables and maps comparing average state scores for students overall and for selected student groups.
http://nces.ed.gov/nationsreportcard/statecomparisons
View State Profiles highlighting information on a state’s student and school characteristics, and a summary of its performance on NAEP assessments.
http://nces.ed.gov/nationsreportcard/states
10
The Nation’s Report Card
A First Look: 2013 Mathematics and ReadingNovember 2013
SUGGESTED CITATION
National Center for Education Statistics (2013).
The Nation’s Report Card: A First Look: 2013 Mathematics and Reading (NCES 2014-451). Institute of Education Sciences, U.S. Department of Education, Washington, D.C.
CONTENT CONTACT
Angela Glymph • 202-219-7127 [email protected]
Samantha Burg • 202-502-7335 [email protected]
This report was prepared for the National Center for Education Statistics under Contract No. ED-IES-13-C-0017 with Educational Testing Service. Mention of trade names, commercial products, or organizations does not imply endorsement by the U.S. Government.
MORE INFORMATION
The report release site is http://nationsreportcard.gov. The NCES Publications and Products address is http://nces.ed.gov/pubsearch.
For ordering information, write to ED Pubs U.S. Department of Education P.O. Box 22207 Alexandria, VA 22304
or call toll free 1-877-4-ED-Pubs
or order online at http://www.edpubs.gov.
U.S. Department of Education
The National Assessment of Educational Progress (NAEP) is a congressionally authorized project sponsored by the U.S. Department of Education. The National Center for Education Statistics, within the Institute of Education Sciences, administers NAEP. The Commissioner of Education Statistics is responsible by law for carrying out the NAEP project.
Arne DuncanSecretaryU.S. Department of Education
John Q. EastonDirectorInstitute of Education Sciences
Jack BuckleyCommissionerNational Center for Education Statistics
Peggy G. CarrAssociate Commissioner for Assessment National Center for Education Statistics
The National Assessment Governing BoardIn 1988, Congress created the National Assessment Governing Board to set policy for the National Assessment of Educational Progress, commonly known as The Nation's Report CardTM. The Governing Board is an independent, bipartisan group whose members include governors, state legislators, local and state school officials, educators, business representatives, and members of the general public.
Honorable David P. Driscoll, ChairFormer Commissioner of EducationMelrose, Massachusetts
Susan Pimentel, Vice ChairEducational ConsultantHanover, New Hampshire
Andrés AlonsoProfessor of PracticeHarvard Graduate School of EducationHarvard UniversityCambridge, Massachusetts
Lucille E. DavyPresident and CEOTransformative Education Solutions, LLC
Pennington, New Jersey
Louis M. FabrizioData, Research and Federal Policy Director
North Carolina Department of Public Instruction
Raleigh, North Carolina
Honorable Anitere FloresSenatorFlorida State SenateMiami, Florida
Rebecca GagnonSchool Board MemberMinneapolis Public SchoolsMinneapolis, Minnesota
Shannon GarrisonFourth-Grade TeacherSolano Avenue Elementary SchoolLos Angeles, California
Doris R. HicksPrincipal and Chief Executive Officer
Dr. Martin Luther King, Jr. Charter School for Science and Technology
New Orleans, Louisiana
Andrew Dean HoAssistant ProfessorHarvard Graduate School of Education
Harvard UniversityCambridge, Massachusetts
Honorable Terry HollidayCommissioner of EducationKentucky Department of EducationLexington, Kentucky
Richard Brent HoustonAssistant SuperintendentShawnee Public SchoolsShawnee, Oklahoma
Hector IbarraEighth-Grade TeacherBelin-Blank International Center and Talent Development
Iowa City, Iowa
Honorable Tom LunaIdaho Superintendent of Public Instruction
Boise, Idaho
Terry MazanyPresident and CEOThe Chicago Community TrustChicago, Illinois
Tonya MilesGeneral Public RepresentativeMitchellville, Maryland
Dale NowlinTwelfth-Grade TeacherColumbus North High SchoolColumbus, Indiana
Joseph M. O’Keefe, S.J.ProfessorLynch School of EducationBoston CollegeChestnut Hill, Massachusetts
W. James PophamProfessor Emeritus University of California, Los AngelesWilsonville, Oregon
B. Fielding RolstonChairmanTennessee State Board of EducationKingsport, Tennessee
Cary SneiderAssociate Research ProfessorPortland State UniversityPortland, Oregon
Honorable Leticia Van de PutteSenatorTexas State SenateSan Antonio, Texas
John Q. Easton (Ex officio)Director Institute of Education SciencesU.S. Department of EducationWashington, D.C.
Cornelia S. OrrExecutive Director National Assessment Governing BoardWashington, D.C.
11

“The Department of Education’s mission is to promote student achievement and preparation for global competitiveness by fostering educational excellence and ensuring equal access.”
www.ed.gov