the national wilderness preservation system: character and values ken cordell, forest service...
TRANSCRIPT

The National Wilderness
Preservation System:Character and Values
www.srs.fs.fed.us/trendswww.srs.fs.fed.us/trends
Ken Cordell, Forest Service Research, and Ken Cordell, Forest Service Research, and Ralph Swain, Forest Service Wilderness ManagementRalph Swain, Forest Service Wilderness Management

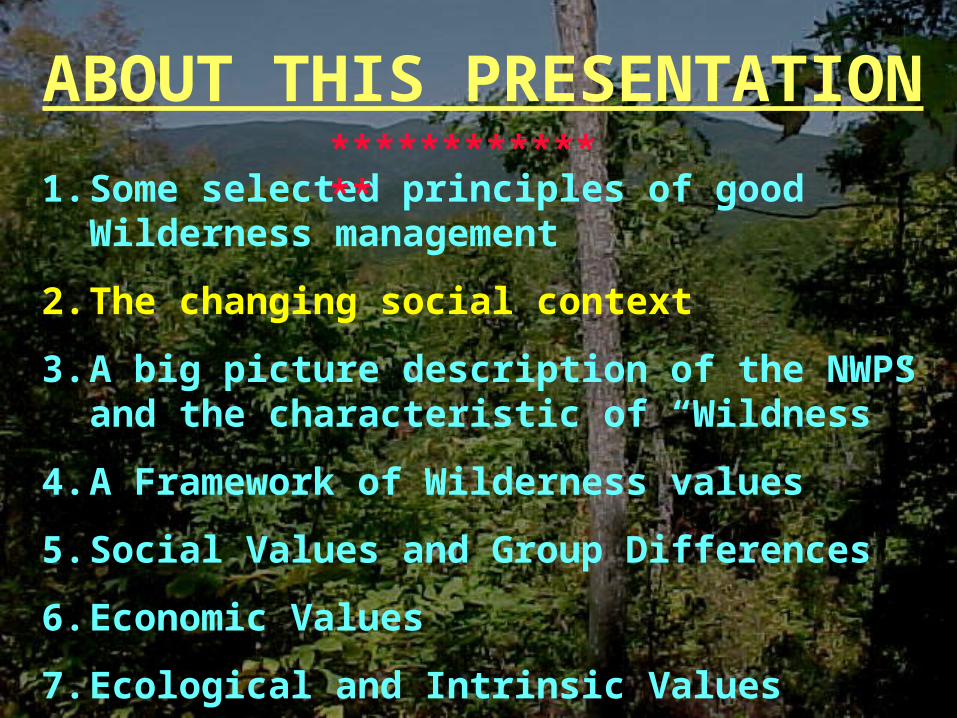
ABOUT THIS PRESENTATION
1. Some selected principles of good Wilderness management
2. The changing social context
3. A big picture description of the NWPS and the characteristic of “Wildness”
4. A Framework of Wilderness values
5. Social Values and Group Differences
6. Economic Values
7. Ecological and Intrinsic Values
**************

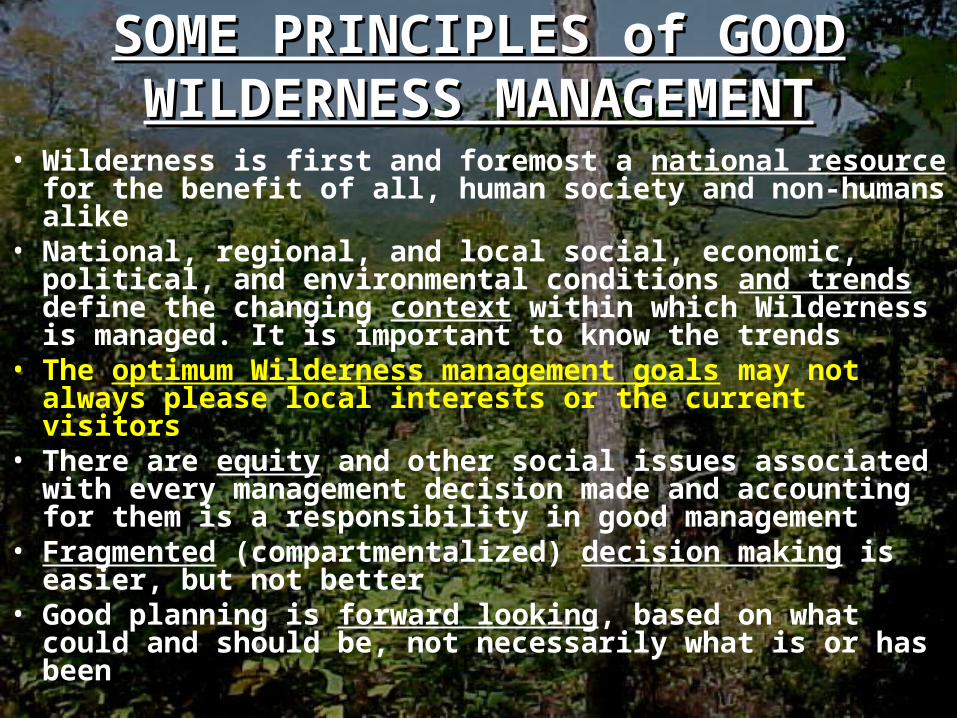
SOME PRINCIPLES of GOOD SOME PRINCIPLES of GOOD WILDERNESS MANAGEMENTWILDERNESS MANAGEMENT
• Wilderness is first and foremost a national resource for the benefit of all, human society and non-humans alike
• National, regional, and local social, economic, political, and environmental conditions and trends define the changing context within which Wilderness is managed. It is important to know the trends
• The optimum Wilderness management goals may not always please local interests or the current visitors
• There are equity and other social issues associated with every management decision made and accounting for them is a responsibility in good management
• Fragmented (compartmentalized) decision making is easier, but not better
• Good planning is forward looking, based on what could and should be, not necessarily what is or has been
ABOUT THIS PRESENTATION
1. Some selected principles of good Wilderness management
2. The changing social context
3. A big picture description of the NWPS and the characteristic of “Wildness”
4. A Framework of Wilderness values
5. Social Values and Group Differences
6. Economic Values
7. Ecological and Intrinsic Values
**************

This published book examined the population, demographic, urban, rural, economic, leisure and recreation trends of the United States. An update is underway.
***********
*******
DEMOGRAPHIC DATA
DEMOGRAPHIC DATA
SOURCESOURCE

Dominant Socioeconomic Forces Shaping the Future of the United States: An Update of
Footprints
ByH. Ken Cordell1, John C. Bergstrom2, Carter J. Betz1, and Gary T. Green2
Introduction
This chapter is devoted to providing up-to-date summaries of a number of highly important social and economic trends that will play a role in the future of the United States and its natural resources. The trend topics covered include population growth, changing composition of the population, urban growth and sprawl, transition of rural lands, economic growth, consumer spending, and recreation demands. This chapter is essentially an abbreviated update of the book Footprints on the Land (Cordell & Overdevest, 2001). It is undertaken ……..
1Project Leader and Outdoor Recreation Planner respectively, USDA Forest Service, Southern Research Station, Athens, GA.2Respectively, Professor, Agriculture & Applied Economics, and Assistant Research Scientist, Warnell School of Forest Resources, University of Georgia, Athens, GA.
Update Coming in June in a book to
be published through the ISSRM


Including Undocumented (Est.)

0
20
40
60
80
100
Year of Birth
Yea
rs
Male Female
Life ExpectancyLife Expectancy

Historical and Projected Population in the U.S.Historical and Projected Population in the U.S.
0
100
200
300
400
500
600
1650 1700 1750 1800 1850 1900 1950 2000 2050 2100
Year
Per
son
s in
Mill
ion
s

0
50000
100000
150000
200000
250000
Year
Th
ou
sa
nd
s White (non-Hispanic)
African American
Hispanic (AnyRace)
American Indian,Eskimo, &Aleutian
Asian & PacificIslander
Historic and Projected Population by Historic and Projected Population by EthnicityEthnicity


LONG TERM TRENDS SINCE 1960
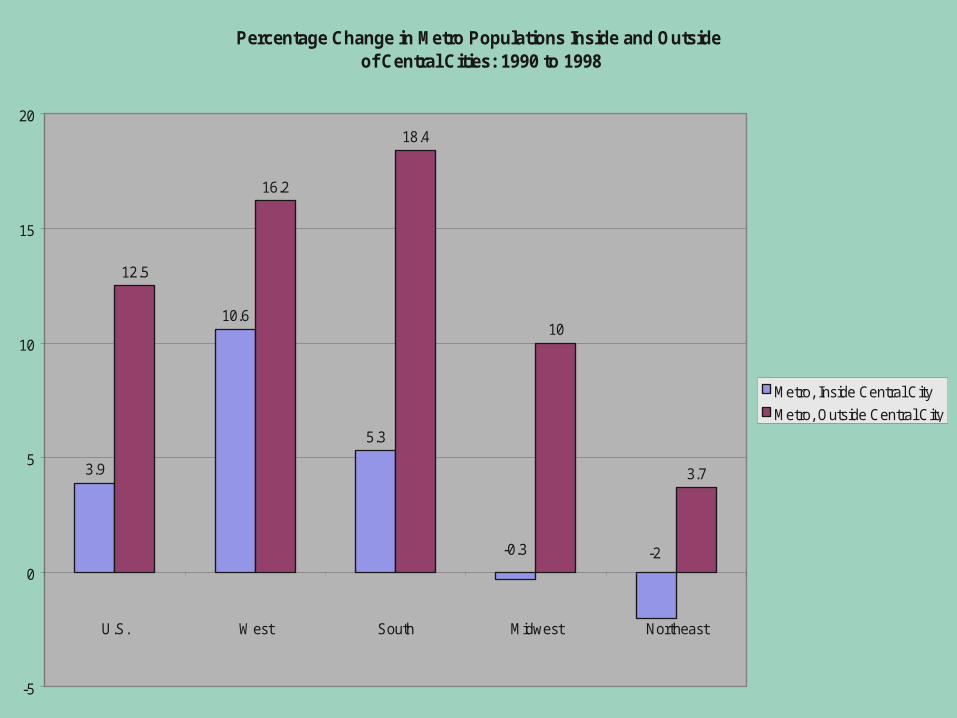
Percentage Change in Metro Populations Inside and Outside of Central Cities: 1990 to 1998
3.9
10.6
5.3
12.5
16.2
18.4
10
3.7
-2-0.3
-5
0
5
10
15
20
U.S. West South Midwest Northeast
Metro, Inside Central City
Metro, Outside Central City


Population Density, 20250-5051-150151-400401-10001001+
National ForestsStates
Spatial Relationship of NFs to Spatial Relationship of NFs to Heavily Populated Counties 2025Heavily Populated Counties 2025

ABOUT THIS PRESENTATION
1. Some selected principles of good Wilderness management
2. The changing social context
3. A big picture description of the NWPS and the characteristic of “Wildness”
4. A Framework of Wilderness values
5. Social Values and Group Differences
6. Economic Values
7. Ecological and Intrinsic Values
**************


Number of Wilderness areas designated in the East, West, and Alaska between 1964 and 2002

State Areas Acres Percentage of National Total Acres
Alaska 48 58,182,216 58.70
California 130 13,975,535 14.10
Arizona 90 4,518,442 4.56
Washington 30 4,324,182 4.36
Idaho 7 4,015,061 4.05
Montana 15 3,442,416 3.47
Colorado 40 3,171,685 3.20
Wyoming 15 3,111,132 3.14
Oregon 40 2,258,238 2.28
Nevada 42 2,123,343 2.14
National Total 457 99,122,250 100.00
Number of Wilderness areas and acres in the 10 states having the most Wilderness

DistanceSum of
PopulationPercent of Population
25 miles 47,495,997 16.8
50 miles 114,497,257 40.6
100 miles 195,745,452 69.4
200 miles 262,151,985 93.0
400 miles 281,918,792 100.0
Number of people living within 25, 50, 100, 200, and 400 miles of Wilderness

Proportion of Roads0 - 1.8151.815 - 4.8444.844 - 9.2969.296 - 19.55219.552 - 51.965
Wilderness Areas
Density of roads relative to Wilderness

Percentage of total Wilderness area at elevations above 5,000 feet by census division and nationally

Precipitation Areas AcresPercent of Total
0-15 in. 146 12,920,179 27.55
16-30 in. 138 9,517,039 20.29
31-40 in. 101 8,777,388 18.72
41-60 in. 185 9,817,244 20.93
61-90 in. 63 3,533,052 7.53
100+ in. 20 2,331,883 4.97
National


The proportion of Wilderness areas in each of 7 land cover classes by census division

Location of designated wilderness areas relative to type of ecosystem at Bailey’s Domain and Division level for each Census Region

B a i l e y ' s E c o s y s t e m D i v i s i o n sM a r i n e R e g i m e M o u n t a i n sS u b a r c t i c D i v i s i o nS u b a r c t i c R e g i m e M o u n t a i n sT u n d r a D i v i s i o nT u n d r a R e g i m e M o u n t a i n s
B a i l e y ' s E c o r e g i o n D o m a i n sH U M I D T E M P E R A T E D O M A I NP O L A R D O M A I N
W i l d e r n e s s A r e a s
F i g u r e 1 . W i l d e r n e s s A r e a s i n A l a s k a i n R e l a t i o n t o B a i l e y ’ s E c o r e g i o n s a t D o m a i n a n d D i v i s i o n l e v e l . S o u r c e :h t t p : / / w w w . f s . f e d . u s / i n s t i t u t e / f t p / m a p s / n a r e g n s s h p z i p

Naturalness
Fre
edom
Artificial Primitive
Con
trol
led
“Sel
f-w
illed
”
Built
Ex-urban non-wildland
Semi-wildland
Non-wilderness wildland
Wilderness
The Wildland Continuum

Fig. 2. Distribution of Wildness by Land Classification - Contiguous U.S.
0
20,000,000
40,000,000
60,000,000
80,000,000
100,000,000
120,000,000
6 9 12 15 18 21 24 27 30
Wildness Index
Are
a (a
cres
)
Non-federal
Fed Non-wilderness
Fed Wilderness

Aplet, et al Wildness Index, 2004
Wild Built

ABOUT THIS PRESENTATION
1. Some selected principles of good Wilderness management
2. The changing social context
3. A big picture description of the NWPS and the characteristic of “Wildness”
4. A Framework of Wilderness values
5. Social Values and Group Differences
6. Economic Values
7. Ecological and Intrinsic Values
**************

Basic Functional Connections
Measurement Accounts or Categories Specific Types of Measures or Indicators
Wilderness Values
Social PsychologicalSociologicalAnthropological
Economic Active Use ValuePassive Use ValueEconomic Impacts
Ecologic Human Life Support ValueAnimal and Plant Life Support Value
Ethical Instrumental ValueIntrinsic Value
Wilderness Services
Animal and Plant Habitat; Carbon Sequestration; Subsistence Living; Cultural Preservation; Historic Preservation; Scientific Discovery; Educational Development; Personal Physical Health and Growth; Personal Emotional Health and Growth; Personal Spiritual Health and Growth; Community Health and Quality of Life
Wilderness Functions
Preservation of Natural and Wild Places; Recreational and Experiential Setting; Ecosystem and Biodiversity Preserve
Wilderness Attributes
Geographic; Geologic; Hydrologic; Atmospheric; Biologic; Naturalness; Wildness; Constructed
An Organizing Framework for Wilderness Values

Basic Functional Connection
Measurement Accounts or Categories
Examples of Measures or Indicators
Wilderness Values
Social Developmental/Health ValueSocial Identify ValueSpiritual Value
Economic Active Use ValuePassive Use ValueEconomic Impacts
Ecologic Human Life Support ValueAnimal and Plant Life Support Value
Ethical Instrumental ValueIntrinsic Value

ABOUT THIS PRESENTATION
1. Some selected principles of good Wilderness management
2. The changing social context
3. A big picture description of the NWPS and the characteristic of “Wildness”
4. A Framework of Wilderness values
5. Social Values and Group Differences
6. Economic Values
7. Ecological and Intrinsic Values
**************

Humans Were Meant to Rule Over Nature
14%
Strongly Agree
15%
Somewhat Agree
19%
Somewhat Disagree
42%
Strongly Disagree
29%
61%(6% Neutral)

Source: Dujack, 1997.
Percentage of AmericansReporting Regulation of Natural Resources is “Just the Right Amount” or has “Not Gone Far Enough.”

•Nationally about 1/2 of American’s 16+ report knowing about the NWPS•Only 4.4% feel we have put too many acres into the NWPS:
- Not enough 52.6%- About right 26.9%- Too much 4.4%- Not sure 15.4%
Public Views on Wilderness

Percent of Respondents
Too little/Not enough 61
About right 24
Too much 8
Not sure/Don’t know 7
American residents’ attitude toward the amount of Wilderness land in the USDA
National Forest system

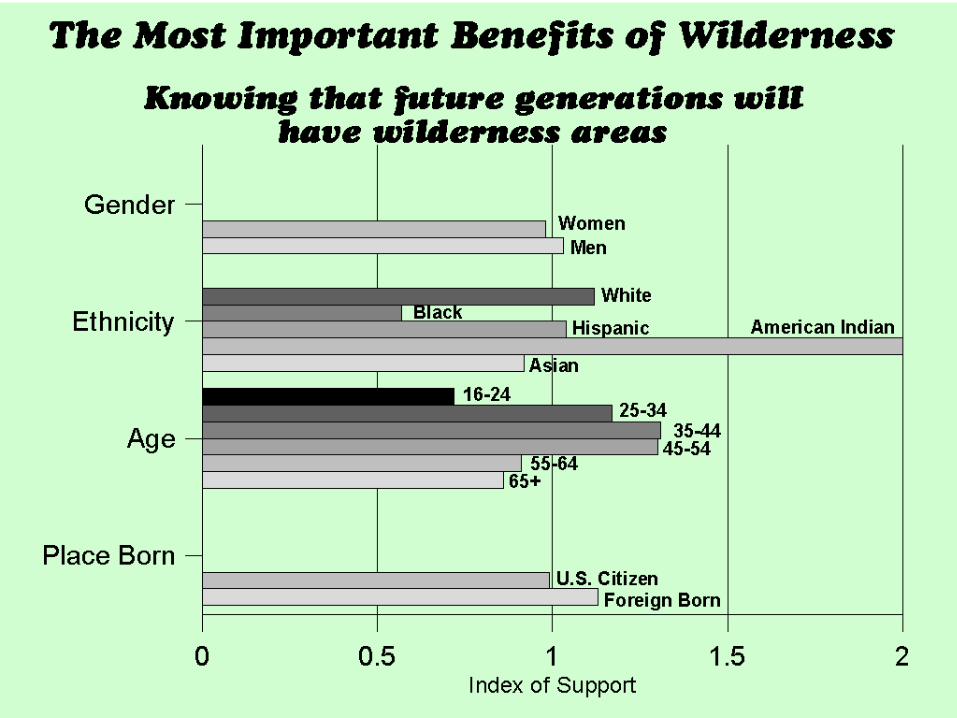
What Americans in 2002 Value about Wilderness
Percentage Saying It Is
Slightly or Not
Important
Extremely ImportantWilderness Value
Protecting air quality 58.41.5
Protecting water quality 55.91.5
Protecting wildlife habitat 52.7 3.1Protecting endangered species 49.8
5.0Legacy for future generations 49.1
3.1Preserving unique ecosystems and genetics 44.3
5.1Future option to visit 37.5 7.1Just knowing it is preserved 36.9 6.4Providing scenic beauty 35.4
5.5Providing recreation opportunities 27.8 7.2Providing spiritual inspiration 25.9 16.7Undisturbed area for scientific study 23.9 11.6Providing income for tourism industry 9.7 33.5

Very or extremely Important (%)Wilderness value 1994 2002 ChangeProtecting water quality 78.9 93.1 14.2Protection of wildlife habitat 78.6 87.8 9.2Protecting air quality 78.0 92.3 14.3For future generations 76.9 87.0 10.1Protection for endangered spp 73.7 82.7 9.0Preserving ecosystems 66.5 80.0 13.5Scenic beauty 59.7 74.0 14.3Future option to visit 59.4 75.1 15.7Just knowing it exists 56.1 74.6 18.5For scientific study 46.3 57.5 11.2Recreation opportunities 48.9 64.9 16.0Providing spiritual inspiration 43.2 56.5 13.3Income for tourism industry 22.8 29.7 6.9
Trends in Public Values of Wilderness
In International Journal of Wilderness Research last year

Summation
There are three underlying dimensions of Wilderness values that the above public surveying has revealed. In order, by percentage of Americans saying they are extremely important, they are:
1. Ecological services, especially clean air and water for humans and other species, on and off site
2. Ecosystem protection, including wildlife habitat, endangered species and rare and unique species
3. Amenities for human appreciation and use, including wildlands for future generations, current and future options for recreation, scenery, spiritual inspiration, scientific study, and a draw for tourism

ABOUT THIS PRESENTATION
1. Some selected principles of good Wilderness management
2. The changing social context
3. A big picture description of the NWPS and the characteristic of “Wildness”
4. A Framework of Wilderness values
5. Social Values and Group Differences
6. Economic Values
7. Ecological and Intrinsic Values
**************


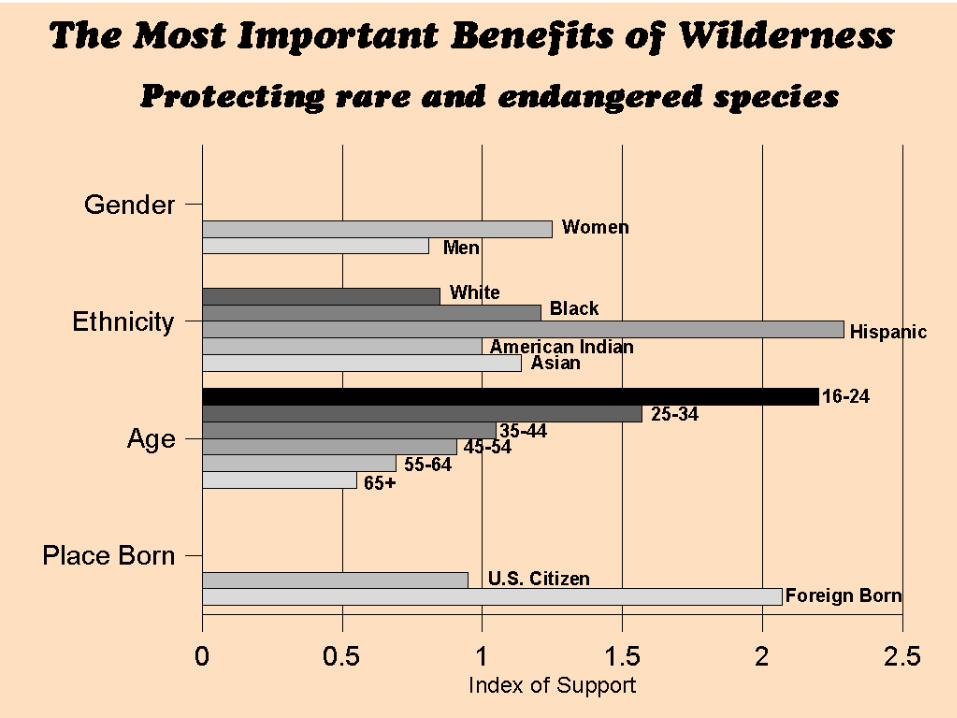


How would be align messaging to better connect with immigrants?
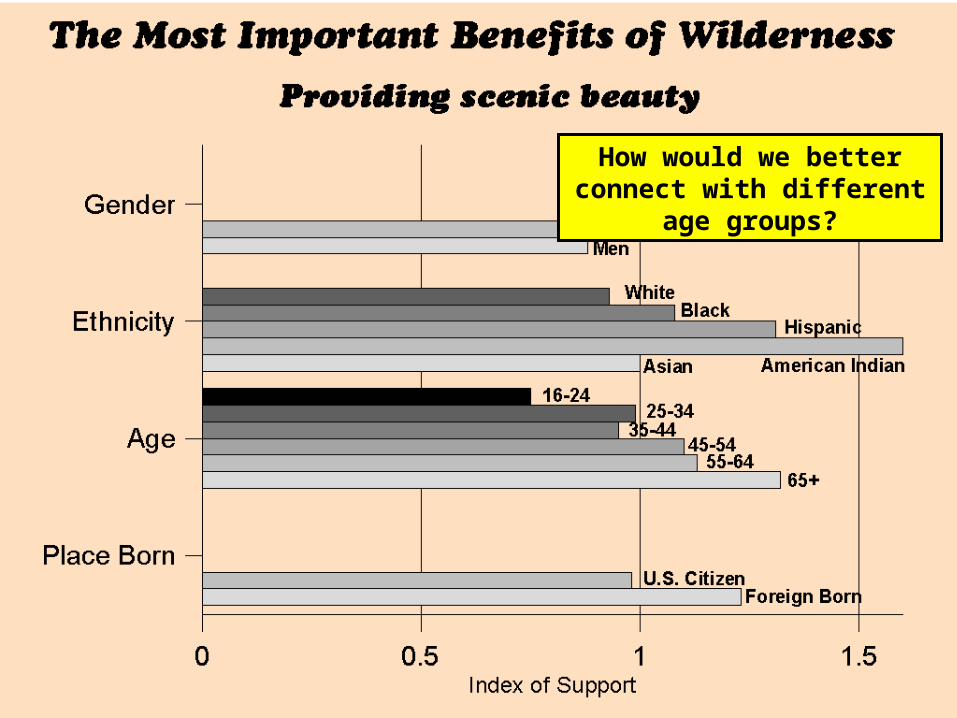
How would we better connect with different age groups?


Public Views on Wilderness
• Nationally about 1/2 of American’s 16+ report knowing about the NWPS
• Only 4.4% feel we have put too many acres into the NWPS:
- Not enough, 52.6%
- About right, 26.9%
- Too much, 4.4%
- Not sure, 15.4%

Percent of Respondents
Favor Total 69.8
Strongly Favor 42.5
Somewhat Favor 27.3
Oppose Total 12.4
Somewhat Oppose 6.4
Strongly Oppose 6.0
Neither 12.2
Don’t Know 5.6
Percentages of surveyed American population indicating support or opposition for designating
additional wilderness in their own state

Should we Should we designate more designate more
Wilderness within Wilderness within Federal lands?Federal lands?
Important/Important/Very Very
ImportantImportant
UrbanUrban 62%62%
SuburbanSuburban 56%56%
RuralRural 47%47%

Should we Should we designate more designate more
Wilderness within Wilderness within Federal lands?Federal lands?
Important/Important/Very Very
ImportantImportant
WhiteWhite 59%59%
BlackBlack 49%49%
HispanicHispanic 56%56%
AsianAsian 75%75%

Should we Should we designate more designate more
Wilderness within Wilderness within Federal lands?Federal lands?
Important/Important/Very Very
ImportantImportant
NorthNorth 66%66%
SouthSouth 55%55%
Great PlainsGreat Plains 50%50%
RockiesRockies 59%59%
Pacific CoastPacific Coast 59%59%

Recreation is another significant social benefit
Total NWPS Site Visits 12,825,610
FS site visits 10,517,000
NPS site visits 1,923,841
FWS site visits 333,466
BLM site visits 51,302
Total single-day site visits 8,458,490
Total multi-day site visits 4,367,120
Total FS, FWS, & BLM site visits 10,901,768
FS, FWS, & BLM single-day site visits (73%) 7,958,291
FS, FWS & BLM multi-day site visits (27%) 2,943,477
Total NPS site visits 1,923,841
NPS single-day use (26%) 500,199
NPS multi-day use (74%) 1,423,643
Total visitation by agency, visitation by single-day and multi-day use and by region

Benefit Grand Mean
Enjoy nature 1.5
Physical fitness 2.0
Reduce tensions 2.2
Escape 2.2
Outdoor learning 2.3
Sharing values 2.8
Independence 3.0
Family kinship 3.0
Spiritual 3.1
Considerate people 3.3
Achievement/stimulation 3.4
Physical rest 3.5
Teach/lead others 3.8
Risk taking 4.6
Risk reduction 4.7
Meet new people 5.1
Mean scores of responses to 16 wilderness recreation experience preference domains from eight designated wilderness areas

Population-wide Total (Overlapping) Occasions Per Year by Groupings of
Activities (2000-01)All activities 98.5% 273.8
Viewing, learning, gathering activities
88.4% 136.1
Developed site activities 94.9% 93.3
Activities on trails 40.4% 40.3
Swimming, surfing, and other beach activities
2.8% 36.6
Motorized activities 62.0% 31.3
Hunting and fishing 38.1% 26.9
Snow activities 19.3% 13.3
Risk activities 35.2% 12.0
Non-motorized activities 22.8% 7.9
PERCENT OF POPULATION PARTICIPATING AND PER-CAPITA OCCASSIONS

Venture Publishing

Public Lands and NWPS Lands Overlaid onto Projected Recreation Demand Hotspots, 2020
2020 Ambient Public Land x Recreation InteractionsNegligibleLightModerateModerately heavyHeavy
All Other Federal LandsNational Park ServiceWildlife RefugesBureau of Land ManagementNational ForestsNational Forest WildernessNational Park Service WildernessBureau of Land Management WildernessFish & Wildlife Service WildernessStates

Wilderness Visits to National Forests 2001
Source: NVUM
(Thousands)

Under 3
3 to 6
6 to 12
12 to 24
Over 24
Distribution byLength of Stay (in hours)
Wilderness
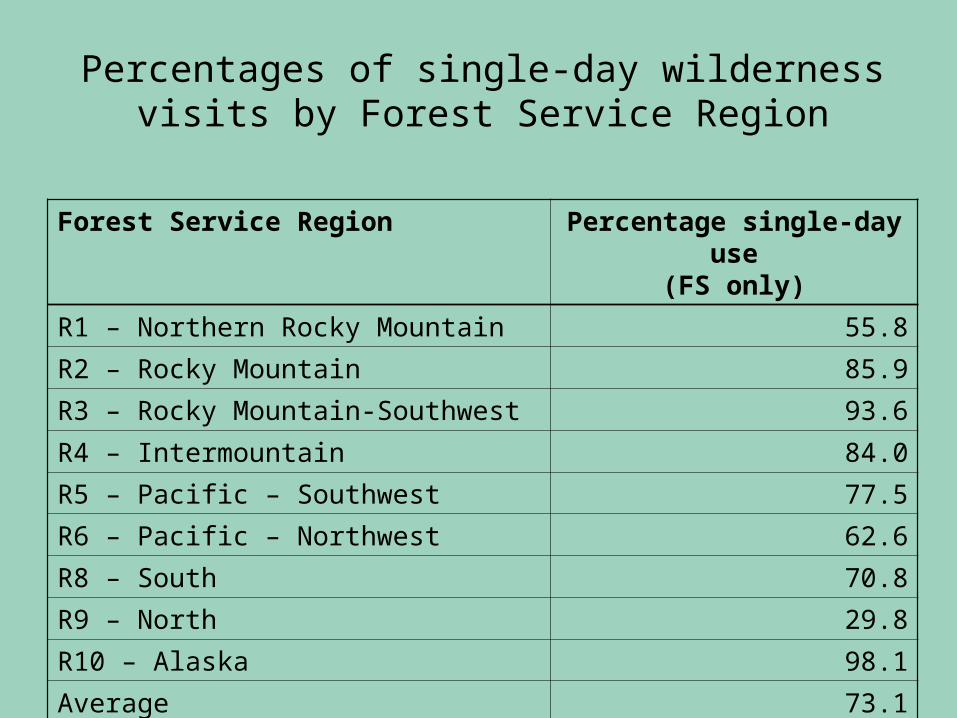
Forest Service Region Percentage single-day use(FS only)
R1 – Northern Rocky Mountain 55.8
R2 – Rocky Mountain 85.9
R3 – Rocky Mountain-Southwest 93.6
R4 – Intermountain 84.0
R5 – Pacific – Southwest 77.5
R6 – Pacific – Northwest 62.6
R8 – South 70.8
R9 – North 29.8
R10 – Alaska 98.1
Average 73.1
Percentages of single-day wilderness visits by Forest Service Region

Duration of Wilderness VisitsDuration of Wilderness Visits
Site Type Site visit (hours)
Developed Day Use 1.9
Developed Overnite 25.9
General Forest Area 26.5
Wilderness 19.7

Age Distribution (%)
Category All NF Visits Wilderness Site Visits
20 and Under 17.6 21.621 to 30 13.3 20.431 to 40 22.1 33.441 to 50 15.0 15.151 to 60 12.8 6.161 to 70 12.8 2.6Over 70 6.6 0.7

Race/ethnicity Distribution (%)
Category All NF Visits Wilderness Site Visits
White 97.4 97.3Spanish, Hispanic or Latino 0.4 0Black/African American 0.8 1.5Asian 0.3 1.2Am. Indian/ Alaska Native 0.1 0Native Hawaiian or Pacific Islander 0.8 0Other 0.2 0

Perception of crowding
Overnight Sites Day Use Sites Wilderness General Forest
10 Over crowded 0.0 0.0 0.0 2.9
9 6.3 0.0 0.0 0.0
8 16.9 1.1 14.4 1.1
7 3.2 4.8 0.0 4.7
6 13.7 2.0 1.3 10.1
5 27.9 15.1 53.4 19.2
4 13.7 7.7 5.0 15.1
3 13.3 27.2 14.3 13.8
2 0.0 25.9 11.6 18.4
1 Hardly anyone there
5.1 16.2 0.0 14.6
Perceptions of Crowding

ABOUT THIS PRESENTATION
1. Some selected principles of good Wilderness management
2. The changing social context
3. A big picture description of the NWPS and the characteristic of “Wildness”
4. A Framework of Wilderness values
5. Social Values and Group Differences
6. Economic Values
7. Ecological and Intrinsic Values
**************

T O T A L EC O N O M IC B E N E FIT S O F W IL D E R N E SS
D IR ECT U SE(O N -SIT E )BEN EFIT S
C O M M U N IT YBEN EFIT S
SC IEN T IFICBEN EFIT S
O F F- SIT EBEN EFIT S
BIO D IV E RSIT YC O N SER V A T IO N
EC O L O G IC A LSER V IC ES
PA SSIV E U S EBEN EFIT S
O n - site r ecreat ionH u m an d ev elop m en tC u ltu ra l-h er itage
Su bsisten ce u seN on - recrea tion jo bsR et irem en t in com eN on - labo r in com eR ecr ea tion jo bs
R esearchEd u cat io nM an agem ent
O ff - site hu n t in gScen ic v iew sh ed sH igh er p ro p erty v a lu esIn creased tax rev en u e
O ff - site co nsu m p t ion o f in for m at io n in boo ksand m ag az in es , an dscen ic beau ty in p h oto sand v id eos
D irect u seG ene ticIn trin sic
W ate rsh ed p ro tectio nN u trien t cy clin gC arb on stor ag eP est con tr o lP o ll in at ion
O ptio nbenefi ts
Beq uestbenefi ts
Existencebenefi ts
Fu tu re d irect,in d irect an d off -s ite benefi ts
H abita t con serv a tionBiod iv er sityEco lo gical se rv icesO n - site r ecreat ionO ff - site hu n t in g
Benefi ts fro mcon serv in gw ild land s forfu tu regen era tion s
Benefi ts fro mcon tin u edex isten ce
Biod iv er sityO n - site r ecreat ionEco lo gical se rv icesA r cheo log ica l r esou rces
H abita t con serv a tionEn d an ger ed sp eciesW ild recr ea tion
D ecreasing “ tan gibil ity ” o f benefi ts to in d iv id u a ls
Decreasing tangibility of benefits

Direct On-Site Use and Passive Use Economic Value
Value Type Use Net Economic Value
Annual Net Economic
Value
On-site recreation value: Single-day use
8.4 million single-day trips per year
$19.50 per trip $165 million
On-site recreation value: Multi-day use
4.4 million multi-day trips per year
$68.47 $299 million
Passive use Value
52.7 million households
$63.31 per household
$3.34 billion
Total Annual NEV
$3.8 billion
Per acre $35.89

Summation
• Passive use net economic value per annum is estimated to be $3.45 billion.
• On-site recreation use value is estimated to be around $464 million per year
• Passive use value is estimated to be over 7 times (7.4 actually) greater than on-site recreation use value.

Does Wilderness Designation Harm Rural Economies?• There are no discernible general patterns of negative impacts from
Wilderness existing in rural counties
• Economic growth is greater for non-metropolitan counties that contain or are near publicly-owned natural areas, including Wilderness
• Wilderness contributes to the quality of life of local residents and it is actively sought in migration decisions
• The role of Wilderness in local economic development is similar to the old BASF commercial: “We don’t build it, we just make it better”
• Economic growth is increasingly being generated by multiplier effects from consumer spending in the services and trades sectors
• But, the total volume of visitation to Wilderness, and the associated spending by nonlocal visitors is not sufficient to sustain any significant tourism industry by itself
• “Wilderness protection does not impoverish communities by locking up resources. Rather, it protects the economic future of those communities by preserving high quality natural environments that are increasing in demand across the nation.” (Tom Power 1996)
Economic Impacts
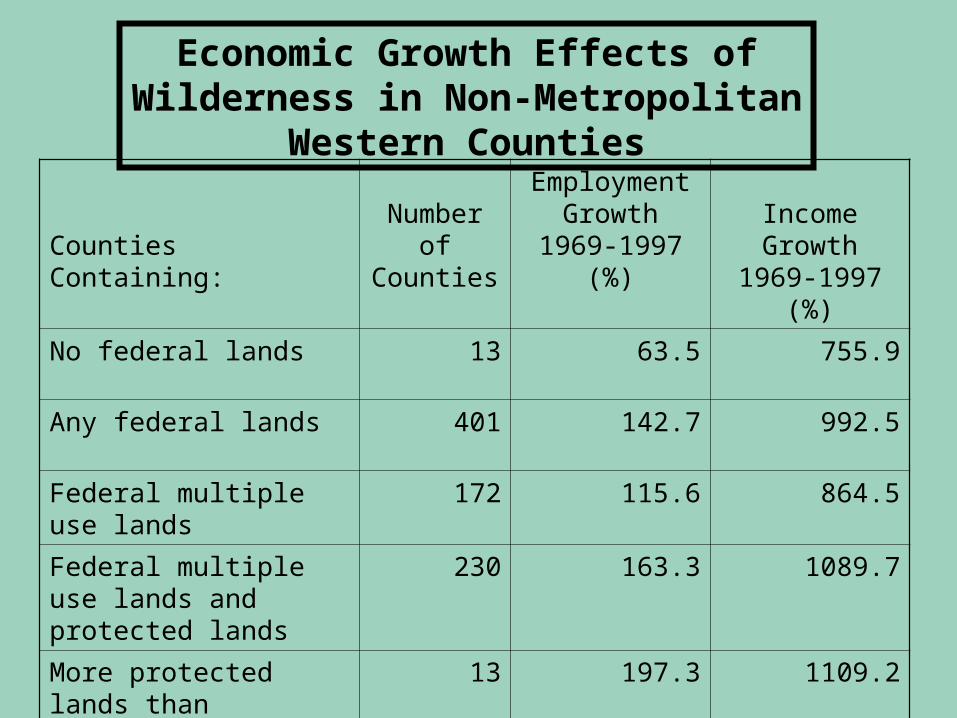
Economic Growth Effects of Wilderness in Non-Metropolitan Western Counties
Counties Containing:Number of Counties
Employment Growth
1969-1997 (%)Income Growth
1969-1997 (%)
No federal lands 13 63.5 755.9
Any federal lands 401 142.7 992.5
Federal multiple use lands
172 115.6 864.5
Federal multiple use lands and protected lands
230 163.3 1089.7
More protected lands than multiple use lands
13 197.3 1109.2
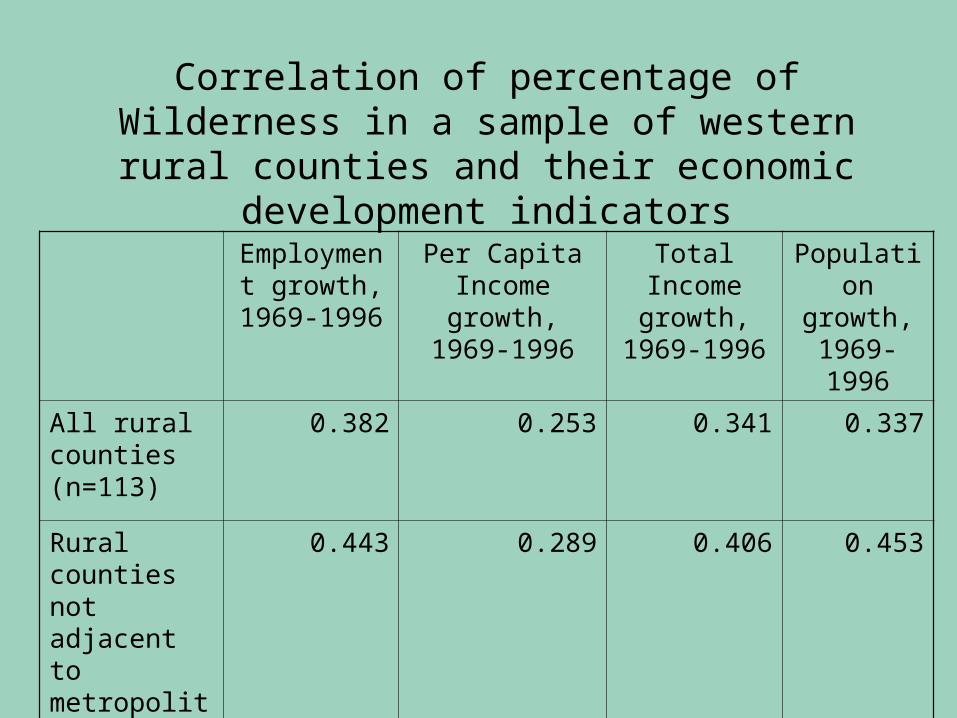
Employment growth,
1969-1996
Per Capita Income growth,
1969-1996
Total Income growth,
1969-1996
Population growth,
1969-1996
All rural counties (n=113)
0.382 0.253 0.341 0.337
Rural counties not adjacent to metropolitan areas (n=83)
0.443 0.289 0.406 0.453
Correlation of percentage of Wilderness in a sample of western rural counties and their
economic development indicators

Statement Agree Disagree No Opinion
Nearby wilderness areas are important to county
81 10 9
Wilderness important reason why move or stay
53 26 22
There should be more access to wilderness
43 36 21
Additional wilderness should be designated nearby
39 35 26
Wilderness areas should be opened for mineral and energy development
22 65 13
Percent agreeing or disagreeing with Wilderness statement, National
Survey

Does Wilderness Designation Harm Rural Economies?• There are no discernible general patterns of negative impacts
from Wilderness existing in rural counties• Economic growth is greater for non-metropolitan counties that contain or
are near publicly-owned natural areas, including Wilderness• Wilderness contributes to the quality of life of local residents that is
actively sought in migration decisions• The role of Wilderness in local economic development is similar to the old
BASF commercial: “We don’t build it, we just make it better”• Economic growth is increasingly being generated by multiplier effects
from consumer spending in the services and trades sectors• But, the total volume of visitation to Wilderness, and the associated
spending by nonlocal visitors is not sufficient to sustain any significant tourism industry by itself
• “Wilderness protection does not impoverish communities by locking up resources. Rather, it protects the economic future of those communities by preserving high quality natural environments that are increasing in demand across the nation.” (Tom Power 1996)
Economic Impacts
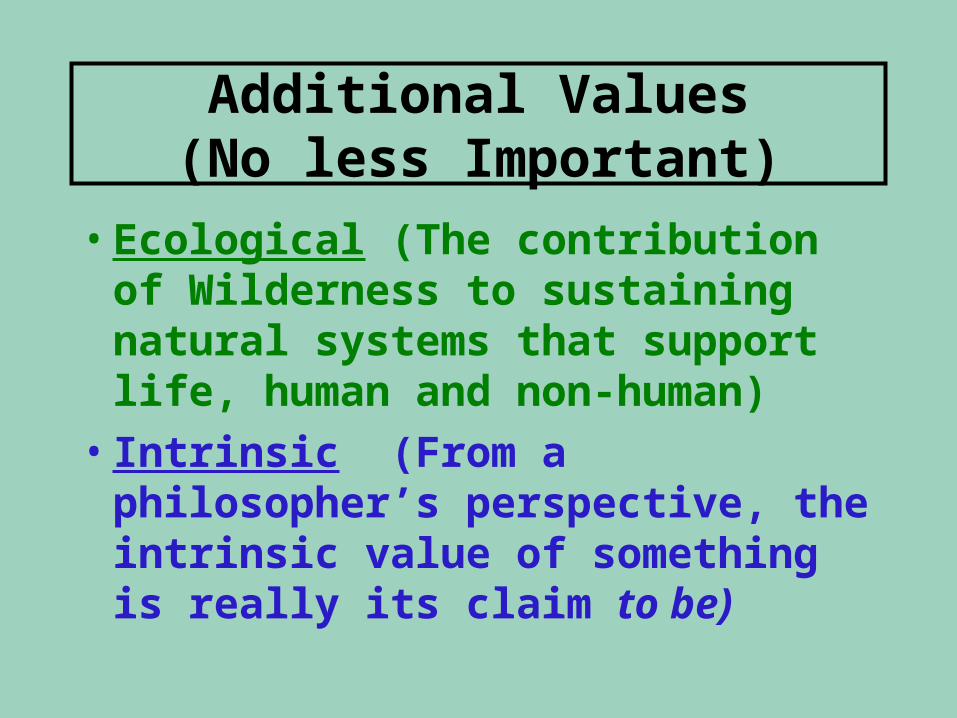
Additional Values(No less Important)
• Ecological (The contribution of Wilderness to sustaining natural systems that support life, human and non-human)
• Intrinsic (From a philosopher’s perspective, the intrinsic value of something is really its claim to be)

Protecting air quality Protecting water quality Protecting wildlife habitat Protecting T&E species Legacy for future generations (By Majority Vote)

SOME PRINCIPLES of GOOD SOME PRINCIPLES of GOOD WILDERNESS MANAGEMENTWILDERNESS MANAGEMENT
• Wilderness is first and foremost a national resource for the benefit of all, human society and non-humans alike
• National, regional, and local social, economic, political, and environmental conditions and trends define the changing context within which Wilderness is managed. It is important to know the trends
• The optimum Wilderness management goals may not always please local interests or the current visitors
• There are equity and other social issues associated with every management decision made and accounting for them is a responsibility in good management
• Fragmented (compartmentalized) decision making is easier, but not better
• Good planning is forward looking, based on what could and should be, not necessarily what is or has been

SOME POINTS TO PONDER
•Wilderness is an American treasure, owned by the people of this Country, held by you in a trust of stewardship
•Stewardship includes being informed of the positions and values of the “Stockholders” of this rich national treasure—IT IS IMPORTANT TO KNOW THE DATA
•Limiting data to on-site surveys and “conventional wisdom” ignores the vast majority of the Wilderness System’s owners, the public, most of whom will never show up—USE HOUSEHOLD SURVEYS


The National Wilderness
Preservation System:Character and Values
www.srs.fs.fed.us/trendswww.srs.fs.fed.us/trends
Ken Cordell, Forest Service Research, and Ken Cordell, Forest Service Research, and Ralph Swain, Forest Service Wilderness ManagementRalph Swain, Forest Service Wilderness Management
END

QUESTIONS• My questions:
• 1. Many different aspects of Wilderness are valued by the American Public. Among these values are passive use values and on-site recreation use values. Science-based estimates of one of these types of values is larger in economic terms than the other. Which is larger AND by a magnitude of how much? (E.g., twice as large, 4 times as large, etc.)
• _______________________________________________________________________________________________.
• 2. What are the three dimensions of Wilderness values that have resulted from public survey research Ken Cordell and his colleagues have done recently. Please put them in the correct order from the highest public support percentage (first one on your list) to the lowest public support percentage (third one on your list).
– __________________– __________________– __________________

• 4. Many different aspects of Wilderness are valued by the American Public. Among these values are passive use values and on-site recreation use values. Science-based estimates of one of these types of values are larger in economic terms than the other. Which is larger AND by a magnitude of how much. (e.g., twice as large, 4 times as large, etc.)
• Passive use net economic value per annum is estimated to be $3.45 billion. On-site recreation use value is estimated to be around $464 million per year. Passive use value is estimated to be over 7 times (7.4 actually) greater than on-site recreation use value.
• 5. What are the three dimensions of Wilderness values that have resulted from public survey research Ken Cordell and his colleagues have done recently? Please put them in the correct order from the highest public support percentage (first one on your list) to the lowest public support percentage (third one on your list).
• 1. Ecological services, especially clean air and water for humans and other species, on and off site
• 2. Ecosystem protection including wildlife habitat, endangered species and rare and unique species
• 3. Amenities for human appreciation and use including wildlands for future generations, recreation, spiritual inspiration, scientific study, and a draw for tourism