the national segmentation of euro area bank balance sheets
TRANSCRIPT

Empir Econ (2017) 53:247–265DOI 10.1007/s00181-016-1221-2
The national segmentation of euro area bank balancesheets during the financial crisis
A. Colangelo1,6 · D. Giannone2,5 · M. Lenza1,6 ·H. Pill3 · L. Reichlin4,5
Received: 3 March 2016 / Accepted: 4 December 2016 / Published online: 31 January 2017© Springer-Verlag Berlin Heidelberg 2017
Abstract This paper analyses bank balance sheet data in conjunction with macroe-conomic and other financial variables. Our aim is to understand the nature of theinstability in financial intermediation in the euro area during the recent financial crises.We define “large changes” as significant departures in the actual evolution of balancesheet variables during the crisis from their historical association with the business andfinancial cycles. In the course of the global 2008–2009 financial crisis, such “large
The views expressed in this paper are those of the authors and do not necessarily reflect the position of theEuropean Central Bank, the Eurosystem, the Federal Reserve Bank of New York, the Federal ReserveSystem or Goldman Sachs.
Electronic supplementary material The online version of this article (doi:10.1007/s00181-016-1221-2)contains supplementary material, which is available to authorized users.
B M. [email protected]
1 European Central Bank, Sonnemannstrasse 20, 60314 Frankfurt am Main, Germany
2 Federal Reserve Bank of New York, 33 Liberty Street, New York, NY 10045, USA
3 Goldman Sachs, 120 Fleet Street, London EC2A 2BB, UK
4 London Business School, Regent’s Park, London NW1 4SA, UK
5 CEPR, 33 Great Sutton Street, London EC1V 0DX, UK
6 ECARES-Université Libre de Bruxelles, Av. F. D. Roosevelt, 1050, Bruxelles, Belgium
123
248 A. Colangelo et al.
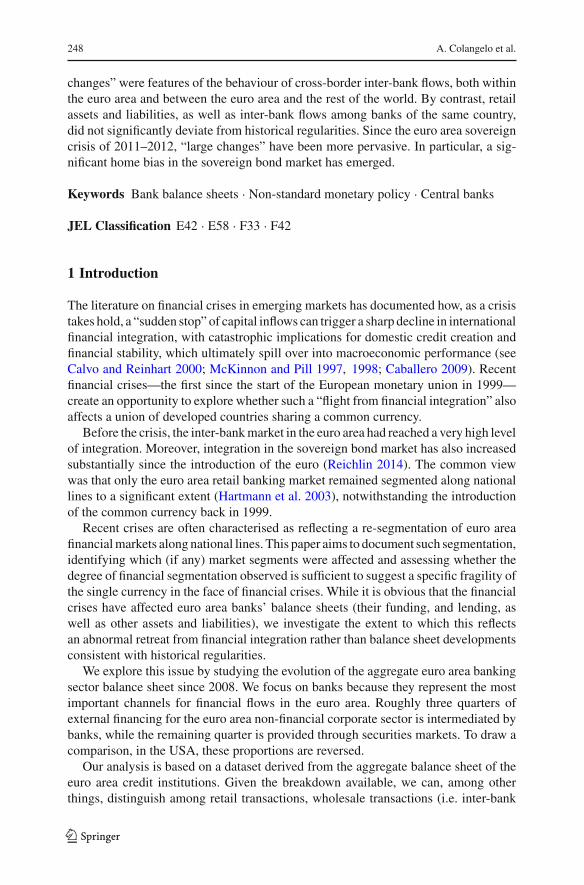
changes” were features of the behaviour of cross-border inter-bank flows, both withinthe euro area and between the euro area and the rest of the world. By contrast, retailassets and liabilities, as well as inter-bank flows among banks of the same country,did not significantly deviate from historical regularities. Since the euro area sovereigncrisis of 2011–2012, “large changes” have been more pervasive. In particular, a sig-nificant home bias in the sovereign bond market has emerged.
Keywords Bank balance sheets · Non-standard monetary policy · Central banks
JEL Classification E42 · E58 · F33 · F42
1 Introduction
The literature on financial crises in emerging markets has documented how, as a crisistakes hold, a “sudden stop” of capital inflows can trigger a sharp decline in internationalfinancial integration, with catastrophic implications for domestic credit creation andfinancial stability, which ultimately spill over into macroeconomic performance (seeCalvo and Reinhart 2000; McKinnon and Pill 1997, 1998; Caballero 2009). Recentfinancial crises—the first since the start of the European monetary union in 1999—create an opportunity to explore whether such a “flight from financial integration” alsoaffects a union of developed countries sharing a common currency.
Before the crisis, the inter-bankmarket in the euro area had reached a very high levelof integration. Moreover, integration in the sovereign bond market has also increasedsubstantially since the introduction of the euro (Reichlin 2014). The common viewwas that only the euro area retail banking market remained segmented along nationallines to a significant extent (Hartmann et al. 2003), notwithstanding the introductionof the common currency back in 1999.
Recent crises are often characterised as reflecting a re-segmentation of euro areafinancialmarkets along national lines. This paper aims to document such segmentation,identifying which (if any) market segments were affected and assessing whether thedegree of financial segmentation observed is sufficient to suggest a specific fragility ofthe single currency in the face of financial crises. While it is obvious that the financialcrises have affected euro area banks’ balance sheets (their funding, and lending, aswell as other assets and liabilities), we investigate the extent to which this reflectsan abnormal retreat from financial integration rather than balance sheet developmentsconsistent with historical regularities.
We explore this issue by studying the evolution of the aggregate euro area bankingsector balance sheet since 2008. We focus on banks because they represent the mostimportant channels for financial flows in the euro area. Roughly three quarters ofexternal financing for the euro area non-financial corporate sector is intermediated bybanks, while the remaining quarter is provided through securities markets. To draw acomparison, in the USA, these proportions are reversed.
Our analysis is based on a dataset derived from the aggregate balance sheet of theeuro area credit institutions. Given the breakdown available, we can, among otherthings, distinguish among retail transactions, wholesale transactions (i.e. inter-bank
123

The national segmentation of euro area bank balance sheets… 249
transactions and transactions vis-à-vis financial intermediaries other than banks) andtransactions in sovereign instruments.
Our database also distinguishes among banks’ domestic counterparties, counterpar-ties in other euro area countries and counterparties outside the euro area countrieswhenanalysing banks’ transactions. The distinction of transacting counterparty by residencyallows a richer description and understanding of the nature of market fragmentationand offers important insight for policy design, both in the immediate crisis manage-ment phase and subsequently when seeking long-term, more fundamental solutions.For example, by acting as an “intermediary of last resort” in the manner describedby Giannone et al. (2012a, b), the ECB can substitute intermediation across its ownbalance sheet for cross-border intra-euro area bank transactions, via the creation ofthe notorious intra-Eurosystem TARGET 2 balances between national central banks(Bindseil et al. 2012). But such central bank intermediation cannot substitute for banktransactions with extra-euro area counterparties and, hence, the ECB balance sheetpolicies are better able to address tensions in intra-euro area markets than tensions inmarkets that straddle the borders of the euro area.
Our empirical approach starts by modelling the joint behaviour of the euro areabanking sector (as represented by the full set of assets and liabilities recorded in itsaggregate balance sheet) and the rest of the euro area economy (as captured by standardmacroeconomic and financial variables). Changes in banks’ balance sheets may reflectchanges in general economic conditions (related to the business and financial cycles)and/or constitute permanent or persistent changes stemming from financial stress. Welabel the former changes as “normal” and the latter changes as “abnormal” relative tohistorical cyclical behaviour.
To define the “normal” path of bank balance sheets during the crisis period (i.e. afterAugust 2008), we first determine the historical (pre-crisis) correlations between bankbalance sheets and the rest of the economy by estimating a model that embodies boththe full set of bank balance sheets and variables describing the rest of the economyover the sample to August 2008.We use this estimatedmodel to compute the “normal”component of the evolution of banks’ balance sheets by forecasting bank balancesheet behaviour over the period September 2008–October 2015, conditional on theobserved path ofmacroeconomic variables during that period. By comparing the actualdevelopment in bank balance sheets with themodel-based counterfactual path definingtheir “normal” cyclical evolution, we can assess whether bank balance sheet dynamicshave been “abnormal” or not.
Concretely, to capture the potentially complex dynamic relationships amongmacroeconomic time series and the set of bank balance sheet variables, we specify aVARmodel encompassing a large set of macroeconomic and financial indicators. Thefinal dataset includes 34 monthly variables in a sample from January 1999 to Octo-ber 2015. To cope with the large dimension of the model, we estimate it by meansof Bayesian techniques, specifying the informative prior distributions described inLitterman (1979) and Doan et al. (1984). As suggested by De Mol et al. (2008) andBanbura et al. (2010), if the variables exhibit relevant co-movement—as ought to bethe case with cyclical macroeconomic and financial variables—this estimation strat-egy is able to control for the estimation error incurred in our very general model whilestill extracting the salient information from the sample. The parameters that govern
123

250 A. Colangelo et al.
the relative weight of the data and the prior beliefs to inform the model coefficientsare set according to the theoretically grounded approach suggested in Giannone et al.(2015). Our findings can be summarised as follows.
First, we show that the stress in the euro area inter-bankmarket following the failureof Lehman has been almost entirely driven by a seizing up of banks’ transactionswith non-domestic wholesale counterparties, in particular banks in other euro areacountries. Domestic inter-bank transactions proved much more resilient.
Previous studies have also pointed to weakness in cross-border inter-bank flows(see, e.g. Abbassi et al. 2015; Garcia-de-Andoain et al. 2014). By distinguishing notonly between domestic and cross-border flows but also between intra-euro area andextra-euro area flows, our richer model provides greater insight. Money market ten-sions after the failure of Lehman in 2008 are better understood as a consequence offinancial dis-integration/cross-border re-fragmentation within monetary union, ratherthan just a generalised breakdown in inter-bank trading or a collapse in inter-bankfunding from outside the euro area. Fortunately for the stability of the financial sys-tem and economy as a whole, the ECB’s policy actions—as reflected in the emergenceof TARGET 2 balances between euro area national central banks—permitted financialtransactions that had taken place in integrated private markets to relocate to centralbank intermediaries.
Second, while in the initial phase of the financial crisis, immediately after thecollapse of Lehman Brothers in 2008, bank loans to households and non-financialcorporations showed some resilience, since the onset of the sovereign and bankingcrises in 2011 such loans have been significantly weaker than the benchmark basedon pre-crisis historical regularities would have suggested.
This implies that, despite the strongworldwide tensions in the banking sector duringthe initial phase of the financial crisis, credit flows to the private sector were largelyinsulated from inter-bank tensions in the aftermath of Lehman’s failure in September2008. This result signals the success of the ECB’s initial policy response (on theevaluation of the effects of the ECB liquidity policy on the euro area credit markets,see Lenza et al. 2010). It is only in the second phase of the crisis, as disruptions inthe euro area markets intensified with sovereign and banking dislocations becomingmore central, that the flow of loans to the real economy was disrupted.
Third, we find that banks built-up unusually large holdings of sovereign debt duringthis second sovereign phase of the crisis, possibly reflecting substitution away fromloans to the private sector. Overwhelmingly, this build-up reflected an accumulationof domestic sovereign debt. The deepening of banks’ home bias in the sovereign bondmarket is therefore characteristic of a second wave of financial dis-integration/marketfragmentation from early 2011 onwards. This second wave lay behind the emergenceof a “diabolic loop” between bank and sovereign balance sheets. In any jurisdiction thesovereign market plays a key role because sovereign bonds, being liquid and “safe”,are a good source of collateral.
Before 2010, the markets considered a sovereign default within the euro area asa very unlikely event and priced sovereign bonds similarly across countries, irre-spective of differences in their fiscal positions. Sovereign spreads were very narrow.This perception changed dramatically with the onset of the Greek sovereign crisis in2010. Since then, not only has the market started to differentiate among countries, at
123

The national segmentation of euro area bank balance sheets… 251
some point it also started to price the possibility of a break-up of euro area or exitof specific countries (introducing so-called redenomination or convertibility risk).1
The reaction to the advent of such risk was an emergence of a strong home bias insovereign debt holdings. With fear of contagion and the emergence of redenomina-tion risk, the liquidity and safety properties of sovereign bonds in some jurisdictionshave disappeared. However, rather than a flight to safer German bonds, banks haveopted for their own domestic bonds (Angelini et al. 2014; Battistini et al. 2013; Gari-cano and Reichlin 2014), leading to a rising correlation between bank and sovereignrisk. Whatever the underlying behaviour, the resulting increased correlation of bankand sovereign risk—an intensification of the “diabolical loop” mentioned above—isanother important aspect of the vulnerability of a monetary union to financial crises.
The previous literature on the evolution of bank balance sheets during the crisis hasfocused on specific aspects of individual or aggregate bank balance sheets (e.g. inter-bank transactions) largely in isolation, capturing the relationship among a handful ofbank level and macroeconomic variables. In this paper, we provide an encompassingassessment of the whole aggregate euro area bank balance sheet and of its relationshipwith a large set of variables describing the rest of the economy. Compared with theexisting literature, this strategy allows us to draw a more consistent picture of thedevelopments in the various elements of the bank balance sheets. Moreover, our modelis quite general and able to capture, to a greater extent than existing studies, thehistorical regularities linking bank balance sheets with the rest of the economy. Fromthis perspective, the counterfactual exercise we conduct is more informative thanexisting analysis about the stylised facts linking bank balance sheets and the rest ofthe economy and, hence, also able to more accurately define “abnormal” deviationsfrom those stylised facts.
The remainder of the paper is organised as follows. InSect. 2,wedescribe the datasetand illustrate the design of the analysis and the related econometric methodology.Section 3 presents the results and Sect. 4 provides a discussion of the results and theirimplications. A more detailed illustration of the data is also presented in the “Annex”.
2 Data and econometric methodology
2.1 The dataset
Our analysis exploits data on the aggregate balance sheet of euro area MonetaryFinancial Institutions (MFIs), excluding the Eurosystem. The statistics are compiledin a fully harmonised manner under the requirements of Regulation ECB/2013/332
and cover asset and liability positions of MFIs with granular breakdowns in terms ofinstrument categories, sector and residency of counterparties, and original maturity.
1 See ECB (2014) for an extensive discussion and survey of the literature on the determinants of sovereignbond yields before and after the sovereign debt crisis.2 Regulation (EC) No XX/2013 of the ECB of 24 September 2013 concerning the balance sheet of themonetary financial institutions sector (Recast), OJ L 15, 7.11.2013, p. 14.
123

252 A. Colangelo et al.
Fig. 1 Intra-euro area inter-MFI loans. Note Euro billions; notional stocks. (Color figure online). Source:ECB
Data are collected by national central banks (NCBs) from reporting agents residentin their jurisdictions based on the ‘host country’ residency approach and relate to thesolo accounts of the institutions. In other words, the focus is not on “banks” but ratheron the individual branches and subsidiaries that operate in euro area countries. Theconcepts underlying MFI balance sheet statistics are based on international statisticalstandards, which guaranty the international comparability of the statistics and ensurea sound methodological background.
For the purposes of this paper, balance sheet variables are aggregated in such away as to distinguish assets and liabilities by instrument, by sector and by residencyof the counterparty.3 In particular, on the assets side, we consider loan and depositclaims, and holdings of securities, separately identifying debt securities from equityinstruments, where relevant. In turn, on the liabilities side, we distinguish betweendeposit and loan liabilities and debt securities issued.
In termsof area of residency, a distinction ismade (when relevant) betweendomesticand non-resident counterparties, with a further split between intra-euro area and extra-euro area. Intra-euro area positions are then broken down between inter-bank, otherwholesale (financial corporations other than banks), retail (non-financial corporationsand households) and government, as applicable. This approach allows us to analysethe behaviour of domestic inter-bank loans as opposed to the corresponding intra-euroarea cross-border activity.
Figure 1 shows developments in the intra-euro area inter-bank market, includingMFI positions with respect to the Eurosystem. Starting from 1999, these positionssteadily increased over time, accelerating in periods preceding the inception of thefinancial crisis. Domestic positions kept increasing, although at a slower pace, between
3 The data used in the paper relate to notional stocks,which are constructed based onmeasure of transactionsand therefore are corrected for series breaks arising, e.g. from mergers and acquisitions or changes in theclassification of counterparties (see the “Annex” for further discussion).
123
The national segmentation of euro area bank balance sheets… 253
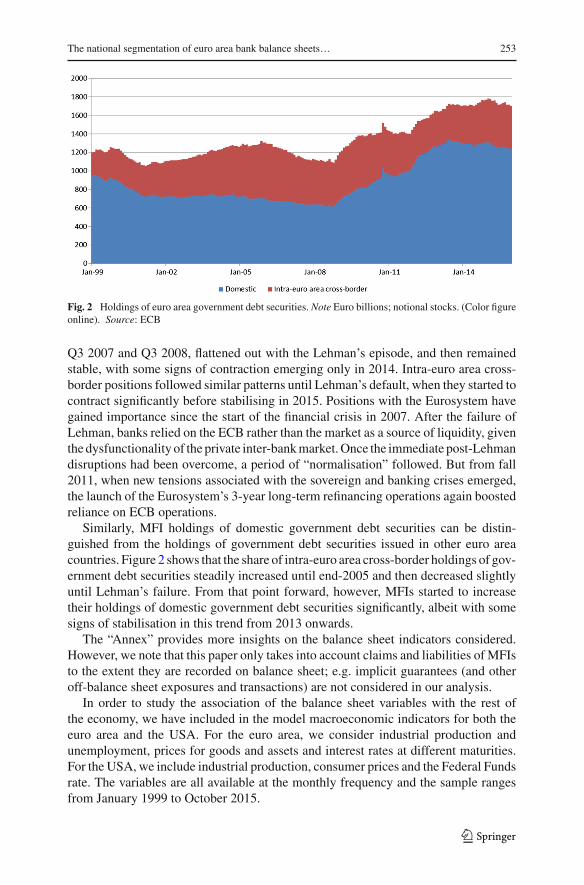
Fig. 2 Holdings of euro area government debt securities. Note Euro billions; notional stocks. (Color figureonline). Source: ECB
Q3 2007 and Q3 2008, flattened out with the Lehman’s episode, and then remainedstable, with some signs of contraction emerging only in 2014. Intra-euro area cross-border positions followed similar patterns until Lehman’s default, when they started tocontract significantly before stabilising in 2015. Positions with the Eurosystem havegained importance since the start of the financial crisis in 2007. After the failure ofLehman, banks relied on the ECB rather than the market as a source of liquidity, giventhe dysfunctionality of the private inter-bankmarket.Once the immediate post-Lehmandisruptions had been overcome, a period of “normalisation” followed. But from fall2011, when new tensions associated with the sovereign and banking crises emerged,the launch of the Eurosystem’s 3-year long-term refinancing operations again boostedreliance on ECB operations.
Similarly, MFI holdings of domestic government debt securities can be distin-guished from the holdings of government debt securities issued in other euro areacountries. Figure 2 shows that the share of intra-euro area cross-border holdings of gov-ernment debt securities steadily increased until end-2005 and then decreased slightlyuntil Lehman’s failure. From that point forward, however, MFIs started to increasetheir holdings of domestic government debt securities significantly, albeit with somesigns of stabilisation in this trend from 2013 onwards.
The “Annex” provides more insights on the balance sheet indicators considered.However, we note that this paper only takes into account claims and liabilities of MFIsto the extent they are recorded on balance sheet; e.g. implicit guarantees (and otheroff-balance sheet exposures and transactions) are not considered in our analysis.
In order to study the association of the balance sheet variables with the rest ofthe economy, we have included in the model macroeconomic indicators for both theeuro area and the USA. For the euro area, we consider industrial production andunemployment, prices for goods and assets and interest rates at different maturities.For the USA, we include industrial production, consumer prices and the Federal Fundsrate. The variables are all available at the monthly frequency and the sample rangesfrom January 1999 to October 2015.
123

254 A. Colangelo et al.
2.2 The design of the empirical exercise
The aim of our quantitative exercise is to identify those changes in balance sheetbehaviour since 2008 which are larger in size than what could have been expected,given the historical association of the bank balance sheets with macroeconomic vari-ables and the evolution of those variables during the crises. In other words, “large”for us is a change which goes beyond what could be rationalised by macroeconomicdynamics seen during the post-Lehman ‘Great Recession’ and the subsequent Euro-pean sovereign and banking crises. In our view, a “large” change signals exceptionalfinancial disruption leading to exceptional changes in banks’ behaviour. To give a pre-cise meaning to the concept of “large change”, we use the pre-crisis part of the sampleas a “benchmark” against which we compare the more recent behaviour during thefinancial crises.
More specifically, we compare the observed path of key bank balance sheet itemswith predictions based on a dynamicmodel of the joint behaviour of bank balance sheetand macroeconomic variables in the pre-crisis sample. In constructing the predictionswe condition on: (1) the economic relationships prevailing before the Lehman collapse(reflected in the model parameters estimated using the data until August 2008); (2)the pre-crisis history of all variables; and (3) the observed outcomes of the subset ofvariables representing themacroeconomic environment until the end of the sample (i.e.using as conditioning assumptions macro variables in our data set; these capture realeconomic conditions, short-term interest rates and consumer and production prices inboth the euro area and the USA).
If the observed path of bank balance sheet variables since Lehman’s failure lies outof the forecast distributions, the observed developments in the banking sector duringthe financial crisis are difficult to reconcile with those in the rest of the economy.Potentially, this may be due to structural changes in the financial sector brought aboutby the crisis. By contrast, the finding of no significant change is evidence that, althoughlarger in size, the shocks that affected the euro area economy during the financialcrises are similar in nature to those that drove the economy in the preceding 10 years.Moreover, the transmission of these shocks has not changed substantially. In otherwords, if the observed and simulated paths are similar, we interpret this as evidencethat the relative importance of real and financial shocks has remained the same throughthe financial crisis, at least once one has conditioned on policies and, in particular, onthe introduction of non-standard monetary policy measures by the ECB.
It is important to notice that, since banks’ balance sheets andmacroeconomic devel-opments are jointly determined in general equilibrium, the conditional predictionsshould not be interpreted as solely driven by the macroeconomic shocks but also bythose financial shocks that significantly influenced macroeconomic conditions. Byconditioning on real economy variables, we ensure that we capture the size of theshocks that would have caused the recent recession, if it were due to the shocks thathave typically generated recessions in the euro area. For example, if credit shockswere traditionally associated with a recession, we would be implicitly conditioning onour characterisation of credit shocks since September 2008 in order to assess whetherthe impact of such shocks and credit dynamic more generally have been in line withhistorical regularities.
123

The national segmentation of euro area bank balance sheets… 255
As a caveat, it should stressed that, since our “normal” is based on predictions of amodel estimated using only pre-crisis data, uncertainty can be substantial, especiallyfor longer horizons. As a consequence, we will be not be able to detect all the abnor-mal dynamics, but only the very “large” differences between the actual data and thecounterfactual.
2.3 The econometric model
Using the data set described in Sect. 2.1 and in the “Annex”, we estimate an empiricalmodel of the euro area economy. Let Xt be the vector including the n variables (allvariables are in log levels, except for variables expressed in rates that are in levels). Inparticular, we estimate a VAR model with p(= 13) lags:
Xt = A0 + A1Xt−1 + A2Xt−2 + · · · + ApXt−p + et
where et is a normally distributed multivariate white noise with covariance matrix �.The large dimension (n = 34 and p = 13) of ourVARmodel implies thatwe face an
issue of overfitting due to the large number of parameters (“curse of dimensionality”).We address this issue by shrinking the model’s coefficients towards those of the naïveand parsimonious randomwalk with drift model, Xit = δi +Xi,t−1+eit . DeMol et al.(2008) and Banbura et al. (2010) have shown that this approach reduces estimationuncertainty without introducing substantial bias, hence providing a parsimonious butreliable estimate of the complex dynamic interactions among the macro-, monetaryand financial variables included in the data set. This is achieved thanks to the tendencyfor economic time series to co-move over the business cycle, which creates scope forthe data to point “massively” in the same direction against a naïve prior model thatdoes not allow for any dynamic interaction.
Inference is based on the framework developed by Giannone et al. (2015). For�, the covariance matrix of the residuals, we specify an inverse Wishart with scaleparameter given by a diagonal matrix. The degrees of freedom are set to d = (n + 2),the minimum number that guarantees the existence of the prior mean of �, which isequal to�/(d−n−1) = �. Conditional on the covariance matrix of the innovations,we specify a Gaussian prior for the constant A0 and the autoregressive coefficients(A1. . .Ap) which is centred on the Random Walk with drift model. More precisely,we specify a flat prior for the constant term, while for the autoregressive coefficientswe postulate two priors: the Minnesota and the sum-of-coefficients priors originallyproposed by Litterman (1979) and Doan et al. (1984) respectively. For the Minnesotaprior, the means and variances are defined as follows:
E[(A1)] = In, while E[(A2)] = · · · = E[(Ap)] = 0n,n
Cov[(As)i j , (Ar )hm] = λ2�ih/(s2�) if m = j and r = s, zero otherwise.
The factor 1/s2 is the rate at which the prior variance decreases with increasing laglength, capturing the prior belief that dependence is less strong for longer lags. Theratio�i j/�i i accounts for the different scale and variability of the data. Finally, the key
123
256 A. Colangelo et al.
hyperparameter isλ, which controls the scale of all the prior variances and covariances,and effectively determines the overall tightness of this prior. For λ = 0 the posteriorequals the prior and the data do not influence the estimates. If λ → ∞, on the otherhand, posterior expectations coincide with the OLS estimates. In order to understandthe intuition underlying the “sum-of-coefficient prior”, it is useful to rewrite the VARequation in error correction form:
�Xt = A0 − (In − A1 − · · · − Ap)Yt−1 + B1�Yt−1 + · · · + Bp−1�Yt−p+1 + et
The prior for � = (In − A1 − · · · − Ap) is centred around zero and can be eas-ily implemented using dummy observations. The tightness of this additional prior iscontrolled by the hyperparameter μ. As μ goes to infinity the prior becomes flat. If,instead, μ goes to 0, the prior becomes dogmatic and we approach the case of a modelwith data transformed in differences, which implies the presence of a unit root in eachequation. Intermediate cases imply a sort of “inexact differencing”.
Summing up, the setting of these priors depends on the hyperparameters λ,μ andψ , which reflect how informative the prior distribution is for the model’s coefficients.These parameters are usually set on the basis of subjective considerations or rules ofthumb. We instead follow the theoretically grounded approach proposed by Giannoneet al. (2015).This involves treating the coefficients of the prior as additional parameters,in the spirit of hierarchical modelling. As hyperpriors we use proper but almost flatdistributions.4
The counterfactual exercise described in broad terms in Sect. 2.2, is performed asfollows. We simulate the model parameters from their full posterior density, account-ing also for the estimation uncertainty of the hyperparameters controlling the priortightness. This approach is implemented using a simple Markov chain Monte Carloalgorithm. In particular, we use a Metropolis step to draw the low dimensional vectorof hyperparameters. Conditional on a value of the hyperparameters, the VAR coeffi-cients can then be drawn from their posterior, which is normal-inverseWishart.5 Sincewe are interested in conditioning on the economic relationships prevailing before theLehman collapse, the posterior is computed using the data until August 2008.
For any given draw of themodel’s parameters from their posterior density, the drawsfrom the counterfactual exercise are computed as conditional forecasts in which theconditioning information is given by: (1) the pre-crisis history of all variables inthe model; (2) the macroeconomic developments observed during the crisis; and (3)the observed outcomes of the subset of variables representing the macroeconomicenvironment until the end of the sample in October 2015. The conditional forecastsare obtained using the algorithm developed in Banbura et al. (2015). The procedureexploits the fact that the vector autoregressive model can be cast in a state-space form.Hence, the conditional forecasts can be drawn using a simulation smoother.6
4 As hyperpriors for λ, μ we choose Gamma densities with mode equal to 0.2, 1 and standard deviationsequal to 0.4, 1 respectively. Our prior on ψ , i.e. the prior mean of the main diagonal of �, is an inverseGamma with scale and shape equal to (0.02)2.5 See Giannone et al. (2015) for the details of the MCMC algorithm.6 In this paper, we use the simulation smoother described in Carter and Kohn (1994).
123

The national segmentation of euro area bank balance sheets… 257
3 Results
Table 1 reports the results of our exercise. We focus on a few important dates in oursample. As a reference, we provide a picture of our stylised bank balance sheet in1999 (average levels over the year, in terms of euro billions), the outset of monetaryunion and the beginning of our sample. We then show the data for the crisis years(2008–2015, average levels over the years, in terms of euro billions), which is thesample over which the empirical exercise is carried out.
At the bottom of each cell, in parenthesis, the table reports the 2.5 and 97.5% per-centiles of the counterfactual forecast distributions. Any development of the variablesoutside those percentiles is identified as being ‘unlikely’ given the historical regular-ities estimated in the pre-crisis sample and, hence, it could reflect relevant changesin the nature of financial intermediation. Figures 3 and 4 capture the same results ingraphical form.
Starting from the liability side, the first striking element is the resilience of retaildeposits. None of the two crises seems to have been characterised by a run on bankdeposits. The stress in bank funding is revealed by the collapse of banks’ debt liabilitiesand, as many have observed (e.g. Heider et al. 2009), that of the inter-bank market.The latter, however, is mainly driven by cross-border activity, while the domestic inter-bank flows have remained relatively resilient. This result is line with the conclusionsof an analysis of bank-level data by Abbassi et al. (2013, 2015). Both the intra-and extra-euro area inter-bank deposits decline unusually during the crisis. Financialintegration within the euro area is revealed to be fragile, as fragile as integration acrossthe boundaries of the single currency area.
One open issue is the extent to which transactions within banking groups influencethese results. Data distinguishing intra-group inter-bank positions are available (for thedataset used in this paper) only since July 2014. These data are not used in our model,as they do not cover the key crisis period. Moreover, these data do not distinguishbetween positions among banks of the same groupwithin one country and transactionsbetween banks within the same group that take place across euro area borders (i.e.between domestic and intra-euro area non-resident transactions). Data show that intra-group positions account for about 50% of inter-bank positions in the euro area andhave remained rather stable since July 2014. If we take the view that intra-grouptransactions are less affected by the breakdown of financial integration within theeuro area, the implication is that transactions between unrelated institutions wereeven more adversely affected than what can be argued by looking at our data. Ourassumption seems to the supported by the findings of Reinhardt and Riddiough (2014),which show that intra-group funding remains stable during periods of heightenedrisk.
The data also imply that (especially in the immediate aftermath of Lehman’s fail-ure) banks’ reliance on the Eurosystem as a source of funding has increased. This isconsistent with our view that central bank intermediation substituted for the decline ininter-bank market activity. The ECB balance sheet was able to step in as intermediaryof last resort at a cost, however, of creating large TARGET 2 (im)balances.
The response of bank assets to the crisis was initially (i.e. in the immediate post-Lehman period) more muted than on the liability or funding side. The one exception
123

258 A. Colangelo et al.
Table1
Bankbalancesheetitems—
liabilitiesandassets.(Color
figureonlin
e)
LIA
BILI
TIES
Dep
osit
s of
eur
o ar
ea fi
rms
and
hous
ehol
ds
Dep
osit
of e
uro
area
gov
ernm
ent
Dep
osit
and
loan
liab
ili�
es to
the
Euro
syst
em
Dom
es�
c de
posi
ts fr
om M
FIs
Intr
a–eu
ro a
rea
cros
s–bo
rder
dep
osit
s fr
om M
FIs
Oth
er e
uro
area
who
lesa
le d
epos
its
Dep
osit
s fr
om n
on–e
uro
area
resi
dent
s
Deb
t sec
uri�
es is
sued
(380
0.6–
1092
6.0)
(383
8.7–
1368
4.0)
(220
5.5–
1143
3.1)
(284
5.2–
1116
6.5)
(731
9.0–
1162
2.0)
(740
9.0–
1293
9.6)
(79.
3–19
09.7
)
(323
3.0–
6693
.9)
(225
8.4–
8852
.6)
(283
0.4–
8755
.9)
(311
9.3–
7520
.9)
(113
.1–7
728.
0)(7
8.6–
1237
6.1)
(60.
6–27
73.1
)
(720
7.1–
1049
5.0)
(102
.5–1
408.
8)
(146
.5–5
031.
0)(1
64.0
–329
1.9)
(332
1.6–
5946
.1)
(227
4.1–
6920
.0)
(278
5.3–
6928
.3)
(376
1.7–
8939
.4)
(194
8.5–
4296
.8)
(259
9.6–
4822
.5)
(371
1.4–
6833
.2)
(697
7.1–
9580
)
(130
.9–1
203.
4)
(334
3.6–
5458
.5)
(211
5.0–
5378
.9)
(264
5.1–
5619
.5)
(363
6.9–
7520
.9)
(360
9.3–
4910
.5)
(682
6.0–
8199
.3)
(185
.2–6
74.3
)
(229
.4–1
298.
7)
(329
2.0–
4404
.4)
(209
0.1–
3581
.3)
(247
1.4–
3834
.3)
(367
1.2–
5671
.8)
(207
6.0–
2217
.2)
(250
4.1–
2599
.4)
(419
0.8–
4401
.4)
(662
9.4–
7547
.8)
(213
.8–5
51.4
)
(263
.5–9
32.0
)
(325
8.9–
4020
.8)
(196
9.0–
2919
.0)
(232
2.8–
3121
.8)
(665
6.0–
6780
.4)
(348
.1–3
93.7
)
(489
.1–5
89.2
)
(336
3.2–
3475
.7)
(693
2.4–
9007
.2)
(153
.3–9
32.3
)
(174
.5–2
048.
2)
(327
3.1–
4953
.6)
2726.4
2407.4
5229.9
5306.4
5257.1
5220.1
5232.9
4873.5
4531.6
4222.3
2593.2
2641.3
1623.3
4209.7
3661.6
3594.1
3403.6
3182.9
2824.5
2665.8
1297.9
1271.3
1290.6
908.7
2589.1
2790.4
2865.7
2969.3
2869.6
2764.5
813.9
2066.4
1744.3
1645.1
1574.3
1419.6
684.1
2108.2
3480.6
3689.1
3660.9
3664.8
3642.3
3583.9
3487.6
3344.4
474.6
503.3
195.2
700.6
817
726.7
687.8
1351.5
934.6
684.4
7983.3
8222.2
8423.4
220.3
390.6
426.4
419.2
462.7
476.6
474.2
4239.4
6736.6
7044.1
7257.4
7468.1
7673.3
1999
2008
2009
2010
2011
2012
2013
2014
2015
ASSE
TS19
9920
0820
0920
1020
1120
1220
1320
1420
15Lo
ans
to e
uro
area
firm
s an
d ho
useh
olds
Loa
ns to
eur
o ar
ea g
over
nmen
t
Dep
osit
and
loan
cla
ims
on th
e Eu
rosy
stem
Dom
es�
c lo
ans
to M
FIs
Intr
a–eu
ro a
rea
cros
s–bo
rder
loan
s to
MFI
Oth
er e
uro
area
who
lesa
le lo
ans
Loan
s to
non
–eur
o ar
ea re
side
nts
Dom
es�
c ho
ldin
gs o
f gov
ernm
ent d
ebt s
ecur
i�es
Intr
a–eu
ro a
rea
cros
s–bo
rder
hol
ding
s of
gov
ernm
ent d
ebt s
ecur
i�es
Hol
ding
of e
uro
area
MFI
sec
uri�
es
Hol
ding
of s
ecur
i�es
issu
es b
y th
e eu
ro a
rea
priv
ate
sect
or
Hol
ding
of d
ebt s
ecur
i�es
issu
ed b
y no
n–eu
ro a
rea
resi
dent
s
Hol
ding
of e
quit
y is
sued
by
non–
euro
are
a re
side
nts
Rem
aini
ng a
sset
s(2
336.
1–15
628.
8)
2196
.6–5
437.
4)
(342
.4–1
332.
9)
(335
.3–2
526.
8)
(230
4.5–
5086
.4)
(156
3.2–
6970
.7)
(187
9.9–
8130
.8)
(83.
9–19
99.4
)
(701
.4–1
538.
8)
(1.9
–101
66.2
)
(298
9.8–
7440
.9)
(228
2.3–
1140
7.3)
(857
.8–4
679.
5)
(431
0.9–
2077
9.9)
(382
.3–2
058.
6)
(233
7.0–
4505
.7)
(167
1.3–
5797
.5)
(177
2.1–
5944
.1)
(98.
8–13
60.4
)
(247
6.2–
1187
7.1)
(165
2.8–
4427
.8)
(111
.5–9
49.4
)
(254
0.0–
9057
.6)
(740
.1–1
418.
8)
(3.7
–521
5.9)
(312
1.8–
6647
.4)
(233
7.0–
8862
.7)
(894
.6–3
655.
7)
(409
8.6
1507
8.0)
(390
.2–1
204.
1)
(398
4.4–
1130
9.0)
(439
.8–1
100.
3)
(421
.6–1
680.
6)
(232
7.3–
4013
.1)
(173
7.9–
4154
.8)
(175
4.1–
4868
.7)
(233
0.8–
3699
.8)
(154
8.1–
3570
.1)
(144
.6–8
90.9
)
(271
5.0–
7985
.2)
(781
.0–1
327.
3)
(6.5
–276
3.9)
(11.
3–20
154.
4)
(321
5.3–
5966
.6)
(236
2.1–
6922
.0)
(920
.1–2
935.
6)
(803
.1–1
259.
6)
(324
7.2–
5403
.7)
(936
.7–2
502.
7)
(368
2.1–
8847
.6)
(454
.4–9
91.5
)
(395
.6–1
272.
2)(4
28.7
–111
1.1)
(228
1.6–
3329
.3)
(183
2.1–
3754
.5)
(140
6.0–
2761
.0)
(152
.3–6
58.4
)
(278
1.3–
6691
.2)
(132
2.6–
2156
.5)
(167
.9–4
80.9
)
(285
5.1–
5356
.5)
(847
.9–1
221.
6)
(22.
7–16
77.2
)
(320
2.1–
4931
.3)
(201
0.7–
4314
.6)
(980
.6–2
194.
9)
(343
5.2–
7114
.6)
(503
.6–9
57.7
)
(943
.3–1
675.
5)
(359
7.3
– 60
40.6
)
(551
.5–8
69.8
)
(463
.4–9
29.5
)
(214
6.6–
2797
.5)
(172
0.2–
2859
.0)
(451
.3–7
27.6
)
(207
2.9–
2502
.1)
(169
9.3–
2425
.0)
(122
4.9–
1720
.6)
(192
.2–4
02.0
)
(291
1.0–
4532
.9)
(284
.5–3
10.4
)
(347
3.3–
3681
.8)
(901
.9–1
088.
8)
(58.
0–55
3.7)
(321
9.7–
3986
.2)
(334
4.2–
3458
.3)
(202
1.0
– 29
63.9
)
(921
.9–1
377.
9)
(343
4.3–
4944
.8)
(570
.8–7
84.9
)
(355
4.2–
3754
.3)
(621
.0–6
48.3
)
(476
.4–5
07.2
)
(223
5.7
– 22
96.4
)
(195
4.2–
2052
.4)
(123
4.7–
1291
.5)
(114
78.5
–157
93.1
)(1
1852
.1–1
7514
.7)
(961
.0–9
85.1
)
(173
.5–2
37.6
)
(213
4.4–
2276
.8)
(111
1.6–
1172
.8)
(883
.0–1
151.
1)
(38.
6–76
7.1)
(324
1.4–
4374
.3)
(211
9.9–
3604
.2)
(927
0.9–
9350
.3)
(922
3.8–
9929
.7)
(957
1.4–
1078
8.7)
(101
98.2
–120
83.5
)(1
0632
.0–1
3140
.8)
(110
17.1
–142
17.6
)
4013.8
316.9
335.1
1611.1
3737.6
3829.8
3936.4
3766
4732.3
3961.3
3555.9
855.4
877.1
932.1
91.7
298.7
284.6
298.9
301.5
292.5
317.3
292.9
1224
1154.6
1078.1
970.9
916.4
1888.4
666.6
2014.9
2270.1
2288.6
2266.5
2211
2204.1
2118.8
2086.6
435
476.4
1013.1
2269.2
2482
2392.7
2298.4
2448.1
2294.9
2084.6
1305.6
1292.9
1270.7
302.6
483.6
539.6
518.4
439.3
375.9
388.8
921.3
631.7
765.6
899
975.4
1194.4
1248.5
1208.2
3601.8
3093.4
3049
3105
3027.4
2908.2
3015.6
3025.5
1320.1
1354.3
358.7
1155.6
1169.3
1189.5
1244.2
1249.3
1259.8
1206.6
3596.3
3498.9
3361.6
796.7
2127.4
1823.5
1697.6
1625.5
1490.3
1360.1
2094.3
3461.1
3669.8
3626.5
3653.6
3664.6
1107.5
104.2
278.1
326
408.9
452.5
1020.4
575.6
322.9
467.3
9802.6
9894.3
972.7
977.3
998.3
1088.4
1165.6
1159.5
1110.4
1093.4
4525.5
9339.1
9596.4
9683.7
9915.8
9965.1
9874.5
(673
3.2
– 10
498.
8)(6
939.
9–11
916.
8)(6
146.
2–83
74.2
)(6
413.
4 –
9223
.5)
(581
0.6–
7466
.5)
(517
8.0–
5848
.0)
(545
1.5–
6523
.4)
(523
7.6–
5325
.4)
123
The national segmentation of euro area bank balance sheets… 259
Deposits of euro area firms and households
1999 2008 2009 2010 2011 2012 2013 2014 20150
2000
4000
6000
8000
10000
12000
14000Deposit of euro area government
1999 2008 2009 2010 2011 2012 2013 2014 20150
500
1000
1500
2000Deposit and loan liabilities to the Eurosystem
1999 2008 2009 2010 2011 2012 2013 2014 20150
2000
4000
6000
8000
Domestic deposits from MFIs
1999 2008 2009 2010 2011 2012 2013 2014 20150
1000
2000
3000
4000
5000
6000
7000Intra-euro area cross-border deposits from MFIs
1999 2008 2009 2010 2011 2012 2013 2014 20150
2000
4000
6000
8000
10000Other euro area wholesale deposits
1999 2008 2009 2010 2011 2012 2013 2014 20150
2000
4000
6000
8000
10000
Deposits from non-euro area residents
1999 2008 2009 2010 2011 2012 2013 2014 20150
2000
4000
6000
8000
10000
12000
14000Debt securities issued
1999 2008 2009 2010 2011 2012 2013 2014 20150
2000
4000
6000
8000
10000
12000
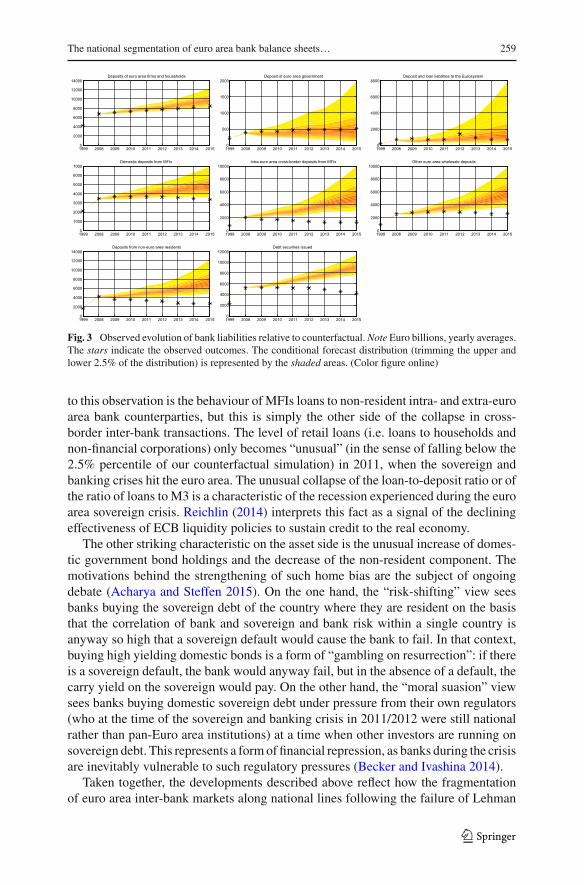
Fig. 3 Observed evolution of bank liabilities relative to counterfactual.Note Euro billions, yearly averages.The stars indicate the observed outcomes. The conditional forecast distribution (trimming the upper andlower 2.5% of the distribution) is represented by the shaded areas. (Color figure online)
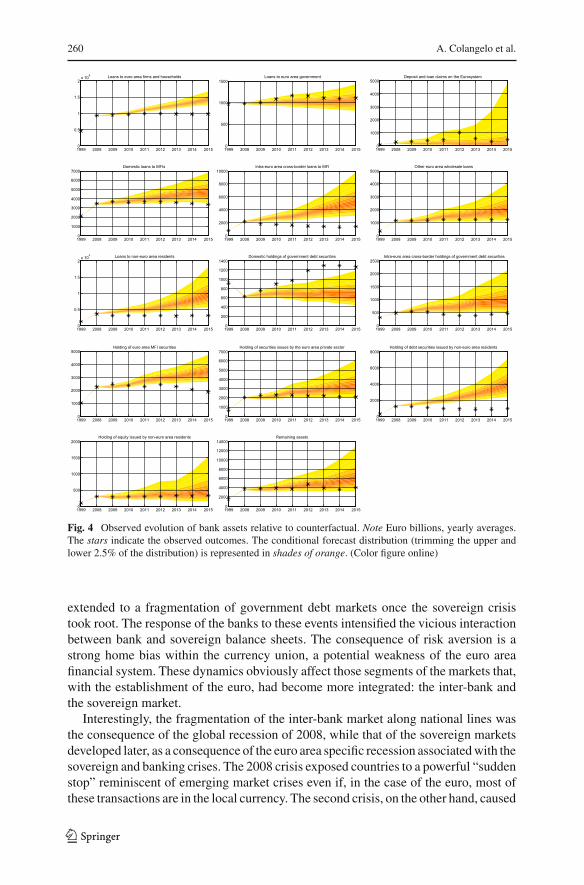
to this observation is the behaviour of MFIs loans to non-resident intra- and extra-euroarea bank counterparties, but this is simply the other side of the collapse in cross-border inter-bank transactions. The level of retail loans (i.e. loans to households andnon-financial corporations) only becomes “unusual” (in the sense of falling below the2.5% percentile of our counterfactual simulation) in 2011, when the sovereign andbanking crises hit the euro area. The unusual collapse of the loan-to-deposit ratio or ofthe ratio of loans to M3 is a characteristic of the recession experienced during the euroarea sovereign crisis. Reichlin (2014) interprets this fact as a signal of the decliningeffectiveness of ECB liquidity policies to sustain credit to the real economy.
The other striking characteristic on the asset side is the unusual increase of domes-tic government bond holdings and the decrease of the non-resident component. Themotivations behind the strengthening of such home bias are the subject of ongoingdebate (Acharya and Steffen 2015). On the one hand, the “risk-shifting” view seesbanks buying the sovereign debt of the country where they are resident on the basisthat the correlation of bank and sovereign and bank risk within a single country isanyway so high that a sovereign default would cause the bank to fail. In that context,buying high yielding domestic bonds is a form of “gambling on resurrection”: if thereis a sovereign default, the bank would anyway fail, but in the absence of a default, thecarry yield on the sovereign would pay. On the other hand, the “moral suasion” viewsees banks buying domestic sovereign debt under pressure from their own regulators(who at the time of the sovereign and banking crisis in 2011/2012 were still nationalrather than pan-Euro area institutions) at a time when other investors are running onsovereign debt. This represents a formof financial repression, as banks during the crisisare inevitably vulnerable to such regulatory pressures (Becker and Ivashina 2014).
Taken together, the developments described above reflect how the fragmentationof euro area inter-bank markets along national lines following the failure of Lehman
123
260 A. Colangelo et al.
Loans to euro area firms and households
1999 2008 2009 2010 2011 2012 2013 2014 20150
0.5
1
1.5
2x 10
4 Loans to euro area government
1999 2008 2009 2010 2011 2012 2013 2014 20150
500
1000
1500Deposit and loan claims on the Eurosystem
1999 2008 2009 2010 2011 2012 2013 2014 20150
1000
2000
3000
4000
5000
Domestic loans to MFIs
1999 2008 2009 2010 2011 2012 2013 2014 20150
1000
2000
3000
4000
5000
6000
7000Intra-euro area cross-border loans to MFI
1999 2008 2009 2010 2011 2012 2013 2014 20150
2000
4000
6000
8000
10000Other euro area wholesale loans
1999 2008 2009 2010 2011 2012 2013 2014 20150
1000
2000
3000
4000
5000
Loans to non-euro area residents
1999 2008 2009 2010 2011 2012 2013 2014 20150
0.5
1
1.5
2x 10
4 Domestic holdings of government debt securities
1999 2008 2009 2010 2011 2012 2013 2014 20150
200
400
600
800
1000
1200
1400Intra-euro area cross-border holdings of government debt securities
1999 2008 2009 2010 2011 2012 2013 2014 20150
500
1000
1500
2000
2500
Holding of euro area MFI securities
1999 2008 2009 2010 2011 2012 2013 2014 20150
1000
2000
3000
4000
5000Holding of securities issues by the euro area private sector
1999 2008 2009 2010 2011 2012 2013 2014 20150
1000
2000
3000
4000
5000
6000
7000Holding of debt securities issued by non-euro area residents
1999 2008 2009 2010 2011 2012 2013 2014 20150
2000
4000
6000
8000
Holding of equity issued by non-euro area residents
1999 2008 2009 2010 2011 2012 2013 2014 20150
500
1000
1500
2000Remaining assets
1999 2008 2009 2010 2011 2012 2013 2014 20150
2000
4000
6000
8000
10000
12000
14000
Fig. 4 Observed evolution of bank assets relative to counterfactual. Note Euro billions, yearly averages.The stars indicate the observed outcomes. The conditional forecast distribution (trimming the upper andlower 2.5% of the distribution) is represented in shades of orange. (Color figure online)
extended to a fragmentation of government debt markets once the sovereign crisistook root. The response of the banks to these events intensified the vicious interactionbetween bank and sovereign balance sheets. The consequence of risk aversion is astrong home bias within the currency union, a potential weakness of the euro areafinancial system. These dynamics obviously affect those segments of the markets that,with the establishment of the euro, had become more integrated: the inter-bank andthe sovereign market.
Interestingly, the fragmentation of the inter-bank market along national lines wasthe consequence of the global recession of 2008, while that of the sovereign marketsdeveloped later, as a consequence of the euro area specific recession associatedwith thesovereign and banking crises. The 2008 crisis exposed countries to a powerful “suddenstop” reminiscent of emerging market crises even if, in the case of the euro, most ofthese transactions are in the local currency. The second crisis, on the other hand, caused
123

The national segmentation of euro area bank balance sheets… 261
a crisis of confidence in the single currency itself (the so-called “redenomination risk”)which induced banks to invest in their own sovereigns.
TheECBwas successful in facing thefirstwaveof nationalisationwhich affected theinter-bankmarket by replacing, viaTARGET2, euro area non-domestic transaction andmanaged in this way to support retail lending activity (see Peersman 2011; Giannoneet al. 2012a, b, for a quantitative assessment on this point). The second wave of marketre-segmentation in the sovereign debt market was linked to a crisis of confidence in thecurrency itself. This proved harder to combat with the tools available to the ECB at thetime. Although sovereign spreads markedly decreased after the announcement in 2012that the central bank was ready to implement Outright Monetary Transactions (OMT),the home bias in the sovereign market has persisted, as has the correlation of riskbetween banks and sovereign. In this situation, loans collapsed more than what wouldhave been expected given cyclical conditions. Facing this problem would require thefull implementation of a banking union and the institution of a resolution mechanismfor debt crises.
4 Discussion and conclusions
An important message of our paper is to emphasise that the European experienceof the financial crisis has two distinct phases, which coincide with the timing of the“double-dip” recessions in economic activity. This contrasts with the experience inother areas, such as the USA or the UK, where the financial crisis following the failureof Lehman was the single, definitive event.
Financial fragmentation is central to both phases of the crisis in the euro area, buttakes different forms during the two episodes. The initial “sudden stop” following thefailure of Lehman was associated with a drying up of cross-border bank wholesalefunding (on the liability side of banks’ balance sheets), which led to private fundingbecomingoverwhelmingly domestic. The drying upof cross-border inter-bank fundingwas not solely or mainly from sources outside the euro area: intra-euro area cross-border wholesale flows also seized up. It was only during the second phase of theeuro area crisis from late 2010—at which point governments were (in some cases)calledupon to support bankswhile domestic banks increased their holdings of domesticsovereign debt as foreign investors withdrew—that amore vicious interaction betweenbank and sovereign balance sheets emerged.
From the policy perspective, the distinction between these two phases of the crisisbegs an important question. Liquidity and bank funding measures taken to address thefirst phase may have enabled bank behaviour—notably an accumulation of domesticsovereign debt—that, through exacerbating the “diabolic loop”, deepened the secondphase. Of course, that is not to say these measures should not have been implemented:without them, a catastrophic financial collapse threatened immediately post-Lehman.But the experience demonstrates that crisis measures, although necessary, need to becomplemented by longer-term structural efforts to deal with the underlying problems.Arguably it was the failure to use the time bought by the ECB’s post-Lehman crisisresponse to implement deeper regulatory and governance reforms in the euro area (in
123

262 A. Colangelo et al.
general, and in the European banking system in particular) that laid the basis for thesecond phase of the crisis.
Data annex
Our dataset includes 22 bank balance sheet variables and 12 macroeconomic andfinancial variables of the euro area. All variables are available at themonthly frequencyand the sample ranges from January 1999 to October 2015. The bank balance sheetseries are from the dataset on Monetary Financial Institutions (MFIs) balance sheetstatistics compiled by the European Central Bank. The macroeconomic and financialblock of the database consists of variables drawn from the Statistical Data Warehouseof the European Central Bank.
As regards the balance sheet data, the aggregations we use in the data analysis areconstructed from the main instrument categories, by grouping sectors of the coun-terparties to yield information on MFI positions vis-à-vis euro area residents, andspecifically the Eurosystem, other MFIs, financial corporations other than MFIs, thegovernment sector, firms and households, and the rest of the world. Special atten-tion is paid to the so-called euro area wholesale lending market, which is definedas the lending market where MFIs operate along with financial intermediaries otherthan MFIs. Those consist of insurance corporations, pension funds, non-MMF invest-ment funds, other financial intermediaries (including captive financial institutions andmoney lenders) and financial auxiliaries.
In addition, MFI balance sheet statistics allow the split between intra-euro areadomestic and cross-border positions, and we take these breakdowns into account whenstudying inter-MFI positions.With this respect it is worth stressing that the operationalframework of the Eurosystem provides that monetary policy operations are alwaysconducted via the relevant NCB; the resulting positions are thus to be considered, bydefinition, domestic.
When analysing developments in MFI loans to firms and households, we also takeinto account the impact of loan securitisation (and other loan transfers) onMFI balancesheets.7
On this basis, the variables employed in the empirical analysis in the main text are:Bank assets
• Loans to euro area firms and households• Loans to euro area government• Deposit and loan claims on the Eurosystem• Domestic loans to MFIs• Intra-euro area cross-border loans to MFIs• Other euro area wholesale loans (This series covers both domestic and intra-euroarea cross-border positions vis-à-vis insurance corporations, pension funds, non-
7 While loans to other counterparties can also be object of securitisation activities, these are not reflected inthe paper as they are assumed to have lower magnitude compared to the impact securitisation has on loansto non-financial sectors.
123

The national segmentation of euro area bank balance sheets… 263
MMF investment funds, other financial intermediaries (including captive financialinstitutions and money lenders) and financial auxiliaries.)
• Loans to non-euro area residents• Domestic holdings of government debt securities• Intra-euro area cross-border holdings of government debt securities• Holdings of euro area MFI securities• Holding of securities issued by the euro area private sector• Holdings of debt securities issued by non-euro area residents• Holdings of equity issued by non-euro area residents• Remaining assets
Bank liabilities
• Deposits of euro area firms and households• Deposits of euro area government• Deposit and loan liabilities to the Eurosystem• Domestic deposits from MFIs• Intra-euro area cross-border deposits from MFIs• Other euro area wholesale deposits (This series includes deposits and loan liabil-ities of euro area MFIs (excluding the Eurosystem) vis-à-vis euro area financialintermediaries other than MFIs, i.e. insurance corporations, pension funds, non-MMF investment funds, other financial intermediaries and financial auxiliaries.Long-term deposits vis-a-vis FVCs are however excluded from our exercise asthey are usually fictionally imputed to the MFI balance sheet as a balancing lia-bility when loan securitisation activities (or other loan sales) do not result in thede-recognition of the assets).
• Deposits from non-euro area residents• Debt securities issued
The macroeconomic and financial block
• Industrial production (euro area)• Harmonised Index of Consumer prices (euro area), HICP• Unemployment rate (euro area)• Producer price index (euro area), PPI• 3-month Euribor rates (euro area)• Industrial production (US)• Consumer price index (US), CPI• Federal Funds rate (US)• DJ Eurostoxx (stock prices)• Sovereign bond yields, 2 years maturity (euro area)• Sovereign bond yields, 5 years maturity (euro area)• Sovereign bond yields, 10 years maturity (euro area)
The data enter the VAR model in annual log levels (i.e. 12*log) except the rates (i.e.the Euribor, the Federal Funds rate, the sovereign bond yields and the unemploymentrate) which enter the model in levels.
More details on the construction of the data series are available in theweb appendix.
123

264 A. Colangelo et al.
References
Abbassi P, Bräuning F, Fecht F, Peydró JL (2015) Cross-border liquidity, relationships and monetary policy:evidence from the Euro area interbank crisis. CEPR discussion papers 10479
Abbassi P, Fecht F, Weber P (2013) How stressed are banks in the interbank market?. Deutsche Bundesbankdiscussion paper no. 40/2013
Acharya VV, Steffen S (2015) The greatest carry trade ever? Understanding Eurozone bank risks. J FinancIntermed 115:215–236
Angelini P, Grande G, Panetta F (2014) The negative feedback loop between banks and sovereigns. Bancad’Italia occasional paper no. 213
Banbura M, Giannone D, Reichlin L (2010) Large Bayesian VARs. J. Appl Econ 25:71–92Banbura M, Giannone D, Lenza M (2015) Conditional forecasts and scenario analysis with vector autore-
gressions for large cross-sections. Int J Forecast 31(3):739–756Battistini N, Pagano M, Simonelli S (2013) Systemic risk, sovereign yields and bank exposures in the euro
crisis. CSEF University of Naples, NaplesBecker B, Ivashina V (2014) Financial repression in the European sovereign debt crisis. Swedish House of
Finance research paper no. 14-13Bindseil U, Cour-Thimann P, König P (2012) Target2 and cross-border interbank payments during the
financial crisis. CESifo Forum, Ifo Institute - Leibniz Institute for Economic Research at the Universityof Munich, vol 13 (SPECIALIS), pp 83–92, 02
Caballero RJ (2009) Sudden financial arrest. IMF Mundell-Flemming lecture, MIT Department of Eco-nomics working paper no. 09-29
Calvo GA, Reinhart C (2000) When capital inflows come to a sudden stop: consequences and policyoptions. In: Kenen P, Swoboda A (eds) Reforming the international monetary and financial system.International Monetary Fund, Washington, pp 214–265
Carter CK, Kohn R (1994) On Gibbs sampling for state-space models. Biometrika 81:541–553Colangelo A, Lenza M (2012) Cross-border banking transactions in the euro area. IFC Bull 36:518–531De Mol C, Giannone D, Reichlin L (2008) Forecasting using a large number of predictors: is Bayesian
shrinkage a valid alternative to principal components? J Econ 146(2):318–328 (Elsevier)Doan T, Litterman R, Sims CA (1984) Forecasting and conditional projection using realistic prior distribu-
tions. Econ Rev 3:1–100ECB (2014) The determinants of euro area sovereign bond yield spreads during the crisis. Monthly Bulletin
Article, pp 67–83Garcia-de-Andoain C, Hoffmann P, Manganelli S (2014) Fragmentation in the Euro overnight unsecured
money market. Econ Lett 125(2):298–302Garicano L, Reichlin L (2014) A safe asset for Eurozone QE: A proposal. http://www.voxeu.org/article/
safe-asset-eurozone-qe-proposalGiannone D, Lenza M, Pill H, Reichlin L (2012a) The ECB and the interbank market. Econ J 122:467–486Giannone D, Lenza M, Reichlin L (2012b) Money, credit, monetary policy and the business cycle in the
Euro area. Working papers ECARES ECARES 2012-008, ULB—Universite Libre de BruxellesGiannone D, Lenza M, Primiceri G (2015) Prior selection for vector autoregressions. Rev Econ Stat
97(2):436–451Hartmann P, Maddaloni A, Manganelli S (2003) The euro area financial system: structure, integration and
policy initiatives. ECB working paper no. 230Heider F, Hoerova M, Holthausen C (2009) Liquidity hoarding and interbank market spreads: the role of
counterparty risk. ECB work paper no. 1126Lenza M, Pill H, Reichlin L (2010) Monetary policy in exceptional times. Econ Policy 62:295–339Litterman R (1979) Techniques of forecasting using vector autoregressions. Federal reserve of minneapolis
working paper 115McKinnonRI, PillH (1997)Credible economic liberalizations andoverborrowing.AmEconRev87(2):189–
193McKinnon RI, Pill H (1998) The overborrowing syndrome: are East Asian economies different? In: Glick R
(ed)Managing capital flows and exchange rates: lessons from the Pacific Basin. Cambridge UniversityPress, Cambridge, pp 322–355
Peersman G (2011) Macroeconomic effects of unconventional monetary policy in the euro area. CEPRdiscussion paper no. 8348
123

The national segmentation of euro area bank balance sheets… 265
Reichlin L (2014) Monetary policy and banks in the euro area: the tale of two crises. J Macroecon 39:387–400
Reinhardt D, Riddiough SJ (2014) The two faces of cross-border banking flows: an investigation into thelinks between global risk, arms-length funding and internal capital markets. Bank of England workingpaper 498
123