the mutual fund house star fund house of debt fund house · the mutual fund house of the year -...
TRANSCRIPT

The Mutual Fund House of the Year - 2007 & 2008Awarded by CNBC TV18 CRISIL4 fund houses were eligible out of a universe of 26. Period: 4 quarterly CPRs in 2007.3 fund houses were eligible out of a universe of 27. Period: 4 quarterly CPRs in 2008.
Star Fund House of the Year - Debt Awarded by ICRA Mutual Fund Awards 200924 fund houses were eligible. Period: 1 year ended 31-Dec-08
Best Group – Mixed Assets Category Awarded by Lipper Awards India 200912 fund houses were eligible. Period: 3 years (2005-2008)
Debt Fund House of the Year Awarded by CNBC TV18 CRISIL 27 fund houses were eligible. Period: 4 quarterly CPRs in 2008.
Past performance is no guarantee of future results. For award methodology and further details refer page 50.
Mutual Fund investments are subject to market risks. Please read the Statement of
Additional Information / Scheme Information Document carefully before investing.
Call 1-800-270-7000 (toll-free) | Visit www.birlasunlife.com sms GAIN to 56161
S e p t e m b e r 2 0 0 9
03
S e p t e m b e r 2 0 0 9Asset Allocation Guide
Asset Allocation guide:
How it works?
“Aggressive”
This Asset Allocation guide helps you decide your broad
allocation to equities at different market levels. The
adjustment as per the recommended asset allocation may be
done on a six monthly basis or whenever you review your
portfolio.
Lets see how it will help you in your wealth creation goals with
the help of an illustration below.
Assuming you are an investor lets see how the
allocation guide will work
Recommended Equity Asset Allocation at different market conditions for different types of investors
Aggressive Moderate Conservative
Expensive 50%-60% 30%-40% 0-10%
Fair 60%-70% 40%-50% 10%-20%
Discounted 70%-80% 50%-60% 20%-30%
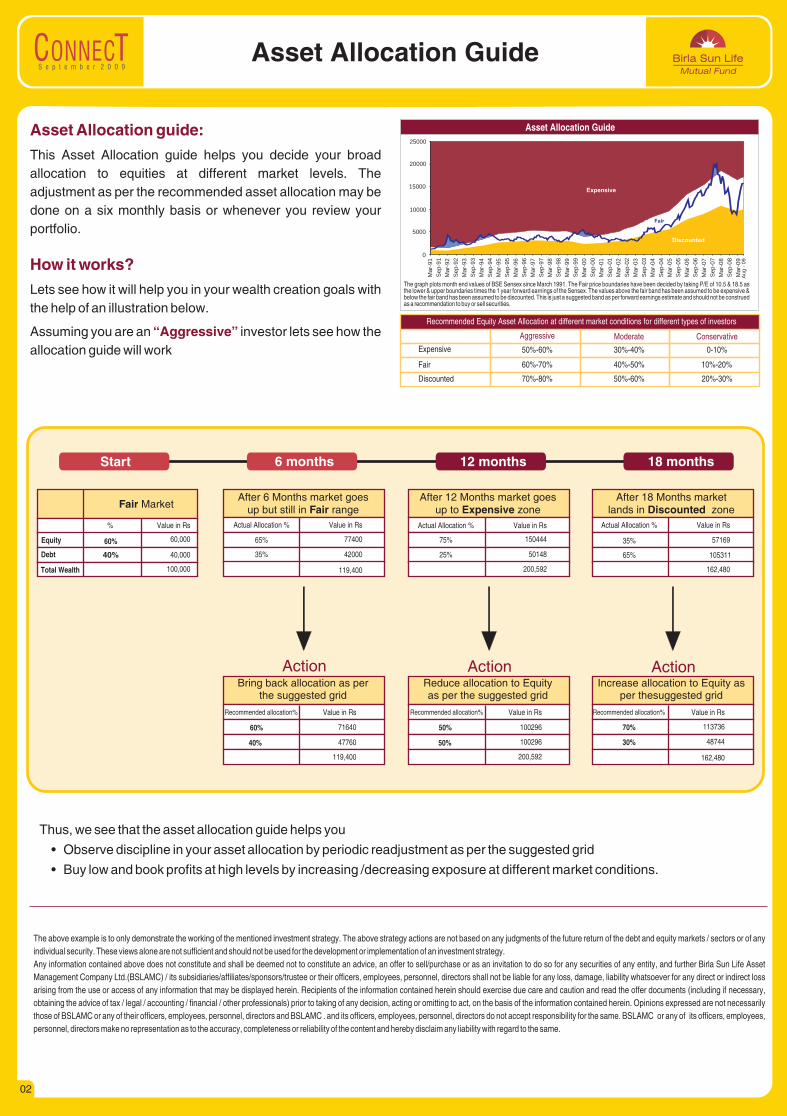
Asset Allocation Guide
The graph plots month end values of BSE Sensex since March 1991. The Fair price boundaries have been decided by taking P/E of 10.5 & 18.5 as the lower & upper boundaries times the 1 year forward earnings of the Sensex. The values above the fair band has been assumed to be expensive & below the fair band has been assumed to be discounted. This is just a suggested band as per forward earnings estimate and should not be construed as a recommendation to buy or sell securities.
Start 6 months 12 months 18 months
% Value in Rs Actual Allocation % Actual Allocation %Value in Rs Value in Rs
Equity 60% 60,000 65% 77400 75% 150444
Debt 40% 40,000 35% 42000 25% 50148
Total Wealth 100,000 119,400 200,592
Fair MarketAfter 6 Months market goes
up but still in Fair range
Action
Value in RsRecommended a llocation%
60% 71640
40% 47760
119,400
Bring back allocation as perthe suggested grid
After 12 Months market up to Expensive zone
goes
Actual Allocation % Value in Rs
35% 57169
65% 105311
162,480
After 18 Months marketlands in Discounted zone
Action
Value in RsRecommended a llocation%
70% 113736
30% 48744
162,480
Increase allocation to per thesuggested grid
Equity as
Action
Value in RsRecommended a llocation%
50% 100296
50% 100296
200,592
Reduce allocation to Equityas per the suggested grid
Thus, we see that the asset allocation guide helps you
• Observe discipline in your asset allocation by periodic readjustment as per the suggested grid
• Buy low and book profits at high levels by increasing /decreasing exposure at different market conditions.
The above example is to only demonstrate the working of the mentioned investment strategy. The above strategy actions are not based on any judgments of the future return of the debt and equity markets / sectors or of any
individual security. These views alone are not sufficient and should not be used for the development or implementation of an investment strategy.
Any information contained above does not constitute and shall be deemed not to constitute an advice, an offer to sell/purchase or as an invitation to do so for any securities of any entity, and further Birla Sun Life Asset
Management Company Ltd.(BSLAMC) / its subsidiaries/affiliates/sponsors/trustee or their officers, employees, personnel, directors shall not be liable for any loss, damage, liability whatsoever for any direct or indirect loss
arising from the use or access of any information that may be displayed herein. Recipients of the information contained herein should exercise due care and caution and read the offer documents (including if necessary,
obtaining the advice of tax / legal / accounting / financial / other professionals) prior to taking of any decision, acting or omitting to act, on the basis of the information contained herein. Opinions expressed are not necessarily
those of BSLAMC or any of their officers, employees, personnel, directors and BSLAMC . and its officers, employees, personnel, directors do not accept responsibility for the same. BSLAMC or any of its officers, employees,
personnel, directors make no representation as to the accuracy, completeness or reliability of the content and hereby disclaim any liability with regard to the same.
02
0
5000
10000
15000
20000
25000
Ma
r-9
1
Se
p-9
1
Ma
r-9
2
Se
p-9
2
Ma
r-9
3
Se
p-9
3
Ma
r-9
4
Se
p-9
4
Ma
r-9
5
Se
p-9
5
Ma
r-9
6
Se
p-9
6
Ma
r-9
7
Se
p-9
7
Ma
r-9
8
Se
p-9
8
Ma
r-9
9
Se
p-9
9
Ma
r-0
0
Se
p-0
0
Ma
r-0
1
Se
p-0
1
Ma
r-0
2
Se
p-0
2
Ma
r-0
3
Se
p-0
3
Ma
r-0
4
Se
p-0
4
Ma
r-0
5
Se
p-0
5
Ma
r-0
6
Se
p-0
6
Ma
r-0
7
Se
p-0
7
Ma
r-0
8
Se
p-0
8
Ma
r-0
9A
ug
- 0
9
Expensive
Fair
Discounted

S e p t e m b e r 2 0 0 9From the CEO’s Desk
Dear Partner,
I would like to start by wishing you and your loved ones a very happy Festive season. At Birla Sun Life Mutual Fund,
it has been our privilege to be associated with you and I wanted to share through this note an update on our
organization.
I am pleased to share with you that Birla Sun Life Mutual Fund has continued its strong march into the new financial
year 2009-10. Since 31 March 2009, we have grown our average AUM from Rs. 47,111 crores to Rs. 62,884
crores in 31 August 2009 registering a strong 33% growth placing us as a strong number 5 within the
industry.
A key reason for this performance has been our partnership and our strong investment performance, which has
helped us become the preferred choice for investors. Birla Sun Life Frontline Equity Fund,
Midcap fund and MIP II Savings 5 Plan continue to be amongst the leading performers in their
respective categories and have delivered superlative performance. Infact we are the fund house with maximum
number of 4 and 5 star rated schemes as per Value Research as of August 31, 2009
This performance has also resulted in strong external recognition in India :
• CNBC TV18 CRISIL ‘Mutual Fund House of the Year’ award 2007 & 2008, two times in a row, creating history
in the Indian Mutual Fund Industry
ICRA Mutual Fund Awards 2009
• Best Group - Mixed Asset Category by Lipper Awards India 2009
We at Birla Sun Life Mutual Fund are committed to focusing on innovative products, superlative investment
performance and enhancing our relationship further. We seek your continued support and look forward to a strong
association with you and together we shall cross new milestones.
Warm Regards,
A Balasubramanian
Chief Executive Officer & Chief Investment Officer
Birla Sun Life Asset Management Company Ltd
Birla Sun Life
Birla Sun Life
• Star Fund House of the Year - Debt by
Past performance is no guarantee of future results. For detailed award methodology please refer page 50
03

03
Market OutlookS e p t e m b e r 2 0 0 9
Equity Market
Debt Market
Bonds slump under heavy borrowing; liquidity outlook unenthusiastic... Government bonds wilted to the year's lowest levels under the sheer pressure
of the large pipeline of government borrowing. Despite ample liquidity in the
banking system, shorter segment yields rose on concerns of inflation picking up
later in the year. The ample liquidity, sporadic 2-way boost from overseas cues
like US yields, commodity prices and comments from several policymakers
impacted the markets from time to time. The 10-year benchmark yield climbed
to a 9-1/2 month high, reflecting market concerns about the record borrowing
and rising inflation, which has pushed the yields up by 75 bps since the plan was
unveiled in July. The benchmark yield rose 40 bps in August and is up 217 bps
from January 1, 2009.
OMO disappoints traders; RBI action eyed for support...The RBI's bond buyback program appears to have failed in its objective to rein
in yields and the market expected the bank to take more supportive steps to
successfully execute the government's record borrowing program. The choice
of several illiquid bonds for the OMO auctions also has tuned off banks from
participation. Higher yields for longer-dated bonds also appeared to have
rubbed off at the shorter end of the curve, as reflected by the rise in the T-bill
rates (were up 30 bps since July lows). The spread between the 1-year and 10-
year benchmark yield narrowed to 276 bps from record highs of 326 bps. In the
non-SLR segment, AAA 5-year corporate bond yield jumped 30 bps, pressured
by the heavy debt supplies and worries over RBI's potential liquidity tightening
measures in the coming months. Credit spread narrowed due to a sharper rise
Our Investment Team (In alphabetical order)
exceeded the disinvestment target set in the Union Budget 2009-10.
While the long-medium term outlook looks quite rosy, over the next 3-6 months investors must watch out for potential deterioration of fiscal situation and rapid rise in inflation. These developments could put pressure on interest rates and may slow investments by private sector. However, we believe that this would be transient in nature unless global environment turns unfavourable. Indian economy's underinvested nature offers substantially higher returns on investment and hence has the ability to attract capital.
Just to conclude, we remain positive on India's growth outlook and consequently on future returns from equity. However, large part of this return would emanate from careful filtering and stock selection in contrast to valuation re-rating. It means investors must select companies that would be future leaders; companies that are investing to build productive assets, to enhance production capacities and into building scale.
Our Way forwardWhile the long-medium term outlook looks quite rosy, over the next 3-6 months investors must watch out for potential deterioration of fiscal situation and rapid rise in inflation. These developments could put pressure on interest rates and may slow investments by private sector. However, we believe that this would be transient in nature unless global environment turns unfavourable. Indian economy's underinvested nature offers substantially higher returns on investment and hence has the ability to attract capital.
Just to conclude, we remain positive on India's growth outlook and consequently on future returns from equity. However, large part of this return would emanate from careful filtering and stock selection in contrast to valuation re-rating. It means investors must select companies that would be future leaders; companies that are investing to build productive assets, to enhance production capacities and into building scale.
in government bond yields.
Though liquidity remained a prominent support for bonds, trades had started to
express doubts beyond the short-term, in view of the inflationary expectations
going up. Additionally, 25% below average rainfall this season impacted prices
of primary articles with the annual consumer price inflation rate rising to
11.89%, even though it has not yet factored in the August prices. The RBI in its
annual policy highlighted concerns on the price stability and the impact of loose
monetary policy on inflation expectations. On the other hand, the overall
economic outlook still exhibits signs of weakness with the manufacturing
activity expanding at a slower pace.
OutlookFears of reversal of accommodative monetary policy to quell inflation will keep
the bonds markets volatile. The sentiment going forward is more likely to be
governed by the domestic leads while overseas cues could add some
occasional volatility. Markets are looking forward to signals from the RBI in the
upcoming policy. Markets are also keenly awaiting the release of the calendar
for second half borrowing. Though going forward a reduced size of borrowing
as well as an improving economy, which may favorably impact the government
finances, are some positives that are currently not factored in the prices. We
feel that the yields have currently reached the top and may not deteriorate any
further in the absence of any negative news and consequently Gilt funds may
outperform in the months to come.
A. Balasubramanian Chief Investment Officer
Achala Kanitkar Research Analyst : Equity
Ajay Argal Co-Head : Equity
Ajay Garg Fund Manager : Equity
Ankit Sancheti Fund Manager/ Research Analyst : Equity
Atul Penkar Fund Manager/ Research Analyst : Equity
Chanchal Khandelwal Research Analyst : Equity
Dipika Chheda Research Analyst : Equity
Hemang Dagli Sr. Dealer / Fund Manager
Kaustubh Gupta Fund Manager : Fixed Income
Lokesh Mallya Research Analyst : Fixed Income
Mahesh Patil Co-Head : Equity
Maneesh Dangi Head : Fixed Income
Merlyn Joseph Research Analyst : Equity
Nishit Dholakia Fund Manager : Equity
Paresh Khandelwal Research Analyst : Equity
Equity
Indian stock markets were flat over last month, with both the Sensex and the Nifty showing virtually no change. However, sector performance diverged significantly with Real Estate (12.9%), IT (5.3%) and Capital Goods (4.4%) leading returns and with FMCG (-6.7%) and Banking (-1.4%) lagging behind.
Institutional flows continued to be positive for market over the month which reflects the appetite for Indian equities. FII inflows continued into August with net purchases aggregating US$ 1,008 million. Mutual funds also continued with buying trend and purchased Rs. 570 Crs worth of stocks, net.
Evidence of a global recovery is piling up. Recent releases of leading economic indicators like the US ISM Manufacturing Index, German IFO Business Expectations Survey, UK Manufacturing PMI and Japan Manufacturing PMI have all shown expansionary readings. As we have earlier reasoned, these economies are likely to have significant sequential growth. This in turn would lead to increased capacity utilization, improved operating leverage and profitability. It would augur well for companies providing goods or services to western world businesses. This category would include IT, Travel and Hotel sectors.
At domestic front also recently published data indicates revival in economic activity. According to Quick Estimates (QE) by the CSO, GDP for Q1-FY09 registered a growth of 6.1%; the IIP for the month of July'09 also rose 7.8%. While the initial releases of more timely data in form of Auto sales and Cement Dispatches etc. are also upbeat.
Our policy makers have taken proactive steps in terms of providing timely monetary and fiscal stimulus to the economy. The government is focused on equitable growth and infrastructure building. This is likely to help domestic consumption and construction related segments. Furthermore, the policymakers have started sending out right signals about their commitment reforms which is reflected in the new Draft Tax Code, NHPC IPO and the imminent IPO of Oil India Limited. In fact, the government has already
Prasad Dhonde Fund Manager / Dealer : Fixed Income
Sanjay Chawla Fund Manager : Equity
Satyabrata Mohanty Head : Mixed Assets
Shaktie Prakash Fund Manager / Dealer : Fixed Income
Sujit Patki Dealer : Equity
Sunaina Da cunha Fund Manager / Research Analyst : Fixed Income
Vineet Maloo Fund Manager/ Research Analyst : Equity
04
S e p t e m b e r 2 0 0 9
Fund Details
Fund Manager :Managing Fund Since : October 01, 2006Total Experience : 20 yearsDate of inception : August 27, 1998Nature of the scheme : An Open-ended Growth Scheme
Default option : Dividend ReinvestmentFresh Purchase : Rs. 5000/-Additional Purchase : Rs. 1000/-Redemption Cheques : Within 10 working days issuedSystematic Investment : Available Plan (SIP)Systematic Withdrawal : Available Plan (SWP)Systematic Transfer : AvailablePlan (STP)
Dividend : 69.73( )Growth : 216.34
Benchmark : BSE 200Average AUM : Rs. 1,147.94 Crores
Entry Load : Nil
Exit Load** : 1% if redeemed / switched out within 365 days from the date of allotment**Exit / Entry Load is NIL for units issued in Bonus & Dividend Reinvestment.
Standard Deviation : 37.23%##Sharpe Ratio : 0.28
Beta : 0.94
Mr. Mahesh Patil
Payout, Reinvestment & Sweep
Key Features
Plans / Options & NAV
Load Structure (Incl for SIP)
Other Parameter
(as on August 31, 2009)
Note: Standard Deviation, Sharpe Ratio & Beta are calculated on Annualised basis using 3 years history of monthly returns, source: MFI Explorer##Risk-free rate assumed to be 3.38%(91 day T-bill yield as on August 31, 2009)
Value Blend Growth Size
Large
Mid
Small
Investment Style
Investment Style Box
As on August 31, 2009
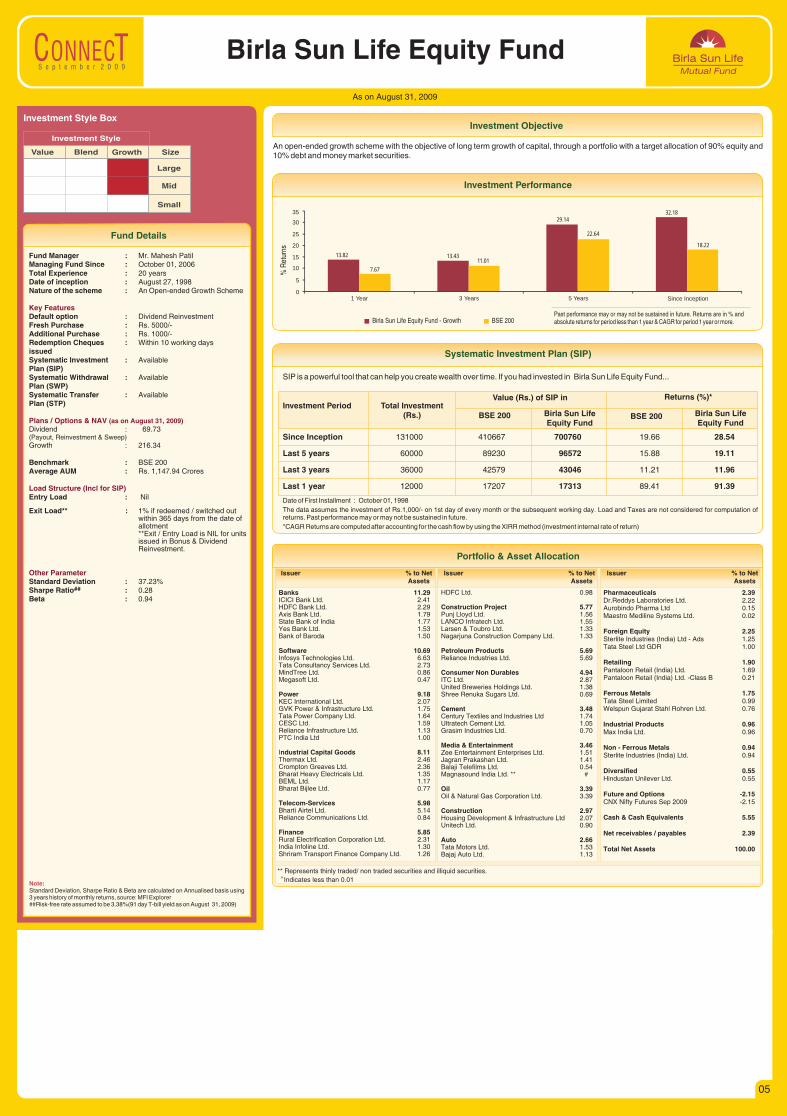
An open-ended growth scheme with the objective of long term growth of capital, through a portfolio with a target allocation of 90% equity and 10% debt and money market securities.
Investment Objective
Banks 11.29ICICI Bank Ltd. 2.41HDFC Bank Ltd. 2.29Axis Bank Ltd. 1.79State Bank of India 1.77Yes Bank Ltd. 1.53Bank of Baroda 1.50
Software 10.69Infosys Technologies Ltd. 6.63Tata Consultancy Services Ltd. 2.73MindTree Ltd. 0.86Megasoft Ltd. 0.47
Power 9.18KEC International Ltd. 2.07GVK Power & Infrastructure Ltd. 1.75Tata Power Company Ltd. 1.64CESC Ltd. 1.59Reliance Infrastructure Ltd. 1.13PTC India Ltd 1.00
Industrial Capital Goods 8.11Thermax Ltd. 2.46Crompton Greaves Ltd. 2.36Bharat Heavy Electricals Ltd. 1.35BEML Ltd. 1.17Bharat Bijlee Ltd. 0.77
Telecom-Services 5.98Bharti Airtel Ltd. 5.14Reliance Communications Ltd. 0.84
Finance 5.85Rural Electrification Corporation Ltd. 2.31India Infoline Ltd. 1.30Shriram Transport Finance Company Ltd. 1.26
HDFC Ltd. 0.98
Construction Project 5.77Punj Lloyd Ltd. 1.56LANCO Infratech Ltd. 1.55Larsen & Toubro Ltd. 1.33Nagarjuna Construction Company Ltd. 1.33
Petroleum Products 5.69Reliance Industries Ltd. 5.69
Consumer Non Durables 4.94ITC Ltd. 2.87United Breweries Holdings Ltd. 1.38Shree Renuka Sugars Ltd. 0.69
Cement 3.48Century Textiles and Industries Ltd 1.74Ultratech Cement Ltd. 1.05Grasim Industries Ltd. 0.70
Media & Entertainment 3.46Zee Entertainment Enterprises Ltd. 1.51Jagran Prakashan Ltd. 1.41Balaji Telefilms Ltd. 0.54Magnasound India Ltd. ** #
Oil 3.39Oil & Natural Gas Corporation Ltd. 3.39
Construction 2.97Housing Development & Infrastructure Ltd 2.07Unitech Ltd. 0.90
Auto 2.66Tata Motors Ltd. 1.53Bajaj Auto Ltd. 1.13
Pharmaceuticals 2.39Dr.Reddys Laboratories Ltd. 2.22Aurobindo Pharma Ltd 0.15Maestro Mediline Systems Ltd. 0.02
Foreign Equity 2.25Sterlite Industries (India) Ltd - Ads 1.25Tata Steel Ltd GDR 1.00
Retailing 1.90Pantaloon Retail (India) Ltd. 1.69Pantaloon Retail (India) Ltd. -Class B 0.21
Ferrous Metals 1.75Tata Steel Limited 0.99Welspun Gujarat Stahl Rohren Ltd. 0.76
Industrial Products 0.96Max India Ltd. 0.96
Non - Ferrous Metals 0.94Sterlite Industries (India) Ltd. 0.94
Diversified 0.55Hindustan Unilever Ltd. 0.55
Future and Options -2.15CNX Nifty Futures Sep 2009 -2.15
Cash & Cash Equivalents 5.55
Net receivables / payables 2.39
Total Net Assets 100.00
Issuer % to NetAssets
Issuer % to NetAssets
Issuer % to NetAssets
Portfolio & Asset Allocation
** Represents thinly traded/ non traded securities and illiquid securities. # Indicates less than 0.01
Systematic Investment Plan (SIP)
SIP is a powerful tool that can help you create wealth over time. If you had invested in Birla Sun Life Equity Fund...
Date of First Installment : October 01, 1998
The data assumes the investment of Rs.1,000/- on 1st day of every month or the subsequent working day. Load and Taxes are not considered for computation of returns. Past performance may or may not be sustained in future.
*CAGR Returns are computed after accounting for the cash flow by using the XIRR method (investment internal rate of return)
Since Inception 131000 410667 700760 19.66 28.54
Last 5 years 60000 89230 96572 15.88 19.11
Last 3 years 36000 42579 43046 11.21 11.96
Last 1 year 12000 17207 17313 89.41 91.39
Investment Period Total Investment (Rs.) Birla Sun Life
Equity FundBirla Sun Life Equity Fund
BSE 200 BSE 200
Value (Rs.) of SIP in Returns (%)*
Birla Sun Life Equity Fund - Growth BSE 200
% R
etur
ns
Past performance may or may not be sustained in future. Returns are in % and absolute returns for period less than 1 year & CAGR for period 1 year or more.
Investment Performance
Birla Sun Life Equity Fund
13.82 13.43
29.1432.18
7.67
11.01
22.64
18.22
0
5
10
15
20
25
30
35
1 Year 3 Years 5 Years Since Inception
05
S e p t e m b e r 2 0 0 9
Fund Details
As on August 31, 2009
Investment Objective
Birla Sun Life Midcap Fund
Value Blend Growth Size
Large
Mid
Small
Investment Style
Investment Style Box
Fund Manager :Managing Fund Since : September 12,2007Total Experience : 20 YearsDate of inception : October 03, 2002Nature of the scheme : An Open-ended Growth Scheme
Default option : Plan A/Dividend ReinvestmentPlan AFresh Purchase : Rs. 5000/-Additional Purchase : Rs. 1000/-Plan BFresh Purchase : Rs. 2,00,000/-Additional Purchase : Rs. 1000/-Redemption Cheques : Within 10 working days issuedSystematic Investment : Available Plan (SIP)Systematic Withdrawal : Available Plan (SWP)Systematic Transfer : AvailablePlan (STP)
Plan ADividend : 22.78( )Growth : 87.90Plan B Dividend : 11.09(Payout, Reinvestment & Sweep)Growth : 11.09
Benchmark : CNX MidcapAverage AUM : Rs. 700.84 Crores
Entry Load : Nil
Exit Load** : 1% if redeemed / switched out within 365 days from the date of allotment**Exit / Entry Load is NIL for units issued in Bonus & Dividend Reinvestment.
Standard Deviation : 42.14%##Sharpe Ratio : 0.36
Beta : 0.94
Mr. Sanjay Chawla
Payout, Reinvestment & Sweep
Key Features
Plans / Options & NAV
Load Structure (Incl for SIP)
Other Parameter
(as on August 31, 2009)
Note: Standard Deviation, Sharpe Ratio & Beta are calculated on Annualised basis using 3 years history of monthly returns, source: MFI Explorer##Risk-free rate assumed to be 3.38%(91 day T-bill yield as on August 31, 2009)
(Past performance is no guarantee of future results.) for ranking methodology please refer page 50
CRISIL~CPR 2^^Birla Sun Life Midcap Fund
Small & Mid Equity Schemes ( Schemes), 2 21 Yrs ended 30-Jun-09
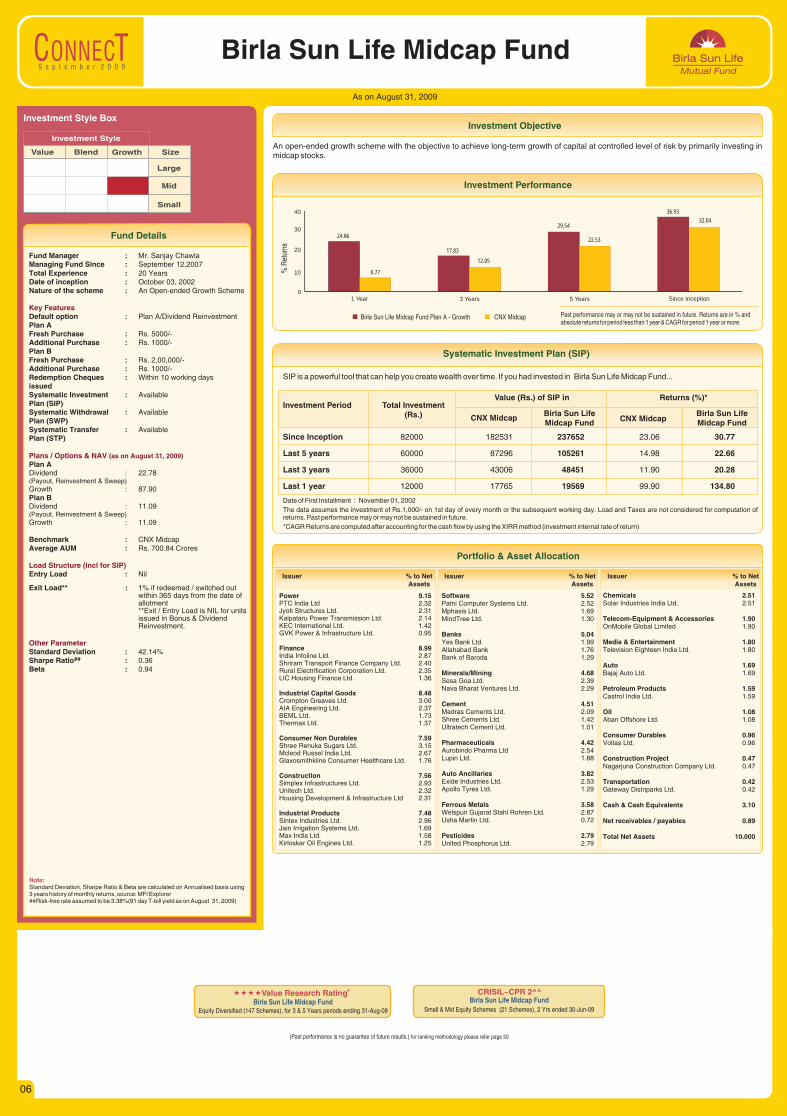
Investment Performance
Birla Sun Life Midcap Fund - GrowthPlan A CNX Midcap
% R
etur
ns
Past performance may or may not be sustained in future. Returns are in % and absolute returns for period less than 1 year & CAGR for period 1 year or more.
SIP is a powerful tool that can help you create wealth over time. If you had invested in Birla Sun Life Midcap Fund...
Systematic Investment Plan (SIP)
Date of First Installment : November 01, 2002
The data assumes the investment of Rs.1,000/- on 1st day of every month or the subsequent working day. Load and Taxes are not considered for computation of returns. Past performance may or may not be sustained in future.
*CAGR Returns are computed after accounting for the cash flow by using the XIRR method (investment internal rate of return)
Investment Period Total Investment (Rs.) Birla Sun Life
Midcap FundBirla Sun Life Midcap Fund
CNX Midcap CNX Midcap
Value (Rs.) of SIP in Returns (%)*
Since Inception 82000 182531 237652 23.06 30.77
Last 5 years 60000 87296 105261 14.98 22.66
Last 3 years 36000 43006 48451 11.90 20.28
Last 1 year 12000 17765 19569 99.90 134.80
Issuer % to NetAssets
Issuer % to NetAssets
Issuer % to NetAssets
Power 9.15PTC India Ltd 2.32Jyoti Structures Ltd. 2.31Kalpataru Power Transmission Ltd. 2.14KEC International Ltd. 1.42GVK Power & Infrastructure Ltd. 0.95
Finance 8.99India Infoline Ltd. 2.87Shriram Transport Finance Company Ltd. 2.40Rural Electrification Corporation Ltd. 2.35LIC Housing Finance Ltd. 1.36
Industrial Capital Goods 8.48Crompton Greaves Ltd. 3.00AIA Engineering Ltd. 2.37BEML Ltd. 1.73Thermax Ltd. 1.37
Consumer Non Durables 7.59Shree Renuka Sugars Ltd. 3.15Mcleod Russel India Ltd. 2.67Glaxosmithkline Consumer Healthcare Ltd. 1.76
Construction 7.56Simplex Infrastructures Ltd. 2.93Unitech Ltd. 2.32Housing Development & Infrastructure Ltd 2.31
Industrial Products 7.48Sintex Industries Ltd. 2.96Jain Irrigation Systems Ltd. 1.69Max India Ltd. 1.58Kirloskar Oil Engines Ltd. 1.25
Software 5.52Patni Computer Systems Ltd. 2.52Mphasis Ltd. 1.69MindTree Ltd. 1.30
Banks 5.04Yes Bank Ltd. 1.99Allahabad Bank 1.76Bank of Baroda 1.29
Minerals/Mining 4.68Sesa Goa Ltd. 2.39Nava Bharat Ventures Ltd. 2.29
Cement 4.51Madras Cements Ltd. 2.09Shree Cements Ltd. 1.42Ultratech Cement Ltd. 1.01
Pharmaceuticals 4.42Aurobindo Pharma Ltd 2.54Lupin Ltd. 1.88
Auto Ancillaries 3.82Exide Industries Ltd. 2.53Apollo Tyres Ltd. 1.29
Ferrous Metals 3.58Welspun Gujarat Stahl Rohren Ltd. 2.87Usha Martin Ltd. 0.72
Pesticides 2.79United Phosphorus Ltd. 2.79
Chemicals 2.51Solar Industries India Ltd. 2.51
Telecom-Equipment & Accessories 1.90OnMobile Global Limited 1.90
Media & Entertainment 1.80Television Eighteen India Ltd. 1.80
Auto 1.69Bajaj Auto Ltd. 1.69
Petroleum Products 1.59Castrol India Ltd. 1.59
Oil 1.08Aban Offshore Ltd. 1.08
Consumer Durables 0.96Voltas Ltd. 0.96
Construction Project 0.47Nagarjuna Construction Company Ltd. 0.47
Transportation 0.42Gateway Distriparks Ltd. 0.42
Cash & Cash Equivalents 3.10
Net receivables / payables 0.89
Total Net Assets 10.000
Portfolio & Asset Allocation
An open-ended growth scheme with the objective to achieve long-term growth of capital at controlled level of risk by primarily investing in midcap stocks.
«««« #Value Research RatingBirla Sun Life Midcap Fund
Equity Diversified (147 Schemes), for 3 & 5 Years periods ending 31-Aug-09
24.86
17.83
29.54
36.93
6.77
12.05
22.53
32.04
0
10
20
30
40
1 Year 3 Years 5 Years Since Inception
06
S e p t e m b e r 2 0 0 9
Fund Details
Investment Objective
Birla Sun Life Frontline Equity Fund
As on August 31, 2009
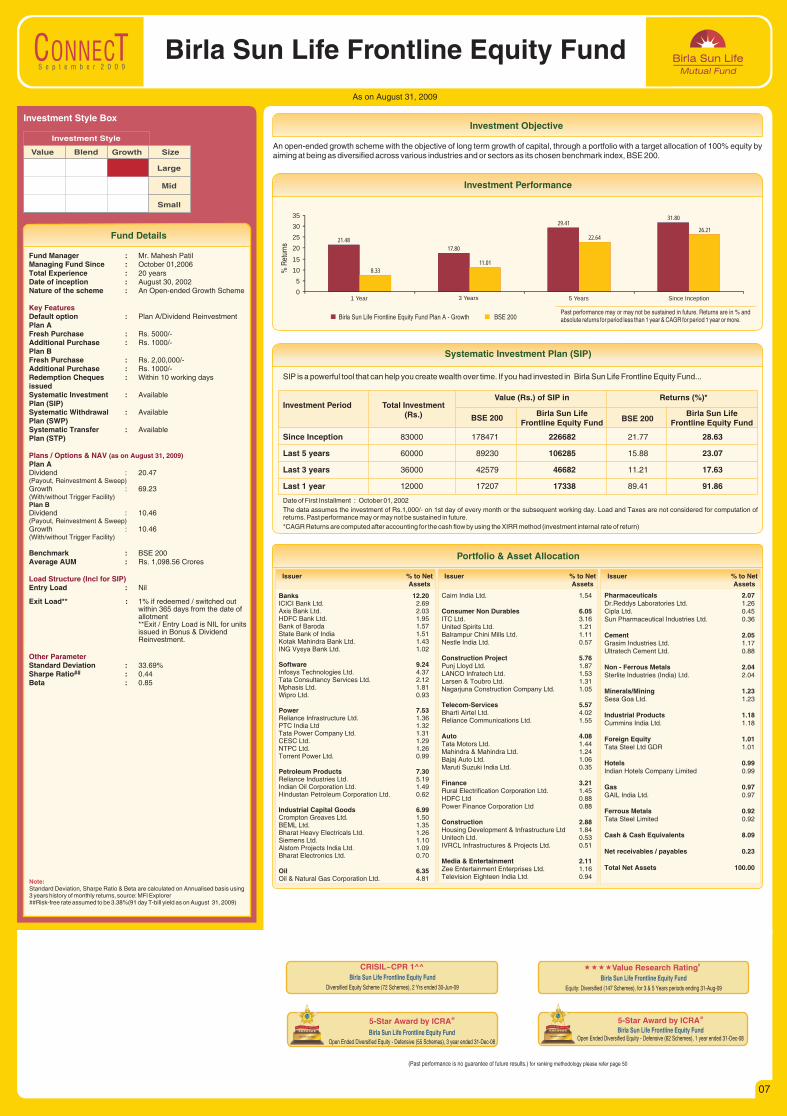
An open-ended growth scheme with the objective of long term growth of capital, through a portfolio with a target allocation of 100% equity by aiming at being as diversified across various industries and or sectors as its chosen benchmark index, BSE 200.
Investment Performance
Birla Sun Life Frontline Equity Fund Plan A - Growth BSE 200
% R
etur
ns
Past performance may or may not be sustained in future. Returns are in % and absolute returns for period less than 1 year & CAGR for period 1 year or more.
SIP is a powerful tool that can help you create wealth over time. If you had invested in Birla Sun Life Frontline Equity Fund...
Systematic Investment Plan (SIP)
Date of First Installment : October 01, 2002
The data assumes the investment of Rs.1,000/- on 1st day of every month or the subsequent working day. Load and Taxes are not considered for computation of returns. Past performance may or may not be sustained in future.
*CAGR Returns are computed after accounting for the cash flow by using the XIRR method (investment internal rate of return)
Investment Period Total Investment (Rs.) Birla Sun Life
Frontline Equity FundBirla Sun Life
Frontline Equity FundBSE 200 BSE 200
Value (Rs.) of SIP in Returns (%)*
Since Inception 83000 178471 226682 21.77 28.63
Last 5 years 60000 89230 106285 15.88 23.07
Last 3 years 36000 42579 46682 11.21 17.63
Last 1 year 12000 17207 17338 89.41 91.86
Issuer % to NetAssets
Issuer % to NetAssets
Issuer % to NetAssets
Banks 12.20ICICI Bank Ltd. 2.69Axis Bank Ltd. 2.03HDFC Bank Ltd. 1.95Bank of Baroda 1.57State Bank of India 1.51Kotak Mahindra Bank Ltd. 1.43ING Vysya Bank Ltd. 1.02
Software 9.24Infosys Technologies Ltd. 4.37Tata Consultancy Services Ltd. 2.12Mphasis Ltd. 1.81Wipro Ltd. 0.93
Power 7.53Reliance Infrastructure Ltd. 1.36PTC India Ltd 1.32Tata Power Company Ltd. 1.31CESC Ltd. 1.29NTPC Ltd. 1.26Torrent Power Ltd. 0.99
Petroleum Products 7.30Reliance Industries Ltd. 5.19Indian Oil Corporation Ltd. 1.49Hindustan Petroleum Corporation Ltd. 0.62
Industrial Capital Goods 6.99Crompton Greaves Ltd. 1.50BEML Ltd. 1.35Bharat Heavy Electricals Ltd. 1.26Siemens Ltd. 1.10Alstom Projects India Ltd. 1.09Bharat Electronics Ltd. 0.70
Oil 6.35Oil & Natural Gas Corporation Ltd. 4.81
Cairn India Ltd. 1.54
Consumer Non Durables 6.05ITC Ltd. 3.16United Spirits Ltd. 1.21Balrampur Chini Mills Ltd. 1.11Nestle India Ltd. 0.57
Construction Project 5.76Punj Lloyd Ltd. 1.87LANCO Infratech Ltd. 1.53Larsen & Toubro Ltd. 1.31Nagarjuna Construction Company Ltd. 1.05
Telecom-Services 5.57Bharti Airtel Ltd. 4.02Reliance Communications Ltd. 1.55
Auto 4.08Tata Motors Ltd. 1.44Mahindra & Mahindra Ltd. 1.24Bajaj Auto Ltd. 1.06Maruti Suzuki India Ltd. 0.35
Finance 3.21Rural Electrification Corporation Ltd. 1.45HDFC Ltd 0.88Power Finance Corporation Ltd 0.88
Construction 2.88Housing Development & Infrastructure Ltd 1.84Unitech Ltd. 0.53IVRCL Infrastructures & Projects Ltd. 0.51
Media & Entertainment 2.11Zee Entertainment Enterprises Ltd. 1.16Television Eighteen India Ltd. 0.94
Pharmaceuticals 2.07Dr.Reddys Laboratories Ltd. 1.26Cipla Ltd. 0.45Sun Pharmaceutical Industries Ltd. 0.36
Cement 2.05Grasim Industries Ltd. 1.17Ultratech Cement Ltd. 0.88
Non - Ferrous Metals 2.04Sterlite Industries (India) Ltd. 2.04
Minerals/Mining 1.23Sesa Goa Ltd. 1.23
Industrial Products 1.18Cummins India Ltd. 1.18
Foreign Equity 1.01Tata Steel Ltd GDR 1.01
Hotels 0.99Indian Hotels Company Limited 0.99
Gas 0.97GAIL India Ltd. 0.97
Ferrous Metals 0.92Tata Steel Limited 0.92
Cash & Cash Equivalents 8.09
Net receivables / payables 0.23
Total Net Assets 100.00
Portfolio & Asset Allocation
(Past performance is no guarantee of future results.) for ranking methodology please refer page 50
CRISIL~CPR 1^^Birla Sun Life Frontline Equity Fund
Diversified Equity Scheme (72 Schemes), 2 Yrs ended 30-Jun-09
5-Star Award by @ICRABirla Sun Life Frontline Equity Fund
Open Ended Diversified Equity - Defensive (55 Schemes), 3 year ended 31-Dec-08
««««V #alue Research RatingBirla Sun Life Frontline Equity Fund
Equity: Diversified (147 Schemes), for 3 & 5 Years periods ending 31-Aug-09
5-Star Award by @ICRABirla Sun Life Frontline Equity Fund
Open Ended Diversified Equity - Defensive (62 Schemes), 1 year ended 31-Dec-08
Value Blend Growth Size
Large
Mid
Small
Investment Style
Investment Style Box
Fund Manager :Managing Fund Since : October 01,2006Total Experience : 20 yearsDate of inception : August 30, 2002Nature of the scheme : An Open-ended Growth Scheme
Default option : Plan A/Dividend ReinvestmentPlan AFresh Purchase : Rs. 5000/-Additional Purchase : Rs. 1000/-Plan BFresh Purchase : Rs. 2,00,000/-Additional Purchase : Rs. 1000/-Redemption Cheques : Within 10 working days issuedSystematic Investment : Available Plan (SIP)Systematic Withdrawal : Available Plan (SWP)Systematic Transfer : AvailablePlan (STP)
Plan ADividend : 20.47( )Growth : 69.23(With/without Trigger Facility)Plan B
Dividend : 10.46(Payout, Reinvestment & Sweep)Growth : 10.46(With/without Trigger Facility)
Benchmark : BSE 200Average AUM : Rs. 1,098.56 Crores
Entry Load : Nil
Exit Load** : 1% if redeemed / switched out within 365 days from the date of allotment**Exit / Entry Load is NIL for units issued in Bonus & Dividend Reinvestment.
Standard Deviation : 33.69%##Sharpe Ratio : 0.44
Beta : 0.85
Mr. Mahesh Patil
Payout, Reinvestment & Sweep
Key Features
Plans / Options & NAV
Load Structure (Incl for SIP)
Other Parameter
(as on August 31, 2009)
Note: Standard Deviation, Sharpe Ratio & Beta are calculated on Annualised basis using 3 years history of monthly returns, source: MFI Explorer##Risk-free rate assumed to be 3.38%(91 day T-bill yield as on August 31, 2009)
21.48
17.80
29.4131.80
8.33
11.01
22.64
26.21
0
5
10
15
20
25
30
35
1 Year 3 Years 5 Years Since Inception
07
S e p t e m b e r 2 0 0 9
Fund Details
Investment Objective
As on August 31, 2009
Birla Sun Life Tax Relief ‘96An open - ended Equity Linked Savings Scheme (ELSS) with a lock-in of 3 years
Value Blend Growth Size
Large
Mid
Small
Investment Style
Investment Style Box
Fund Manager :Managing Fund Since : October 01,2006Total Experience : 15 yearsDate of inception : March 29, 1996Nature of the scheme : An Open-ended ELSS Scheme
Default option : Dividend PayoutFresh Purchase : Rs. 500/-Additional Purchase : Rs. 500/-Redemption Cheques : Within 10 working days issuedSystematic Investment : Available Plan (SIP)Systematic Withdrawal : Not Available Plan (SWP)Systematic Transfer : Not AvailablePlan (STP)
Dividend : 78.56(Payout, Reinvestment & Sweep)Growth (w.e.f. 06/03/08) : 9.24
Benchmark : BSE 200Average AUM : Rs. 980.83 Crores
Entry Load : Nil
Exit Load : Nil
Standard Deviation : 41.77%##Sharpe Ratio : 0.21
Beta : 1.04
Mr. Ajay Garg
Key Features
Plans / Options & NAV
Load Structure (Incl for SIP)
Other Parameter
(as on August 31, 2009)
Note: Standard Deviation, Sharpe Ratio & Beta are calculated on Annualised basis using 3 years history of monthly returns, source: MFI Explorer##Risk-free rate assumed to be 3.38%(91 day T-bill yield as on August 31, 2009)
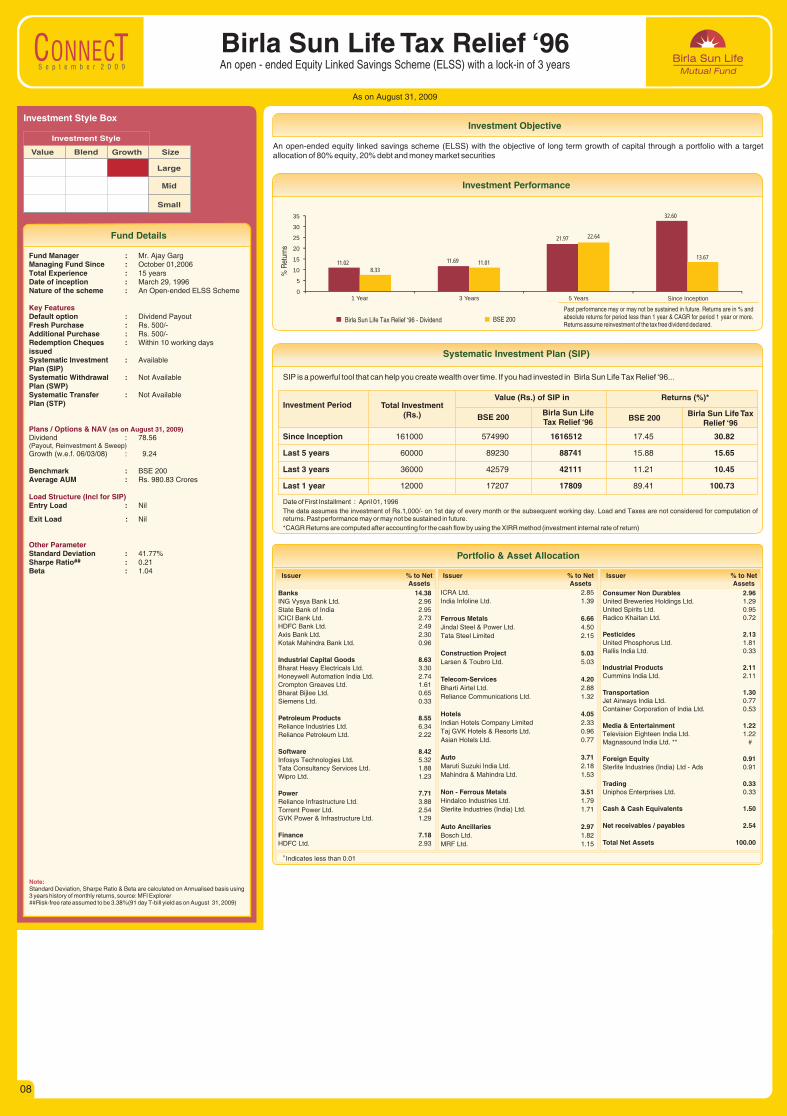
An open-ended equity linked savings scheme (ELSS) with the objective of long term growth of capital through a portfolio with a target allocation of 80% equity, 20% debt and money market securities
Investment Performance
Birla Sun Life Tax Relief ‘96 - Dividend BSE 200
% R
etur
ns
Past performance may or may not be sustained in future. Returns are in % and absolute returns for period less than 1 year & CAGR for period 1 year or more. Returns assume reinvestment of the tax free dividend declared.
SIP is a powerful tool that can help you create wealth over time. If you had invested in Birla Sun Life Tax Relief ‘96...
Systematic Investment Plan (SIP)
Date of First Installment : April 01, 1996
The data assumes the investment of Rs.1,000/- on 1st day of every month or the subsequent working day. Load and Taxes are not considered for computation of returns. Past performance may or may not be sustained in future.
*CAGR Returns are computed after accounting for the cash flow by using the XIRR method (investment internal rate of return)
Investment Period Total Investment (Rs.) Birla Sun Life
Tax Relief ‘96Birla Sun Life Tax
Relief ‘96BSE 200 BSE 200
Value (Rs.) of SIP in Returns (%)*
Since Inception 161000 574990 1616512 17.45 30.82
Last 5 years 60000 89230 88741 15.88 15.65
Last 3 years 36000 42579 42111 11.21 10.45
Last 1 year 12000 17207 17809 89.41 100.73
Issuer % to NetAssets
Issuer % to NetAssets
Issuer % to NetAssets
Banks 14.38ING Vysya Bank Ltd. 2.96State Bank of India 2.95ICICI Bank Ltd. 2.73HDFC Bank Ltd. 2.49Axis Bank Ltd. 2.30Kotak Mahindra Bank Ltd. 0.96
Industrial Capital Goods 8.63Bharat Heavy Electricals Ltd. 3.30Honeywell Automation India Ltd. 2.74Crompton Greaves Ltd. 1.61Bharat Bijlee Ltd. 0.65Siemens Ltd. 0.33
Petroleum Products 8.55Reliance Industries Ltd. 6.34Reliance Petroleum Ltd. 2.22
Software 8.42Infosys Technologies Ltd. 5.32Tata Consultancy Services Ltd. 1.88Wipro Ltd. 1.23
Power 7.71Reliance Infrastructure Ltd. 3.88Torrent Power Ltd. 2.54GVK Power & Infrastructure Ltd. 1.29
Finance 7.18HDFC Ltd. 2.93
ICRA Ltd. 2.85
India Infoline Ltd. 1.39
Ferrous Metals 6.66Jindal Steel & Power Ltd. 4.50
Tata Steel Limited 2.15
Construction Project 5.03Larsen & Toubro Ltd. 5.03
Telecom-Services 4.20Bharti Airtel Ltd. 2.88
Reliance Communications Ltd. 1.32
Hotels 4.05Indian Hotels Company Limited 2.33
Taj GVK Hotels & Resorts Ltd. 0.96
Asian Hotels Ltd. 0.77
Auto 3.71Maruti Suzuki India Ltd. 2.18
Mahindra & Mahindra Ltd. 1.53
Non - Ferrous Metals 3.51Hindalco Industries Ltd. 1.79
Sterlite Industries (India) Ltd. 1.71
Auto Ancillaries 2.97Bosch Ltd. 1.82
MRF Ltd. 1.15
Consumer Non Durables 2.96United Breweries Holdings Ltd. 1.29United Spirits Ltd. 0.95Radico Khaitan Ltd. 0.72
Pesticides 2.13United Phosphorus Ltd. 1.81Rallis India Ltd. 0.33
Industrial Products 2.11Cummins India Ltd. 2.11
Transportation 1.30Jet Airways India Ltd. 0.77Container Corporation of India Ltd. 0.53
Media & Entertainment 1.22Television Eighteen India Ltd. 1.22Magnasound India Ltd. ** #
Foreign Equity 0.91Sterlite Industries (India) Ltd - Ads 0.91
Trading 0.33Uniphos Enterprises Ltd. 0.33
Cash & Cash Equivalents 1.50
Net receivables / payables 2.54
Total Net Assets 100.00
Portfolio & Asset Allocation
# Indicates less than 0.01
11.02 11.69
21.97
32.60
8.3311.01
22.64
13.67
0
5
10
15
20
25
30
35
1 Year 3 Years 5 Years Since Inception
08
S e p t e m b e r 2 0 0 9
Fund Details
Investment Objective
As on August 31, 2009
Birla Sun Life Infrastructure Fund
Value Blend Growth Size
Large
Mid
Small
Investment Style
Investment Style Box
Fund Manager :Managing Fund Since : Since inceptionTotal Experience : 20 yearsDate of inception : March 17, 2006Nature of the scheme : An Open-ended Growth Scheme
Default option : Plan A/Dividend ReinvestmentPlan AFresh Purchase : Rs. 5000/-Additional Purchase : Rs. 1000/-Plan BFresh Purchase : Rs. 2,00,000/-Additional Purchase : Rs. 1000/-Redemption Cheques : Within 10 working days issuedSystematic Investment : Available Plan (SIP)Systematic Withdrawal : Available Plan (SWP)Systematic Transfer : AvailablePlan (STP)
Plan ADividend : 12.62( )Growth : 14.80Plan BDividend : 10.62(Payout, Reinvestment & Sweep)Growth : 11.06
Benchmark : S&P CNX NIFTYAverage AUM : Rs. 531.30 Crores
Entry Load : Nil
Exit Load** : 1% if redeemed / switched out within 365 days from the date of allotment**Exit / Entry Load is NIL for units issued in Bonus & Dividend Reinvestment.
Standard Deviation : 41.42%##Sharpe Ratio : 0.26
Beta : 1.11
Mr. Mahesh Patil
Payout, Reinvestment & Sweep
Key Features
Plans / Options & NAV
Load Structure (Incl for SIP)
Other Parameter
(as on August 31, 2009)
Note: Standard Deviation, Sharpe Ratio & Beta are calculated on Annualised basis using 3 years history of monthly returns, source: MFI Explorer##Risk-free rate assumed to be 3.38%(91 day T-bill yield as on August 31, 2009)
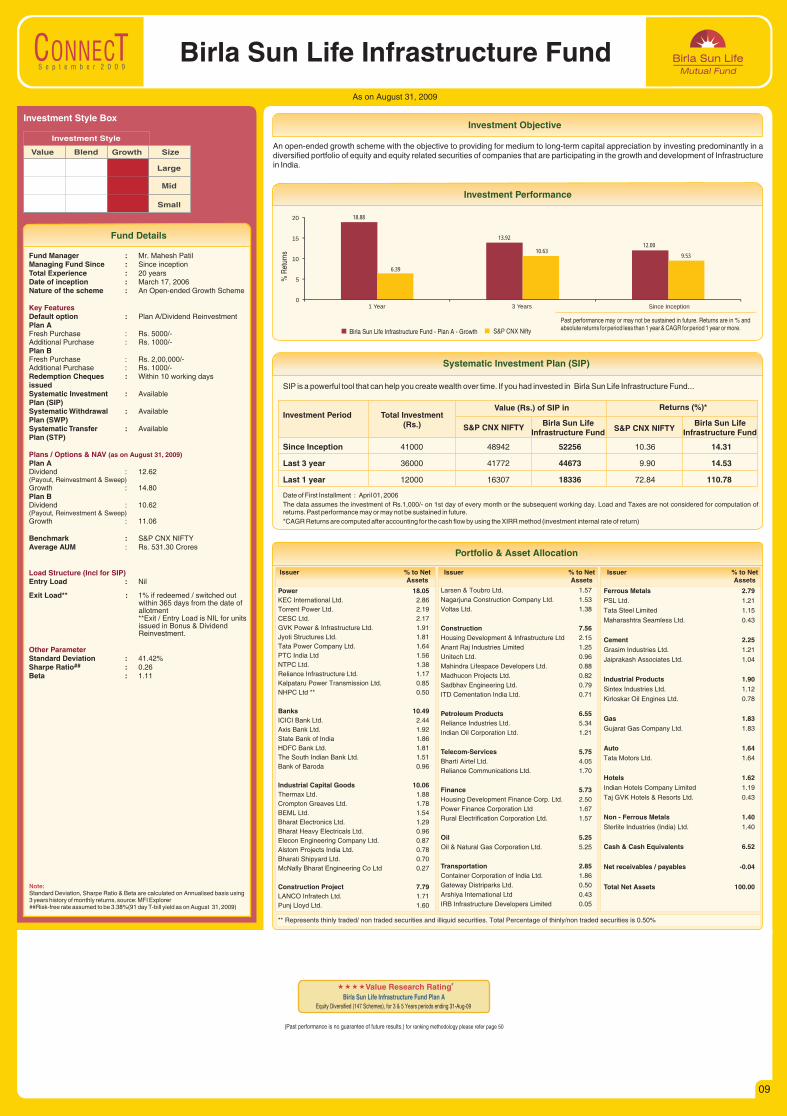
An open-ended growth scheme with the objective to providing for medium to long-term capital appreciation by investing predominantly in a diversified portfolio of equity and equity related securities of companies that are participating in the growth and development of Infrastructure in India.
Investment Performance
Birla Sun Life Infrastructure Fund - Plan A - Growth S&P CNX Nifty
% R
etur
ns
Past performance may or may not be sustained in future. Returns are in % and absolute returns for period less than 1 year & CAGR for period 1 year or more.
SIP is a powerful tool that can help you create wealth over time. If you had invested in Birla Sun Life Infrastructure Fund...
Systematic Investment Plan (SIP)
Date of First Installment : April 01, 2006
The data assumes the investment of Rs.1,000/- on 1st day of every month or the subsequent working day. Load and Taxes are not considered for computation of returns. Past performance may or may not be sustained in future.
*CAGR Returns are computed after accounting for the cash flow by using the XIRR method (investment internal rate of return)
Investment Period Total Investment (Rs.) Birla Sun Life
Infrastructure FundBirla Sun Life
Infrastructure FundS&P CNX NIFTY S&P CNX NIFTY
Value (Rs.) of SIP in Returns (%)*
Since Inception 41000 48942 52256 10.36 14.31
Last 3 year 36000 41772 44673 9.90 14.53
Last 1 year 12000 16307 18336 72.84 110.78
Issuer % to NetAssets
Issuer % to NetAssets
Issuer % to NetAssets
Power 18.05KEC International Ltd. 2.86
Torrent Power Ltd. 2.19
CESC Ltd. 2.17
GVK Power & Infrastructure Ltd. 1.91
Jyoti Structures Ltd. 1.81
Tata Power Company Ltd. 1.64
PTC India Ltd 1.56
NTPC Ltd. 1.38
Reliance Infrastructure Ltd. 1.17
Kalpataru Power Transmission Ltd. 0.85
NHPC Ltd ** 0.50
Banks 10.49ICICI Bank Ltd. 2.44
Axis Bank Ltd. 1.92
State Bank of India 1.86
HDFC Bank Ltd. 1.81
The South Indian Bank Ltd. 1.51
Bank of Baroda 0.96
Industrial Capital Goods 10.06Thermax Ltd. 1.88
Crompton Greaves Ltd. 1.78
BEML Ltd. 1.54
Bharat Electronics Ltd. 1.29
Bharat Heavy Electricals Ltd. 0.96
Elecon Engineering Company Ltd. 0.87
Alstom Projects India Ltd. 0.78
Bharati Shipyard Ltd. 0.70
McNally Bharat Engineering Co Ltd 0.27
Construction Project 7.79LANCO Infratech Ltd. 1.71
Punj Lloyd Ltd. 1.60
Larsen & Toubro Ltd. 1.57
Nagarjuna Construction Company Ltd. 1.53
Voltas Ltd. 1.38
Construction 7.56Housing Development & Infrastructure Ltd 2.15
Anant Raj Industries Limited 1.25
Unitech Ltd. 0.96
Mahindra Lifespace Developers Ltd. 0.88
Madhucon Projects Ltd. 0.82
Sadbhav Engineering Ltd. 0.79
ITD Cementation India Ltd. 0.71
Petroleum Products 6.55Reliance Industries Ltd. 5.34
Indian Oil Corporation Ltd. 1.21
Telecom-Services 5.75Bharti Airtel Ltd. 4.05
Reliance Communications Ltd. 1.70
Finance 5.73Housing Development Finance Corp. Ltd. 2.50
Power Finance Corporation Ltd 1.67
Rural Electrification Corporation Ltd. 1.57
Oil 5.25Oil & Natural Gas Corporation Ltd. 5.25
Transportation 2.85Container Corporation of India Ltd. 1.86
Gateway Distriparks Ltd. 0.50
Arshiya International Ltd 0.43
IRB Infrastructure Developers Limited 0.05
Ferrous Metals 2.79PSL Ltd. 1.21
Tata Steel Limited 1.15
Maharashtra Seamless Ltd. 0.43
Cement 2.25Grasim Industries Ltd. 1.21
Jaiprakash Associates Ltd. 1.04
Industrial Products 1.90Sintex Industries Ltd. 1.12
Kirloskar Oil Engines Ltd. 0.78
Gas 1.83Gujarat Gas Company Ltd. 1.83
Auto 1.64Tata Motors Ltd. 1.64
Hotels 1.62Indian Hotels Company Limited 1.19
Taj GVK Hotels & Resorts Ltd. 0.43
Non - Ferrous Metals 1.40Sterlite Industries (India) Ltd. 1.40
Cash & Cash Equivalents 6.52
Net receivables / payables -0.04
Total Net Assets 100.00
Portfolio & Asset Allocation
(Past performance is no guarantee of future results.) for ranking methodology please refer page 50
««««V #alue Research RatingBirla Sun Life Infrastructure Fund Plan A
Equity Diversified (147 Schemes), for 3 & 5 Years periods ending 31-Aug-09
** Represents thinly traded/ non traded securities and illiquid securities. Total Percentage of thinly/non traded securities is 0.50%
18.88
13.9212.00
6.39
10.639.53
0
5
10
15
20
1 Year 3 Years Since Inception
09
S e p t e m b e r 2 0 0 9
Fund Details
Investment Objective
As on August 31, 2009
Birla Sun Life Basic Industries Fund
Value Blend Growth Size
Large
Mid
Small
Investment Style
Investment Style Box
Fund Manager :Managing Fund Since : November 30,2007Total Experience : 11 yearsDate of inception : January 15, 2000Nature of the scheme : An Open-ended Growth Scheme
Default option : Dividend ReinvestmentFresh Purchase : Rs. 5000/-Additional Purchase : Rs. 1000/-Redemption Cheques : Within 10 working days issued Systematic Investment : Available Plan (SIP)Systematic Withdrawal : Available Plan (SWP)Systematic Transfer : AvailablePlan (STP)
Dividend : 26.60(Payout, Reinvestment & Sweep)Growth : 82.94
Benchmark : BSE 200Average AUM : Rs. 124.61 Crores
Entry Load : Nil
Exit Load** : 0.50% if redeemed / switched out within 7 days from the date of allotment**Exit / Entry Load is NIL for units issued in Bonus & Dividend Reinvestment.
Standard Deviation : 39.97%##Sharpe Ratio : 0.21
Beta : 1.00
Mr. Ankit Sancheti
Key Features
Plans / Options & NAV
Load Structure (Incl for SIP)
Other Parameter
(as on August 31, 2009)
Note: Standard Deviation, Sharpe Ratio & Beta are calculated on Annualised basis using 3 years history of monthly returns, source: MFI Explorer##Risk-free rate assumed to be 3.38%(91 day T-bill yield as on August 31, 2009)
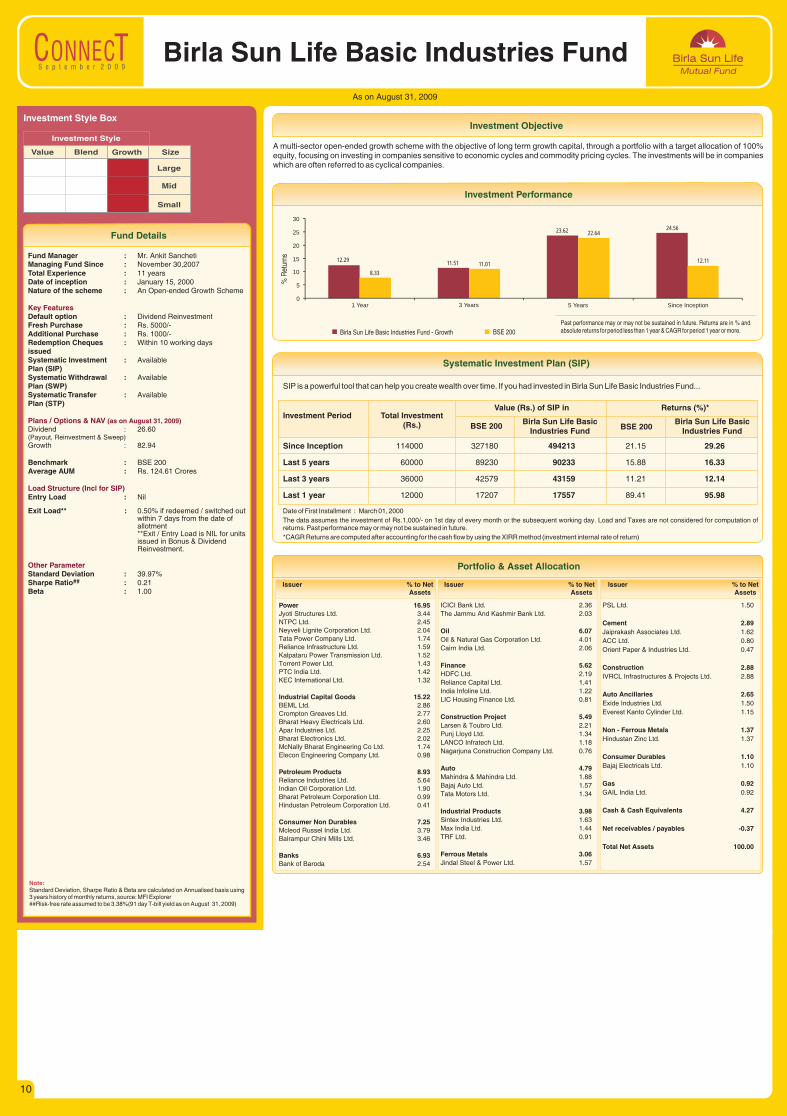
A multi-sector open-ended growth scheme with the objective of long term growth capital, through a portfolio with a target allocation of 100% equity, focusing on investing in companies sensitive to economic cycles and commodity pricing cycles. The investments will be in companies which are often referred to as cyclical companies.
Investment Performance
Birla Sun Life Basic Industries Fund - Growth BSE 200
% R
etur
ns
Past performance may or may not be sustained in future. Returns are in % and absolute returns for period less than 1 year & CAGR for period 1 year or more.
SIP is a powerful tool that can help you create wealth over time. If you had invested in Birla Sun Life Basic Industries Fund...
Systematic Investment Plan (SIP)
Date of First Installment : March 01, 2000
The data assumes the investment of Rs.1,000/- on 1st day of every month or the subsequent working day. Load and Taxes are not considered for computation of returns. Past performance may or may not be sustained in future.
*CAGR Returns are computed after accounting for the cash flow by using the XIRR method (investment internal rate of return)
Investment Period Total Investment (Rs.) Birla Sun Life Basic
Industries FundBirla Sun Life Basic
Industries FundBSE 200 BSE 200
Value (Rs.) of SIP in Returns (%)*
Since Inception 114000 327180 494213 21.15 29.26
Last 5 years 60000 89230 90233 15.88 16.33
Last 3 years 36000 42579 43159 11.21 12.14
Last 1 year 12000 17207 17557 89.41 95.98
Issuer % to NetAssets
Issuer % to NetAssets
Issuer % to NetAssets
Power 16.95Jyoti Structures Ltd. 3.44NTPC Ltd. 2.45Neyveli Lignite Corporation Ltd. 2.04Tata Power Company Ltd. 1.74Reliance Infrastructure Ltd. 1.59Kalpataru Power Transmission Ltd. 1.52Torrent Power Ltd. 1.43PTC India Ltd. 1.42KEC International Ltd. 1.32
Industrial Capital Goods 15.22BEML Ltd. 2.86Crompton Greaves Ltd. 2.77Bharat Heavy Electricals Ltd. 2.60Apar Industries Ltd. 2.25Bharat Electronics Ltd. 2.02McNally Bharat Engineering Co Ltd. 1.74Elecon Engineering Company Ltd. 0.98
Petroleum Products 8.93Reliance Industries Ltd. 5.64Indian Oil Corporation Ltd. 1.90Bharat Petroleum Corporation Ltd. 0.99Hindustan Petroleum Corporation Ltd. 0.41
Consumer Non Durables 7.25Mcleod Russel India Ltd. 3.79Balrampur Chini Mills Ltd. 3.46
Banks 6.93Bank of Baroda 2.54
ICICI Bank Ltd. 2.36
The Jammu And Kashmir Bank Ltd. 2.03
Oil 6.07Oil & Natural Gas Corporation Ltd. 4.01
Cairn India Ltd. 2.06
Finance 5.62HDFC Ltd. 2.19
Reliance Capital Ltd. 1.41
India Infoline Ltd. 1.22
LIC Housing Finance Ltd. 0.81
Construction Project 5.49Larsen & Toubro Ltd. 2.21
Punj Lloyd Ltd. 1.34
LANCO Infratech Ltd. 1.18
Nagarjuna Construction Company Ltd. 0.76
Auto 4.79Mahindra & Mahindra Ltd. 1.88
Bajaj Auto Ltd. 1.57
Tata Motors Ltd. 1.34
Industrial Products 3.98Sintex Industries Ltd. 1.63
Max India Ltd. 1.44
TRF Ltd. 0.91
Ferrous Metals 3.06Jindal Steel & Power Ltd. 1.57
PSL Ltd. 1.50
Cement 2.89Jaiprakash Associates Ltd. 1.62
ACC Ltd. 0.80
Orient Paper & Industries Ltd. 0.47
Construction 2.88IVRCL Infrastructures & Projects Ltd. 2.88
Auto Ancillaries 2.65Exide Industries Ltd. 1.50
Everest Kanto Cylinder Ltd. 1.15
Non - Ferrous Metals 1.37Hindustan Zinc Ltd. 1.37
Consumer Durables 1.10Bajaj Electricals Ltd. 1.10
Gas 0.92GAIL India Ltd. 0.92
Cash & Cash Equivalents 4.27
Net receivables / payables -0.37
Total Net Assets 100.00
Portfolio & Asset Allocation
12.2911.51
23.62 24.56
8.33
11.01
22.64
12.11
0
5
10
15
20
25
30
1 Year 3 Years 5 Years Since Inception
10
S e p t e m b e r 2 0 0 9
Fund Details
Investment Objective
Birla Sun Life India GenNext FundAs on August 31, 2009
Value Blend Growth Size
Large
Mid
Small
Investment Style
Investment Style Box
Fund Manager :Managing Fund Since : September 12,2007Total Experience : 20 yearsDate of inception : August 05, 2005Nature of the scheme : An Open-ended Growth Scheme
Default option : Dividend ReinvestmentFresh Purchase : Rs. 5000/-Additional Purchase : Rs. 1000/-Redemption Cheques : Within 10 working days issuedSystematic Investment : Available Plan (SIP)Systematic Withdrawal : Available Plan (SWP)Systematic Transfer : AvailablePlan (STP)
Dividend : 12.60(Payout, Reinvestment & Sweep)Growth : 18.01
Benchmark : S&P CNX NIFTYAverage AUM : Rs. 93.26 Crores
Entry Load : Nil
Exit Load** : 1% if redeemed / switched out within 365 days from the date of allotment**Exit / Entry Load is NIL for units issued in Bonus & Dividend Reinvestment.
Standard Deviation : 28.91%##Sharpe Ratio : 0.29
Beta : 0.76
Mr. Sanjay Chawla
Key Features
Plans / Options & NAV
Load Structure (Incl for SIP)
Other Parameter
(as on August 31, 2009)
Note: Standard Deviation, Sharpe Ratio & Beta are calculated on Annualised basis using 3 years history of monthly returns, source: MFI Explorer##Risk-free rate assumed to be 3.38%(91 day T-bill yield as on August 31, 2009)
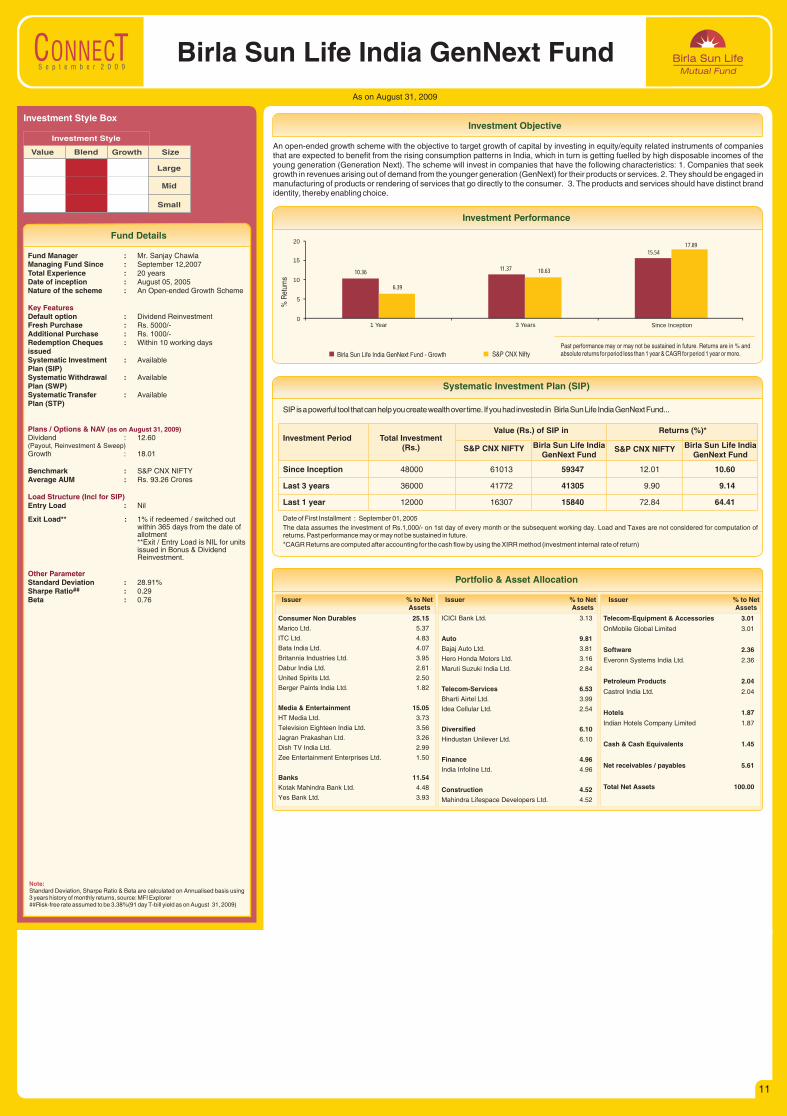
An open-ended growth scheme with the objective to target growth of capital by investing in equity/equity related instruments of companies that are expected to benefit from the rising consumption patterns in India, which in turn is getting fuelled by high disposable incomes of the young generation (Generation Next). The scheme will invest in companies that have the following characteristics: 1. Companies that seek growth in revenues arising out of demand from the younger generation (GenNext) for their products or services. 2. They should be engaged in manufacturing of products or rendering of services that go directly to the consumer. 3. The products and services should have distinct brand identity, thereby enabling choice.
Investment Performance
Birla Sun Life India GenNext Fund - Growth S&P CNX Nifty
% R
etur
ns
Past performance may or may not be sustained in future. Returns are in % and absolute returns for period less than 1 year & CAGR for period 1 year or more.
SIP is a powerful tool that can help you create wealth over time. If you had invested in Birla Sun Life India GenNext Fund...
Systematic Investment Plan (SIP)
Date of First Installment : September 01, 2005
The data assumes the investment of Rs.1,000/- on 1st day of every month or the subsequent working day. Load and Taxes are not considered for computation of returns. Past performance may or may not be sustained in future.
*CAGR Returns are computed after accounting for the cash flow by using the XIRR method (investment internal rate of return)
Investment Period Total Investment (Rs.) Birla Sun Life India
GenNext FundBirla Sun Life India
GenNext FundS&P CNX NIFTY S&P CNX NIFTY
Value (Rs.) of SIP in Returns (%)*
Since Inception 48000 61013 59347 12.01 10.60
Last 3 years 36000 41772 41305 9.90 9.14
Last 1 year 12000 16307 15840 72.84 64.41
Issuer % to NetAssets
Issuer % to NetAssets
Issuer % to NetAssets
Consumer Non Durables 25.15
Marico Ltd. 5.37
ITC Ltd. 4.83
Bata India Ltd. 4.07
Britannia Industries Ltd. 3.95
Dabur India Ltd. 2.61
United Spirits Ltd. 2.50
Berger Paints India Ltd. 1.82
Media & Entertainment 15.05
HT Media Ltd. 3.73
Television Eighteen India Ltd. 3.56
Jagran Prakashan Ltd. 3.26
Dish TV India Ltd. 2.99
Zee Entertainment Enterprises Ltd. 1.50
Banks 11.54
Kotak Mahindra Bank Ltd. 4.48
Yes Bank Ltd. 3.93
ICICI Bank Ltd. 3.13
Auto 9.81
Bajaj Auto Ltd. 3.81
Hero Honda Motors Ltd. 3.16
Maruti Suzuki India Ltd. 2.84
Telecom-Services 6.53
Bharti Airtel Ltd. 3.99
Idea Cellular Ltd. 2.54
Diversified 6.10
Hindustan Unilever Ltd. 6.10
Finance 4.96
India Infoline Ltd. 4.96
Construction 4.52
Mahindra Lifespace Developers Ltd. 4.52
Telecom-Equipment & Accessories 3.01
OnMobile Global Limited 3.01
Software 2.36
Everonn Systems India Ltd. 2.36
Petroleum Products 2.04
Castrol India Ltd. 2.04
Hotels 1.87
Indian Hotels Company Limited 1.87
Cash & Cash Equivalents 1.45
Net receivables / payables 5.61
Total Net Assets 100.00
Portfolio & Asset Allocation
10.3611.37
15.54
6.39
10.63
17.89
0
5
10
15
20
1 Year 3 Years Since Inception
11
S e p t e m b e r 2 0 0 9
Fund Details
Investment Objective
As on August 31, 2009
Birla Sun Life Advantage Fund
Value Blend Growth Size
Large
Mid
Small
Investment Style
Investment Style Box
Fund Manager :Managing Fund Since : Aug 05. 2009Total Experience : 16 yearsDate of inception : February 24, 1995Nature of the scheme : An Open-ended Growth Scheme
Default option : Dividend ReinvestmentFresh Purchase : Rs. 5000/-Additional Purchase : Rs. 1000/-Redemption Cheques : Within 10 working days issuedSystematic Investment : Available Plan (SIP)Systematic Withdrawal : Available Plan (SWP)Systematic Transfer : AvailablePlan (STP)
Dividend : 91.23(Payout, Reinvestment & Sweep)Growth : 133.75
Benchmark : BSE SENSEXAverage AUM : Rs. 387.51 Crores
Entry Load : Nil
Exit Load** : 0.50% if redeemed / switched out within 7 days from the date of allotment**Exit / Entry Load is NIL for units issued in Bonus & Dividend Reinvestment.
Standard Deviation : 38.26%##Sharpe Ratio : 0.12
Beta : 1.04
Mr. Ajay Argal
Key Features
Plans / Options & NAV
Load Structure (Incl for SIP)
Other Parameter
(as on August 31, 2009)
Note: Standard Deviation, Sharpe Ratio & Beta are calculated on Annualised basis using 3 years history of monthly returns, source: MFI Explorer##Risk-free rate assumed to be 3.38%(91 day T-bill yield as on August 31, 2009)
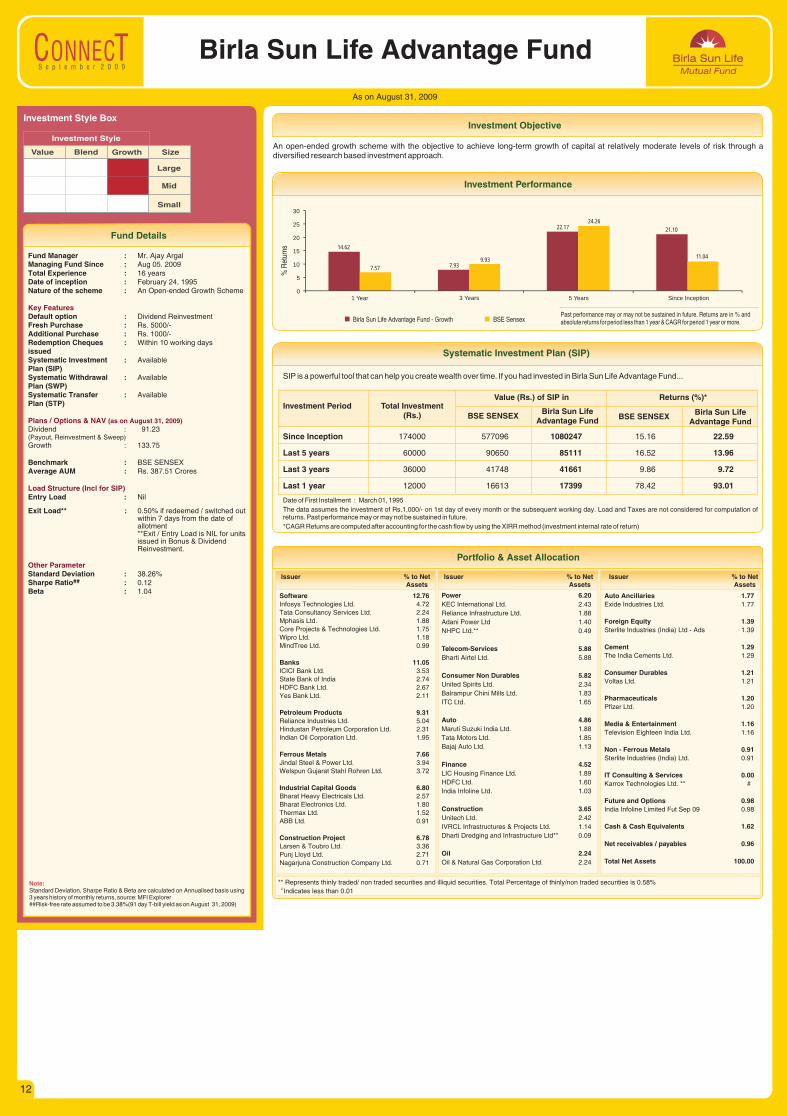
An open-ended growth scheme with the objective to achieve long-term growth of capital at relatively moderate levels of risk through a diversified research based investment approach.
Investment Performance
Birla Sun Life Advantage Fund - Growth BSE Sensex
% R
etur
ns
Past performance may or may not be sustained in future. Returns are in % and absolute returns for period less than 1 year & CAGR for period 1 year or more.
SIP is a powerful tool that can help you create wealth over time. If you had invested in Birla Sun Life Advantage Fund...
Systematic Investment Plan (SIP)
Date of First Installment : March 01, 1995
The data assumes the investment of Rs.1,000/- on 1st day of every month or the subsequent working day. Load and Taxes are not considered for computation of returns. Past performance may or may not be sustained in future.
*CAGR Returns are computed after accounting for the cash flow by using the XIRR method (investment internal rate of return)
Investment Period Total Investment (Rs.) Birla Sun Life
Advantage FundBirla Sun Life
Advantage FundBSE SENSEX BSE SENSEX
Value (Rs.) of SIP in Returns (%)*
Since Inception 174000 577096 1080247 15.16 22.59
Last 5 years 60000 90650 85111 16.52 13.96
Last 3 years 36000 41748 41661 9.86 9.72
Last 1 year 12000 16613 17399 78.42 93.01
Issuer % to NetAssets
Issuer % to NetAssets
Issuer % to NetAssets
Software 12.76Infosys Technologies Ltd. 4.72Tata Consultancy Services Ltd. 2.24Mphasis Ltd. 1.88Core Projects & Technologies Ltd. 1.75Wipro Ltd. 1.18MindTree Ltd. 0.99
Banks 11.05ICICI Bank Ltd. 3.53State Bank of India 2.74HDFC Bank Ltd. 2.67Yes Bank Ltd. 2.11
Petroleum Products 9.31Reliance Industries Ltd. 5.04Hindustan Petroleum Corporation Ltd. 2.31Indian Oil Corporation Ltd. 1.95
Ferrous Metals 7.66Jindal Steel & Power Ltd. 3.94Welspun Gujarat Stahl Rohren Ltd. 3.72
Industrial Capital Goods 6.80Bharat Heavy Electricals Ltd. 2.57Bharat Electronics Ltd. 1.80Thermax Ltd. 1.52ABB Ltd. 0.91
Construction Project 6.78Larsen & Toubro Ltd. 3.36Punj Lloyd Ltd. 2.71Nagarjuna Construction Company Ltd. 0.71
Power 6.20KEC International Ltd. 2.43
Reliance Infrastructure Ltd. 1.88
Adani Power Ltd 1.40
NHPC Ltd.** 0.49
Telecom-Services 5.88Bharti Airtel Ltd. 5.88
Consumer Non Durables 5.82United Spirits Ltd. 2.34
Balrampur Chini Mills Ltd. 1.83
ITC Ltd. 1.65
Auto 4.86Maruti Suzuki India Ltd. 1.88
Tata Motors Ltd. 1.85
Bajaj Auto Ltd. 1.13
Finance 4.52LIC Housing Finance Ltd. 1.89
HDFC Ltd. 1.60
India Infoline Ltd. 1.03
Construction 3.65Unitech Ltd. 2.42
IVRCL Infrastructures & Projects Ltd. 1.14
Dharti Dredging and Infrastructure Ltd** 0.09
Oil 2.24Oil & Natural Gas Corporation Ltd. 2.24
Portfolio & Asset Allocation
** Represents thinly traded/ non traded securities and illiquid securities. Total Percentage of thinly/non traded securities is 0.58% # Indicates less than 0.01
Auto Ancillaries 1.77Exide Industries Ltd. 1.77
Foreign Equity 1.39Sterlite Industries (India) Ltd - Ads 1.39
Cement 1.29The India Cements Ltd. 1.29
Consumer Durables 1.21Voltas Ltd. 1.21
Pharmaceuticals 1.20Pfizer Ltd. 1.20
Media & Entertainment 1.16Television Eighteen India Ltd. 1.16
Non - Ferrous Metals 0.91Sterlite Industries (India) Ltd. 0.91
IT Consulting & Services 0.00Karrox Technologies Ltd. ** #
Future and Options 0.98India Infoline Limited Fut Sep 09 0.98
Cash & Cash Equivalents 1.62
Net receivables / payables 0.96
Total Net Assets 100.00
14.62
7.93
22.17 21.10
7.57
9.93
24.26
11.04
0
5
10
15
20
25
30
1 Year 3 Years 5 Years Since Inception
12
S e p t e m b e r 2 0 0 9
Fund Details
As on August 31, 2009
Birla Sun Life Tax PlanAn open - ended Equity Linked Savings Scheme (ELSS) with a lock-in of 3 years
Value Blend Growth Size
Large
Mid
Small
Investment Style
Investment Style Box
Fund Manager :Managing Fund Since : September 12,2007Total Experience : 20 yearsDate of inception : February 16, 1999Nature of the scheme : An Open-ended ELSS Scheme
Default option : Dividend PayoutFresh Purchase : Rs. 500/-Additional Purchase : Rs. 500/-Redemption Cheques : Within 10 working days issuedSystematic Investment : Available Plan (SIP)Systematic Withdrawal : Not Available Plan (SWP)Systematic Transfer : Not AvailablePlan (STP)
Dividend : 46.96(Payout, Reinvestment & Sweep)Growth : 11.44
Benchmark : BSE SENSEXAverage AUM : Rs. 145.55 Crores
Entry Load : Nil
Exit Load : Nil
Standard Deviation : 34.77%##Sharpe Ratio : 0.13
Beta : 0.94
Mr. Sanjay Chawla
Key Features
Plans / Options & NAV
Load Structure (Incl for SIP)
Other Parameter
(as on August 31, 2009)
Note: Standard Deviation, Sharpe Ratio & Beta are calculated on Annualised basis using 3 years history of monthly returns, source: MFI Explorer##Risk-free rate assumed to be 3.38%(91 day T-bill yield as on August 31, 2009)
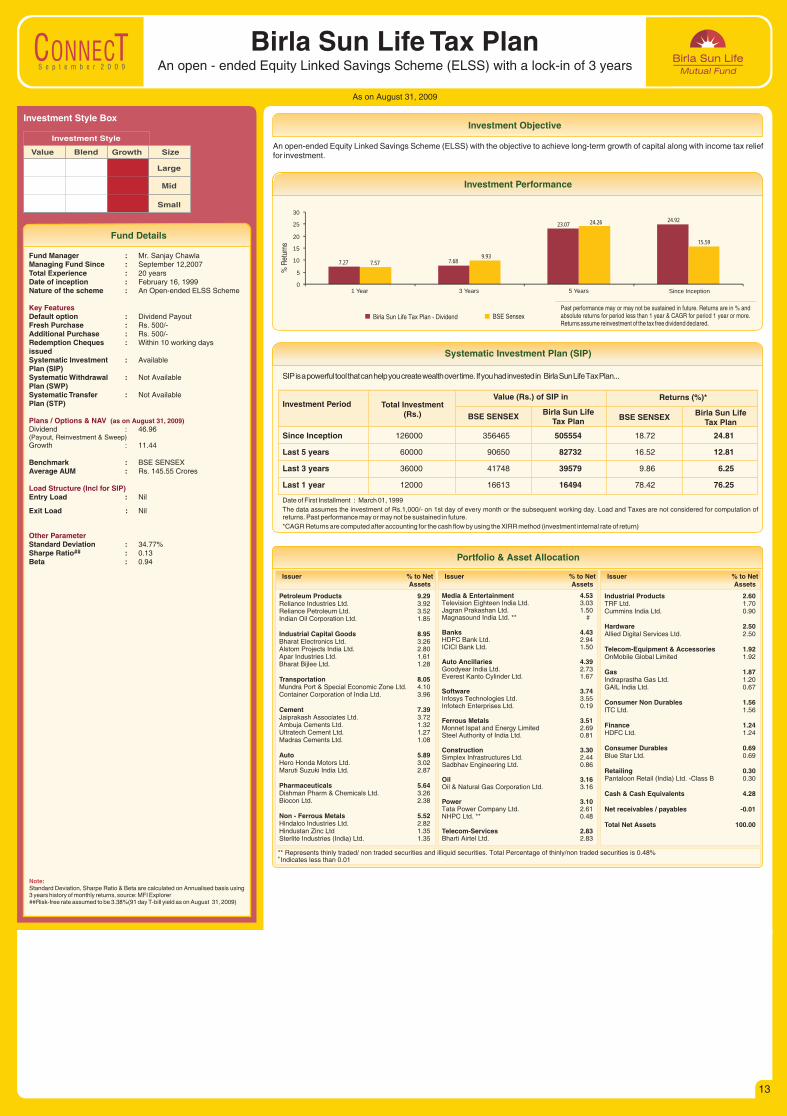
An open-ended Equity Linked Savings Scheme (ELSS) with the objective to achieve long-term growth of capital along with income tax relief for investment.
Investment Objective
Investment Performance
Birla Sun Life Tax Plan - Dividend BSE Sensex
% R
etur
ns
Past performance may or may not be sustained in future. Returns are in % and absolute returns for period less than 1 year & CAGR for period 1 year or more. Returns assume reinvestment of the tax free dividend declared.
SIP is a powerful tool that can help you create wealth over time. If you had invested in Birla Sun Life Tax Plan...
Systematic Investment Plan (SIP)
Date of First Installment : March 01, 1999
The data assumes the investment of Rs.1,000/- on 1st day of every month or the subsequent working day. Load and Taxes are not considered for computation of returns. Past performance may or may not be sustained in future.
*CAGR Returns are computed after accounting for the cash flow by using the XIRR method (investment internal rate of return)
Investment Period Total Investment (Rs.) Birla Sun Life
Tax PlanBirla Sun Life
Tax PlanBSE SENSEX BSE SENSEX
Value (Rs.) of SIP in Returns (%)*
Since Inception 126000 356465 505554 18.72 24.81
Last 5 years 60000 90650 82732 16.52 12.81
Last 3 years 36000 41748 39579 9.86 6.25
Last 1 year 12000 16613 16494 78.42 76.25
Issuer % to NetAssets
Issuer % to NetAssets
Issuer % to NetAssets
Petroleum Products 9.29Reliance Industries Ltd. 3.92Reliance Petroleum Ltd. 3.52Indian Oil Corporation Ltd. 1.85
Industrial Capital Goods 8.95Bharat Electronics Ltd. 3.26Alstom Projects India Ltd. 2.80Apar Industries Ltd. 1.61Bharat Bijlee Ltd. 1.28
Transportation 8.05Mundra Port & Special Economic Zone Ltd. 4.10Container Corporation of India Ltd. 3.96
Cement 7.39Jaiprakash Associates Ltd. 3.72Ambuja Cements Ltd. 1.32Ultratech Cement Ltd. 1.27Madras Cements Ltd. 1.08
Auto 5.89Hero Honda Motors Ltd. 3.02Maruti Suzuki India Ltd. 2.87
Pharmaceuticals 5.64Dishman Pharm & Chemicals Ltd. 3.26Biocon Ltd. 2.38
Non - Ferrous Metals 5.52Hindalco Industries Ltd. 2.82Hindustan Zinc Ltd 1.35Sterlite Industries (India) Ltd. 1.35
Media & Entertainment 4.53Television Eighteen India Ltd. 3.03Jagran Prakashan Ltd. 1.50Magnasound India Ltd. ** #
Banks 4.43HDFC Bank Ltd. 2.94ICICI Bank Ltd. 1.50
Auto Ancillaries 4.39Goodyear India Ltd. 2.73Everest Kanto Cylinder Ltd. 1.67
Software 3.74Infosys Technologies Ltd. 3.55Infotech Enterprises Ltd. 0.19
Ferrous Metals 3.51Monnet Ispat and Energy Limited 2.69Steel Authority of India Ltd. 0.81
Construction 3.30Simplex Infrastructures Ltd. 2.44Sadbhav Engineering Ltd. 0.86
Oil 3.16Oil & Natural Gas Corporation Ltd. 3.16
Power 3.10Tata Power Company Ltd. 2.61NHPC Ltd. ** 0.48
Telecom-Services 2.83Bharti Airtel Ltd. 2.83
Industrial Products 2.60TRF Ltd. 1.70Cummins India Ltd. 0.90
Hardware 2.50Allied Digital Services Ltd. 2.50
Telecom-Equipment & Accessories 1.92OnMobile Global Limited 1.92
Gas 1.87Indraprastha Gas Ltd. 1.20GAIL India Ltd. 0.67
Consumer Non Durables 1.56ITC Ltd. 1.56
Finance 1.24HDFC Ltd. 1.24
Consumer Durables 0.69Blue Star Ltd. 0.69
Retailing 0.30Pantaloon Retail (India) Ltd. -Class B 0.30
Cash & Cash Equivalents 4.28
Net receivables / payables -0.01
Total Net Assets 100.00
Portfolio & Asset Allocation
** Represents thinly traded/ non traded securities and illiquid securities. Total Percentage of thinly/non traded securities is 0.48%# Indicates less than 0.01
7.27 7.68
23.0724.92
7.579.93
24.26
15.59
0
5
10
15
20
25
30
1 Year 3 Years 5 Years Since Inception
13
S e p t e m b e r 2 0 0 9
Fund Details
As on August 31, 2009
Investment Objective
Birla Sun Life Index Fund
Value Blend Growth Size
Large
Mid
Small
Investment Style
Investment Style Box
Fund Manager :Managing Fund Since : October 01,2007Total Experience : 15 yearsDate of inception : September 18, 2002Nature of the scheme : An Open-ended Index Linked
Growth Scheme
Default option : Dividend ReinvestmentFresh Purchase : Rs. 5000/-Additional Purchase : Rs. 1000/-Redemption Cheques : Within 10 Working days issuedSystematic Investment : Available Plan (SIP)Systematic Withdrawal : Not Available Plan (SWP)Systematic Transfer : Not AvailablePlan (STP)
Dividend : 18.04(Payout, Reinvestment & Sweep)Growth : 46.63
Benchmark : S&P CNX NIFTYAverage AUM : Rs. 36.40 Crores
Entry Load : Nil
Exit Load** : 0.50% if redeemed / switched out within 7 days from the date of allotment**Exit / Entry Load is NIL for units issued in Bonus & Dividend Reinvestment.
Standard Deviation : 35.47%##Sharpe Ratio : 0.18
Beta : 0.98
Mr. Ajay Garg
Key Features
Plans / Options & NAV
Load Structure (Incl for SIP)
Other Parameter
(as on August 31, 2009)
Note: Standard Deviation, Sharpe Ratio & Beta are calculated on Annualised basis using 3 years history of monthly returns, source: MFI Explorer##Risk-free rate assumed to be 3.38%(91 day T-bill yield as on August 31, 2009)
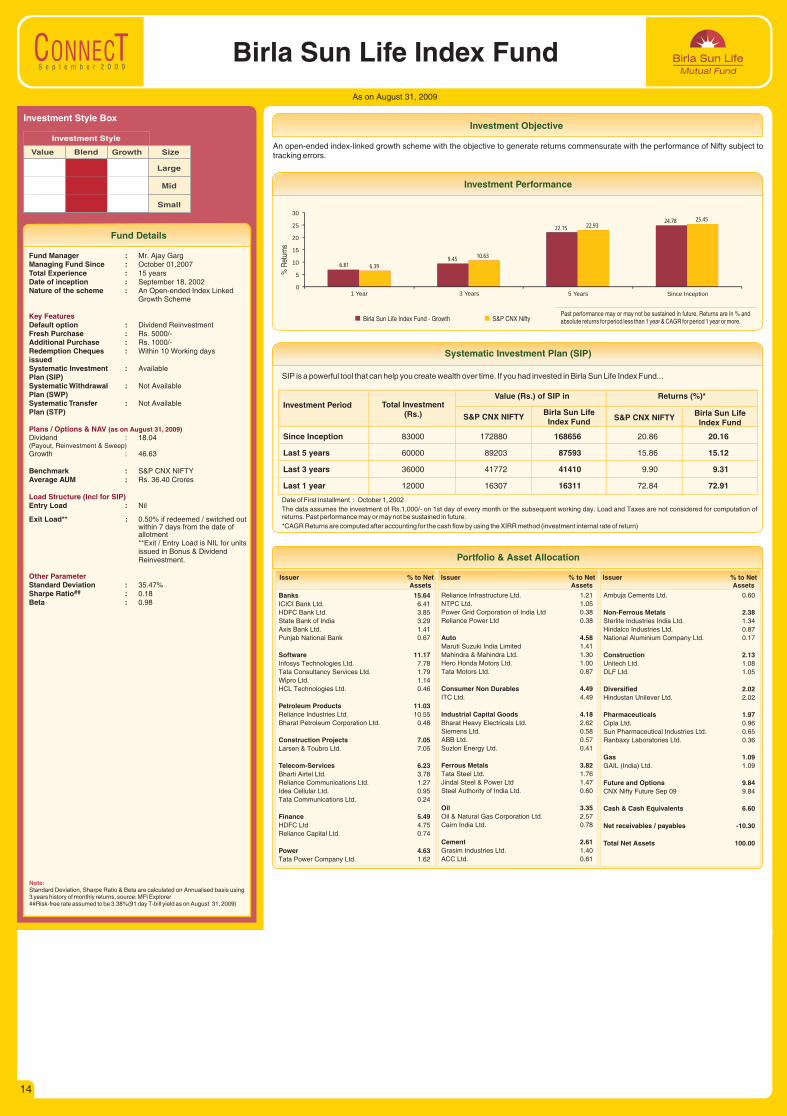
An open-ended index-linked growth scheme with the objective to generate returns commensurate with the performance of Nifty subject to tracking errors.
Investment Performance
% R
etur
ns
Birla Sun Life Index Fund - Growth S&P CNX NiftyPast performance may or may not be sustained in future. Returns are in % and absolute returns for period less than 1 year & CAGR for period 1 year or more.
SIP is a powerful tool that can help you create wealth over time. If you had invested in Birla Sun Life Index Fund...
Systematic Investment Plan (SIP)
Date of First Installment : October 1, 2002
The data assumes the investment of Rs.1,000/- on 1st day of every month or the subsequent working day. Load and Taxes are not considered for computation of returns. Past performance may or may not be sustained in future.
*CAGR Returns are computed after accounting for the cash flow by using the XIRR method (investment internal rate of return)
Investment Period Total Investment (Rs.) Birla Sun Life
Index FundBirla Sun Life
Index FundS&P CNX NIFTY S&P CNX NIFTY
Value (Rs.) of SIP in Returns (%)*
Since Inception 83000 172880 168656 20.86 20.16
Last 5 years 60000 89203 87593 15.86 15.12
Last 3 years 36000 41772 41410 9.90 9.31
Last 1 year 12000 16307 16311 72.84 72.91
Issuer % to NetAssets
Issuer % to NetAssets
Issuer % to NetAssets
Banks 15.64ICICI Bank Ltd. 6.41
HDFC Bank Ltd. 3.85
State Bank of India 3.29
Axis Bank Ltd. 1.41
Punjab National Bank 0.67
Software 11.17Infosys Technologies Ltd. 7.78
Tata Consultancy Services Ltd. 1.79
Wipro Ltd. 1.14
HCL Technologies Ltd. 0.46
Petroleum Products 11.03Reliance Industries Ltd. 10.55
Bharat Petroleum Corporation Ltd. 0.48
Construction Projects 7.05Larsen & Toubro Ltd. 7.05
Telecom-Services 6.23Bharti Airtel Ltd. 3.78
Reliance Communications Ltd. 1.27
Idea Cellular Ltd. 0.95
Tata Communications Ltd. 0.24
Finance 5.49HDFC Ltd 4.75
Reliance Capital Ltd. 0.74
Power 4.63Tata Power Company Ltd. 1.62
Reliance Infrastructure Ltd. 1.21
NTPC Ltd. 1.05
Power Grid Corporation of India Ltd 0.38
Reliance Power Ltd 0.38
Auto 4.58Maruti Suzuki India Limited 1.41
Mahindra & Mahindra Ltd. 1.30
Hero Honda Motors Ltd. 1.00
Tata Motors Ltd. 0.87
Consumer Non Durables 4.49ITC Ltd. 4.49
Industrial Capital Goods 4.18Bharat Heavy Electricals Ltd. 2.62
Siemens Ltd. 0.58
ABB Ltd. 0.57
Suzlon Energy Ltd. 0.41
Ferrous Metals 3.82Tata Steel Ltd. 1.76
Jindal Steel & Power Ltd 1.47
Steel Authority of India Ltd. 0.60
Oil 3.35Oil & Natural Gas Corporation Ltd. 2.57
Cairn India Ltd. 0.78
Cement 2.61Grasim Industries Ltd. 1.40
ACC Ltd. 0.61
Ambuja Cements Ltd. 0.60
Non-Ferrous Metals 2.38Sterlite Industries India Ltd. 1.34
Hindalco Industries Ltd. 0.87
National Aluminium Company Ltd. 0.17
Construction 2.13Unitech Ltd. 1.08
DLF Ltd. 1.05
Diversified 2.02Hindustan Unilever Ltd. 2.02
Pharmaceuticals 1.97Cipla Ltd. 0.96
Sun Pharmaceutical Industries Ltd. 0.65
Ranbaxy Laboratories Ltd. 0.36
Gas 1.09GAIL (India) Ltd. 1.09
Future and Options 9.84CNX Nifty Future Sep 09 9.84
Cash & Cash Equivalents 6.60
Net receivables / payables -10.30
Total Net Assets 100.00
Portfolio & Asset Allocation
6.819.45
22.1524.78
6.39
10.63
22.9325.45
0
5
10
15
20
25
30
1 Year 3 Years 5 Years Since Inception
14
S e p t e m b e r 2 0 0 9
Fund Details
As on August 31, 2009
Investment Objective
Birla Sun Life New Millennium Fund
Value Blend Growth Size
Large
Mid
Small
Investment Style
Investment Style Box
Fund Manager :Managing Fund Since : September 12,2007Total Experience : 10 yearsDate of inception : January 15, 2000Nature of the scheme : An Open-ended Growth Scheme
Default option : Dividend ReinvestmentFresh Purchase : Rs. 5000/-Additional Purchase : Rs. 1000/-Redemption Cheques : Within 10 working days issuedSystematic Investment : Available Plan (SIP)Systematic Withdrawal : Available Plan (SWP)Systematic Transfer : AvailablePlan (STP)
Dividend : 13.42(Payout, Reinvestment & Sweep)Growth : 16.94
Benchmark : BSE TeckAverage AUM : Rs. 63.41 Crores
Entry Load : Nil
Exit Load** : 1% if redeemed / switched out within 365 days from the date of allotment**Exit / Entry Load is NIL for units issued in Bonus & Dividend Reinvestment.
Standard Deviation : 34.07%##Sharpe Ratio : -0.02
Beta : 1.00
Mr. Atul Penkar
Key Features
Plans / Options & NAV
Load Structure (Incl for SIP)
Other Parameter
(as on August 31, 2009)
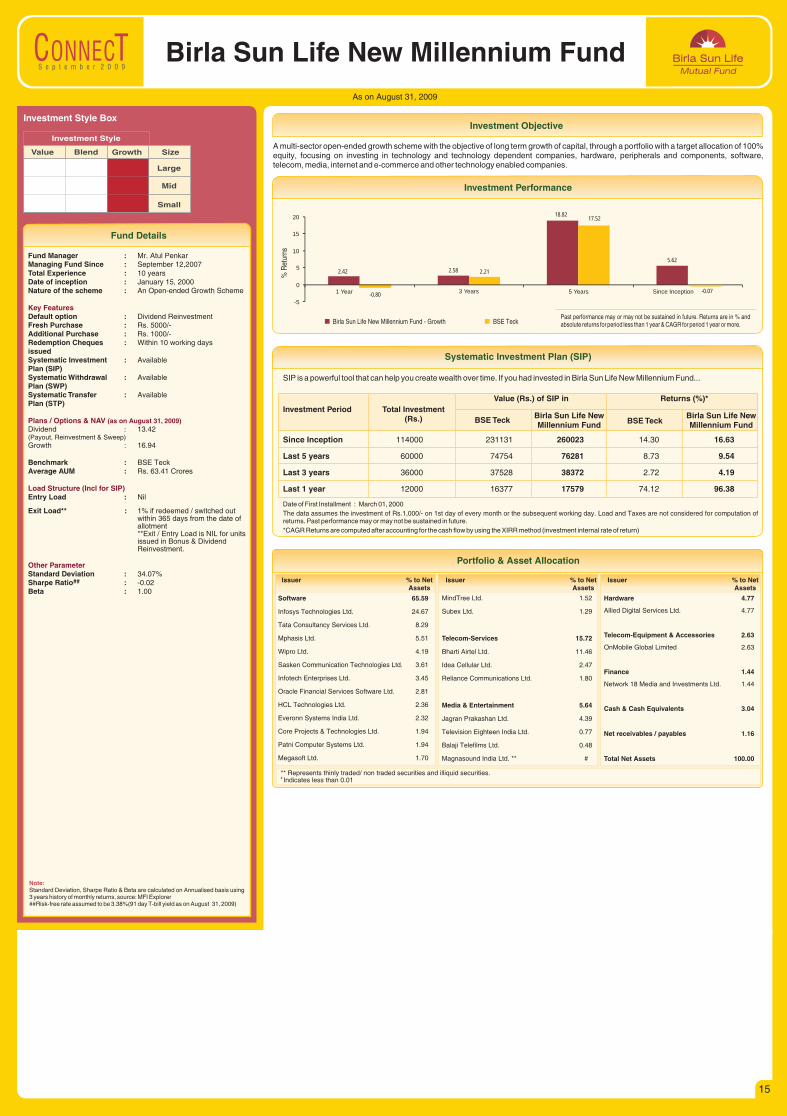
A multi-sector open-ended growth scheme with the objective of long term growth of capital, through a portfolio with a target allocation of 100% equity, focusing on investing in technology and technology dependent companies, hardware, peripherals and components, software, telecom, media, internet and e-commerce and other technology enabled companies.
Investment Performance
% R
etur
ns
Birla Sun Life New Millennium Fund - Growth BSE TeckPast performance may or may not be sustained in future. Returns are in % and absolute returns for period less than 1 year & CAGR for period 1 year or more.
SIP is a powerful tool that can help you create wealth over time. If you had invested in Birla Sun Life New Millennium Fund...
Systematic Investment Plan (SIP)
Date of First Installment : March 01, 2000
The data assumes the investment of Rs.1,000/- on 1st day of every month or the subsequent working day. Load and Taxes are not considered for computation of returns. Past performance may or may not be sustained in future.
*CAGR Returns are computed after accounting for the cash flow by using the XIRR method (investment internal rate of return)
Investment Period Total Investment (Rs.) Birla Sun Life New
Millennium FundBirla Sun Life New Millennium Fund
BSE Teck BSE Teck
Value (Rs.) of SIP in Returns (%)*
Since Inception 114000 231131 260023 14.30 16.63
Last 5 years 60000 74754 76281 8.73 9.54
Last 3 years 36000 37528 38372 2.72 4.19
Last 1 year 12000 16377 17579 74.12 96.38
Issuer % to NetAssets
Issuer % to NetAssets
Issuer % to NetAssets
Software 65.59
Infosys Technologies Ltd. 24.67
Tata Consultancy Services Ltd. 8.29
Mphasis Ltd. 5.51
Wipro Ltd. 4.19
Sasken Communication Technologies Ltd. 3.61
Infotech Enterprises Ltd. 3.45
Oracle Financial Services Software Ltd. 2.81
HCL Technologies Ltd. 2.36
Everonn Systems India Ltd. 2.32
Core Projects & Technologies Ltd. 1.94
Patni Computer Systems Ltd. 1.94
Megasoft Ltd. 1.70
MindTree Ltd. 1.52
Subex Ltd. 1.29
Telecom-Services 15.72
Bharti Airtel Ltd. 11.46
Idea Cellular Ltd. 2.47
Reliance Communications Ltd. 1.80
Media & Entertainment 5.64
Jagran Prakashan Ltd. 4.39
Television Eighteen India Ltd. 0.77
Balaji Telefilms Ltd. 0.48
Magnasound India Ltd. ** #
Portfolio & Asset Allocation
** Represents thinly traded/ non traded securities and illiquid securities. # Indicates less than 0.01
Hardware 4.77
Allied Digital Services Ltd. 4.77
Telecom-Equipment & Accessories 2.63
OnMobile Global Limited 2.63
Finance 1.44
Network 18 Media and Investments Ltd. 1.44
Cash & Cash Equivalents 3.04
Net receivables / payables 1.16
Total Net Assets 100.00
Note: Standard Deviation, Sharpe Ratio & Beta are calculated on Annualised basis using 3 years history of monthly returns, source: MFI Explorer##Risk-free rate assumed to be 3.38%(91 day T-bill yield as on August 31, 2009)
2.42 2.58
18.82
5.62
-0.80
2.21
17.52
-0.07
-5
0
5
10
15
20
1 Year 3 Years 5 Years Since Inception
15
S e p t e m b e r 2 0 0 9
Fund Details
As on August 31, 2009
Investment Objective
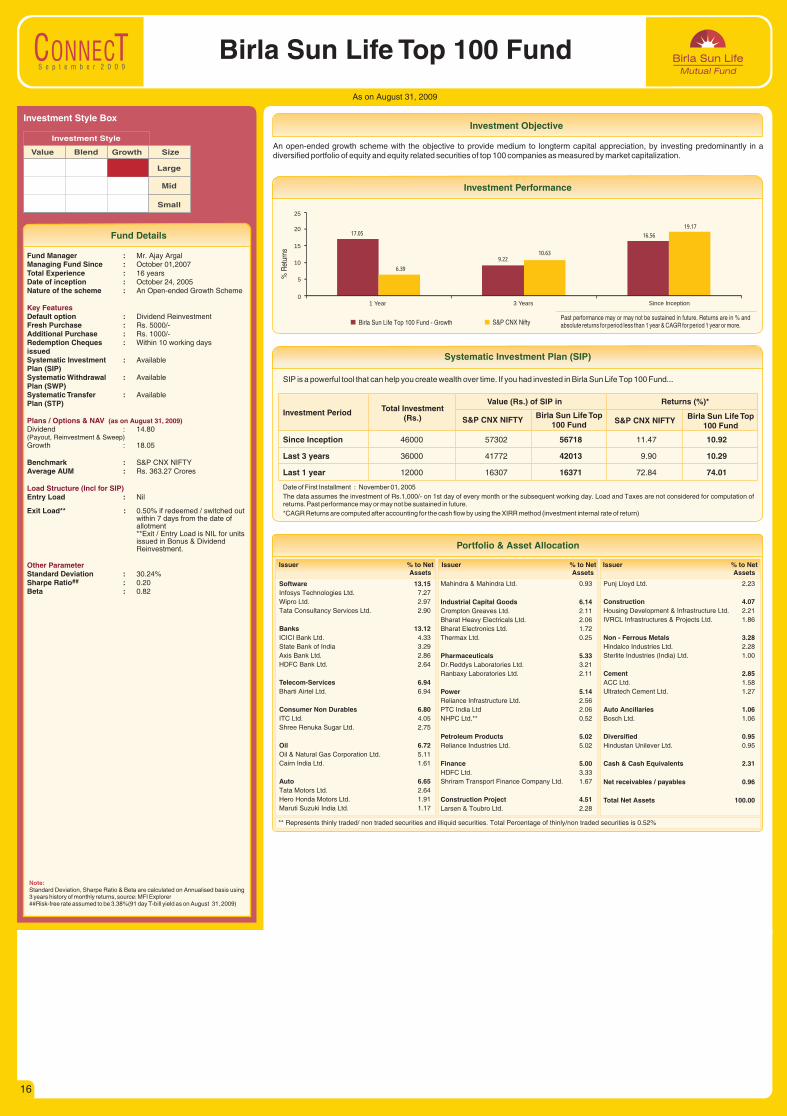
Birla Sun Life Top 100 Fund
Value Blend Growth Size
Large
Mid
Small
Investment Style
Investment Style Box
Fund Manager :Managing Fund Since : October 01,2007Total Experience : 16 yearsDate of inception : October 24, 2005Nature of the scheme : An Open-ended Growth Scheme
Default option : Dividend ReinvestmentFresh Purchase : Rs. 5000/-Additional Purchase : Rs. 1000/-Redemption Cheques : Within 10 working days issuedSystematic Investment : Available Plan (SIP)Systematic Withdrawal : Available Plan (SWP)Systematic Transfer : AvailablePlan (STP)
Dividend : 14.80(Payout, Reinvestment & Sweep)Growth : 18.05
Benchmark : S&P CNX NIFTYAverage AUM : Rs. 363.27 Crores
Entry Load : Nil
Exit Load** : 0.50% if redeemed / switched out within 7 days from the date of allotment**Exit / Entry Load is NIL for units issued in Bonus & Dividend Reinvestment.
Standard Deviation : 30.24%##Sharpe Ratio : 0.20
Beta : 0.82
Mr. Ajay Argal
Key Features
Plans / Options & NAV
Load Structure (Incl for SIP)
Other Parameter
(as on August 31, 2009)
An open-ended growth scheme with the objective to provide medium to longterm capital appreciation, by investing predominantly in a diversified portfolio of equity and equity related securities of top 100 companies as measured by market capitalization.
Investment Performance
Birla Sun Life Top 100 Fund - Growth S&P CNX Nifty
% R
etur
ns
Past performance may or may not be sustained in future. Returns are in % and absolute returns for period less than 1 year & CAGR for period 1 year or more.
SIP is a powerful tool that can help you create wealth over time. If you had invested in Birla Sun Life Top 100 Fund...
Systematic Investment Plan (SIP)
Date of First Installment : November 01, 2005
The data assumes the investment of Rs.1,000/- on 1st day of every month or the subsequent working day. Load and Taxes are not considered for computation of returns. Past performance may or may not be sustained in future.
*CAGR Returns are computed after accounting for the cash flow by using the XIRR method (investment internal rate of return)
Investment Period Total Investment (Rs.) Birla Sun Life Top
100 FundBirla Sun Life Top
100 FundS&P CNX NIFTY S&P CNX NIFTY
Value (Rs.) of SIP in Returns (%)*
Since Inception 46000 57302 56718 11.47 10.92
Last 3 years 36000 41772 42013 9.90 10.29
Last 1 year 12000 16307 16371 72.84 74.01
Issuer % to NetAssets
Issuer % to NetAssets
Issuer % to NetAssets
Software 13.15Infosys Technologies Ltd. 7.27
Wipro Ltd. 2.97
Tata Consultancy Services Ltd. 2.90
Banks 13.12ICICI Bank Ltd. 4.33
State Bank of India 3.29
Axis Bank Ltd. 2.86
HDFC Bank Ltd. 2.64
Telecom-Services 6.94Bharti Airtel Ltd. 6.94
Consumer Non Durables 6.80ITC Ltd. 4.05
Shree Renuka Sugar Ltd. 2.75
Oil 6.72Oil & Natural Gas Corporation Ltd. 5.11
Cairn India Ltd. 1.61
Auto 6.65Tata Motors Ltd. 2.64
Hero Honda Motors Ltd. 1.91
Maruti Suzuki India Ltd. 1.17
Mahindra & Mahindra Ltd. 0.93
Industrial Capital Goods 6.14Crompton Greaves Ltd. 2.11
Bharat Heavy Electricals Ltd. 2.06
Bharat Electronics Ltd. 1.72
Thermax Ltd. 0.25
Pharmaceuticals 5.33Dr.Reddys Laboratories Ltd. 3.21
Ranbaxy Laboratories Ltd. 2.11
Power 5.14Reliance Infrastructure Ltd. 2.56
PTC India Ltd 2.06
NHPC Ltd.** 0.52
Petroleum Products 5.02Reliance Industries Ltd. 5.02
Finance 5.00HDFC Ltd. 3.33
Shriram Transport Finance Company Ltd. 1.67
Construction Project 4.51Larsen & Toubro Ltd. 2.28
Punj Lloyd Ltd. 2.23
Construction 4.07Housing Development & Infrastructure Ltd. 2.21
IVRCL Infrastructures & Projects Ltd. 1.86
Non - Ferrous Metals 3.28Hindalco Industries Ltd. 2.28
Sterlite Industries (India) Ltd. 1.00
Cement 2.85ACC Ltd. 1.58
Ultratech Cement Ltd. 1.27
Auto Ancillaries 1.06Bosch Ltd. 1.06
Diversified 0.95Hindustan Unilever Ltd. 0.95
Cash & Cash Equivalents 2.31
Net receivables / payables 0.96
Total Net Assets 100.00
Portfolio & Asset Allocation
Note: Standard Deviation, Sharpe Ratio & Beta are calculated on Annualised basis using 3 years history of monthly returns, source: MFI Explorer##Risk-free rate assumed to be 3.38%(91 day T-bill yield as on August 31, 2009)
** Represents thinly traded/ non traded securities and illiquid securities. Total Percentage of thinly/non traded securities is 0.52%
17.05
9.22
16.56
6.39
10.63
19.17
0
5
10
15
20
25
1 Year 3 Years Since Inception
16
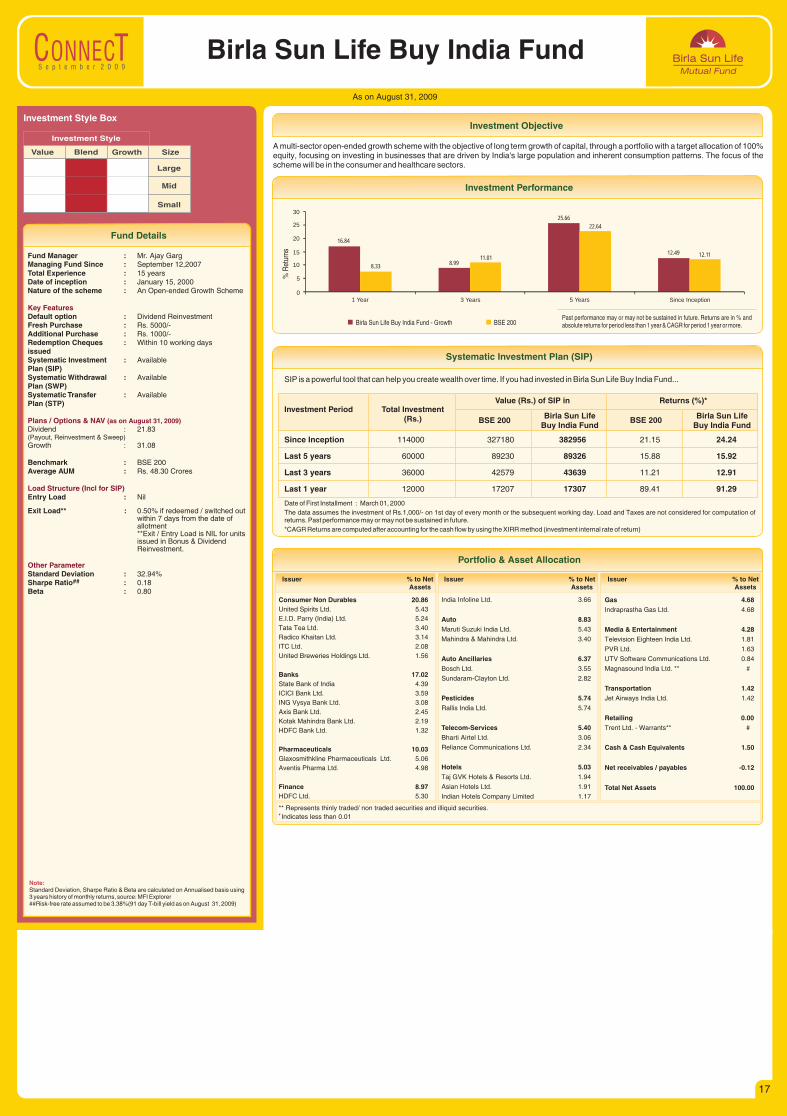
S e p t e m b e r 2 0 0 9
Fund Details
As on August 31, 2009
Birla Sun Life Buy India Fund
Value Blend Growth Size
Large
Mid
Small
Investment Style
Investment Style Box
Fund Manager :Managing Fund Since : September 12,2007Total Experience : 15 yearsDate of inception : January 15, 2000Nature of the scheme : An Open-ended Growth Scheme
Default option : Dividend ReinvestmentFresh Purchase : Rs. 5000/-Additional Purchase : Rs. 1000/-Redemption Cheques : Within 10 working days issuedSystematic Investment : Available Plan (SIP)Systematic Withdrawal : Available Plan (SWP)Systematic Transfer : AvailablePlan (STP)
Dividend : 21.83(Payout, Reinvestment & Sweep)Growth : 31.08
Benchmark : BSE 200Average AUM : Rs. 48.30 Crores
Entry Load : Nil
Exit Load** : 0.50% if redeemed / switched out within 7 days from the date of allotment**Exit / Entry Load is NIL for units issued in Bonus & Dividend Reinvestment.
Standard Deviation : 32.94%##Sharpe Ratio : 0.18
Beta : 0.80
Mr. Ajay Garg
Key Features
Plans / Options & NAV
Load Structure (Incl for SIP)
Other Parameter
(as on August 31, 2009)
Note: Standard Deviation, Sharpe Ratio & Beta are calculated on Annualised basis using 3 years history of monthly returns, source: MFI Explorer##Risk-free rate assumed to be 3.38%(91 day T-bill yield as on August 31, 2009)
A multi-sector open-ended growth scheme with the objective of long term growth of capital, through a portfolio with a target allocation of 100% equity, focusing on investing in businesses that are driven by India's large population and inherent consumption patterns. The focus of the scheme will be in the consumer and healthcare sectors.
Investment Objective
Investment Performance
Birla Sun Life Buy India Fund - Growth BSE 200
% R
etur
ns
Past performance may or may not be sustained in future. Returns are in % and absolute returns for period less than 1 year & CAGR for period 1 year or more.
SIP is a powerful tool that can help you create wealth over time. If you had invested in Birla Sun Life Buy India Fund...
Systematic Investment Plan (SIP)
Date of First Installment : March 01, 2000
The data assumes the investment of Rs.1,000/- on 1st day of every month or the subsequent working day. Load and Taxes are not considered for computation of returns. Past performance may or may not be sustained in future.
*CAGR Returns are computed after accounting for the cash flow by using the XIRR method (investment internal rate of return)
Investment Period Total Investment (Rs.) Birla Sun Life
Buy India FundBirla Sun Life
Buy India FundBSE 200 BSE 200
Value (Rs.) of SIP in Returns (%)*
Since Inception 114000 327180 382956 21.15 24.24
Last 5 years 60000 89230 89326 15.88 15.92
Last 3 years 36000 42579 43639 11.21 12.91
Last 1 year 12000 17207 17307 89.41 91.29
Issuer % to NetAssets
Issuer % to NetAssets
Issuer % to NetAssets
Consumer Non Durables 20.86United Spirits Ltd. 5.43
E.I.D. Parry (India) Ltd. 5.24
Tata Tea Ltd. 3.40
Radico Khaitan Ltd. 3.14
ITC Ltd. 2.08
United Breweries Holdings Ltd. 1.56
Banks 17.02State Bank of India 4.39
ICICI Bank Ltd. 3.59
ING Vysya Bank Ltd. 3.08
Axis Bank Ltd. 2.45
Kotak Mahindra Bank Ltd. 2.19
HDFC Bank Ltd. 1.32
Pharmaceuticals 10.03Glaxosmithkline Pharmaceuticals Ltd. 5.06
Aventis Pharma Ltd. 4.98
Finance 8.97HDFC Ltd. 5.30
India Infoline Ltd. 3.66
Auto 8.83Maruti Suzuki India Ltd. 5.43
Mahindra & Mahindra Ltd. 3.40
Auto Ancillaries 6.37Bosch Ltd. 3.55
Sundaram-Clayton Ltd. 2.82
Pesticides 5.74Rallis India Ltd. 5.74
Telecom-Services 5.40Bharti Airtel Ltd. 3.06
Reliance Communications Ltd. 2.34
Hotels 5.03Taj GVK Hotels & Resorts Ltd. 1.94
Asian Hotels Ltd. 1.91
Indian Hotels Company Limited 1.17
Gas 4.68Indraprastha Gas Ltd. 4.68
Media & Entertainment 4.28Television Eighteen India Ltd. 1.81
PVR Ltd. 1.63
UTV Software Communications Ltd. 0.84
Magnasound India Ltd. ** #
Transportation 1.42Jet Airways India Ltd. 1.42
Retailing 0.00Trent Ltd. - Warrants** #
Cash & Cash Equivalents 1.50
Net receivables / payables -0.12
Total Net Assets 100.00
Portfolio & Asset Allocation
** Represents thinly traded/ non traded securities and illiquid securities. # Indicates less than 0.01
16.84
8.99
25.66
12.49
8.33
11.01
22.64
12.11
0
5
10
15
20
25
30
1 Year 3 Years 5 Years Since Inception
17
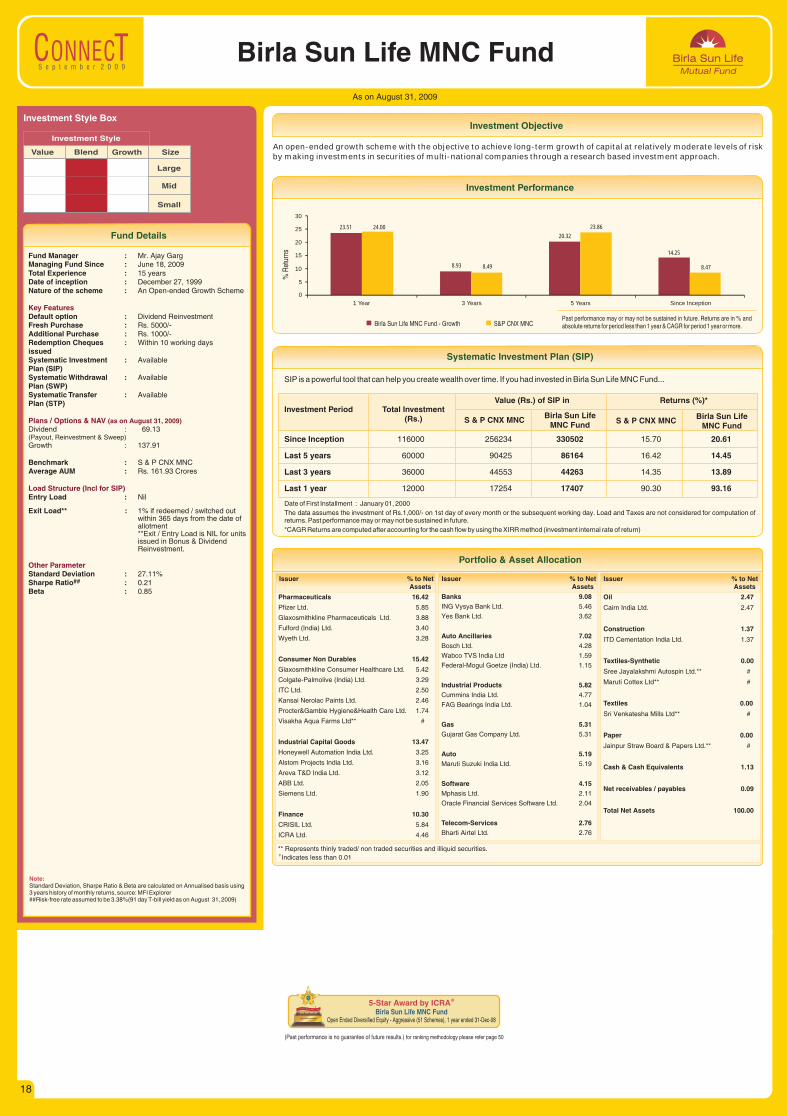
S e p t e m b e r 2 0 0 9
Fund Details
As on August 31, 2009
Investment Objective
Birla Sun Life MNC Fund
Value Blend Growth Size
Large
Mid
Small
Investment Style
Investment Style Box
Fund Manager :Managing Fund Since : June 18, 2009Total Experience : 15 yearsDate of inception : December 27, 1999Nature of the scheme : An Open-ended Growth Scheme
Default option : Dividend ReinvestmentFresh Purchase : Rs. 5000/-Additional Purchase : Rs. 1000/-Redemption Cheques : Within 10 working days issuedSystematic Investment : Available Plan (SIP)Systematic Withdrawal : Available Plan (SWP)Systematic Transfer : AvailablePlan (STP)
Dividend : 69.13(Payout, Reinvestment & Sweep)Growth : 137.91
Benchmark : S & P CNX MNCAverage AUM : Rs. 161.93 Crores
Entry Load : Nil
Exit Load** : 1% if redeemed / switched out within 365 days from the date of allotment**Exit / Entry Load is NIL for units issued in Bonus & Dividend Reinvestment.
Standard Deviation : 27.11%##Sharpe Ratio : 0.21
Beta : 0.85
Mr. Ajay Garg
Key Features
Plans / Options & NAV
Load Structure (Incl for SIP)
Other Parameter
(as on August 31, 2009)
Note: Standard Deviation, Sharpe Ratio & Beta are calculated on Annualised basis using 3 years history of monthly returns, source: MFI Explorer##Risk-free rate assumed to be 3.38%(91 day T-bill yield as on August 31, 2009)
An open-ended growth scheme with the objective to achieve long-term growth of capital at relatively moderate levels of risk by making investments in securities of multi-national companies through a research based investment approach.
Investment Performance
Birla Sun Life MNC Fund - Growth S&P CNX MNC
% R
etur
ns
Past performance may or may not be sustained in future. Returns are in % and absolute returns for period less than 1 year & CAGR for period 1 year or more.
SIP is a powerful tool that can help you create wealth over time. If you had invested in Birla Sun Life MNC Fund...
Systematic Investment Plan (SIP)
Date of First Installment : January 01, 2000
The data assumes the investment of Rs.1,000/- on 1st day of every month or the subsequent working day. Load and Taxes are not considered for computation of returns. Past performance may or may not be sustained in future.
*CAGR Returns are computed after accounting for the cash flow by using the XIRR method (investment internal rate of return)
Investment Period Total Investment (Rs.) Birla Sun Life
MNC FundBirla Sun Life
MNC FundS & P CNX MNC S & P CNX MNC
Value (Rs.) of SIP in Returns (%)*
Since Inception 116000 256234 330502 15.70 20.61
Last 5 years 60000 90425 86164 16.42 14.45
Last 3 years 36000 44553 44263 14.35 13.89
Last 1 year 12000 17254 17407 90.30 93.16
Issuer % to NetAssets
Issuer % to NetAssets
Issuer % to NetAssets
Pharmaceuticals 16.42
Pfizer Ltd. 5.85
Glaxosmithkline Pharmaceuticals Ltd. 3.88
Fulford (India) Ltd. 3.40
Wyeth Ltd. 3.28
Consumer Non Durables 15.42
Glaxosmithkline Consumer Healthcare Ltd. 5.42
Colgate-Palmolive (India) Ltd. 3.29
ITC Ltd. 2.50
Kansai Nerolac Paints Ltd. 2.46
Procter&Gamble Hygiene&Health Care Ltd. 1.74
Visakha Aqua Farms Ltd** #
Industrial Capital Goods 13.47
Honeywell Automation India Ltd. 3.25
Alstom Projects India Ltd. 3.16
Areva T&D India Ltd. 3.12
ABB Ltd. 2.05
Siemens Ltd. 1.90
Finance 10.30
CRISIL Ltd. 5.84
ICRA Ltd. 4.46
Banks 9.08ING Vysya Bank Ltd. 5.46
Yes Bank Ltd. 3.62
Auto Ancillaries 7.02Bosch Ltd. 4.28
Wabco TVS India Ltd 1.59
Federal-Mogul Goetze (India) Ltd. 1.15
Industrial Products 5.82Cummins India Ltd. 4.77
FAG Bearings India Ltd. 1.04
Gas 5.31Gujarat Gas Company Ltd. 5.31
Auto 5.19Maruti Suzuki India Ltd. 5.19
Software 4.15Mphasis Ltd. 2.11
Oracle Financial Services Software Ltd. 2.04
Telecom-Services 2.76Bharti Airtel Ltd. 2.76
Oil 2.47
Cairn India Ltd. 2.47
Construction 1.37
ITD Cementation India Ltd. 1.37
Textiles-Synthetic 0.00
Sree Jayalakshmi Autospin Ltd.** #
Maruti Cottex Ltd** #
Textiles 0.00
Sri Venkatesha Mills Ltd** #
Paper 0.00
Jainpur Straw Board & Papers Ltd.** #
Cash & Cash Equivalents 1.13
Net receivables / payables 0.09
Total Net Assets 100.00
Portfolio & Asset Allocation
5-Star Award by @ICRABirla Sun Life MNC Fund
Open Ended Diversified Equity - Aggressive (51 Schemes), 1 year ended 31-Dec-08
(Past performance is no guarantee of future results.) for ranking methodology please refer page 50
** Represents thinly traded/ non traded securities and illiquid securities. # Indicates less than 0.01
23.51
8.93
20.32
14.25
24.00
8.49
23.86
8.47
0
5
10
15
20
25
30
1 Year 3 Years 5 Years Since Inception
18

S e p t e m b e r 2 0 0 9
Fund Details
As on August 31, 2009
Investment Objective
Birla Sun Life India Opportunities Fund
Value Blend Growth Size
Large
Mid
Small
Investment Style
Investment Style Box
Fund Manager :Managing Fund Since : September 12, 2007Total Experience : 10 yearsDate of inception : December 27, 1999Nature of the scheme : An Open-ended Growth Scheme
Default option : Dividend ReinvestmentFresh Purchase : Rs. 5000/-Additional Purchase : Rs. 1000/-Redemption Cheques : Within 10 working days issuedSystematic Investment : Available Plan (SIP)Systematic Withdrawal : Available Plan (SWP)Systematic Transfer : AvailablePlan (STP)
Dividend : 18.37(Payout, Reinvestment & Sweep)Growth : 42.77
Benchmark : S & P CNX 500Average AUM : Rs. 47.65 Crores
Entry Load : Nil
Exit Load** : 0.50% if redeemed / switched out within 7 days from the date of allotment**Exit / Entry Load is NIL for units issued in Bonus & Dividend Reinvestment.
Standard Deviation : 35.45%##Sharpe Ratio : -0.11
Beta : 0.84
Mr. Atul Penkar
Key Features
Plans / Options & NAV
Load Structure (Incl for SIP)
Other Parameter
(as on August 31, 2009)
Note: Standard Deviation, Sharpe Ratio & Beta are calculated on Annualised basis using 3 years history of monthly returns, source: MFI Explorer##Risk-free rate assumed to be 3.38%(91 day T-bill yield as on August 31, 2009)
An open-ended growth scheme with the objective to achieve superior long-term growth of capital by investing in shares of companies that do one or more of the following: Leverage India's intellectual capital for providing services, research and creative inputs; Seek to use current and impending changes in patent laws / import tariffs / quotas to supply goods and services; Leverage India's lower labour costs for providing services and manufactured goods; Leverage India's large population of English speaking people for providing services.
Investment Performance
Birla Sun Life India Opportunities Fund - Growth S&P CNX 500
% R
etur
ns
Past performance may or may not be sustained in future. Returns are in % and absolute returns for period less than 1 year & CAGR for period 1 year or more.
SIP is a powerful tool that can help you create wealth over time. If you had invested in Birla Sun Life India Opportunities Fund...
Systematic Investment Plan (SIP)
Date of First Installment : January 01, 2000
The data assumes the investment of Rs.1,000/- on 1st day of every month or the subsequent working day. Load and Taxes are not considered for computation of returns. Past performance may or may not be sustained in future.
*CAGR Returns are computed after accounting for the cash flow by using the XIRR method (investment internal rate of return)
Investment Period Total Investment (Rs.) Birla Sun Life India
Opportunities FundBirla Sun Life India Opportunities Fund
S & P CNX 500 S & P CNX 500
Value (Rs.) of SIP in Returns (%)*
Since Inception 116000 329256 252496 20.54 15.41
Last 5 years 60000 88005 70787 15.31 6.55
Last 3 years 36000 42628 38609 11.29 4.60
Last 1 year 12000 17266 18191 90.52 108.00
Issuer % to NetAssets
Issuer % to NetAssets
Issuer % to NetAssets
Software 34.57Infosys Technologies Ltd. 7.93
Tata Consultancy Services Ltd. 6.38
Mphasis Ltd. 5.63
Infotech Enterprises Ltd. 3.27
Wipro Ltd. 2.95
Patni Computer Systems Ltd. 2.71
Sasken Communication Technologies Ltd. 2.39
MindTree Ltd. 2.01
Core Projects & Technologies Ltd. 1.29
Collabera Solutions Pvt. Ltd. ** #
Industrial Capital Goods 10.95Honeywell Automation India Ltd. 5.07
Crompton Greaves Ltd. 2.57
AIA Engineering Ltd. 2.17
Suzlon Energy Ltd. 1.14
Petroleum Products 7.64Reliance Industries Ltd. 7.64
Power 4.89KEC International Ltd. 4.89
Industrial Products 4.33Cummins India Ltd. 2.39
Sintex Industries Ltd. 1.94
Sree Rama Polymers Ltd** #
Pharmaceuticals 4.17Dr.Reddys Laboratories Ltd. 1.60
Dishman Pharmaceuticals & Chemicals Ltd. 1.34
Aventis Pharma Ltd. 1.23
Construction Project 3.80Punj Lloyd Ltd. 3.80
Ferrous Metals 3.43Tata Steel Limited 2.01
Welspun Gujarat Stahl Rohren Ltd. 1.42
Hardware 2.89Allied Digital Services Ltd. 2.89
Consumer Durables 2.74Voltas Ltd. 2.74
Finance 2.40CRISIL Ltd. 2.40
Telecom-Equipment & Accessories 2.33OnMobile Global Limited 2.33
Auto Ancillaries 2.10Apollo Tyres Ltd. 2.10
Non - Ferrous Metals 2.05
Sterlite Industries (India) Ltd. 2.05
Minerals/Mining 1.72
Sesa Goa Ltd. 1.72
Pesticides 1.71
United Phosphorus Ltd. 1.71
Paper 0.00
Jainpur Straw Board & Papers Ltd.** #
Consumer Non Durables 0.00
Oriqua Ltd ** #
Media & Entertainment 0.00
Magnasound India Ltd. ** #
Cash & Cash Equivalents 6.54
Net receivables / payables 1.74
Total Net Assets 100.00
Portfolio & Asset Allocation
** Represents thinly traded/ non traded securities and illiquid securities. # Indicates less than 0.01
5.71
-0.61
12.89
6.29
9.2710.68
22.34
12.71
-5
0
5
10
15
20
25
1 Year 3 Years 5 Years Since Inception
19
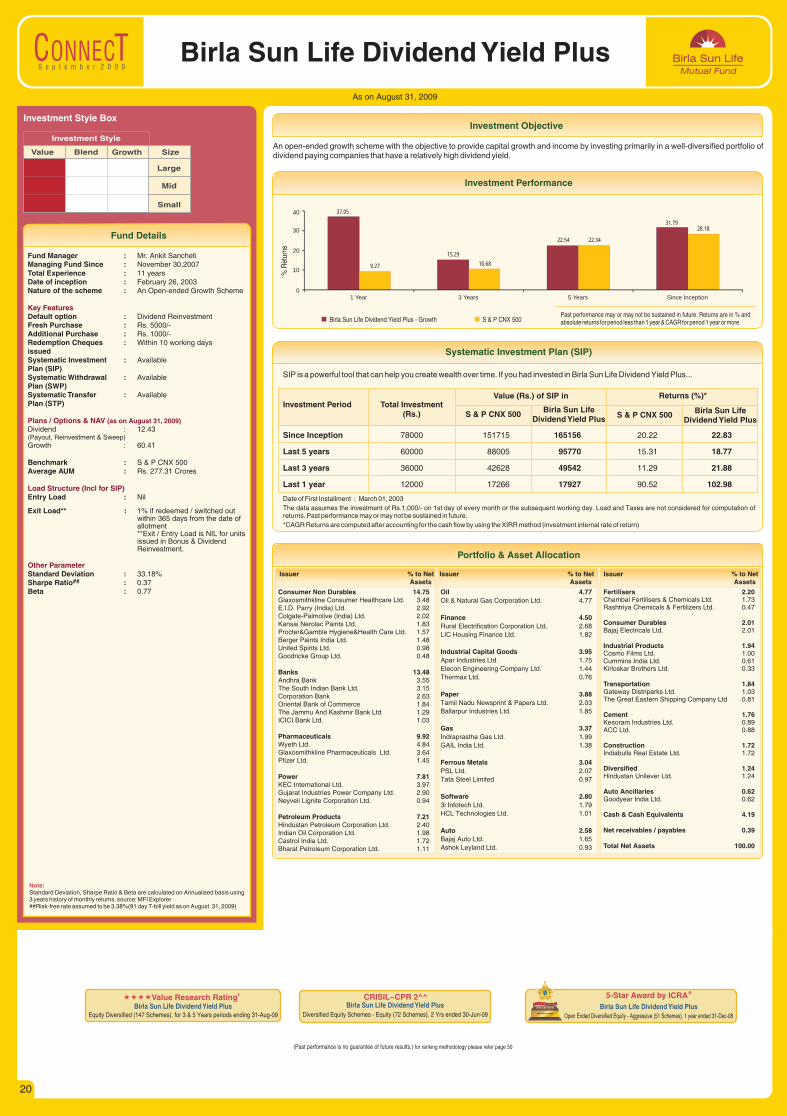
S e p t e m b e r 2 0 0 9
Fund Details
As on August 31, 2009
Investment Objective
Birla Sun Life Dividend Yield Plus
Value Blend Growth Size
Large
Mid
Small
Investment Style
Investment Style Box
Fund Manager :Managing Fund Since : November 30,2007Total Experience : 11 yearsDate of inception : February 26, 2003Nature of the scheme : An Open-ended Growth Scheme
Default option : Dividend ReinvestmentFresh Purchase : Rs. 5000/-Additional Purchase : Rs. 1000/-Redemption Cheques : Within 10 working days issuedSystematic Investment : Available Plan (SIP)Systematic Withdrawal : Available Plan (SWP)Systematic Transfer : AvailablePlan (STP)
Dividend : 12.43(Payout, Reinvestment & Sweep)Growth : 60.41
Benchmark : S & P CNX 500Average AUM : Rs. 277.31 Crores
Entry Load : Nil
Exit Load** : 1% if redeemed / switched out within 365 days from the date of allotment**Exit / Entry Load is NIL for units issued in Bonus & Dividend Reinvestment.
Standard Deviation : 33.18%##Sharpe Ratio : 0.37
Beta : 0.77
Mr. Ankit Sancheti
Key Features
Plans / Options & NAV
Load Structure (Incl for SIP)
Other Parameter
(as on August 31, 2009)
Note: Standard Deviation, Sharpe Ratio & Beta are calculated on Annualised basis using 3 years history of monthly returns, source: MFI Explorer##Risk-free rate assumed to be 3.38%(91 day T-bill yield as on August 31, 2009)
An open-ended growth scheme with the objective to provide capital growth and income by investing primarily in a well-diversified portfolio of dividend paying companies that have a relatively high dividend yield.
Investment Performance
Birla Sun Life Dividend Yield Plus - Growth S & P CNX 500
% R
etur
ns
Past performance may or may not be sustained in future. Returns are in % and absolute returns for period less than 1 year & CAGR for period 1 year or more.
SIP is a powerful tool that can help you create wealth over time. If you had invested in Birla Sun Life Dividend Yield Plus...
Systematic Investment Plan (SIP)
Date of First Installment : March 01, 2003
The data assumes the investment of Rs.1,000/- on 1st day of every month or the subsequent working day. Load and Taxes are not considered for computation of returns. Past performance may or may not be sustained in future.
*CAGR Returns are computed after accounting for the cash flow by using the XIRR method (investment internal rate of return)
Investment Period Total Investment (Rs.) Birla Sun Life
Dividend Yield PlusBirla Sun Life
Dividend Yield PlusS & P CNX 500 S & P CNX 500
Value (Rs.) of SIP in Returns (%)*
Since Inception 78000 151715 165156 20.22 22.83
Last 5 years 60000 88005 95770 15.31 18.77
Last 3 years 36000 42628 49542 11.29 21.88
Last 1 year 12000 17266 17927 90.52 102.98
Issuer % to NetAssets
Issuer % to NetAssets
Issuer % to NetAssets
Consumer Non Durables 14.75Glaxosmithkline Consumer Healthcare Ltd. 3.48E.I.D. Parry (India) Ltd. 2.92Colgate-Palmolive (India) Ltd. 2.02Kansai Nerolac Paints Ltd. 1.83Procter&Gamble Hygiene&Health Care Ltd. 1.57Berger Paints India Ltd. 1.48United Spirits Ltd. 0.98Goodricke Group Ltd. 0.48
Banks 13.48Andhra Bank 3.55The South Indian Bank Ltd. 3.15Corporation Bank 2.63Oriental Bank of Commerce 1.84The Jammu And Kashmir Bank Ltd 1.29ICICI Bank Ltd. 1.03
Pharmaceuticals 9.92Wyeth Ltd. 4.84Glaxosmithkline Pharmaceuticals Ltd. 3.64Pfizer Ltd. 1.45
Power 7.81KEC International Ltd. 3.97Gujarat Industries Power Company Ltd. 2.90Neyveli Lignite Corporation Ltd. 0.94
Petroleum Products 7.21Hindustan Petroleum Corporation Ltd. 2.40Indian Oil Corporation Ltd. 1.98Castrol India Ltd. 1.72Bharat Petroleum Corporation Ltd. 1.11
Oil 4.77Oil & Natural Gas Corporation Ltd. 4.77
Finance 4.50Rural Electrification Corporation Ltd. 2.68
LIC Housing Finance Ltd. 1.82
Industrial Capital Goods 3.95Apar Industries Ltd. 1.75
Elecon Engineering Company Ltd. 1.44
Thermax Ltd. 0.76
Paper 3.88Tamil Nadu Newsprint & Papers Ltd. 2.03
Ballarpur Industries Ltd. 1.85
Gas 3.37Indraprastha Gas Ltd. 1.99
GAIL India Ltd. 1.38
Ferrous Metals 3.04PSL Ltd. 2.07
Tata Steel Limited 0.97
Software 2.803i Infotech Ltd. 1.79
HCL Technologies Ltd. 1.01
Auto 2.58Bajaj Auto Ltd. 1.65
Ashok Leyland Ltd. 0.93
Fertilisers 2.20Chambal Fertilisers & Chemicals Ltd. 1.73Rashtriya Chemicals & Fertilizers Ltd. 0.47
Consumer Durables 2.01Bajaj Electricals Ltd. 2.01
Industrial Products 1.94Cosmo Films Ltd. 1.00Cummins India Ltd. 0.61Kirloskar Brothers Ltd. 0.33
Transportation 1.84Gateway Distriparks Ltd. 1.03The Great Eastern Shipping Company Ltd 0.81
Cement 1.76Kesoram Industries Ltd. 0.89ACC Ltd. 0.88
Construction 1.72Indiabulls Real Estate Ltd. 1.72
Diversified 1.24Hindustan Unilever Ltd. 1.24
Auto Ancillaries 0.62Goodyear India Ltd. 0.62
Cash & Cash Equivalents 4.19
Net receivables / payables 0.39
Total Net Assets 100.00
Portfolio & Asset Allocation
5-Star Award by @ICRABirla Sun Life Dividend Yield Plus
Open Ended Diversified Equity - Aggressive (51 Schemes), 1 year ended 31-Dec-08
(Past performance is no guarantee of future results.) for ranking methodology please refer page 50
CRISIL~CPR 2^^Birla Sun Life Dividend Yield Plus
Diversified Equity Schemes - Equity ( Schemes), 2 72 Yrs ended 30-Jun-09
«««« #Value Research RatingBirla Sun Life Dividend Yield Plus
Equity Diversified (147 Schemes), for 3 & 5 Years periods ending 31-Aug-09
37.05
15.29
22.54
31.79
9.27 10.68
22.34
28.18
0
10
20
30
40
1 Year 3 Years 5 Years Since Inception
20
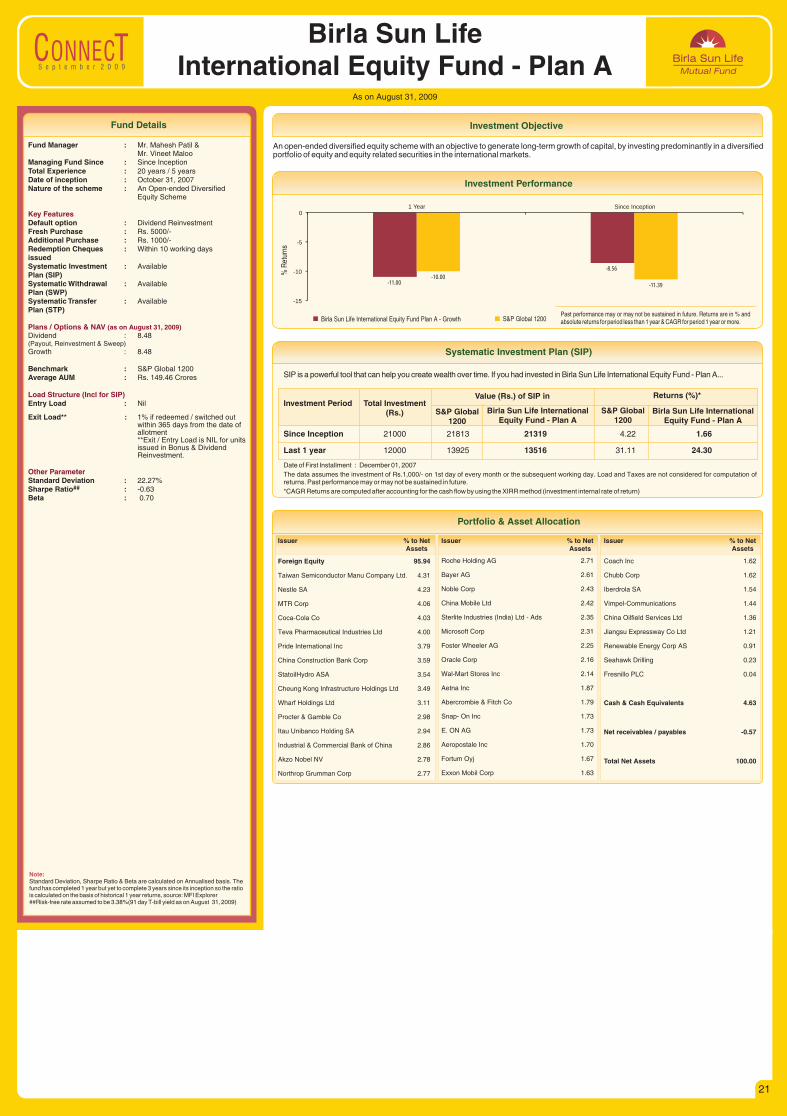
S e p t e m b e r 2 0 0 9
As on August 31, 2009
Investment ObjectiveFund Details
Birla Sun Life International Equity Fund - Plan A
Fund Manager :Mr. Vineet Maloo
Managing Fund Since : Since InceptionTotal Experience : 20 years / 5 yearsDate of inception : October 31, 2007Nature of the scheme : An Open-ended Diversified
Equity Scheme
Default option : Dividend ReinvestmentFresh Purchase : Rs. 5000/-Additional Purchase : Rs. 1000/-Redemption Cheques : Within 10 working days issuedSystematic Investment : Available Plan (SIP)Systematic Withdrawal : Available Plan (SWP)Systematic Transfer : AvailablePlan (STP)
Dividend : 8.48(Payout, Reinvestment & Sweep)Growth : 8.48
Benchmark : S&P Global 1200Average AUM : Rs. 149.46 Crores
Entry Load : Nil
Exit Load** : 1% if redeemed / switched out within 365 days from the date of allotment**Exit / Entry Load is NIL for units issued in Bonus & Dividend Reinvestment.
Standard Deviation : 22.27%##Sharpe Ratio : -0.63
Beta : 0.70
Mr. Mahesh Patil &
Key Features
Plans / Options & NAV
Load Structure (Incl for SIP)
Other Parameter
(as on August 31, 2009)
Note: Standard Deviation, Sharpe Ratio & Beta are calculated on Annualised basis. fund has completed 1 year but yet to complete 3 years since its inception so the ratio is calculated on the basis of historical 1 year returns, source: MFI Explorer##Risk-free rate assumed to be 3.38%(91 day T-bill yield as on August 31, 2009)
The
An open-ended diversified equity scheme with an objective to generate long-term growth of capital, by investing predominantly in a diversified portfolio of equity and equity related securities in the international markets.
Investment Performance
Birla Sun Life International Equity Fund Plan A - Growth S&P Global 1200
% R
etur
ns
Past performance may or may not be sustained in future. Returns are in % and absolute returns for period less than 1 year & CAGR for period 1 year or more.
SIP is a powerful tool that can help you create wealth over time. If you had invested in Birla Sun Life International Equity Fund - Plan A...
Systematic Investment Plan (SIP)
Date of First Installment : December 01, 2007
The data assumes the investment of Rs.1,000/- on 1st day of every month or the subsequent working day. Load and Taxes are not considered for computation of returns. Past performance may or may not be sustained in future.
*CAGR Returns are computed after accounting for the cash flow by using the XIRR method (investment internal rate of return)
Investment Period Total Investment (Rs.) Birla Sun Life International
Equity Fund - Plan ABirla Sun Life International
Equity Fund - Plan AS&P Global
1200S&P Global
1200
Value (Rs.) of SIP in Returns (%)*
Since Inception 21000 21813 21319 4.22 1.66
Last 1 year 12000 13925 13516 31.11 24.30
Issuer % to NetAssets
Issuer % to NetAssets
Issuer % to NetAssets
Foreign Equity 95.94
Taiwan Semiconductor Manu Company Ltd. 4.31
Nestle SA 4.23
MTR Corp 4.06
Coca-Cola Co 4.03
Teva Pharmaceutical Industries Ltd 4.00
Pride International Inc 3.79
China Construction Bank Corp 3.59
StatoilHydro ASA 3.54
Cheung Kong Infrastructure Holdings Ltd 3.49
Wharf Holdings Ltd 3.11
Procter & Gamble Co 2.98
Itau Unibanco Holding SA 2.94
Industrial & Commercial Bank of China 2.86
Akzo Nobel NV 2.78
Northrop Grumman Corp 2.77
Roche Holding AG 2.71
Bayer AG 2.61
Noble Corp 2.43
China Mobile Ltd 2.42
Sterlite Industries (India) Ltd - Ads 2.35
Microsoft Corp 2.31
Foster Wheeler AG 2.25
Oracle Corp 2.16
Wal-Mart Stores Inc 2.14
Aetna Inc 1.87
Abercrombie & Fitch Co 1.79
Snap- On Inc 1.73
E. ON AG 1.73
Aeropostale Inc 1.70
Fortum Oyj 1.67
Exxon Mobil Corp 1.63
Coach Inc 1.62
Chubb Corp 1.62
Iberdrola SA 1.54
Vimpel-Communications 1.44
China Oilfield Services Ltd 1.36
Jiangsu Expressway Co Ltd 1.21
Renewable Energy Corp AS 0.91
Seahawk Drilling 0.23
Fresnillo PLC 0.04
Cash & Cash Equivalents 4.63
Net receivables / payables -0.57
Total Net Assets 100.00
Portfolio & Asset Allocation
-11.00
-8.56
-10.00
-11.39
-15
-10
-5
01 Year Since Inception
21

S e p t e m b e r 2 0 0 9
As on August 31, 2009
Investment ObjectiveFund Details
Birla Sun Life International Equity Fund - Plan B
Fund Manager :Mr. Vineet Maloo
Managing Fund Since : Since inceptionTotal Experience : 20 years / 5 yearsDate of inception : October 31, 2007Nature of the scheme : An Open-ended Diversified
Equity Scheme
Default option : Dividend ReinvestmentFresh Purchase : Rs. 5000/-Additional Purchase : Rs. 1000/-Redemption Cheques : Within 10 working days issued Systematic Investment : Available Plan (SIP)Systematic Withdrawal : Available Plan (SWP)Systematic Transfer : AvailablePlan (STP)
Dividend : 8.05(Payout, Reinvestment & Sweep)Growth : 8.05
Benchmark : Customised Index†Average AUM : Rs. 563.59 Crores
†A customized benchmark created using BSE 200 to the extent of 65% of portfolio and S&P Global 1200 to the extent of 35% of portfolio.
Entry Load : Nil
Exit Load** : 1% if redeemed / switched out within 365 days from the date of allotment**Exit / Entry Load is NIL for units issued in Bonus & Dividend Reinvestment.
Standard Deviation : 38.14%##Sharpe Ratio : 0.02
Beta : 0.83
Mr. Mahesh Patil &
Key Features
Plans / Options & NAV
Load Structure (Incl for SIP)
Other Parameter
(as on August 31, 2009)
Note: Standard Deviation, Sharpe Ratio & Beta are calculated on Annualised basis.fund has completed 1 year but yet to complete 3 years since its inception so the ratio is calculated on the basis of historical 1 year returns, source: MFI Explorer##Risk-free rate assumed to be 3.38%(91 day T-bill yield as on August 31, 2009)
The
An open-ended diversified equity scheme with an objective to generate long-term growth of capital, by investing predominantly in a diversified portfolio of equity and equity related securities in the domestic and international markets.
Investment Performance
Birla Sun Life International Equity Fund Plan B - Growth Customized Index+
% R
etur
ns
Past performance may or may not be sustained in future. Returns are in % and absolute returns for period less than 1 year & CAGR for period 1 year or more.
+ A customized benchmark created using BSE 200 to the extent of 65% of portfolio and S&P Global 1200 to the extent of 35% of Portfolio.
SIP is a powerful tool that can help you create wealth over time. If you had invested in Birla Sun Life International Equity Fund - Plan B...
Systematic Investment Plan (SIP)
Date of First Installment : December 01, 2007
The data assumes the investment of Rs.1,000/- on 1st day of every month or the subsequent working day. Load and Taxes are not considered for computation of returns. Past performance may or may not be sustained in future.
*CAGR Returns are computed after accounting for the cash flow by using the XIRR method (investment internal rate of return)
†A customized benchmark created using BSE 200 to the extent of 65% of portfolio and S&P Global 1200 to the extent of 35% of portfolio.
Investment Period Total Investment (Rs.) Birla Sun Life International
Equity Fund - Plan BBirla Sun Life International
Equity Fund - Plan BCustomised
Index†Customised
Index†
Value (Rs.) of SIP in Returns (%)*
Since Inception 21000 24599 23921 18.42 15.00
Last 1 year 12000 16162 15690 70.18 61.70
Issuer % to NetAssets
Issuer % to NetAssets
Issuer % to NetAssets
Foreign Equity 26.98Sterlite Industries (India) Ltd - Ads 1.67Taiwan Semiconductor Manufacturing Co Ltd. 1.05Tata Steel Ltd GDR 1.01Nestle SA 0.97Bayer AG 0.94MTR Corp 0.93Coca-Cola Co 0.93Wharf Holdings Ltd 0.92Pride International Inc 0.87Itau Unibanco Holding SA 0.86Industrial & Commercial Bank of China 0.85China Construction Bank Corp 0.82StatoilHydro ASA 0.81Akzo Nobel NV 0.81Roche Holding AG 0.78Teva Pharmaceutical Industries Ltd 0.77Cheung Kong Infrastructure Holdings Ltd 0.72Procter & Gamble Co 0.71Noble Corp 0.71Foster Wheeler AG 0.70Microsoft Corp 0.67Northrop Grumman Corp 0.64Oracle Corp 0.63Abercrombie & Fitch Co 0.56Aetna Inc 0.56China Mobile Ltd 0.55Snap- On Inc 0.54Aeropostale Inc 0.52Coach Inc 0.52Wal-Mart Stores Inc 0.49Exxon Mobil Corp 0.47Chubb Corp 0.43Vimpel-Communications 0.41China Oilfield Services Ltd 0.40E. ON AG 0.39Fortum Oyj 0.38Iberdrola SA 0.35Jiangsu Expressway Co Ltd 0.28Renewable Energy Corp AS 0.28Seahawk Drilling 0.05
Banks 9.72ICICI Bank Ltd. 2.28
HDFC Bank Ltd. 1.74
Axis Bank Ltd. 1.67
ING Vysya Bank Ltd. 1.62
State Bank of India 1.37
Union Bank of India 1.04
Software 7.17Infosys Technologies Ltd. 4.52
Tata Consultancy Services Ltd. 2.13
MindTree Ltd. 0.53
Petroleum Products 6.20Reliance Industries Ltd. 5.62
Indian Oil Corporation Ltd. 0.58
Power 5.40Tata Power Company Ltd. 1.65
Reliance Infrastructure Ltd. 1.34
NTPC Ltd. 1.12
PTC India Ltd 0.80
NHPC Ltd.** 0.49
Telecom-Services 5.35Bharti Airtel Ltd. 4.10
Reliance Communications Ltd. 1.25
Industrial Capital Goods 4.73Bharat Heavy Electricals Ltd. 1.67
Crompton Greaves Ltd. 1.12
Siemens Ltd. 0.85
BEML Ltd. 0.76
Bharat Electronics Ltd. 0.33
Consumer Non Durables 4.59ITC Ltd. 2.42
United Breweries Holdings Ltd. 1.24
Colgate-Palmolive (India) Ltd. 0.93
Oil 4.34Oil & Natural Gas Corporation Ltd. 4.34
Finance 4.09ICRA Ltd. 2.17
HDFC Ltd. 1.93
Construction Project 2.92Larsen & Toubro Ltd. 1.58
Punj Lloyd Ltd. 1.34
Cement 2.88Century Textiles and Industries Ltd 1.07
Grasim Industries Ltd. 0.94
Ultratech Cement Ltd. 0.87
Auto 2.59Tata Motors Ltd. 1.56
Maruti Suzuki India Ltd. 1.03
Construction 2.11Housing Development & Infrastructure Ltd 1.11
Unitech Ltd. 0.56
D.S. Kulkarni Developers Ltd. 0.44
Ferrous Metals 1.79Tata Steel Limited 0.78
JSW Steel Ltd. 0.57
Jindal Saw Ltd. 0.43
Pharmaceuticals 1.73Dr.Reddys Laboratories Ltd. 1.73
Media & Entertainment 1.41Zee Entertainment Enterprises Ltd. 1.41
Non - Ferrous Metals 0.23Hindustan Zinc Ltd 0.23
Cash & Cash Equivalents 5.61
Net receivables / payables 0.16
Total Net Assets 100.00
Portfolio & Asset Allocation
** Represents thinly traded/ non traded securities and illiquid securities. Total Percentage of thinly/non traded securities is 0.49%
4.20
-11.13
3.67
-10.15
-15
-10
-5
0
5
1 Year
Since Inception
22
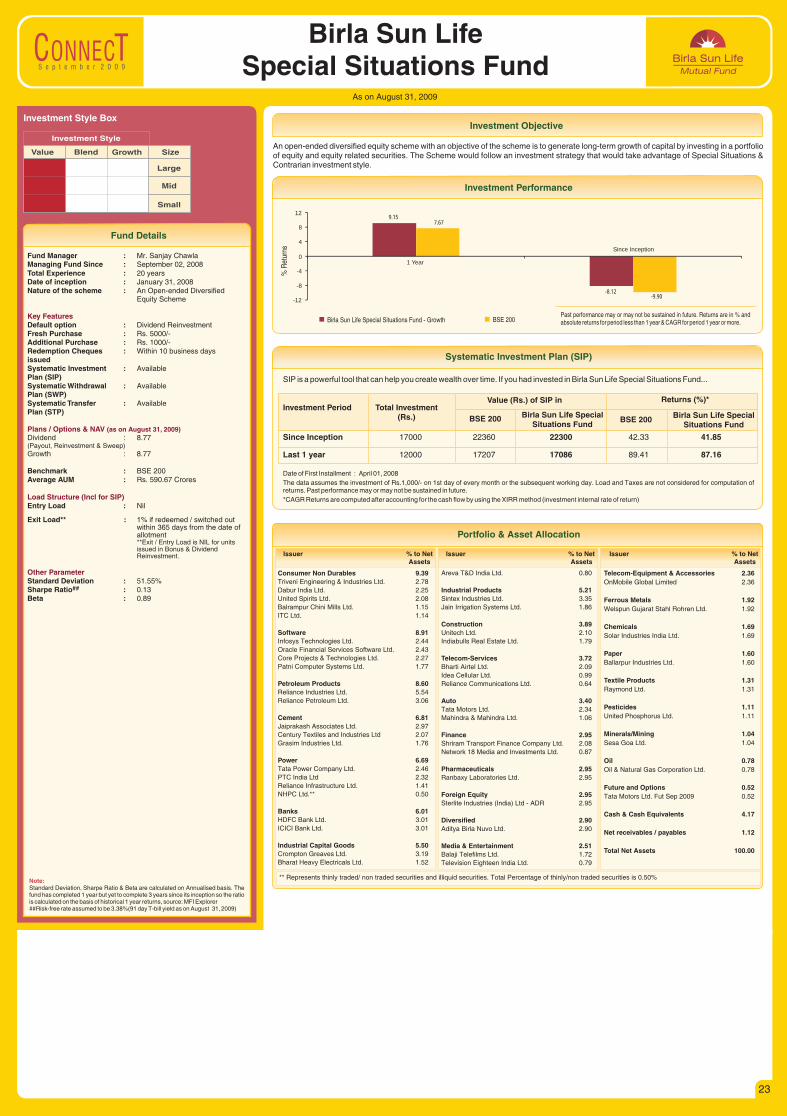
S e p t e m b e r 2 0 0 9
Fund Details
As on August 31, 2009
Investment Objective
Birla Sun Life Special Situations Fund
Value Blend Growth Size
Large
Mid
Small
Investment Style
Investment Style Box
Fund Manager :Managing Fund Since : September 02, 2008Total Experience : 20 yearsDate of inception : January 31, 2008Nature of the scheme : An Open-ended Diversified
Equity Scheme
Default option : Dividend ReinvestmentFresh Purchase : Rs. 5000/-Additional Purchase : Rs. 1000/-Redemption Cheques : Within 10 business days issuedSystematic Investment : Available Plan (SIP)Systematic Withdrawal : Available Plan (SWP)Systematic Transfer : AvailablePlan (STP)
Dividend : 8.77(Payout, Reinvestment & Sweep)Growth : 8.77
Benchmark : BSE 200Average AUM : Rs. 590.67 Crores
Entry Load : Nil
Exit Load** : 1% if redeemed / switched out within 365 days from the date of allotment**Exit / Entry Load is NIL for units issued in Bonus & Dividend Reinvestment.
Standard Deviation : 51.55%##Sharpe Ratio : 0.13
Beta : 0.89
Mr. Sanjay Chawla
Key Features
Plans / Options & NAV
Load Structure (Incl for SIP)
Other Parameter
(as on August 31, 2009)
Note: Standard Deviation, Sharpe Ratio & Beta are calculated on Annualised basis. fund has completed 1 year but yet to complete 3 years since its inception so the ratio is calculated on the basis of historical 1 year returns, source: MFI Explorer##Risk-free rate assumed to be 3.38%(91 day T-bill yield as on August 31, 2009)
The
An open-ended diversified equity scheme with an objective of the scheme is to generate long-term growth of capital by investing in a portfolio of equity and equity related securities. The Scheme would follow an investment strategy that would take advantage of Special Situations & Contrarian investment style.
Investment Performance
Birla Sun Life Special Situations Fund - Growth BSE 200
% R
etur
ns
Past performance may or may not be sustained in future. Returns are in % and absolute returns for period less than 1 year & CAGR for period 1 year or more.
SIP is a powerful tool that can help you create wealth over time. If you had invested in Birla Sun Life Special Situations Fund...
Systematic Investment Plan (SIP)
Date of First Installment : April 01, 2008
The data assumes the investment of Rs.1,000/- on 1st day of every month or the subsequent working day. Load and Taxes are not considered for computation of returns. Past performance may or may not be sustained in future.
*CAGR Returns are computed after accounting for the cash flow by using the XIRR method (investment internal rate of return)
Investment Period Total Investment (Rs.) Birla Sun Life Special
Situations FundBirla Sun Life Special
Situations FundBSE 200 BSE 200
Value (Rs.) of SIP in Returns (%)*
Since Inception 17000 22360 22300 42.33 41.85
Last 1 year 12000 17207 17086 89.41 87.16
Issuer % to NetAssets
Issuer % to NetAssets
Issuer % to NetAssets
Consumer Non Durables 9.39Triveni Engineering & Industries Ltd. 2.78
Dabur India Ltd. 2.25
United Spirits Ltd. 2.08
Balrampur Chini Mills Ltd. 1.15
ITC Ltd. 1.14
Software 8.91Infosys Technologies Ltd. 2.44
Oracle Financial Services Software Ltd. 2.43
Core Projects & Technologies Ltd. 2.27
Patni Computer Systems Ltd. 1.77
Petroleum Products 8.60Reliance Industries Ltd. 5.54
Reliance Petroleum Ltd. 3.06
Cement 6.81Jaiprakash Associates Ltd. 2.97
Century Textiles and Industries Ltd 2.07
Grasim Industries Ltd. 1.76
Power 6.69Tata Power Company Ltd. 2.46
PTC India Ltd 2.32
Reliance Infrastructure Ltd. 1.41
NHPC Ltd.** 0.50
Banks 6.01HDFC Bank Ltd. 3.01
ICICI Bank Ltd. 3.01
Industrial Capital Goods 5.50Crompton Greaves Ltd. 3.19
Bharat Heavy Electricals Ltd. 1.52
Areva T&D India Ltd. 0.80
Industrial Products 5.21Sintex Industries Ltd. 3.35
Jain Irrigation Systems Ltd. 1.86
Construction 3.89Unitech Ltd. 2.10
Indiabulls Real Estate Ltd. 1.79
Telecom-Services 3.72Bharti Airtel Ltd. 2.09
Idea Cellular Ltd. 0.99
Reliance Communications Ltd. 0.64
Auto 3.40Tata Motors Ltd. 2.34
Mahindra & Mahindra Ltd. 1.06
Finance 2.95Shriram Transport Finance Company Ltd. 2.08
Network 18 Media and Investments Ltd. 0.87
Pharmaceuticals 2.95Ranbaxy Laboratories Ltd. 2.95
Foreign Equity 2.95Sterlite Industries (India) Ltd - ADR 2.95
Diversified 2.90Aditya Birla Nuvo Ltd. 2.90
Media & Entertainment 2.51Balaji Telefilms Ltd. 1.72
Television Eighteen India Ltd. 0.79
Telecom-Equipment & Accessories 2.36OnMobile Global Limited 2.36
Ferrous Metals 1.92Welspun Gujarat Stahl Rohren Ltd. 1.92
Chemicals 1.69Solar Industries India Ltd. 1.69
Paper 1.60Ballarpur Industries Ltd. 1.60
Textile Products 1.31Raymond Ltd. 1.31
Pesticides 1.11United Phosphorus Ltd. 1.11
Minerals/Mining 1.04Sesa Goa Ltd. 1.04
Oil 0.78Oil & Natural Gas Corporation Ltd. 0.78
Future and Options 0.52Tata Motors Ltd. Fut Sep 2009 0.52
Cash & Cash Equivalents 4.17
Net receivables / payables 1.12
Total Net Assets 100.00
Portfolio & Asset Allocation
** Represents thinly traded/ non traded securities and illiquid securities. Total Percentage of thinly/non traded securities is 0.50%
9.15
-8.12
7.67
-9.90-12
-8
-4
0
4
8
12
1 Year
Since Inception
23
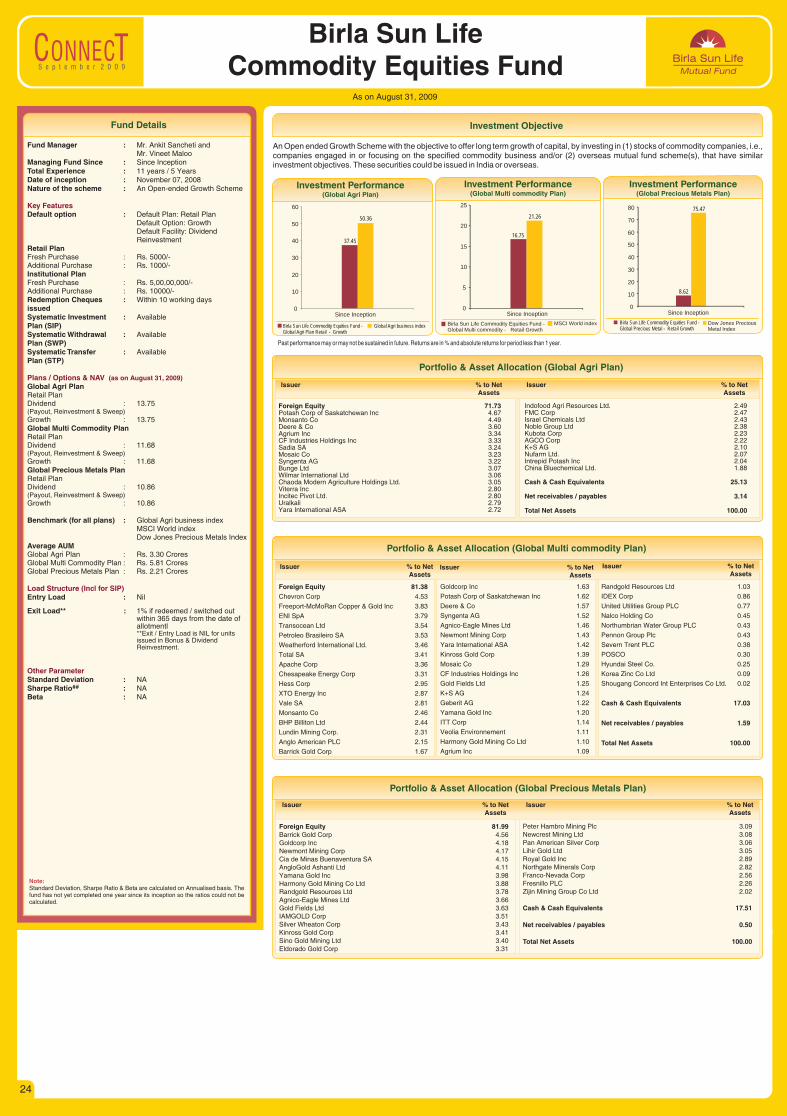
S e p t e m b e r 2 0 0 9
As on August 31, 2009
Investment ObjectiveFund Details
Birla Sun Life Commodity Equities Fund
Fund Manager :Mr. Vineet Maloo
Managing Fund Since : Since InceptionTotal Experience : 11 years / 5 YearsDate of inception : November 07, 2008Nature of the scheme : An Open-ended Growth Scheme
Default option : Default Plan: Retail PlanDefault Option: GrowthDefault Facility: Dividend Reinvestment
Retail PlanFresh Purchase : Rs. 5000/-Additional Purchase : Rs. 1000/-Institutional PlanFresh Purchase : Rs. 5,00,00,000/-Additional Purchase : Rs. 10000/-Redemption Cheques : Within 10 working days issuedSystematic Investment : Available Plan (SIP)Systematic Withdrawal : Available Plan (SWP)Systematic Transfer : AvailablePlan (STP)
Global Agri PlanRetail PlanDividend : 13.75(Payout, Reinvestment & Sweep)Growth : 13.75Global Multi Commodity PlanRetail PlanDividend : 11.68(Payout, Reinvestment & Sweep)Growth : 11.68Global Precious Metals PlanRetail PlanDividend : 10.86(Payout, Reinvestment & Sweep)Growth : 10.86
Benchmark (for all plans) : Global Agri business indexMSCI World indexDow Jones Precious Metals Index
Average AUMGlobal Agri Plan : Rs. 3.30 CroresGlobal Multi Commodity Plan : Rs. 5.81 CroresGlobal Precious Metals Plan : Rs. 2.21 Crores
Entry Load : Nil
Exit Load** : 1% if redeemed / switched out within 365 days from the date of allotmentl**Exit / Entry Load is NIL for units issued in Bonus & Dividend Reinvestment.
Standard Deviation : NA##Sharpe Ratio : NA
Beta : NA
Mr. Ankit Sancheti and
Key Features
Plans / Options & NAV
Load Structure (Incl for SIP)
Other Parameter
(as on August 31, 2009)
An Open ended Growth Scheme with the objective to offer long term growth of capital, by investing in (1) stocks of commodity companies, i.e., companies engaged in or focusing on the specified commodity business and/or (2) overseas mutual fund scheme(s), that have similar investment objectives. These securities could be issued in India or overseas.
Note: Standard Deviation, Sharpe Ratio & Beta are calculated on Annualised basis. fund has not yet completed one year since its inception so the ratios could not be calculated.
The
Investment Performance(Global Multi commodity Plan)
Investment Performance(Global Agri Plan)
Investment Performance(Global Precious Metals Plan)
Birla Sun Life Commodity Equities Fund - Global Agri Plan Retail - Growth
Global Agri business index Birla Sun Life Commodity Equities Fund - Global Multi commodity - Retail Growth
MSCI World index Birla Sun Life Commodity Equities Fund - Global Precious Metal - Retail Growth
Dow Jones Precious Metal Index
Past performance may or may not be sustained in future. Returns are in % and absolute returns for period less than 1 year.
Issuer % to NetAssets
Issuer % to NetAssets
Portfolio & Asset Allocation (Global Agri Plan)
Foreign Equity 71.73Potash Corp of Saskatchewan Inc 4.67Monsanto Co 4.49Deere & Co 3.60Agrium Inc 3.34CF Industries Holdings Inc 3.33Sadia SA 3.24Mosaic Co 3.23Syngenta AG 3.22Bunge Ltd 3.07Wilmar International Ltd 3.06Chaoda Modern Agriculture Holdings Ltd. 3.05Viterra Inc 2.80Incitec Pivot Ltd. 2.80Uralkali 2.79Yara International ASA 2.72
Indofood Agri Resources Ltd. 2.49FMC Corp 2.47Israel Chemicals Ltd 2.43Noble Group Ltd 2.38Kubota Corp 2.23AGCO Corp 2.22K+S AG 2.10Nufarm Ltd. 2.07Intrepid Potash Inc 2.04China Bluechemical Ltd. 1.88
Cash & Cash Equivalents 25.13
Net receivables / payables 3.14
Total Net Assets 100.00
Portfolio & Asset Allocation (Global Multi commodity Plan)
Issuer % to NetAssets
Issuer % to NetAssets
Issuer % to NetAssets
Foreign Equity 81.38Chevron Corp 4.53
Freeport-McMoRan Copper & Gold Inc 3.83
ENI SpA 3.79
Transocean Ltd 3.54
Petroleo Brasileiro SA 3.53
Weatherford International Ltd. 3.46
Total SA 3.41
Apache Corp 3.36
Chesapeake Energy Corp 3.31
Hess Corp 2.95
XTO Energy Inc 2.87
Vale SA 2.81
Monsanto Co 2.46
BHP Billiton Ltd 2.44
Lundin Mining Corp. 2.31
Anglo American PLC 2.15
Barrick Gold Corp 1.67
Goldcorp Inc 1.63
Potash Corp of Saskatchewan Inc 1.62
Deere & Co 1.57
Syngenta AG 1.52
Agnico-Eagle Mines Ltd 1.46
Newmont Mining Corp 1.43
Yara International ASA 1.42
Kinross Gold Corp 1.39
Mosaic Co 1.29
CF Industries Holdings Inc 1.26
Gold Fields Ltd 1.25
K+S AG 1.24
Geberit AG 1.22
Yamana Gold Inc 1.20
ITT Corp 1.14
Veolia Environnement 1.11
Harmony Gold Mining Co Ltd 1.10
Agrium Inc 1.09
Portfolio & Asset Allocation (Global Precious Metals Plan)
Issuer % to NetAssets
Issuer % to NetAssets
Foreign Equity 81.99Barrick Gold Corp 4.56Goldcorp Inc 4.18Newmont Mining Corp 4.17Cia de Minas Buenaventura SA 4.15AngloGold Ashanti Ltd 4.11Yamana Gold Inc 3.98Harmony Gold Mining Co Ltd 3.88Randgold Resources Ltd 3.78Agnico-Eagle Mines Ltd 3.66Gold Fields Ltd 3.63IAMGOLD Corp 3.51Silver Wheaton Corp 3.43Kinross Gold Corp 3.41Sino Gold Mining Ltd 3.40Eldorado Gold Corp 3.31
Peter Hambro Mining Plc 3.09Newcrest Mining Ltd 3.08Pan American Silver Corp 3.06Lihir Gold Ltd 3.05Royal Gold Inc 2.89Northgate Minerals Corp 2.82Franco-Nevada Corp 2.56Fresnillo PLC 2.26Zijin Mining Group Co Ltd 2.02
Cash & Cash Equivalents 17.51
Net receivables / payables 0.50
Total Net Assets 100.00
Randgold Resources Ltd 1.03
IDEX Corp 0.86
United Utilities Group PLC 0.77
Nalco Holding Co 0.45
Northumbrian Water Group PLC 0.43
Pennon Group Plc 0.43
Severn Trent PLC 0.38
POSCO 0.30
Hyundai Steel Co. 0.25
Korea Zinc Co Ltd 0.09
Shougang Concord Int Enterprises Co Ltd. 0.02
Cash & Cash Equivalents 17.03
Net receivables / payables 1.59
Total Net Assets 100.00
Since Inception Since Inception Since Inception
37.45
50.36
0
10
20
30
40
50
60
16.75
21.26
0
5
10
15
20
25
8.62
75.47
0
10
20
30
40
50
60
70
80
24
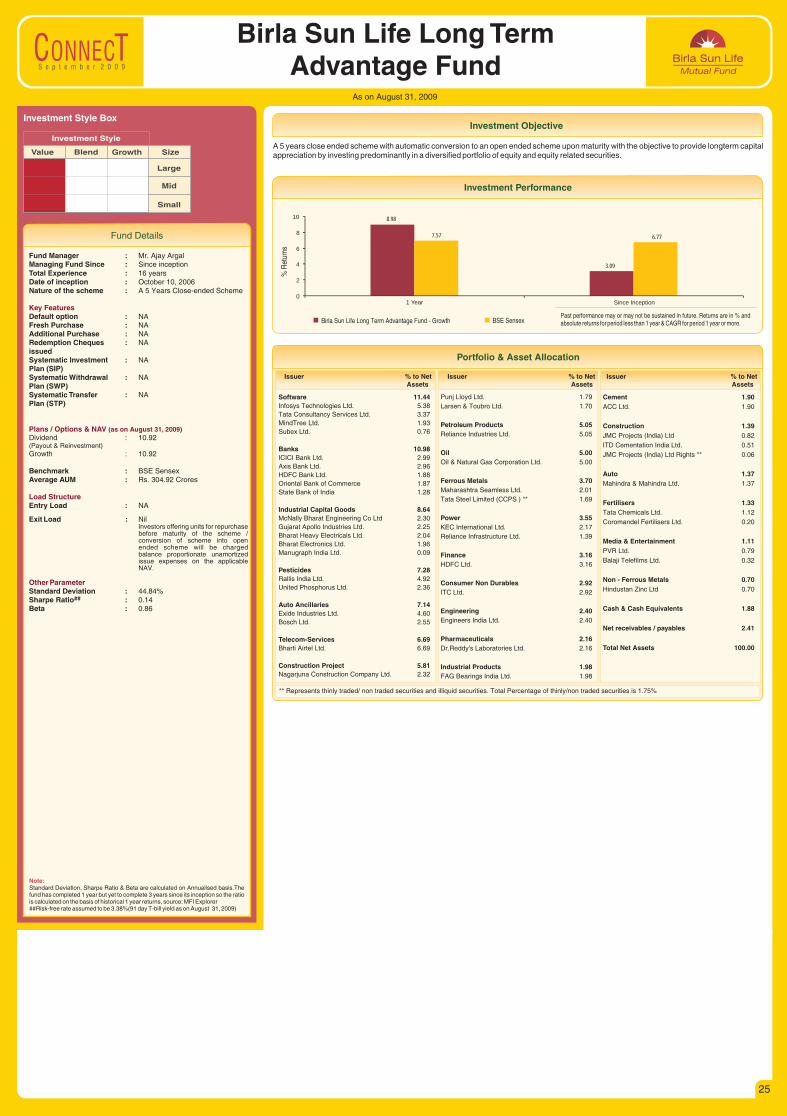
S e p t e m b e r 2 0 0 9
Fund Details
Investment Objective
Birla Sun Life Long Term Advantage Fund
As on August 31, 2009
Value Blend Growth Size
Large
Mid
Small
Investment Style
Investment Style Box
Fund Manager :Managing Fund Since : Since inceptionTotal Experience : 16 yearsDate of inception : October 10, 2006Nature of the scheme : A 5 Years Close-ended Scheme
Default option : NAFresh Purchase : NAAdditional Purchase : NARedemption Cheques : NAissuedSystematic Investment : NAPlan (SIP)Systematic Withdrawal : NAPlan (SWP)Systematic Transfer : NAPlan (STP)
Dividend : 10.92(Payout & Reinvestment)Growth : 10.92
Benchmark : BSE SensexAverage AUM : Rs. 304.92 Crores
Entry Load : NA
Exit Load : NilInvestors offering units for repurchase before maturity of the scheme / conversion of scheme into open ended scheme will be charged balance proportionate unamortized issue expenses on the applicable NAV.
Standard Deviation : 44.84%##Sharpe Ratio : 0.14
Beta : 0.86
Mr. Ajay Argal
Key Features
Plans / Options & NAV
Load Structure
Other Parameter
(as on August 31, 2009)
Note: Standard Deviation, Sharpe Ratio & Beta are calculated on Annualised basis.fund has completed 1 year but yet to complete 3 years since its inception so the ratio is calculated on the basis of historical 1 year returns, source: MFI Explorer##Risk-free rate assumed to be 3.38%(91 day T-bill yield as on August 31, 2009)
The
A 5 years close ended scheme with automatic conversion to an open ended scheme upon maturity with the objective to provide longterm capital appreciation by investing predominantly in a diversified portfolio of equity and equity related securities.
Investment Performance
Birla Sun Life Long Term Advantage Fund - Growth BSE Sensex
% R
etur
ns
Past performance may or may not be sustained in future. Returns are in % and absolute returns for period less than 1 year & CAGR for period 1 year or more.
Issuer % to NetAssets
Issuer % to NetAssets
Issuer % to NetAssets
Software 11.44Infosys Technologies Ltd. 5.38
Tata Consultancy Services Ltd. 3.37
MindTree Ltd. 1.93
Subex Ltd. 0.76
Banks 10.98ICICI Bank Ltd. 2.99
Axis Bank Ltd. 2.96
HDFC Bank Ltd. 1.88
Oriental Bank of Commerce 1.87
State Bank of India 1.28
Industrial Capital Goods 8.64McNally Bharat Engineering Co Ltd 2.30
Gujarat Apollo Industries Ltd. 2.25
Bharat Heavy Electricals Ltd. 2.04
Bharat Electronics Ltd. 1.96
Manugraph India Ltd. 0.09
Pesticides 7.28Rallis India Ltd. 4.92
United Phosphorus Ltd. 2.36
Auto Ancillaries 7.14Exide Industries Ltd. 4.60
Bosch Ltd. 2.55
Telecom-Services 6.69Bharti Airtel Ltd. 6.69
Construction Project 5.81Nagarjuna Construction Company Ltd. 2.32
Punj Lloyd Ltd. 1.79
Larsen & Toubro Ltd. 1.70
Petroleum Products 5.05Reliance Industries Ltd. 5.05
Oil 5.00Oil & Natural Gas Corporation Ltd. 5.00
Ferrous Metals 3.70Maharashtra Seamless Ltd. 2.01
Tata Steel Limited (CCPS ) ** 1.69
Power 3.55KEC International Ltd. 2.17
Reliance Infrastructure Ltd. 1.39
Finance 3.16HDFC Ltd. 3.16
Consumer Non Durables 2.92ITC Ltd. 2.92
Engineering 2.40Engineers India Ltd. 2.40
Pharmaceuticals 2.16Dr.Reddy's Laboratories Ltd. 2.16
Industrial Products 1.98FAG Bearings India Ltd. 1.98
Cement 1.90ACC Ltd. 1.90
Construction 1.39JMC Projects (India) Ltd 0.82
ITD Cementation India Ltd. 0.51
JMC Projects (India) Ltd Rights ** 0.06
Auto 1.37Mahindra & Mahindra Ltd. 1.37
Fertilisers 1.33Tata Chemicals Ltd. 1.12
Coromandel Fertilisers Ltd. 0.20
Media & Entertainment 1.11PVR Ltd. 0.79
Balaji Telefilms Ltd. 0.32
Non - Ferrous Metals 0.70Hindustan Zinc Ltd 0.70
Cash & Cash Equivalents 1.88
Net receivables / payables 2.41
Total Net Assets 100.00
Portfolio & Asset Allocation
** Represents thinly traded/ non traded securities and illiquid securities. Total Percentage of thinly/non traded securities is 1.75%
8.98
3.09
7.57 6.77
0
2
4
6
8
10
1 Year Since Inception
25
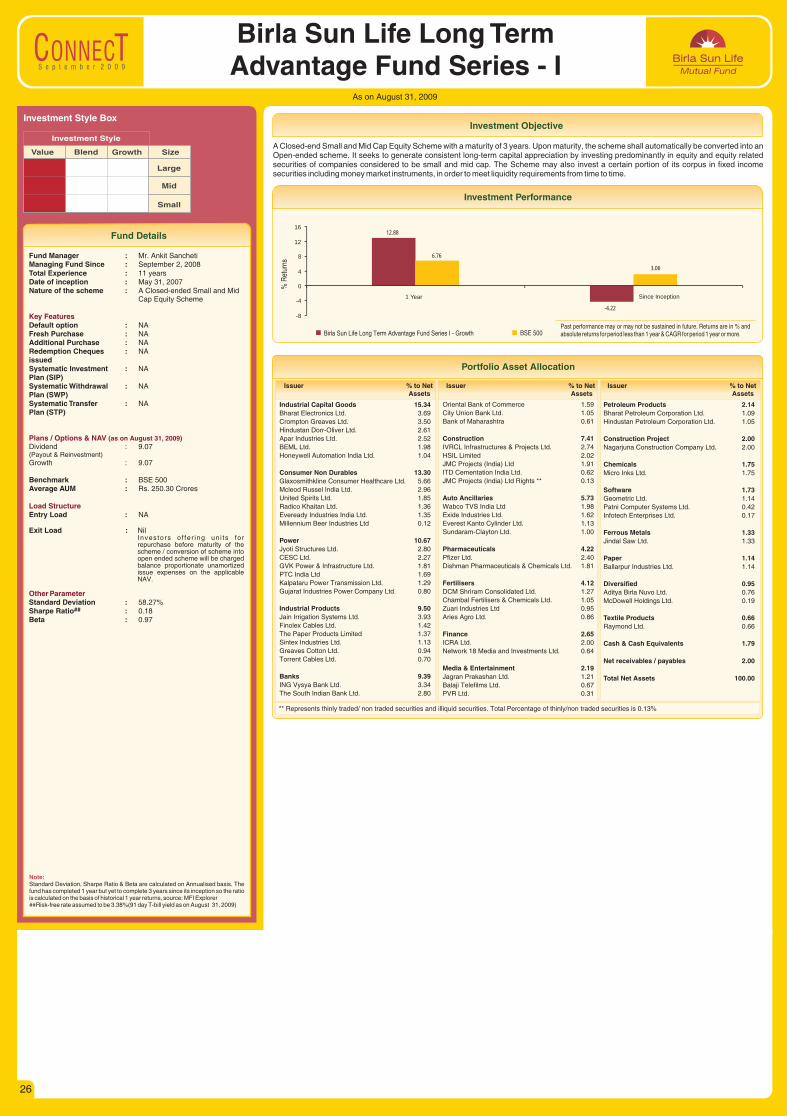
S e p t e m b e r 2 0 0 9
Fund Details
Investment Objective
As on August 31, 2009
Birla Sun Life Long Term Advantage Fund Series - I
Value Blend Growth Size
Large
Mid
Small
Investment Style
Investment Style Box
Fund Manager :Managing Fund Since : September 2, 2008Total Experience : 11 yearsDate of inception : May 31, 2007Nature of the scheme : A Closed-ended Small and Mid
Cap Equity Scheme
Default option : NAFresh Purchase : NAAdditional Purchase : NARedemption Cheques : NA issuedSystematic Investment : NAPlan (SIP)Systematic Withdrawal : NAPlan (SWP)Systematic Transfer : NAPlan (STP)
Dividend : 9.07(Payout & Reinvestment)Growth : 9.07
Benchmark : BSE 500Average AUM : Rs. 250.30 Crores
Entry Load : NA
Exit Load : NilInves tors o f fe r ing un i ts fo r repurchase before maturity of the scheme / conversion of scheme into open ended scheme will be charged balance proportionate unamortized issue expenses on the applicable NAV.
Standard Deviation : 58.27%##Sharpe Ratio : 0.18
Beta : 0.97
Mr. Ankit Sancheti
Key Features
Plans / Options & NAV
Load Structure
Other Parameter
(as on August 31, 2009)
Note: Standard Deviation, Sharpe Ratio & Beta are calculated on Annualised basis. fund has completed 1 year but yet to complete 3 years since its inception so the ratio is calculated on the basis of historical 1 year returns, source: MFI Explorer##Risk-free rate assumed to be 3.38%(91 day T-bill yield as on August 31, 2009)
The
A Closed-end Small and Mid Cap Equity Scheme with a maturity of 3 years. Upon maturity, the scheme shall automatically be converted into an Open-ended scheme. It seeks to generate consistent long-term capital appreciation by investing predominantly in equity and equity related securities of companies considered to be small and mid cap. The Scheme may also invest a certain portion of its corpus in fixed income securities including money market instruments, in order to meet liquidity requirements from time to time.
Investment Performance
Past performance may or may not be sustained in future. Returns are in % and absolute returns for period less than 1 year & CAGR for period 1 year or more. Birla Sun Life Long Term Advantage Fund Series I - Growth BSE 500
% R
etur
ns
Issuer % to NetAssets
Issuer % to NetAssets
Issuer % to NetAssets
Industrial Capital Goods 15.34Bharat Electronics Ltd. 3.69
Crompton Greaves Ltd. 3.50
Hindustan Dorr-Oliver Ltd. 2.61
Apar Industries Ltd. 2.52
BEML Ltd. 1.98
Honeywell Automation India Ltd. 1.04
Consumer Non Durables 13.30Glaxosmithkline Consumer Healthcare Ltd. 5.66
Mcleod Russel India Ltd. 2.96
United Spirits Ltd. 1.85
Radico Khaitan Ltd. 1.36
Eveready Industries India Ltd. 1.35
Millennium Beer Industries Ltd 0.12
Power 10.67Jyoti Structures Ltd. 2.80
CESC Ltd. 2.27
GVK Power & Infrastructure Ltd. 1.81
PTC India Ltd 1.69
Kalpataru Power Transmission Ltd. 1.29
Gujarat Industries Power Company Ltd. 0.80
Industrial Products 9.50Jain Irrigation Systems Ltd. 3.93
Finolex Cables Ltd. 1.42
The Paper Products Limited 1.37
Sintex Industries Ltd. 1.13
Greaves Cotton Ltd. 0.94
Torrent Cables Ltd. 0.70
Banks 9.39ING Vysya Bank Ltd. 3.34
The South Indian Bank Ltd. 2.80
Oriental Bank of Commerce 1.59
City Union Bank Ltd. 1.05
Bank of Maharashtra 0.61
Construction 7.41IVRCL Infrastructures & Projects Ltd. 2.74
HSIL Limited 2.02
JMC Projects (India) Ltd 1.91
ITD Cementation India Ltd. 0.62
JMC Projects (India) Ltd Rights ** 0.13
Auto Ancillaries 5.73Wabco TVS India Ltd 1.98
Exide Industries Ltd. 1.62
Everest Kanto Cylinder Ltd. 1.13
Sundaram-Clayton Ltd. 1.00
Pharmaceuticals 4.22Pfizer Ltd. 2.40
Dishman Pharmaceuticals & Chemicals Ltd. 1.81
Fertilisers 4.12DCM Shriram Consolidated Ltd. 1.27
Chambal Fertilisers & Chemicals Ltd. 1.05
Zuari Industries Ltd 0.95
Aries Agro Ltd. 0.86
Finance 2.65ICRA Ltd. 2.00
Network 18 Media and Investments Ltd. 0.64
Media & Entertainment 2.19Jagran Prakashan Ltd. 1.21
Balaji Telefilms Ltd. 0.67
PVR Ltd. 0.31
Petroleum Products 2.14Bharat Petroleum Corporation Ltd. 1.09
Hindustan Petroleum Corporation Ltd. 1.05
Construction Project 2.00Nagarjuna Construction Company Ltd. 2.00
Chemicals 1.75Micro Inks Ltd. 1.75
Software 1.73Geometric Ltd. 1.14
Patni Computer Systems Ltd. 0.42
Infotech Enterprises Ltd. 0.17
Ferrous Metals 1.33Jindal Saw Ltd. 1.33
Paper 1.14Ballarpur Industries Ltd. 1.14
Diversified 0.95Aditya Birla Nuvo Ltd. 0.76
McDowell Holdings Ltd. 0.19
Textile Products 0.66Raymond Ltd. 0.66
Cash & Cash Equivalents 1.79
Net receivables / payables 2.00
Total Net Assets 100.00
Portfolio Asset Allocation
** Represents thinly traded/ non traded securities and illiquid securities. Total Percentage of thinly/non traded securities is 0.13%
12.88
-4.22
6.76
3.06
-8
-4
0
4
8
12
16
1 Year Since Inception
26
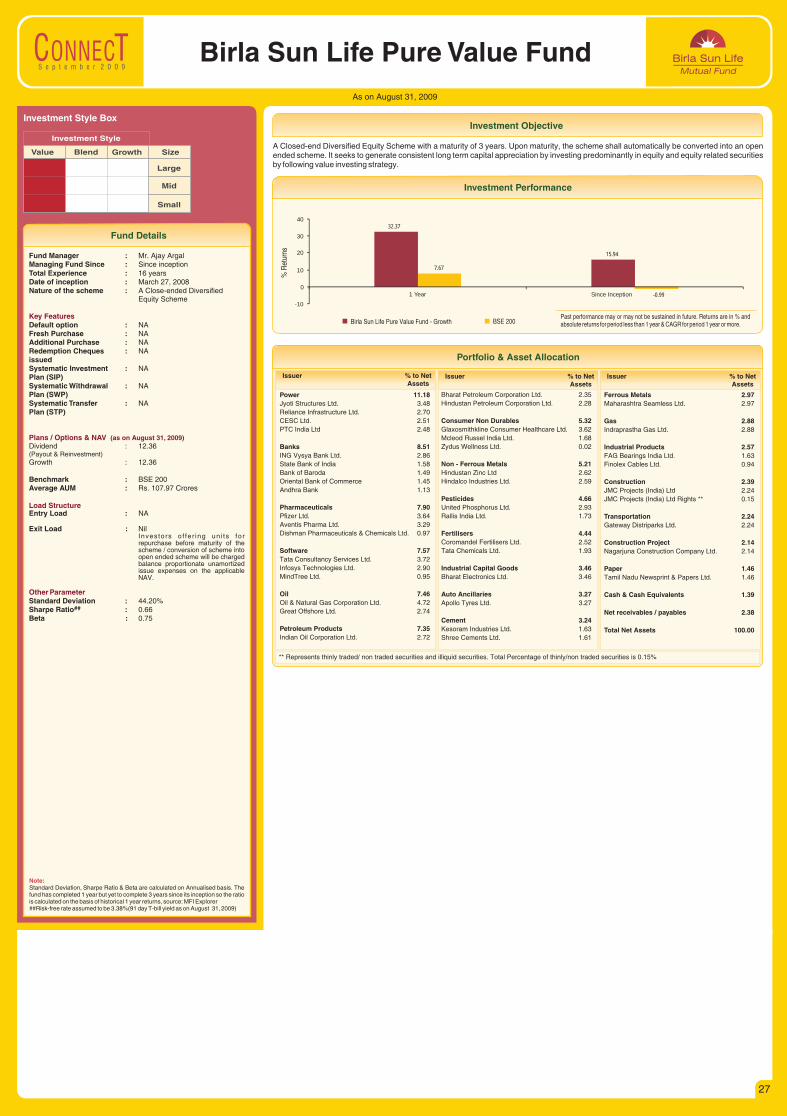
S e p t e m b e r 2 0 0 9
As on August 31, 2009
Birla Sun Life Pure Value Fund
Value Blend Growth Size
Large
Mid
Small
Investment Style
Investment Style Box
Fund Details
Fund Manager :Managing Fund Since : Since inceptionTotal Experience : 16 yearsDate of inception : March 27, 2008Nature of the scheme : A Close-ended Diversified
Equity Scheme
Default option : NAFresh Purchase : NAAdditional Purchase : NARedemption Cheques : NA issuedSystematic Investment : NAPlan (SIP)Systematic Withdrawal : NAPlan (SWP)Systematic Transfer : NAPlan (STP)
Dividend : 12.36(Payout & Reinvestment)Growth : 12.36
Benchmark : BSE 200Average AUM : Rs. 107.97 Crores
Entry Load : NA
Exit Load : NilInvestors o f fe r ing un i ts fo r repurchase before maturity of the scheme / conversion of scheme into open ended scheme will be charged balance proportionate unamortized issue expenses on the applicable NAV.
Standard Deviation : 44.20%##Sharpe Ratio : 0.66
Beta : 0.75
Mr. Ajay Argal
Key Features
Plans / Options & NAV
Load Structure
Other Parameter
(as on August 31, 2009)
Note: Standard Deviation, Sharpe Ratio & Beta are calculated on Annualised basis. fund has completed 1 year but yet to complete 3 years since its inception so the ratio is calculated on the basis of historical 1 year returns, source: MFI Explorer##Risk-free rate assumed to be 3.38%(91 day T-bill yield as on August 31, 2009)
The
A Closed-end Diversified Equity Scheme with a maturity of 3 years. Upon maturity, the scheme shall automatically be converted into an open ended scheme. It seeks to generate consistent long term capital appreciation by investing predominantly in equity and equity related securities by following value investing strategy.
Investment Objective
Investment Performance
Birla Sun Life Pure Value Fund - Growth BSE 200
% R
etur
ns
Past performance may or may not be sustained in future. Returns are in % and absolute returns for period less than 1 year & CAGR for period 1 year or more.
Issuer % to NetAssets
Issuer % to NetAssets
Issuer % to NetAssets
Power 11.18Jyoti Structures Ltd. 3.48
Reliance Infrastructure Ltd. 2.70
CESC Ltd. 2.51
PTC India Ltd 2.48
Banks 8.51ING Vysya Bank Ltd. 2.86
State Bank of India 1.58
Bank of Baroda 1.49
Oriental Bank of Commerce 1.45
Andhra Bank 1.13
Pharmaceuticals 7.90Pfizer Ltd. 3.64
Aventis Pharma Ltd. 3.29
Dishman Pharmaceuticals & Chemicals Ltd. 0.97
Software 7.57Tata Consultancy Services Ltd. 3.72
Infosys Technologies Ltd. 2.90
MindTree Ltd. 0.95
Oil 7.46Oil & Natural Gas Corporation Ltd. 4.72
Great Offshore Ltd. 2.74
Petroleum Products 7.35Indian Oil Corporation Ltd. 2.72
Bharat Petroleum Corporation Ltd. 2.35
Hindustan Petroleum Corporation Ltd. 2.28
Consumer Non Durables 5.32Glaxosmithkline Consumer Healthcare Ltd. 3.62
Mcleod Russel India Ltd. 1.68
Zydus Wellness Ltd. 0.02
Non - Ferrous Metals 5.21Hindustan Zinc Ltd 2.62
Hindalco Industries Ltd. 2.59
Pesticides 4.66United Phosphorus Ltd. 2.93
Rallis India Ltd. 1.73
Fertilisers 4.44Coromandel Fertilisers Ltd. 2.52
Tata Chemicals Ltd. 1.93
Industrial Capital Goods 3.46Bharat Electronics Ltd. 3.46
Auto Ancillaries 3.27Apollo Tyres Ltd. 3.27
Cement 3.24Kesoram Industries Ltd. 1.63
Shree Cements Ltd. 1.61
Ferrous Metals 2.97Maharashtra Seamless Ltd. 2.97
Gas 2.88Indraprastha Gas Ltd. 2.88
Industrial Products 2.57FAG Bearings India Ltd. 1.63
Finolex Cables Ltd. 0.94
Construction 2.39JMC Projects (India) Ltd 2.24
JMC Projects (India) Ltd Rights ** 0.15
Transportation 2.24Gateway Distriparks Ltd. 2.24
Construction Project 2.14Nagarjuna Construction Company Ltd. 2.14
Paper 1.46Tamil Nadu Newsprint & Papers Ltd. 1.46
Cash & Cash Equivalents 1.39
Net receivables / payables 2.38
Total Net Assets 100.00
Portfolio & Asset Allocation
** Represents thinly traded/ non traded securities and illiquid securities. Total Percentage of thinly/non traded securities is 0.15%
32.37
15.94
7.67
-0.99
-10
0
10
20
30
40
1 Year Since Inception
27

S e p t e m b e r 2 0 0 9
Fund Details
Investment Objective
As on Aug 31, 2009
Birla Sun Life '95 Fund
Fund Manager :Mr. Nishit Dholakia
Managing Fund Since : June 18, 2009Total Experience : 12 years & 9 yearsDate of inception : February 10, 1995Nature of the scheme : An Open-ended Balanced Scheme
Default option : Dividend ReinvestmentFresh Purchase : Rs. 5000/-Additional Purchase : Rs. 1000/-Redemption Cheques : Within 10 working days issued Systematic Investment : Available Plan (SIP)Systematic Withdrawal : Available Plan (SWP)Systematic Transfer : AvailablePlan (STP)
Dividend : 105.98(Payout, Reinvestment & Sweep)Growth : 241.90
Benchmark : CRISIL Balanced Fund IndexAverage AUM : Rs. 187.76 Crores
Entry Load : Nil
Exit Load** : 1% if redeemed / switched out within 365 days from the date of allotment**Exit / Entry Load is NIL for units issued in Bonus & Dividend Reinvestment.
Average Maturity : –Standard Deviation : 28.12%
##Sharp Ratio : 0.48
Mr. Satyabrata Mohanty &
Key Features
Plans / Options & NAV
Load Structure (Incl for SIP)
Other Parameter
(As on Aug 31, 2009)
Investment Style Box
Value Blend Growth Size
Large
Mid
Small
Investment StyleAn open-ended balanced scheme with the objective of long term growth of capital and current income, through a portfolio of equity and fixed income securities
Portfolio & Asset Allocation
Government Bond 11.946.90 CGL 2019 7.51 Sovereign06.83 Govt.Stock 2039 4.43 Sovereign
Money Market Instruments 9.50Housing Development Finance Corporation Ltd 9.50 A1+
Consumer Non Durables 8.01Nestle India Ltd. 2.47 ITC Ltd. 2.40 Colgate-Palmolive (India) Ltd. 1.70 United Breweries Holdings Ltd. 0.74 Shree Renuka Sugars Ltd. 0.69
Software 7.20Infosys Technologies Ltd. 3.33 Wipro Ltd. 2.78 Everonn Systems India Ltd. 1.10
Pesticides 6.05Rallis India Ltd. 6.05
Power 5.57Torrent Power Ltd. 1.79 Jyoti Structures Ltd. 1.40 GVK Power & Infrastructure Ltd. 1.15 KEC International Ltd. 0.84 Adani Power Ltd 0.39
Pharmaceuticals 5.19Aventis Pharma Ltd. 1.75 Dr.Reddy's Laboratories Ltd. 1.60 Biocon Ltd. 0.99 Piramal Healthcare Ltd. 0.86
Petroleum Products 4.86Reliance Industries Ltd. 2.60 Indian Oil Corporation Ltd. 2.26
PSU/PFI Bonds/Banks 3.84IDBI Bank Ltd. 3.84 AA+
Industrial Capital Goods 3.64Bharat Heavy Electricals Ltd. 1.32 Siemens Ltd. 0.86 Suzlon Energy Ltd. 0.85 Bharati Shipyard Ltd. 0.62
Retailing 3.46Trent Ltd. 3.46
Banks 3.44Allahabad Bank 1.96 ICICI Bank Ltd. 1.48
Construction Project 3.37Larsen & Toubro Ltd. 2.44 LANCO Infratech Ltd. 0.93
Minerals/Mining 2.81Nava Bharat Ventures Ltd. 2.81
Gas 2.14Gujarat Gas Company Ltd. 2.14
Cement 2.08Kesoram Industries Ltd. 1.19 Jaiprakash Associates Ltd. 0.89
Telecom-Services 2.06Bharti Airtel Ltd. 2.06
Auto Ancillaries 1.20Everest Kanto Cylinder Ltd. 1.20
Ferrous Metals 1.04JSW Steel Ltd. 1.04
Chemicals 1.03Gujarat Alkalies & Chemicals Ltd. 1.03
Construction 1.03Housing Development & Infrastructure Ltd 1.03
Non - Ferrous Metals 1.02Sterlite Industries (India) Ltd. 1.02
Industrial Products 1.00Max India Ltd. 1.00
Diversified 0.97Aditya Birla Nuvo Ltd. 0.53 Bombay Burmah Trading Corporation Ltd. 0.44
Auto 0.88Bajaj Auto Ltd. 0.88
Transportation 0.67Mundra Port and Special Economic Zone Ltd. 0.67
Media & Entertainment 0.36ETC Networks Ltd. 0.36 Magnasound India Ltd. ** #
Cash & Current Assets 5.64
Total Net Assets 100.00
Issuer % to Net RatingAssets
Issuer % to Net RatingAssets
** Represents thinly traded/ non traded securities and illiquid securities. # Indicates less than 0.01
Note:Standard Deviation & Sharpe Ratio are calculated on Annualised basis using 3 year history of monthly returns, source: MFI Explorer.##Risk-free rate assumed to be 3.38% (91 day T-bill yield as on August 31, 2009)
Past performance may or may not be sustained in future. Returns are in % and absolute returns for period less than 1 year & CAGR for period 1 year or more. When benchmark returns are not available, they have not been shown.
% R
etur
ns
Investment Performance Rating Profile
Birla Sun Life 95 Fund - Growth Crisil Balanced Fund Index
(Past performance is no guarantee of future results.) for ranking methodology please refer page 50
#««««Value Research Rating
Hybrid Equity-Oriented (28 Schemes),for 3 & 5 years periods ending 31-Aug-09Birla Sun Life ‘95 Fund
Hybrid Equity - Oriented (18 Schemes), 2 years ended 30-Jun-09
Birla Sun Life ‘95 FundCRISIL~CPR 2^^
SIP is a powerful tool that can help you create wealth over time. If you had invested in Birla Sun Life '95 Fund...
Systematic Investment Plan (SIP)
Date of First Installment : April 1, 1995
The data assumes the investment of Rs.1,000/- on 1st day of every month or the subsequent working day. Load and Taxes are not considered for computation of returns. Past performance may or may not be sustained in future.
*CAGR Returns are computed after accounting for the cash flow by using the XIRR method (investment internal rate of return)
Investment Period
Total Investment
(Rs.) Birla Sun Life '95 Fund
Birla Sun Life '95 Fund
CRISIL Balanced Fund Index
CRISIL Balanced Fund Index
Since Inception 173000 417896 1397955 11.40 25.85
Last 5 years 60000 84276 96628 13.56 19.13
Last 3 years 36000 42455 46466 11.01 17.30
Last 1 year 12000 15079 16738 50.92 80.73
Value (Rs.) of SIP in Returns (%)*
Consistent CPR Performer- Balanced (14 Schemes), 5 years ended 30-Jun-09Birla Sun Life ‘95 FundCRISIL~CPR 2^^
3.84%
5.64%
9.50%
11.94%
69.08%
AA
Cash & Current Assets
AAA
Sovereign
Equity
25.69
16.39
23.5724.45
11.17 10.77
16.84
0
5
10
15
20
25
30
1 Year 3 Years 5 Years Since Inception
28
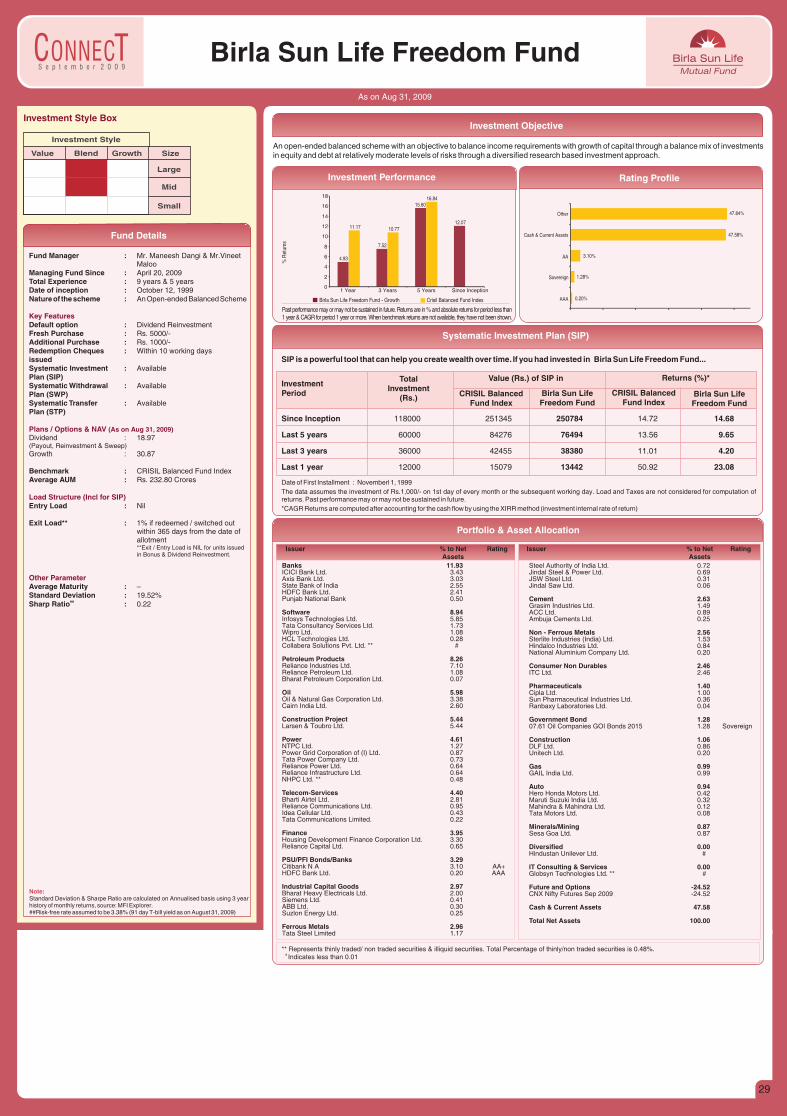
S e p t e m b e r 2 0 0 9
Fund Details
Investment Objective
Birla Sun Life Freedom FundAs on Aug 31, 2009
Investment Style Box
Value Blend Growth Size
Large
Mid
Small
Investment Style
Fund Manager :Maloo
Managing Fund Since : April 20, 2009Total Experience : 9 years & 5 yearsDate of inception : October 12, 1999Nature of the scheme : An Open-ended Balanced Scheme
Default option : Dividend ReinvestmentFresh Purchase : Rs. 5000/-Additional Purchase : Rs. 1000/-Redemption Cheques : Within 10 working days issuedSystematic Investment : Available Plan (SIP)Systematic Withdrawal : Available Plan (SWP)Systematic Transfer : AvailablePlan (STP)
Dividend : 18.97(Payout, Reinvestment & Sweep)Growth : 30.87
Benchmark : CRISIL Balanced Fund IndexAverage AUM : Rs. 232.80 Crores
Entry Load : Nil
Exit Load** : 1% if redeemed / switched out within 365 days from the date of allotment**Exit / Entry Load is NIL for units issued in Bonus & Dividend Reinvestment.
Average Maturity : –Standard Deviation : 19.52%
##Sharp Ratio : 0.22
Mr. Maneesh Dangi & Mr.Vineet
Key Features
Plans / Options & NAV
Load Structure (Incl for SIP)
Other Parameter
(As on Aug 31, 2009)
Note:Standard Deviation & Sharpe Ratio are calculated on Annualised basis using 3 year history of monthly returns, source: MFI Explorer.##Risk-free rate assumed to be 3.38% (91 day T-bill yield as on August 31, 2009)
An open-ended balanced scheme with an objective to balance income requirements with growth of capital through a balance mix of investments in equity and debt at relatively moderate levels of risks through a diversified research based investment approach.
Past performance may or may not be sustained in future. Returns are in % and absolute returns for period less than 1 year & CAGR for period 1 year or more. When benchmark returns are not available, they have not been shown.
% R
etur
ns
Investment Performance Rating Profile
Birla Sun Life Freedom Fund - Growth Crisil Balanced Fund Index
Banks 11.93ICICI Bank Ltd. 3.43 Axis Bank Ltd. 3.03 State Bank of India 2.55 HDFC Bank Ltd. 2.41 Punjab National Bank 0.50
Software 8.94Infosys Technologies Ltd. 5.85 Tata Consultancy Services Ltd. 1.73 Wipro Ltd. 1.08 HCL Technologies Ltd. 0.28 Collabera Solutions Pvt. Ltd. ** #
Petroleum Products 8.26Reliance Industries Ltd. 7.10 Reliance Petroleum Ltd. 1.08 Bharat Petroleum Corporation Ltd. 0.07
Oil 5.98Oil & Natural Gas Corporation Ltd. 3.38 Cairn India Ltd. 2.60
Construction Project 5.44Larsen & Toubro Ltd. 5.44
Power 4.61NTPC Ltd. 1.27 Power Grid Corporation of (I) Ltd. 0.87 Tata Power Company Ltd. 0.73 Reliance Power Ltd. 0.64 Reliance Infrastructure Ltd. 0.64 NHPC Ltd. ** 0.48
Telecom-Services 4.40Bharti Airtel Ltd. 2.81 Reliance Communications Ltd. 0.95 Idea Cellular Ltd. 0.43 Tata Communications Limited. 0.22
Finance 3.95Housing Development Finance Corporation Ltd. 3.30 Reliance Capital Ltd. 0.65
PSU/PFI Bonds/Banks 3.29Citibank N A 3.10 AA+HDFC Bank Ltd. 0.20 AAA
Industrial Capital Goods 2.97Bharat Heavy Electricals Ltd. 2.00 Siemens Ltd. 0.41 ABB Ltd. 0.30 Suzlon Energy Ltd. 0.25
Ferrous Metals 2.96Tata Steel Limited 1.17
Issuer % to Net RatingAssets
** Represents thinly traded/ non traded securities & illiquid securities. Total Percentage of thinly/non traded securities is 0.48%. # Indicates less than 0.01
Portfolio & Asset Allocation
Steel Authority of India Ltd. 0.72 Jindal Steel & Power Ltd. 0.69 JSW Steel Ltd. 0.31 Jindal Saw Ltd. 0.06
Cement 2.63Grasim Industries Ltd. 1.49 ACC Ltd. 0.89 Ambuja Cements Ltd. 0.25
Non - Ferrous Metals 2.56Sterlite Industries (India) Ltd. 1.53 Hindalco Industries Ltd. 0.84 National Aluminium Company Ltd. 0.20
Consumer Non Durables 2.46ITC Ltd. 2.46
Pharmaceuticals 1.40Cipla Ltd. 1.00 Sun Pharmaceutical Industries Ltd. 0.36 Ranbaxy Laboratories Ltd. 0.04
Government Bond 1.2807.61 Oil Companies GOI Bonds 2015 1.28 Sovereign
Construction 1.06DLF Ltd. 0.86 Unitech Ltd. 0.20
Gas 0.99GAIL India Ltd. 0.99
Auto 0.94Hero Honda Motors Ltd. 0.42 Maruti Suzuki India Ltd. 0.32 Mahindra & Mahindra Ltd. 0.12 Tata Motors Ltd. 0.08
Minerals/Mining 0.87Sesa Goa Ltd. 0.87
Diversified 0.00Hindustan Unilever Ltd. #
IT Consulting & Services 0.00Globsyn Technologies Ltd. ** #
Future and Options -24.52CNX Nifty Futures Sep 2009 -24.52
Cash & Current Assets 47.58
Total Net Assets 100.00
Issuer % to Net RatingAssets
SIP is a powerful tool that can help you create wealth over time. If you had invested in Birla Sun Life Freedom Fund...
Systematic Investment Plan (SIP)
Date of First Installment : Novemberl 1, 1999
The data assumes the investment of Rs.1,000/- on 1st day of every month or the subsequent working day. Load and Taxes are not considered for computation of returns. Past performance may or may not be sustained in future.
*CAGR Returns are computed after accounting for the cash flow by using the XIRR method (investment internal rate of return)
Investment Period
Total Investment
(Rs.) Birla Sun Life Freedom Fund
Birla Sun Life Freedom Fund
CRISIL Balanced Fund Index
CRISIL Balanced Fund Index
Since Inception 118000 251345 250784 14.72 14.68
Last 5 years 60000 84276 76494 13.56 9.65
Last 3 years 36000 42455 38380 11.01 4.20
Last 1 year 12000 15079 13442 50.92 23.08
Value (Rs.) of SIP in Returns (%)*
0.20%
1.28%
3.10%
47.58%
47.84%
AAA
Sovereign
AA
Cash & Current Assets
Other
4.93
7.52
15.60
12.0711.17 10.77
16.84
0
2
4
6
8
10
12
14
16
18
1 Year 3 Years 5 Years Since Inception
29
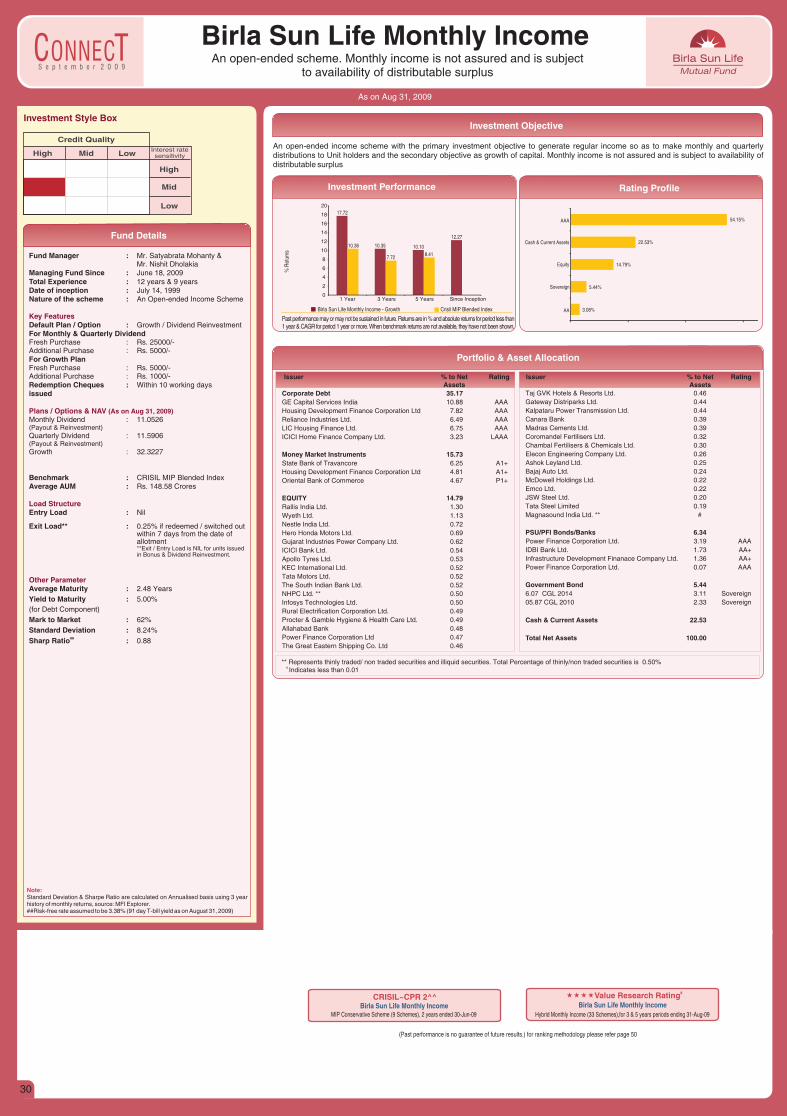
S e p t e m b e r 2 0 0 9
Fund Details
Birla Sun Life Monthly IncomeAn open-ended scheme. Monthly income is not assured and is subject
to availability of distributable surplus
As on Aug 31, 2009
Investment Style Box
High Mid Low Interest rate sensitivity
High
Mid
Low
Credit Quality
Fund Manager :Mr. Nishit Dholakia
Managing Fund Since : June 18, 2009Total Experience : 12 years & 9 yearsDate of inception : July 14, 1999Nature of the scheme : An Open-ended Income Scheme
Default Plan / Option : Growth / Dividend ReinvestmentFor Monthly & Quarterly Dividend Fresh Purchase : Rs. 25000/-Additional Purchase : Rs. 5000/-For Growth PlanFresh Purchase : Rs. 5000/-Additional Purchase : Rs. 1000/-Redemption Cheques : Within 10 working days issued
Monthly Dividend : 11.0526(Payout & Reinvestment)Quarterly Dividend : 11.5906(Payout & Reinvestment)Growth : 32.3227
Benchmark : CRISIL MIP Blended IndexAverage AUM : Rs. 148.58 Crores
Entry Load : Nil
Exit Load** : 0.25% if redeemed / switched out within 7 days from the date of allotment**Exit / Entry Load is NIL for units issued in Bonus & Dividend Reinvestment.
Average Maturity : 2.48 Years
Yield to Maturity : 5.00%
(for Debt Component)
Mark to Market : 62%
Standard Deviation : 8.24%##Sharp Ratio : 0.88
Mr. Satyabrata Mohanty &
Key Features
Plans / Options & NAV
Load Structure
Other Parameter
(As on Aug 31, 2009)
An open-ended income scheme with the primary investment objective to generate regular income so as to make monthly and quarterly distributions to Unit holders and the secondary objective as growth of capital. Monthly income is not assured and is subject to availability of distributable surplus
Investment Objective
Past performance may or may not be sustained in future. Returns are in % and absolute returns for period less than 1 year & CAGR for period 1 year or more. When benchmark returns are not available, they have not been shown.
% R
etur
ns
Investment Performance Rating Profile
Birla Sun Life Monthly Income - Growth Crisil MIP Blended Index
Corporate Debt 35.17GE Capital Services India 10.88 AAA
Housing Development Finance Corporation Ltd 7.82 AAA
Reliance Industries Ltd. 6.49 AAA
LIC Housing Finance Ltd. 6.75 AAA
ICICI Home Finance Company Ltd. 3.23 LAAA
Money Market Instruments 15.73State Bank of Travancore 6.25 A1+
Housing Development Finance Corporation Ltd 4.81 A1+
Oriental Bank of Commerce 4.67 P1+
EQUITY 14.79Rallis India Ltd. 1.30
Wyeth Ltd. 1.13
Nestle India Ltd. 0.72
Hero Honda Motors Ltd. 0.69
Gujarat Industries Power Company Ltd. 0.62
ICICI Bank Ltd. 0.54
Apollo Tyres Ltd. 0.53
KEC International Ltd. 0.52
Tata Motors Ltd. 0.52
The South Indian Bank Ltd. 0.52
NHPC Ltd. ** 0.50
Infosys Technologies Ltd. 0.50
Rural Electrification Corporation Ltd. 0.49
Procter & Gamble Hygiene & Health Care Ltd. 0.49
Allahabad Bank 0.48
Power Finance Corporation Ltd 0.47
The Great Eastern Shipping Co. Ltd 0.46
Taj GVK Hotels & Resorts Ltd. 0.46
Gateway Distriparks Ltd. 0.44
Kalpataru Power Transmission Ltd. 0.44
Canara Bank 0.39
Madras Cements Ltd. 0.39
Coromandel Fertilisers Ltd. 0.32
Chambal Fertilisers & Chemicals Ltd. 0.30
Elecon Engineering Company Ltd. 0.26
Ashok Leyland Ltd. 0.25
Bajaj Auto Ltd. 0.24
McDowell Holdings Ltd. 0.22
Emco Ltd. 0.22
JSW Steel Ltd. 0.20
Tata Steel Limited 0.19
Magnasound India Ltd. ** #
PSU/PFI Bonds/Banks 6.34Power Finance Corporation Ltd. 3.19 AAA
IDBI Bank Ltd. 1.73 AA+
Infrastructure Development Finanace Company Ltd. 1.36 AA+
Power Finance Corporation Ltd. 0.07 AAA
Government Bond 5.446.07 CGL 2014 3.11 Sovereign
05.87 CGL 2010 2.33 Sovereign
Cash & Current Assets 22.53
Total Net Assets 100.00
Issuer % to Net RatingAssets
Issuer % to Net RatingAssets
** Represents thinly traded/ non traded securities and illiquid securities. Total Percentage of thinly/non traded securities is 0.50% # Indicates less than 0.01
Portfolio & Asset Allocation
(Past performance is no guarantee of future results.) for ranking methodology please refer page 50
«««« #Value Research Rating
Hybrid Monthly Income (33 Schemes),for 3 & 5 years periods ending 31-Aug-09
Birla Sun Life Monthly Income
Note:Standard Deviation & Sharpe Ratio are calculated on Annualised basis using 3 year history of monthly returns, source: MFI Explorer.##Risk-free rate assumed to be 3.38% (91 day T-bill yield as on August 31, 2009)
MIP Conservative Scheme (9 Schemes), 2 years ended 30-Jun-09
Birla Sun Life Monthly IncomeCRISIL~CPR 2^^
3.08%
5.44%
14.79%
22.53%
54.15%
AA
Sovereign
Equity
Cash & Current Assets
AAA
17.72
10.35 10.10
12.27
10.36
7.728.41
0
2
4
6
8
10
12
14
16
18
20
1 Year 3 Years 5 Years Since Inception
30
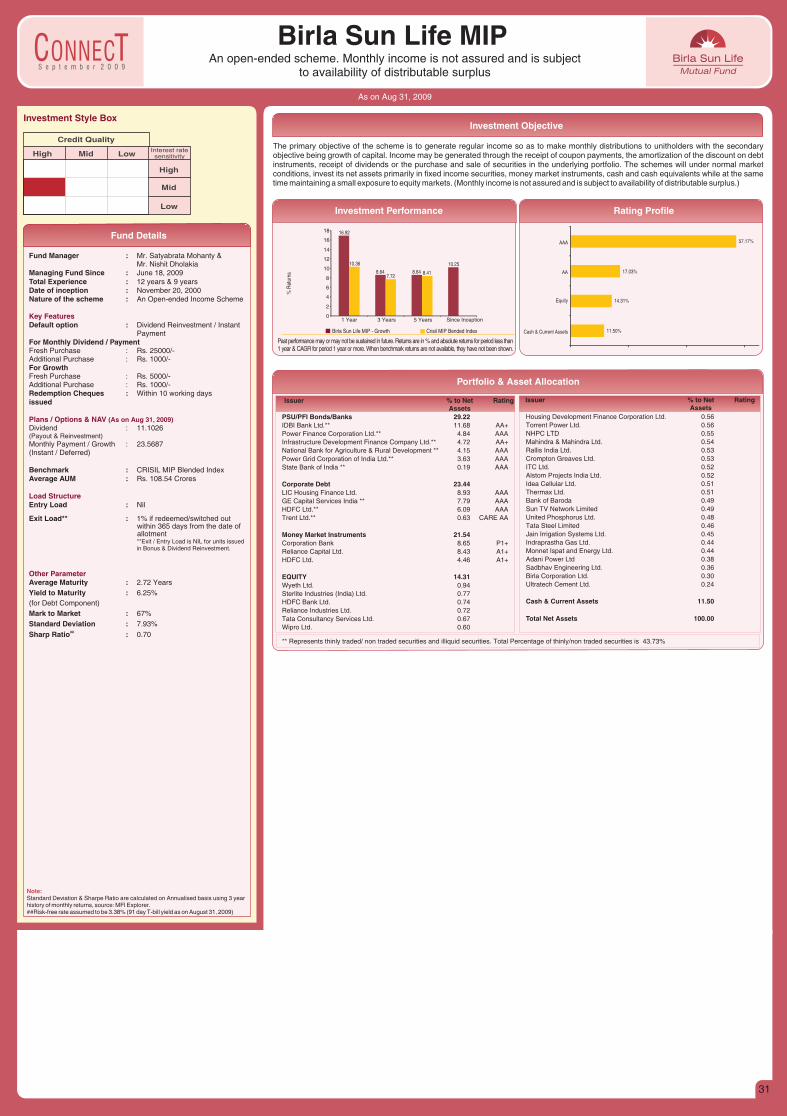
S e p t e m b e r 2 0 0 9
Fund Details
Birla Sun Life MIPAn open-ended scheme. Monthly income is not assured and is subject
to availability of distributable surplus
As on Aug 31, 2009
Investment Style Box
Credit Quality
High Mid Low Interest rate sensitivity
High
Mid
Low
Fund Manager :Mr. Nishit Dholakia
Managing Fund Since : June 18, 2009Total Experience : 12 years & 9 yearsDate of inception : November 20, 2000Nature of the scheme : An Open-ended Income Scheme
Default option : Dividend Reinvestment / Instant Payment
For Monthly Dividend / PaymentFresh Purchase : Rs. 25000/-Additional Purchase : Rs. 1000/-For GrowthFresh Purchase : Rs. 5000/-Additional Purchase : Rs. 1000/-Redemption Cheques : Within 10 working days issued
Dividend : 11.1026(Payout & Reinvestment)Monthly Payment / Growth : 23.5687(Instant / Deferred)
Benchmark : CRISIL MIP Blended IndexAverage AUM : Rs. 108.54 Crores
Entry Load : Nil
Exit Load** : 1% if redeemed/switched out within 365 days from the date of allotment**Exit / Entry Load is NIL for units issued in Bonus & Dividend Reinvestment.
Average Maturity : 2.72 Years
Yield to Maturity : 6.25%
(for Debt Component)
Mark to Market : 67%
Standard Deviation : 7.93%##Sharp Ratio : 0.70
Mr. Satyabrata Mohanty &
Key Features
Plans / Options & NAV
Load Structure
Other Parameter
(As on Aug 31, 2009)
Note:Standard Deviation & Sharpe Ratio are calculated on Annualised basis using 3 year history of monthly returns, source: MFI Explorer.##Risk-free rate assumed to be 3.38% (91 day T-bill yield as on August 31, 2009)
The primary objective of the scheme is to generate regular income so as to make monthly distributions to unitholders with the secondary objective being growth of capital. Income may be generated through the receipt of coupon payments, the amortization of the discount on debt instruments, receipt of dividends or the purchase and sale of securities in the underlying portfolio. The schemes will under normal market conditions, invest its net assets primarily in fixed income securities, money market instruments, cash and cash equivalents while at the same time maintaining a small exposure to equity markets. (Monthly income is not assured and is subject to availability of distributable surplus.)
Investment Objective
Past performance may or may not be sustained in future. Returns are in % and absolute returns for period less than 1 year & CAGR for period 1 year or more. When benchmark returns are not available, they have not been shown.
% R
etur
ns
Investment Performance Rating Profile
Birla Sun Life MIP - Growth Crisil MIP Bended Index
PSU/PFI Bonds/Banks 29.22IDBI Bank Ltd.** 11.68 AA+
Power Finance Corporation Ltd.** 4.84 AAA
Infrastructure Development Finance Company Ltd.** 4.72 AA+
National Bank for Agriculture & Rural Development ** 4.15 AAA
Power Grid Corporation of India Ltd.** 3.63 AAA
State Bank of India ** 0.19 AAA
Corporate Debt 23.44LIC Housing Finance Ltd. 8.93 AAA
GE Capital Services India ** 7.79 AAA
HDFC Ltd.** 6.09 AAA
Trent Ltd.** 0.63 CARE AA
Money Market Instruments 21.54Corporation Bank 8.65 P1+
Reliance Capital Ltd. 8.43 A1+
HDFC Ltd. 4.46 A1+
EQUITY 14.31Wyeth Ltd. 0.94
Sterlite Industries (India) Ltd. 0.77
HDFC Bank Ltd. 0.74
Reliance Industries Ltd. 0.72
Tata Consultancy Services Ltd. 0.67
Wipro Ltd. 0.60
Housing Development Finance Corporation Ltd. 0.56
Torrent Power Ltd. 0.56
NHPC LTD 0.55
Mahindra & Mahindra Ltd. 0.54
Rallis India Ltd. 0.53
Crompton Greaves Ltd. 0.53
ITC Ltd. 0.52
Alstom Projects India Ltd. 0.52
Idea Cellular Ltd. 0.51
Thermax Ltd. 0.51
Bank of Baroda 0.49
Sun TV Network Limited 0.49
United Phosphorus Ltd. 0.48
Tata Steel Limited 0.46
Jain Irrigation Systems Ltd. 0.45
Indraprastha Gas Ltd. 0.44
Monnet Ispat and Energy Ltd. 0.44
Adani Power Ltd 0.38
Sadbhav Engineering Ltd. 0.36
Birla Corporation Ltd. 0.30
Ultratech Cement Ltd. 0.24
Cash & Current Assets 11.50
Total Net Assets 100.00
Issuer % to Net RatingAssets
Issuer % to Net RatingAssets
Portfolio & Asset Allocation
** Represents thinly traded/ non traded securities and illiquid securities. Total Percentage of thinly/non traded securities is 43.73%
11.50%
14.31%
17.03%
57.17%
Cash & Current Assets
Equity
AA
AAA
16.92
8.64 8.64
10.2510.36
7.728.41
0
2
4
6
8
10
12
14
16
18
1 Year 3 Years 5 Years Since Inception
31
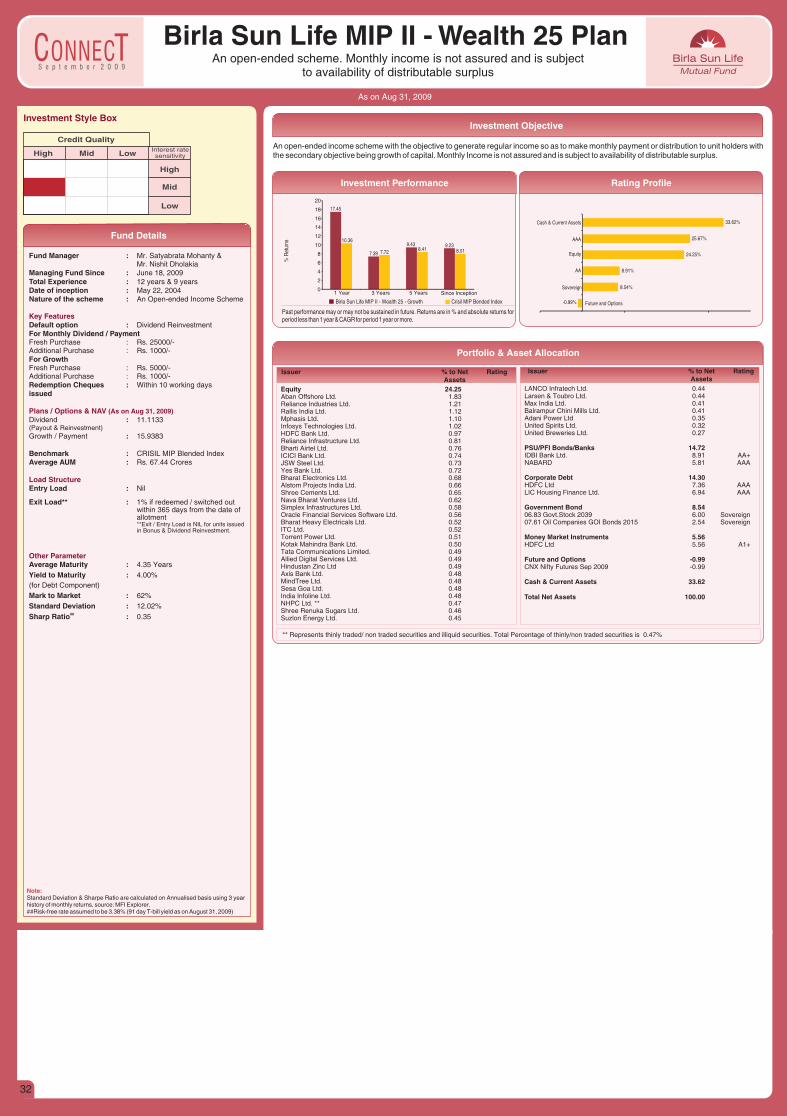
S e p t e m b e r 2 0 0 9
Fund Details
Investment Objective
Birla Sun Life MIP II - Wealth 25 PlanAn open-ended scheme. Monthly income is not assured and is subject
to availability of distributable surplus
As on Aug 31, 2009
Investment Style Box
Credit Quality
High Mid Low Interest rate sensitivity
High
Mid
Low
Fund Manager :Mr. Nishit Dholakia
Managing Fund Since : June 18, 2009Total Experience : 12 years & 9 yearsDate of inception : May 22, 2004Nature of the scheme : An Open-ended Income Scheme
Default option : Dividend ReinvestmentFor Monthly Dividend / PaymentFresh Purchase : Rs. 25000/-Additional Purchase : Rs. 1000/-For GrowthFresh Purchase : Rs. 5000/-Additional Purchase : Rs. 1000/-Redemption Cheques : Within 10 working days issued
Dividend : 11.1133(Payout & Reinvestment)
Growth / Payment : 15.9383
Benchmark : CRISIL MIP Blended IndexAverage AUM : Rs. 67.44 Crores
Entry Load : Nil
Exit Load** : 1% if redeemed / switched out within 365 days from the date of allotment**Exit / Entry Load is NIL for units issued in Bonus & Dividend Reinvestment.
Average Maturity : 4.35 Years
Yield to Maturity : 4.00%
(for Debt Component)
Mark to Market : 62%
Standard Deviation : 12.02%##Sharp Ratio : 0.35
Mr. Satyabrata Mohanty &
Key Features
Plans / Options & NAV
Load Structure
Other Parameter
(As on Aug 31, 2009)
An open-ended income scheme with the objective to generate regular income so as to make monthly payment or distribution to unit holders with the secondary objective being growth of capital. Monthly Income is not assured and is subject to availability of distributable surplus.
Past performance may or may not be sustained in future. Returns are in % and absolute returns for period less than 1 year & CAGR for period 1 year or more.
% R
etur
ns
Investment Performance Rating Profile
Birla Sun Life MIP II - Wealth 25 - Growth Crisil MIP Bended Index
Equity 24.25Aban Offshore Ltd. 1.83 Reliance Industries Ltd. 1.21 Rallis India Ltd. 1.12 Mphasis Ltd. 1.10 Infosys Technologies Ltd. 1.02 HDFC Bank Ltd. 0.97 Reliance Infrastructure Ltd. 0.81 Bharti Airtel Ltd. 0.76 ICICI Bank Ltd. 0.74 JSW Steel Ltd. 0.73 Yes Bank Ltd. 0.72 Bharat Electronics Ltd. 0.68 Alstom Projects India Ltd. 0.66 Shree Cements Ltd. 0.65 Nava Bharat Ventures Ltd. 0.62 Simplex Infrastructures Ltd. 0.58 Oracle Financial Services Software Ltd. 0.56 Bharat Heavy Electricals Ltd. 0.52 ITC Ltd. 0.52 Torrent Power Ltd. 0.51 Kotak Mahindra Bank Ltd. 0.50 Tata Communications Limited. 0.49 Allied Digital Services Ltd. 0.49 Hindustan Zinc Ltd 0.49 Axis Bank Ltd. 0.48 MindTree Ltd. 0.48 Sesa Goa Ltd. 0.48 India Infoline Ltd. 0.48 NHPC Ltd. ** 0.47 Shree Renuka Sugars Ltd. 0.46 Suzlon Energy Ltd. 0.45
LANCO Infratech Ltd. 0.44 Larsen & Toubro Ltd. 0.44 Max India Ltd. 0.41 Balrampur Chini Mills Ltd. 0.41 Adani Power Ltd 0.35 United Spirits Ltd. 0.32 United Breweries Ltd. 0.27
PSU/PFI Bonds/Banks 14.72IDBI Bank Ltd. 8.91 AA+NABARD 5.81 AAA
Corporate Debt 14.30HDFC Ltd 7.36 AAALIC Housing Finance Ltd. 6.94 AAA
Government Bond 8.5406.83 Govt.Stock 2039 6.00 Sovereign07.61 Oil Companies GOI Bonds 2015 2.54 Sovereign
Money Market Instruments 5.56HDFC Ltd 5.56 A1+
Future and Options -0.99CNX Nifty Futures Sep 2009 -0.99
Cash & Current Assets 33.62
Total Net Assets 100.00
Issuer % to Net RatingAssets
Issuer % to Net RatingAssets
Portfolio & Asset Allocation
Note:Standard Deviation & Sharpe Ratio are calculated on Annualised basis using 3 year history of monthly returns, source: MFI Explorer.##Risk-free rate assumed to be 3.38% (91 day T-bill yield as on August 31, 2009)
** Represents thinly traded/ non traded securities and illiquid securities. Total Percentage of thinly/non traded securities is 0.47%
-0.99%
8.54%
8.91%
24.25%
25.67%
33.62%
Future and Options
Sovereign
AA
Equity
AAA
Cash & Current Assets
17.45
7.39
9.43 9.2310.36
7.728.41 8.01
0
2
4
6
8
10
12
14
16
18
20
1 Year 3 Years 5 Years Since Inception
32
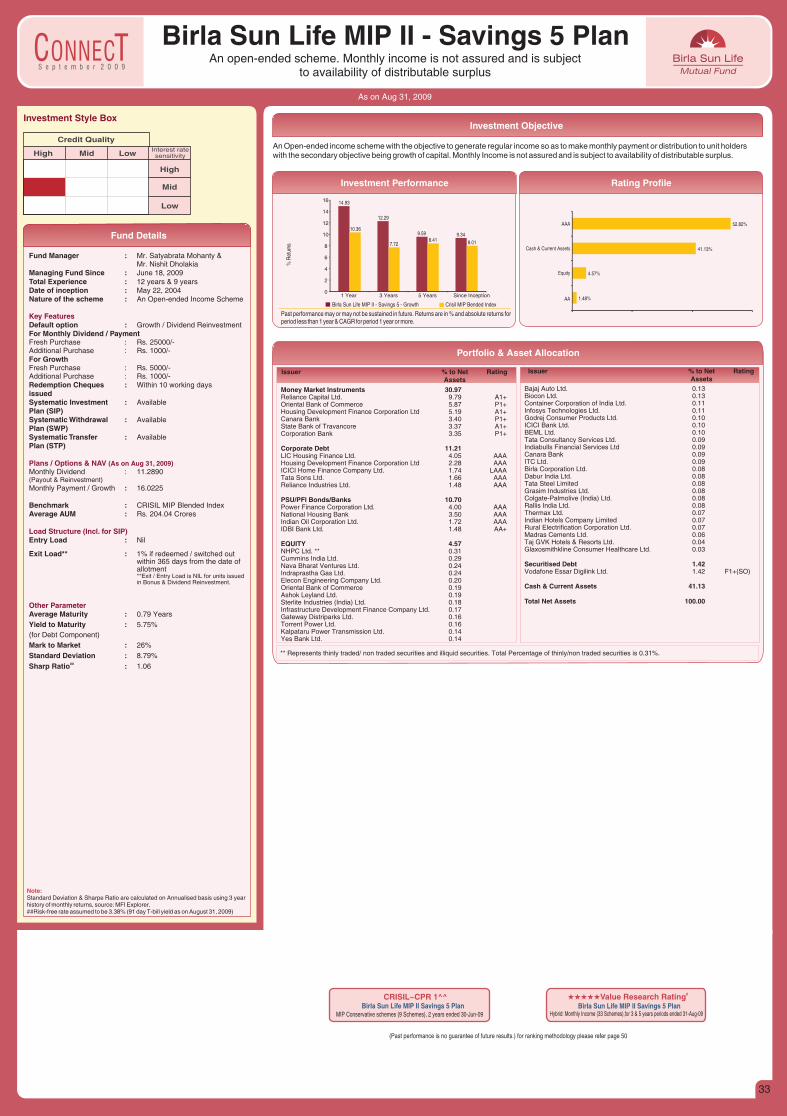
S e p t e m b e r 2 0 0 9
Fund Details
Investment Objective
As on Aug 31, 2009
Birla Sun Life MIP II - Savings 5 PlanAn open-ended scheme. Monthly income is not assured and is subject
to availability of distributable surplus
Investment Style Box
Credit Quality
High Mid Low Interest rate sensitivity
High
Mid
Low
Fund Manager :Mr. Nishit Dholakia
Managing Fund Since : June 18, 2009Total Experience : 12 years & 9 yearsDate of inception : May 22, 2004Nature of the scheme : An Open-ended Income Scheme
Default option : Growth / Dividend ReinvestmentFor Monthly Dividend / PaymentFresh Purchase : Rs. 25000/-Additional Purchase : Rs. 1000/-For GrowthFresh Purchase : Rs. 5000/-Additional Purchase : Rs. 1000/-Redemption Cheques : Within 10 working days issuedSystematic Investment : Available Plan (SIP)Systematic Withdrawal : Available Plan (SWP)Systematic Transfer : AvailablePlan (STP)
Monthly Dividend : 11.2890(Payout & Reinvestment)
Monthly Payment / Growth : 16.0225 Benchmark : CRISIL MIP Blended IndexAverage AUM : Rs. 204.04 Crores
Entry Load : Nil
Exit Load** : 1% if redeemed / switched out within 365 days from the date of allotment**Exit / Entry Load is NIL for units issued in Bonus & Dividend Reinvestment.
Average Maturity : 0.79 Years
Yield to Maturity : 5.75%
(for Debt Component)
Mark to Market : 26%
Standard Deviation : 8.79%##Sharp Ratio : 1.06
Mr. Satyabrata Mohanty &
Key Features
Plans / Options & NAV
Load Structure (Incl. for SIP)
Other Parameter
(As on Aug 31, 2009)
Note:Standard Deviation & Sharpe Ratio are calculated on Annualised basis using 3 year history of monthly returns, source: MFI Explorer.##Risk-free rate assumed to be 3.38% (91 day T-bill yield as on August 31, 2009)
An Open-ended income scheme with the objective to generate regular income so as to make monthly payment or distribution to unit holderswith the secondary objective being growth of capital. Monthly Income is not assured and is subject to availability of distributable surplus.
Past performance may or may not be sustained in future. Returns are in % and absolute returns for period less than 1 year & CAGR for period 1 year or more.
% R
etur
ns
Investment Performance Rating Profile
Birla Sun Life MIP II - Savings 5 - Growth Crisil MIP Bended Index
Money Market Instruments 30.97Reliance Capital Ltd. 9.79 A1+Oriental Bank of Commerce 5.87 P1+Housing Development Finance Corporation Ltd 5.19 A1+Canara Bank 3.40 P1+State Bank of Travancore 3.37 A1+Corporation Bank 3.35 P1+
Corporate Debt 11.21LIC Housing Finance Ltd. 4.05 AAAHousing Development Finance Corporation Ltd 2.28 AAAICICI Home Finance Company Ltd. 1.74 LAAATata Sons Ltd. 1.66 AAAReliance Industries Ltd. 1.48 AAA
PSU/PFI Bonds/Banks 10.70Power Finance Corporation Ltd. 4.00 AAANational Housing Bank 3.50 AAAIndian Oil Corporation Ltd. 1.72 AAAIDBI Bank Ltd. 1.48 AA+
EQUITY 4.57NHPC Ltd. ** 0.31 Cummins India Ltd. 0.29 Nava Bharat Ventures Ltd. 0.24 Indraprastha Gas Ltd. 0.24 Elecon Engineering Company Ltd. 0.20 Oriental Bank of Commerce 0.19 Ashok Leyland Ltd. 0.19 Sterlite Industries (India) Ltd. 0.18 Infrastructure Development Finance Company Ltd. 0.17 Gateway Distriparks Ltd. 0.16 Torrent Power Ltd. 0.16 Kalpataru Power Transmission Ltd. 0.14 Yes Bank Ltd. 0.14
Bajaj Auto Ltd. 0.13 Biocon Ltd. 0.13 Container Corporation of India Ltd. 0.11 Infosys Technologies Ltd. 0.11 Godrej Consumer Products Ltd. 0.10 ICICI Bank Ltd. 0.10 BEML Ltd. 0.10 Tata Consultancy Services Ltd. 0.09 Indiabulls Financial Services Ltd 0.09 Canara Bank 0.09 ITC Ltd. 0.09 Birla Corporation Ltd. 0.08 Dabur India Ltd. 0.08 Tata Steel Limited 0.08 Grasim Industries Ltd. 0.08 Colgate-Palmolive (India) Ltd. 0.08 Rallis India Ltd. 0.08 Thermax Ltd. 0.07 Indian Hotels Company Limited 0.07 Rural Electrification Corporation Ltd. 0.07 Madras Cements Ltd. 0.06 Taj GVK Hotels & Resorts Ltd. 0.04 Glaxosmithkline Consumer Healthcare Ltd. 0.03
Securitised Debt 1.42Vodafone Essar Digilink Ltd. 1.42 F1+(SO)
Cash & Current Assets 41.13
Total Net Assets 100.00
Issuer % to Net RatingAssets
Issuer % to Net RatingAssets
Portfolio & Asset Allocation
** Represents thinly traded/ non traded securities and illiquid securities. Total Percentage of thinly/non traded securities is 0.31%.
ii#
iiiValue Research RatingBirla Sun Life MIP II Savings 5 Plan
Hybrid: Monthly Income (33 Schemes),for 3 & 5 years periods ended 31-Aug-09
(Past performance is no guarantee of future results.) for ranking methodology please refer page 50
MIP Conservative schemes (9 Schemes), 2 years ended 30-Jun-09Birla Sun Life MIP II Savings 5 Plan
CRISIL~CPR 1^^
1.48%
4.57%
41.13%
52.82%
AA
Equity
Cash & Current Assets
AAA
14.93
12.29
9.59 9.3410.36
7.728.41 8.01
0
2
4
6
8
10
12
14
16
1 Year 3 Years 5 Years Since Inception
33

S e p t e m b e r 2 0 0 9
Fund Details
Investment Objective
As on Aug 31, 2009
Birla Sun Life Asset Allocation Fund
Investment Style Box
Credit Quality
High Mid Low Interest rate sensitivity
High
Mid
Low
Fund Manager :Managing Fund Since : June 18, 2009Total Experience : 12 yearsDate of inception : February 24, 2004Nature of the scheme : An Open-ended Fund of Funds
Scheme
Default option : Dividend ReinvestmentFresh Purchase : Rs. 5000/-Additional Purchase : Rs. 1000/-Redemption Cheques : Within 10 working days issued
Aggressive PlanDividend : 27.6481(Payout & Reinvestment)Growth : 27.6481Conservative PlanDividend : 18.4400(Payout & Reinvestment)Growth : 18.4400Moderate PlanDividend : 23.7650(Payout & Reinvestment)Growth : 23.7650
BenchmarkAggressive Plan : S&P CNX NIFTYModerate Plan : CRISIL Balanced Fund IndexConservative Plan : CRISIL MIP Blended IndexAverage AUMAggressive Plan : Rs. 8.48 CroresConservative Plan : Rs. 5.06 CroresModerate Plan Rs. 4.80 Crores
Entry Load : NilExit Load : Nil
Standard Deviation Aggressive Plan : 31.76%Conservative Plan : 8.34%Moderate Plan : 23.03%
Mr. Satyabrata Mohanty
Key Features
Plans / Options & NAV
:
Load Structure
Other Parameter
(As on Aug 31, 2009)
Note:Standard Deviation is calculated on annualised basis using 1 year history of monthly returns, source: MFI Explorer
An open-ended Fund of Funds scheme with the objective to provide income and capital appreciation along with diversification by investing in a basket of debt and equity Mutual Fund schemes in line with the risk profile of the investors.
Past performance may or may not be sustained in future. Returns are in % and absolute returns for period less than 1 year & CAGR for period 1 year or more.
Birla Sun Life AAF Aggressive Plan - Growth S & P CNX Nifty
Investment Performance - Aggressive Plan
Past performance may or may not be sustained in future. Returns are in % and absolute returns for period less than 1 year & CAGR for period 1 year or more.
Birla Sun Life AAF Conservative Plan - Growth Crisil MIP Blended Index
Investment Performance - Conservative Plan
Past performance may or may not be sustained in future. Returns are in % and absolute returns for period less than 1 year & CAGR for period 1 year or more.
Birla Sun Life AAF Moderate Plan - Growth Crisil Balanced Fund Index
Investment Performance - Moderate Plan
% R
etur
ns
% R
etur
ns
% R
etur
ns
Mutual Fund Units 96.51Birla Sun Life Dynamic Bond Fund - Growth 22.83
Birla Sun Life Midcap Fund - Growth 20.65
Birla Sun Life Index Fund - Growth 20.08
Birla Sun Life Advantage Fund - Growth 10.90
Birla Sun Life India Opportunities Fund 7.24
Birla Sun Life MNC Fund - Growth 7.11
Birla Sun Life Income Fund - Growth 4.03
Birla Sun Life Short Term Fund - Growth 3.67
Cash & Cash Equivalents 3.47
Net receivables / payables 0.02
Total Net Assets 100.00
Portfolio & Asset Allocation - Moderate PlanPortfolio & Asset Allocation - Aggressive Plan
Issuer % to Net Assets Issuer % to Net Assets
Mutual Fund Units 96.32Birla Sun Life Midcap Fund - Growth 18.49
Birla Sun Life Advantage Fund - Growth 16.49
Birla Sun Life India Opportunities Fund 15.69
Birla Sun Life MNC Fund - Growth 15.47
Birla Sun Life Index Fund - Growth 15.29
Birla Sun Life Dynamic Bond Fund - Growth 7.01
Birla Sun Life Income Fund - Growth 4.16
Birla Sun Life Short Term Fund - Growth 3.01
Birla Sun Life Gilt Plus PF Plan - Growth 0.71
Cash & Cash Equivalents 4.92
Net receivables / payables -1.24
Total Net Assets 100.00
Portfolio & Asset Allocation - Conservative Plan
Issuer % to Net Assets
Mutual Fund Units 92.08Birla Sun Life Short Term Fund - Growth 28.60
Birla Sun Life Dynamic Bond Fund - Growth 25.90
Birla Sun Life Index Fund - Growth 7.86
Birla Sun Life Income Fund - Growth 7.41
Birla Sun Life India Opportunities Fund 6.61
Birla Sun Life MNC Fund - Growth 6.58
Birla Sun Life Advantage Fund - Growth 5.09
Birla Sun Life Midcap Fund - Growth 4.03
Cash & Cash Equivalents 7.20
Net receivables / payables 0.72
Total Net Assets 100.00
(Past performance is no guarantee of future results.) for ranking methodology please refer page 50
«««« #Value Research Rating
Equity Diversified(147 Schemes),for 3 & 5 years periods ended 31-Aug-09
Birla Sun Life AAF - Aggressive
Winner of&Best Fund - 3 yrs performance Lipper Awards India 2009
Mixed Asset INR Balanced, (7 schemes) 3 Yrs Performance (2005-2008)Birla Sun Life Asset Allocation Fund - Growth
9
29.10
15.45
22.5320.23
6.39
10.63
22.93
18.81
0
5
10
15
20
25
30
35
1 Year 3 Years 5 Years Since Inception
23.20
14.28
18.7516.98
11.17 10.77
16.84
14.18
0
5
10
15
20
25
1 Year 3 Years 5 Years Since Inception
15.77
11.3012.37
11.7210.36
7.728.41
7.31
0
2
4
6
8
10
12
14
16
18
1 Year 3 Years 5 Years Since Inception
34
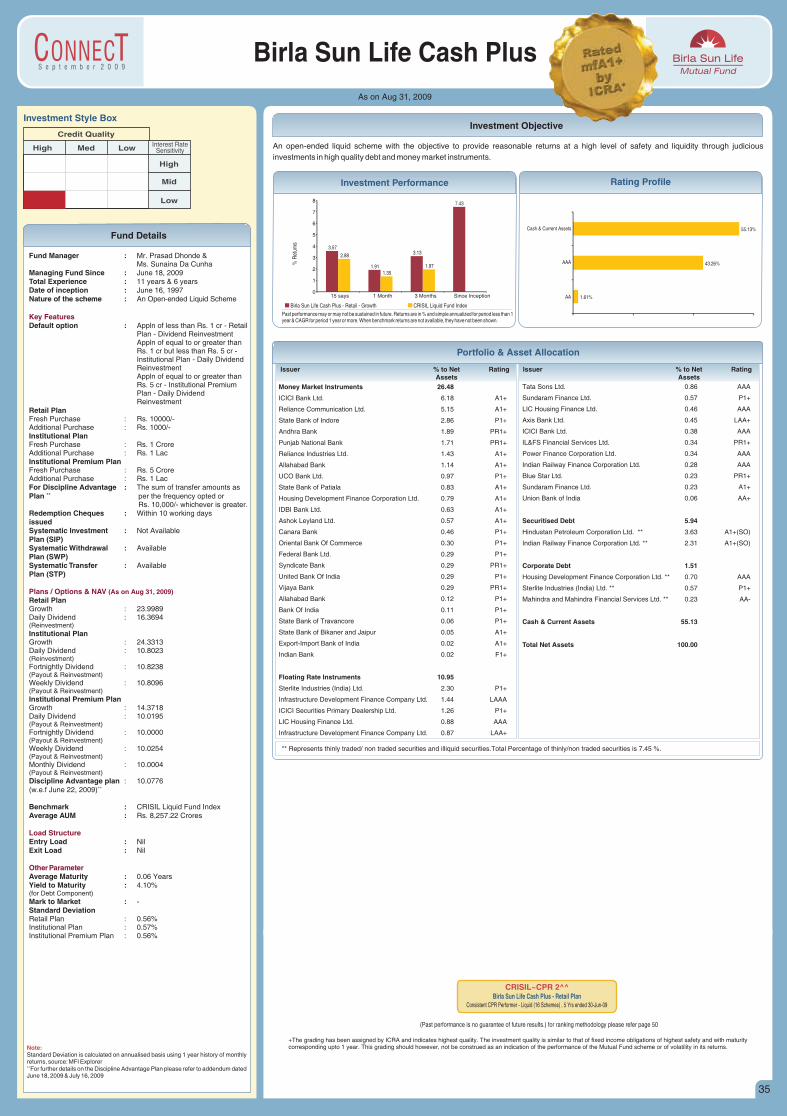
S e p t e m b e r 2 0 0 9
Fund Details
Investment Objective
As on Aug 31, 2009
Birla Sun Life Cash Plus
Investment Style Box
Low Interest RateSensitivity
High
Mid
Low
Credit Quality
High Med
Fund Manager :Ms. Sunaina Da Cunha
Managing Fund Since : June 18, 2009Total Experience : 11 years & 6 yearsDate of inception : June 16, 1997Nature of the scheme : An Open-ended Liquid Scheme
Default option : Appln of less than Rs. 1 cr - Retail Plan - Dividend ReinvestmentAppln of equal to or greater than Rs. 1 cr but less than Rs. 5 cr - Institutional Plan - Daily Dividend ReinvestmentAppln of equal to or greater than Rs. 5 cr - Institutional Premium Plan - Daily Dividend Reinvestment
Retail PlanFresh Purchase : Rs. 10000/-Additional Purchase : Rs. 1000/-Institutional PlanFresh Purchase : Rs. 1 CroreAdditional Purchase : Rs. 1 LacInstitutional Premium PlanFresh Purchase : Rs. 5 CroreAdditional Purchase : Rs. 1 LacFor Discipline Advantage : The sum of transfer amounts as
++Plan per the frequency opted or Rs. 10,000/- whichever is greater.
Redemption Cheques : Within 10 working days issuedSystematic Investment : Not Available Plan (SIP)Systematic Withdrawal : Available Plan (SWP)Systematic Transfer : AvailablePlan (STP)
Retail PlanGrowth : 23.9989Daily Dividend : 16.3694(Reinvestment)
Institutional PlanGrowth : 24.3313Daily Dividend : 10.8023(Reinvestment)Fortnightly Dividend : 10.8238(Payout & Reinvestment)Weekly Dividend : 10.8096(Payout & Reinvestment)
Institutional Premium PlanGrowth : 14.3718Daily Dividend : 10.0195(Payout & Reinvestment)Fortnightly Dividend : 10.0000(Payout & Reinvestment)Weekly Dividend : 10.0254(Payout & Reinvestment)Monthly Dividend : 10.0004(Payout & Reinvestment)
Discipline Advantage plan : 10.0776++(w.e.f June 22, 2009)
Benchmark : CRISIL Liquid Fund IndexAverage AUM : Rs. 8,257.22 Crores
Entry Load : NilExit Load : Nil
Average Maturity : 0.06 YearsYield to Maturity : 4.10%(for Debt Component)
Mark to Market : -Standard DeviationRetail Plan : 0.56%Institutional Plan : 0.57%Institutional Premium Plan : 0.56%
Mr. Prasad Dhonde &
Key Features
Plans / Options & NAV
Load Structure
Other Parameter
(As on Aug 31, 2009)
Note:Standard Deviation is calculated on annualised basis using 1 year history of monthly returns, source: MFI Explorer++For further details on the Discipline Advantage Plan please refer to addendum dated June 18, 2009 & July 16, 2009
An open-ended liquid scheme with the objective to provide reasonable returns at a high level of safety and liquidity through judicious
investments in high quality debt and money market instruments.
Portfolio & Asset Allocation
Issuer % to Net RatingAssets
Issuer % to Net RatingAssets
Money Market Instruments 26.48
ICICI Bank Ltd. 6.18 A1+
Reliance Communication Ltd. 5.15 A1+
State Bank of Indore 2.86 P1+
Andhra Bank 1.89 PR1+
Punjab National Bank 1.71 PR1+
Reliance Industries Ltd. 1.43 A1+
Allahabad Bank 1.14 A1+
UCO Bank Ltd. 0.97 P1+
State Bank of Patiala 0.83 A1+
Housing Development Finance Corporation Ltd. 0.79 A1+
IDBI Bank Ltd. 0.63 A1+
Ashok Leyland Ltd. 0.57 A1+
Canara Bank 0.46 P1+
Oriental Bank Of Commerce 0.30 P1+
Federal Bank Ltd. 0.29 P1+
Syndicate Bank 0.29 PR1+
United Bank Of India 0.29 P1+
Vijaya Bank 0.29 PR1+
Allahabad Bank 0.12 P1+
Bank Of India 0.11 P1+
State Bank of Travancore 0.06 P1+
State Bank of Bikaner and Jaipur 0.05 A1+
Export-Import Bank of India 0.02 A1+
Indian Bank 0.02 F1+
Floating Rate Instruments 10.95
Sterlite Industries (India) Ltd. 2.30 P1+
Infrastructure Development Finance Company Ltd. 1.44 LAAA
ICICI Securities Primary Dealership Ltd. 1.26 P1+
LIC Housing Finance Ltd. 0.88 AAA
Infrastructure Development Finance Company Ltd. 0.87 LAA+
Tata Sons Ltd. 0.86 AAA
Sundaram Finance Ltd. 0.57 P1+
LIC Housing Finance Ltd. 0.46 AAA
Axis Bank Ltd. 0.45 LAA+
ICICI Bank Ltd. 0.38 AAA
IL&FS Financial Services Ltd. 0.34 PR1+
Power Finance Corporation Ltd. 0.34 AAA
Indian Railway Finance Corporation Ltd. 0.28 AAA
Blue Star Ltd. 0.23 PR1+
Sundaram Finance Ltd. 0.23 A1+
Union Bank of India 0.06 AA+
Securitised Debt 5.94
Hindustan Petroleum Corporation Ltd. ** 3.63 A1+(SO)
Indian Railway Finance Corporation Ltd. ** 2.31 A1+(SO)
Corporate Debt 1.51
Housing Development Finance Corporation Ltd. ** 0.70 AAA
Sterlite Industries (India) Ltd. ** 0.57 P1+
Mahindra and Mahindra Financial Services Ltd. ** 0.23 AA-
Cash & Current Assets 55.13
Total Net Assets 100.00
** Represents thinly traded/ non traded securities and illiquid securities.Total Percentage of thinly/non traded securities is 7.45 %.
(Past performance is no guarantee of future results.) for ranking methodology please refer page 50
CRISIL~CPR 2^^Birla Sun Life Cash Plus - Retail Plan
Consistent CPR Performer - Liquid (16 Schemes) , 5 Yrs ended 30-Jun-09
+The grading has been assigned by ICRA and indicates highest quality. The investment quality is similar to that of fixed income obligations of highest safety and with maturity corresponding upto 1 year. This grading should however, not be construed as an indication of the performance of the Mutual Fund scheme or of volatility in its returns.
Rating ProfileInvestment Performance
Past performance may or may not be sustained in future. Returns are in % and simple annualized for period less than 1 year & CAGR for period 1 year or more. When benchmark returns are not available, they have not been shown.
% R
etur
ns
Birla Sun Life Cash Plus - Retail - Growth CRISIL Liquid Fund Index
1.61%
43.26%
55.13%
AA
AAA
Cash & Current Assets
3.57
1.91
3.13
7.43
2.88
1.35
1.97
0
1
2
3
4
5
6
7
8
15 says 1 Month 3 Months Since Inception
35
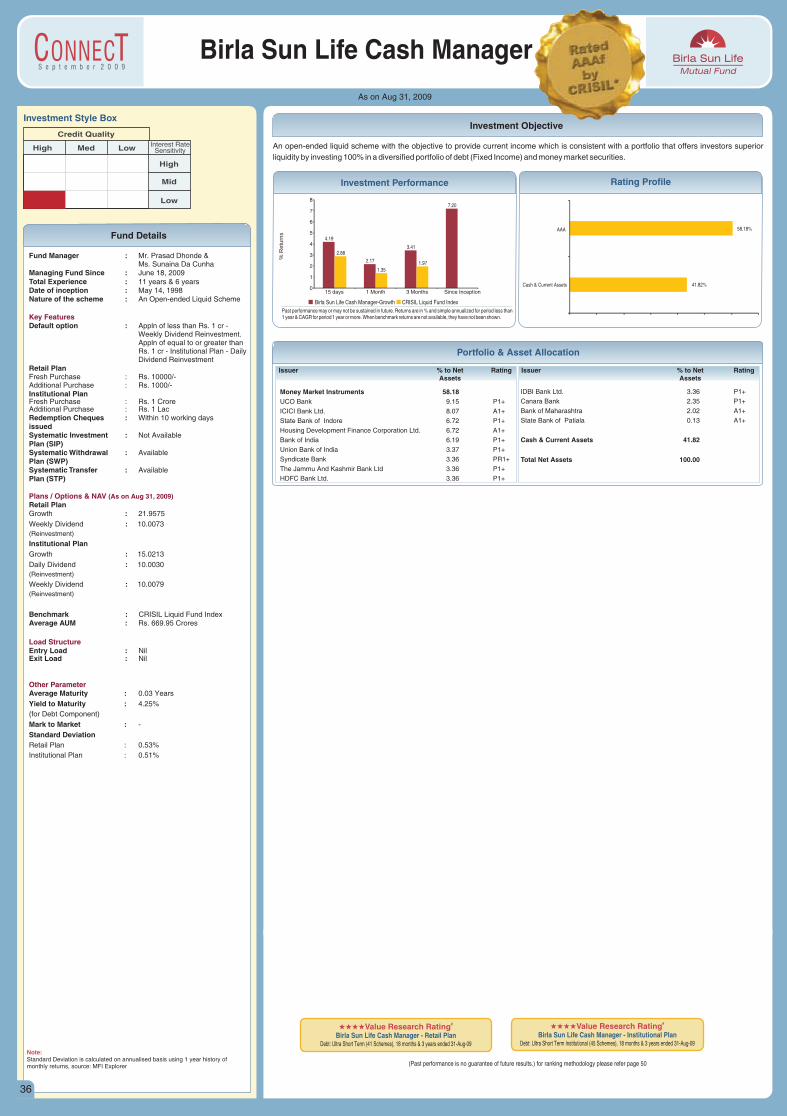
S e p t e m b e r 2 0 0 9
Fund Details
Investment Objective
As on Aug 31, 2009
Birla Sun Life Cash Manager
Investment Style Box
Low Interest RateSensitivity
High
Mid
Low
Credit Quality
High Med
Fund Manager :Ms. Sunaina Da Cunha
Managing Fund Since : June 18, 2009Total Experience : 11 years & 6 yearsDate of inception : May 14, 1998Nature of the scheme : An Open-ended Liquid Scheme
Default option : Appln of less than Rs. 1 cr - Weekly Dividend Reinvestment.Appln of equal to or greater than Rs. 1 cr - Institutional Plan - Daily Dividend Reinvestment
Retail PlanFresh Purchase : Rs. 10000/-Additional Purchase : Rs. 1000/-Institutional PlanFresh Purchase : Rs. 1 CroreAdditional Purchase : Rs. 1 LacRedemption Cheques : Within 10 working days issuedSystematic Investment : Not Available Plan (SIP)Systematic Withdrawal : Available Plan (SWP)Systematic Transfer : AvailablePlan (STP)
Retail PlanGrowth : 21.9575
Weekly Dividend : 10.0073
(Reinvestment)
Institutional PlanGrowth : 15.0213
Daily Dividend : 10.0030
(Reinvestment)
Weekly Dividend : 10.0079
(Reinvestment)
Benchmark : CRISIL Liquid Fund IndexAverage AUM : Rs. 669.95 Crores
Entry Load : NilExit Load : Nil
Average Maturity : 0.03 Years
Yield to Maturity : 4.25%
(for Debt Component)
Mark to Market : -
Standard Deviation Retail Plan : 0.53%
Institutional Plan : 0.51%
Mr. Prasad Dhonde &
Key Features
Plans / Options & NAV
Load Structure
Other Parameter
(As on Aug 31, 2009)
Note:Standard Deviation is calculated on annualised basis using 1 year history of monthly returns, source: MFI Explorer
An open-ended liquid scheme with the objective to provide current income which is consistent with a portfolio that offers investors superior
liquidity by investing 100% in a diversified portfolio of debt (Fixed Income) and money market securities.
Rating Profile
41.82%
58.18%
Cash & Current Assets
AAA
Past performance may or may not be sustained in future. Returns are in % and simple annualized for period less than 1 year & CAGR for period 1 year or more. When benchmark returns are not available, they have not been shown.
Birla Sun Life Cash Manager-Growth CRISIL Liquid Fund Index
Investment Performance
% R
etu
rns
Portfolio & Asset Allocation
Issuer % to Net RatingAssets
Issuer % to Net RatingAssets
Money Market Instruments 58.18UCO Bank 9.15 P1+
ICICI Bank Ltd. 8.07 A1+
State Bank of Indore 6.72 P1+
Housing Development Finance Corporation Ltd. 6.72 A1+
Bank of India 6.19 P1+
Union Bank of India 3.37 P1+
Syndicate Bank 3.36 PR1+
The Jammu And Kashmir Bank Ltd 3.36 P1+
HDFC Bank Ltd. 3.36 P1+
IDBI Bank Ltd. 3.36 P1+
Canara Bank 2.35 P1+
Bank of Maharashtra 2.02 A1+
State Bank of Patiala 0.13 A1+
Cash & Current Assets 41.82
Total Net Assets 100.00
#iiiValue Research Ratingi
Birla Sun Life Cash Manager - Retail PlanDebt: Ultra Short Term (41 Schemes), 18 months & 3 years ended 31-Aug-09
(Past performance is no guarantee of future results.) for ranking methodology please refer page 50
#iiiValue Research Ratingi
Birla Sun Life Cash Manager - Institutional PlanDebt: Ultra Short Term Institutional (45 Schemes), 18 months & 3 years ended 31-Aug-09
4.19
2.17
3.41
7.20
2.88
1.35
1.97
0
1
2
3
4
5
6
7
8
15 days 1 Month 3 Months Since Inception
36

S e p t e m b e r 2 0 0 9
Fund Details
Investment Objective
As on Aug 31, 2009
Birla Sun Life Short Term Fund
Investment Style Box
Low Interest RateSensitivity
High
Mid
Low
Credit Quality
High Med
Fund Manager :Managing Fund Since : June 18, 2009Total Experience : 9 yearsDate of inception : April 19, 2002Nature of the scheme : An Open-ended Short Term
Income Scheme
Default option : Appln of less than Rs. 2 cr - Retail Plan - Fortnightly Dividend ReinvestmentAppln of equal to or greater than Rs. 2 cr - Institutional Plan - Fortnightly Dividend Reinvestment
Retail PlanFresh Purchase : Rs. 10000/-Additional Purchase : Rs. 1000/-Institutional PlanFresh Purchase : Rs. 2 CroreAdditional Purchase : Rs. 10000/-For Discipline Advantage : The sum of transfer amounts as
++Plan per the frequency opted or Rs. 10,000/- whichever is greater.
Redemption Cheques : Within 10 working days issuedSIP : AvailableSWP : Available STP : Available
Retail PlanGrowth : 16.2431Daily Dividend : 10.0055(Reinvestment)
Fortnightly Dividend : 10.2358(Payout & Reinvestment)
Monthly Dividend : 10.7037(Payout & Reinvestment)
Institutional PlanGrowth : 10.6601Daily Dividend : 10.0055(Reinvestment)
Fortnightly Dividend : 10.1397(Payout & Reinvestment)
Monthly Dividend : 10.1439(Payout & Reinvestment)
Discipline Advantage Plan : 10.0892++(w.e.f June 22, 2009)
Benchmark : CRISIL Short-Term Bond Fund Index
Average AUM : Rs. 4,185.19 Crores
Entry Load : NilExit Load : Nil
Average Maturity : 0.34 YearsYield to Maturity : 4.75%(for Debt Component)Mark to Market : -Standard Deviation : 0.62%
Mr. Maneesh Dangi
Key Features
Plans / Options & NAV
Load Structure (Incl. for SIP)
Other Parameter
(As on Aug 31, 2009)
Past performance may or may not be sustained in future. Returns are in % and absolute returns for period less than 1 year & CAGR for period 1 year or more.
% R
etur
ns
Birla Sun Life Short Term Fund - Retail Plan - Growth CRISIL Short-Term Bond Fund Index
Investment Performance Rating Profile
An open-ended short term income scheme with the objective to generate income and capital appreciation by investing 100% of the corpus in a
diversified portfolio of debt and money market securities with relatively low levels of interest rate risk.
Note:Standard Deviation is calculated on annualised basis using 1 year history of monthly returns, source: MFI Explorer++For further details on the Discipline Advantage Plan please refer to addendum dated June 18, 2009 & July 16, 2009
(Past performance is no guarantee of future results.) for ranking methodology please refer page 50
Birla Sun Life Short Term Fund - Retail PlanDebt: Short Term Schemes (22 Schemes), 1 Yr ended 30-Jun-09
CRISIL~CPR 1^^ &&CNBC TV-18 CRISIL AWARD 2008Birla Sun Life Short Term Fund - Retail
1 Yr Performance ended Dec 31, 08. Total Schemes in Category = 15Category: Income – Short Term Funds
Portfolio & Asset Allocation
Issuer % to Net RatingAssets
Issuer % to Net RatingAssets
Money Market Instruments 68.59
Punjab National Bank 15.37 PR1+
Oriental Bank of Commerce 11.13 P1+
Corporation Bank 5.99 P1+
Canara Bank 4.89 P1+
State Bank of Travancore 4.28 P1+
Vijaya Bank 3.61 PR1+
Bank of Baroda 3.08 P1+
State Bank of Hyderabad 2.75 A1+
Syndicate Bank 2.43 PR1+
Indian Bank 2.41 F1+
Allahabad Bank 2.38 P1+
State Bank of Bikaner and Jaipur 1.85 P1+
State Bank of Mysore 1.84 A1+
State Bank of Travancore 1.57 A1+
IDBI Bank Ltd. 1.23 A1+
Bank of India 1.22 P1+
Allahabad Bank 1.22 A1+
Andhra Bank 0.74 F1+
State Bank of Patiala 0.61 P1+
Cash & Current Assets 31.41
Total Net Assets 100.00
#iiValue Research Ratingii
Birla Sun Life Short Term Fund - Retail PlanDebt: Short Term (17 Schemes), 18 months & 3 years ended 31-Aug-09
31.41%
68.59%
Cash & Current Assets
AAA7.10
8.13
6.97 6.80
9.75
7.74
6.58 6.33
0
2
4
6
8
10
12
1 Year 3 Years 5 Years Since Inception
37
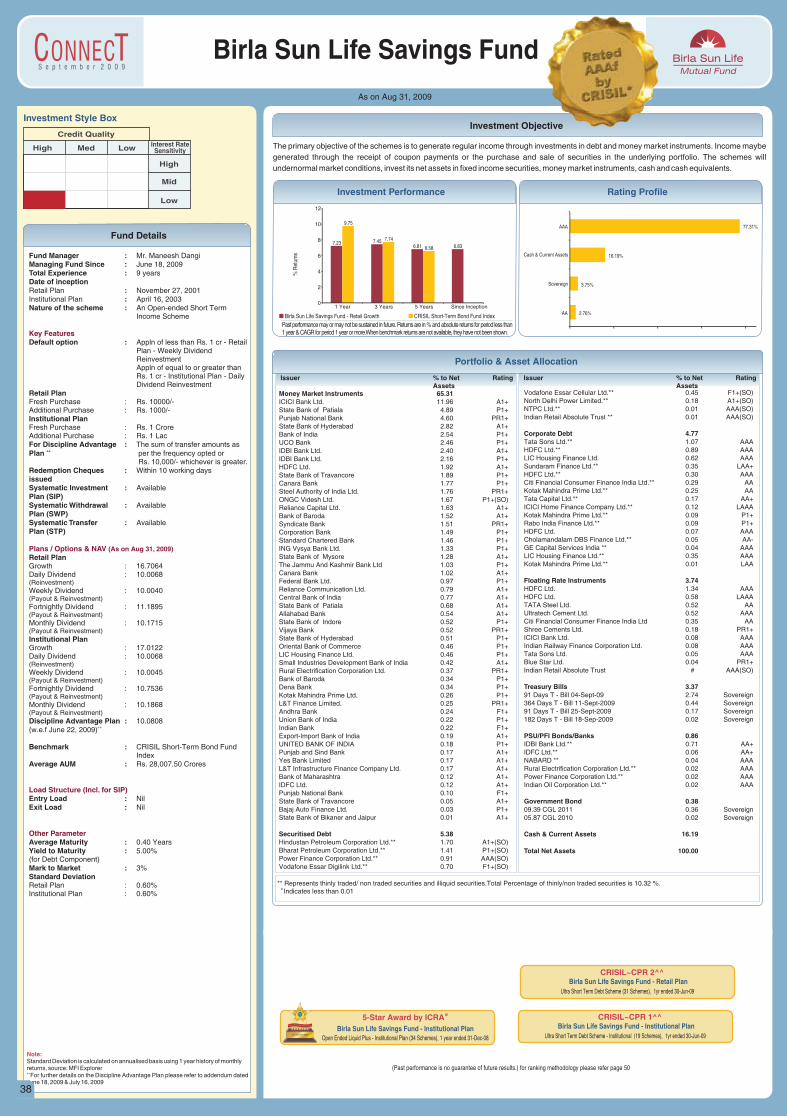
S e p t e m b e r 2 0 0 9
Fund Details
Investment Objective
Birla Sun Life Savings Fund
As on Aug 31, 2009
Investment Style Box
Low Interest RateSensitivity
High
Mid
Low
Credit Quality
High Med
Fund Manager :Managing Fund Since : June 18, 2009Total Experience : 9 yearsDate of inceptionRetail Plan : November 27, 2001Institutional Plan : April 16, 2003Nature of the scheme : An Open-ended Short Term
Income Scheme
Default option : Appln of less than Rs. 1 cr - Retail Plan - Weekly Dividend ReinvestmentAppln of equal to or greater than Rs. 1 cr - Institutional Plan - Daily Dividend Reinvestment
Retail PlanFresh Purchase : Rs. 10000/-Additional Purchase : Rs. 1000/-Institutional PlanFresh Purchase : Rs. 1 CroreAdditional Purchase : Rs. 1 LacFor Discipline Advantage : The sum of transfer amounts as
++Plan per the frequency opted or Rs. 10,000/- whichever is greater.
Redemption Cheques : Within 10 working days issuedSystematic Investment : Available Plan (SIP)Systematic Withdrawal : Available Plan (SWP)Systematic Transfer : AvailablePlan (STP)
Retail PlanGrowth : 16.7064Daily Dividend : 10.0068(Reinvestment)Weekly Dividend : 10.0040(Payout & Reinvestment)Fortnightly Dividend : 11.1895(Payout & Reinvestment)Monthly Dividend : 10.1715(Payout & Reinvestment)
Institutional PlanGrowth : 17.0122Daily Dividend : 10.0068(Reinvestment)Weekly Dividend : 10.0045(Payout & Reinvestment)Fortnightly Dividend : 10.7536(Payout & Reinvestment)Monthly Dividend : 10.1868(Payout & Reinvestment)
Discipline Advantage Plan : 10.0808++(w.e.f June 22, 2009)
Benchmark : CRISIL Short-Term Bond Fund Index
Average AUM : Rs. 28,007.50 Crores
Entry Load : NilExit Load : Nil
Average Maturity : 0.40 YearsYield to Maturity : 5.00%(for Debt Component)Mark to Market : 3%Standard DeviationRetail Plan : 0.60%Institutional Plan : 0.60%
Mr. Maneesh Dangi
Key Features
Plans / Options & NAV
Load Structure (Incl. for SIP)
Other Parameter
(As on Aug 31, 2009)
Note:Standard Deviation is calculated on annualised basis using 1 year history of monthly returns, source: MFI Explorer++For further details on the Discipline Advantage Plan please refer to addendum dated June 18, 2009 & July 16, 2009
Birla Sun Life Savings Fund - Institutional Plan Ultra Short Term Debt Scheme - Institutional (19 Schemes), 1yr ended 30-Jun-09
CRISIL~CPR 1^^
(Past performance is no guarantee of future results.) for ranking methodology please refer page 50
5-Star Award by @ICRABirla Sun Life Savings Fund - Institutional Plan
Open Ended Liquid Plus - Institutional Plan (34 Schemes), 1 year ended 31-Dec-08
Past performance may or may not be sustained in future. Returns are in % and absolute returns for period less than 1 year & CAGR for period 1 year or more.When benchmark returns are not available, they have not been shown.
% R
etur
ns
Birla Sun Life Savings Fund - Retail Growth CRISIL Short-Term Bond Fund Index
Investment Performance Rating Profile
The primary objective of the schemes is to generate regular income through investments in debt and money market instruments. Income maybe
generated through the receipt of coupon payments or the purchase and sale of securities in the underlying portfolio. The schemes will
undernormal market conditions, invest its net assets in fixed income securities, money market instruments, cash and cash equivalents.
Portfolio & Asset Allocation
Issuer % to Net RatingAssets
Issuer % to Net RatingAssets
Money Market Instruments 65.31ICICI Bank Ltd. 11.96 A1+State Bank of Patiala 4.89 P1+Punjab National Bank 4.60 PR1+State Bank of Hyderabad 2.82 A1+Bank of India 2.54 P1+UCO Bank 2.46 P1+IDBI Bank Ltd. 2.40 A1+IDBI Bank Ltd. 2.16 P1+HDFC Ltd. 1.92 A1+State Bank of Travancore 1.89 P1+Canara Bank 1.77 P1+Steel Authority of India Ltd. 1.76 PR1+ONGC Videsh Ltd. 1.67 P1+(SO)Reliance Capital Ltd. 1.63 A1+Bank of Baroda 1.52 A1+Syndicate Bank 1.51 PR1+Corporation Bank 1.49 P1+Standard Chartered Bank 1.46 P1+ING Vysya Bank Ltd. 1.33 P1+State Bank of Mysore 1.28 A1+The Jammu And Kashmir Bank Ltd 1.03 P1+Canara Bank 1.02 A1+Federal Bank Ltd. 0.97 P1+Reliance Communication Ltd. 0.79 A1+Central Bank of India 0.77 A1+State Bank of Patiala 0.68 A1+Allahabad Bank 0.54 A1+State Bank of Indore 0.52 P1+Vijaya Bank 0.52 PR1+State Bank of Hyderabad 0.51 P1+Oriental Bank of Commerce 0.46 P1+LIC Housing Finance Ltd. 0.46 P1+Small Industries Development Bank of India 0.42 A1+Rural Electrification Corporation Ltd. 0.37 PR1+Bank of Baroda 0.34 P1+Dena Bank 0.34 P1+Kotak Mahindra Prime Ltd. 0.26 P1+L&T Finance Limited. 0.25 PR1+Andhra Bank 0.24 F1+Union Bank of India 0.22 P1+Indian Bank 0.22 F1+Export-Import Bank of India 0.19 A1+UNITED BANK OF INDIA 0.18 P1+Punjab and Sind Bank 0.17 A1+Yes Bank Limited 0.17 A1+L&T Infrastructure Finance Company Ltd. 0.17 A1+Bank of Maharashtra 0.12 A1+IDFC Ltd. 0.12 A1+Punjab National Bank 0.10 F1+State Bank of Travancore 0.05 A1+Bajaj Auto Finance Ltd. 0.03 P1+State Bank of Bikaner and Jaipur 0.01 A1+
Securitised Debt 5.38Hindustan Petroleum Corporation Ltd.** 1.70 A1+(SO)Bharat Petroleum Corporation Ltd.** 1.41 P1+(SO)Power Finance Corporation Ltd.** 0.91 AAA(SO)Vodafone Essar Digilink Ltd.** 0.70 F1+(SO)
Vodafone Essar Cellular Ltd.** 0.45 F1+(SO)North Delhi Power Limited.** 0.18 A1+(SO)NTPC Ltd.** 0.01 AAA(SO)Indian Retail Absolute Trust ** 0.01 AAA(SO)
Corporate Debt 4.77Tata Sons Ltd.** 1.07 AAAHDFC Ltd.** 0.89 AAALIC Housing Finance Ltd. 0.62 AAASundaram Finance Ltd.** 0.35 LAA+HDFC Ltd.** 0.30 AAACiti Financial Consumer Finance India Ltd.** 0.29 AAKotak Mahindra Prime Ltd.** 0.25 AATata Capital Ltd.** 0.17 AA+ICICI Home Finance Company Ltd.** 0.12 LAAAKotak Mahindra Prime Ltd.** 0.09 P1+Rabo India Finance Ltd.** 0.09 P1+HDFC Ltd. 0.07 AAACholamandalam DBS Finance Ltd.** 0.05 AA-GE Capital Services India ** 0.04 AAALIC Housing Finance Ltd.** 0.35 AAAKotak Mahindra Prime Ltd.** 0.01 LAA
Floating Rate Instruments 3.74HDFC Ltd. 1.34 AAAHDFC Ltd. 0.58 LAAATATA Steel Ltd. 0.52 AAUltratech Cement Ltd. 0.52 AAACiti Financial Consumer Finance India Ltd 0.35 AAShree Cements Ltd. 0.18 PR1+ICICI Bank Ltd. 0.08 AAAIndian Railway Finance Corporation Ltd. 0.08 AAATata Sons Ltd. 0.05 AAABlue Star Ltd. 0.04 PR1+Indian Retail Absolute Trust # AAA(SO)
Treasury Bills 3.3791 Days T - Bill 04-Sept-09 2.74 Sovereign364 Days T - Bill 11-Sept-2009 0.44 Sovereign91 Days T - Bill 25-Sept-2009 0.17 Sovereign182 Days T - Bill 18-Sep-2009 0.02 Sovereign
PSU/PFI Bonds/Banks 0.86IDBI Bank Ltd.** 0.71 AA+IDFC Ltd.** 0.06 AA+NABARD ** 0.04 AAARural Electrification Corporation Ltd.** 0.02 AAAPower Finance Corporation Ltd.** 0.02 AAAIndian Oil Corporation Ltd.** 0.02 AAA
Government Bond 0.3809.39 CGL 2011 0.36 Sovereign05.87 CGL 2010 0.02 Sovereign
Cash & Current Assets 16.19
Total Net Assets 100.00
** Represents thinly traded/ non traded securities and illiquid securities.Total Percentage of thinly/non traded securities is 10.32 %. # Indicates less than 0.01
Birla Sun Life Savings Fund - Retail Plan Ultra Short Term Debt Scheme (31 Schemes), 1yr ended 30-Jun-09
CRISIL~CPR 2^^
2.76%
3.75%
16.19%
77.31%
AA
Sovereign
Cash & Current Assets
AAA
7.23 7.456.81 6.83
9.75
7.74
6.58
0
2
4
6
8
10
12
1 Year 3 Years 5 Years Since Inception
38
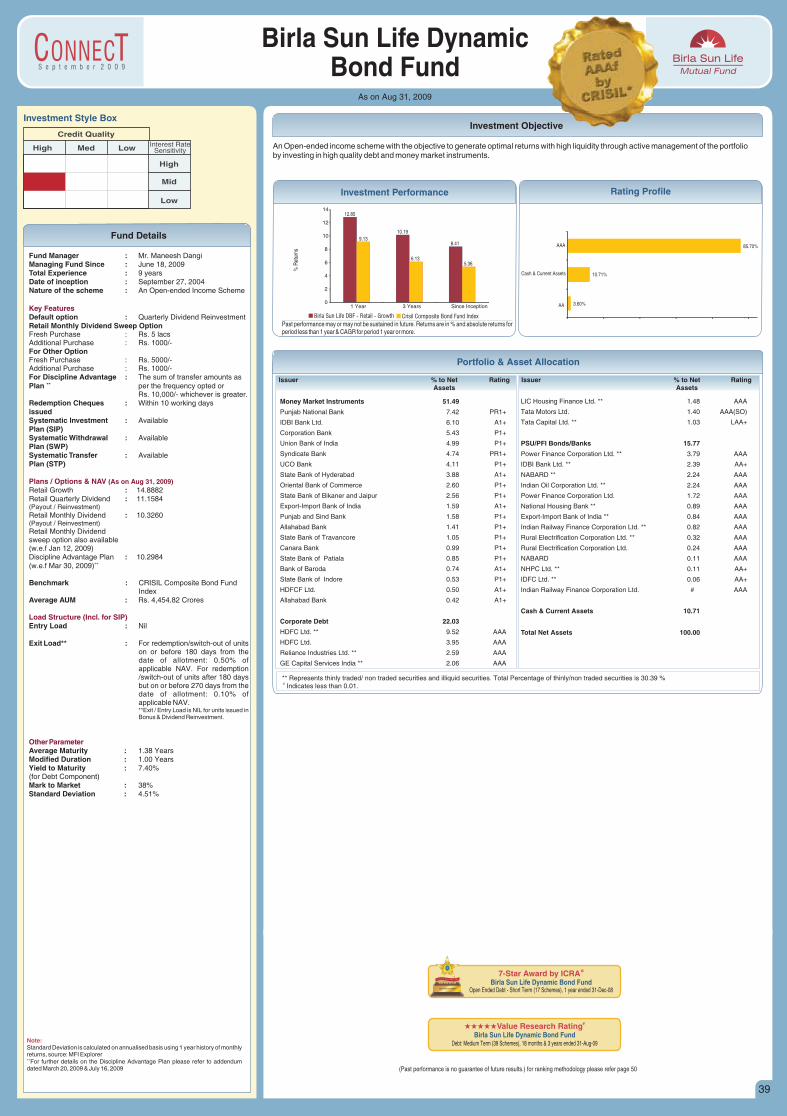
S e p t e m b e r 2 0 0 9
Fund Details
Investment Objective
Birla Sun Life Dynamic Bond Fund
As on Aug 31, 2009
Investment Style Box
Low Interest RateSensitivity
High
Mid
Low
Credit Quality
High Med
Fund Manager :Managing Fund Since : June 18, 2009Total Experience : 9 yearsDate of inception : September 27, 2004Nature of the scheme : An Open-ended Income Scheme
Default option : Quarterly Dividend ReinvestmentRetail Monthly Dividend Sweep OptionFresh Purchase : Rs. 5 lacsAdditional Purchase : Rs. 1000/-For Other OptionFresh Purchase : Rs. 5000/- Additional Purchase : Rs. 1000/-For Discipline Advantage : The sum of transfer amounts as
++Plan per the frequency opted or Rs. 10,000/- whichever is greater.
Redemption Cheques : Within 10 working days issuedSystematic Investment : Available Plan (SIP)Systematic Withdrawal : Available Plan (SWP)Systematic Transfer : AvailablePlan (STP)
Retail Growth : 14.8882 Retail Quarterly Dividend : 11.1584 (Payout / Reinvestment)
Retail Monthly Dividend : 10.3260(Payout / Reinvestment)Retail Monthly Dividendsweep option also available (w.e.f Jan 12, 2009) Discipline Advantage Plan : 10.2984
++(w.e.f Mar 30, 2009)
Benchmark : CRISIL Composite Bond Fund Index
Average AUM : Rs. 4,454.82 Crores
Entry Load : Nil
Exit Load** : For redemption/switch-out of units on or before 180 days from the date of allotment: 0.50% of applicable NAV. For redemption /switch-out of units after 180 days but on or before 270 days from the date of allotment: 0.10% of applicable NAV.**Exit / Entry Load is NIL for units issued in Bonus & Dividend Reinvestment.
Average Maturity : 1.38 YearsModified Duration : 1.00 YearsYield to Maturity : 7.40%(for Debt Component)Mark to Market : 38%Standard Deviation : 4.51%
Mr. Maneesh Dangi
Key Features
Plans / Options & NAV
Load Structure (Incl. for SIP)
Other Parameter
(As on Aug 31, 2009)
Note:Standard Deviation is calculated on annualised basis using 1 year history of monthly returns, source: MFI Explorer++For further details on the Discipline Advantage Plan please refer to addendum dated March 20, 2009 & July 16, 2009 (Past performance is no guarantee of future results.) for ranking methodology please refer page 50
#iiiValue Research Ratingii
Birla Sun Life Dynamic Bond FundDebt: Medium Term (39 Schemes), 18 months & 3 years ended 31-Aug-09
7-Star Award by @ICRABirla Sun Life Dynamic Bond Fund
Open Ended Debt - Short Term (17 Schemes), 1 year ended 31-Dec-08
Portfolio & Asset Allocation
Issuer % to Net RatingAssets
Issuer % to Net RatingAssets
Money Market Instruments 51.49
Punjab National Bank 7.42 PR1+
IDBI Bank Ltd. 6.10 A1+
Corporation Bank 5.43 P1+
Union Bank of India 4.99 P1+
Syndicate Bank 4.74 PR1+
UCO Bank 4.11 P1+
State Bank of Hyderabad 3.88 A1+
Oriental Bank of Commerce 2.60 P1+
State Bank of Bikaner and Jaipur 2.56 P1+
Export-Import Bank of India 1.59 A1+
Punjab and Sind Bank 1.58 P1+
Allahabad Bank 1.41 P1+
State Bank of Travancore 1.05 P1+
Canara Bank 0.99 P1+
State Bank of Patiala 0.85 P1+
Bank of Baroda 0.74 A1+
State Bank of Indore 0.53 P1+
HDFCF Ltd. 0.50 A1+
Allahabad Bank 0.42 A1+
Corporate Debt 22.03
HDFC Ltd. ** 9.52 AAA
HDFC Ltd. 3.95 AAA
Reliance Industries Ltd. ** 2.59 AAA
GE Capital Services India ** 2.06 AAA
LIC Housing Finance Ltd. ** 1.48 AAA
Tata Motors Ltd. 1.40 AAA(SO)
Tata Capital Ltd. ** 1.03 LAA+
PSU/PFI Bonds/Banks 15.77
Power Finance Corporation Ltd. ** 3.79 AAA
IDBI Bank Ltd. ** 2.39 AA+
NABARD ** 2.24 AAA
Indian Oil Corporation Ltd. ** 2.24 AAA
Power Finance Corporation Ltd. 1.72 AAA
National Housing Bank ** 0.89 AAA
Export-Import Bank of India ** 0.84 AAA
Indian Railway Finance Corporation Ltd. ** 0.82 AAA
Rural Electrification Corporation Ltd. ** 0.32 AAA
Rural Electrification Corporation Ltd. 0.24 AAA
NABARD 0.11 AAA
NHPC Ltd. ** 0.11 AA+
IDFC Ltd. ** 0.06 AA+
Indian Railway Finance Corporation Ltd. # AAA
Cash & Current Assets 10.71
Total Net Assets 100.00
** Represents thinly traded/ non traded securities and illiquid securities. Total Percentage of thinly/non traded securities is 30.39 % # Indicates less than 0.01.
Past performance may or may not be sustained in future. Returns are in % and absolute returns for period less than 1 year & CAGR for period 1 year or more.
% R
etur
ns
Birla Sun Life DBF - Retail - Growth Crisil Composite Bond Fund Index
Investment Performance Rating Profile
An Open-ended income scheme with the objective to generate optimal returns with high liquidity through active management of the portfolioby investing in high quality debt and money market instruments.
3.60%
10.71%
85.70%
Cash & Current Assets
AA
AAA
12.85
10.19
8.419.13
6.135.36
0
2
4
6
8
10
12
14
1 Year 3 Years Since Inception
39
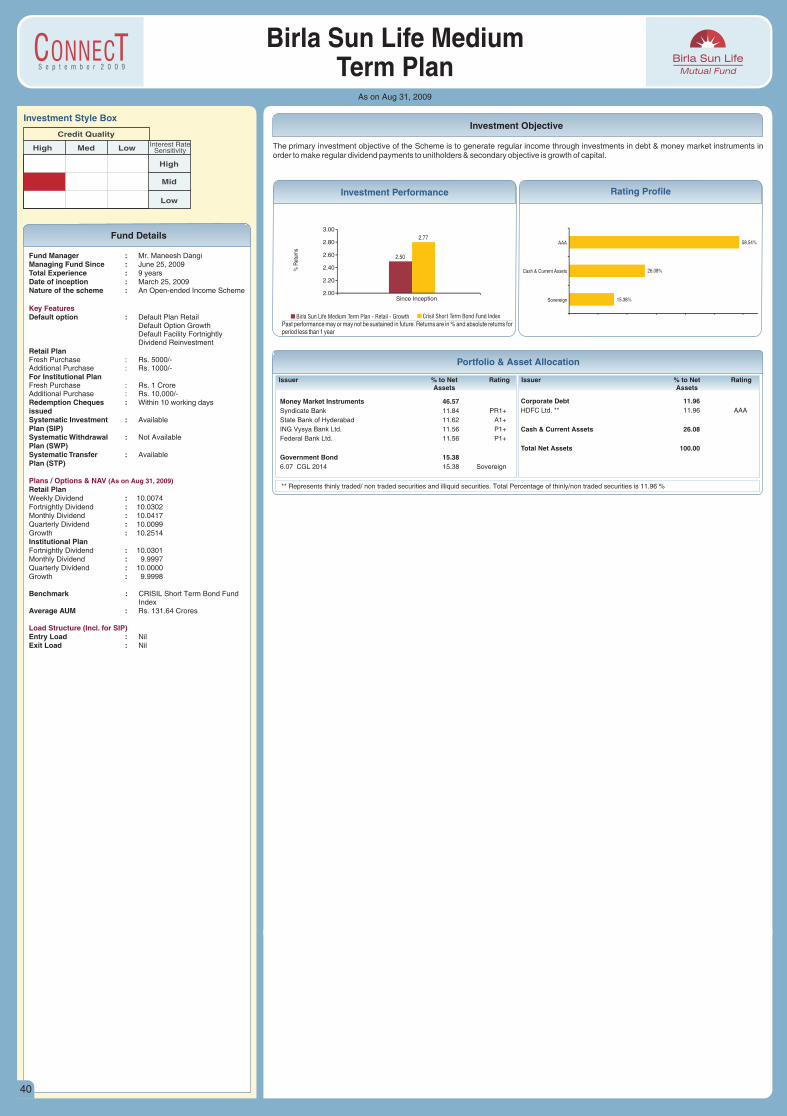
S e p t e m b e r 2 0 0 9
Fund Details
Investment Objective
Birla Sun Life Medium Term Plan
As on Aug 31, 2009
Investment Style Box
Low Interest RateSensitivity
High
Mid
Low
Credit Quality
High Med
Fund Manager :Managing Fund Since : June 25, 2009Total Experience : 9 yearsDate of inception : March 25, 2009Nature of the scheme : An Open-ended Income Scheme
Default option : Default Plan RetailDefault Option GrowthDefault Facility FortnightlyDividend Reinvestment
Retail PlanFresh Purchase : Rs. 5000/-Additional Purchase : Rs. 1000/-For Institutional PlanFresh Purchase : Rs. 1 Crore Additional Purchase : Rs. 10,000/-Redemption Cheques : Within 10 working days issuedSystematic Investment : Available Plan (SIP)Systematic Withdrawal : Not Available Plan (SWP)Systematic Transfer : AvailablePlan (STP)
Retail Plan Weekly Dividend : 10.0074Fortnightly Dividend : 10.0302Monthly Dividend : 10.0417Quarterly Dividend : 10.0099Growth : 10.2514Institutional PlanFortnightly Dividend : 10.0301Monthly Dividend : 9.9997Quarterly Dividend : 10.0000Growth : 9.9998
Benchmark : CRISIL Short Term Bond Fund Index
Average AUM : Rs. 131.64 Crores
Entry Load : NilExit Load : Nil
Mr. Maneesh Dangi
Key Features
Plans / Options & NAV
Load Structure (Incl. for SIP)
(As on Aug 31, 2009)
Portfolio & Asset Allocation
Issuer % to Net RatingAssets
Issuer % to Net RatingAssets
Money Market Instruments 46.57Syndicate Bank 11.84 PR1+
State Bank of Hyderabad 11.62 A1+
ING Vysya Bank Ltd. 11.56 P1+
Federal Bank Ltd. 11.56 P1+
Government Bond 15.386.07 CGL 2014 15.38 Sovereign
Corporate Debt 11.96HDFC Ltd. ** 11.96 AAA
Cash & Current Assets 26.08
Total Net Assets 100.00
Past performance may or may not be sustained in future. Returns are in % and absolute returns for period less than 1 year
% R
etur
ns
Birla Sun Life Medium Term Plan - Retail - Growth Crisil Short Term Bond Fund Index
Investment Performance Rating Profile
The primary investment objective of the Scheme is to generate regular income through investments in debt & money market instruments in order to make regular dividend payments to unitholders & secondary objective is growth of capital.
2.50
2.77
2.00
2.20
2.40
2.60
2.80
3.00
Since Inception
** Represents thinly traded/ non traded securities and illiquid securities. Total Percentage of thinly/non traded securities is 11.96 %
15.38%
26.08%
58.54%
Sovereign
Cash & Current Assets
AAA
40
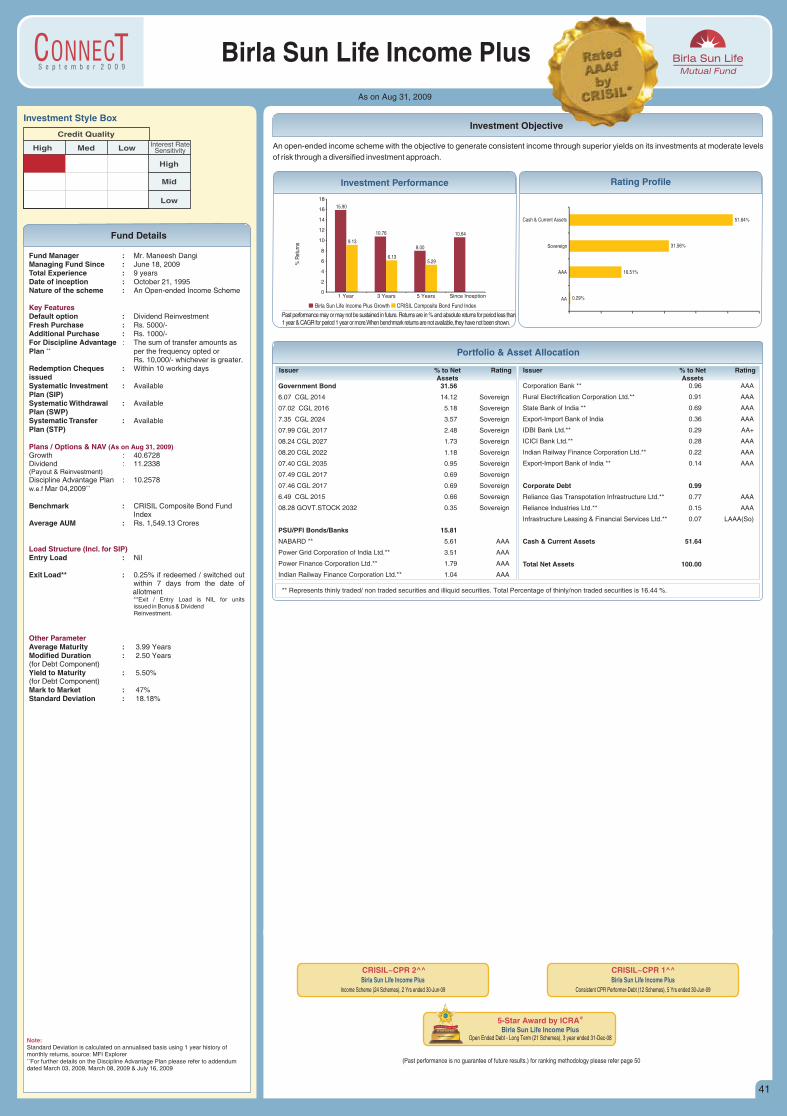
S e p t e m b e r 2 0 0 9
Fund Details
Investment Objective
Birla Sun Life Income PlusAs on Aug 31, 2009
Investment Style Box
Low Interest RateSensitivity
High
Mid
Low
Credit Quality
High Med
Fund Manager : Mr. Managing Fund Since : June 18, 2009Total Experience : 9 yearsDate of inception : October 21, 1995Nature of the scheme : An Open-ended Income Scheme
Default option : Dividend ReinvestmentFresh Purchase : Rs. 5000/-Additional Purchase : Rs. 1000/-For Discipline Advantage : The sum of transfer amounts as
++Plan per the frequency opted or Rs. 10,000/- whichever is greater.
Redemption Cheques : Within 10 working days issuedSystematic Investment : Available Plan (SIP)Systematic Withdrawal : Available Plan (SWP)Systematic Transfer : Available Plan (STP)
Growth : 40.6728Dividend : 11.2338(Payout & Reinvestment)Discipline Advantage Plan : 10.2578
++w.e.f Mar 04,2009
Benchmark : CRISIL Composite Bond Fund Index
Average AUM : Rs. 1,549.13 Crores
Entry Load : Nil
Exit Load** : 0.25% if redeemed / switched out within 7 days from the date of allotment**Exit / Entry Load is NIL for units issued in Bonus & DividendReinvestment.
Average Maturity : 3.99 YearsModified Duration : 2.50 Years(for Debt Component)Yield to Maturity : 5.50%(for Debt Component)Mark to Market : 47%Standard Deviation : 18.18%
Maneesh Dangi
Key Features
Plans / Options & NAV
Load Structure (Incl. for SIP)
Other Parameter
(As on Aug 31, 2009)
Note:Standard Deviation is calculated on annualised basis using 1 year history of monthly returns, source: MFI Explorer++For further details on the Discipline Advantage Plan please refer to addendum dated March 03, 2009, March 08, 2009 & July 16, 2009
5-Star Award by @ICRABirla Sun Life Income Plus
Open Ended Debt - Long Term (21 Schemes), 3 year ended 31-Dec-08
CRISIL~CPR 2^^Birla Sun Life Income Plus
Income Scheme (24 Schemes), 2 Yrs ended 30-Jun-09
CRISIL~CPR 1^^Birla Sun Life Income Plus
Consistent CPR Performer-Debt (12 Schemes), 5 Yrs ended 30-Jun-09
(Past performance is no guarantee of future results.) for ranking methodology please refer page 50
An open-ended income scheme with the objective to generate consistent income through superior yields on its investments at moderate levels
of risk through a diversified investment approach.
Past performance may or may not be sustained in future. Returns are in % and absolute returns for period less than 1 year & CAGR for period 1 year or more.When benchmark returns are not available, they have not been shown.
% R
etur
ns
Birla Sun Life Income Plus Growth CRISIL Composite Bond Fund Index
Investment Performance Rating Profile
Portfolio & Asset Allocation
Issuer % to Net RatingAssets
Issuer % to Net RatingAssets
Government Bond 31.56
6.07 CGL 2014 14.12 Sovereign
07.02 CGL 2016 5.18 Sovereign
7.35 CGL 2024 3.57 Sovereign
07.99 CGL 2017 2.48 Sovereign
08.24 CGL 2027 1.73 Sovereign
08.20 CGL 2022 1.18 Sovereign
07.40 CGL 2035 0.95 Sovereign
07.49 CGL 2017 0.69 Sovereign
07.46 CGL 2017 0.69 Sovereign
6.49 CGL 2015 0.66 Sovereign
08.28 GOVT.STOCK 2032 0.35 Sovereign
PSU/PFI Bonds/Banks 15.81
NABARD ** 5.61 AAA
Power Grid Corporation of India Ltd.** 3.51 AAA
Power Finance Corporation Ltd.** 1.79 AAA
Indian Railway Finance Corporation Ltd.** 1.04 AAA
Corporation Bank ** 0.96 AAA
Rural Electrification Corporation Ltd.** 0.91 AAA
State Bank of India ** 0.69 AAA
Export-Import Bank of India 0.36 AAA
IDBI Bank Ltd.** 0.29 AA+
ICICI Bank Ltd.** 0.28 AAA
Indian Railway Finance Corporation Ltd.** 0.22 AAA
Export-Import Bank of India ** 0.14 AAA
Corporate Debt 0.99
Reliance Gas Transpotation Infrastructure Ltd.** 0.77 AAA
Reliance Industries Ltd.** 0.15 AAA
Infrastructure Leasing & Financial Services Ltd.** 0.07 LAAA(So)
Cash & Current Assets 51.64
Total Net Assets 100.00
** Represents thinly traded/ non traded securities and illiquid securities. Total Percentage of thinly/non traded securities is 16.44 %.
0.29%
16.51%
31.56%
51.64%
AA
AAA
Sovereign
Cash & Current Assets
15.90
10.76
8.00
10.64
9.13
6.135.29
0
2
4
6
8
10
12
14
16
18
1 Year 3 Years 5 Years Since Inception
41

S e p t e m b e r 2 0 0 9
Fund Details
Investment Objective
As on Aug 31, 2009
Birla Sun Life Income Fund
Investment Style Box
Low Interest RateSensitivity
High
Mid
Low
Credit Quality
High Med
Fund Manager :Managing Fund Since : June 18, 2009Total Experience : 9 years Date of inception : March 3, 1997Nature of the scheme : An Open-ended Income Scheme
Default option : Dividend ReinvestmentFresh Purchase : Rs. 5000/-Additional Purchase : Rs. 1000/-For Discipline Advantage : The sum of transfer amounts as
++Plan per the frequency opted or Rs. 10,000/- whichever is greater.
Redemption Cheques : Within 10 working days issuedSystematic Investment : Available Plan (SIP)Systematic Withdrawal : Available Plan (SWP)Systematic Transfer : AvailablePlan (STP)
Growth : 32.8129Quarterly Dividend : 10.8606(Payout & Reinvestment)Half Yearly Dividend : 11.4712(Payout & Reinvestment)54 EA Growth : 32.790254 EA Dividend : 12.222554 EB Growth : 32.583754 EB Dividend : 14.4643Discipline Advantage Plan : 10.0745
++w.e.f Mar 04,2009
Benchmark : CRISIL Composite Bond Fund Index
Average AUM : Rs. 654.15 Crores
Entry Load : NilExit Load** : 1% if redeemed / switched out
within 365 days from the date of allotment**Exit / Entry Load is NIL for units issued in Bonus & Dividend Reinvestment.
Average Maturity : 4.28 YearsModified Duration : 3.00 Years(for Debt Component)Yield to Maturity : 5.75%(for Debt Component)Mark to Market : 57%Standard DeviationRetail Plan : 17.59%54 EA Growth : 17.59%54 EB Growth : 17.59%
Mr. Maneesh Dangi
Key Features
Plans / Options & NAV
Load Structure (Incl. for SIP)
Other Parameter
(As on Aug 31, 2009)
Note:Standard Deviation is calculated on annualised basis using 1 year history of monthly returns, source: MFI Explorer++For further details on the Discipline Advantage Plan please refer to addendum dated March 03, 2009, March 08, 2009 & July 16, 2009
(Past performance is no guarantee of future results.) for ranking methodology please refer page 50
Winner of&Best Fund - 3 yrs performance Lipper Awards India 2009
Bond INR General, (99 schemes) 3 Yrs Performance (2005-2008)Birla Sun Life Income Fund - Growth
9
Winner of&Best Fund - 10 yrs performance Lipper Awards India 2009
Bond INR General, (16 schemes) 10 Yrs Performance (1998-2008)Birla Sun Life Income Fund - Growth
9
&&CNBC TV-18 CRISIL AWARD 2008Birla Sun Life Income Fund - Growth
1 Yr Performance ended Dec 31, 08. Total Schemes in Category = 17
Category: Income scheme
Portfolio & Asset Allocation
Issuer % to Net RatingAssets
Issuer % to Net RatingAssets
Government Bond 38.79
6.07 CGL 2014 13.33 Sovereign
6.49 CGL 2015 11.84 Sovereign
07.02 CGL 2016 9.31 Sovereign
6.90 CGL 2019 2.85 Sovereign
7.35 CGL 2024 1.39 Sovereign
06.05 CGL 2019 FEB 0.06 Sovereign
PSU/PFI Bonds/Banks 18.33
NABARD ** 8.64 AAA
National Housing Bank ** 5.91 AAA
Indian Railway Finance Corporation Ltd.** 1.66 AAA
Rural Electrification Corporation Ltd.** 1.30 AAA
Corporation Bank ** 0.76 AAA
Indian Railway Finance Corporation Ltd. 0.07 AAA
Corporate Debt 3.51
HDFC Ltd.** 2.58 AAA
Reliance Gas Transpotation Infrastructure Ltd.** 0.92 AAA
Cash & Current Assets 39.37
Total Net Assets 100.00
** Represents thinly traded/ non traded securities and illiquid securities.Total Percentage of thinly/non traded securities is 21.78 %.
Past performance may or may not be sustained in future. Returns are in % and absolute returns for period less than 1 year & CAGR for period 1 year or more.When benchmark returns are not available, they have not been shown.
% R
etur
ns
Birla Sun Life Income Fund Growth CRISIL Composite Bond Fund Index
Investment Performance Rating Profile
An open-ended income scheme with the objective to generate income and capital appreciation by investing 100% of the corpus in a diversified
portfolio of debt and money market securities.
21.84%
38.79%
39.37%
AAA
Sovereign
Cash & Current Assets
9.37 9.63
7.49
9.979.13
6.135.29
0
2
4
6
8
10
12
1 Year 3 Years 5 Years Since Inception
42
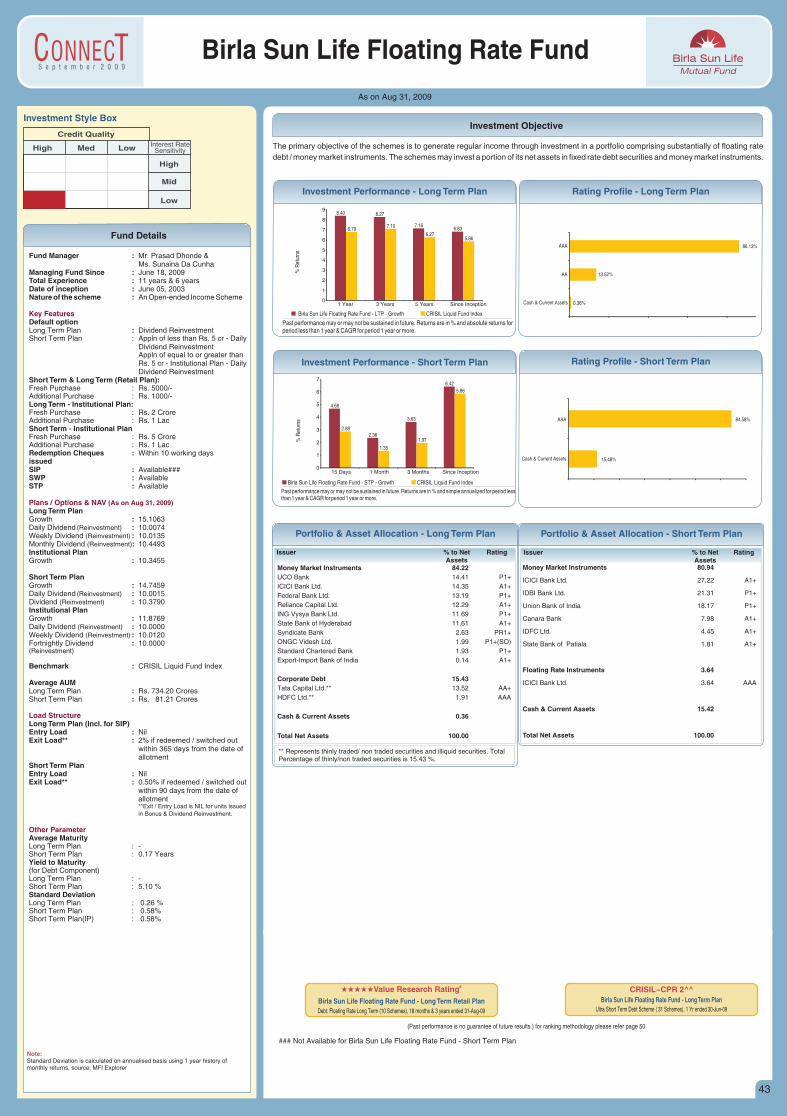
S e p t e m b e r 2 0 0 9
Fund Details
Investment Objective
As on Aug 31, 2009
Birla Sun Life Floating Rate Fund
Investment Style Box
Low Interest RateSensitivity
High
Mid
Low
Credit Quality
High Med
Fund Manager :Ms. Sunaina Da Cunha
Managing Fund Since : June 18, 2009Total Experience : 11 years & 6 years Date of inception : June 05, 2003Nature of the scheme : An Open-ended Income Scheme
Default optionLong Term Plan : Dividend ReinvestmentShort Term Plan : Appln of less than Rs. 5 cr - Daily
Dividend ReinvestmentAppln of equal to or greater than Rs. 5 cr - Institutional Plan - Daily Dividend Reinvestment
Short Term & Long Term (Retail Plan): Fresh Purchase : Rs. 5000/-Additional Purchase : Rs. 1000/-Long Term - Institutional Plan:Fresh Purchase : Rs. 2 CroreAdditional Purchase : Rs. 1 LacShort Term - Institutional PlanFresh Purchase : Rs. 5 CroreAdditional Purchase : Rs. 1 LacRedemption Cheques : Within 10 working days issuedSIP : Available### SWP : Available STP : Available
Long Term PlanGrowth : 15.1063Daily Dividend (Reinvestment) : 10.0074Weekly Dividend (Reinvestment) : 10.0135Monthly Dividend (Reinvestment): 10.4493Institutional Plan Growth : 10.3455
Short Term PlanGrowth : 14.7459Daily Dividend (Reinvestment) : 10.0015Dividend (Reinvestment) : 10.3790Institutional Plan Growth : 11.8769Daily Dividend (Reinvestment) : 10.0000Weekly Dividend (Reinvestment) : 10.0120Fortnightly Dividend : 10.0000(Reinvestment)
Benchmark : CRISIL Liquid Fund Index
Average AUMLong Term Plan : Rs. 734.20 CroresShort Term Plan : Rs. 81.21 Crores
Long Term Plan (Incl. for SIP) Entry Load : Nil Exit Load** : 2% if redeemed / switched out
within 365 days from the date of allotment
Short Term PlanEntry Load : NilExit Load** : 0.50% if redeemed / switched out
within 90 days from the date of allotment**Exit / Entry Load is NIL for units issued
in Bonus & Dividend Reinvestment.
Average Maturity Long Term Plan : -Short Term Plan : 0.17 YearsYield to Maturity (for Debt Component)Long Term Plan : -Short Term Plan : 5.10 %Standard Deviation Long Term Plan : 0.26 %Short Term Plan : 0.58%Short Term Plan(IP) : 0.58%
Mr. Prasad Dhonde &
Key Features
Plans / Options & NAV
Load Structure
Other Parameter
(As on Aug 31, 2009)
The primary objective of the schemes is to generate regular income through investment in a portfolio comprising substantially of floating rate
debt / money market instruments. The schemes may invest a portion of its net assets in fixed rate debt securities and money market instruments.
Past performance may or may not be sustained in future. Returns are in % and absolute returns for period less than 1 year & CAGR for period 1 year or more.
% R
etur
ns
Birla Sun Life Floating Rate Fund - LTP - Growth CRISIL Liquid Fund Index
Investment Performance - Long Term Plan Rating Profile - Long Term Plan
Past performance may or may not be sustained in future. Returns are in % and simple annualized for period less than 1 year & CAGR for period 1 year or more.
% R
etur
ns
Birla Sun Life Floating Rate Fund - STP - Growth CRISIL Liquid Fund Index
Investment Performance - Short Term Plan Rating Profile - Short Term Plan
Issuer % to Net RatingAssets
Issuer % to Net RatingAssets
Money Market Instruments 84.22UCO Bank 14.41 P1+
ICICI Bank Ltd. 14.35 A1+
Federal Bank Ltd. 13.19 P1+
Reliance Capital Ltd. 12.29 A1+
ING Vysya Bank Ltd. 11.69 P1+
State Bank of Hyderabad 11.61 A1+
Syndicate Bank 2.63 PR1+
ONGC Videsh Ltd. 1.99 P1+(SO)
Standard Chartered Bank 1.93 P1+
Export-Import Bank of India 0.14 A1+
Corporate Debt 15.43Tata Capital Ltd.** 13.52 AA+
HDFC Ltd.** 1.91 AAA
Cash & Current Assets 0.36
Total Net Assets 100.00
Portfolio & Asset Allocation - Long Term Plan Portfolio & Asset Allocation - Short Term Plan
### Not Available for Birla Sun Life Floating Rate Fund - Short Term Plan
#iiiValue Research Ratingii
Birla Sun Life Floating Rate Fund - Long Term Plan Retail Debt: Floating Rate Long Term (10 Schemes), 18 months & 3 years ended 31-Aug-09
(Past performance is no guarantee of future results.) for ranking methodology please refer page 50
CRISIL~CPR 2^^Birla Sun Life Floating Rate Fund - Long Term Plan
Ultra Short Term Debt Scheme ( 31 Schemes), 1 Yr ended 30-Jun-09
Note:Standard Deviation is calculated on annualised basis using 1 year history of monthly returns, source: MFI Explorer
Money Market Instruments 80.94
ICICI Bank Ltd. 27.22 A1+
IDBI Bank Ltd. 21.31 P1+
Union Bank of India 18.17 P1+
Canara Bank 7.98 A1+
IDFC Ltd. 4.45 A1+
State Bank of Patiala 1.81 A1+
Floating Rate Instruments 3.64
ICICI Bank Ltd. 3.64 AAA
Cash & Current Assets 15.42
Total Net Assets 100.00
15.48%
84.58%
Cash & Current Assets
AAA
** Represents thinly traded/ non traded securities and illiquid securities. Total Percentage of thinly/non traded securities is 15.43 %.
0.36%
13.52%
86.13%
Cash & Current Assets
AA
AAA
8.40 8.27
7.166.836.79
7.10
6.275.86
0
1
2
3
4
5
6
7
8
9
1 Year 3 Years 5 Years Since Inception
4.68
2.36
3.63
6.42
2.88
1.35
1.97
5.86
0
1
2
3
4
5
6
7
15 Days 1 Month 3 Months Since Inception
43
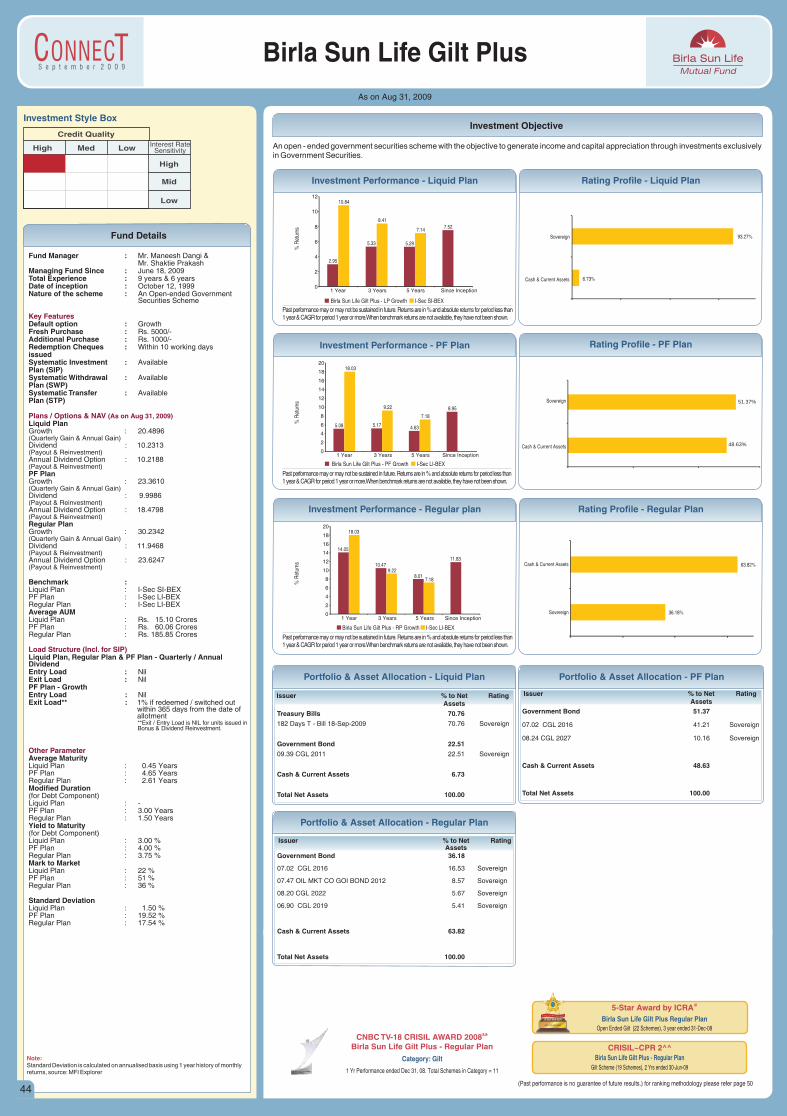
S e p t e m b e r 2 0 0 9
Investment Objective
As on Aug 31, 2009
An open - ended government securities scheme with the objective to generate income and capital appreciation through investments exclusivelyin Government Securities.
Birla Sun Life Gilt Plus
Investment Style Box
Low Interest RateSensitivity
High
Mid
Low
Credit Quality
High Med
Fund Manager :Mr. Shaktie Prakash
Managing Fund Since : June 18, 2009Total Experience : 9 years & 6 yearsDate of inception : October 12, 1999Nature of the scheme : An Open-ended Government
Securities Scheme
Default option : GrowthFresh Purchase : Rs. 5000/-Additional Purchase : Rs. 1000/-Redemption Cheques : Within 10 working days issuedSystematic Investment : Available Plan (SIP)Systematic Withdrawal : Available Plan (SWP)Systematic Transfer : AvailablePlan (STP)
Liquid PlanGrowth : 20.4896(Quarterly Gain & Annual Gain)Dividend : 10.2313(Payout & Reinvestment)Annual Dividend Option : 10.2188(Payout & Reinvestment)PF PlanGrowth : 23.3610(Quarterly Gain & Annual Gain)Dividend : 9.9986(Payout & Reinvestment)Annual Dividend Option : 18.4798(Payout & Reinvestment)Regular PlanGrowth : 30.2342(Quarterly Gain & Annual Gain)Dividend : 11.9468(Payout & Reinvestment)Annual Dividend Option : 23.6247(Payout & Reinvestment)
Benchmark :Liquid Plan : I-Sec SI-BEXPF Plan : I-Sec LI-BEXRegular Plan : I-Sec LI-BEXAverage AUMLiquid Plan : Rs. 15.10 CroresPF Plan : Rs. 60.06 CroresRegular Plan : Rs. 185.85 Crores
Liquid Plan, Regular Plan & PF Plan - Quarterly / Annual DividendEntry Load : NilExit Load : NilPF Plan - GrowthEntry Load : NilExit Load** : 1% if redeemed / switched out
within 365 days from the date of allotment**Exit / Entry Load is NIL for units issued in Bonus & Dividend Reinvestment.
Average Maturity Liquid Plan : 0.45 YearsPF Plan : 4.65 YearsRegular Plan : 2.61 YearsModified Duration (for Debt Component)Liquid Plan : -PF Plan : 3.00 YearsRegular Plan : 1.50 YearsYield to Maturity (for Debt Component)Liquid Plan : 3.00 %PF Plan : 4.00 %Regular Plan : 3.75 %Mark to MarketLiquid Plan : 22 %PF Plan : 51 % Regular Plan : 36 % Standard Deviation Liquid Plan : 1.50 %PF Plan : 19.52 % Regular Plan : 17.54 %
Mr. Maneesh Dangi &
Key Features
Plans / Options & NAV
Load Structure (Incl. for SIP)
Other Parameter
(As on Aug 31, 2009)
Note:Standard Deviation is calculated on annualised basis using 1 year history of monthly returns, source: MFI Explorer
Past performance may or may not be sustained in future. Returns are in % and absolute returns for period less than 1 year & CAGR for period 1 year or more.When benchmark returns are not available, they have not been shown.
Investment Performance - Liquid Plan Rating Profile - Liquid Plan
Past performance may or may not be sustained in future. Returns are in % and absolute returns for period less than 1 year & CAGR for period 1 year or more.When benchmark returns are not available, they have not been shown.
Investment Performance - PF Plan Rating Profile - PF Plan
Past performance may or may not be sustained in future. Returns are in % and absolute returns for period less than 1 year & CAGR for period 1 year or more.When benchmark returns are not available, they have not been shown.
Investment Performance - Regular plan Rating Profile - Regular Plan
Birla Sun Life Gilt Plus - LP Growth I-Sec SI-BEX
Birla Sun Life Gilt Plus - PF Growth I-Sec LI-BEX
Birla Sun Life Gilt Plus - RP Growth I-Sec LI-BEX
% R
etur
ns%
Ret
urns
% R
etur
ns
Fund Details
Issuer % to Net RatingAssets
Government Bond 51.37
07.02 CGL 2016 41.21 Sovereign
08.24 CGL 2027 10.16 Sovereign
Cash & Current Assets 48.63
Total Net Assets 100.00
Issuer % to Net RatingAssets
Treasury Bills 70.76
182 Days T - Bill 18-Sep-2009 70.76 Sovereign
Government Bond 22.51
09.39 CGL 2011 22.51 Sovereign
Cash & Current Assets 6.73
Total Net Assets 100.00
Portfolio & Asset Allocation - Liquid Plan Portfolio & Asset Allocation - PF Plan
Issuer % to Net RatingAssets
Government Bond 36.18
07.02 CGL 2016 16.53 Sovereign
07.47 OIL MKT CO GOI BOND 2012 8.57 Sovereign
08.20 CGL 2022 5.67 Sovereign
06.90 CGL 2019 5.41 Sovereign
Cash & Current Assets 63.82
Total Net Assets 100.00
Portfolio & Asset Allocation - Regular Plan
5-Star Award by @ICRABirla Sun Life Gilt Plus Regular Plan
Open Ended Gilt (22 Schemes), 3 year ended 31-Dec-08
CRISIL~CPR 2^^Birla Sun Life Gilt Plus - Regular Plan
Gilt Scheme (19 Schemes), 2 Yrs ended 30-Jun-09
(Past performance is no guarantee of future results.) for ranking methodology please refer page 50
&&CNBC TV-18 CRISIL AWARD 2008Birla Sun Life Gilt Plus - Regular Plan
1 Yr Performance ended Dec 31, 08. Total Schemes in Category = 11
Category: Gilt
6.73%
93.27%
Cash & Current Assets
Sovereign
48.63%
51.37%
Cash & Current Assets
Sovereign
36.18%
63.82%
Sovereign
Cash & Current Assets
14.05
10.47
8.01
11.83
18.03
9.22
7.18
0
2
4
6
8
10
12
14
16
18
20
1 Year 3 Years 5 Years Since Inception
5.08 5.17 4.63
8.95
18.03
9.22
7.18
0
2
4
6
8
10
12
14
16
18
20
1 Year 3 Years 5 Years Since Inception
2.95
5.33 5.29
7.52
10.84
8.41
7.14
0
2
4
6
8
10
12
1 Year 3 Years 5 Years Since Inception
44
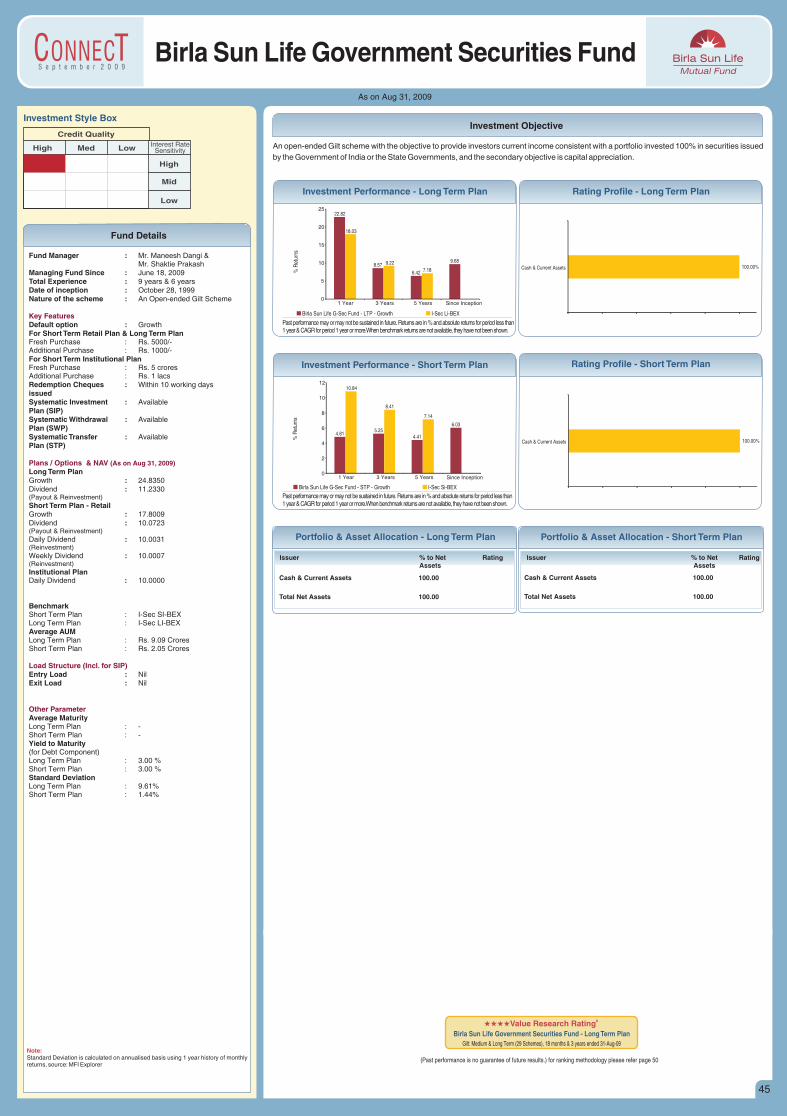
S e p t e m b e r 2 0 0 9
As on Aug 31, 2009
Fund Details
Investment Style Box
Low Interest RateSensitivity
High
Mid
Low
Credit Quality
High Med
Fund Manager :Mr. Shaktie Prakash
Managing Fund Since : June 18, 2009Total Experience : 9 years & 6 yearsDate of inception : October 28, 1999Nature of the scheme : An Open-ended Gilt Scheme
Default option : GrowthFor Short Term Retail Plan & Long Term PlanFresh Purchase : Rs. 5000/-Additional Purchase : Rs. 1000/-For Short Term Institutional PlanFresh Purchase : Rs. 5 croresAdditional Purchase : Rs. 1 lacsRedemption Cheques : Within 10 working days issuedSystematic Investment : Available Plan (SIP)Systematic Withdrawal : Available Plan (SWP)Systematic Transfer : AvailablePlan (STP)
Long Term PlanGrowth : 24.8350Dividend : 11.2330(Payout & Reinvestment)
Short Term Plan - Retail Growth : 17.8009Dividend : 10.0723(Payout & Reinvestment)
Daily Dividend : 10.0031(Reinvestment)
Weekly Dividend : 10.0007(Reinvestment)
Institutional Plan Daily Dividend : 10.0000
BenchmarkShort Term Plan : I-Sec SI-BEXLong Term Plan : I-Sec LI-BEXAverage AUMLong Term Plan : Rs. 9.09 CroresShort Term Plan : Rs. 2.05 Crores
Entry Load : NilExit Load : Nil
Average Maturity Long Term Plan : -Short Term Plan : -Yield to Maturity (for Debt Component)Long Term Plan : 3.00 %Short Term Plan : 3.00 %Standard Deviation Long Term Plan : 9.61%Short Term Plan : 1.44%
Mr. Maneesh Dangi &
Key Features
Plans / Options & NAV
Load Structure (Incl. for SIP)
Other Parameter
(As on Aug 31, 2009)
Note:Standard Deviation is calculated on annualised basis using 1 year history of monthly returns, source: MFI Explorer
An open-ended Gilt scheme with the objective to provide investors current income consistent with a portfolio invested 100% in securities issued
by the Government of India or the State Governments, and the secondary objective is capital appreciation.
Investment Objective
Birla Sun Life Government Securities Fund
Past performance may or may not be sustained in future. Returns are in % and absolute returns for period less than 1 year & CAGR for period 1 year or more.When benchmark returns are not available, they have not been shown.
% R
etur
ns
Birla Sun Life G-Sec Fund - LTP - Growth I-Sec Li-BEX
Investment Performance - Long Term Plan Rating Profile - Long Term Plan
Past performance may or may not be sustained in future. Returns are in % and absolute returns for period less than 1 year & CAGR for period 1 year or more.When benchmark returns are not available, they have not been shown.
Investment Performance - Short Term Plan Rating Profile - Short Term Plan
% R
etur
ns
Birla Sun Life G-Sec Fund - STP - Growth I-Sec Si-BEX
Issuer % to Net RatingAssets
Issuer % to Net RatingAssets
Cash & Current Assets 100.00
Total Net Assets 100.00
Cash & Current Assets 100.00
Total Net Assets 100.00
Portfolio & Asset Allocation - Long Term Plan Portfolio & Asset Allocation - Short Term Plan
100.00%Cash & Current Assets
100.00%Cash & Current Assets
#iiiValue Research Ratingi
Birla Sun Life Government Securities Fund - Long Term Plan Gilt: Medium & Long Term (29 Schemes), 18 months & 3 years ended 31-Aug-09
(Past performance is no guarantee of future results.) for ranking methodology please refer page 50
22.82
8.57
6.42
9.68
18.03
9.22
7.18
0
5
10
15
20
25
1 Year 3 Years 5 Years Since Inception
4.815.25
4.41
6.03
10.84
8.41
7.14
0
2
4
6
8
10
12
1 Year 3 Years 5 Years Since Inception
45
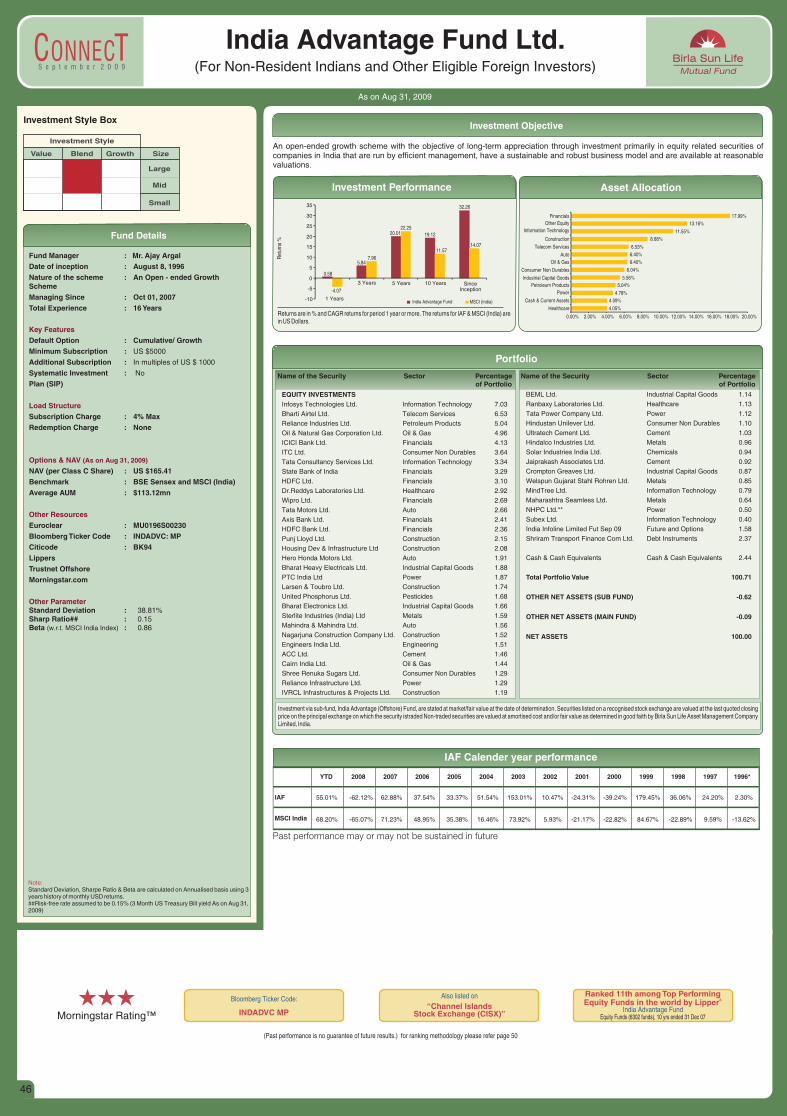
S e p t e m b e r 2 0 0 9
Fund Details
Investment Objective
Note: Standard Deviation, Sharpe Ratio & Beta are calculated on Annualised basis using 3 years history of monthly USD returns.##Risk-free rate assumed to be 0.15% (3 Month US Treasury Bill yield As on Aug 31, 2009)
As on Aug 31, 2009
India Advantage Fund Ltd.(For Non-Resident Indians and Other Eligible Foreign Investors)
Investment Style Box
Value Blend Growth Size
Large
Mid
Small
Investment StyleAn open-ended growth scheme with the objective of long-term appreciation through investment primarily in equity related securities of companies in India that are run by efficient management, have a sustainable and robust business model and are available at reasonable valuations.
Fund Manager : Mr. Ajay Argal
Date of inception : August 8, 1996
Nature of the scheme : An Open - ended Growth Scheme
Managing Since : Oct 01, 2007Total Experience : 16 Years
Default Option : Cumulative/ Growth
Minimum Subscription : US $5000
Additional Subscription : In multiples of US $ 1000
Systematic Investment : No
Plan (SIP)
Subscription Charge : 4% MaxRedemption Charge : None
NAV (per Class C Share) : US $165.41Benchmark : BSE Sensex and MSCI (India)
Average AUM : $113.12mn
Euroclear : MU0196S00230Bloomberg Ticker Code : INDADVC: MP
Citicode : BK94
Lippers
Trustnet Offshore
Morningstar.com
Standard Deviation : 38.81%Sharp Ratio## : 0.15Beta (w.r.t. MSCI India Index) : 0.86
Key Features
Load Structure
Options & NAV (As on Aug 31, 2009)
Other Resources
Other Parameter
Morningstar Rating™
iii Ranked 11th among Top Performing &Equity Funds in the world by Lipper
India Advantage FundEquity Funds (6302 funds), 10 yrs ended 31 Dec 07
“Channel Islands Stock Exchange (CISX)”
Also listed on
INDADVC MP
Bloomberg Ticker Code:
(Past performance is no guarantee of future results.) for ranking methodology please refer page 50
Returns are in % and CAGR returns for period 1 year or more. The returns for IAF & MSCI (India) are in US Dollars.
Investment Performance Asset Allocation
India Advantage Fund MSCI (India)
Ret
urns
%
Portfolio
EQUITY INVESTMENTSInfosys Technologies Ltd. Information Technology 7.03
Bharti Airtel Ltd. Telecom Services 6.53
Reliance Industries Ltd. Petroleum Products 5.04
Oil & Natural Gas Corporation Ltd. Oil & Gas 4.96
ICICI Bank Ltd. Financials 4.13
ITC Ltd. Consumer Non Durables 3.64
Tata Consultancy Services Ltd. Information Technology 3.34
State Bank of India Financials 3.29
HDFC Ltd. Financials 3.10
Dr.Reddys Laboratories Ltd. Healthcare 2.92
Wipro Ltd. Financials 2.69
Tata Motors Ltd. Auto 2.66
Axis Bank Ltd. Financials 2.41
HDFC Bank Ltd. Financials 2.36
Punj Lloyd Ltd. Construction 2.15
Housing Dev & Infrastructure Ltd Construction 2.08
Hero Honda Motors Ltd. Auto 1.91
Bharat Heavy Electricals Ltd. Industrial Capital Goods 1.88
PTC India Ltd Power 1.87
Larsen & Toubro Ltd. Construction 1.74
United Phosphorus Ltd. Pesticides 1.68
Bharat Electronics Ltd. Industrial Capital Goods 1.66
Sterlite Industries (India) Ltd Metals 1.59
Mahindra & Mahindra Ltd. Auto 1.56
Nagarjuna Construction Company Ltd. Construction 1.52
Engineers India Ltd. Engineering 1.51
ACC Ltd. Cement 1.46
Cairn India Ltd. Oil & Gas 1.44
Shree Renuka Sugars Ltd. Consumer Non Durables 1.29
Reliance Infrastructure Ltd. Power 1.29
IVRCL Infrastructures & Projects Ltd. Construction 1.19
BEML Ltd. Industrial Capital Goods 1.14
Ranbaxy Laboratories Ltd. Healthcare 1.13
Tata Power Company Ltd. Power 1.12
Hindustan Unilever Ltd. Consumer Non Durables 1.10
Ultratech Cement Ltd. Cement 1.03
Hindalco Industries Ltd. Metals 0.96
Solar Industries India Ltd. Chemicals 0.94
Jaiprakash Associates Ltd. Cement 0.92
Crompton Greaves Ltd. Industrial Capital Goods 0.87
Welspun Gujarat Stahl Rohren Ltd. Metals 0.85
MindTree Ltd. Information Technology 0.79
Maharashtra Seamless Ltd. Metals 0.64
NHPC Ltd.** Power 0.50
Subex Ltd. Information Technology 0.40
India Infoline Limited Fut Sep 09 Future and Options 1.58
Shriram Transport Finance Com Ltd. Debt Instruments 2.37
Cash & Cash Equivalents Cash & Cash Equivalents 2.44
Total Portfolio Value 100.71
OTHER NET ASSETS (SUB FUND) -0.62
OTHER NET ASSETS (MAIN FUND) -0.09
NET ASSETS 100.00
Investment via sub-fund, India Advantage (Offshore) Fund, are stated at market/fair value at the date of determination. Securities listed on a recognised stock exchange are valued at the last quoted closing price on the principal exchange on which the security istraded Non-traded securities are valued at amortised cost and/or fair value as determined in good faith by Birla Sun Life Asset Management Company Limited, India.
Name of the Security Sector Percentageof Portfolio
Name of the Security Sector Percentageof Portfolio
YTD 2008 2007 2006 2005 2004 2003 2002 2001 2000 1999 1998 1997 1996*
IAF
MSCI India
IAF Calender year performance
55.01% -62.12% 62.88% 37.54% 33.37% 51.54% 153.01% 10.47% -24.31% -39.24% 179.45% 36.06% 24.20% 2.30%
68.20% -65.07% 71.23% 48.95% 35.38% 16.46% 73.92% 5.93% -21.17% -22.82% 84.67% -22.89% 9.59% -13.62%
Past performance may or may not be sustained in future
4.05%
4.09%
4.78%
5.04%
5.56%
6.04%
6.40%
6.40%
6.53%
8.68%
11.55%
13.16%
17.99%
0.00% 2.00% 4.00% 6.00% 8.00% 10.00% 12.00% 14.00% 16.00% 18.00% 20.00%
Healthcare
Cash & Current Assets
Power
Petroleum Products
Industrial Capital Goods
Consumer Non Durables
Oil & Gas
Auto
Telecom Services
Construction
Information Technology
Other Equity
Financials
0.58
5.84
20.01 19.12
32.26
-4.07
7.96
22.25
11.5714.07
-10
-5
0
5
10
15
20
25
30
35
1 Years
3 Years 5 Years 10 Years SinceInception
46
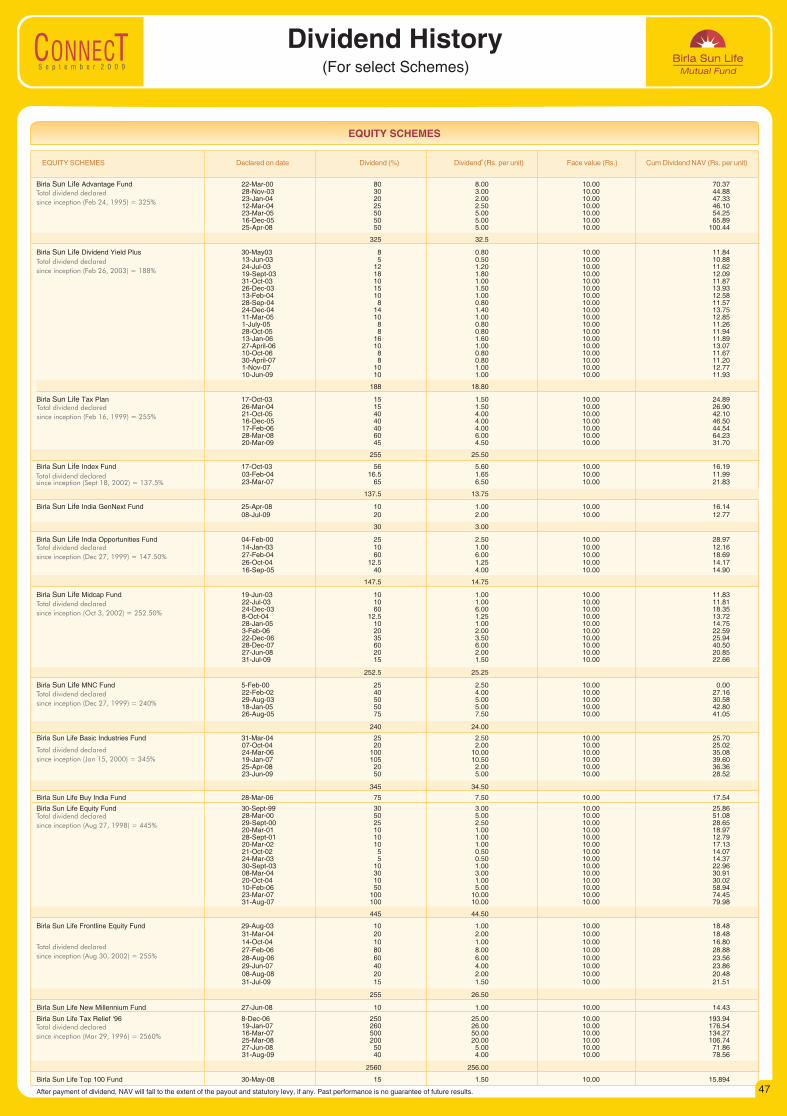
S e p t e m b e r 2 0 0 9
Dividend History(For select Schemes)
EQUITY SCHEMES
After payment of dividend, NAV will fall to the extent of the payout and statutory levy, if any. Past performance is no guarantee of future results.
Total dividend declared
since inception (Feb 24, 1995) = 325%
Total dividend declared
since inception (Feb 16, 1999) = 255%
Total dividend declared
since inception (Aug 27, 1998) = 445%
Total dividend declared
since inception (Dec 27, 1999) = 147.50%
Total dividend declared
since inception (Dec 27, 1999) = 240%
Total dividend declared
since inception (Oct 3, 2002) = 252.50%
Total dividend declared
since inception (Feb 26, 2003) = 188%
Total dividend declared since inception (Sept 18, 2002) = 137.5%
Total dividend declared
since inception (Aug 30, 2002) = 255%
Total dividend declared
since inception (Jan 15, 2000) = 345%
Total dividend declared
since inception (Mar 29, 1996) = 2560%
# EQUITY SCHEMES Declared Dividend Dividend Face value Cum Dividend NAV on date (%) (Rs. per unit) (Rs.) (Rs. per unit)
47
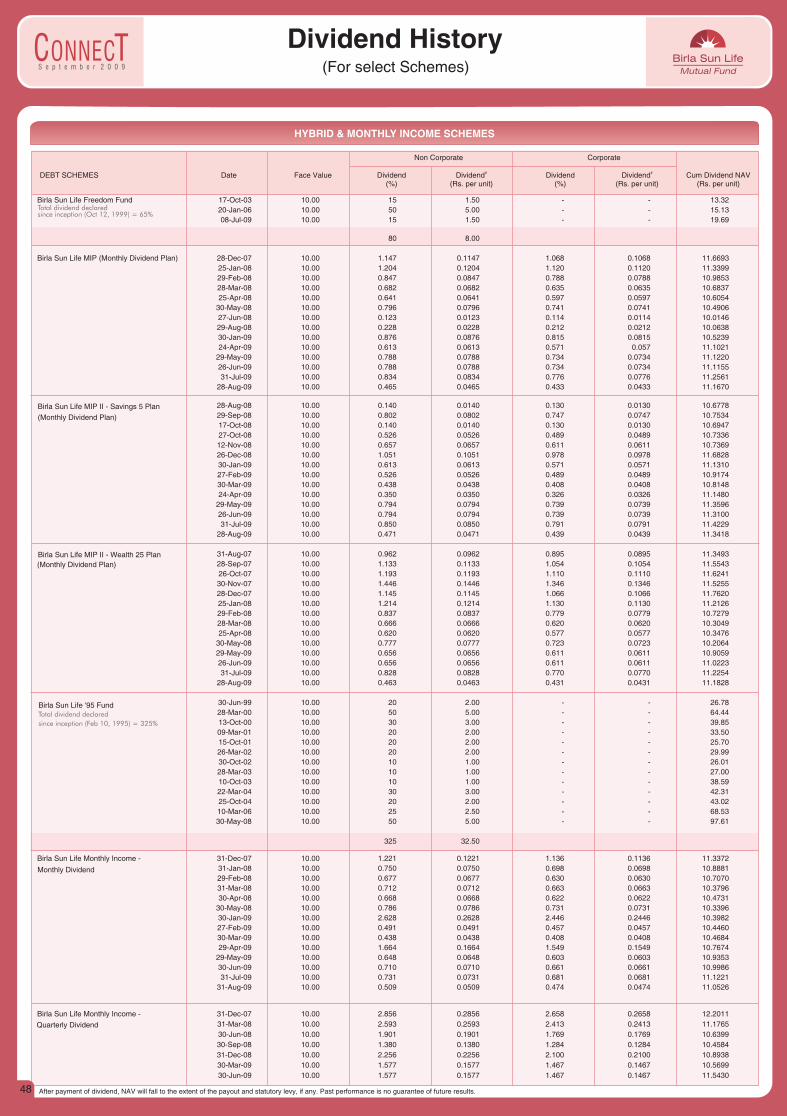
S e p t e m b e r 2 0 0 9
Dividend History(For select Schemes)
HYBRID & MONTHLY INCOME SCHEMES
# DEBT SCHEMES Date Face Value Dividend Dividend Cum Dividend NAV (%) (Rs. per unit) (%) (Rs. per unit) (Rs. per unit)
#Dividend Dividend
Non Corporate Corporate
Birla Sun Life Freedom Fund 17-Oct-03 10.00 15 1.50 - - 13.32
20-Jan-06 10.00 50 5.00 - - 15.13
08-Jul-09 10.00 15 1.50 - - 19.69
80 8.00
Birla Sun Life MIP (Monthly Dividend Plan) 28-Dec-07 10.00 1.147 0.1147 1.068 0.1068 11.6693
25-Jan-08 10.00 1.204 0.1204 1.120 0.1120 11.3399
29-Feb-08 10.00 0.847 0.0847 0.788 0.0788 10.9853
28-Mar-08 10.00 0.682 0.0682 0.635 0.0635 10.6837
25-Apr-08 10.00 0.641 0.0641 0.597 0.0597 10.6054
30-May-08 10.00 0.796 0.0796 0.741 0.0741 10.4906
27-Jun-08 10.00 0.123 0.0123 0.114 0.0114 10.0146
29-Aug-08 10.00 0.228 0.0228 0.212 0.0212 10.0638
30-Jan-09 10.00 0.876 0.0876 0.815 0.0815 10.5239
24-Apr-09 10.00 0.613 0.0613 0.571 0.057 11.1021
29-May-09 10.00 0.788 0.0788 0.734 0.0734 11.1220
26-Jun-09 10.00 0.788 0.0788 0.734 0.0734 11.1155
31-Jul-09 10.00 0.834 0.0834 0.776 0.0776 11.2561
28-Aug-09 10.00 0.465 0.0465 0.433 0.0433 11.1670
28-Aug-08 10.00 0.140 0.0140 0.130 0.0130 10.6778
29-Sep-08 10.00 0.802 0.0802 0.747 0.0747 10.7534
17-Oct-08 10.00 0.140 0.0140 0.130 0.0130 10.6947
27-Oct-08 10.00 0.526 0.0526 0.489 0.0489 10.7336
12-Nov-08 10.00 0.657 0.0657 0.611 0.0611 10.7369
26-Dec-08 10.00 1.051 0.1051 0.978 0.0978 11.6828
30-Jan-09 10.00 0.613 0.0613 0.571 0.0571 11.1310
27-Feb-09 10.00 0.526 0.0526 0.489 0.0489 10.9174
30-Mar-09 10.00 0.438 0.0438 0.408 0.0408 10.8148
24-Apr-09 10.00 0.350 0.0350 0.326 0.0326 11.1480
29-May-09 10.00 0.794 0.0794 0.739 0.0739 11.3596
26-Jun-09 10.00 0.794 0.0794 0.739 0.0739 11.3100
31-Jul-09 10.00 0.850 0.0850 0.791 0.0791 11.4229
28-Aug-09 10.00 0.471 0.0471 0.439 0.0439 11.3418
31-Aug-07 10.00 0.962 0.0962 0.895 0.0895 11.3493
28-Sep-07 10.00 1.133 0.1133 1.054 0.1054 11.5543
26-Oct-07 10.00 1.193 0.1193 1.110 0.1110 11.6241
30-Nov-07 10.00 1.446 0.1446 1.346 0.1346 11.5255
28-Dec-07 10.00 1.145 0.1145 1.066 0.1066 11.7620
25-Jan-08 10.00 1.214 0.1214 1.130 0.1130 11.2126
29-Feb-08 10.00 0.837 0.0837 0.779 0.0779 10.7279
28-Mar-08 10.00 0.666 0.0666 0.620 0.0620 10.3049
25-Apr-08 10.00 0.620 0.0620 0.577 0.0577 10.3476
30-May-08 10.00 0.777 0.0777 0.723 0.0723 10.2064
29-May-09 10.00 0.656 0.0656 0.611 0.0611 10.9059
26-Jun-09 10.00 0.656 0.0656 0.611 0.0611 11.0223
31-Jul-09 10.00 0.828 0.0828 0.770 0.0770 11.2254
28-Aug-09 10.00 0.463 0.0463 0.431 0.0431 11.1828
30-Jun-99 10.00 20 2.00 - - 26.78
28-Mar-00 10.00 50 5.00 - - 64.44
13-Oct-00 10.00 30 3.00 - - 39.85
09-Mar-01 10.00 20 2.00 - - 33.50
15-Oct-01 10.00 20 2.00 - - 25.70
26-Mar-02 10.00 20 2.00 - - 29.99
30-Oct-02 10.00 10 1.00 - - 26.01
28-Mar-03 10.00 10 1.00 - - 27.00
10-Oct-03 10.00 10 1.00 - - 38.59
22-Mar-04 10.00 30 3.00 - - 42.31
25-Oct-04 10.00 20 2.00 - - 43.02
10-Mar-06 10.00 25 2.50 - - 68.53
30-May-08 10.00 50 5.00 - - 97.61
325 32.50
Birla Sun Life Monthly Income - 31-Dec-07 10.00 1.221 0.1221 1.136 0.1136 11.3372
31-Jan-08 10.00 0.750 0.0750 0.698 0.0698 10.8881
29-Feb-08 10.00 0.677 0.0677 0.630 0.0630 10.7070
31-Mar-08 10.00 0.712 0.0712 0.663 0.0663 10.3796
30-Apr-08 10.00 0.668 0.0668 0.622 0.0622 10.4731
30-May-08 10.00 0.786 0.0786 0.731 0.0731 10.3396
30-Jan-09 10.00 2.628 0.2628 2.446 0.2446 10.3982
27-Feb-09 10.00 0.491 0.0491 0.457 0.0457 10.4460
30-Mar-09 10.00 0.438 0.0438 0.408 0.0408 10.4684
29-Apr-09 10.00 1.664 0.1664 1.549 0.1549 10.7674
29-May-09 10.00 0.648 0.0648 0.603 0.0603 10.9353
30-Jun-09 10.00 0.710 0.0710 0.661 0.0661 10.9986
31-Jul-09 10.00 0.731 0.0731 0.681 0.0681 11.1221
31-Aug-09 10.00 0.509 0.0509 0.474 0.0474 11.0526
Birla Sun Life Monthly Income - 31-Dec-07 10.00 2.856 0.2856 2.658 0.2658 12.2011
31-Mar-08 10.00 2.593 0.2593 2.413 0.2413 11.1765
30-Jun-08 10.00 1.901 0.1901 1.769 0.1769 10.6399
30-Sep-08 10.00 1.380 0.1380 1.284 0.1284 10.4584
31-Dec-08 10.00 2.256 0.2256 2.100 0.2100 10.8938
30-Mar-09 10.00 1.577 0.1577 1.467 0.1467 10.5699
30-Jun-09 10.00 1.577 0.1577 1.467 0.1467 11.5430
Total dividend declared
since inception (Feb 10, 1995) = 325%
Total dividend declared since inception (Oct 12, 1999) = 65%
Monthly Dividend
(Monthly Dividend Plan)
Quarterly Dividend
After payment of dividend, NAV will fall to the extent of the payout and statutory levy, if any. Past performance is no guarantee of future results.
Birla Sun Life MIP II - Savings 5 Plan
Birla Sun Life MIP II - Wealth 25 Plan
Birla Sun Life '95 Fund
(Monthly Dividend Plan)
48
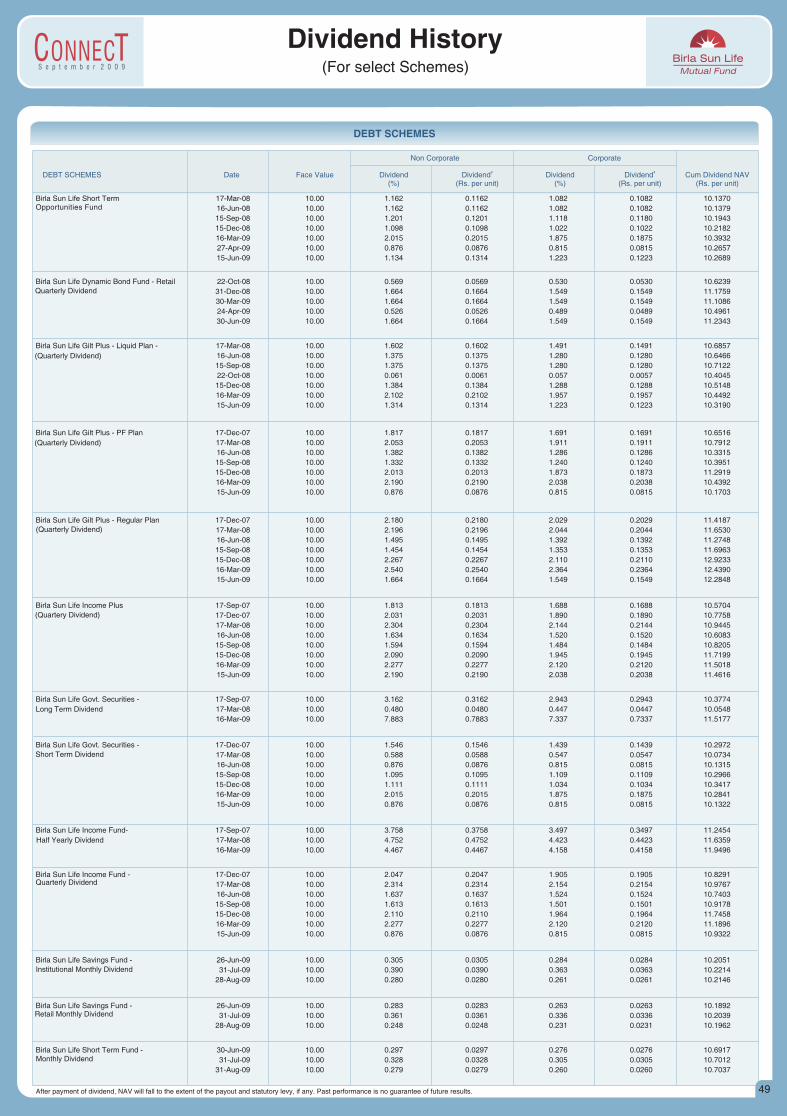
S e p t e m b e r 2 0 0 9
Dividend History(For select Schemes)
DEBT SCHEMES
Birla Sun Life Short Term 17-Mar-08 10.00 1.162 0.1162 1.082 0.1082 10.1370
16-Jun-08 10.00 1.162 0.1162 1.082 0.1082 10.1379
15-Sep-08 10.00 1.201 0.1201 1.118 0.1180 10.1943
15-Dec-08 10.00 1.098 0.1098 1.022 0.1022 10.2182
16-Mar-09 10.00 2.015 0.2015 1.875 0.1875 10.3932
27-Apr-09 10.00 0.876 0.0876 0.815 0.0815 10.2657
15-Jun-09 10.00 1.134 0.1314 1.223 0.1223 10.2689
Birla Sun Life Dynamic Bond Fund - Retail 22-Oct-08 10.00 0.569 0.0569 0.530 0.0530 10.6239
31-Dec-08 10.00 1.664 0.1664 1.549 0.1549 11.1759
30-Mar-09 10.00 1.664 0.1664 1.549 0.1549 11.1086
24-Apr-09 10.00 0.526 0.0526 0.489 0.0489 10.4961
30-Jun-09 10.00 1.664 0.1664 1.549 0.1549 11.2343
Birla Sun Life Gilt Plus - Liquid Plan - 17-Mar-08 10.00 1.602 0.1602 1.491 0.1491 10.6857
16-Jun-08 10.00 1.375 0.1375 1.280 0.1280 10.6466
15-Sep-08 10.00 1.375 0.1375 1.280 0.1280 10.7122
22-Oct-08 10.00 0.061 0.0061 0.057 0.0057 10.4045
15-Dec-08 10.00 1.384 0.1384 1.288 0.1288 10.5148
16-Mar-09 10.00 2.102 0.2102 1.957 0.1957 10.4492
15-Jun-09 10.00 1.314 0.1314 1.223 0.1223 10.3190
Birla Sun Life Gilt Plus - PF Plan 17-Dec-07 10.00 1.817 0.1817 1.691 0.1691 10.6516
17-Mar-08 10.00 2.053 0.2053 1.911 0.1911 10.7912
16-Jun-08 10.00 1.382 0.1382 1.286 0.1286 10.3315
15-Sep-08 10.00 1.332 0.1332 1.240 0.1240 10.3951
15-Dec-08 10.00 2.013 0.2013 1.873 0.1873 11.2919
16-Mar-09 10.00 2.190 0.2190 2.038 0.2038 10.4392
15-Jun-09 10.00 0.876 0.0876 0.815 0.0815 10.1703
Birla Sun Life Gilt Plus - Regular Plan 17-Dec-07 10.00 2.180 0.2180 2.029 0.2029 11.4187
17-Mar-08 10.00 2.196 0.2196 2.044 0.2044 11.6530
16-Jun-08 10.00 1.495 0.1495 1.392 0.1392 11.2748
15-Sep-08 10.00 1.454 0.1454 1.353 0.1353 11.6963
15-Dec-08 10.00 2.267 0.2267 2.110 0.2110 12.9233
16-Mar-09 10.00 2.540 0.2540 2.364 0.2364 12.4390
15-Jun-09 10.00 1.664 0.1664 1.549 0.1549 12.2848
Birla Sun Life Income Plus 17-Sep-07 10.00 1.813 0.1813 1.688 0.1688 10.5704
17-Dec-07 10.00 2.031 0.2031 1.890 0.1890 10.7758
17-Mar-08 10.00 2.304 0.2304 2.144 0.2144 10.9445
16-Jun-08 10.00 1.634 0.1634 1.520 0.1520 10.6083
15-Sep-08 10.00 1.594 0.1594 1.484 0.1484 10.8205
15-Dec-08 10.00 2.090 0.2090 1.945 0.1945 11.7199
16-Mar-09 10.00 2.277 0.2277 2.120 0.2120 11.5018
15-Jun-09 10.00 2.190 0.2190 2.038 0.2038 11.4616
Birla Sun Life Govt. Securities - 17-Sep-07 10.00 3.162 0.3162 2.943 0.2943 10.3774
17-Mar-08 10.00 0.480 0.0480 0.447 0.0447 10.0548
16-Mar-09 10.00 7.883 0.7883 7.337 0.7337 11.5177
Birla Sun Life Govt. Securities - 17-Dec-07 10.00 1.546 0.1546 1.439 0.1439 10.2972
17-Mar-08 10.00 0.588 0.0588 0.547 0.0547 10.0734
16-Jun-08 10.00 0.876 0.0876 0.815 0.0815 10.1315
15-Sep-08 10.00 1.095 0.1095 1.109 0.1109 10.2966
15-Dec-08 10.00 1.111 0.1111 1.034 0.1034 10.3417
16-Mar-09 10.00 2.015 0.2015 1.875 0.1875 10.2841
15-Jun-09 10.00 0.876 0.0876 0.815 0.0815 10.1322
Birla Sun Life Income Fund- 17-Sep-07 10.00 3.758 0.3758 3.497 0.3497 11.2454
17-Mar-08 10.00 4.752 0.4752 4.423 0.4423 11.6359
16-Mar-09 10.00 4.467 0.4467 4.158 0.4158 11.9496
Birla Sun Life Income Fund - 17-Dec-07 10.00 2.047 0.2047 1.905 0.1905 10.8291
17-Mar-08 10.00 2.314 0.2314 2.154 0.2154 10.9767
16-Jun-08 10.00 1.637 0.1637 1.524 0.1524 10.7403
15-Sep-08 10.00 1.613 0.1613 1.501 0.1501 10.9178
15-Dec-08 10.00 2.110 0.2110 1.964 0.1964 11.7458
16-Mar-09 10.00 2.277 0.2277 2.120 0.2120 11.1896
15-Jun-09 10.00 0.876 0.0876 0.815 0.0815 10.9322
Birla Sun Life Savings Fund - 26-Jun-09 10.00 0.305 0.0305 0.284 0.0284 10.2051
31-Jul-09 10.00 0.390 0.0390 0.363 0.0363 10.2214
28-Aug-09 10.00 0.280 0.0280 0.261 0.0261 10.2146
Birla Sun Life Savings Fund - 26-Jun-09 10.00 0.283 0.0283 0.263 0.0263 10.1892
31-Jul-09 10.00 0.361 0.0361 0.336 0.0336 10.2039
28-Aug-09 10.00 0.248 0.0248 0.231 0.0231 10.1962
Birla Sun Life Short Term Fund - 30-Jun-09 10.00 0.297 0.0297 0.276 0.0276 10.6917
31-Jul-09 10.00 0.328 0.0328 0.305 0.0305 10.7012
31-Aug-09 10.00 0.279 0.0279 0.260 0.0260 10.7037
Non Corporate Corporate
# DEBT SCHEMES Date Face Value Dividend Dividend Cum Dividend NAV (%) (Rs. per unit) (%) (Rs. per unit) (Rs. per unit)
#Dividend Dividend
Institutional Monthly Dividend
Monthly Dividend
Retail Monthly Dividend
Quarterly Dividend
Quarterly Dividend
(Quarterly Dividend)
(Quarterly Dividend)
Short Term Dividend
Half Yearly Dividend
Opportunities Fund
Long Term Dividend
(Quarterly Dividend)
After payment of dividend, NAV will fall to the extent of the payout and statutory levy, if any. Past performance is no guarantee of future results.
(Quartery Dividend)
49
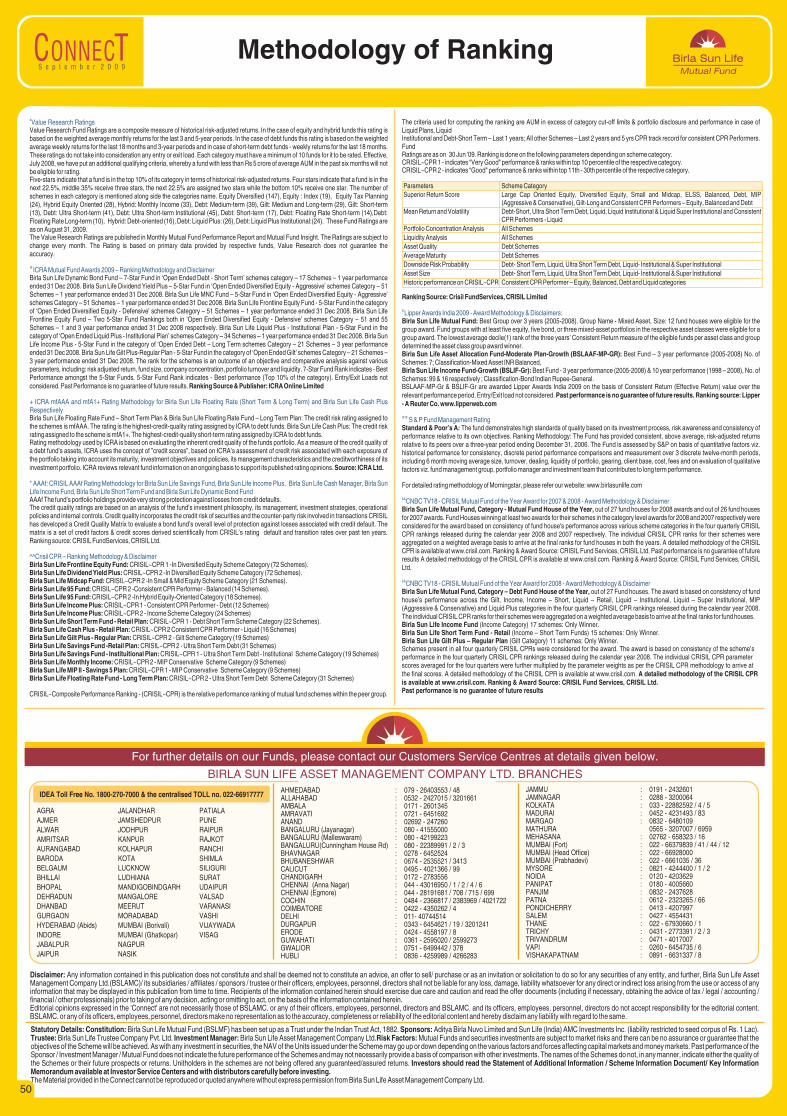
03
S e p t e m b e r 2 0 0 9
Methodology of Ranking
#Value Research Ratings
@ ICRA Mutual Fund Awards 2009 – Ranking Methodology and Disclaimer
+ ICRA mfAAA and mfA1+ Rating Methodology for Birla Sun Life Floating Rate (Short Term & Long Term) and Birla Sun Life Cash Plus Respectively
* AAAf: CRISIL AAAf Rating Methodology for Birla Sun Life Savings Fund, Birla Sun Life Income Plus, Birla Sun Life Cash Manager, Birla Sun Life Income Fund, Birla Sun Life Short Term Fund and Birla Sun Life Dynamic Bond Fund
^^Crisil CPR – Ranking Methodology & Disclaimer
Value Research Fund Ratings are a composite measure of historical risk-adjusted returns. In the case of equity and hybrid funds this rating is based on the weighted average monthly returns for the last 3 and 5-year periods. In the case of debt funds this rating is based on the weighted average weekly returns for the last 18 months and 3-year periods and in case of short-term debt funds - weekly returns for the last 18 months. These ratings do not take into consideration any entry or exit load. Each category must have a minimum of 10 funds for it to be rated. Effective, July 2008, we have put an additional qualifying criteria, whereby a fund with less than Rs 5 crore of average AUM in the past six months will not be eligible for rating.Five-stars indicate that a fund is in the top 10% of its category in terms of historical risk-adjusted returns. Four stars indicate that a fund is in the next 22.5%, middle 35% receive three stars, the next 22.5% are assigned two stars while the bottom 10% receive one star. The number of schemes in each category is mentioned along side the categories name. Equity Diversified (147), Equity : Index (19), Equity Tax Planning (24), Hybrid Equity Oriented (28), Hybrid: Monthly Income (33), Debt: Medium-term (39), Gilt: Medium and Long-term (29), Gilt: Short-term (13), Debt: Ultra Short-term (41), Debt: Ultra Short-term Institutional (45), Debt: Short-term (17), Debt: Floating Rate Short-term (14),Debt: Floating Rate Long-term (10), Hybrid: Debt-oriented (16), Debt: Liquid Plus: (26), Debt: Liquid Plus Institutional:(24). These Fund Ratings are as on August 31, 2009. The Value Research Ratings are published in Monthly Mutual Fund Performance Report and Mutual Fund Insight. The Ratings are subject to change every month. The Rating is based on primary data provided by respective funds, Value Research does not guarantee the accuracy.
Birla Sun Life Dynamic Bond Fund – 7-Star Fund in ‘Open Ended Debt - Short Term’ schemes category – 17 Schemes – 1 year performance ended 31 Dec 2008. Birla Sun Life Dividend Yield Plus – 5-Star Fund in ‘Open Ended Diversified Equity - Aggressive’ schemes Category – 51 Schemes – 1 year performance ended 31 Dec 2008. Birla Sun Life MNC Fund – 5-Star Fund in ‘Open Ended Diversified Equity - Aggressive’ schemes Category – 51 Schemes – 1 year performance ended 31 Dec 2008. Birla Sun Life Frontline Equity Fund - 5-Star Fund in the category of ‘Open Ended Diversified Equity - Defensive’ schemes Category – 51 Schemes – 1 year performance ended 31 Dec 2008. Birla Sun Life Frontline Equity Fund – Two 5-Star Fund Rankings both in ‘Open Ended Diversified Equity - Defensive’ schemes Category – 51 and 55 Schemes – 1 and 3 year performance ended 31 Dec 2008 respectively. Birla Sun Life Liquid Plus - Institutional Plan - 5-Star Fund in the category of ‘Open Ended Liquid Plus - Institutional Plan’ schemes Category – 34 Schemes – 1 year performance ended 31 Dec 2008. Birla Sun Life Income Plus - 5-Star Fund in the category of ‘Open Ended Debt – Long Term schemes Category – 21 Schemes – 3 year performance ended 31 Dec 2008. Birla Sun Life Gilt Plus-Regular Plan - 5-Star Fund in the category of ‘Open Ended Gilt’ schemes Category – 21 Schemes – 3 year performance ended 31 Dec 2008. The rank for the schemes is an outcome of an objective and comparative analysis against various parameters, including: risk adjusted return, fund size, company concentration, portfolio turnover and liquidity. 7-Star Fund Rank indicates - Best Performance amongst the 5-Star Funds. 5-Star Fund Rank indicates - Best performance (Top 10% of the category). Entry/Exit Loads not considered. Past Performance is no guarantee of future results. Ranking Source & Publisher: ICRA Online Limited
Birla Sun Life Floating Rate Fund – Short Term Plan & Birla Sun Life Floating Rate Fund – Long Term Plan: The credit risk rating assigned to the schemes is mfAAA. The rating is the highest-credit-quality rating assigned by ICRA to debt funds. Birla Sun Life Cash Plus: The credit risk rating assigned to the scheme is mfA1+. The highest-credit-quality short-term rating assigned by ICRA to debt funds.Rating methodology used by ICRA is based on evaluating the inherent credit quality of the funds portfolio. As a measure of the credit quality of a debt fund’s assets, ICRA uses the concept of ”credit scores”, based on ICRA’s assessment of credit risk associated with each exposure of the portfolio taking into account its maturity, investment objectives and policies, its management characteristics and the creditworthiness of its investment portfolio. ICRA reviews relevant fund information on an ongoing basis to support its published rating opinions. Source: ICRA Ltd.
AAAf The fund’s portfolio holdings provide very strong protection against losses from credit defaults.The credit quality ratings are based on an analysis of the fund’s investment philosophy, its management, investment strategies, operational policies and internal controls. Credit quality incorporates the credit risk of securities and the counter-party risk involved in transactions CRISIL has developed a Credit Quality Matrix to evaluate a bond fund’s overall level of protection against losses associated with credit default. The matrix is a set of credit factors & credit scores derived scientifically from CRISIL’s rating default and transition rates over past ten years. Ranking source: CRISIL FundServices, CRISIL Ltd.
Birla Sun Life Frontline Equity Fund: CRISIL~CPR 1 -In Diversified Equity Scheme Category (72 Schemes). Birla Sun Life Dividend Yield Plus: CRISIL~CPR 2 -In Diversified Equity Scheme Category (72 Schemes). Birla Sun Life Midcap Fund: CRISIL~CPR 2 -In Small & Mid Equity Scheme Category (21 Schemes). Birla Sun Life 95 Fund: CRISIL~CPR 2 -Consistent CPR Performer - Balanced (14 Schemes). Birla Sun Life 95 Fund: CRISIL~CPR 2 -In Hybrid Equity-Oriented Category (18 Schemes). Birla Sun Life Income Plus: CRISIL~CPR 1 - Consistent CPR Performer - Debt (12 Schemes)Birla Sun Life Income Plus: CRISIL~CPR 2 - Income Scheme Category (24 Schemes)Birla Sun Life Short Term Fund - Retail Plan: CRISIL~CPR 1 - Debt Short Term Scheme Category (22 Schemes).Birla Sun Life Cash Plus - Retail Plan: CRISIL~CPR 2 Consistent CPR Performer - Liquid (16 Schemes)Birla Sun Life Gilt Plus - Regular Plan: CRISIL~CPR 2 - Gilt Scheme Category (19 Schemes)Birla Sun Life Savings Fund -Retail Plan: CRISIL~CPR 2 - Ultra Short Term Debt (31 Schemes)Birla Sun Life Savings Fund - Instituitional Plan: CRISIL~CPR 1 - Ultra Short Term Debt - Institutional Scheme Category (19 Schemes)Birla Sun Life Monthly Income: CRISIL~CPR 2 - MIP Conservative Scheme Category (9 Schemes)Birla Sun Life MIP II - Savings 5 Plan: CRISIL~CPR 1 - MIP Conservative Scheme Category (9 Schemes)Birla Sun Life Floating Rate Fund - Long Term Plan: CRISIL~CPR 2 - Ultra Short Term Debt Scheme Category (31 Schemes)
CRISIL~Composite Performance Ranking - (CRISIL~CPR) is the relative performance ranking of mutual fund schemes within the peer group.
The criteria used for computing the ranking are AUM in excess of category cut-off limits & portfolio disclosure and performance in case of Liquid Plans, Liquid Institutional and Debt-Short Term – Last 1 years; All other Schemes – Last 2 years and 5 yrs CPR track record for consistent CPR Performers. Fund Ratings are as on 30 Jun ‘09. Ranking is done on the following parameters depending on scheme category.CRISIL~CPR 1 - indicates “Very Good" performance & ranks within top 10 percentile of the respective category.CRISIL~CPR 2 - indicates “Good" performance & ranks within top 11th - 30th percentile of the respective category.
Ranking Source: Crisil FundServices, CRISIL Limited
Birla Sun Life Mutual Fund: Best Group over 3 years (2005-2008). Group Name - Mixed Asset, Size: 12 fund houses were eligible for the group award. Fund groups with at least five equity, five bond, or three mixed-asset portfolios in the respective asset classes were eligible for a group award. The lowest average decile(1) rank of the three years’ Consistent Return measure of the eligible funds per asset class and group determined the asset class group award winner. Birla Sun Life Asset Allocation Fund-Moderate Plan-Growth (BSLAAF-MP-GR): Best Fund – 3 year performance (2005-2008) No. of Schemes: 7; Classification-Mixed Asset INR Balanced, Birla Sun Life Income Fund-Growth (BSLIF-Gr): Best Fund - 3 year performance (2005-2008) & 10 year performance (1998 – 2008), No. of Schemes: 99 & 16 respectively ; Classification-Bond Indian Rupee-General. BSLAAF-MP-Gr & BSLIF-Gr are awarded Lipper Awards India 2009 on the basis of Consistent Return (Effective Return) value over the relevant performance period. Entry/Exit load not considered. Ranking source: Lipper - A Reuter Co. www.lipperweb.com
Standard & Poor’s A: The fund demonstrates high standards of quality based on its investment process, risk awareness and consistency of performance relative to its own objectives. Ranking Methodology: The Fund has provided consistent, above average, risk-adjusted returns relative to its peers over a three-year period ending December 31, 2006. The Fund is assessed by S&P on basis of quantitative factors viz. historical performance for consistency, discrete period performance comparisons and measurement over 3 discrete twelve-month periods, including 6 month moving average size, turnover, dealing, liquidity of portfolio, gearing, client base, cost, fees and on evaluation of qualitative factors viz. fund management group, portfolio manager and investment team that contributes to long term performance.
For detailed rating methodology of Morningstar, please refer our website: www.birlasunlife.com
& Lipper Awards India 2009 - Award Methodology & Disclaimers:
@@ S & P Fund Management Rating
&&CNBC TV18 - CRISIL Mutual Fund of the Year Award for 2007 & 2008 - Award Methodology & Disclaimer
&&CNBC TV18 - CRISIL Mutual Fund of the Year Award for 2008 - Award Methodology & Disclaimer
Past performance is no guarantee of future results.
Birla Sun Life Mutual Fund, Category - Mutual Fund House of the Year, out of 27 fund houses for 2008 awards and out of 26 fund houses for 2007 awards. Fund Houses winning at least two awards for their schemes in the category level awards for 2008 and 2007 respectively were considered for the award based on consistency of fund house's performance across various scheme categories in the four quarterly CRISIL CPR rankings released during the calendar year 2008 and 2007 respectively. The individual CRISIL CPR ranks for their schemes were aggregated on a weighted average basis to arrive at the final ranks for fund houses in both the years. A detailed methodology of the CRISIL CPR is available at www.crisil.com. Ranking & Award Source: CRISIL Fund Services, CRISIL Ltd. Past performance is no guarantee of future results A detailed methodology of the CRISIL CPR is available at www.crisil.com. Ranking & Award Source: CRISIL Fund Services, CRISIL Ltd.
Birla Sun Life Mutual Fund, Category – Debt Fund House of the Year, out of 27 Fund houses. The award is based on consistency of fund house’s performance across the Gilt, Income, Income – Short, Liquid – Retail, Liquid – Institutional, Liquid – Super Institutional, MIP (Aggressive & Conservative) and Liquid Plus categories in the four quarterly CRISIL CPR rankings released during the calendar year 2008. The individual CRISIL CPR ranks for their schemes were aggregated on a weighted average basis to arrive at the final ranks for fund houses.Birla Sun Life Income Fund (Income Category) 17 schemes: Only Winner.Birla Sun Life Short Term Fund - Retail (Income – Short Term Funds) 15 schemes: Only Winner.Birla Sun Life Gilt Plus – Regular Plan (Gilt Category) 11 schemes: Only Winner.Schemes present in all four quarterly CRISIL CPRs were considered for the award. The award is based on consistency of the scheme’s performance in the four quarterly CRISIL CPR rankings released during the calendar year 2008. The individual CRISIL CPR parameter scores averaged for the four quarters were further multiplied by the parameter weights as per the CRISIL CPR methodology to arrive at the final scores. A detailed methodology of the CRISIL CPR is available at www.crisil.com. A detailed methodology of the CRISIL CPR is available at www.crisil.com. Ranking & Award Source: CRISIL Fund Services, CRISIL Ltd.Past performance is no guarantee of future results
For further details on our Funds, please contact our Customers Service Centres at details given below.
BIRLA SUN LIFE ASSET MANAGEMENT COMPANY LTD. BRANCHES
Disclaimer: Any information contained in this publication does not constitute and shall be deemed not to constitute an advice, an ofManagement Company Ltd.(BSLAMC)/ its subsidiaries / affiliates / sponsors / trustee or their officers, employees, personnel, directors shall not be liable for any loss, damage, liability whatsoever for any direct or indirect loss arising from the use or access of any information that may be displayed in this publication from time to time. Recipients of the information contained herein should exercise due care and caution and read the offer documents (including if necessary, obtaining the advice of tax / legal / accounting / financial / other professionals) prior to taking of any decision, acting or omitting to act, on the basis of the information contained herein.Editorial opinions expressed in the 'Connect' are not necessarily those of BSLAMC. or any of their officers, employees, personnel, directors and BSLAMC. and its officers, employees, personnel, directors do not accept responsibility for the editorial content. BSLAMC. or any of its officers, employees, personnel, directors make no representation as to the accuracy, completeness or reliability of the editorial content and hereby disclaim any liability with regard to the same.
fer to sell/ purchase or as an invitation or solicitation to do so for any securities of any entity, and further, Birla Sun Life Asset
Statutory Details: Constitution: Birla Sun Life Mutual Fund (BSLMF) has been set up as a Trust under the Indian Trust Act, 1882. Sponsors: Aditya Birla Nuvo Limited and Sun Life (India) AMC Investments Inc. (liability restricted to seed corpus of Rs. 1 Lac). Trustee: Birla Sun Life Trustee Company Pvt. Ltd. Investment Manager: Birla Sun Life Asset Management Company Ltd.Risk Factors: Mutual Funds and securities investments are subject to market risks and there can be no assurance or guarantee that the objectives of the Scheme will be achieved. As with any investment in securities, the NAV of the Units issued under the Scheme may go up or down depending on the various factors and forces affecting capital markets and money markets. Past performance of the Sponsor / Investment Manager / Mutual Fund does not indicate the future performance of the Schemes and may not necessarily provide a basis of comparison with other investments. The names of the Schemes do not, in any manner, indicate either the quality of the Schemes or their future prospects or returns. Unitholders in the schemes are not being offered any guaranteed/assured returns. Investors should read the Statement of Additional Information / Scheme Information Document/ Key Information Memorandum available at Investor Service Centers and with distributors carefully before investing. The Material provided in the Connect cannot be reproduced or quoted anywhere without express permission from Birla Sun Life Asset Management Company Ltd.
AHMEDABAD : 079 - 26403553 / 48ALLAHABAD : 0532 - 2427015 / 3201661AMBALA : 0171 - 2601345AMRAVATI : 0721 - 6451692ANAND : 02692 - 247260BANGALURU (Jayanagar) : 080 - 41555000BANGALURU (Malleswaram) : 080 - 42199223BANGALURU(Cunningham House Rd) : 080 - 22389991 / 2 / 3BHAVNAGAR : 0278 - 6452524BHUBANESHWAR : 0674 - 2535521 / 3413CALICUT : 0495 - 4021366 / 99CHANDIGARH : 0172 - 2783556CHENNAI (Anna Nagar) : 044 - 43016950 / 1 / 2 / 4 / 6CHENNAI (Egmore) : 044 - 28191681 / 708 / 715 / 699COCHIN : 0484 - 2366817 / 2383969 / 4021722COIMBATORE : 0422 - 4350262 / 4DELHI : 011- 40744514DURGAPUR : 0343 - 6454621 / 19 / 3201241ERODE : 0424 - 4558197 / 8GUWAHATI : 0361 - 2595020 / 2599273GWALIOR : 0751 - 6499442 / 378HUBLI : 0836 - 4259989 / 4266283
AGRA JALANDHAR PATIALA
AJMER JAMSHEDPUR PUNE
ALWAR JODHPUR RAIPUR
AMRITSAR KANPUR RAJKOT
AURANGABAD KOLHAPUR RANCHI
BARODA KOTA SHIMLA
BELGAUM LUCKNOW SILIGURI
BHILLAI LUDHIANA SURAT
BHOPAL MANDIGOBINDGARH UDAIPUR
DEHRADUN MANGALORE VALSAD
DHANBAD MEERUT VARANASI
GURGAON MORADABAD VASHI
HYDERABAD (Abids) MUMBAI (Borivali) VIJAYWADA
INDORE MUMBAI (Ghatkopar) VISAG
JABALPUR NAGPUR
JAIPUR NASIK
JAMMU : 0191 - 2432601JAMNAGAR : 0288 - 3200064KOLKATA : 033 - 22882592 / 4 / 5MADURAI : 0452 - 4231493 / 83MARGAO : 0832 - 6480109MATHURA 0565 - 3207007 / 6959MEHASANA : 02762 - 658323 / 16MUMBAI (Fort) : 022 - 66379839 / 41 / 44 / 12MUMBAI (Head Office) : 022 - 66928000MUMBAI (Prabhadevi) : 022 - 6661035 / 36MYSORE : 0821 - 4244400 / 1 / 2NOIDA : 0120 - 4203629PANIPAT : 0180 - 4005660PANJIM : 0832 - 2437628PATNA : 0612 - 2323265 / 66PONDICHERRY : 0413 - 4207997SALEM : 0427 - 4554431THANE : 022 - 67930660 / 1TRICHY : 0431 - 2773391 / 2 / 3TRIVANDRUM : 0471 - 4017007VAPI : 0260 - 6454735 / 6VISHAKAPATNAM : 0891 - 6631337 / 8
IDEA Toll Free No. 1800-270-7000 & the centralised TOLL no. 022-66917777
50
Parameters Scheme CategorySuperior Return Score Large Cap Oriented Equity, Diversified Equity, Small and Midcap, ELSS, Balanced, Debt, MIP
(Aggressive & Conservative), Gilt-Long and Consistent CPR Performers – Equity, Balanced and DebtMean Return and Volatility Debt-Short, Ultra Short Term Debt, Liquid, Liquid Institutional & Liquid Super Institutional and Consistent
CPR Performers - Liquid
Portfolio Concentration Analysis All Schemes
Liquidity Analysis All Schemes
Asset Quality Debt Schemes
Average Maturity Debt Schemes
Downside Risk Probability Debt- Short Term, Liquid, Ultra Short Term Debt, Liquid- Institutional & Super Institutional
Asset Size Debt- Short Term, Liquid, Ultra Short Term Debt, Liquid- Institutional & Super Institutional
Historic performance on CRISIL~CPR Consistent CPR Performer – Equity, Balanced, Debt and Liquid categories
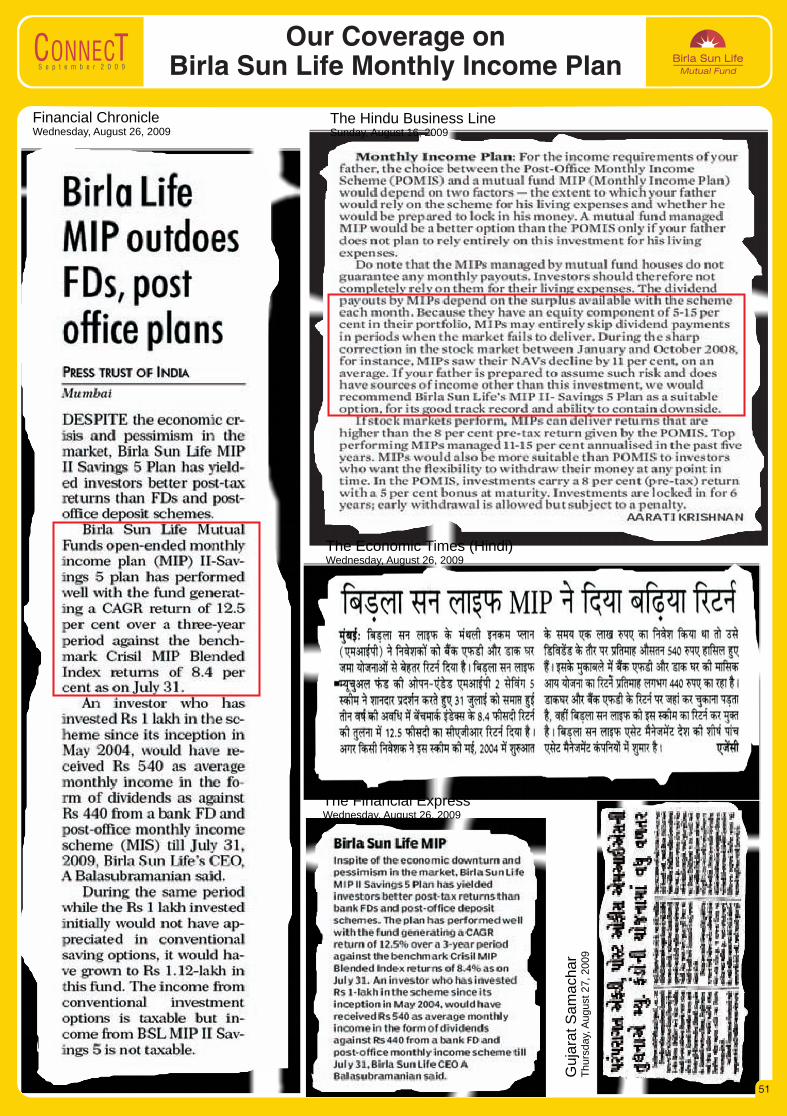
The Economic Times (Hindi)Wednesday, August 26, 2009
The Financial ExpressWednesday, August 26, 2009
Gu
jara
t S
am
ach
ar
Th
urs
da
y, A
ug
ust
27
, 2
00
9
The Hindu Business LineSunday, August 16, 2009
Financial ChronicleWednesday, August 26, 2009
S e p t e m b e r 2 0 0 9
Our Coverage on Birla Sun Life Monthly Income Plan
51
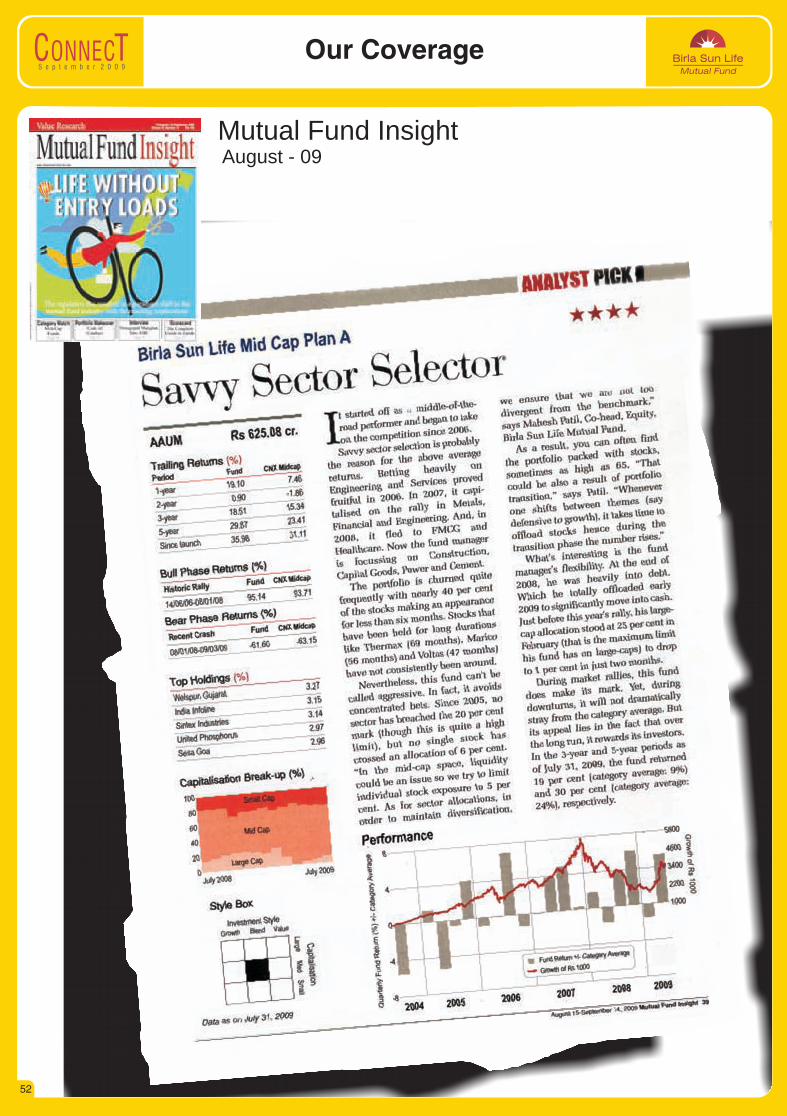
Our Coverage
Mutual Fund Insight August - 09
S e p t e m b e r 2 0 0 9
52

assistance,round the clock.
www.birlasunlife.com/mobile
Online Portfolio Access
www.birlasunlife.com
Mobile Investment Manager
All India Telephone
• View portfolio summary
• View transaction history
• Track your portfolio
• Purchase, Switch & Redeem
• Change TPIN (Telephone Personal Identification Number)
• Get Account Statement instantly
Toll Free : 1-800-22-7000 1-800-270-7000
Non Toll Free : +91 22 6691 7777
(MTNL/BSNL)

India is a hotbed of mid-sized companies but only some have the
potential to become tomorrow’s superstars. Invest in Birla Sun Life
Midcap Fund and gain from our expertise of spotting tomorrow’s
winners today.
Birla Sun Life Midcap FundAn Open ended Growth Scheme
Toll-free 1-800-270-7000 www.birlasunlife.com sms GAIN to 56161
Disclaimer: The name ‘Medicare Ltd’ is a fictitious name and is not intended to bear any resemblance to an existing company. Statutory Details: Constitution: Birla Sun Life Mutual Fund (BSLMF) has been set up as a Trust under the Indian Trust Act, 1882. Sponsors: Aditya Birla Nuvo Limited and Sun Life (India) AMC Investments Inc. (liability restricted to seed corpus of Rs. 1 Lakh). Trustee: Birla Sun Life Trustee Company Pvt. Ltd. Investment Manager: Birla Sun Life Asset Management Company Ltd. Scheme Name and Objective: Birla Sun Life Midcap Fund An Open ended Growth Scheme with the objective to achieve long-term growth of capital at controlled level of risk by primarily investing in midcap stocks. Date of inception / takeover: 03 Oct 2002. Entry Load (Incl. for SIP): Nil. Exit Load (Incl. for SIP): For redemption/switch-out of units within 365 days from the date of allotment: 1.00% of applicable NAV. For redemption/switch-out of units after 365 days from the date of allotment: Nil. Risk Factors: Mutual Funds and securities investments are subject to market risks and there can be no assurance or guarantee that the objectives of the Scheme will be achieved. As with any investment in securities, the NAV of the Units issued under the Scheme may go up or down depending on the various factors and forces affecting capital markets and money markets. Past performance of the Sponsors / Investment Manager / Mutual Fund does not indicate the future performance of the Scheme and may not necessarily provide a basis of comparison with other investments. The name of the Scheme does not, in any manner, indicate either the quality of the Scheme or its future prospects or returns. Unit holders in the Scheme are not being offered any guaranteed / assured returns. Please refer to the Scheme Information Document for Scheme specific risk factors. Investors should carefully read the Scheme Information Document / Statement of Additional Information / Key Information Memorandum available at Investor Service Centres and with Distributors before investing.
Can you pick tomorrow’s winners today?