the multiplicity and stoichiometry of the prosthetic groups in qh2 : cytochrome c oxidoreductase as...
TRANSCRIPT
316
Biochimica et Biophysica Acta, 546 (1979) 316--333 © Elsevier/North-Holland Biomedical Press
BBA 47646
THE MULTIPLICITY AND STOICHIOMETRY OF THE PROSTHETIC GROUPS IN QH2 : CYTOCHROME c OXIDOREDUCTASE AS STUDIED BY EPR
SIMON DE VRIES, SIMON P.J. ALBRACHT and FRANS J. LEEUWERIK
Laboratory of Biochemistry, B.C.P. Jansen Institute, University of Amsterdam, Plantage Muidergracht 12, 1018 TV Amsterdam (The Netherlands)
(Received July 12th, 1978)
Key words: EPR; Stoichiometry; Cytoehrome; Fe-S centers; Complex III
Summary
1. The EPR signal in the g = 2 region of the reduced QH2 : cytochrome c oxidoreductase as present in submitochondrial particles and the isolated enzyme is an overlap of two signals in a 1 : 1 weighted ratio. Both signals are due to [2Fe-2Sr 1 centers.
2. From the signal intensity it is computed that the concentration of each Fe-S center is half that of cytochrome c~.
3. The line shape of one of the Fe-S centers, defined as center 1, is reversibly dependent on the redox state of the b-c1 complex. The change of the line shape cannot be correlated with changes of the redox state of any of the cytochromes in QH2 : cytochrome c oxidoreductase.
4. Like the optical spectrum, the EPR spectrum of the cytochromes is com- posed of the absorption of at least three different b cytochromes and cyto- chrome c 1.
5. The molar ratio of the prosthetic groups was found to be c~ : b-562 : b - 5 6 6 : b - 5 5 8 : c e n t e r 1 : c e n t e r 2 = 2 : 2 : 1 : 1 : 1 : 1 . The consequences of this stoichiometry are discussed in relation to the basic enzymic unit of QH2 : cytochrome c oxidoreductase.
Introduction
Isolated Complex III (QH2 : cytochrome c oxidoreductase), reduced with dithionite or ascorbate, shows a rhombic EPR signal at 100 K with g values
Abbreviation: TMPD, N,N,Nr,N~-tetramethyl-p-phenylenediamine.
317
1.78--1.80, 1.90 and 2.02 as was first described by Rieske et al. [1--3]. These workers succeeded in purifying the species responsible for this signal and discovered that it contains non-heme iron [2,3]. Later it became clear that the g values of the EPR signal were typical for a [2Fe-2S] center [4]. This was in agreement with the Fe content of isolated Complex III [2] and has been also confirmed by a recent EPR study on STFe~ontaining submitochondrial parti- cles [5].
It is known that the line shape of the EPR signal of this center in Complex III [3,6--8] or submitochondrial particles [5] is dependent on the reducing agent used, in contrast to that of the purified succinylated non-heme iron protein [3]. Orme~Johnson et al. [7] suggested that the line shape change accompanies the reduction of cy tochrome b-562.
We describe here an analysis of the EPR signal, which has revealed the existence of two EPR signals with different properties. Only one of the signals changes with the redox state of the complex. This could no t be correlated with redox changes of any of the other prosthetic groups in Complex III.
The optical spectrum of Complex III shows at least three different b cyto- chromes, namely: cy tochrome b-562, cy tochrome b-558 and cytochrome b-566 [9--12]. Moreover, cy tochrome b-562 seems to be composed of two species differing in midpoint potential [ 13].
Sato et al. [14] assign the absorption maxima at 558 and 566 nm to a single b cytochrome with a split a-band, cytochrome b-566 + 558. This assign- ment is not shared by others for two reasons. First, the splitting is unusually large. Secondly, the ratio between the peak amplitudes at 558 and 566 nm is variable during reductive titrations [ 15]. In particular, in rat liver mitochondria Higuti et al. [16] could reduce selectively the components responsible for the absorptions at 558 and 566 nm, indicating that, at least in rat liver mito- chondria, two a-bands exist that can be ascribed to two cytochromes with different redox properties.
In the EPR spectrum of Complex III, reduced with ascorbate, only two absorptions of b cytochromes are clearly visible [6], namely cytochrome b-562 and cy tochrome b-566 + 558. The peak of cy tochrome b-562 shifts after addition of antimycin [17]. In this paper it is shown that the EPR spectrum of Complex III in the g = 3.3--3.8 region is composed of the reso- nances of cy tochrome cl, two species of cy tochrome b-562, cy tochrome b-558 and cy tochrome b-566. With the method outlined in an accompanying paper [18] the s toichiometry of the cytochromes has been determined from the EPR spectra. This method measures the absolute amount of paramag- netic centers, whereas previous determinations [19,20] of the stoichiometry had perforce to be based on the assumption that the extinction coefficients of the different b cy tochromes are the same. Part of this work has been pre- sented elsewhere [ 21].
Materials and Methods
Beef heart QH2 : c y t o c h r o m e c oxidoreductase was prepared from the succinate-cytochrome c reductase segment according to the procedure of Hatefi et al. [22] and suspended in a medium containing 0.66 M sucrose and
318
50 mM Tris-HC1 buffer (pH 8). When other pH values were required this solution was diluted 100-fold in 0.66 M sucrose, 50 mM potassium phosphate buffer (pH 6.5 or 7.2) or in 0.66 M sucrose, 50 mM Tris-HC1 buffer (pH 8 or 9). The protein was then precipitated at 55% ammonium sulphate saturation and resuspended in the same medium. The preparations were always contami- nated with small amounts of Complex II.
MgATP particles were prepared from beef heart mitochondria by the method of LSw and Vallin [23]. Some preparations were made from mitochondria that had been freed from cytochrome c as described by Tsou [24]. The succinate dehydrogenase in the particles was activated by an incubation with 10 mM fumarate for 20 min at 30°C. After washing, the particles were suspended in 0.25 M sucrose, 50 mM potassium phosphate buffer (pH 7.2) to a concentra- tion of 100 mg of protein/ml. The cytochrome cl content , determined opti- cally using a es53-s39 ( r e d . - - o x . ) = 20.1 mM -1. cm -1 [25], was about 0.35 nmol/mg of protein.
EPR spectra were recorded with a Varian E-3 or E-9 spectrometer. Spectra were digitized and simulated as earlier described [26]. Quantitation of the EPR signals of the cytochromes was performed as described in an accompanying paper [18] using the expression for T Av. The EPR spectrum of the b cyto- chromes was analyzed with a Du Pont 310 Curve-Resolver.
Low-temperature diffuse reflectance spectra were obtained with a home- built integrating sphere attached to an Aminco DW-2 spectrophotometer. Low temperatures were generated with a gas-flow system essentially as described by Lundin and Aasa [27], except that the integrating sphere replaced the EPR cavity. The spectrophotometer was connected to a LS-II microcomputer that was programmed to carry out automatic baseline correction and further digital manipulations of the optical spectra.
Results
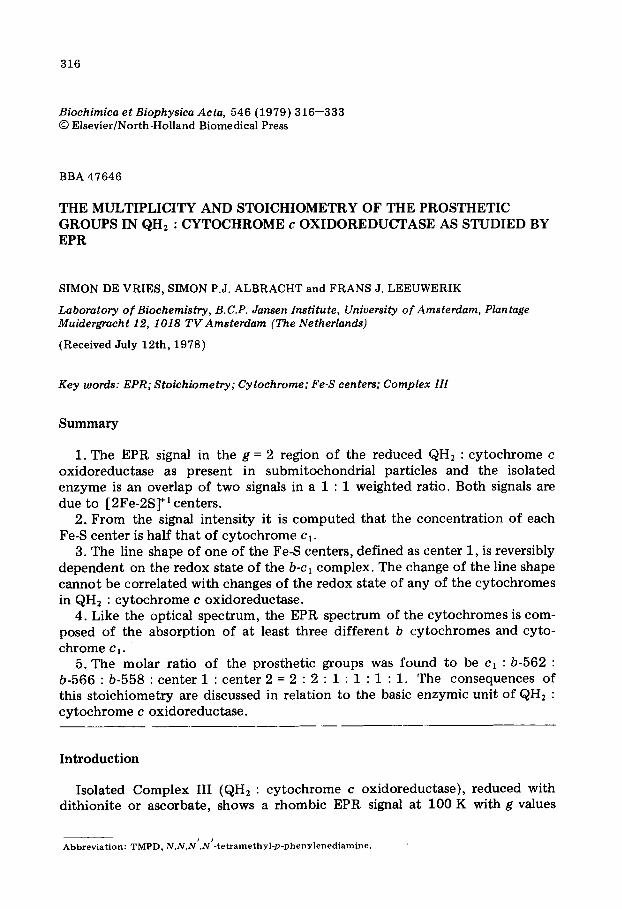
I. The Fe-S centers Line shape analysis. It can be seen from Fig. 1 that the EPR signal of
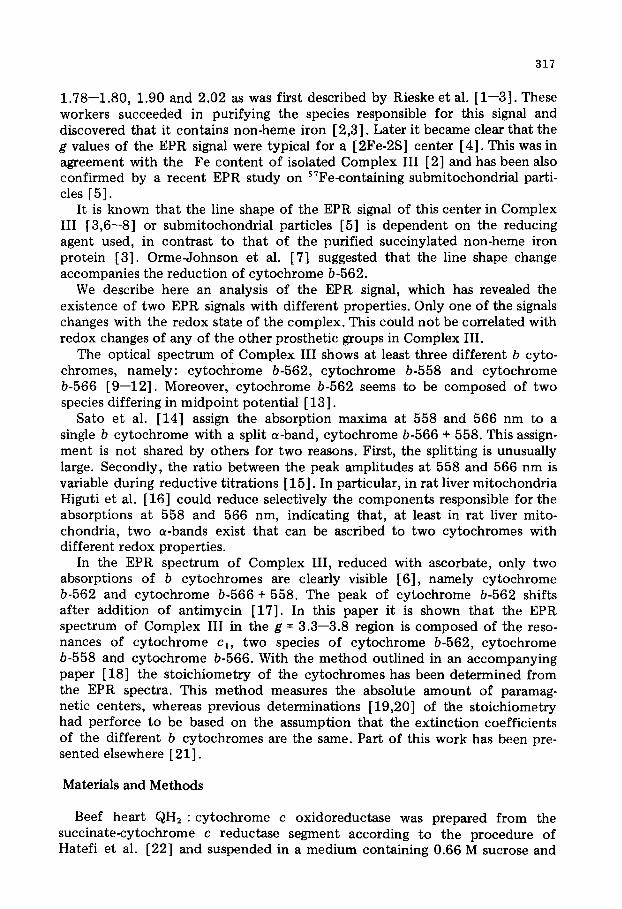
reduced Complex III shows more details at 36 K than at 85 K. In the 36 K spectrum various extra features can be observed: a shoulder on the low-field side of the gz at 2.02, an asymmetric shape of the gy at 1.89 and a very broad shoulder at the high-field side of the gx at 1.81. These features, that are less obvious or absent in the 85 K spectrum, indicate that probably a second signal with a more rapid spin-lattice relaxation is present. This is confirmed by a computer simulation of the line shape (Fig. 2). Clearly two rhombic S = ½ signals in a 1 : 1.22 ratio are needed for a good fit. A line shape very similar to that in Fig. 1 (upper trace) is observed in submitochondrial particles (Fig. 3, upper trace). The low-field shoulder around g = 2.03 and the high-field shoulder around g = 1.77 are here relatively smaller. This suggests that the amount of the second signal present here is relatively less than in Fig. 1. Simu- lation confirms this (Fig. 3, lower trace). Now two rhombic S = ½ signals, with nearly identical parameters as used in Fig. 2, were needed in a 1 : 1 ratio. For further discussion we define the signal with the narrow line widths as center 1 (Fig. 2, trace C), the other as center 2 (Fig. 2, trace D).
319
SSK
I . . , . . . . I . . . . , . . . . . . . . , . . . . t . . . . , . . . . I ~ , , ,
2 . 10 2 .00 t 90 1 .80 1 .10
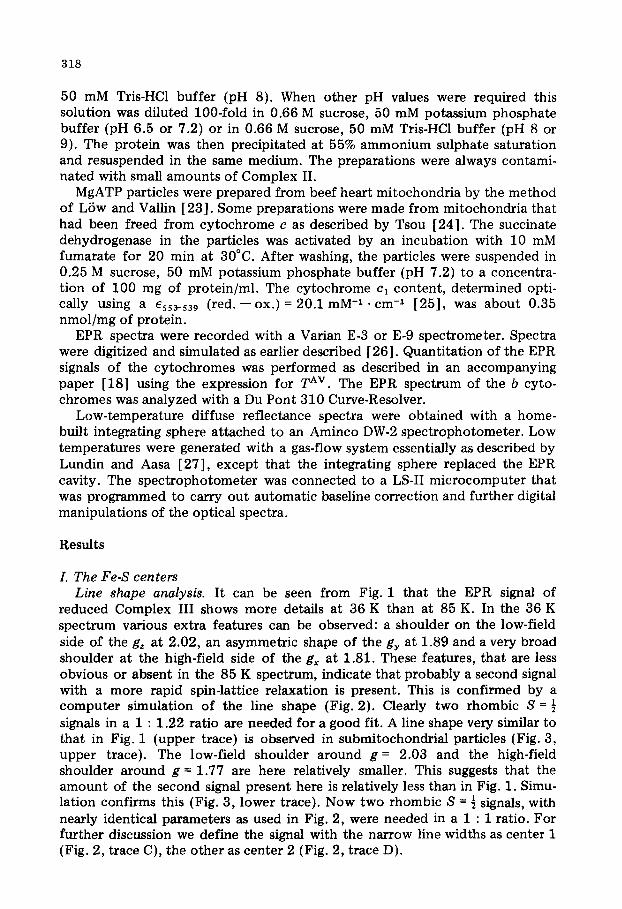
Fig. 1. E f f ec t of t e m p e r a t u r e on the EPR s p e c t r u m of QH 2 : c y t o c h r o m e c o x i d o r e d u c t a s e r e d u c e d wi th ascorba te . C o m p l e x I I I (pH 8.0) was m i x e d wi th 5 m M s o d i u m asco rba t e and f rozen a f t e r 30 s a t 0°C. EPR cond i t ions : F r e q u e n c y (F) , 9 3 1 8 MHz; t e m p e r a t u r e (T) , 36 K for the u p p e r t race an d 85 K for the l ower one ; m i c r o w a v e p o w e r (P), 2 roW; m o d u l a t i o n a m p l i t u d e (MA), 0 .63 roT; scanning ra te (SR), 25 roT/ ra in ; m o d u l a t i o n f r e q u e n c y , 100 kHz for these and all o th e r EPR spect ra . The gain for the l o wer
t race was 3.1 t i m es t h a t of the uppe r . The g value scale is s h o w n a t the b o t t o m of the f igure.
A v / ' ~ E x Pt I B
~ - ' C 1 ,'1.22 C 2
C
~ ~ D 1.22 C 2
. . . . , . . . . I . . . . , . . . . I . . . . , . . . . I . . . . , . . . . I . . . . , . . . . I
I 2 . 0 1 . 9 t . 8 1 . 7 t . 6
Fig. 2. Simulation of the EPR signal of reduced Complex III. (A) Experimental spectrum as in Fig. 1,
upper trace. (B) Simulation as a superposition of two S = 2 I- signals plotted separately as C and D. The
relative weights for C and D axe 1 and 1.22, respectively. Simulation parameters for C: gz,y,x = 2.0188, 1.8914, 1.8046; width (z,y,x) = 1.25 roT, 2.4 roT, 4.2 roT. Parameters for D: gz,y,x = 2.0242, 1.8946, 1.7746; width (z,y,x) = 3.1 roT, 3.4 roT, 13 roT.
320
J _/
2.11 2 , 0 I ,9 1. :8 1. ,7 1 , 6
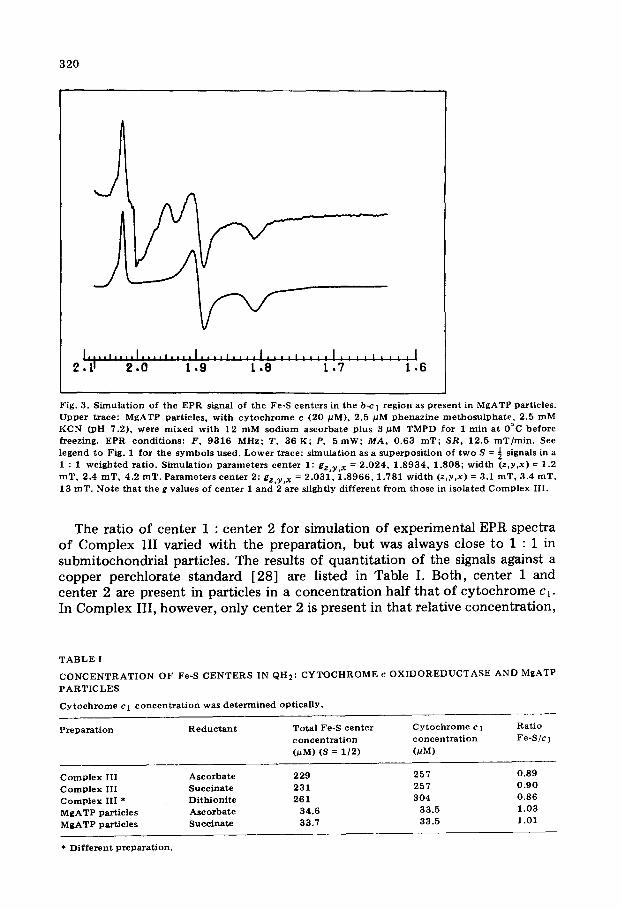
Fig. 3. S imu la t i on of the EPR signal of the Fe-S cen te r s in the b-c I reg ion as p resen t in MgATP part icles . U p p e r t race : MgA T P par t ic les , wi th c y t o c h r o m e c (20 #M), 2.5 pM p h e n a z i n e m e t h o s u l p h a t e , 2.5 m M KCN (pH 7.2) , we re m i x e d wi th 12 m M s o d i u m a s c o rba t e plus 3 #M TMPD for 1 rain a t 0°C be fo re freezing. EPR cond i t ions : F , 9316 MHz: T, 36 K; P, 5 roW; M A , 0 .63 roT; S R , 12.5 roT/ra in . See legend to Fig. 1 for the s y m b o l s used. L o w e r t race : s imula t ion as a supe rpos i t i on of t w o S = ~ signals in a 1 : 1 w e i g h t e d ra t io . S imu la t i on p a r a m e t e r s cen t e r 1: g z , y , x = 2 .024 , 1 . 8 9 3 4 , 1 .808; wid th (z ,y ,x) = 1.2 m T , 2.4 roT, 4.2 roT. P a r a m e t e r s cen t e r 2: g z , y , x = 2 .031 , 1 . 8 9 6 6 , 1 .781 w id th (z ,y ,x) = 3.1 m T , 3.4 roT, 13 raT. No te t ha t the g va lues of cen t e r 1 a nd 2 are sl ightly d i f f e ren t f r o m those in i so la ted C o m p l e x III .
The ratio of center 1 : center 2 for simulation of experimental EPR spectra of Complex III varied with the preparation, but was always close to 1 : 1 in submitochondrial particles. The results of quanti tat ion of the signals against a copper perchlorate standard [28] are listed in Table I. Both, center 1 and center 2 are present in particles in a concentrat ion half that of cy tochrome cl. In Complex III, however, only center 2 is present in that relative concentration,
T A B L E I
C O N C E N T R A T I O N OF Fe-S C E N T E R S IN QH2: C Y T O C H R O M E c O X I D O R E D U C T A S E A N D MgATP
P A R T I C L E S
C y t o c h r o m e c 1 c o n c e n t r a t i o n was d e t e r m i n e d opt ica l ly .
P r e p a r a t i o n R e d u c t a n t To ta l Fe-S c e n t e r C y t o c h r o m e c 1 Ra t io c o n c e n t r a t i o n c o n e e n t r a t i o n Fe-S/¢ 1
CPM) (s = 1 /2) (pM)
C o m p l e x I I I A s c o r b a t e 229 257 0.89 C o m p l e x I l l Succ ina te 231 257 0 .90 C o m p l e x I I I * Di th ion i t e 261 304 0 .86 MgATP par t ic les As c o rba t e 34 ,6 33 .5 1.03 M g A T P par t ic les Succinate 33,7 33.5 1.01
* D i f f e r en t p r epa ra t i on .
321
whereas 20% of the original amount of center 1 is lost as can be calculated from Table I and Fig. 2. When Complex III was prepared from Complex I-III only 50--60% of the total Fe-S centers were recovered relative to cytochrome c~ and again it was mainly center 1 that was lost. We have never observed that the relative amounts of the individual centers 1 or 2 in Complex III or sub- mitochondrial particles exceeded 50% of that of cytochrome cl under any conditions used.
Line shape dependence on the redox potential. In accordance with Rieske et al. [3], OrmeJohnson et al. [6,7] and Siedow
et al. [8] we find that the total line shape of the Fe-S signals of Complex III is dependent on the reducing agent. In fact a gradual reversible change is noticed when the redox potential is moved. This is shown in Figs. 4A and 5A for particles but the same is found with isolated Complex III. Especially in particles it can be seen that center 1 clearly changes its line shape: the gx at 1.80, gy at 1.89 and gz at 2.02 gradually broaden and as a result their ampli- tudes decrease. At lower redox potentials the signal of center 1 of succinate dehydrogenase is also appearing. No change in the line shape of center 2 was observed either in particles or Complex III. The line shape of center 1 as present after the broadening process has occurred is not the same as that of center 2. The resulting overall shape in Complex III cannot be simulated as a single S = ½ signal. Thus center 1 and center 2 have different EPR properties under all conditions. During the titrations the total area under the gz peaks of the centers 1 and 2 was constant when corrected for the contribution of center 1 of succinate dehydrogenase, showing that both centers of QH2 : cytochrome c oxidoreductase remain fully reduced under these conditions.
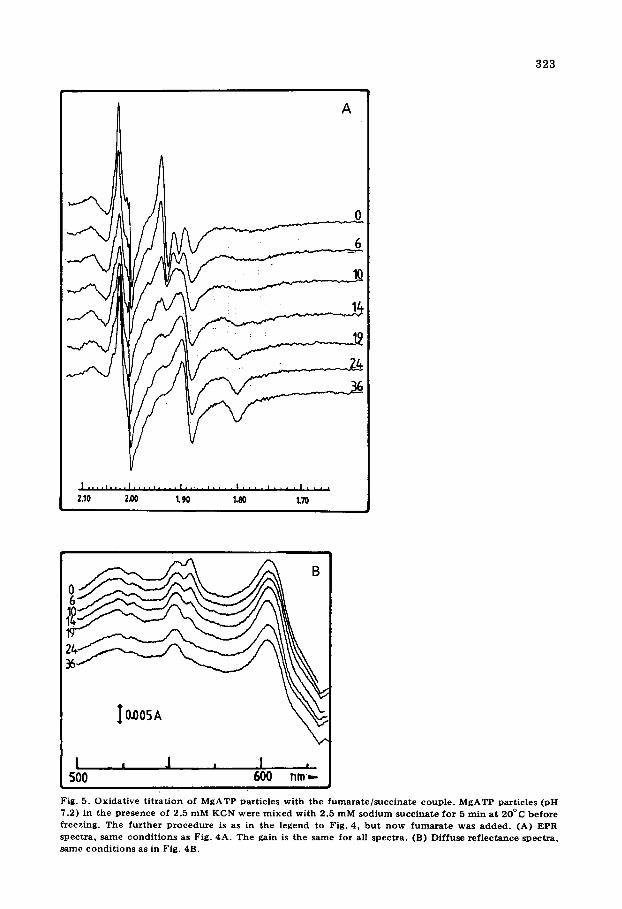
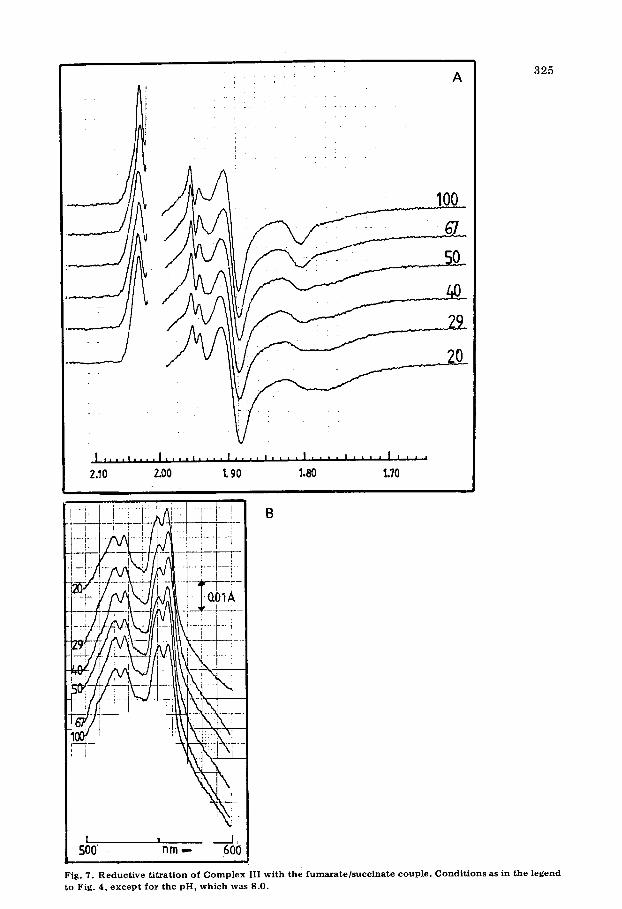
The changes observed in Figs. 4A and 5A seem to parallel the redox state of cytochrome b-562, as can be seen from the optical low-temperature reflec- tance spectra of the EPR tubes (Figs. 4B and 5B). As the midpoint potential of cytochrome b-562 is pH dependent [29,30] experiments were also carried out at pH 6.5 (Fig. 6), pH 8.0 (Fig. 7} and pH 9.0 (not shown). At these pH values there is no longer any connection between the redox state of cytochrome b-562 and the line shape change of center 1. At pH 6.5 the signal of center 1 broadens without reduction of cytochrome b-562, whereas at pH 8.0 the cyto- chrome is already fully reduced before the line shape of center 1 takes place. At pH 8.0 but especially at pH 9.0 a new line at g = 1.95 shows up in addition to the g~ and gx of center 1 of succinate dehydrogenase. We do not know the origin of this line. It might be correlated with the fact that succinate dehydro- genase becomes unstable in air at high pH. The radical signal is also much stronger at high pH and is therefore not recorded in Fig. 7. This indicates that a considerable part of the signal at g = 2 is due to ubisemiquinone and its anion form as their concentrat ion will increase in a partially reduced ubiquinone preparation on increasing the pH [ 31].
For comparison Fig. 8 is added showing the behaviour of the sample at pH 7.2.
II. The cy tochromes Resolution o f the EPR spectrum o f the cy tochromes in the individual com-
ponents. Fig. 9 shows the EPR spectra of the cytochromes of Complex III in

. , , , ,
A
5O
' 33
29
2.10 2.00 1. 90 1.80 1.70
22
,
I aoo5 A
L , [ j ! . , 500 600 nm.,.-
Fig. 4. Reductive titration of MgATP particles with the fumarate/succinate couple. MgATP paxticles (pH
7.2) in the presence of 2.5 mM KCN, were mixed with 90 mM sodium fumarate and 0.9 mM sodium suceinate for 5 rain at 20°C and then frozen. After recording the EPR and optical spectra the EPR tube
was thawed and succinate was added to lower the fumarate/succinate ratio. After 5 rain at 20~C the
contents were again frozen and measured. This was repeated several times. The fumarate/succinate ratio is
indicated in this and the next figures by the numbers aside the traces. (A) EPR spectra at F, 9.31 GHz;
T, 36 K; P, 5roW; MA, 0.63 roT; SR, 12.5 roT/rain. The gain is the same for all spectra. (B) Diffuse
reflectance spectra at T = 110 K; SR, 0.2 rim/s; slit width (SW), 1.0 nm. See legend to Fig. ] for the
symbols used.
3 2 3
A
B
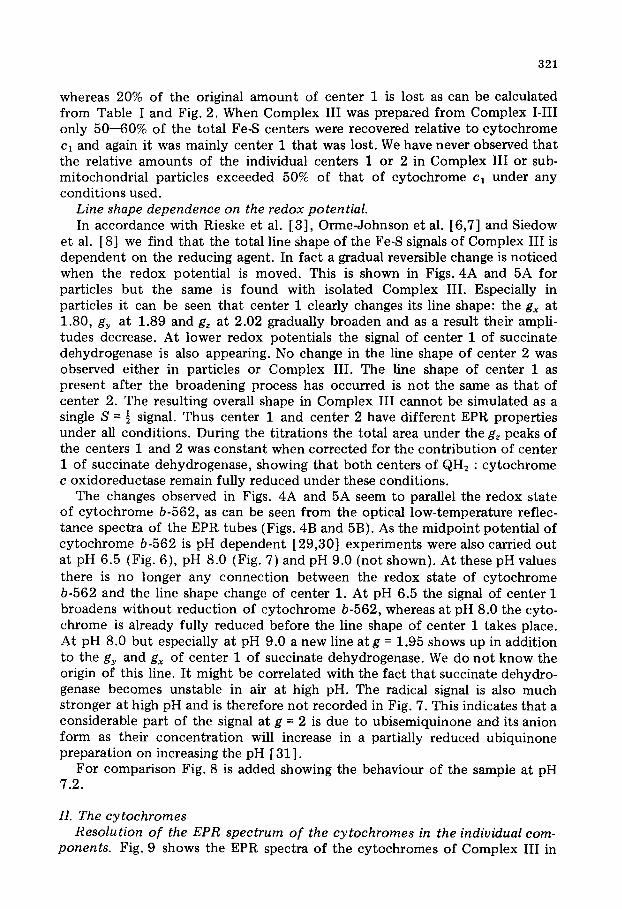
~o I'°+°~~ ' +bo~ l !, Fig. 5. O x i d a t i v e t i t r a t i o n of M g A T P pa r t i c l e s w i t h the f u m a r a t e / s u c c i n a t e coup le . M g A T P par t i c les (pH
7.2) in t he p r e s e n c e of 2.5 m M K C N were m i x e d w i t h 2 .5 m M s o d i u m s u c c i n a t e f o r 5 ra in a t 2 0 ° C b e f o r e f r eez ing . T h e f u r t h e r p r o c e d u r e is as in t he l egend to F ig . 4, b u t n o w f u m a r a t e was a d d e d . (A) E P R spec t r a , s a m e c o n d i t i o n s as F ig . 4A. T h e ga in is t he s a m e f o r all spec t r a . (B) D i f f u s e r e f l e c t a n c e spec t r a , s a m e c o n d i t i o n s as in Fig. 4B.

324
A
__f
2.10 2.00 1. 90 1.80 1.70
I i
500 n m ,,.. 600" I Fig. 6. R e d u c t i v e t i t r a t i on of C o m p l e x I I I wi th the f u m a r a t e / s u c c i n a t e couple . C o m p l e x I I I (pH 6 .5) was m i x e d wi th 4 ~M p h e n a z i n e m e t h o s u l p h a t e , 90 m M s o d i u m f u m a r a t e and 0.9 m M s o d i u m succ ina te for 5 m i n a t 20°C be fo re f reez ing . The f u r t h e r p r o c e d u r e is as in the legend to Fig. 4. (A) EPR spect ra , same cond i t ions as in Fig. 4. (B) Diffuse r e f l e c t a nc e spec t ra , s ame cond i t ions as in Fig. 4.
i
. i i i f! . ¸ : : ¸ A
. / J ~ 100
, 2100 , , , 1190 n, 1180 170 i
325
Fig. 7. R e d u c t i v e t i t r a t i o n o f C o m p l e x I I I w i t h the f u m a r a t e / s u c c i n a t e coup le . C o n d i t i o n s as in t he l egend
to F ig . 4, e x c e p t f o r t he p H , w h i c h was 8.0.

326
A
I . . . . I . . . . I . . . . , . . . . I , , , i . . . . I . . . . ~ . . . . I , , , ,
2 . 10 2~0 t gO 1 .80 ' 1 . 70
0
I I i a t I So0 SS0
\
\ \
J I
i
F ig . 8. R e d u c t i v e t i t r a t i o n of C o m p l e x I I I w i t h the f u m a r a t e / s u c c i n a t e coup le . C o n d i t i o n s as in the l egend to Fig . 4, e x c e p t fo r t he p H , w h i c h was 7.2.
different redox states. The oxidized spectrum, trace A, consists of the resonances of cytochrome cl and the b cytochromes. After reduction with ascorbate, trace B, the signal of cytochrome c~ disappears and the remaining spectrum is an overlap of the signals of all the b cytochromes. Orme~lohnson et al. [6] assigned the peak at g = 3.44 to cytochrome b-562 and that at g = 3.78 to cytochrome b-566 + 558. After further reduction with the fumarate/ succinate couple, trace C, the peak of cytochrome b-562 decreases in intensity and the maximum shifts 0.9 mT down field to g = 3.457. The same shift appears after reduction with ascorbate/N,N,N',N'-tetramethyl-p-phenylene- diamine (TMPD) (spectrum not shown). Thus it seems as if the peak of cyto-

A
327
]H .h . : [ J .d . . J , . , IH tJ [ .Nh~ [ ImdHH[NHhHJ i . .h :H [ . . h:H I~ H~I . H lJ H ~I . . . . ] . . . . I . . . . [ 1 4.0 3.5
Fig. 9. EPR spec t ra of the c y t o c h r o m e s of QH 2 : c y t o c h r o m e c o x i d o r e d u c t a s e in d i f f e r en t r e d o x states. (A) Oxid ized wi th 0.5 m M p o t a s s i u m fe r r i cyan ide for 1 m in a t 0°C. (B) R e d u c e d wi th 0 .35 m M sod ium aseo rba t e for 1 m i n a t 0°C. (C) R e d u c e d wi th 50 mM s o d i u m f u m a r a t e , 2.6 m M s o d i u m succ ina te for 5 m i n a t 20°C. The p e a k of c y t o c h r o m e b-562 is a t g = 3 .441 in t race B an d a t g = 3 .457 in t race C. EPR cond i t ions : F, 9 3 0 3 MHz, T, 10 K; P, 0 .32 roW; MA, 3.2 m T ; SR, 12.5 roT/ ra in . See legend for Fig. 1 for the s y m b o l s used.
~ T I,,4. A.
I . . , . , , . . , I . . . . : . . . . I . . . . J . . . . i . . . . , . . . . I . . . . I . . . . [ . . . . : . . . . I 3.9 3.8 3.7 3.S 3.5 $.4 3.3 Fig. 10. E f f ec t of m o d u l a t i o n a m p l i t u d e on the line shape of the EPR s p e c t r u m of the b c y t o c h r o m e s . (A an d B) R e d u c e d w i t h s o d i u m a s c o rba t e as in Fig. 9B. EPR condi t ions : F , 9 3 1 0 MHz; T, 10 K; P, 0 .32 m W; MA, 0 .63 m T for (A) ; MA, 3.2 m T for (B). T race A r ep re sen t the real l ine shape of t h e signal a t g = 3 .76 since lower ing the MA did n o t change its l ine shape an y fu r the r . See l egend to Fig. 1 for the s y m b o l s used .
A
B C
chrome b-562 at g = 3.441 is an overlap of two signals originating from two cytochromes b-562, differing in midpoint potential.
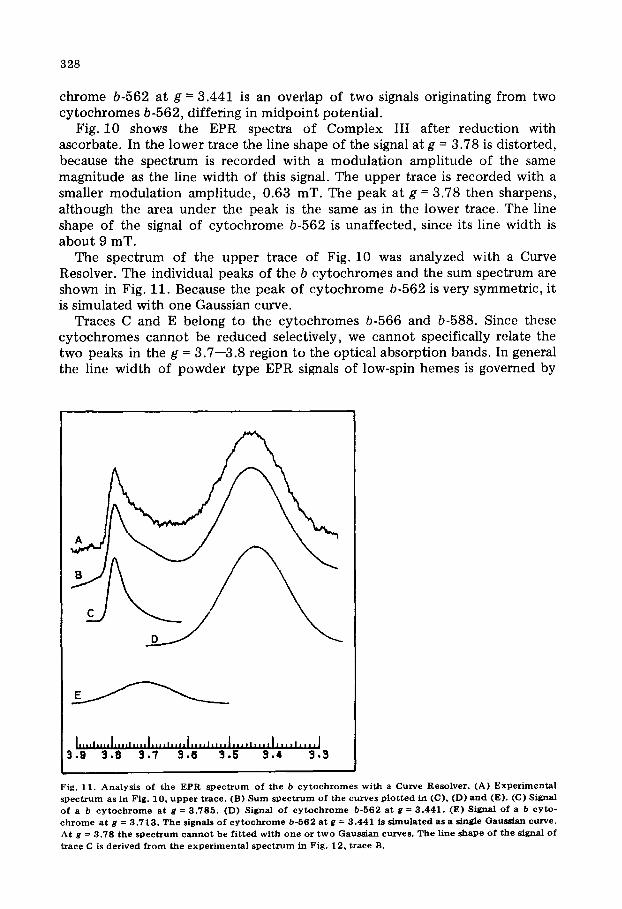
Fig. 10 shows the EPR spectra of Complex III after reduction with ascorbate. In the lower trace the line shape of the signal at g = 3.78 is distorted, because the spectrum is recorded with a modulat ion amplitude of the same magnitude as the line width of this signal. The upper trace is recorded with a smaller modulat ion amplitude, 0.63 mT. The peak at g = 3.78 then sharpens, although the area under the peak is the same as in the lower trace. The line shape of the signal of cytochrome b-562 is unaffected, since its line width is about 9 mT.
The spectrum of the upper trace of Fig. 10 was analyzed with a Curve Resolver. The individual peaks of the b cytochromes and the sum spectrum are shown in Fig. 11. Because the peak of cytochrome b-562 is very symmetric, it is simulated with one Gaussian curve.
Traces C and E belong to the cytochromes b-566 and b-588. Since these cytochromes cannot be reduced selectively, we cannot specifically relate the two peaks in the g = 3.7--3.8 region to the optical absorption bands. In general the line width of powder type EPR signals of low-spin hemes is governed by
328
J , , . . , . . . . I , . . . . . . I . . . . , . . . . I . . . . , . . . . l . . . . , . . . . I . . . . , . . . . J 3 .9 3 . 8 3 . 7 3 . 6 3 . 5 3 . 4 3 . 3
Fig. 11. A n a l y s i s o f the EPR s p e c t r u m o f the b c y t o c h r o m e s w i t h a Curve Reso lve r . (A) E x p e r i m e n t a l s p e c t r u m as in F ig . 10, u p p e r t r a c e . (B) S u m s p e c t r u m o f t h e c u r v e s p l o t t e d in (C), (D) a n d (E). (C) Signal of a b c y t o c h r o m e a t g = 3 . 7 8 5 . (D) Signal o f c y t o c h r o m e b-562 a t g = 3 . 4 4 1 . (E) Signal o f a b c y t o - c h r o m e a t g = 3 . 7 1 3 . T h e s ignals o f c y t o c h r o m e b -562 a t g = 3 .441 is s i m u l a t e d a s a single Gauss i an curve . At g = 3 .78 t h e s p e c t r u m c a n n o t b e f i t t e d w i t h o n e o r t w o Gauss ian curves . T h e l ine shape o f the s ignal o f
t~ace C is de r ived f r o m t h e e x p e r i m e n t a l s p e c t r u m in Fig . 12, t race B.

329
g-strain [32], at least at temperatures where the relaxation broadening is negligible. The overall line shape of the EPR spectrum can then be simulated as a convolution of the first derivative of Gaussian peaks. In these cases the gz appears as an isolated peak with a normal Gaussian shape if the line width is small in comparison with the g-anisotropy. All these conditions are fulfilled for the experimental trace in Fig. 11. However, the absorption at g = 3.78 could not be simulated with a single Gaussian curve nor as an overlap of two. Our best analysis is the one shown in Fig. 11. The line shape of trace C was derived from the experimental spectrum of Fig. 12, lower trace.
Fig. 12 shows the experimental spectra of the cytochromes of Complex III after reduction with a low ratio of the fumarate/succinate couple. Cytochrome b-562 is largely reduced under these conditions whereas the intensity of the absorptions in the g = 3.7--3.8 region is the same as after reduction with ascorbate. The spectrum of Fig. 12A was recorded under non-saturating condi- tions. At higher microwave power, Fig. 12B, the absorptions at g = 3.44 and g = 3.71 are largely saturated. The line shape of the remaining signal, originat- ing either from cytochrome b-566 or cytochrome b-558, was used for the analysis of Fig. 11 (represented by trace C).
Quantitation of the signals o f the cytochromes. With the procedure outlined in an accompanying paper [18] the different signals were quantitated. Since the gz region of the EPR spectrum of the cytochromes is resolved into the individual components, the absolute concentration of each component can be
W
JJ
I .... , .... I .... , .... I .... , .... I .... , .... I .... , .... I .... ,,,,,[
3 .9 3 .8 3 .7 3 .6 3 .5 3 .4 3 .3
Fig. 12. Effect of microwave power on the EPR spectrum of Complex III. (A and B) Reduced with
50 mM sodium fumarate, 25 mM sodium succinate for 5 rain at 20°C. EPR conditions: (A and B): F =
9318 MHz; T, 10 K; MA, 0.63 roT. (A): P, 0.32 roW; SR, 5 roT/rain. (B): P, 200 mW; SR, 20 mT/min. Cytochrome b-562 is largely reduced, whereas the cytochromes b-566 and b-558 are fully oxidized. Trace
A is recorded under non-saturating microwave power. At high microwave power, (trace B), the reso-
nances at g = 3.441 and 3.713 become highly saturated. The line shape of the remaining signal at g =
3.785 is neither Gaussian nor can it be simulated as a sum of two Gaussian curves. This signal belongs to
either eytochrome b-566 or cytochrome b-558. See legend to Fig. 1 for the symbols used.
330
TABLE I I
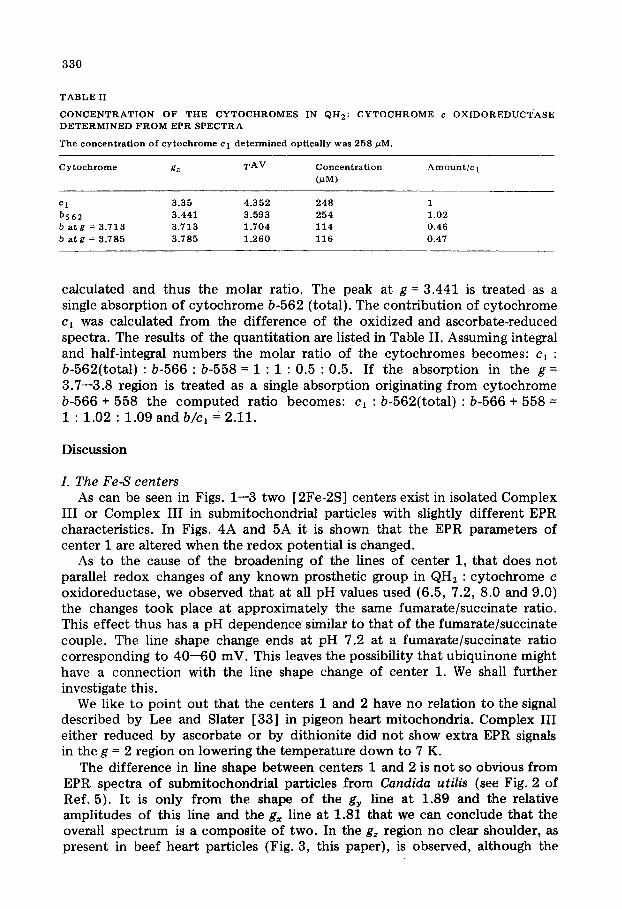
CONCENTRATION OF THE CYTOCHROMES IN QH2: CYTOCHROME c OXIDOREDUCTASE DETERMINED FROM EPR SPECTRA
T h e c o n c e n t r a t i o n o f c y t o c h r o m e c 1 d e t e r m i n e d opt ica l ly w a s 258 pM.
C y t o c h r o m e gz T A V C o n c e n t r a t i o n A m o u n t / c 1 (,uM)
c 1 3 .35 4 .352 248 1
b562 3 .441 3 .593 254 1.02
b a t g = 3 .713 3 .713 1 .704 114 0 .46 b a t g = 3 .785 3 .785 1 .260 116 0.47
calculated and thus the molar ratio. The peak at g = 3.441 is treated as a single absorption of cytochrome b-562 (total). The contribution of cytochrome cl was calculated from the difference of the oxidized and ascorbate-reduced spectra. The results of the quantitation are listed in Table II. Assuming integral and half-integral numbers the molar ratio of the cytochromes becomes: c, : b-562(total) : b-566 : b-558 = 1 : 1 : 0.5 : 0.5. If the absorption in the g = 3.7--3.8 region is treated as a single absorption originating from cytochrome b-566 + 558 the computed ratio becomes: cl : b-562(total) : b-566 + 558 = 1 : 1.02 : 1.09 and b/c1 = 2.11.
Discussion
I. The Fe-S centers As can be seen in Figs. 1--3 two [2Fe-2S] centers exist in isolated Complex
III or Complex III in submitochondrial particles with slightly different EPR characteristics. In Figs. 4A and 5A it is shown that the EPR parameters of center 1 are altered when the redox potential is changed.
As to the cause of the broadening of the lines of center 1, that does not parallel redox changes of any known prosthetic group in QH2 : cytochrome c oxidoreductase, we observed that at all pH values used (6.5, 7.2, 8.0 and 9.0) the changes took place at approximately the same fumarate/succinate ratio. This effect thus has a pH dependence similar to that of the fumarate/succinate couple. The line shape change ends at pH 7.2 at a fumarate/succinate ratio corresponding to 40--60 mV. This leaves the possibility that ubiquinone might have a connection with the line shape change of center 1. We shall further investigate this.
We like to point out that the centers 1 and 2 have no relation to the signal described by Lee and Slater [33] in pigeon heart mitochondria. Complex III either reduced by ascorbate or by dithionite did not show extra EPR signals in the g = 2 region on lowering the temperature down to 7 K.
The difference in line shape between centers 1 and 2 is not so obvious from EPR spectra of submitochondrial particles from Candida utilis (see Fig. 2 of Ref. 5). It is only from the shape of the gy line at 1.89 and the relative amplitudes of this line and the gx line at 1.81 that we can conclude that the overall spectrum is a composite of two. In the gz region no clear shoulder, as present in beef heart particles (Fig. 3, this paper), is observed, although the
331
peak is asymmetric. Therefore, we feel that the analysis of the line shape of this gz line in STFe-containing submitochondrial particles as given in Ref. 5 is mainly reflecting the hyperfine interaction of the STFe nucleus in center 1 of the b-c~ complex, showing that it is a [2Fe-2S] center. Of course the non-heme Fe analysis of Complex III [2] as well as the characteristic g values [4] of both centers strongly suggest that both are [2Fe-2S] centers.
We now also understand why a difference of an EPR spectrum of particles reduced with succinate minus that of particles reduced with ascorbate (at 60 K) does not give a proper gz line shape for center 1 of succinate dehydrogenase (see Fig. 4, Ref. 5). As shown in this paper the gz line of center 1 of the b-c~ complex broadens considerably when succinate is the reducing agent, so a difference spectrum succinate minus ascorbate will give a negative peak as is indeed found [5].
II. The stoichiometry of the prosthetic groups The EPR spectra in Figs. 9, 10 and 12 show that all the cytochromes recog-
nized in the optical spectrum of reduced Complex III are also present in the EPR spectrum of oxidized Complex III.
The absorption peak of cytochrome b-562 is probably an overlap of two signals originating from two kinds of cytochrome b-562 differing in midpoint potential.
From Figs. 11 and 12 it can be seen that the spectra in the g = 3.7--3.8 region consists of two peaks with different gz values, line widths, line shapes and power-saturation properties. Thus this supports the finding [15,16] that the optical absorptions at 558 and 566 nm belong to two different b cyto- chromes.
The assumptions made for the derivation of the formula used to quantitate the EPR signals [18] are supported by the data in this paper. The concentra- t ion of cytochrome cl Calculated by EPR corresponds very well with the opti- cally determined concentration and the b/cl ratio found in this way is in good agreement with the ratio estimated with other independent methods [34,35]. Since the EPR signal in the g = 2 region of reduced QH2 : cytochrome c oxido- reductase is a superposition of signals of two [2Fe-2S] centers, center 1 and center 2, each center in a concentration half that of cytochrome cl, we can now write the following stoichiometry of all known prosthetic groups in QH2 : cytochrome c oxidoreductase: cl : b-562(total) : b-558 : b-566 : center 1 : center 2 = 2 : 2 : I : 1 : 1 : 1. Thus cytochrome c, can no longer be used as basis for the minimum molecular weight of Complex III.
Two possibilities exist: The basic enzymic unit of QH2 : cy tochrome c oxidoreductase has a molecular weight of about 500 000, twice as musch as that of a molecule containing one cytochrome c~ molecule, or the preparation is inhomogeneous with respect to all prosthetic groups except cytochrome c,.
The first possibility is in contradiction with the results of Tzagoloff et al. [36], who determined a molecular weight of about 275 000, corrected for lipid, with the light-scattering method. The authors also found that S2o,w = 10.2 S, consistent with a sperhical molecule of a molecular weight of about 250 000, although they did not measure the diffusion coefficient and the partial specific volume.
332
The second possibility means that the preparation is a I : 1 mixture of two different kinds of Complex III, each with a molecular weight of about 250 000 and each having different optical, EPR and redox properties. The chemical properties of the two protein molecules are, however, nearly identical. The two iron-sulphur centers are then probably located on the two different protein complexes. The same situation holds for submitochondrial particles as the optical and EPR properties of the b-c~ complex in these particles are identical to those of isolated Complex III. A 1 : 1 ratio of the two kinds of QH2 : cytochrome c oxidoreductase might indicate that they have a different amino acid composition. The difference could be small though: e.g. one amino acid in an arbitrary subunit.
Studies to explain the anomalous line shape of the signal at g = 3.78 and to distinguish between a dimer as basic enzymic unit or the existence of two different kinds of QH2 : cytochrome c oxidoreductase are in progress.
Acknowledgements
We thank Prof. E.C. Slater for his valuable criticism of the manuscript. Part of this work has been supported by grants from the Netherlands Organization for the Advancement of Pure Research (Z.W.O.) under the auspices of the Netherlands Foundation for Chemical Research (S.O.N.).
References
1 Rieske, J.S., Hansen, R.E. and Zaugg, W.S. (1964) J. Biol. Chem. 239, 3017--3022 2 Rieske, J.S., Zaugg, W.S. and Hansen, R.E. (1964) J. Biol. Chem. 239, 3023--3030 3 Rieske, J.S., MacLennan, D.H. and Coleman, R. (1964) Biochem. Biophys. Res. Commun. 15, 338--
344 4 Gibson, J.F., Hall, D.O., Thornley, J.H.M. and Whatley, F.R. (1966) Proc. Natl. Acad. Sci. U.S. 56,
987--990 5 Albracht, S.P.J. and Subramanian, J. (1977) Biochim. Biophys. Acta 462, 36--48 6 Orme-Johnson, N.R., Hansen, R.E. and Beincrt, H. (1974) J. Biol. Chem. 249, 1928--1939 7 Orme-Johnson, N.R., Hansen, R.E. and Beinert, H. (1971) Biochem. Biophys. Res. Commun. 45,
871--878 8 Siedow, J.N., Power, S., De La Rosa, F.F. and Palmer, G. (1978) J. Biol. Chem. 253, 2392--2399 9 Chance, B. (1958) J. Biol. Chem. 233, 1223--1229
10 Slater, E.C. and Colpa-Boonstra, J.P. (1961) in Haematin Enzymes (Falk, J.E., Lemberg, R. and Morton, R.K., eds.), Vol. 2, pp. 575--592, Pergamon Press, London
11 Wikstr~Sm, M.K.F. (1971) in Energy Transduetion in Respirat ion and Photosynthesis (QuagliaxieUo, E., Papa, S. and Rossi, C.S., eds.), pp. 693--709, Adriatica Editrice, Bari
12 Phelps, D.C. and Crane, F.L. (1974) Biochem. Biophys. Res. Commun. 60, 576--581 13 Berden, J.A. and Opperdoes, F.R. (1972) Bioehim. Biophys. Aeta 267, 7--14 14 Sato, N., Wilson, D.F. and Chance, B. (1971) Biochim. Biophys. Acta 253, 88--97 15 Wikstr6m, M.K.F. (1971) Biochim. Biophys. Acta 253 ,332 - -345 16 Higuti, T., Mizuno, S. and Muraoka, S. (1975) Bioehim. Biophys. Acta 396, 36--47 17 Dervartanian, D.V., Albracht, S.P.J., Berden, J.A., Van Gelder, B.F. and Slater, E.C. (1973) Biochim.
Biophys. Aeta 292 ,496 - -501 18 De Vries, S. and Albracht, S.P.J. (1979) Biochim. Biophys. Acta 546 ,334 - -340 19 Wikstr6m, M.K.F. (1973) Biochim. Biophys. Aeta 301 ,155 - -193 20 Fla tmark, T. and Pedersen, J.I. (1973) Bioehim. Biophys. Acta 325, 16--28 21 De Vries, S., Albracht, S.P.J. and Leeuwerik, F.J. (1978) in Mechanisms of Oxidizing Enzymes
(Singer, T.P. and Ondarza, R.N., eds.), pp. 181--188, Elsevier/North-Holland, New York 22 Hatefi, Y., Haavik, A.G. and Jur tshuk, P. (1961) Biochim. Biophys. Acta 52, 106--118 23 L6w, H. and Vallin, I. (1963) Biochim. Biophys. Acta 69, 361--374 24 Tsou, C.L. (1952) Biochem. J. 50, 493--499 25 Berden, J.A. and Slater, E.C. (1970) Biochim. Biophys. Acta 216, 237--249
3 3 3
26 Albracht, S,P.J., Dooijewaard, G., Leeuwerik, F.J. and Van Swol, B. (1977) Biochim. Biophys. Acta 4 5 9 , 3 0 0 - - 3 1 7
27 Lundin, A. and Aasa, R. (1972) J. Magn. Res. 8, 70--73 . . o 28 Malmstrbm, B.G., Re inhammat , B. and Vanngard, T. (1970) Biochim. Biophys. Acta 205, 48--57
29 Straub, J.P. and Colpa-Boonstra, J.P. (1962) Biochim. Biophys. Acta 60, 650--652 30 Urban, P.F. and Klingenberg, M. (1969) Eur. J. Biochem. 9, 519--525 31 Diebler, V.H., Eigen, M. and Matthies, P. (1961) Z. Naturforseh. 16B, 629--637 32 Fritz, J., Anderson, R., Fee, J., Palmer, G., Sands, R.H., Tsibris, J.C.M., Gunsalus, I.C., Orme-
Johnson, W,H. and Beinert, H. (1971) Biochim. Biophys. Acta 253, 110--133 33 Lee, I.-Y. and Slater, E.C. (1974) Biochim. Biophys. Acta 347, 14--21 34 Rieske, J.S. (1976) Biochim. Biophys. Acta 456, 195--247 35 Marres, C.A.M. and. Slater, E.C. (1977) Biochim. Biophys. Aeta 462, 531--548 36 Tzagaloff, A., Yang, P.C., Wharton, D.C. and Rieske, J.S. (1965) Biochim. Biophys. Aeta 96, 1--8