the multiple vortex nature of tropical cyclogenesis
TRANSCRIPT
THE MULTIPLE VORTEX NATURE OF TROPICAL CYCLOGENESIS
A Thesis
by
JASON ALLEN SIPPEL
Submitted to the Office of Graduate Studies of
Texas A&M University in partial fulfillment of the requirements for the degree of
MASTER OF SCIENCE
December 2004
Major Subject: Atmospheric Sciences
THE MULTIPLE VORTEX NATURE OF TROPICAL CYCLOGENESIS
A Thesis
by
JASON ALLEN SIPPEL
Submitted to the Office of Graduate Studies of Texas A&M University
in partial fulfillment of the requirements for the degree of
MASTER OF SCIENCE
Approved as to style and content by: __________________________ Richard Orville (Head of Department) __________________________ __________________________ John Nielsen-Gammon Craig Epifanio (Chair of Committee) (Member) __________________________ __________________________ Fuqing Zhang Hongxing Liu (Member) (Member)
December 2004
Major Subject: Atmospheric Sciences

iii
ABSTRACT
The Multiple Vortex Nature of Tropical Cyclogenesis. (December 2004)
Jason Allen Sippel, B.S., Texas A&M University
Chair of Advisory Committee: Dr. John Nielsen-Gammon
This thesis contains an observational analysis of the genesis of Tropical Storm
Allison (2001). Using a paradigm of tropical cyclone formation as the superposition of
potential vorticity (PV) anomalies, the importance of different scales of PV merger to
various aspects of Allison’s formation is discussed. While only the case of Allison is
discussed in great detail, other studies have also documented PV superposition on
various scales, and superposition could be important for most tropical cyclones.
Preceding Allison’s genesis, PV superposition on the large scale destabilized the
atmosphere and increased low-level cyclonic vorticity. This presented a more favorable
environment for the formation of MCV-type PV anomalies and smaller, surface-based,
meso-β-scale vortices. Although these vortices eventually merged to form a more
concentrated vortex with stronger surface pressure gradients, the merger happened well
after landfall of Allison and no strengthening ensued.
The unstable, vorticity-rich environment was also favorable for the development
of even smaller, meso-γ-scale vortices that accompanied deep convective cells within
one of Allison’s meso-β-scale vortices. The observations herein suggest that the meso-γ-
scale convective cells and vortices are the respective source of PV production and
building blocks for the meso-β-scale vortices.
iv
Finally, this thesis discusses issues related to the multiple vortex nature of
tropical cyclone formation. For instance, the tracking of developing tropical cyclones is
greatly complicated by the presence of multiple vortices. For these cases, the paradigm
of a single cyclone center is inappropriate and alternative tracking methods are
introduced.

v
ACKNOWLEDGEMENTS
The author would like to thank John Nielsen-Gammon of Texas A&M University
and Steve Allen of the Houston/Galveston National Weather Service Forecast Office.
vi
TABLE OF CONTENTS
Page ABSTRACT……………………………………………………………………. iii ACKNOWLEDGEMENTS…………………………………………………..... v TABLE OF CONTENTS……………………………………………………..... vi LIST OF FIGURES…………………………………………………………….. vii LIST OF TABLES……………………………………………………………… ix 1. INTRODUCTION…………………………………………………………… 1 2. BACKGROUND…………………………………………………………….. 6 3. SYSTEM EVOLUTION…………………………………………………...... 14 a. Synoptic and meso-α scales………………………………………….. 14 b. Meso-β-scale vortices………………………………………………... 18 c. Meso-γ-scale vortices……………………………………………....... 24 4. DISCUSSION…………………………………………….………………….. 32 a. Other cases and forecasting issues…...………………………………. 32 b. Hot towers and vortical hot towers…………………………………... 33 c. Commonality of meso-β- and meso-γ- scale vortices………………... 34 5. CONCLUSION………………………………………………….…………… 36 REFERENCES………………………………………………………………..... 40 VITA…………………………………………………………………………..... 42
vii
LIST OF FIGURES FIGURE Page
1 ETA analyses of 300 hPa and 850 hPa heights and winds for 0000 UTC and 1200 UTC 5 June…………………………....... 7 2 Soundings from Corpus Christi (CRP) and Brownsville (BRO) from 0000 UTC 4 and 5 June……………………….. 8
3 GOES 8 IR image of Allison's initial convective burst and ongoing MCSs at 0845 UTC 5 June.………………………....... 9 4 Mesoscale surface analyses for a) 0000 UTC, b) 0200 UTC, and c) 0600 UTC on 6 June……...……………….………….. 11 5 League City Doppler radar images from a) 0000 UTC, b) 0200 UTC, and c) 0600 UTC 6 June……………………………. 12 6 0000 UTC and 1200 UTC 5 June ETA analysis of average potential vorticity in 100 mb layers and height fields. ……………………………………………………………... 15
7 GOES 8 IR image of Allison at 1145 UTC 5 June……………………….. 16 8 KHGX Doppler radar image from 1202 UTC 5 June..……........................ 16 9 League City base velocity at 1913 UTC 5 June………………………….. 17 10 Overlay of GOES 8 IR and visible images from 1915 UTC 5 June.………………………………………………………… 17 11 An analysis of A and B via: a) radar and satellite estimated tracks the vortices; b) position of B relative to A; and c) distance between the two
vortices.…………………………………………………………………… 20 12 Flight level (~250 m) wind analysis..………………………….................. 21 13 League City Doppler velocity and reflectivity images from 5 June.. …………………....................................................... 23 14 Tracks of all meso-γ-scale vortices relative to meso- β-scale center A (represented by star) that formed between 1830 and 1930 UTC 5 June.……………………………………. 25
viii
FIGURE Page
15 The growth and development of A' as seen in League City Doppler velocity and reflectivity images from 5 June.……………………………………………………… 27 16 Vortex A' and associated meso-γ vortices at 2219 UTC 5 June.……………………………………………………………………. 29
ix
LIST OF TABLES
TABLE Page
1 Potential tracking methods with advantages and drawbacks for each……………………………………………………..... 38
1
1. INTRODUCTION
Forecasts of the timing and details of tropical cyclone formation have fallen far
behind those of tropical cyclone intensity and position during the past 50 years. Track
forecasts have improved considerably during this period, and while intensity forecast
skill has lagged somewhat (DeMaria and Gross 2003), cyclogenesis forecasts have
proven to be more difficult. Although the scientific and operational communities now
understand which environments are favorable for tropical cyclone formation, they are
still unable to accurately forecast the evolution from a tropical disturbance to a tropical
cyclone (Emanuel, 2003). The most obvious reason for this is has been the lack of
understanding of tropical cyclogenesis. Air-sea instability theory (Emanuel 1986;
Rotunno and Emanuel 1987) has been accepted as the leading theory for cyclone
maintenance and intensification (Craig and Gray 1996), but it relies on the presence of
an initial finite-amplitude vortex (Rotunno and Emanuel 1987; Emanuel 1989) and gives
no indication how such a vortex arises from a tropical disturbance.
Recent observational and numerical studies have shed light on the initial stages
of tropical cyclogenesis in a variety of environments, suggesting that vortex merger on a
variety of scales plays an important role in the cyclogenesis process. From the potential
vorticity (PV) point of view (Hoskins et al. 1985), the horizontal or vertical
superposition of PV anomalies of the same sign will strengthen, deepen, and widen the
circulation associated with both anomalies. If the resulting circulation is able to reach
the surface with sufficient intensity, then the initial disturbance requirement of air-sea
This thesis follows the style of Monthly Weather Review.
2
interaction can be met. Furthermore, cumulus convection tends to redistribute PV
downwards (Raymond and Jiang, 1990), and surface-based convection can thereby
enhance surface vortex formation. If sustained convection develops within a large
reservoir of mid- or upper-level PV, there is enhanced potential to create a low-level
disturbance of sufficient amplitude for air-sea interaction to commence.
Both horizontal and vertical PV superposition seem to be at work in the monsoon
environment of the west Pacific where much of the observational work into the early
stages of tropical cyclogenesis has been concentrated. Simpson et al. (1997) discuss a
case where two tropical mesoscale convective systems (MCSs) and their embedded PV
anomalies (mesoscale convective vortices, or MCVs) merge, resulting in a tropical
cyclone. Meanwhile, during the formation of Typhoon Irving (1992) in the West Pacific
(Ritchie and Holland 1997) the interactions between multiple MCVs and a tropical
upper-tropospheric trough (TUTT) led to tropical cyclogenesis over a period of about a
week. A tropical depression emerged only after convection associated with the TUTT
redistributed its PV to the surface and enhanced the circulation of the merged MCVs.
Multi-scale vortex superposition also played an important role in the
development of Typhoon Robyn (1993). In this case, Harr et al. (1996) document the
formation and decay of several MCSs within a larger-scale monsoon depression. As one
MCS developed within the depression, its associated PV anomaly superposed onto the
larger-scale PV anomaly and the larger-scale circulation center shifted towards the
position of the MCS. This MCS decayed but was followed another MCS that formed
near the 700 hPa circulation center. The authors hypothesized that the formation of this
3
second MCS eventually contributed to the formation of the tropical depression. In this
scenario, superposition of PV from the two MCSs onto the larger-scale PV structure
helped create a surface vortex of tropical depression strength.
Vortex merger on the mesoscale is important for at least some cases of tropical
cyclogenesis in the Atlantic and Pacific. For example, Hendricks et al. (2004) used a 3
km MM5 simulation to infer a two-phase evolution during the genesis of Hurricane
Diana (1984). During the first phase, intense convective bursts generate multiple small-
scale PV anomalies, and during the second stage multiple mergers of these vortices lead
to larger-scale momentum spin-up. Supporting the idea that small-scale vortices can
merge and act as PV building blocks for tropical cyclones is an observational analysis of
the formation of Tropical Cyclone Ed (1993) near Guam (Stewart and Lyons 1996). The
cyclone’s nascent eyewall absorbed a series of convective scale vortices that were strong
enough to trip the mesocyclone algorithm of the Guam WSR-88D. Their absorption into
the eyewall directly preceded the rapid intensification of the cyclone. Multiple
mesoscale vortices are also frequently noted by the Tropical Prediction Center (TPC).
Published cases of such vortices in the Atlantic include Isabel (1958) (Stossmeister and
Barnes 1992) and Gustav (2002) (Hendricks et al. 2004).
Although convective- and larger-scale superposition has not previously been
documented to occur simultaneously, there appears to be no reason why this should not
occur. For example, the disturbance that preceded Hurricane Diana (1984) originally
deepened as a moist baroclinic cyclone when an upper-level PV anomaly approached a
stalled surface front (Davis and Bosart 2001). In this case, the modest baroclinic
4
strengthening had an effect similar to large-scale PV superposition by strengthening the
low-level vorticity. It also helped to focus convection along the front near the low-level
vortex. These factors were crucial for the rapid development of stronger surface PV
anomaly. With ample deep convection, the enhanced low-level vorticity primed the
environment for the small-scale PV anomalies that merged to build the cyclone in the
Hendricks et al. (2004) simulation.
The goal of this study is to consider tropical cyclogenesis and intensification as a
multiscale superposition of PV anomalies. Although synoptic scale superposition does
not directly lead to a tropical cyclone scale vortex, it can enhance low-level vorticity and
destabilize the atmosphere by cooling the middle and upper troposphere while enhancing
surface fluxes. Such large scale superposition is not essential; in other instances a single
PV anomaly or tropical wave can instigate sufficient deep convection such that PV
redistribution enhances low-level vorticity and surface fluxes. The MCV-type PV
anomalies that form with episodes of deep convection might also merge and produce
similar low-level effects.
In any case, the enhanced vorticity and decreased stability which favor tropical
cyclogenesis in a climatological sense (Gray 1968; McBride and Zehr 1981) serve as an
atmospheric primer for the convective development of small mesoscale PV features.
These features can then merge and act as the actual building blocks of tropical cyclones.
This type of merger can be an important strengthening and organization mechanism even
when the winds are well above tropical storm strength (e.g., strengths at which air-sea
interaction instability is thought to be the main contributor to storm intensification).
5
While the details of each individual event will differ, this seems to be the pattern that
many cases follow.
In the current study, this paradigm will be used to investigate the genesis of
Tropical Storm Allison (2001). Allison made landfall along the upper Texas coast in
June 2001 and is typical of many Gulf of Mexico tropical cyclogenesis events. The
storm is an excellent candidate for such a study because its formation occurred
completely within range of the KHGX (Houston/Galveston National Weather Service
Office) WSR-88D and because the storm made landfall in a dense surface observation
network.
Information about synoptic background associated with Allison and a general
description of the storm itself can be found in Section 2 of this paper. In Section 3,
detail is given on the evolution of the storm along with observational evidence for
multiple vortices and vortex merger. Section 4 contains a discussion of various issues
related to mesoscale vortices. In addition to concluding remarks, Section 5 gives
attention to the applicability of this new paradigm to the operational community. Its use
can greatly facilitate the tracking of developing tropical cyclones; alternative tracking
methods and their caveats will be presented.
6
2. BACKGROUND
The thermodynamic environment that preceded Allison’s development was
typical of that associated with a weak upper level positive PV disturbance in that
location and time of year. Substantial convective instability marked the synoptic scale
as the return flow on the west side of an East Coast anticyclone pushed a tropical
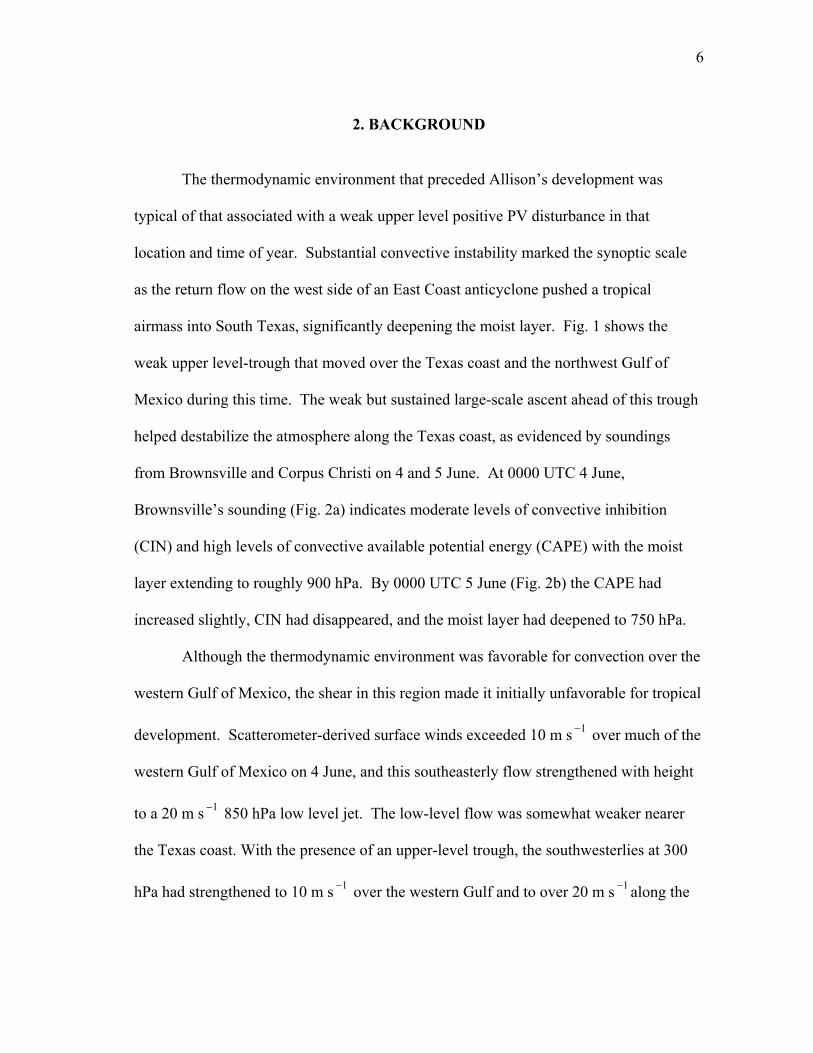
airmass into South Texas, significantly deepening the moist layer. Fig. 1 shows the
weak upper level-trough that moved over the Texas coast and the northwest Gulf of
Mexico during this time. The weak but sustained large-scale ascent ahead of this trough
helped destabilize the atmosphere along the Texas coast, as evidenced by soundings
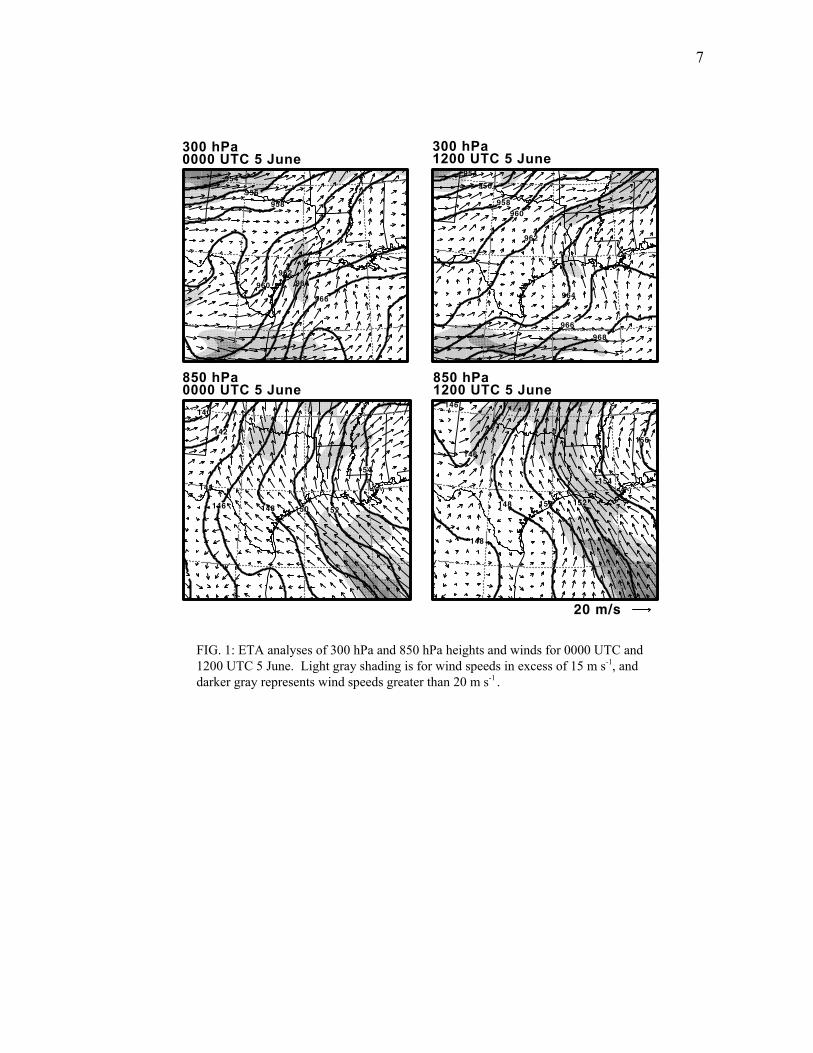
from Brownsville and Corpus Christi on 4 and 5 June. At 0000 UTC 4 June,
Brownsville’s sounding (Fig. 2a) indicates moderate levels of convective inhibition
(CIN) and high levels of convective available potential energy (CAPE) with the moist
layer extending to roughly 900 hPa. By 0000 UTC 5 June (Fig. 2b) the CAPE had
increased slightly, CIN had disappeared, and the moist layer had deepened to 750 hPa.
Although the thermodynamic environment was favorable for convection over the
western Gulf of Mexico, the shear in this region made it initially unfavorable for tropical
development. Scatterometer-derived surface winds exceeded 10 m s over much of the
western Gulf of Mexico on 4 June, and this southeasterly flow strengthened with height
to a 20 m s 850 hPa low level jet. The low-level flow was somewhat weaker nearer
the Texas coast. With the presence of an upper-level trough, the southwesterlies at 300
hPa had strengthened to 10 m s
1−
1−
1− over the western Gulf and to over 20 m s − along the 1
7
FIG. 1: ETA analyses of 300 hPa and 850 hPa heights and winds for 0000 UTC and 1200 UTC 5 June. Light gray shading is for wind speeds in excess of 15 m s , and darker gray represents wind speeds greater than 20 m s
-1
-1 .
954956
958960
962
964
966968
954
956958
960
962964
966
140
142
144
146 148 150 152
154
300 hPa0000 UTC 5 June
300 hPa1200 UTC 5 June
850 hPa0000 UTC 5 June
850 hPa1200 UTC 5 June
20 m/s
146
146
148
148
150 152
154
156
8
FIG. 2: Soundings from Corpus Christi (CRP) and Brownsville (BRO) from 0000 UTC 4 and 5 June. Dew point is shaded in solid green, temperature in red, and the lifted surface-based parcel trajectory in blue dash-dot.
CRP 010604/0000
1000
850
700
500
300
200
100
-30 -20 -10 0
CRP 010605/0000
1000
850
700
500
300
200
100
-30 -20 -10 0 10 20 30 40 50MSL km
012345678910
11
12
13
14
15
16
1000
850
700
500
300
200
100 BRO 010605/0000
1000
850
700
500
300
200
100
-30 -20 -10 0 10 20 30 40 50MSL km
012345678910
11
12
13
14
15
16 BRO 010604/0000
-30 -20 -10 0 10 20 30 40 50
10 20 30 40 50
-103
-84
-65
-46
-27
-18
3
13
23
33
43
53
1
2
3
ºC
9
Texas coast. This implies zonal wind shear over the entire western Gulf of about 20 m
s , which is unfavorable for tropical development (DeMaria et al. 2001). However, by
1200 UTC 5 June the upper level trough had become reoriented such that weak winds in
its axis and southeasterly winds downstream of it were directly over the area of strong
surface winds. This is important because the surface winds likely played a critical role
in developing a moist boundary layer and destabilizing the atmosphere by inducing
intense oceanic surface fluxes. Thus, the shear substantially decreased over an area of
high surface fluxes, which is where Allison formed.
-1
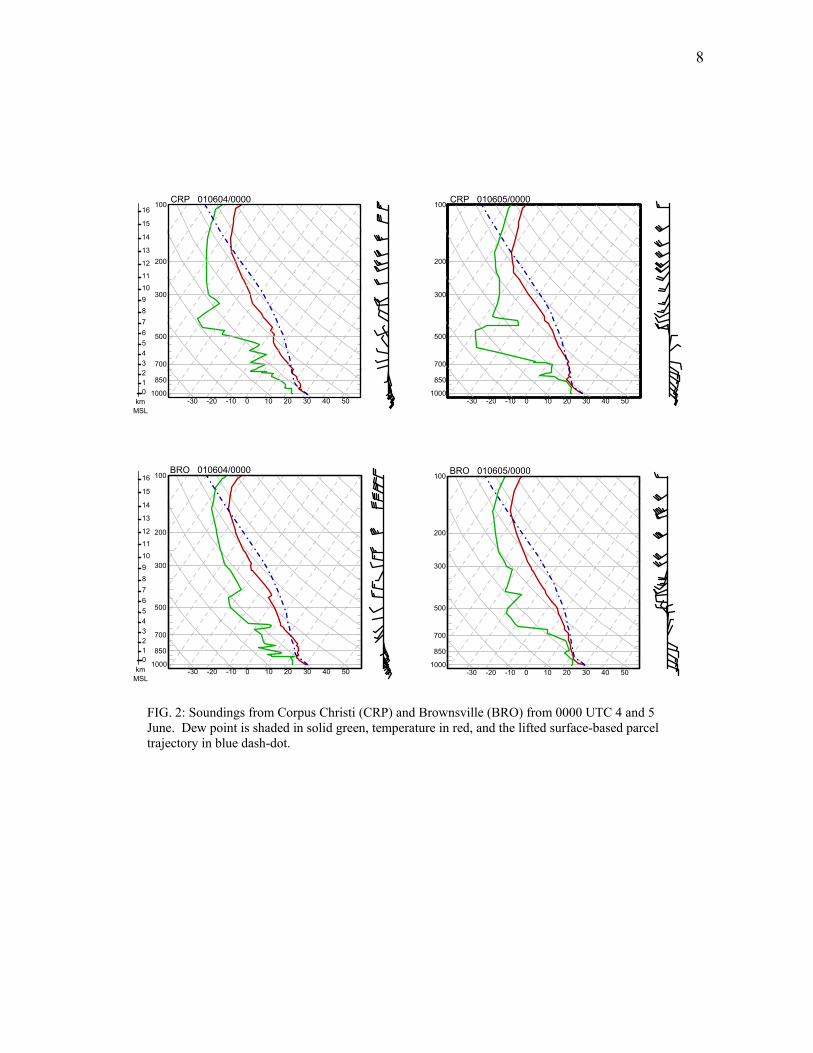
FIG. 3: GOES 8 IR image of Allison's initial convective burst and ongoing MCSs at 0845 UTC 5 June. Each number represents a distinct MCS, and the two bold circles denote the two convective areas in which vortices A and B developed.
10
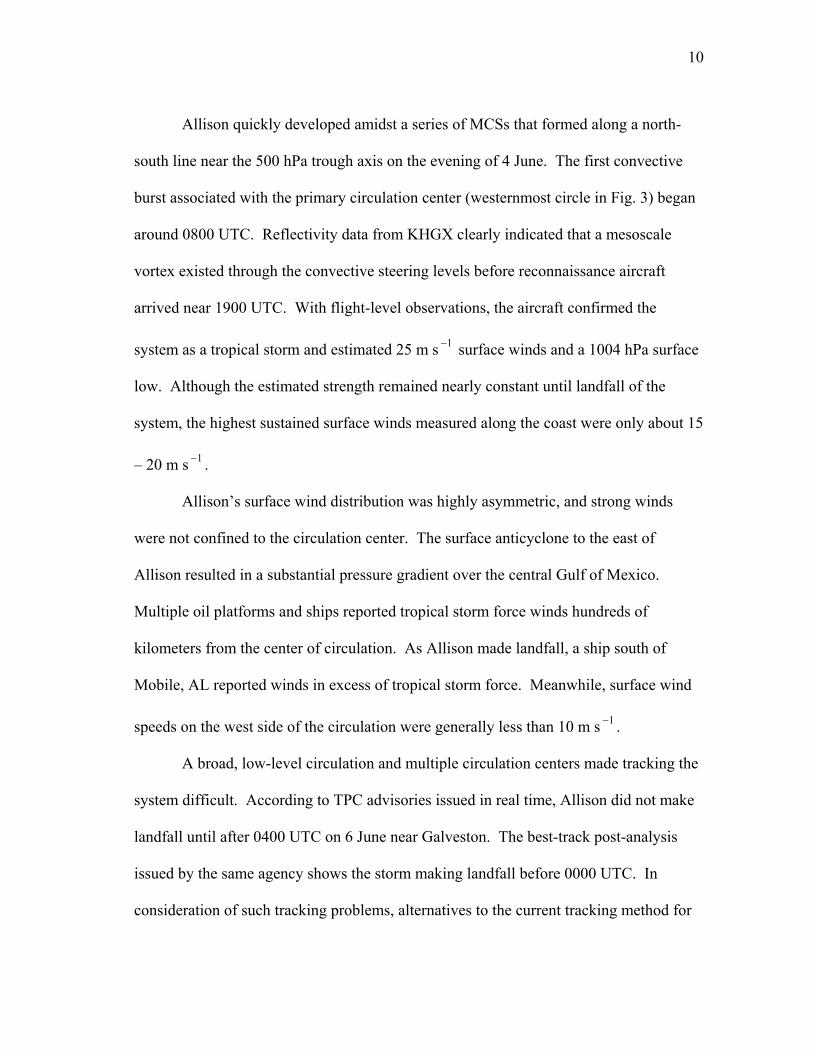
Allison quickly developed amidst a series of MCSs that formed along a north-
south line near the 500 hPa trough axis on the evening of 4 June. The first convective
burst associated with the primary circulation center (westernmost circle in Fig. 3) began
around 0800 UTC. Reflectivity data from KHGX clearly indicated that a mesoscale
vortex existed through the convective steering levels before reconnaissance aircraft
arrived near 1900 UTC. With flight-level observations, the aircraft confirmed the
system as a tropical storm and estimated 25 m s 1− surface winds and a 1004 hPa surface
low. Although the estimated strength remained nearly constant until landfall of the
system, the highest sustained surface winds measured along the coast were only about 15
– 20 m s . 1−
Allison’s surface wind distribution was highly asymmetric, and strong winds
were not confined to the circulation center. The surface anticyclone to the east of
Allison resulted in a substantial pressure gradient over the central Gulf of Mexico.
Multiple oil platforms and ships reported tropical storm force winds hundreds of
kilometers from the center of circulation. As Allison made landfall, a ship south of
Mobile, AL reported winds in excess of tropical storm force. Meanwhile, surface wind
speeds on the west side of the circulation were generally less than 10 m s . 1−
A broad, low-level circulation and multiple circulation centers made tracking the
system difficult. According to TPC advisories issued in real time, Allison did not make
landfall until after 0400 UTC on 6 June near Galveston. The best-track post-analysis
issued by the same agency shows the storm making landfall before 0000 UTC. In
consideration of such tracking problems, alternatives to the current tracking method for
11
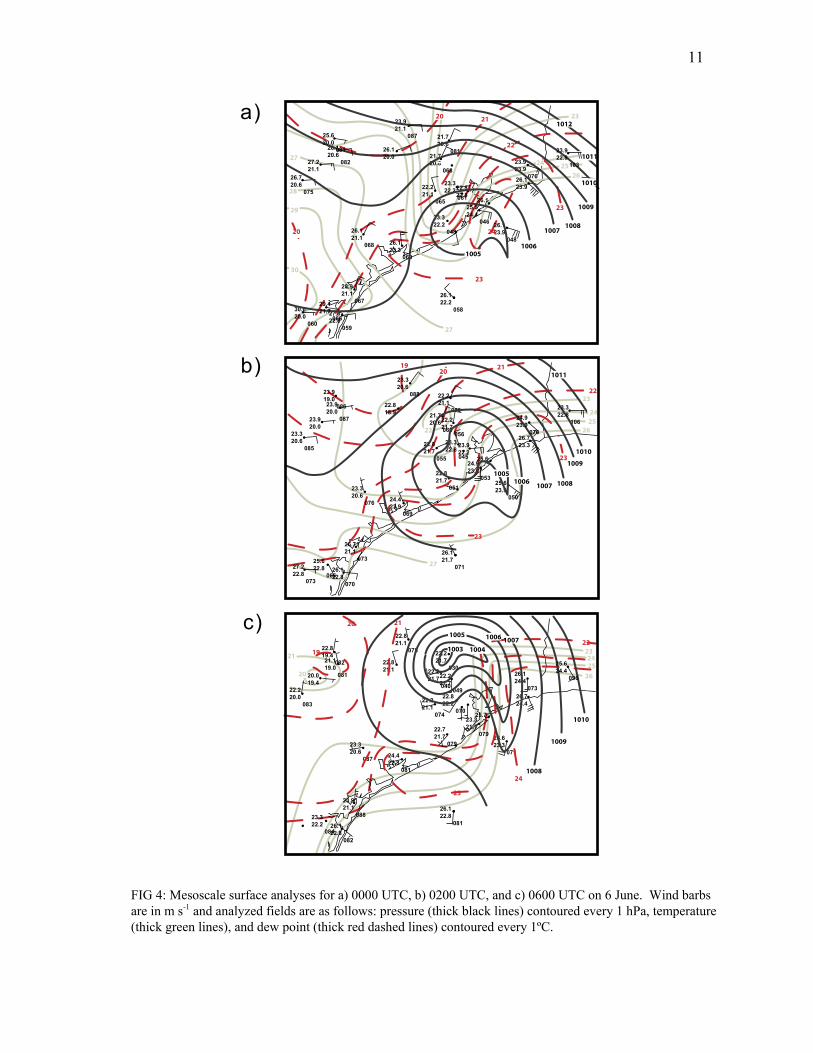
FIG 4: Mesoscale surface analyses for a) 0000 UTC, b) 0200 UTC, and c) 0600 UTC on 6 June. Wind barbs are in m s and analyzed fields are as follows: pressure (thick black lines) contoured every 1 hPa, temperature (thick green lines), and dew point (thick red dashed lines) contoured every 1ºC.
-1
23.923.9 076
23.322.2 061
26.123.3 060
26.123.9 048
26.122.2 058
21.720.6 068
21.720.6 081
23.921.1 087
26.120.6 08227.2
21.1 26.720.6 075
27.822.8 059
30.620.0 060
1006
10071008
1009
1011
27
26
24
23
2527
28
29
3023
24
22
23
2120
20
1010
1012
26.120.0
25.620.0 081
25.524.4 046
23.322.2 048
22.221.1 065
28.921.1 067
26.121.1 068
22.822.8
1005
29.421.7 066
26.123.9
26.1
23.922.8 103
24.423.9 069
26.121.7 071
22.221.1 070
23.320.6 088
23.920.0
23.320.6 085
26.122.8 070
27.222.8 073
23.322.8 106
27
26
2425
23
22
23
2120 1011
22.818.9
24.923.37 053
22.821.7 051
22.821.7 055
26.721.1 073
23.320.6 076
24.923.9 076
19
1010
1009
10081007
22.221.7 056
21.720.6 060
23.922.2
25.6
26.723.3
25.623.9 050
25.622.8 066
2323.920.0 087
23.919.0 086
23.322.8 045
22
10051006
22.221.7 040
22.221.7 030
22.221.7 049
20.019.4
22.721.7 079
24.422.8 081
26.122.8 081
22.821.1 075
22.220.0 083
25
23
22
2120
22.821.1
23.321.7 079
22.221.1 074
23.320.6 087
26.124.4 073
19
1010
1009
25.7
26.724.4
23.322.2 084
23
26.122.8 082
22.822.2 070
1008
1003
26
26.623.3 071
23.921.1 088
241004
21.119.0 081
22.819.4 082
24
21
1005 1006 1007
20
25.624.4 096
a)
b)
c)
12
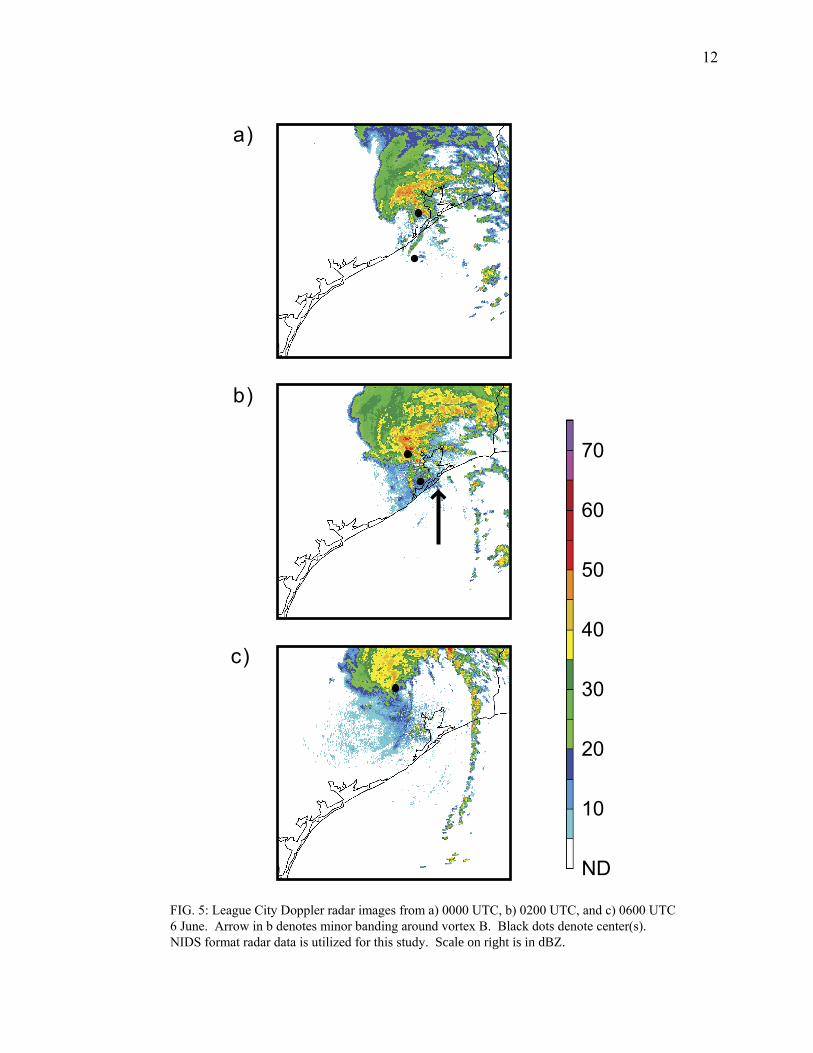
FIG. 5: League City Doppler radar images from a) 0000 UTC, b) 0200 UTC, and c) 0600 UTC 6 June. Arrow in b denotes minor banding around vortex B. Black dots denote center(s). NIDS format radar data is utilized for this study. Scale on right is in dBZ.
70
60
50
40
30
20
10
ND
a)
b)
c)
13
developing tropical cyclones will be discussed later in this study.
Mesoscale analyses of Allison during her landfall reveal the development an
interesting frontal structure with the system in the absence of any synoptic-scale
baroclinic zone. During the hours before the storm made landfall, a substantial cold pool
associated with precipitation that preceded Allison’s landfall formed just inland over
Southeast Texas. The mesoscale analyses shown in Fig. 4 show the development of
surface fronts with cross-frontal temperature differences of about 4ºC as the circulation
began to interact with the cold pool. The structure quickly evolved into something
reminiscent of an occluded mid-latitude cyclone, with the surface low connected to the
frontal features by only a pressure trough.
Fig. 5 shows the response of the precipitation distribution to this structure. All
convective precipitation near the center gradually vanished as a rainband just east of the
leading edge of the cold pool became the focus for convection. Meanwhile, a large area
of stratiform precipitation formed north of the effective warm front. The limited amount
of surface data available over eastern Texas indicates that the frontal structure remained
through at least 1200 UTC 6 June.
14
3. SYSTEM EVOLUTION a. Synoptic and meso-α scales
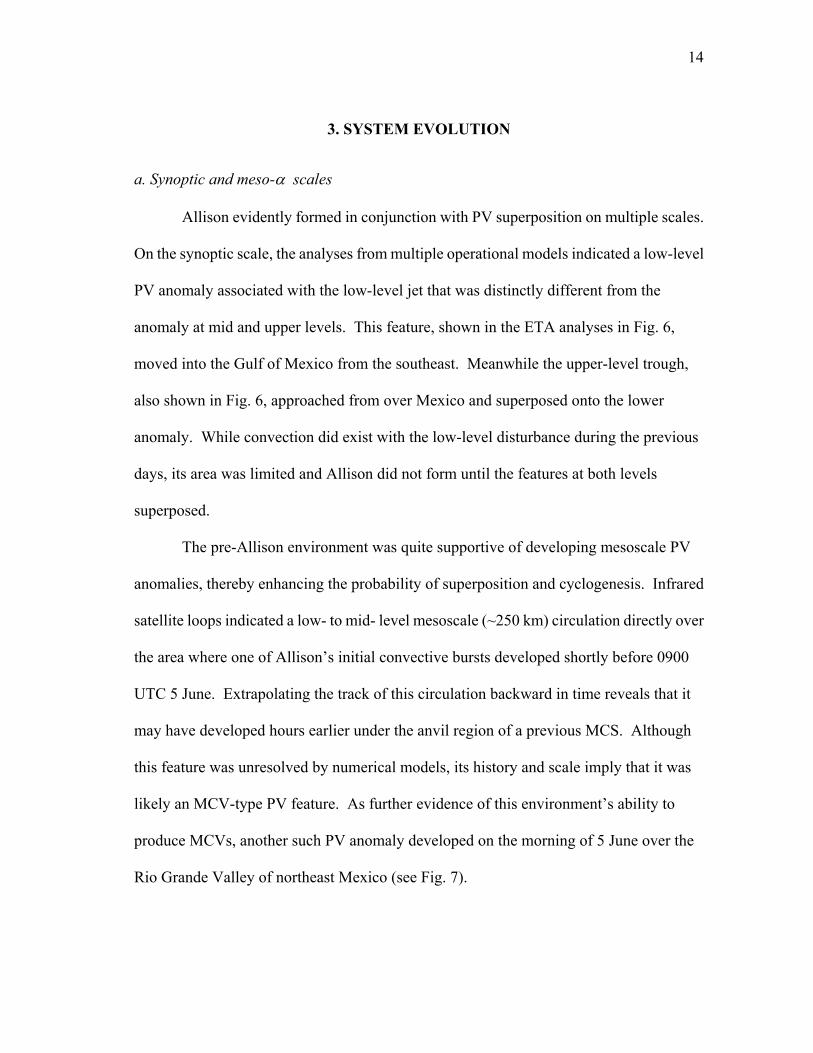
Allison evidently formed in conjunction with PV superposition on multiple scales.
On the synoptic scale, the analyses from multiple operational models indicated a low-level
PV anomaly associated with the low-level jet that was distinctly different from the
anomaly at mid and upper levels. This feature, shown in the ETA analyses in Fig. 6,
moved into the Gulf of Mexico from the southeast. Meanwhile the upper-level trough,
also shown in Fig. 6, approached from over Mexico and superposed onto the lower
anomaly. While convection did exist with the low-level disturbance during the previous
days, its area was limited and Allison did not form until the features at both levels
superposed.
The pre-Allison environment was quite supportive of developing mesoscale PV
anomalies, thereby enhancing the probability of superposition and cyclogenesis. Infrared
satellite loops indicated a low- to mid- level mesoscale (~250 km) circulation directly over
the area where one of Allison’s initial convective bursts developed shortly before 0900
UTC 5 June. Extrapolating the track of this circulation backward in time reveals that it
may have developed hours earlier under the anvil region of a previous MCS. Although
this feature was unresolved by numerical models, its history and scale imply that it was
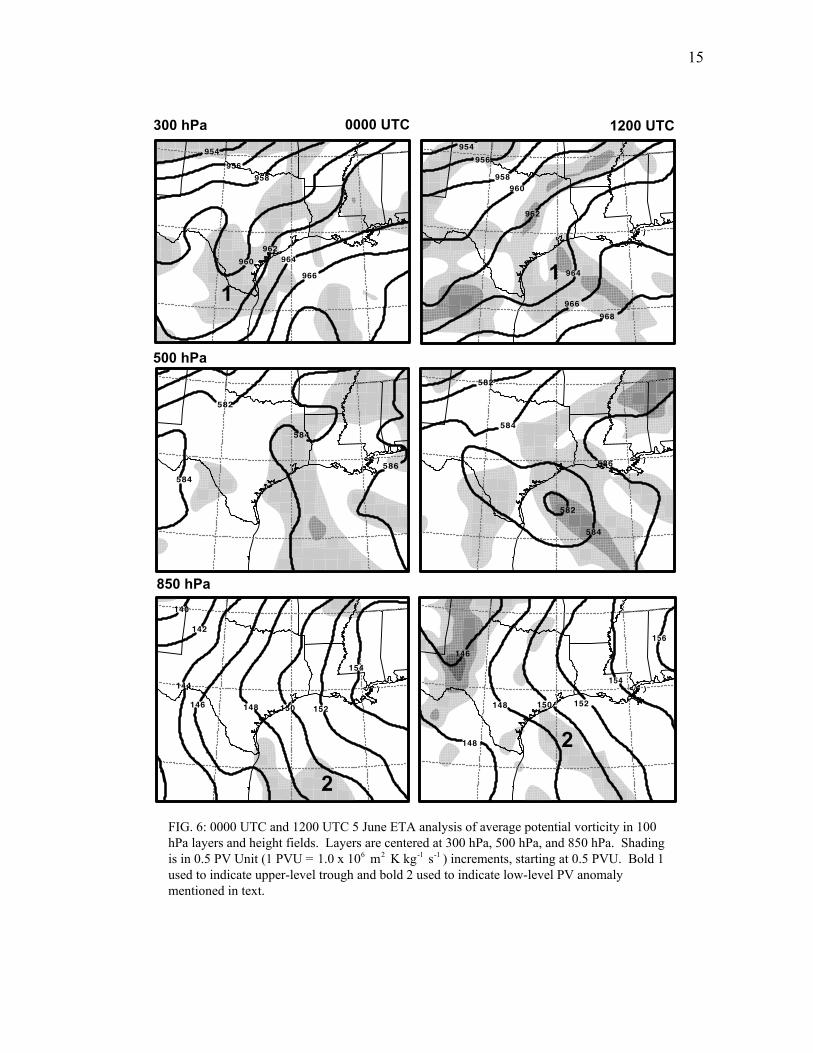
likely an MCV-type PV feature. As further evidence of this environment’s ability to
produce MCVs, another such PV anomaly developed on the morning of 5 June over the
Rio Grande Valley of northeast Mexico (see Fig. 7).
300 hPa
500 hPa
850 hPa
0000 UTC 1200 UTC954
956
958960
962
964
966968
954
956958
960
962964
966
140
142
144
146 148 150 152
154
146
148
148
150 152
154
156
582
584
584
586
582
582
584
584
586
11
2
2
15
FIG. 6: 0000 UTC and 1200 UTC 5 June ETA analysis of average potential vorticity in 100 hPa layers and height fields. Layers are centered at 300 hPa, 500 hPa, and 850 hPa. Shading is in 0.5 PV Unit (1 PVU = 1 ) increments, starting at 0.5 PVU. Bold 1 used to indicate upper-level trough and bold 2 used to indicate low-level PV anomaly mentioned in text.
6 2 -1 -1.0 x 10 m K kg s
-103
-84
-65
-46
-27
-18
3
13
23
33
43
53
AB
MCV
ºC
16
FIG. 7: GOES 8 IR image of Allison at 1145 UTC 5 June. The colder cloud-top temperatures are coincident with the stronger reflectivity values in Fig. 8. The cold cloud tops near A and B are coincident with the primary and secondary circulation centers and the white arrow denotes the general area of a remnant MCV over Mexico.
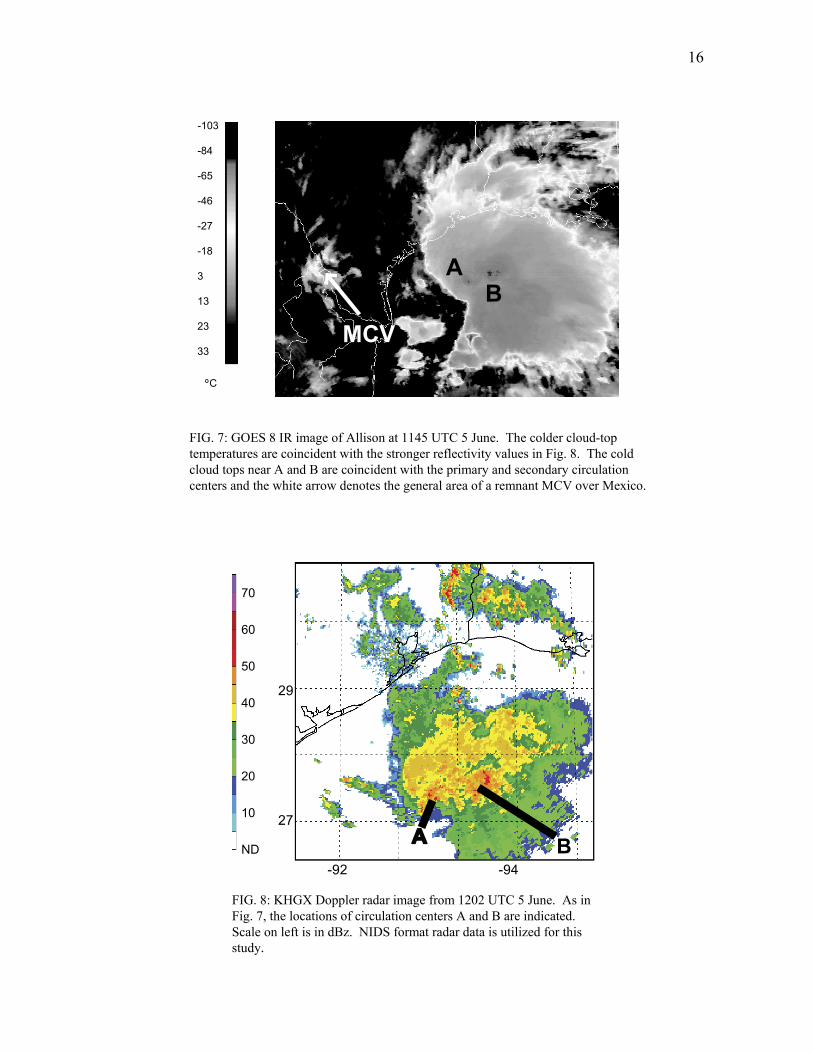
FIG. 8: KHGX Doppler radar image from 1202 UTC 5 June. As in Fig. 7, the locations of circulation centers A and B are indicated. Scale on left is in dBz. NIDS format radar data is utilized for this study.
A B
29
27
-92 -94
70
60
50
40
30
20
10
ND
29.5
29.0
-95.0 -94.5
RF+32+25+18+13+10+050-5-10-13-18-25-32ND
17
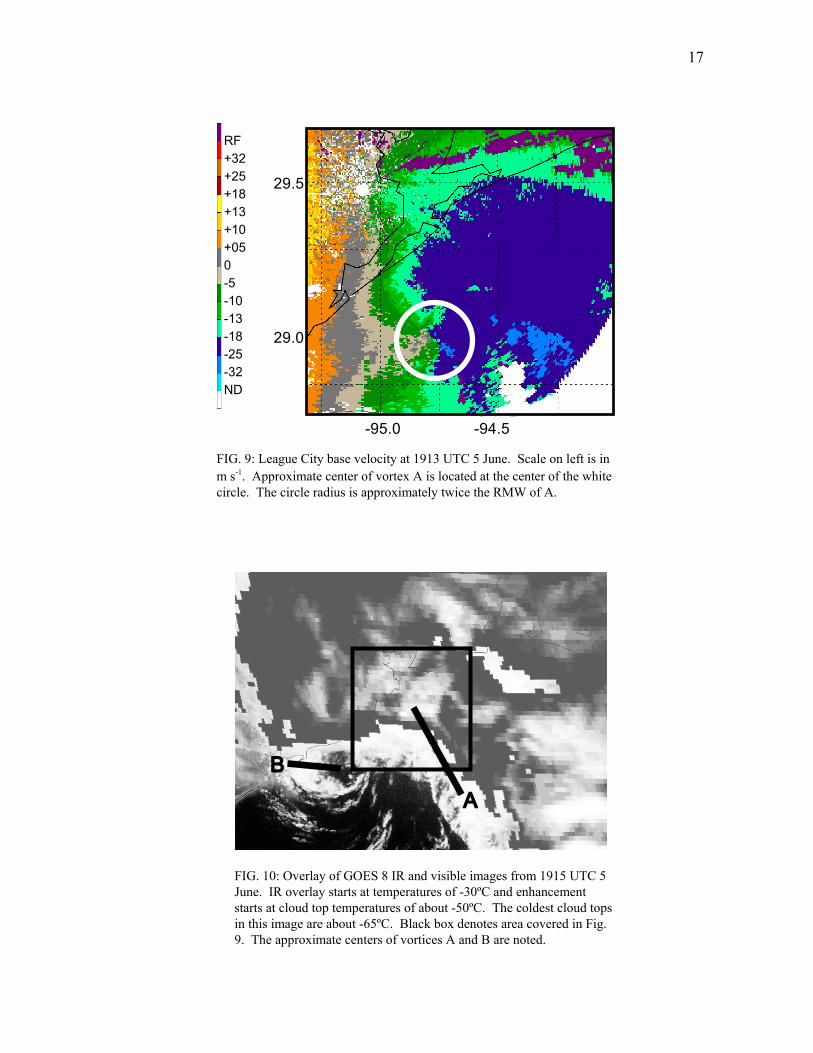
FIG. 9: League City base velocity at 1913 UTC 5 June. Scale on left is in m s . Approximate center of vortex A is located at the center of the white circle. The circle radius is approximately twice the RMW of A.
-1
B
A
FIG. 10: Overlay of GOES 8 IR and visible images from 1915 UTC 5 June. IR overlay starts at temperatures of -30ºC and enhancement starts at cloud top temperatures of about -50ºC. The coldest cloud tops in this image are about -65ºC. Black box denotes area covered in Fig. 9. The approximate centers of vortices A and B are noted.
18
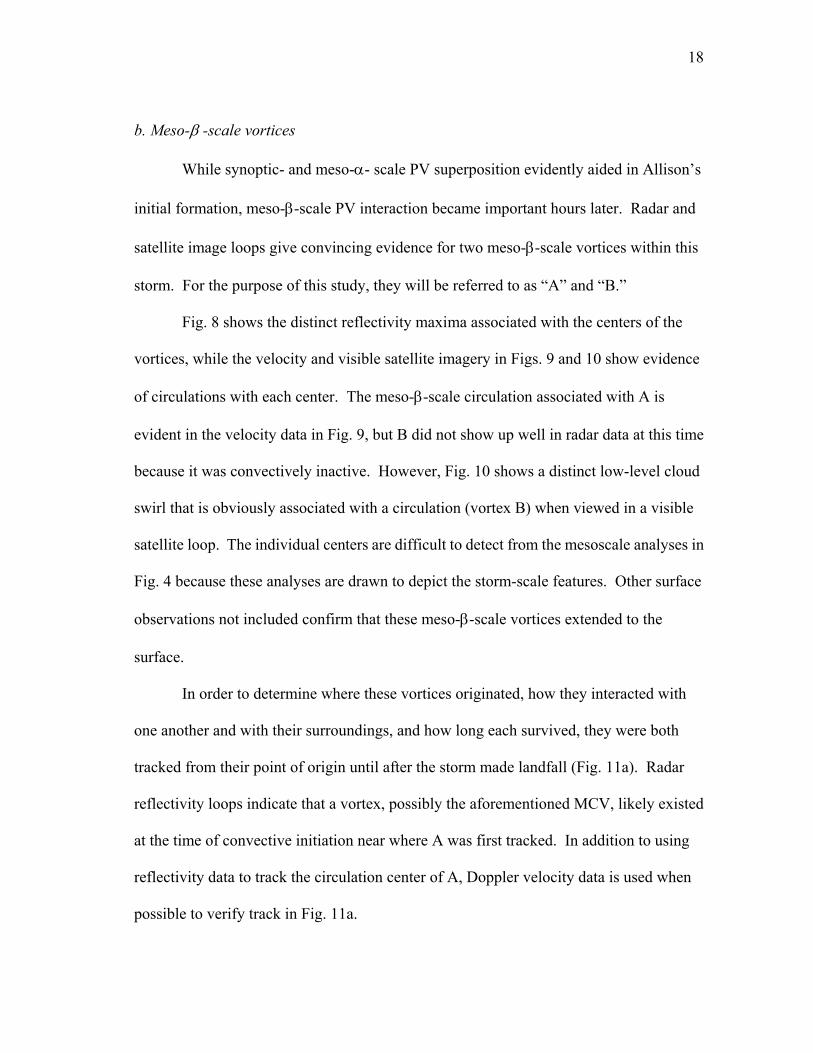
b. Meso-β -scale vortices
While synoptic- and meso-α- scale PV superposition evidently aided in Allison’s
initial formation, meso-β-scale PV interaction became important hours later. Radar and
satellite image loops give convincing evidence for two meso-β-scale vortices within this
storm. For the purpose of this study, they will be referred to as “A” and “B.”
Fig. 8 shows the distinct reflectivity maxima associated with the centers of the
vortices, while the velocity and visible satellite imagery in Figs. 9 and 10 show evidence
of circulations with each center. The meso-β-scale circulation associated with A is
evident in the velocity data in Fig. 9, but B did not show up well in radar data at this time
because it was convectively inactive. However, Fig. 10 shows a distinct low-level cloud
swirl that is obviously associated with a circulation (vortex B) when viewed in a visible
satellite loop. The individual centers are difficult to detect from the mesoscale analyses in
Fig. 4 because these analyses are drawn to depict the storm-scale features. Other surface
observations not included confirm that these meso-β-scale vortices extended to the
surface.
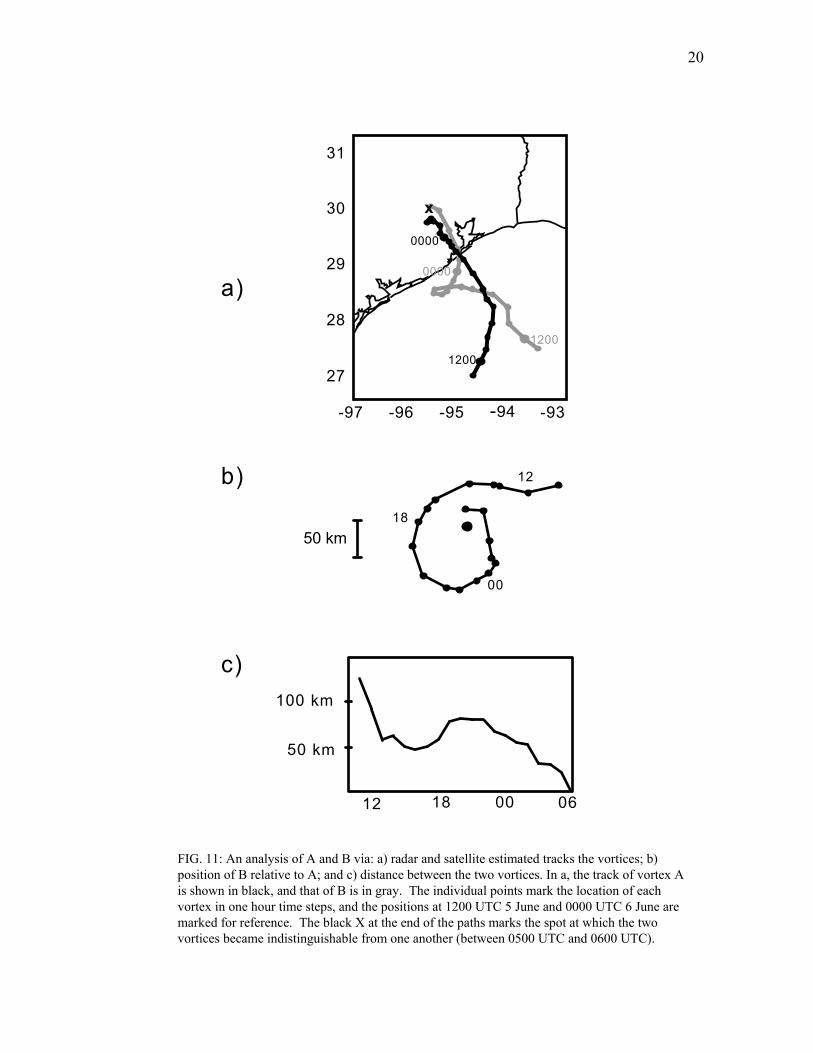
In order to determine where these vortices originated, how they interacted with
one another and with their surroundings, and how long each survived, they were both
tracked from their point of origin until after the storm made landfall (Fig. 11a). Radar
reflectivity loops indicate that a vortex, possibly the aforementioned MCV, likely existed
at the time of convective initiation near where A was first tracked. In addition to using
reflectivity data to track the circulation center of A, Doppler velocity data is used when
possible to verify track in Fig. 11a.
19
Range-folded velocity data and lack of an obvious circulation in reflectivity data
prevents direct tracking of B until that center is out of the range-folded region at about
1530 UTC. At this time, B is coincident with a distinct convective maximum that formed
near 1030 UTC about 160 km to the east of A. The track for B in Fig. 11 assumes that a
circulation existed soon after initiation of the aforementioned convective maximum and
follows the center of that feature until 1530 UTC. From this point, a similar method of
tracking A is used, but with the aid of visible satellite imagery when its convection
dissipated.
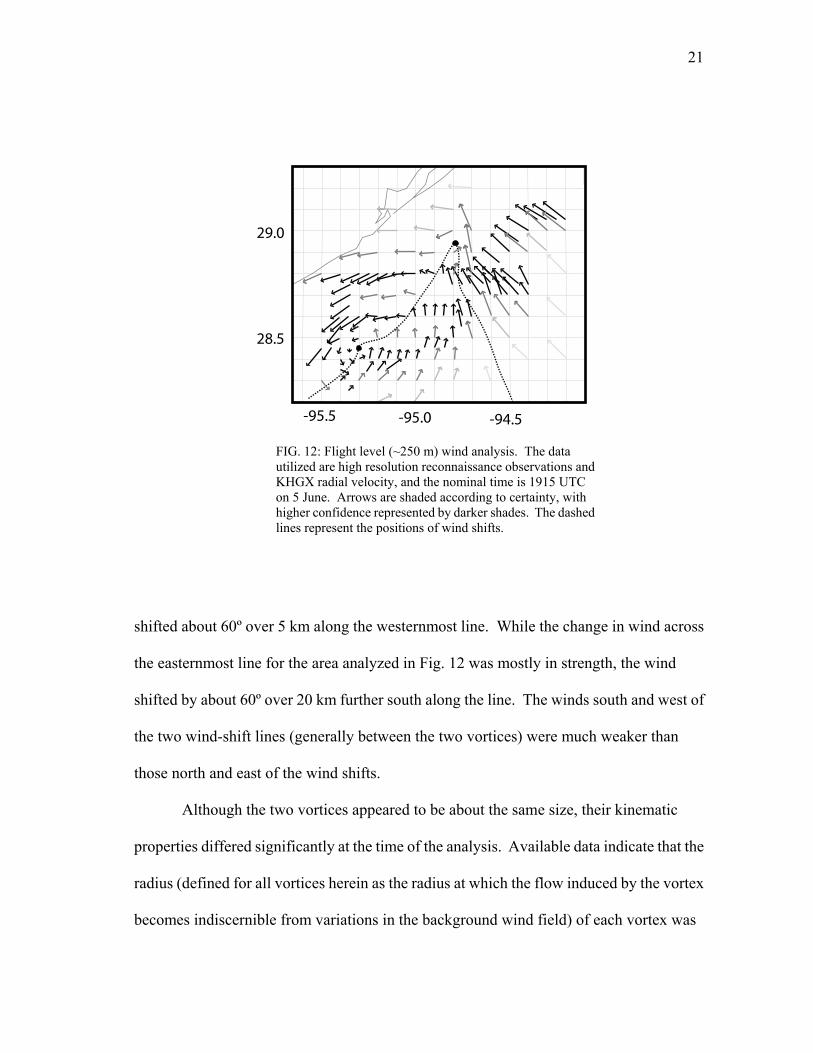
In order to investigate the mesoscale kinematic structure of Allison, high-density
(30 second) flight-level reconnaissance observations were supplemented with KHGX
velocity data to derive the analysis shown in Fig. 12. The KGHX velocity data proved
useful for analyzing vortex A because it was poorly sampled by reconnaissance aircraft.
On the other hand, abundant reconnaissance observations within B compensate for poor
sampling of the vortex by the KGHX radar. The nominal time of this analysis is about
1915 UTC and it approximates the wind field at 250 m. The observations shown were
taken from about 1810 UTC until 1940 UTC. Vortex B was nearly stationary during this
time (see Fig. 11a), so this analysis is approximately equivalent to a reference frame
moving with the center of B. Vortex A was moving northeastward at about 8 m s during
this period.
1−
Figure 12 reveals a complex mesoscale wind pattern associated with Allison. Two
wind-shift lines shown in Fig. 12 terminate at or near the center of vortex A. One extends
southwestward through B, and the other extends southeastward. The wind direction
20
FIG. 11: An analysis of A and B via: a) radar and satellite estimated tracks the vortices; b) position of B relative to A; and c) distance between the two vortices. In a, the track of vortex A is shown in black, and that of B is in gray. The individual points mark the location of each vortex in one hour time steps, and the positions at 1200 UTC 5 June and 0000 UTC 6 June are marked for reference. The black X at the end of the paths marks the spot at which the two vortices became indistinguishable from one another (between 0500 UTC and 0600 UTC).
1200
27
28
29
30
31
-97 -96 -95 -94 -93
1200
0000
0000
x
12 18 00
50 km
100 km
50 km
12
18
00
a)
b)
c)
06
21
shifted about 60º ov
the easternmost line
shifted by about 60º
the two wind-shift l
those north and eas
Although th
properties differed s
radius (defined for a
becomes indiscerni
28.5
29.0
-95.0 -94.5-95.5
FIG. 12: Flight level (~250 m) wind analysis. The data utilized are high resolution reconnaissance observations and KHGX radial velocity, and the nominal time is 1915 UTC on 5 June. Arrows are shaded according to certainty, with higher confidence represented by darker shades. The dashed lines represent the positions of wind shifts.
er 5 km along the westernmost line. While the change in wind across
for the area analyzed in Fig. 12 was mostly in strength, the wind
over 20 km further south along the line. The winds south and west of
ines (generally between the two vortices) were much weaker than
t of the wind shifts.
e two vortices appeared to be about the same size, their kinematic
ignificantly at the time of the analysis. Available data indicate that the
ll vortices herein as the radius at which the flow induced by the vortex
ble from variations in the background wind field) of each vortex was
22
about 20 km. No deep convection was occurring within this distance from the center of B
at the analysis time, and the weak winds near the center increased to the magnitude of the
background winds near the radius of the vortex. Meanwhile, the strongest winds observed
with the convectively active vortex A were within a few kilometers of the center. From a
point of reference following the center of A, the wind strength decreased to the strength of
the background winds at the vortex radius.
The cyclonic movement of each center relative to the other was likely due to
advection by winds associated with the larger-scale PV anomalies rather than due to
interaction between the small-scale vortices. While the radius of each vortex was about 20
km, the distance between the two vortices shown in Fig. 11 was greater than 50 km until
0300 UTC 6 June. Meanwhile, the observed rate of rotation of B relative to A was at least
8 – 10 m s . Mutual interaction cannot explain that rate of rotation at such a large
distance relative to the estimated radii.
1−
Vortices A and B merged on the northwest side of Houston and produced a larger
single vortex with a greater pressure perturbation. The mesoscale surface analyses in Fig.
4 reveal the evolution to a more concentrated vortex with stronger pressure gradients. The
lowest surface pressure measured as Allison made landfall was no less than 1004 hPa, but
the central pressure fell to less than 1003 hPa north of Houston even as deep convection
weakened. Note that the central pressure fell in spite of the environmental tendency for
pressure rises and resulted in the stronger pressure gradients in Fig. 4c. Although one
criterion for system strengthening was met when the surface pressure dropped, the surface
winds did not respond. This is partly due to the increased surface friction over land and
29.2
29.0
28.8
-95.0 -94.8 -94.6 -94.4
-95.0 -94.8 -94.6 -94.4
29.2
29.0
28.8
-95.0 -94.8 -94.6 -94.4
-95.0 -94.8 -94.6 -94.4
-95.0 -94.8 -94.6 -94.4 -95.0 -94.8 -94.6 -94.4
29.2
29.0
28.8
29.2
29.0
28.8
29.2
29.0
28.8
29.2
29.0
28.8
RF+32+25+18+13+10+50-5-10-13-18-25-32ND
1913 UTC
1923 UTC
1933 UTC
23
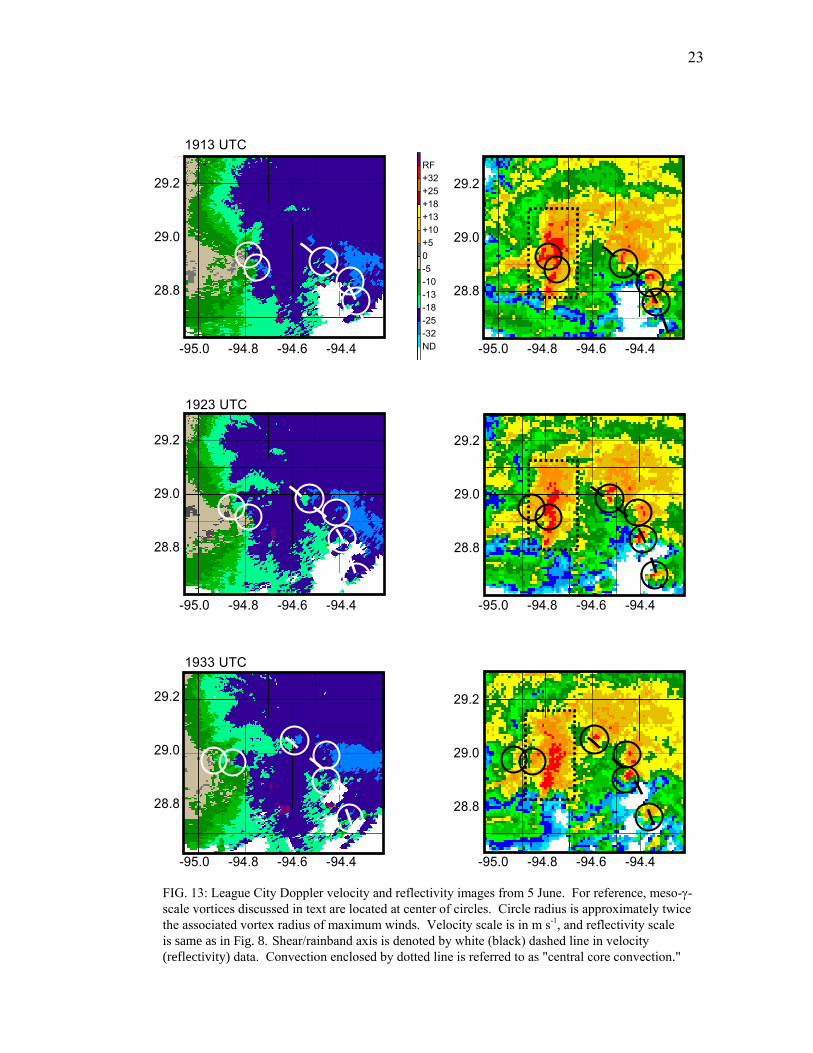
FIG. 13: League City Doppler velocity and reflectivity images from 5 June. For reference, meso-γ-scale vortices discussed in text are located at center of circles. Circle radius is approximately twicethe associated vortex radius of maximum winds. Velocity scale is in m s-1, and reflectivity scale is same as in Fig. 8. Shear/rainband axis is denoted by white (black) dashed line in velocity (reflectivity) data. Convection enclosed by dotted line is referred to as "central core convection."
24
the ongoing dissipation of deep convection near the merged centers. However, had this
merger taken place over water, intensification might have resulted.
c. Meso-γ-scale vortices
It became apparent as vortex A neared the KHGX radar that meso-γ-scale vortices
associated with single convective cells were embedded within the meso-β-scale vortex.
These vortices, shown in Fig. 13, existed both in the core of convection near the center
and in the primary rainband (for reference, these areas are labeled in Fig. 13). The typical
radius of these vortices was less than 5 km while that of their parent convective cells that
was less than 2.5 km. The vorticity within these features was estimated from the NIDS-
format velocity data by approximating the maximum inbound and outbound velocities at
the radius of maximum wind (RMW) of each vortex. For most of these features the
vorticity ranged from about 10 3− s 1−
to 10 2− s 1− , and it peaked near 1.5 s in the
strongest vortex for only a short period of time. The vortices tended to be fairly shallow,
with the strongest vorticity generally measured in the lowest radar elevations at about 1
km above ground level. With one exception discussed below, the highest low-level
reflectivity associated with these convective cells was very near or over the low-level
vortex center.
210−× 1−
While the Doppler-indicated rotational velocities of the strongest vortices tended
to be only as strong as moderate Great Plains mesocyclones (reference 6.5 km nomogram
developed by the WSR-88D Operational Support Facility), their characteristic velocities
and scales were comparable to tornadic mesocyclones observed with other Gulf of Mexico
tropical systems documented by Spratt et al. (1997). The rotational velocities of these
25
mesocyclones and
s . The typical R
2 km, while those
the radius of Allis
-1
The tracks
plotted in Fig. 14
time, the distance
1938
1838
20392029
1828
1858
1858
2039
2008
1828
20181908
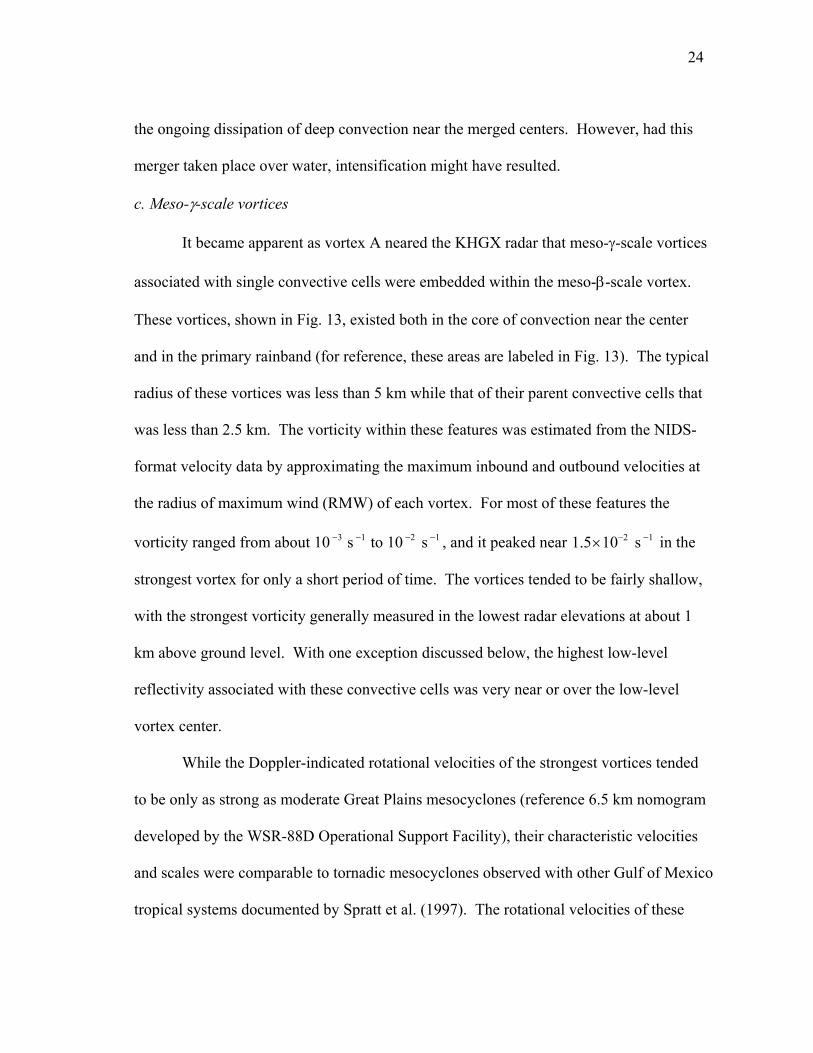
FIG. 14: Tracks of all meso-γ-scale vortices relative to meso-β-scale center A (represented by star) that formed between1830 and 1930 UTC 5 June. Tracks of A' and vortices associatedwith A' itself are not plotted. Filled circles represent points at which the convective cell associated with each vortex attained precipitation intensity of 50 dBZ. Hollow circles indicate point at
which vortex was no longer trackable.those observed with Allison generally ranged from 7.5 m s to 15 m
MW with Allison’s meso-γ-scale vortices averaged between 1.5 km and
investigated by Spratt et al. (1997) ranged from 1 km to 1.5 km. Finally,
on’s meso-γ-scale vortices generally extended to about 5 km.
-1
of all such vortices that formed between 1830 UTC and 1930 UTC are
relative to vortex A. Although such features likely existed before this
of the system from the radar and shallow vortex depth inhibited their
26
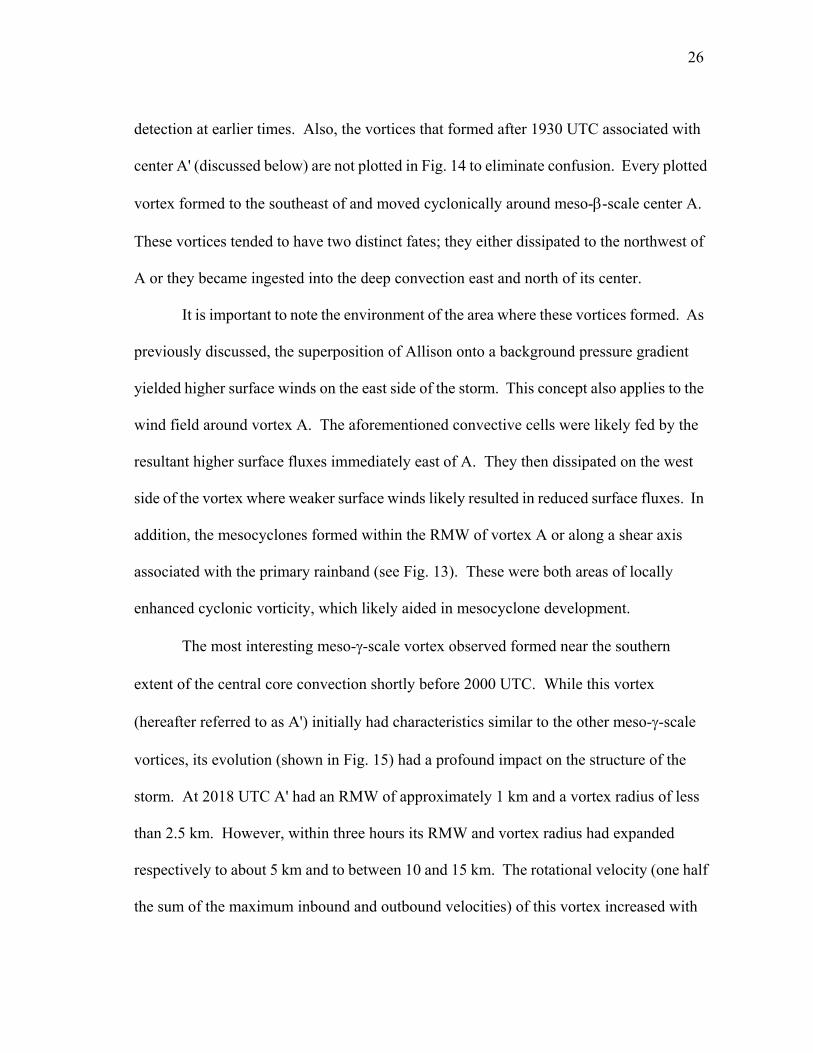
detection at earlier times. Also, the vortices that formed after 1930 UTC associated with
center A' (discussed below) are not plotted in Fig. 14 to eliminate confusion. Every plotted
vortex formed to the southeast of and moved cyclonically around meso-β-scale center A.
These vortices tended to have two distinct fates; they either dissipated to the northwest of
A or they became ingested into the deep convection east and north of its center.
It is important to note the environment of the area where these vortices formed. As
previously discussed, the superposition of Allison onto a background pressure gradient
yielded higher surface winds on the east side of the storm. This concept also applies to the
wind field around vortex A. The aforementioned convective cells were likely fed by the
resultant higher surface fluxes immediately east of A. They then dissipated on the west
side of the vortex where weaker surface winds likely resulted in reduced surface fluxes. In
addition, the mesocyclones formed within the RMW of vortex A or along a shear axis
associated with the primary rainband (see Fig. 13). These were both areas of locally
enhanced cyclonic vorticity, which likely aided in mesocyclone development.
The most interesting meso-γ-scale vortex observed formed near the southern
extent of the central core convection shortly before 2000 UTC. While this vortex
(hereafter referred to as A') initially had characteristics similar to the other meso-γ-scale
vortices, its evolution (shown in Fig. 15) had a profound impact on the structure of the
storm. At 2018 UTC A' had an RMW of approximately 1 km and a vortex radius of less
than 2.5 km. However, within three hours its RMW and vortex radius had expanded
respectively to about 5 km and to between 10 and 15 km. The rotational velocity (one half
the sum of the maximum inbound and outbound velocities) of this vortex increased with
94.0 -94.5
29.5
29.0
RF+32+25+18+13+10+50-5-10-13-18-25-32ND
2018 UTC
2119 UTC
2219 UTC
29.5
29.0
29.5
29.0
94.0 -94.5
94.0 -94.5
29.5
29.0
94.0 -94.5
29.5
29.0
94.0 -94.5
29.5
29.0
94.0 -94.5
27
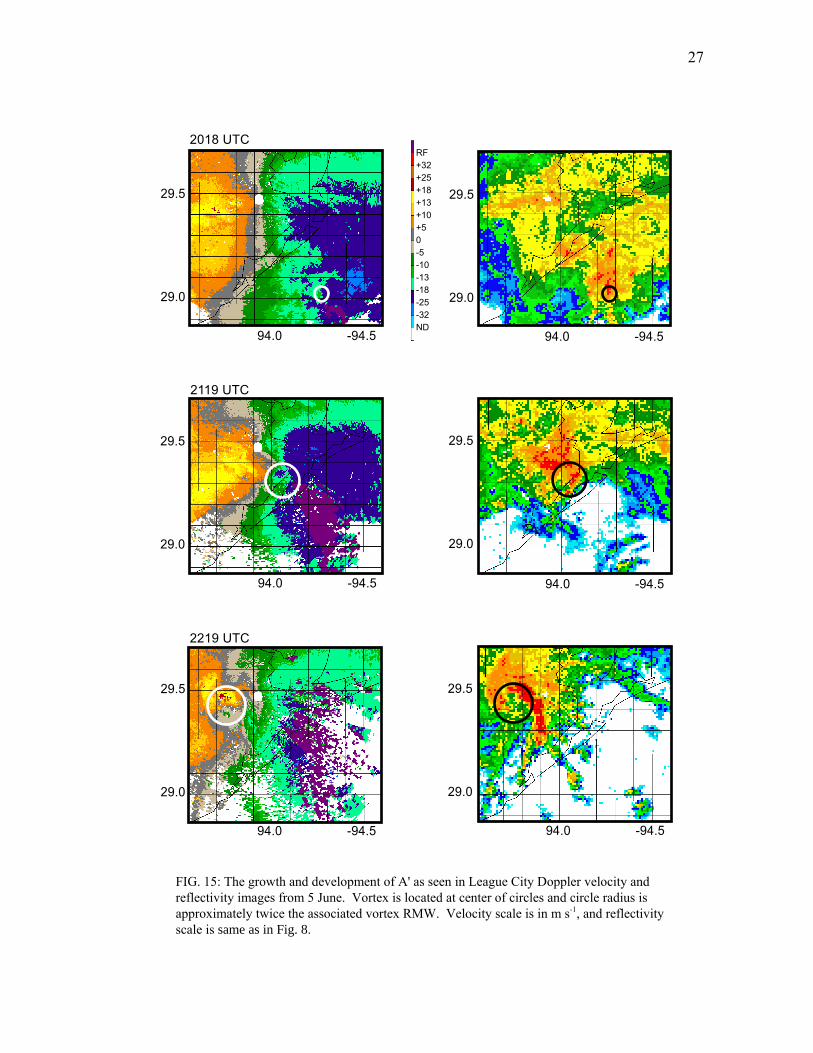
FIG. 15: The growth and development of A' as seen in League City Doppler velocity and reflectivity images from 5 June. Vortex is located at center of circles and circle radius is approximately twice the associated vortex RMW. Velocity scale is in m s , and reflectivity scale is same as in Fig. 8.-1
28
the RMW such that the estimated value of vorticity (approximately 5 1 s ) 30−× 1−
within the RMW did not change. Also, the dramatic upscale growth of A' made it of
comparable size to meso-β vortex A. A' quickly became the strongest meso-β-scale vortex
within Allison. After about 2000 UTC, the center of A became increasingly difficult to
follow using Doppler velocity data. For the next several hours, only a diffuse area of weak
cyclonic vorticity with A could be inferred from the velocity data. Reflectivity data also
showed little evidence of a circulation. Meanwhile, by 2200 UTC, both the vortex radius
and the RMW of A' had expanded into the meso-β scale. With nearly all the deep
convection rotating exclusively about A', it had become the most visible meso-β-scale
vortex in radar data.
The convective structure of A' exhibited dramatic changes as the vortex grew.
During the early stages of vortex growth, the size of its >50 dBZ isopleth expanded
dramatically. While it had been 1 – 2 km wide at 2018 UTC, it steadily grew to 7 – 8 km
across by 2149 UTC. Up until this point, the highest reflectivity remained nearly
superposed upon the vortex, much like with the previously observed vortices of the same
scale. Figure 15 shows how this changed within the next 30 minutes as the vortex
continued its upscale growth. The deep convection over the center of A' substantially
weakened as a large band of 45 – 60 dBZ convection developed and encircled more than
50% of the vortex near its RMW.
This evolution is markedly similar to that observed during the formation of the eye
of Tropical Cyclone Ed early during its genesis phase (Stewart and Lyons 1996). The
authors of that study hypothesized that a rapid increase in the low-level wind field about a
29
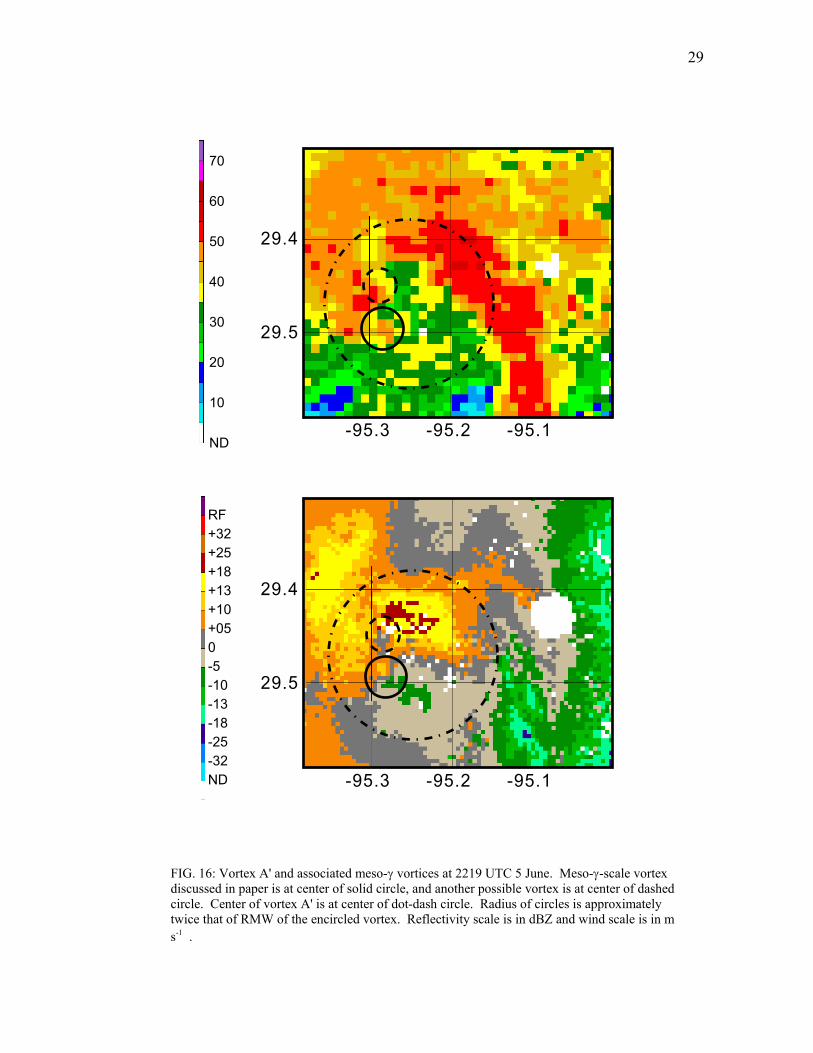
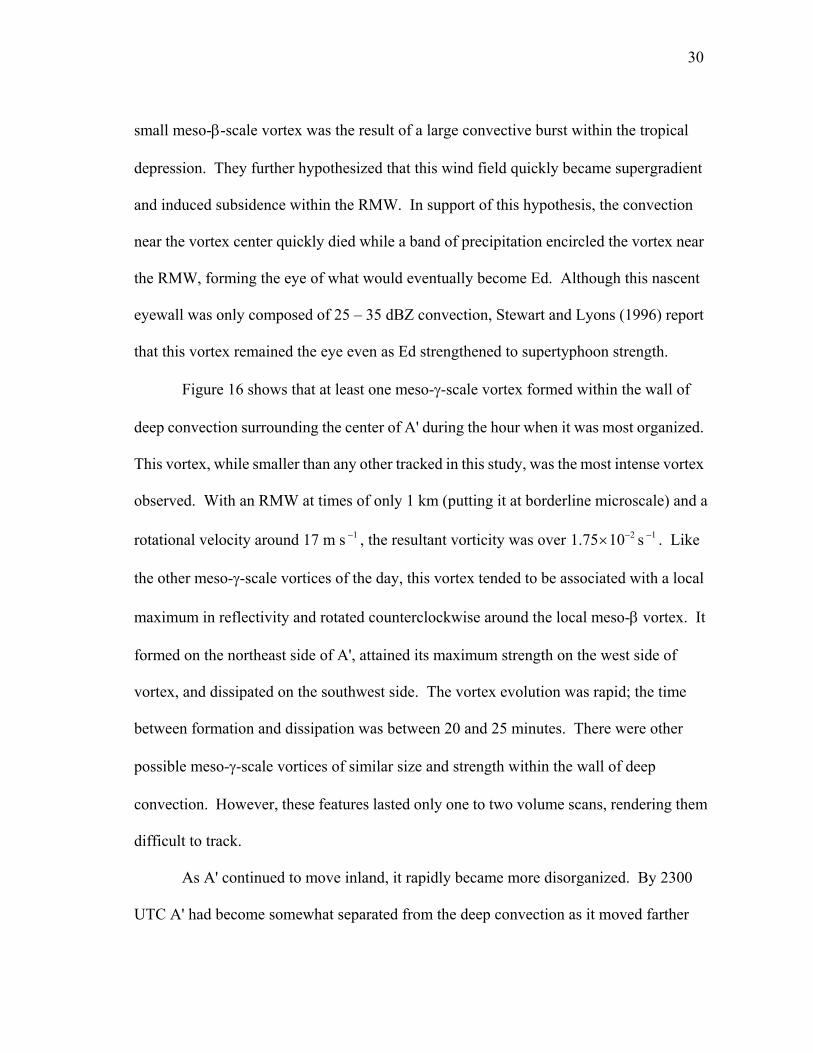
FIG. 16: Vortex A' and associated meso-γ vortices at 2219 UTC 5 June. Meso-γ-scale vortex discussed in paper is at center of solid circle, and another possible vortex is at center of dashed circle. Center of vortex A' is at center of dot-dash circle. Radius of circles is approximately twice that of RMW of the encircled vortex. Reflectivity scale is in dBZ and wind scale is in m s . -1
RF+32+25+18+13+10+050-5-10-13-18-25-32ND
70
60
50
40
30
20
10
ND
29.4
29.5
29.4
29.5
-95.3 -95.2 -95.1
-95.3 -95.2 -95.1
30
small meso-β-scale vortex was the result of a large convective burst within the tropical
depression. They further hypothesized that this wind field quickly became supergradient
and induced subsidence within the RMW. In support of this hypothesis, the convection
near the vortex center quickly died while a band of precipitation encircled the vortex near
the RMW, forming the eye of what would eventually become Ed. Although this nascent
eyewall was only composed of 25 – 35 dBZ convection, Stewart and Lyons (1996) report
that this vortex remained the eye even as Ed strengthened to supertyphoon strength.
Figure 16 shows that at least one meso-γ-scale vortex formed within the wall of
deep convection surrounding the center of A' during the hour when it was most organized.
This vortex, while smaller than any other tracked in this study, was the most intense vortex
observed. With an RMW at times of only 1 km (putting it at borderline microscale) and a
rotational velocity around 17 m s 1− , the resultant vorticity was over 1.75 s . Like
the other meso-γ-scale vortices of the day, this vortex tended to be associated with a local
maximum in reflectivity and rotated counterclockwise around the local meso-β vortex. It
formed on the northeast side of A', attained its maximum strength on the west side of
vortex, and dissipated on the southwest side. The vortex evolution was rapid; the time
between formation and dissipation was between 20 and 25 minutes. There were other
possible meso-γ-scale vortices of similar size and strength within the wall of deep
convection. However, these features lasted only one to two volume scans, rendering them
difficult to track.
210−× 1−
As A' continued to move inland, it rapidly became more disorganized. By 2300
UTC A' had become somewhat separated from the deep convection as it moved farther
31
west. While the vorticity had not substantially decreased, the vortex was now only
surrounded about 30% by 30 dBz convection. After 2300 UTC, the vortex itself began to
rapidly weaken, and by shortly after 0100 UTC, any semblance of a circulation in the
reflectivity or velocity data had completely vanished.
32
4. DISCUSSION a. Other cases and forecasting issues
The occurrence of multiple meso-β-scale vortices presents a difficulty in tracking
developing tropical cyclones. In the 2003 season alone, the presence of such features
complicated TPC tracking of at least four Gulf of Mexico tropical systems (Bill,
Claudette, Henri, and Grace). One particular discussion for Claudette indicated that the
feature being tracked as the center appeared to be rotating around a broader circulation.
Furthermore, TPC discussions often speak of the center of circulation jumping from one
convective flare-up to another, with multiple candidates for the true circulation center.
This often happens in high-shear cases when convection gets displaced downshear of a
circulation center, resulting in pressure falls and center reformation under the
convection. The fates of these circulation centers vary; while some merge (as with A
and B in Allison), some eventually dissipate in the absence of sustaining convection (as
with A' in Allison).
While difficulty in pinpointing the exact center of developing tropical cyclones is
of little consequence over the open ocean, it becomes a concern when such systems near
land. Tracking a single vortex as the center can mean the landfall of another vortex and
its associated weather hundreds of kilometers from where the official center is being
tracked. In the case of Allison, convection-free vortex B was tracked as the official
center as A, A', and the associated convection moved over the suburbs of Houston.
Similar events happened with tropical storms Fay (2002) and Grace (2003), which made
landfall near the upper Texas coast. As was the case with Allison, tropical storm force
33
winds and major flooding often accompany these other, well-defined centers while
mostly clear skies and light winds might accompany the official center.
b. Hot towers and vortical hot towers
The meso-β-scale convective vortices in Allison had several properties in
common with the “vortical hot towers” (VHTs) simulated and discussed by Hendricks et
al. (2004) and Montgomery et al. (2004, submitted for publication to J. Atmos. Sci.).
The typical VHT simulated by Hendricks et al. (2004) with a 3-km grid spacing had
approximately a 10 km wide updraft and had a RMW of about 7.5 km. The
approximately 6.5 km RMW and 12.5 m s 1− rotational velocity associated with A also
compared favorably with these simulated features.
Despite this, other important differences make it unclear how the meso-β-scale
vortices actually relate to the simulated VHTs. The structure and scale (15 – 30 km) of
the reflectivity pattern associated with A imply a complex of individual updrafts. These
updrafts stimulated significant asymmetries in the circulation of A on a scale that the
aforementioned numerical simulations could not have resolved. Under the assumption
that the smallest resolvable features in a numerical simulation are five times the grid
spacing, the 15 km wide VHTs in these numerical studies were the smallest structures
that could be resolved by Hendricks et al. (2004). The VHTs in that study were
consequently limited to axisymmetry. Their investigation also noted that finer-
resolution numerical simulations tended to produce smaller VHTs than with the 2 km or
3 km studies. Thus, it is uncertain if the features simulated are an attempt by the model
to produce meso-γ-scale vortices or if they are poorly-resolved meso-β-scale vortices.
34
Regardless of how these vortices relate to VHTs, the fact that meso-γ-scale
vortices existed within the meso-β-scale vortices is important. While the meso-β-scale
vortex merger is likely significant for tropical cyclone scale intensification, the above
observations suggest that smaller vortices and individual updrafts are the actual building
blocks of and source of PV production for the meso-β-scale vortices. To our knowledge,
this phenomenon has yet to be observed in any published numerical study because the
scale is too small. Any grid spacing larger than 0.25 – 0.5 km is inadequate to resolve
meso-γ-scale vortices which have an RMW of approximately 2 km. Computing power
is only now advancing to the point where such three-dimensional simulations are
possible on the scale of a tropical system.
While the relationship between vortices A and B and the simulated VHTs remain
ambiguous, the observed meso-β scale features are not the same as the hot towers
discussed in previous studies. Although the intrinsic scale of a hot tower does not seem
to have been formally defined in peer-reviewed literature, the term has historically
referred to individual cumulonimbi with approximately 5 km wide updrafts (e.g. Reihl
and Malkus 1958, Malkus et al. 1961, and Simpson et al. 1998). As indicated above, the
structure and scale of the deep convection associated with A imply a complex of
individual updrafts rather than a single hot tower. Instead, the hot towers of Allison
were likely the convective cells associated with the meso-γ-scale vortices.
c. Commonality of meso-β- and meso-γ- scale vortices
It is difficult to say to what extent multiple meso-β- and meso-γ- scale vortices
are a normal stage of tropical cyclone development. Multiple meso-β-scale vortices

35
have only been documented by Stossmeister and Barnes (1992), Hendricks et al. (2004),
and the present study. Furthermore, the importance of multiple meso-γ-scale vortices in
a developing tropical cyclone has only been discussed by Stewart and Lyons (1996).
Despite the relative absence of observations of these smaller-scale vortices in studies
relevant to tropical cyclone formation, the supercell characteristics of rainband and
eyewall meso-γ-scale vortices of mature tropical cyclones have been extensively
documented in the literature (e.g., Spratt et al. 1997). Furthermore, the frequent
appearance meso-β-scale vortices in TPC forecast discussions indicates that they are
fairly common.
The small scales of these vortices make them exceptionally difficult to observe in
many cases. Meso-β-scale vortices can be only be remotely detected by Doppler radar
or in visible satellite imagery if their convection dissipates and the low-level cloud swirl
becomes exposed. It is for this reason that sheared environments result in the most
easily observable meso-β-scale vortices when storms are far from shore. Even with
insitu airplane observations, these vortices can be missed (e.g., as shown in Fig. 12,
aircraft reconnaissance never directly observed vortex A). Meanwhile, meso-γ-scale
vortices can only be observed with Doppler radar. Their scale is much too small to be
directly observed even with airplane data.

36
5. CONCLUSION
An investigation of a developing tropical cyclone has been presented with
emphasis on the interaction and superposition of PV anomalies on multiple scales. It is
clear in this case that PV superposition is likely a key component of cyclogenesis from
the lower synoptic to the lower meso-γ scales. While only the case of Allison has been
discussed in great detail, other studies have documented PV superposition on various
scales. In addition, the clear presence of multiple mesoscale vortices in many
developing tropical cyclones indicates that such superposition could be important for
most tropical cyclones.
While mesoscale vortices are of great interest for understanding tropical
cyclogenesis, they also present considerable forecasting implications. A significant
forecasting problem lies in the paradigm that, given a tropical cyclone, an exact center of
circulation must exist. Although this idea works well for well-developed systems, such
as a hurricane with an eye, it is inappropriate for a developing tropical storm. Rather,
the tendency is for developing systems to be composed of a diffuse area of elevated PV
with small, concentrated areas of particularly high PV. The transient nature of the small
areas of high PV renders them poor predictors of long-lived centers. With this
perspective, it seems logical that the practice of determining an exact center should be
abandoned until an eye emerges with a particular system.
Although it is clear from the previous discussion that an exact center does not
exist for many developing tropical cyclones, a method for providing an estimated system
center is still necessary if an agency wishes to track and name such systems. Given the

37
continued public and TPC interest in the tracking and naming of tropical depressions and
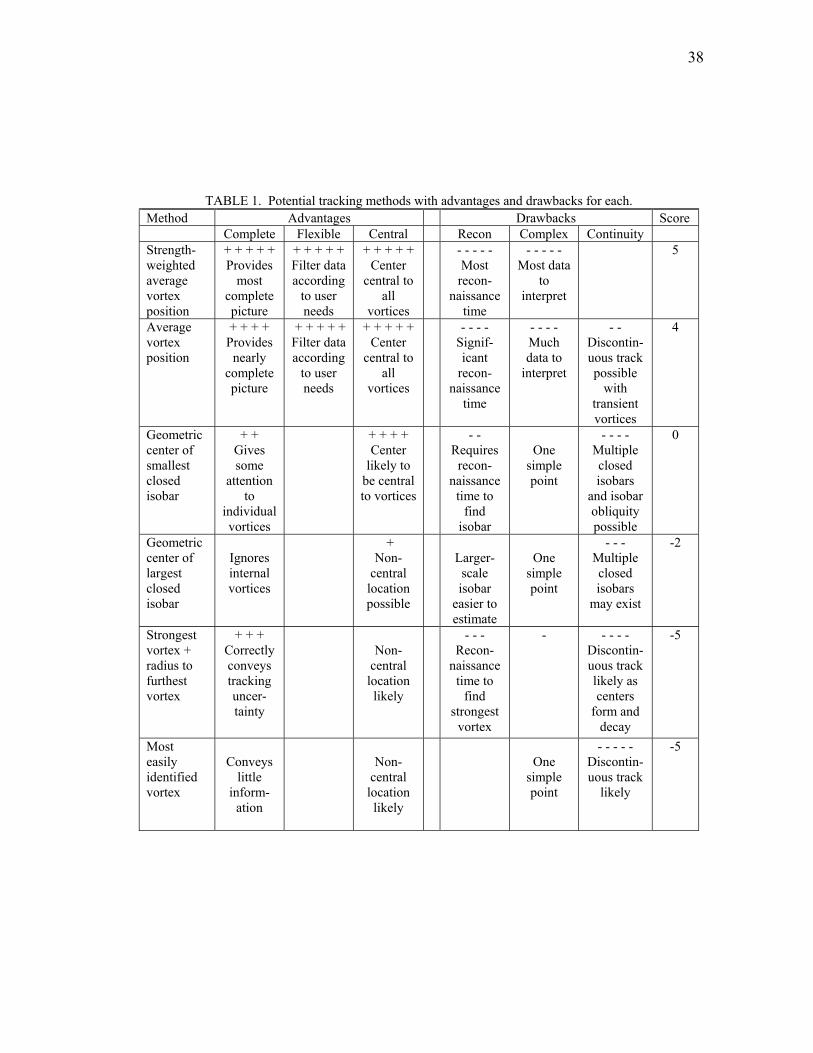
storms, several alternatives to the current tracking method are outlined in Table 1. The
advantages and drawbacks are listed in this table for each potential method of tracking.
Note that vortices of interest in this table are on the meso-β scale, the smallest
observable scale with reconnaissance observations.
The most desirable methods should have the advantages of providing a complete
picture, being flexible for many users, and estimating a center central to all vortices. A
complete picture consists of position and strength information on all meso-β and larger
scale vortices within a particular system. Less complete methods ignore part or all of the
meso-β-scale storm structure. Flexible methods contain information that can be filtered
according to the needs of different users. For example, a broadcast meteorologist in a
particular coastal city might only need specific information on a vortex approaching that
city while a research scientist might need information on all vortices at a given time. In
any event, a center that is central to all given vortices is easily estimated once one has
the needed information on all meso-β and larger scale vortices at a particular time. A
central center estimate is important because it deemphasizes single vortices and forces
the forecaster and the public to focus on the system as a whole.
There are also drawbacks to any method of tracking a tropical cyclone. The
more complete methods tend to require more reconnaissance, which can be costly and is
impossible for storms out of reach of reconnaissance aircraft. In addition to being more
costly, these methods are also more complex because of the necessary increase in data
that has to be communicated. Finally, the less complete methods have the drawback of
38
TABLE 1. Potential tracking methods with advantages and drawbacks for each. Method Advantages Drawbacks Score Complete Flexible Central Recon Complex Continuity Strength-weighted average vortex position
+ + + + + Provides
most complete picture
+ + + + + Filter data according
to user needs
+ + + + + Center
central to all
vortices
- - - - - Most recon-
naissance time
- - - - - Most data
to interpret
5
Average vortex position
+ + + + Provides
nearly complete picture
+ + + + + Filter data according
to user needs
+ + + + + Center
central to all
vortices
- - - - Signif-icant
recon-naissance
time
- - - - Much data to
interpret
- - Discontin-uous track possible
with transient vortices
4
Geometric center of smallest closed isobar
+ + Gives some
attention to
individual vortices
+ + + + Center
likely to be central to vortices
- - Requires
recon-naissance
time to find
isobar
One
simple point
- - - - Multiple closed isobars
and isobar obliquity possible
0
Geometric center of largest closed isobar
Ignores internal vortices
+ Non-
central location possible
Larger-scale isobar
easier to estimate
One
simple point
- - - Multiple closed isobars
may exist
-2
Strongest vortex + radius to furthest vortex
+ + + Correctly conveys tracking uncer-tainty
Non-
central location likely
- - - Recon-
naissance time to
find strongest
vortex
-
- - - - Discontin-uous track likely as centers
form and decay
-5
Most easily identified vortex
Conveys
little inform-
ation
Non-
central location likely
One
simple point
- - - - - Discontin-uous track
likely
-5
39
producing a discontinuous estimated storm track. This center repositioning is commonly
seen with the current method of tracking tropical cyclones.
While all approaches to tracking have their strengths and weaknesses, it appears
that advantages strongly outweigh drawbacks for the more complex methods. The
system currently employed to track developing tropical cyclones is comparable to the
least complex method listed while the more desirable alternatives more completely
convey important information. Data on meso-β-scale vortex positions is clearly
advantageous for landfalling systems and would mitigate public scrutiny and forecaster
disagreement on center position. Another appealing advantage is the ability to convey a
subset of complex information to less sophisticated users.
Although Tropical Storm Allison provides an interesting glimpse into rarely
documented mesoscale processes in tropical cyclogenesis, many of the observations and
conclusions drawn herein are subject to the limitation of coming from a single case. For
example, the commonality or importance of the documented meso-γ-scale vortices to
tropical cyclogenesis in general remains unknown. Few published observational studies
have focused on meso-β or meso-γ scales. Although this is at least partly due to a lack
of data over the ocean, the occurrence of landfalling tropical cyclones in their
development stage is common enough that other similar studies are possible. Detailed
analyses of other cases should address much of this uncertainty and provide for a more
complete understanding of tropical cyclone formation.
40
REFERENCES Craig, G. C., and S. L. Gray, 1996: CISK or WISHE as the mechanism for tropical
cyclone intensification. J. Atmos. Sci., 53, 3528-3540. Davis, C., and L. F. Bosart, 2001: Numerical simulations of the genesis of Hurricane
Diana (1984). Part I: Control simulation. Mon. Wea. Rev., 129, 1859-1881. DeMaria, M., Knaff, J. A., and B. H. Connell, 2001: A tropical cyclone genesis parameter for the tropical Atlantic. Wea. Forecasting, 16, 219–233. ____, and J. M. Gross, 2003: Evolution of prediction models. Hurricane! Coping with
Disaster: Progress and challenges since Galveston, 1900, R. Simpson, Ed., American Geophysical Union, 103-126.
Emanuel, K. A., 1986: An air-sea interaction theory for tropical cyclones. Part I:
Steady-state maintenance. J. Atmos. Sci., 43, 585-604. ____, 1989: The finite-amplitude nature of tropical cyclogenesis. J. Atmos. Sci., 46,
3431-3456. ____, 2003: A century of scientific progress: An evaluation. Hurricane! Coping with
Disaster: Progress and challenges since Galveston, 1900, R. Simpson, Ed., American Geophysical Union, 177-204.
Gray, W. M., 1968: Global view of the origin of tropical disturbances and storms. Mon.
Wea. Rev., 96, 669-700. Harr, P. A., Elsberry, R. L., and J. C. Chan, 1996: Transformation of a large monsoon
depression to a tropical storm during TCM-93. Mon. Wea. Rev., 124, 2625-2643. Hendricks, E. A., Montgomery, M. T., and C. A. Davis 2004: The role of “vortical” hot towers in the formation of tropical cyclone Diana (1984). J. Atmos. Sci., 61, 1209–1232. Hoskins, B. J., M. E. McIntyre, and A. W. Robertson, 1985: On the use and significance
of isentropic potential vorticity maps. Q. J. R. Meterol. Soc., 111, 877-946. Malkus, J. S., C. Ronne, and M. Chaffee, 1961: Cloud patterns in Hurricane Daisy.
Tellus, 13, 8-30.

41
McBride, J. L., and R. Zehr, 1981: Observational analysis of tropical cyclone formation. Part II: Comparison of non-developing versus developing systems. Jour. Atmos. Sci., 38, 1132-1151.
Raymond, D. J., and H. Jiang, 1990: A theory for long-lived mesoscale convective
systems. J. Atmos. Sci., 47, 3067-3077. Reihl, H., and J. S. Malkus, 1958: On the heat balance in the equatorial trough zone.
Geophysica, 6, 503-538. Ritchie, E. A., and G. J. Holland, 1997: Scale interactions during the formation of
Typhoon Irving. Mon. Wea. Rev., 125, 1377-1396. Rotunno, R., and K. A. Emanuel, 1987: An air–sea interaction theory for tropical
cyclones. Part II: Evolutionary study using a nonhydrostatic axisymmetric numerical model. J. Atmos. Sci., 44, 542-561.
Simpson, J., E. Ritchie, G. J. Holland, J. Halverson, and S. Stewart, 1997: Mesoscale
interactions in tropical cyclone genesis. Mon. Wea. Rev., 125, 2643-2661. ____, J. B. Halverson, B. S. Ferrier, W. A. Peterson, R. H. Simpson, R. Blakeslee, and S.
L. Durden, 1998: On the role of “hot towers” in tropical cyclone formation. Meteorol. Atmos. Phys., 67, 15-35.
Spratt, S. M., Sharp, D. W., Welsh, P., Sandrik, A., Alsheimer, F., and C. Paxton, 1997: A WSR-88D assessment of tropical cyclone outer rainband tornadoes. Wea. Forecasting, 12, 479–501. Stewart, S. R., and S. W. Lyons, 1996: A WSR-88D radar view of tropical cyclone Ed. Wea. Forecasting, 11, 115–132. Stossmeister, G. J., and G. M. Barnes, 1992: The development of a second circulation center within Tropical Storm Isabel (1985). Mon. Wea. Rev., 120, 685–697.
42
VITA
Jason Allen Sippel ADDRESS: Department of Atmospheric Sciences Texas A&M University 3150 TAMU College Station, TX 77843-3150 EDUCATION: B.S. Meteorology, Texas A&M University Graduated May 2002 M.S. Atmospheric Sciences, Texas A&M University Graduated December 2004 PUBLICATIONS: Sippel, J., 2001: Numerical Simulation of the Genesis of Tropical Storm Allison (2001). Preprints, 19th Conf. on Numerical Weather Prediction, San Antonio, TX, Amer. Meteor. Soc., 361-364.