the multidimensional measure of conceptual complexity
TRANSCRIPT

Berkeley Evaluation & Assessment Research CenterGraduate School of EducationUniversity of California, BerkeleyBerkeley, CA 94720-1670http://bearcenter.berkeley.eduTechnical Report SeriesNo. 2005-04-01
The Multidimensional Measure ofConceptual Complexity
Nathaniel J. S. Brown
April 9, 2005

Brown, N. J. S. (2005). The MMCC. Page 2 of 45
Abstract
Given that appropriate assessments are a critical driving force behind successful reform, a
great need exists for assessment instruments that are aligned with current efforts to increase
student understanding of science concepts rather than facts or procedures. Existing instruments
purporting to assess conceptual understanding are based upon outdated and pedagogically
unhelpful perspectives on conceptual change. This report documents the pilot testing and
analysis of a novel multidimensional instrument, grounded in the modern conceptual change
literature and taking advantage of the benefits of Rasch measurement, designed to measure
conceptual understanding of chemical equilibrium. Evidence for the validity and reliability of the
instrument is presented, and the measures of 103 undergraduate chemistry students are
interpreted with respect to the complexity of their conceptual understanding.
Motivation
Many instruments that purport to assess conceptual understanding of various scientific
fields are available in the literature. These instruments, sometimes referred to as conceptual
diagnostic inventories, draw heavily upon the misconceptions literature, which has catalogued
thousands of student conceptions that differ from normative scientific concepts.
By and large, items on these instruments follow a common format. First, the student is
asked to predict the outcome of a simple experiment, usually by selecting one of several possible
outcomes in a multiple-choice format. Often, the student is then asked to either write down a
short explanation for their answer or to select an explanation from a second list of possible
explanations. Each item tests the student’s understanding of a particular concept, where the
distractors represent common misconceptions about that concept. Examples of prototypical items
are shown in Figures 1 and 2.

Brown, N. J. S. (2005). The MMCC. Page 3 of 45
2. Imagine a head-on collision between a large truck and a small compact car.During the collision,
(A) the truck exerts a greater amount of force on the car than thecar exerts on the truck.
(B) the car exerts a greater amount of force on the truck than thetruck exerts on the car.
(C) neither exerts a force on the other, the car gets smashedsimply because it gets in the way of the truck.
(D) the truck exerts a force on the car but the car doesn’t exert aforce on the truck.
(E) the truck exerts the same amount of force on the car as the carexerts on the truck.
Figure 1. A prototypical item from the Force Concept Inventory (Hestenes, Wells, &Swackhamer, 1992) asking the student to describe what happens during a simple physics“experiment.”
7. True or False? When a match burns, some matter is destroyed.
a. Trueb. False
8. What is the reason for your answer to question 7?
a. This chemical reaction destroys matter.b. Matter is consumed by the flame.c. The mass of ash is less than the match it came from.d. The atoms are not destroyed, they are only rearranged.e. The match weighs less after burning.
Figure 2. A prototypical pair of items from the Chemical Concepts Inventory (Mulford &Robinson, 2002) asking the student to first predict the result of a simple chemistry experimentand then explain their prediction.
Conceptual diagnostic inventories suffer from two serious drawbacks. First, they draw
upon an outdated and problematic view of conceptual change, glossed in the literature as
misconceptions research. Misconceptions research has been highly prolific and essential in
promoting at least one of the tenets of constructivism, namely that students do not enter into
instruction as blank slates possessing no pre-existing conceptions. However, many researchers

Brown, N. J. S. (2005). The MMCC. Page 4 of 45
now acknowledge that the instructional applications of this research, referred to in the literature
as confront-and-replace approaches because they advocate “disproving” students’
misconceptions with anomalous facts, have been overly rational and overly simplistic (Smith,
diSessa, & Roschelle, 1993; Strike & Posner, 1992). Consequently, even if a conceptual
diagnostic inventory can successfully identify a student’s misconceptions, it is unclear what
utility this has for instruction.
Second, these instruments subscribe to an all-or-nothing view of learning, in which the
student either knows the correct concept or is suffering from a misconception. The
misconceptions represented in the distractors might be different, but they are all equally wrong,
as reflected in the dichotomous, correct-or-incorrect scoring system applied to the items. This
view contradicts the constructivist perspective that all knowledge builds upon and is constrained
by previous knowledge, and precludes the possibility of incomplete but productive steps along
the path to complete and correct understanding. Moreover, without a conceptualization of what
the steps are along this path, it is impossible to locate students along this continuum.
Rasch measurement, a subdomain of item response theory, is uniquely poised to address
these two issues (Wilson, 2004; Wright, 1997). Grounded in hierarchical, qualitative constructs
that describe the different possible levels of an underlying, latent variable, Rasch measurement is
intimately tied to, indeed requires, a comprehensive theory of the latent variable one is
measuring. Likewise, measurement that references constructs allows the measurement of student
locations along these continua, providing meaningful, construct-referenced measures of
individuals.
This report documents the pilot-testing and analysis of a novel instrument, grounded in
the modern conceptual change literature and taking advantage of the benefits of Rasch

Brown, N. J. S. (2005). The MMCC. Page 5 of 45
measurement, designed to measure conceptual understanding of chemical equilibrium. Some of
these results have previously been reported in a series of unpublished papers (Brown, 2001b;
2002; 2003a; 2003b). Details of the development of this instrument, a topic not covered in this
report, have been reported elsewhere (Brown, 2004; Wilson & Brown, 2004).
Constructs
Theoretical background
The instrument described in this report is theoretically grounded in the extensive
literature on conceptual change in scientific domains. Rather than representing a consensus,
however, this literature describes several different theories regarding the underlying conceptual
structure of student understanding. One of the goals of this instrument is to provide a common
framework within which these different perspectives can be located.
According to diSessa (1988, 1993), conceptual understanding appears to begin as a
collection of shallow and inarticulate fragments called phenomenological primitives, or p-prims
for short. A p-prim is shallow in the sense that there is no articulated mechanism underlying the
concept. For example, when you work harder, you usually get more of a result. The p-prim more
effort begets more result does nothing more than simply assert this causal relationship. The range
of phenomena to which a p-prim applies is often markedly different than an established scientific
domain. For example, the p-prim described above applies to situations like pushing chairs and
wagons but not to situations like pushing walls. This range of phenomena is limited when
compared to an expert physicist’s view, who would assert that pushing chairs, wagons, and walls
are all the same because they all involve applying a force. However, the same p-prim applies to
many situations outside the realm of physics, including urging a friend to do something or
studying for an exam.
Brown, N. J. S. (2005). The MMCC. Page 6 of 45
The view of knowledge based on p-prims is only one of many forms of conceptual
understanding described in the literature. In contrast, many researchers claim that student
understanding resembles simplistic theories (Gopnik & Wellman, 1994; Vosniadou, 1994), with
a range of applicability more closely aligned to scientific domains. Other researchers emphasize
the ontological difference between matter-based reasoning and dynamic systems reasoning, the
latter requiring a deeper conceptual structure with more internal elements (Chi, Slotta, & de
Leeuw, 1994; Slotta, Chi, & Joram, 1995). Still more complicated structures called coordination
classes, requiring the coordination of many separate elements, appear to contribute to expert
understanding (diSessa & Sherin, 1998).
These different possibilities can be thought of as inhabiting a two-dimensional space of
conceptual complexity, defined by hierarchical continua representing different degrees of
conceptual depth and conceptual breadth. The instrument described in this paper attempts to
locate students within this space, by measuring students’ positions along both constructs.
Conceptual depth
The depth construct (Figure 3) characterizes six levels of conceptual depth. These levels
describe a hierarchy of increasingly deep structures of understanding of a scientific phenomenon:
(0) the absence of understanding; (1) acausal understanding in which the phenomenon is not seen
to require any justification; (2) understanding based upon a single causal element that lacks
justification; (3) understanding based upon a single causal element that includes justification; (4)
understanding that involves multiple causal elements, all of which are necessary but
independent; and (5) understanding that involves multiple causal elements that interact within a
system, eventually producing an emergent phenomenon.

Brown, N. J. S. (2005). The MMCC. Page 7 of 45
Level Description of Person Description of Response
5Emergent
B
A1 A2
The phenomenon is seen asan emergent property of asystem, made up ofinteracting components. Thesystem evolves over time,eventually producing theobserved effect.
A1 and A2 happen. Over time,they interact and evolve, untileventually B happens.Meanwhile, A1 and A2continue to happen.
4Multiple
A1 B A2
The phenomenon is seen asan effect produced bymultiple causal elements. Allare necessary; if one isremoved the effect is notproduced.
A1 and A2 cause B when theyboth happen at the same time.
3Justified A B
The phenomenon is seen asan effect produced by a singlecausal element. Justificationor a mechanism is necessary.
A causes B, and this is how.
2Elemental
A BThe phenomenon is seen asan effect produced by a singlecausal element. Justificationor a mechanism is notnecessary.
A causes B.
1Acausal
BThe phenomenon is seen asan instantiation of reality. Nocause is necessary.
B happens because that’s theway things are.
0Absent
B ?!?The phenomenon issurprising. No explanationseems possible.
I can’t explain why Bhappens.
Figure 3. The qualitative levels of the depth construct.
This construct incorporates two somewhat independent distinctions between different
types of understanding, those with versus without justification, on the one hand, and those
involving single versus multiple causal elements, on the other. In the present depth construct, the

Brown, N. J. S. (2005). The MMCC. Page 8 of 45
Multiple level is above the Justified level. This ordering reflects the hypothesis that a student
performing at the Elemental level on a particular item is more likely to provide justification for a
single causal element, when presented with an easier item, than to incorporate a second element.
Likewise, the hypothesis asserts that a student performing at the Emergent level on a particular
item is more likely to fall back on Multiple understanding, when presented with a more difficult
item, than to fall back on Justified understanding. This hypothesis is the result of previous
research conducted with undergraduate chemistry students on the topic of chemical equilibrium
(Brown, 2001a) and several years of work as a graduate teaching assistant in undergraduate
general chemistry courses. The validity of this ordering is examined in the analysis section.
Level Description of Person Description of Response
SubsurfaceConsistent
Phenomena that share neither a typeof change nor the same objects cannonetheless be caused by the samething.
Explanations for phenomena X and Y,which share neither a process nor thesame actors, are based on the samecausal element.
ProcessConsistent
Phenomena that share a type ofchange can be caused by the samething, even if the objects are different.
Explanations for phenomena X and Y,which share a process but differentactors, are based on the same causalelement.
ActorConsistent
Only phenomena that involve thesame objects can be caused by thesame thing.
Explanations for phenomena X and Y,which share a set of actors, are basedon the same causal element.
DistinctPhenomena are caused by differentthings, even when they involve thesame objects.
Explanations for phenomena X and Y,which involve the same actors, arebased on different causal elements.
Figure 4. The qualitative levels of the breadth construct.
Conceptual breadth
The breadth construct (Figure 4) characterizes four levels of conceptual breadth. These
levels describe a hierarchy of increasingly wider ranges of applicability, i.e., pairs of increasingly

Brown, N. J. S. (2005). The MMCC. Page 9 of 45
diverse phenomena that are explained by the same causal element: (0) no phenomena; (1)
phenomena that share a set of actors, the objects involved in the phenomena; (2) phenomena that
share a process, the type of change (or absence of change) in which the actors are involved; and
(3) phenomena that share neither actors nor processes. The ordering of these levels is again based
upon previous research and teaching experience. The validity of this ordering is examined in the
analysis section.
Conceptual structure vs. correctness
The constructs of depth and breadth are collectively referred to as the Multidimensional
Measure of Conceptual Complexity (MMCC). Importantly, the MMCC does not specify nor
refer to particular normatively-correct concepts or normatively-incorrect misconceptions.
Likewise, while the MMCC does define what constitutes more and less depth and more and less
breadth, it is not an assumption of the MMCC that higher levels of either construct represent
better understanding. A particular scientific concept does not necessarily incorporate multiple
causal elements, nor does it apply to all conceivable pairs of phenomena in the world. For a
given topic in the classroom, the goal of instruction will be a point somewhere within the two-
dimensional space defined by the MMCC, but choosing this point will depend on the particular
topic and the goals of the particular teacher, and cannot be specified without this content and
pedagogical knowledge.
The MMCC purposefully focuses on the underlying structural characteristics of
conceptual understanding rather than the correctness of particular conceptions in order to avoid a
focus on the all-or-nothing approach to learning that has characterized previous instruments.
Instead, the MMCC is designed to allow teachers to make use of the extensive literature
describing pedagogical strategies appropriate to different levels of conceptual understanding.

Brown, N. J. S. (2005). The MMCC. Page 10 of 45
These strategies include the use of bridging analogies and anchoring intuitions (Clement, 1993),
benchmark lessons (van Zee & Minstrell, 1997), and microworlds (diSessa, 1988) for students
who rely upon p-prims, a variety of epistemological methods for students who reason using
simplistic theories (Chinn & Brewer, 1993), and representations that emphasize model linkage
for students who are learning to use dynamic systems reasoning (Frederiksen, White, & Gutwill,
1999).
Items
Previous instruments have often required the student to first predict and then explain their
prediction (e.g., Figure 2). The assumption underlying this item type is that the student will
articulate in the second question the understanding they used to answer the first question. There
are several reasons to suspect the validity of this assumption. First, the student may not be an
especially good judge of how they made their prediction, especially if their conceptual
understanding is inarticulate. Reflection after the fact may lead to an explanation that does not
accurately capture the student’s understanding. Second, the student may not even have used their
relevant conceptual understanding to make the prediction, relying instead upon memorized facts,
clues in the problem statement, or guessing strategies. In this case, the prediction may have little
to do with the student’s underlying conceptual understanding. Third, when presented with a list
of possible explanations, the student may abandon or forget their own explanation and instead
choose the best-sounding among those listed. Again, this may have little to do with the student’s
actual understanding of the phenomenon.
Mindful of these issues, items on this instrument were written so as not to confound the
possibly distinct activities of predicting and explaining and to avoid the temptations of distractor-
laden lists of choices. Consequently, the instrument consists of nine open-ended, free-response

Brown, N. J. S. (2005). The MMCC. Page 11 of 45
questions that prompt the student to explain why a particular chemical phenomenon occurs. Each
of the nine questions constitutes an item for the depth construct, while each of the 36 distinct
pairings of questions constitutes an item for the breadth construct. In order to ensure a
substantive number of each of the three types of pairings involved in the breadth construct
(pairings that share actors, pairings that share processes, and pairings that share neither), the nine
questions were designed to occupy a fully-crossed space of three types of actors and three types
of process (Figure 5). The actual questions are shown in Appendix A.
Processes
Reactions stop at acertain point
Reactions stop at adifferent point whenthe temperature is
changed
Reactions stop at adifferent point whenthe substances are
changedSolids dissolving
in water Question 1 Question 2 Question 3
Liquids evaporatingin air Question 4 Question 5 Question 6
Act
ors
Acids dissociatingin water Question 7 Question 8 Question 9
Figure 5. Design of the nine items, encompassing three sets of actors and three processes.
The nine phenomena in these questions were chosen based upon their importance in the
general chemistry curriculum, covering the central topics of solution, phase, and acid-base
equilibrium. The questions were subjected to three rounds of review and revision by
measurement experts and content experts in chemistry. Because students often use scientific
terminology without understanding, the test instructions (Appendix A) ask the students to phrase
their explanations as if talking to a friend who has never taken a chemistry course, and who
doesn’t understand scientific terms such as equilibrium or saturated. This attempt was mostly
Brown, N. J. S. (2005). The MMCC. Page 12 of 45
successful; only 4% of student responses relied upon scientific terms to the extent that they
couldn’t be scored or analyzed.
Subjects
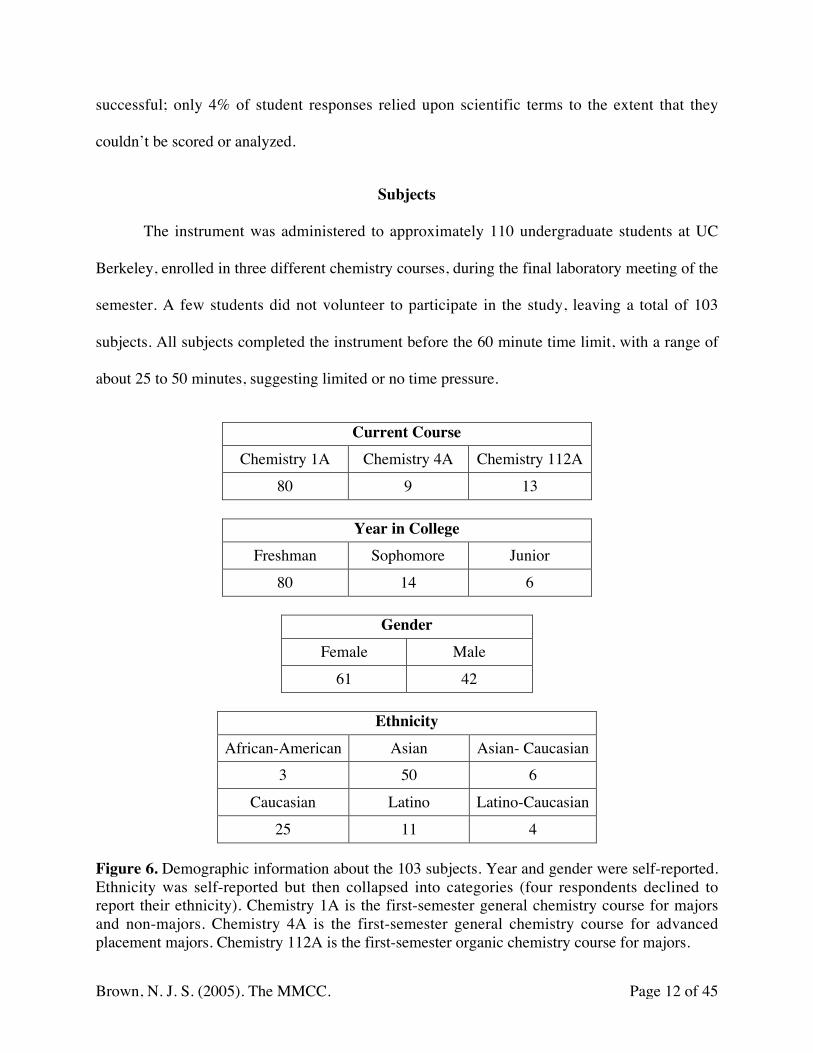
The instrument was administered to approximately 110 undergraduate students at UC
Berkeley, enrolled in three different chemistry courses, during the final laboratory meeting of the
semester. A few students did not volunteer to participate in the study, leaving a total of 103
subjects. All subjects completed the instrument before the 60 minute time limit, with a range of
about 25 to 50 minutes, suggesting limited or no time pressure.
Current CourseChemistry 1A Chemistry 4A Chemistry 112A
80 9 13
Year in CollegeFreshman Sophomore Junior
80 14 6
GenderFemale Male
61 42
EthnicityAfrican-American Asian Asian- Caucasian
3 50 6Caucasian Latino Latino-Caucasian
25 11 4
Figure 6. Demographic information about the 103 subjects. Year and gender were self-reported.Ethnicity was self-reported but then collapsed into categories (four respondents declined toreport their ethnicity). Chemistry 1A is the first-semester general chemistry course for majorsand non-majors. Chemistry 4A is the first-semester general chemistry course for advancedplacement majors. Chemistry 112A is the first-semester organic chemistry course for majors.

Brown, N. J. S. (2005). The MMCC. Page 13 of 45
After completing the instrument, each subject was asked to self-report the following
information on a short survey: gender, date of birth, current year in school, ethnicity, high school
GPA, undergraduate GPA, SAT scores (verbal, math, and total), and the number of chemistry
courses taken at all levels of education. Some of the demographic information from this survey is
shown in Figure 6.
Outcome Spaces
Depth codes
The responses of the 103 subjects to the nine questions were each coded using the depth
construct as a guide. Each response was assigned a unique level based upon the general
descriptions in Figure 3 and the specific criteria discussed below.
The instructions (Appendix A) asked students to explicitly state if they were unable to
give an explanation for the phenomenon, rather than leaving the question blank. For this reason,
responses were only coded as Absent if this statement was present. Blank responses were treated
as missing data, along with intentionally off-topic responses and responses that indicated the
subject did not understand the question (and, hence, answered a different question than the one
asked). All in all, 9% of the responses were coded as missing, leaving more than enough linkages
in the data for a successful Rasch analysis.
A response was coded as Acausal if cause was not assigned to any specific actor. For
example, the statement “no more salt dissolves in the water” is considered purely descriptive,
because the verb dissolve has no object (“in the water” being a prepositional phrase describing
where the dissolving is occurring). In contrast, the statement “the water can’t dissolve any more
salt” has assigned cause, albeit implicitly, to the water rather than the salt or some other actor

Brown, N. J. S. (2005). The MMCC. Page 14 of 45
because the verb dissolve has the object salt. This second statement would be coded as
Elemental.
The statement “the water can’t dissolve any more salt” is Elemental rather than Justified
because no additional information is presented as backing for this claim. The question “Why
can’t the water dissolve any more salt?” is left unanswered. For this response, a suitable backing
might take the form of a statement like “because more salt would be too heavy” or “because each
water molecule is already attached to a salt ion and there aren’t any more water molecules left to
carry any additional salt ions.” Responses that include backings like these were coded as
Justified (regardless of whether the backing is warranted or correct).
A response that incorporated more than one causal element was coded as Multiple if it
treated the elements as independent, and as Emergent if it included a description of how the
elements interact with each other. For example, the statement “the rate at which salt dissolves in
the water is equal to the rate at which it becomes salt again” would be coded as Multiple, while
the statement “salt dissolves in the water, and as it builds up in the water it starts to turn back
into salt again, which happens faster and faster until its happening at the same speed the salt is
dissolving at” would be coded as Emergent.
These general coding criteria were applied to all of the items. One of the interesting
features of this dataset is that there are multiple ways to achieve each level. The levels of the
depth construct do not specify which particular causal element must be used; consequently,
responses relying upon different elements fall into distinct categories within each level. In
Appendix B, example responses are shown for each category within each level for the first item.

Brown, N. J. S. (2005). The MMCC. Page 15 of 45
Breadth codes
While the particular causal element(s) do not affect the depth codes, they form the basis
of the breadth codes. For each of the 36 distinct pairings of phenomena, a code of 1 was given if
the two responses relied upon the same causal element, regardless of the depth of the two
responses; 0 otherwise. For example, if the first two phenomena on the instrument were both
explained by appealing to the limited capacity of water for holding dissolved salt particles, then
the student would receive a score of 1 on the first breadth item. This would be the case whether
the two explanations were both Elemental in depth, if one was Elemental and one was Justified,
or any other combination of depth codes.
Measurement Model
The coded data were modeled using the multidimensional random coefficients
multinomial logit (MRCML) model, a generalized Rasch model that allows the construction of
specific submodels to satisfy particular requirements (Adams, Wilson, & Wang, 1997). In the
present case, a two-dimensional model was used, combining Masters’ (1982) partial credit model
(PCM) for the depth data with the simple logistic model for the dichotomous breadth data. As the
items associated with each construct are distinct, this model is an example of between-item
multidimensionality (Briggs & Wilson, 2003; Wang, Wilson, & Adams, 1997; 1998).
Specifically, the model represents the locations of the 103 individuals (n = 1, …, 103)
within the two-dimensional latent space (d = 1, 2) by the vectors θn = (θn1, θn2). A unique set of Id
items (i = 1, …, Id) is associated with each dimension, where I1 = 9 and I2 = 36 for the depth and
breadth dimensions, respectively. Each item admits Kd + 1 response categories (k = 0, …, Kd),
where K1 = 5 and K2 = 1.
Brown, N. J. S. (2005). The MMCC. Page 16 of 45
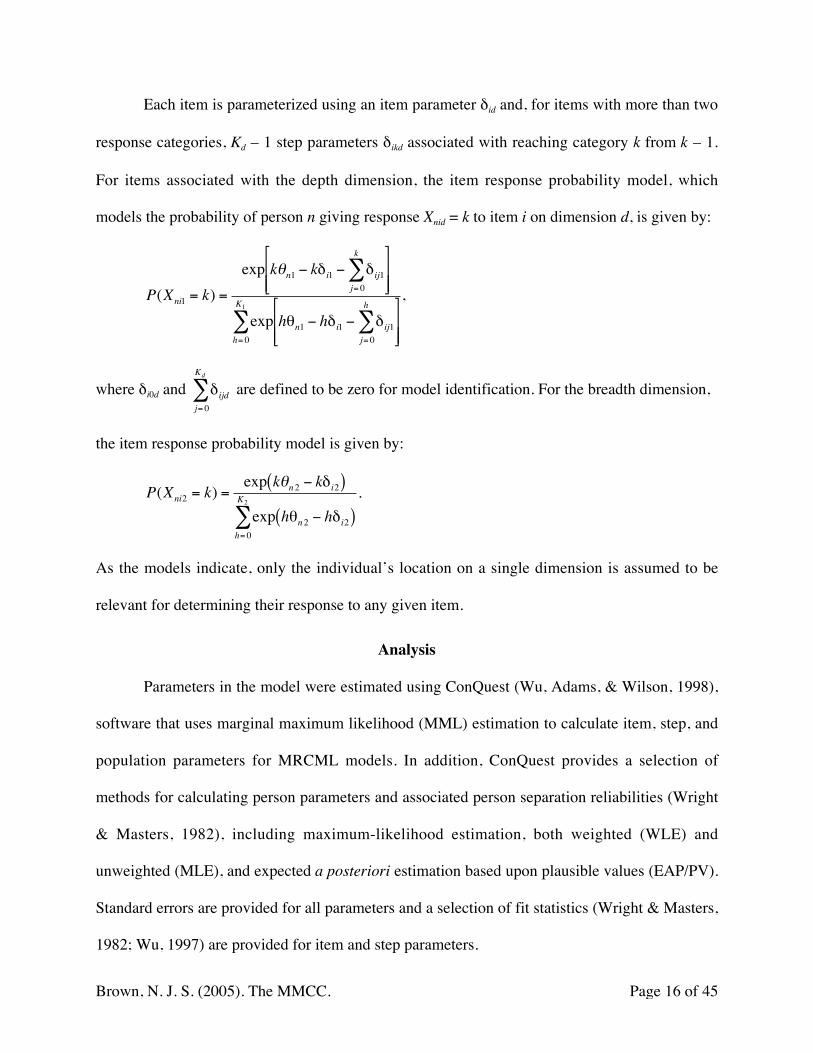
Each item is parameterized using an item parameter δid and, for items with more than two
response categories, Kd – 1 step parameters δikd associated with reaching category k from k – 1.
For items associated with the depth dimension, the item response probability model, which
models the probability of person n giving response Xnid = k to item i on dimension d, is given by:
€
P(Xni1 = k) =
exp kθn1 − kδi1 − δij1j= 0
k
∑
exp hθn1 − hδi1 − δij1j= 0
h
∑
h= 0
K1
∑,
where δi0d and
€
δijdj= 0
Kd
∑ are defined to be zero for model identification. For the breadth dimension,
the item response probability model is given by:
€
P(Xni2 = k) =exp kθn2 − kδi2( )
exp hθn2 − hδi2( )h= 0
K2
∑.
As the models indicate, only the individual’s location on a single dimension is assumed to be
relevant for determining their response to any given item.
Analysis
Parameters in the model were estimated using ConQuest (Wu, Adams, & Wilson, 1998),
software that uses marginal maximum likelihood (MML) estimation to calculate item, step, and
population parameters for MRCML models. In addition, ConQuest provides a selection of
methods for calculating person parameters and associated person separation reliabilities (Wright
& Masters, 1982), including maximum-likelihood estimation, both weighted (WLE) and
unweighted (MLE), and expected a posteriori estimation based upon plausible values (EAP/PV).
Standard errors are provided for all parameters and a selection of fit statistics (Wright & Masters,
1982; Wu, 1997) are provided for item and step parameters.

Brown, N. J. S. (2005). The MMCC. Page 17 of 45
Wright maps
Item, step, and person parameters are most efficiently and meaningfully displayed in a
Wright map (Wilson, 2004), which plots the parameters on their common scale. In Figure 7,
which displays the Wright map for the depth construct, the person parameters (MLEs) appear in
a histogram to the left of the scale and the item and step parameters appear to the right of the
scale. To aid interpretation, the item and step parameters have been converted into Thurstonian
thresholds. The thresholds, labeled i.k, are displayed in columns, with the thresholds for each
item appearing in a separate column.
Each threshold is located at the point on the scale at which a person would have to be
located in order to have a 50% chance of achieving that level (k) or a higher level. For each
threshold, people who are located above the threshold have a greater than 50% chance of
achieving at least that level on that item, while people below the threshold have less than a 50%
chance. In general, people near the bottom of the scale are likely to exhibit low levels of depth on
all the items, while people near the top are likely to do exhibit high levels of depth. Levels of
depth represented by thresholds near the bottom of the scale are likely to be achieved by nearly
all the people, while levels near the top are achieved relatively infrequently. The common scale
is interval, but not ratio, so the choice of an origin is arbitrary and has been set at the average of
the person locations.
In Figure 8, the same data is displayed by grouping thresholds corresponding to the same
level of depth. This particular representation highlights the relationship between the Wright map
and the depth construct illustrated in Figure 3.

Brown, N. J. S. (2005). The MMCC. Page 18 of 45
| 1.5 2.4 | | 6.5 7.5 | | | | | | | | | | | | | | | | | | | | | | | | | | | | | XX| | | | | | | | | -|- 2 | | | | | | | | | | | | | | | | | | | | | | | | | | | | | | | | | 8.4 | | | | | 5.4 6.4 | | | X| | | | | | | | | | | | | | | | | 9.4 XX| 1.4 | | 4.5 | | | | | | | | | | | | | | | X| | | | | | | | | | X| | | | | | | | | | | | | | | | | | | 9.3 XXXX|- 1 | | | | | | | | | | | | | | | | | | | XX| | | | | 5.3 | | 8.3 | | | | | | | | | | | XXX| | | | | | | | | | X| | | | | | | | | | XX| | | | | | | | | | XXXX| | | | | | | | | | XXXXX| | | | | | | | | | XXXXX| | | | | | 6.3 7.4 | | XXXXXXX| 1.3 2.3 3.3 | | | | | | XX| | | | 4.4 | | | | | XXXXXXXXXX| | | | | | | | | | XXXXXXXXXX|- 0 | | | | | | | | | XX| | | | 4.3 | | | | | XXXXXXXX| | | | | | | | | | XX| | | | | | | 7.3 | | XXXXXX| | | | | | | | | | XX| | | | | | | | | | XXX| | | | | | | | | | X| | | | | | | | | | X| | | | | | | | | | X| | | | | | | | | | XXX| | | 3.2 | | | | | | XX| | | | | | | | | 9.2 -|- -1 | | | | | | 7.2 | | X| | | | | | | | | | | | | | | | 6.2 | | | XX| | | | | | 6.1 | 8.2 | X| 1.2 | | | | 7.1 8.1 | X| | 2.2 | | | | XX| | | 3.1 | 5.2 9.1 X| | | | | | | | | | | | | | | | | | | | | | | | | -|- -2 | | 4.2 | | | | | | X| | 2.1 | | | | | | | | | | | | 4.1 5.1
Figure 7. Wright map for the depth construct, showing MLEs for the subjects and Thurstonianthresholds for the items, grouped by item. Each X represents one subject.

Brown, N. J. S. (2005). The MMCC. Page 19 of 45
| 2.4 1.5 6.5 7.5 | | | XX| -|- 2 | | | 8.4 | 5.4 6.4 X| | 9.4 XX| 1.4 4.5 | X| X| | 9.3 XXXX|- 1 | XX| 5.3 8.3 | XXX| X| XX| XXXX| XXXXX| XXXXX| 6.3 7.4 XXXXXXX| 1.3 2.3 3.3 XX| 4.4 XXXXXXXXXX| XXXXXXXXXX|- 0 XX| 4.3 XXXXXXXX| XX| 7.3 XXXXXX| XX| XXX| X| X| X| XXX| 3.2 XX| 9.2 -|- -1 7.2 X| | 6.2 XX| 6.1 X| 7.1 8.1 1.2 8.2 X| 2.2 XX| 3.1 9.1 5.2 X| | | | | -|- -2 4.2 | X| 2.1 | | | 4.1 5.1
Figure 8. Wright map for the depth construct, showing MLEs for the subjects and Thurstonianthresholds for the items, grouped by level of depth. Each X represents one subject.

Brown, N. J. S. (2005). The MMCC. Page 20 of 45
The Wright maps indicate the average student in this sample has just less than a 50%
chance of scoring at least a 3 (Justified) on an average item; their most likely response is a 2
(Elemental). These subjects are beginning to give justified explanations; the use of multiple
causal elements is unlikely for most, but has a greater than 50% chance of occurring for some
students on some items.
The partial credit model allows the distance between consecutive thresholds to vary from
item to item, which means that within different response categories different items can be the
most difficult. Despite this freedom in the model, Item 4 is consistently the easiest or the second
easiest item. This is consistent with expectations, as Item 4, which deals with the evaporation of
water, is a canonical textbook example in which the scientific explanation for the phenomenon
(which happens to be Emergent) is explicitly taught. In contrast, items dealing with acid-base
equilibria (Items 7-9) or with the comparison of two similar substances (Items 3, 6, and 9) tend
to be relatively difficult. In general chemistry, acid-base equilibrium is usually taught as a series
of memorized algorithms for solving quantitative problems; not much focus is placed on its
conceptual aspects. Likewise, little attention is given to explaining why the equilibrium constant
is different for different substances, so student explanations are expected to be less deep.
Figure 9 illustrates the locations of the subjects within the two-dimensional space defined
by the depth and breadth constructs. The Wright map for the depth construct from Figure 8 is
reproduced along the x–axis, and a Wright map for the breadth construct is displayed along the
y–axis. On the breadth Wright map, items are labeled simply with i, as there is only one item
parameter for each dichotomous item. The 36 items are grouped by the type of phenomena
pairing they involve. On the far left are items that pair phenomena sharing a common set of
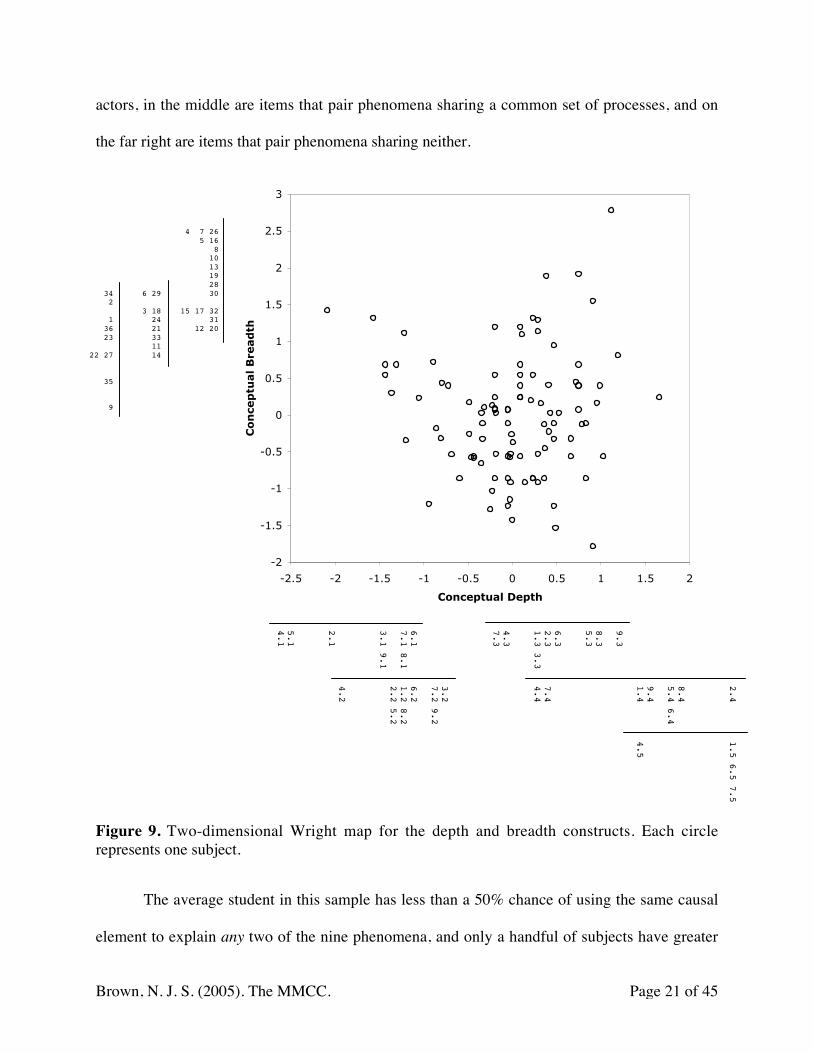
Brown, N. J. S. (2005). The MMCC. Page 21 of 45
actors, in the middle are items that pair phenomena sharing a common set of processes, and on
the far right are items that pair phenomena sharing neither.
-2
-1.5
-1
-0.5
0
0.5
1
1.5
2
2.5
3
-2.5 -2 -1.5 -1 -0.5 0 0.5 1 1.5 2
Conceptual Depth
Co
nce
ptu
al
Bre
ad
th
Figure 9. Two-dimensional Wright map for the depth and breadth constructs. Each circlerepresents one subject.
The average student in this sample has less than a 50% chance of using the same causal
element to explain any two of the nine phenomena, and only a handful of subjects have greater
4 7 26 5 16 8 10 13 19 28 34 6 29 30 2 3 18 15 17 32 1 24 31 36 21 12 20 23 33 1122 27 14
35
9
2.4 1.5 6.5 7.5
8.4 5.4 6.4
9.4 1.4 4.5
9.3
8.35.3
6.32.3 7.41.3 3.3 4.4
4.37.3
3.2 7.2 9.2
6.1 6.27.1 8.1 1.2 8.2 2.2 5.23.1 9.1
4.22.1
5.14.1

Brown, N. J. S. (2005). The MMCC. Page 22 of 45
than a 50% chance of using the same causal element to explain two phenomena that share neither
a common set of actors nor a common process. This is somewhat surprising, as all nine of the
phenomena would be considered examples of chemical equilibrium by an expert.
The correlation between the two dimensions is negligible (r = –0.043), suggesting that
depth and breadth are uncorrelated dimensions of student conceptual understanding for these
subjects on this topic, and deserve to be treated separately.
Level ordering
One of the assumptions of the Rasch family of models is that the levels of the construct
are hierarchically ordered. Whether or not the data support this assumption is a critical factor in
establishing construct validity. For partial credit items on the depth construct, an important test is
whether the mean location of the people who achieved a particular response level increases as
the level increases. In other words, for each item, the mean location of students achieving the
Elemental level should be higher than the mean location of students achieving the Acausal level,
and likewise for each consecutive pair of response levels. This was indeed the case for all nine
depth items. Moreover, as illustrated in Figure 7, successive thresholds within each item are
separated on average by 1.5 units on the scale, indicating substantive differences between the
qualitative levels of the depth construct. (The proximity of the first two thresholds for many of
the items reflects, not an ordering problem, but the relatively small number of subjects exhibiting
the Acausal level.)
As illustrated in Figure 8, there is substantial overlap between most adjacent groups of
thresholds on both the depth and breadth constructs. The only exception is the separation
between the second and third groups of thresholds on the depth construct. This degree of overlap
implies that individual students do not exhibit a single level of either depth or breadth across all

Brown, N. J. S. (2005). The MMCC. Page 23 of 45
of the items on this instrument, a result consistent with the expectation that particular topics
within chemical equilibrium are expected to be substantively more difficult than others. As
described above, phase equilibrium, especially involving water, appears to elicit deeper
explanations than acid-base equilibrium.
Parameter fit
Fit statistics for the item parameters were satisfactory. The weighted meansquare fit
statistics (Wright & Masters, 1982; Wu, 1997) for the item and step parameters for the depth
construct were roughly symmetrically-distributed about 1.00, ranging from 0.79 to 1.18 (Figure
10). The corresponding fit statistics for the breadth construct were similarly distributed, ranging
from 0.85 to 1.17 (Figure 11). These distributions, with the absence of clear outliers, suggest the
randomness in the data is modeled well by the Rasch model, supporting the conclusion that these
constructs are individually unidimensional.
0
2
4
6
8
10
12
14
Figure 10. Distribution of the weighted meansquare fit statistics for the item and step parametersfor the depth construct.
0.75 0.80 0.85 0.90 0.95 1.00 1.05 1.10 1.15 1.20 1.25

Brown, N. J. S. (2005). The MMCC. Page 24 of 45
0
2
4
6
8
10
Figure 11. Distribution of the weighted meansquare fit statistics for the item parameters for thebreadth construct.
0
2
4
6
8
10
12
Figure 12. Distribution of the weighted meansquare fit statistics for the person parameters forthe depth construct.
In contrast, the weighted meansquare fit statistics for the person parameters for the depth
construct form a highly skewed distribution with a substantial number of apparent outliers
(Figure 12). These students exhibit substantively more randomness in their pattern of responses
0.75 0.80 0.85 0.90 0.95 1.00 1.05 1.10 1.15 1.20 1.25
0.0 0.5 1.0 1.5 2.0 2.5 3.0

Brown, N. J. S. (2005). The MMCC. Page 25 of 45
than expected from the model. Examination of these subjects’ response patterns indicated that
the most common surprise was an unexpectedly high response at the Multiple level.
These unexpected responses suggest a possible problem with the depth construct for these
subjects. As described above, the Multiple level was placed above the Justified level based upon
previous research and teaching experience. However, for a minority of students it is apparently
easier to incorporate more than one causal element in their understanding than to provide
justification for a single element. In subsequent analyses, it may be beneficial to split the depth
construct into two sub-constructs, one dealing with the number and composition of the causal
elements and the other dealing with the level of justification provided. On average, however, the
ordering of the levels in the construct appears to be satisfactory.
Reliability
The Wright maps in Figures 7–9 indicate that the items provide good coverage for this
sample of students. This contributes to a relatively small standard error of measurement for the
person parameters. For the depth construct, for example, standard errors for persons with
complete data ranged from 0.28 to 0.38 logits. At the high end of this range, this corresponds to a
95% confidence interval with a width of 1.5 units on the depth scale, comparable to the average
separation between consecutive levels. This suggests that the instrument is successful at reliably
locating individuals within the qualitative levels of the construct, satisfying the necessary
requirements for using the instrument for individual diagnosis.
However, because the distribution of this sample is relatively narrow, the separation
reliabilities (Wright & Masters, 1982) for the two constructs are only moderate (Table 1). This
suggests that the instrument would not be particularly useful for making fine distinctions
between the undergraduate students in these courses; however, this was not one of the intended

Brown, N. J. S. (2005). The MMCC. Page 26 of 45
purposes of the instrument. Although inter-rater reliability is clearly of great concern, that
analysis was not conducted for this report.
Dimension Reliability Type Reliability ValueMLE 0.692WLE 0.698Depth
EAP/PV 0.695MLE 0.697WLE 0.685Breadth
EAP/PV 0.664
Table 1. Person separation reliabilities for the depth and breadth constructs.
Differential item functioning with respect to gender
Using the self-reported gender data from the survey, the existence of differential item
functioning with respect to gender was investigated. The subjects were split into two subgroups,
male and female, and the item parameters for the depth construct were re-estimated for each
subgroup independently. The standard errors for the parameters were used to give an
approximate α = 0.05 significance test, using the formula:
€
δm −δ f < 1.96 εm2 +ε f
2
where δm and δf are the parameter estimates for the male and female subgroups, respectively, and
εm and εf are the standard errors of those estimates. For each item, the left-hand side was smaller
than the right-hand side, indicating no significant difference between males and females at the
95% confidence level.
Correlations with external measures
Correlations between the MLEs of the person locations on the depth construct and several
external variables were calculated (Table 2).

Brown, N. J. S. (2005). The MMCC. Page 27 of 45
External variable Correlation
Gender –0.02
Verbal SAT score 0.11
Math SAT score 0.11
Total SAT score 0.21
Number of chemistry courses taken 0.08
Table 2. Correlations between subjects’ locations on the depth construct and several externalvariables.
The instrument does not appear to be related to gender, and there are weak to extremely
weak (and largely insignificant) correlations with the other external variables. Not surprisingly,
this instrument measures something substantively different from the SAT. More surprisingly,
there is almost no correlation between this instrument and the number of chemistry courses taken
by the subjects. For these students, who have a relatively narrow range of prior chemistry
experience, most of the difference in the number of chemistry courses taken has to do with
whether the student has taken AP chemistry in high school or not. AP chemistry courses are
somewhat notorious for emphasizing quantitative problem-solving procedures in preparation for
the AP exam. In contrast, this instrument emphasizes qualitative conceptual understanding,
which may help to explain this low correlation.
Summary
Validity evidence
The MMCC shows strong evidence for validity in the following senses.
Construct validity. The instrument is predicated upon two well-defined constructs,
conceptual depth and conceptual breadth, and the analysis indicated that the data fit the model
Brown, N. J. S. (2005). The MMCC. Page 28 of 45
that uses these constructs to define the ordering of responses. For the partial credit items, within-
item ordering of the levels follows that specified by the depth construct, as indicated by the mean
location of respondents within each level. For all the items, parameter fit statistics were
symmetrically distributed without outliers, indicating a good fit of the data to the assumptions of
the model. Parameter fit statistics for the person locations on the depth construct indicated a
possible misordering of the levels Justified and Multiple for a minority of the subjects. This
suggests the depth construct may be better understood as a combination of two sub-constructs of
composition, on the one hand, and justification, on the other hand. Investigation of this
possibility is underway.
Content validity. The instrument was reviewed by content experts in chemistry,
including professors who have taught general chemistry. They characterized the content as valid
but difficult. As the subjects had no difficulty in responding to the questions on the instrument,
the characterization of difficulty is taken as evidence that these items have both a low floor and a
high ceiling, allowing meaningful responses to be given by both novices and experts.
Bias and differential item functioning. The instrument does not exhibit gender effects,
and the individual items do not exhibit differential functioning with respect to gender. The
effects of other external variables, such as ethnicity, have not yet been investigated.
External validity. This instrument has not yet been directly compared to other
assessments purporting to measure conceptual understanding of general chemistry. Somewhat
surprisingly, there is a negligible correlation between students’ positions on the depth scale and
the number of chemistry courses they have taken. As discussed above, this may be due to the
relatively narrow distribution of chemistry experience in the sample, and may also reflect the

Brown, N. J. S. (2005). The MMCC. Page 29 of 45
instrument’s emphasis on qualities of student conceptual understanding not typically valued in
secondary science education.
Consequential validity. An important aspect of validity is whether the purpose of the
instrument’s use can be subverted by methods that increase student performance without
increasing the latent ability the instrument is intended to measure. For traditional standardized
tests, such methods include teaching to the test or student memorization of specific items.
In this instrument, the open-ended item format makes it difficult for students to memorize
correct responses. More importantly, however, the questions directly elicit the desired behavior,
namely explaining scientific phenomena, rather than serving as indirect indicators. In this sense,
the instrument is more like a performance assessment than a traditional standardized test.
Consequently, teaching to the test becomes a desired pedagogical outcome, as it is precisely the
ability to respond to these items that is valued.
Reliability evidence
Separation reliability (Wright & Masters, 1982) was moderate, but found to be
substantively high when the standard error of measurement was compared to the quantified
length of the construct. In this latter sense, students were reliably located within single levels of
the construct. Inter-rater reliability has not yet been investigated.
Student performance
These students, a sample of undergraduate students studying general chemistry at UC
Berkeley, exhibit surprisingly little depth and breadth when responding to these items. The
average student is using Elemental or lower levels of depth roughly half the time; students at the
top of the depth scale are just beginning to use Multiple and Emergent explanations, which are
the types of explanation expected of students in these courses. On the breadth scale, the average

Brown, N. J. S. (2005). The MMCC. Page 30 of 45
student is using the same explanation for more than one phenomena less than half the time, and
only the students at the top of the scale are beginning to see the connections between different
forms of chemical equilibrium. For the large majority of the students, solubility, phase, and acid-
base equilibrium are treated as separate phenomena.
These results are surprising given that the data comes from students at the end of courses
that cover the content on the instrument. However, based upon my experience as a teaching
assistant for similar courses, instruction rarely focuses on developing students’ ability to explain
scientific phenomena without relying upon scientific terminology. Terms, such as equilibrium,
are often used as crutches by students who use them to answer questions on course exams
without understanding what they mean. In contrast, this instrument asks for explanations in
everyday language, removing this crutch and exposing the underlying structure of their
understanding.
References
Adams, R. J., Wilson, M., & Wang, W. (1997). The multidimensional random coefficientsmultinomial logit model. Applied Psychological Measurement, 21, 1-23.
Briggs, D. C. & Wilson, M. (2003). An introduction to multidimensional measurement usingRasch models. Journal of Applied Measurement, 4, 87-100.
Brown, N. J. S. (2001a). Heterogeneous equilibrium: A reformulation. Unpublished paper.University of California, Berkeley.
Brown, N. J. S. (2001b). Measuring conceptual understanding of chemical equilibrium:Instrument development. Unpublished paper. University of California, Berkeley.
Brown, N. J. S. (2002). Measuring conceptual understanding of chemical equilibrium: Itembundle behavior. Unpublished paper. University of California, Berkeley.
Brown, N. J. S. (2003a). Modeling conceptual strands using the ordered partition model.Unpublished paper. University of California, Berkeley.
Brown, N. J. S. (2003b). Multidimensional measure of conceptual complexity. Unpublishedpaper. University of California, Berkeley.

Brown, N. J. S. (2005). The MMCC. Page 31 of 45
Brown, N. J. S. (2004). Measuring conceptual understanding of chemical equilibrium: A casestudy. In M. Wilson, Constructing measures: An item response modeling approach(supplemental material). Mahwah, NJ: Lawrence Erlbaum.
Chi, M. T. H., Slotta, J. D., & de Leeuw, N. A. (1994). From things to processes: A theory ofconceptual change for learning science concepts. Learning and Instruction, 4, 27-43.
Chinn, C. A. & Brewer, W. F. (1993). The role of anomalous data in knowledge acquisition: Atheoretical framework and implications for science instruction. Review of EducationalResearch, 63, 1-49.
Clement, J. (1993). Using bridging analogies and anchoring intuitions to deal with students’preconceptions in physics. Journal of Research in Science Teaching, 30, 1241-1257.
diSessa, A. A. (1988). Knowledge in pieces. In G. Forman & P. Pufal (Eds.), Constructivism inthe Computer Age (49-70). Hillsdale, NJ: Lawrence Erlbaum.
diSessa, A. A. (1993). Toward an epistemology of physics. Cognition and Instruction, 10, 105-225.
diSessa, A. A. & B. L. Sherin (1998). What changes in conceptual change? International Journalof Science Education, 20(10), 1155-1191.
Frederiksen, J. R., White, B. Y., & Gutwill, J. (1999). Dynamic mental models in learningscience: The importance of constructing derivational linkages among models. Journal ofResearch in Science Teaching, 36, 806-836.
Gopnik, A. & Wellman, H. M. (1994). The theory theory. In L. A. Hirschfeld & S. A. Gelman(Eds.), Mapping the mind: Domain specificity in cognition and culture (pp. 257-293).Cambridge, England: Cambridge University Press.
Hestenes, D., Wells, M., & Swackhamer, G. (1992). Force concept inventory. The PhysicsTeacher, 30, 141-158.
Masters, G. N. (1982). A Rasch model for partial credit scoring. Psychometrika, 47, 149-174.
Mulford, D. R. & Robinson, W. R. (2002). An inventory for alternate conceptions among first-semester general chemistry students. Journal of Chemical Education, 79, 739-744.
Slotta, J. D., Chi, M. T. H., & Joram, E. (1995). Assessing students’ misclassifications of physicsconcepts: An ontological basis for conceptual change. Cognition and Instruction, 13,373-400.
Smith, J. P., diSessa, A. A., & Roschelle, J. (1993). Misconceptions reconceived: Aconstructivist analysis of knowledge in transition. Journal of the Learning Sciences, 3,115-163.

Brown, N. J. S. (2005). The MMCC. Page 32 of 45
Strike, K. A. & Posner, G. J. (1992). A revisionist theory of conceptual change. In R. A. Duschl& R. J. Hamilton (Eds.), Philosophy of science, cognitive psychology, and educationaltheory and practice (pp. 147-176). Albany, NY: State University of New York Press.
van Zee, E. & Minstrell, J. (1997). Using questioning to guide student thinking. Journal of theLearning Sciences, 6, 227-269.
Vosniadou, S. (1994). Capturing and modeling the process of conceptual change. Learning andInstruction, 4, 45-69.
Wang, W., Wilson, M., & Adams, R. J. (1997). Rasch models for multidimensionality betweenitems and within items. In M. Wilson & G. Engelhard (Eds.), Objective measurement:Theory into practice (Vol. 4, pp. 139-155). Norwood, NJ: Ablex Publishing.
Wang, W., Wilson, M., & Adams, R. J. (1998). Measuring individual differences in change withmultidimensional Rasch models. Journal of Outcome Measurement, 2, 240-265.
Wilson, M. (2004). Constructing measures: An item response modeling approach. Mahwah, NJ:Lawrence Erlbaum.
Wilson, M. & Adams, R. J. (1995). Rasch models for item bundles. Psychometrika, 60, 181-198.
Wilson, M. & Brown, N. J. S. (2004). Measurement as struggle. Presentation at the InternationalObjective Measurement Workshop (Cairns, Australia).
Wright, B. D. (1997). A history of social science measurement. Educational Measurement:Issues and Practice, 16, 33-45, 52.
Wright, B. D. & Masters, G. N. (1982). Rating scale analysis: Rasch measurement. Chicago, IL:MESA Press.
Wu, M. L. (1997). The Development and Application of a Fit Test for Use with MarginalMaximum Likelihood Estimation and Generalised Item Response Models. UnpublishedMasters Dissertation. University of Melbourne.
Wu, M. L., Adams, R. J., & Wilson, M. (1998). ACERConQuest user guide. Hawthorn,Australia: ACER Press.
Brown, N. J. S. (2005). The MMCC. Page 33 of 45
Appendix A: The instrument
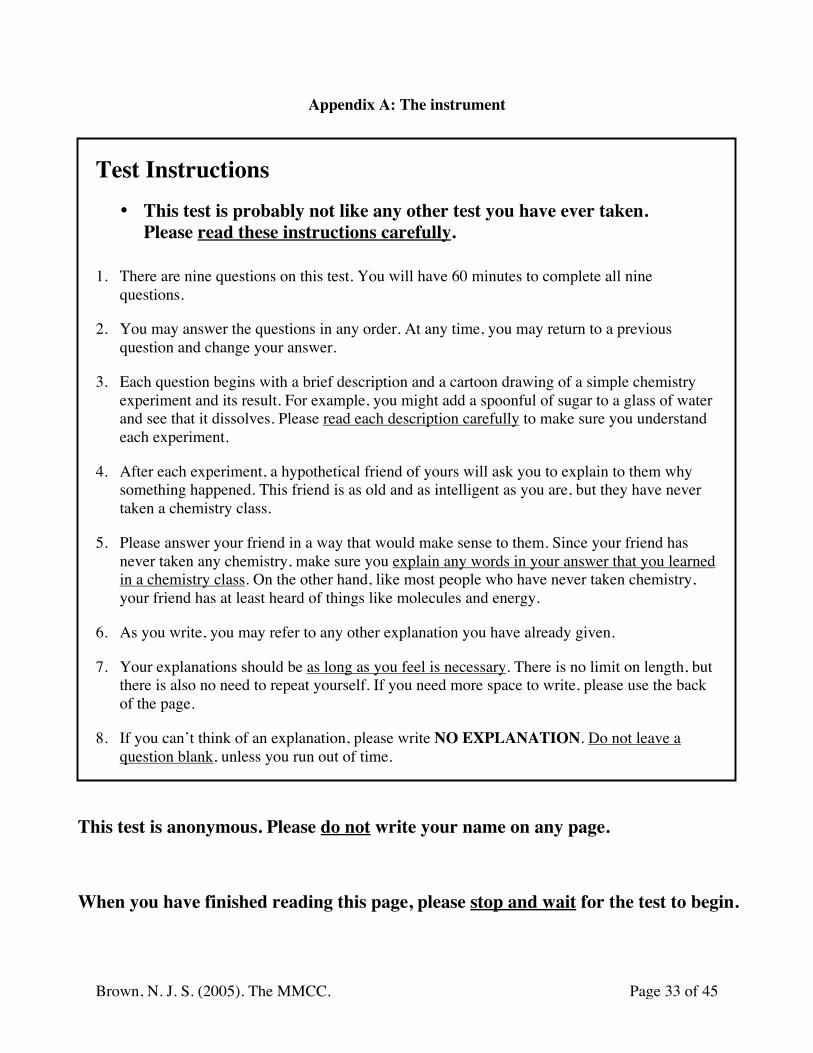
Test Instructions• This test is probably not like any other test you have ever taken.
Please read these instructions carefully.
1. There are nine questions on this test. You will have 60 minutes to complete all ninequestions.
2. You may answer the questions in any order. At any time, you may return to a previousquestion and change your answer.
3. Each question begins with a brief description and a cartoon drawing of a simple chemistryexperiment and its result. For example, you might add a spoonful of sugar to a glass of waterand see that it dissolves. Please read each description carefully to make sure you understandeach experiment.
4. After each experiment, a hypothetical friend of yours will ask you to explain to them whysomething happened. This friend is as old and as intelligent as you are, but they have nevertaken a chemistry class.
5. Please answer your friend in a way that would make sense to them. Since your friend hasnever taken any chemistry, make sure you explain any words in your answer that you learnedin a chemistry class. On the other hand, like most people who have never taken chemistry,your friend has at least heard of things like molecules and energy.
6. As you write, you may refer to any other explanation you have already given.
7. Your explanations should be as long as you feel is necessary. There is no limit on length, butthere is also no need to repeat yourself. If you need more space to write, please use the backof the page.
8. If you can’t think of an explanation, please write NO EXPLANATION. Do not leave aquestion blank, unless you run out of time.
This test is anonymous. Please do not write your name on any page.
When you have finished reading this page, please stop and wait for the test to begin.

Brown, N. J. S. (2005). The MMCC. Page 34 of 45
Experiment 1You take an ordinary glass of water and add ten spoonfuls of salt to it. When you stir the water, alot of the salt dissolves. However, some of the salt always remains at the bottom of the glass, nomatter how long you stir or wait.
Before stirring After stirring
← Water ← Salty water
← Salt ← Less salt
Your friend asks you, “Why didn’t all of the salt disappear?”How would you explain this to them?

Brown, N. J. S. (2005). The MMCC. Page 35 of 45
Experiment 2Exactly like in Experiment 1, you take an ordinary glass of water and add ten spoonfuls of saltto it. When you stir the water, a lot of the salt dissolves. However, some of the salt alwaysremains at the bottom of the glass, no matter how long you stir or wait.Now, you take the glass of salty water and you stir it while you heat it on a stove. The rest of thesalt dissolves.
Before heating After heating
← Salty water ← Salty water
← Salt
Your friend asks you, “Why did the rest of the salt disappear when you heated the water?”How would you explain this to them?
Brown, N. J. S. (2005). The MMCC. Page 36 of 45
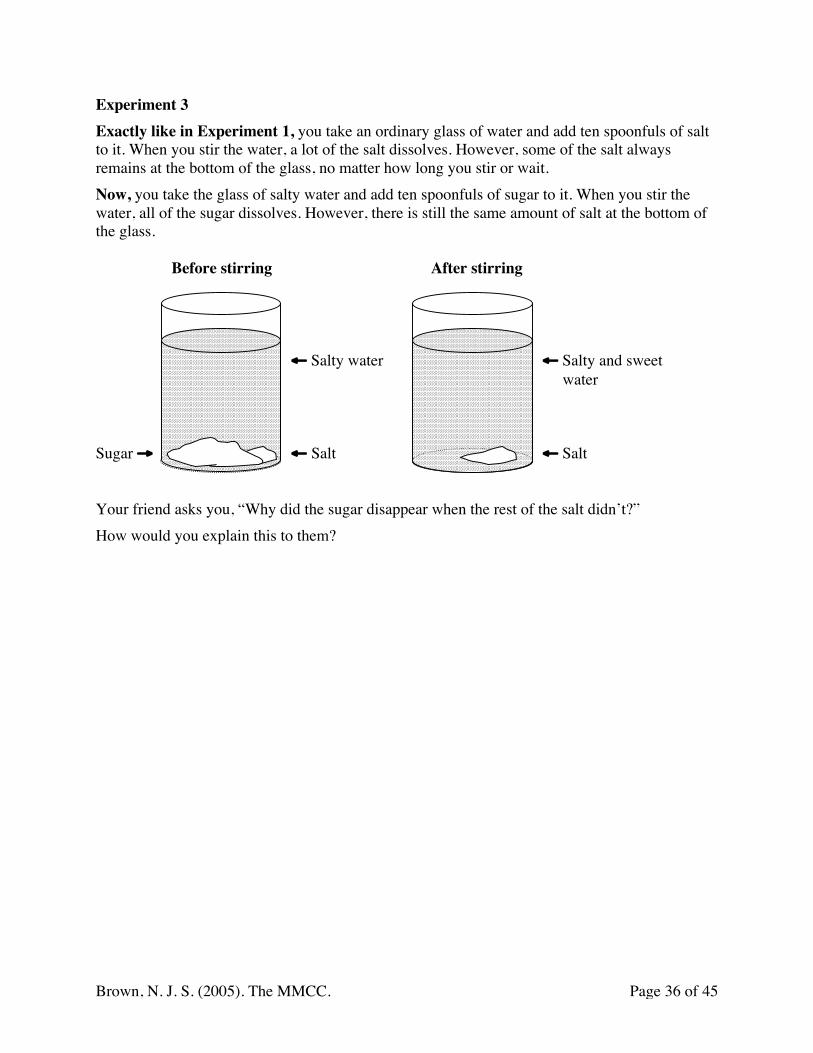
Experiment 3Exactly like in Experiment 1, you take an ordinary glass of water and add ten spoonfuls of saltto it. When you stir the water, a lot of the salt dissolves. However, some of the salt alwaysremains at the bottom of the glass, no matter how long you stir or wait.Now, you take the glass of salty water and add ten spoonfuls of sugar to it. When you stir thewater, all of the sugar dissolves. However, there is still the same amount of salt at the bottom ofthe glass.
Before stirring After stirring
← Salty water ← Salty and sweet water
Sugar → ← Salt ← Salt
Your friend asks you, “Why did the sugar disappear when the rest of the salt didn’t?”How would you explain this to them?

Brown, N. J. S. (2005). The MMCC. Page 37 of 45
Experiment 4You take a glass and put a small amount of water in it. Then you cover the glass with a tight-fitting lid so that nothing can escape. After a few hours, some of the water has evaporated intothe air. However, some of the water always remains at the bottom of the glass, no matter howlong you wait.
Before After
← Dry air ← Air containing water vapor
← Water ← Less water
Your friend asks you, “Why is there still some water left over?”How would you explain this to them?

Brown, N. J. S. (2005). The MMCC. Page 38 of 45
Experiment 5Exactly like in Experiment 4, you take a glass and put a small amount of water in it. Then youcover the glass with a tight-fitting lid so that nothing can escape. After a few hours, some of thewater has evaporated into the air. However, some of the water always remains at the bottom ofthe glass, no matter how long you wait.Now, you take the glass and warm it in a microwave. After a few minutes, less water is at thebottom of the glass.
Before heating After heating
← Air containing ← Air containingwater vapor water vapor
← Water ← Less water
Your friend asks you, “Why did more of the water disappear when you warmed it?”How would you explain this to them?

Brown, N. J. S. (2005). The MMCC. Page 39 of 45
Experiment 6You take a glass and put a small amount of alcohol in it. Then you cover the glass with a tight-fitting lid so that nothing can escape. After a few hours, almost all of the alcohol has evaporatedinto the air. However, a tiny amount of alcohol always remains at the bottom of the glass, nomatter how long you wait.
Before After
← Dry air ← Air containing alcohol vapor
← Alcohol ← Much less alcohol
Your friend asks you, “Why is the amount of alcohol left behind less than the amount of waterleft behind in Experiment 4, when everything else is exactly the same?”How would you explain this to them?

Brown, N. J. S. (2005). The MMCC. Page 40 of 45
Experiment 7Hypochlorous acid (HClO) reacts with water (H2O) to form hydronium ion (H3O+) andhypochlorite ion (ClO–): HClO + H2O → H3O+ + ClO–
You take a glass of water and put 100 trillion molecules of HClO in it. After a few seconds, thewater contains 28 trillion molecules of HClO, 72 trillion molecules of H3O+, and 72 trillionmolecules of ClO–. After that, the water always contains the same number of each molecule, nomatter how long you wait.
Beginning of the reaction End of the reaction
← Water ← Water
HClO: 100 trillion HClO: 28 trillionH3O+: 72 trillionClO–: 72 trillion
Your friend asks you, “Why is there still some HClO at the end of the reaction?”How would you explain this to them?

Brown, N. J. S. (2005). The MMCC. Page 41 of 45
Experiment 8Hypochlorous acid (HClO) reacts with water (H2O) to form hydronium ion (H3O+) andhypochlorite ion (ClO–): HClO + H2O → H3O+ + ClO–
Exactly like in Experiment 7, you take a glass of water and put 100 trillion molecules of HClOin it. After a few seconds, the water contains 28 trillion molecules of HClO, 72 trillion moleculesof H3O+, and 72 trillion molecules of ClO–. After that, the water always contains the samenumber of each molecule, no matter how long you wait.Now, you take the glass and warm it in a microwave. After a few minutes, the water contains 11trillion molecules of HClO, 88 trillion molecules of H3O+, and 88 trillion molecules of ClO–.After that, the water always contains the same number of each molecule, no matter how long youwait.
Before heating After heating
← Water ← Water
HClO: 28 trillion HClO: 11 trillionH3O+: 72 trillion H3O+: 88 trillionClO–: 72 trillion ClO–: 88 trillion
Your friend asks you, “Why did heating the water decrease the amount of HClO?”How would you explain this to them?

Brown, N. J. S. (2005). The MMCC. Page 42 of 45
Experiment 9Hydrocyanic acid (HCN) reacts with water (H2O) to form hydronium ion (H3O+) and cyanide ion(CN–): HCN + H2O → H3O+ + CN–
You take a glass of water and put 100 trillion molecules of HCN in it. After a few seconds, thewater contains 83 trillion molecules of HCN, 17 trillion molecules of H3O+, and 17 trillionmolecules of CN–. After that, the water always contains the same number of each molecule, nomatter how long you wait.
Beginning of the reaction End of the reaction
← Water ← Water
HCN: 100 trillion HCN: 83 trillionH3O+: 17 trillionCN–: 17 trillion
Your friend asks you, “Why is the amount of HCN left over greater than the amount of HClOleft over in Experiment 7, when everything else is exactly the same?”How would you explain this to them?
Brown, N. J. S. (2005). The MMCC. Page 43 of 45
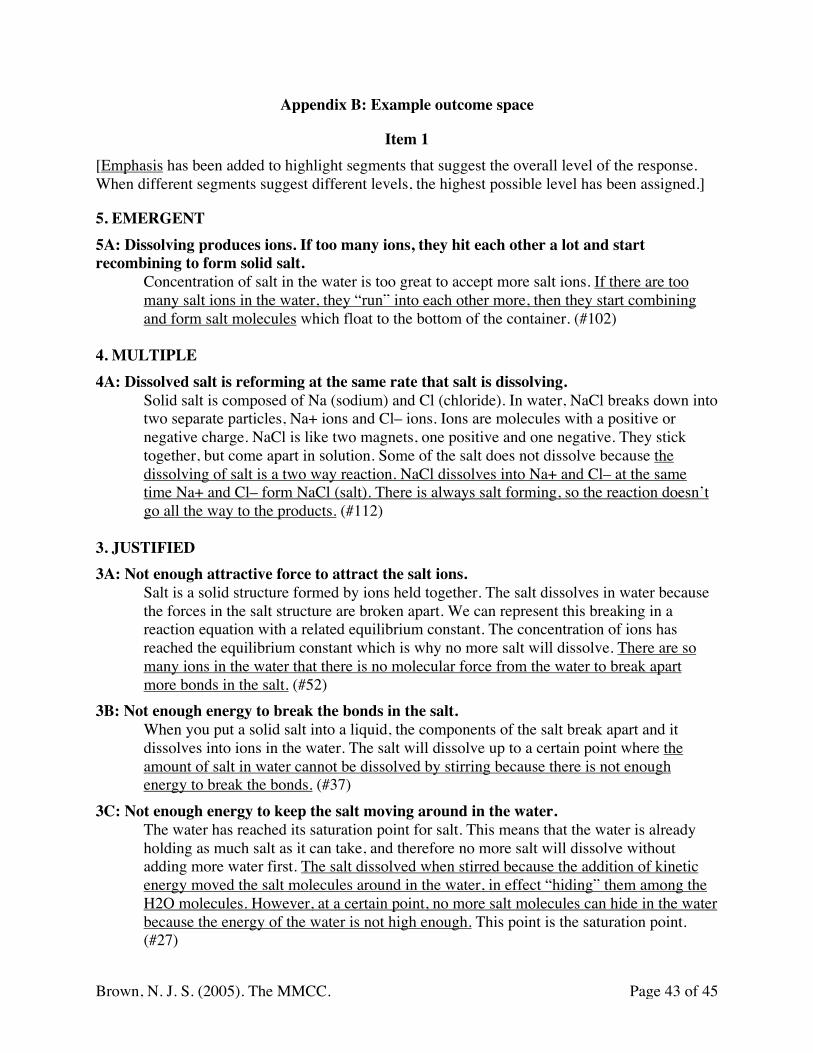
Appendix B: Example outcome space
Item 1[Emphasis has been added to highlight segments that suggest the overall level of the response.When different segments suggest different levels, the highest possible level has been assigned.]
5. EMERGENT5A: Dissolving produces ions. If too many ions, they hit each other a lot and startrecombining to form solid salt.
Concentration of salt in the water is too great to accept more salt ions. If there are toomany salt ions in the water, they “run” into each other more, then they start combiningand form salt molecules which float to the bottom of the container. (#102)
4. MULTIPLE4A: Dissolved salt is reforming at the same rate that salt is dissolving.
Solid salt is composed of Na (sodium) and Cl (chloride). In water, NaCl breaks down intotwo separate particles, Na+ ions and Cl– ions. Ions are molecules with a positive ornegative charge. NaCl is like two magnets, one positive and one negative. They sticktogether, but come apart in solution. Some of the salt does not dissolve because thedissolving of salt is a two way reaction. NaCl dissolves into Na+ and Cl– at the sametime Na+ and Cl– form NaCl (salt). There is always salt forming, so the reaction doesn’tgo all the way to the products. (#112)
3. JUSTIFIED3A: Not enough attractive force to attract the salt ions.
Salt is a solid structure formed by ions held together. The salt dissolves in water becausethe forces in the salt structure are broken apart. We can represent this breaking in areaction equation with a related equilibrium constant. The concentration of ions hasreached the equilibrium constant which is why no more salt will dissolve. There are somany ions in the water that there is no molecular force from the water to break apartmore bonds in the salt. (#52)
3B: Not enough energy to break the bonds in the salt.When you put a solid salt into a liquid, the components of the salt break apart and itdissolves into ions in the water. The salt will dissolve up to a certain point where theamount of salt in water cannot be dissolved by stirring because there is not enoughenergy to break the bonds. (#37)
3C: Not enough energy to keep the salt moving around in the water.The water has reached its saturation point for salt. This means that the water is alreadyholding as much salt as it can take, and therefore no more salt will dissolve withoutadding more water first. The salt dissolved when stirred because the addition of kineticenergy moved the salt molecules around in the water, in effect “hiding” them among theH2O molecules. However, at a certain point, no more salt molecules can hide in the waterbecause the energy of the water is not high enough. This point is the saturation point.(#27)

Brown, N. J. S. (2005). The MMCC. Page 44 of 45
3D: Not enough physical room for all the salt particles.Not all the salt disappears because the water molecules has taken up all the salt it canhold. It has no more room for the extra salt, no matter how long you stir. It’s like eatinguntil full. There are a little food left, but no matter how hard you try to force yourself,you just can’t finish that little scrap of food. (#90)
3E: There aren’t any water molecules left to react with/ attach to/ combine with / etc. thesalt ions.
Because while some of the salt dissolved in water, some still didn’t. This is because theliquid solution is fully saturated with salt, and can’t hold anymore. This implies all theH2O molecules to be holding onto the salt, and no more are freed up in order to dissolvethe extra salt on the bottom. (#106)
2. ELEMENTAL2A: Water has reacted with/ attached to/ combined with / etc. as much salt as it can.
Salts dissolve into ions, i.e. positively and negatively charged atoms. Water, whichalthough neutral, is lightly charged on both ends of it. The charge of the ions attract thewater molecules to form a sort of hydrated radius about. When the water cannot handleany more (can’t form these ion clusters) no more salt can be dissolved. (#53)
2B: The water can’t dissolve any more salt.The solution is completely saturated. The water has dissolved all the salt it can dissolve,and will dissolve no further. (#119)
2C: The water can’t hold any more salt.There is a certain limit when no matter how much you stir, some salt will remain. This iscalled the saturation point. It means that there is so much salt dissolved in the water (N.B.although you don’t see it, the salt is still there), that it can’t hold any more, so it will fallundissolved to the bottom. (#116)
2D: The water has become too salty.NaCl + H2O -> NaO + HCl. Because the H2O becomes so salty (NaCl) that can not actas water. It act or behave more like salt, so some salt always remains at the bottom of theglass, no matter how long we stir or wait for it. (#12)
2E: There is a balance between the salt on the bottom and the salt in the water.I would say that a lot of the salt already dissolved and the mixture was in equilibrium.The remaining salt did not dissolve because the concentration in the water is high and itwill not dissolve any more. Maybe, by heating the solution, you can make the rest of thesalt disappear. (#85)
2F: There are the right amounts of salt on the bottom and in the water, as dictated by theequilibrium point.
When salt dissolves, it breaks into its sodium and chlorine components. It does this in thepresence of water. This reaction, like all chemical reactions, has a point where just theright amount of salt is left and just the right amount has been dissolved. This point iscalled equilibrium. When we reach equilibrium, not necessarily all the salt disappears.That is the case here. The dissolving process is finished (at a stand-still) but there’s stillsalt left over. (#75)

Brown, N. J. S. (2005). The MMCC. Page 45 of 45
1. ACAUSAL1A: Only a certain amount of salt can dissolve in a certain amount of water.
I would explain to them that salt has a specific solubility in water. In other words, Iwould tell them that only a certain amount of salt will dissolve in a specific volume ofwater. I would then add more water to show them that more salt will dissolve, with agreater quantity of water. I would also tell them that the solubility varies withtemperature, and that at higher temperatures, more salt dissolves. (#31)
0. ABSENT0A: No explanation.
No Explanation. (#17)
X. UNSCORABLE (treated as missing data)XA: Uses chemical jargon (equilibrium, saturated) without enough context to know forsure what they mean by it.
NaCl + H2O -> Na+ + Cl–. At some point this reaction reaches equilibrium and no matterhow long you wait no more salt will dissolve. The equilibrium constant K determineshow much salt will dissolve. (#73)
XB: Didn’t answer the intended question.Salt, which is NaCl, is highly soluble, which means it dissolves well in water. Stirring thesolution with the salt helps the salt crystals dissolve into the water, which is why there isless salt. The water is salty because of the Na+ and Cl– ions of NaCl dissolved in thewater. (#2)