the mortgage market in upper canada: window …papers.economics.ubc.ca/legacypapers/dp9923.pdf ·...
TRANSCRIPT

THE MORTGAGE MARKET IN UPPER CANADA:
WINDOW ON A PIONEER ECONOMY
by
Angela Redish
September 1999
Discussion Paper No.: 99-23
DEPARTMENT OF ECONOMICSTHE UNIVERSITY OF BRITISH COLUMBIA
VANCOUVER, CANADA V6T 1Z1
http://web.arts.ubc.ca/econ/

The mortgage market in Upper Canada:
Window on a pioneer economy.
Angela Redish
University of British Columbia
September 1999
AbstractThis paper presents new data on the characteristics of the mortgage market in the NiagaraDistrict, Ontario, between 1795 and 1850. The data show that private mortgage lendingoccurred on the same scale as bank lending. The largest single type of loan was between ayeoman farmer borrower, and a lender resident in Niagara District, for an amountsomewhat in excess of a year's farm output. There were also many loans to merchants andlarge land owners, which tended to be for larger amounts lent by non-residents of theDistrict. Up to a quarter of all mortgages were used to finance the purchase of land. Thedata provide ambiguous evidence on the cyclicality of mortgage lending, but, consistentwith those who have argued against a dominant role for wheat exports in the UpperCanadian economy, there is not a significant correlation between the number ofmortgages and wheat prices.
JEL Classification: N21
Keywords: mortgages, Canadian economic history, financial market development
Paper prepared for the Conference to honour Lance Davis, Los Angeles, November 1998.The author would like to thank participants at this conference, especially Ken Snowden,for their comments, and Doug McCalla and Gillian Hamilton for comments on an earlierdraft. and SSHRCC for funding.

1
It is commonly accepted that well-functioning capital markets are a key to
economic development and growth, yet our knowledge of capital markets in historical
times is very limited. Recent research has begun to characterize the nature and evolution
of stock markets in England, France and the United States and, to a lesser extent, the
markets and institutions which had a direct impact on large numbers of people such as
credit co-operatives and mortgage markets.1 This paper contributes to the latter literature
by examining the mortgage market in the Niagara District of Upper Canada (now
Ontario) in the first half of the 19th century.
Through this period banks were the only financial intermediaries, and their
lending was restricted to 'real bills' and their clientele therefore limited to the commercial
sector. In the large agricultural, and smaller industrial, sectors credit was limited to direct
transactions between borrowers and lenders, and the resulting decentralization has made
it difficult to collect data to determine the nature and extent of the credit market.
However, Upper Canada had a land registration system that required registration of
mortgages providing a rich source of information on one piece of the credit market. This
paper summarizes the evidence on three aspects of the mortgage market: the extent of
mortgage indebtedness; the characteristics of the market - who lent how much to whom
and, in particular, the extent to which borrowing was internal (lenders came from the
Niagara District) or external (lenders came from elsewhere in Upper Canada, Lower
Canada, the United States or the United Kingdom); and the rationale for mortgage
borrowing.
I estimate that between 1815 and 1850 mortgage indebtedness was of the same
order of magnitude as indebtedness to banks (there was virtually no overlap), and that the
land of about 1 in 10 land owners was mortgaged. Since Niagara District was a newly
settled region through this period, we might expect that there would be an inflow of funds
into the region. On the other hand, problems of moral hazard might raise the costs of
lending from afar, perhaps prohibitively. I find that the majority of loans are from 'local'
lenders, giving support to this second effect. However, if moral hazard was costly we
1 This is a growing literature; examples include Neal (1990), Hoffman, Postel-Vinay and Rosenthal (1992)Guinnnane (1994), Hollis and Sweetman (1998) Rothenberg (1998) and Snowden (1987, 1995 and 1997).

2
would expect that there would be significant differences in loan characteristics as lenders
attempt to mitigate those costs. There is little evidence of such differences. Finally, I
consider motives for borrowing such as consumption smoothing over harvest and
business cycles and the need to finance the purchase of farms, but conclude that, while
mortgages were often used to finance the purchase of land, the majority of borrowing is
to finance major improvements both to farms and small industry, and to finance
inventory.
II. Historical Context
The data for this study are taken from the Niagara District in Ontario - essentially
the peninsula south of Lake Ontario, and north of Lake Erie - for the years between 1800
and 1850. The first major influx of European settlers in the District were Loyalists who
arrived in 1784 and a considerable part of the land in the District was granted to
Loyalists, Late Loyalists and their descendants, in 200 acre lots. In 1824, the Census
counted 17,552 residents in the Niagara District, (half in Lincoln County) when the
population of Ontario was 150,000. By 1850, mainly as a result of immigration and
extensive settlement, the population of Upper Canada had risen to 950,000, while that of
Niagara District had risen only to 49,747 (of Lincoln county - 15,777). Lewis and
Urquhart (1999) report that Upper Canada was the fastest growing region of North
America between 1826 and 1851.
The early settlers had been attracted by the possibility of supplying the military
posts in the District, but the posts became unimportant, and the growth in the Province
passed the District by. In common with the rest of the province, the major economic
activities were forwarding (i.e. transportation and trade) and agriculture. The two urban
areas in the District were Niagara and St. Catherines.2 Although Niagara was settled
earlier, by the end of the period St. Catherines had surpassed it. Informative descriptions
of the two towns in 1846 are given in Smith’s Gazetteer for that year, and suggest busy
small towns of a few thousand people serving an agricultural hinterland. In addition, to
the service sector, Niagara had a major shipbuilding facility which had been building
2 Niagara was originally named Newark, and is now Niagara on the Lake.

3
steam boats (for Great Lake shipping) since 1832, and which employed between 150 and
350 people in the 1830s and 1840s.3
There were agencies and branches of the chartered banks within the District, but
banks were prohibited from lending directly on the security of land, although they could
take a mortgage as additional security for a loan and in the case of a loan default had the
usual right to seize land under a writ of ‘fieri facias’ (see below). In the sample, only 12
mortgages were granted by banks: the Montreal Bank, the Bank of Upper Canada, the
Gore Bank and the Commercial Bank. Until 1847 the banks were the only formal
financial intermediary in Upper Canada but in that year the Niagara District Building
Society and the St. Catherine’s Building Society began operations. By 1850 they had
made 30 mortgage loans.
III. Legal Context.
The data used in this study are drawn from the mortgages registered in the
Niagara District before 1850. A clear understanding about the legal processes, both the
mortgage contract and the registration process, that generated the data is essential to its
interpretation.
The basic land law system was established in 1792, when Upper Canada adopted
the land law of England. Indeed, the introduction of British land law had been part of the
raison d’etre of the division of Quebec into Upper and Lower Canada. Yet this adoption
of English law was ambiguous in that one of the key institutions of English land law – the
Chancery Court – was not implemented until 1837.
3 The description of Niagara lists as Professions and Trades: “three physicians and surgeons, nine lawyers,
one foundry, 12 stores, some taverns, two chemists and druggists, three booksellers and stationers, twosaddlers, four waggon makers, two watchmakers, one gunsmith, two tallow-chandlers, marble works, twoprinters, two cabinet makers, one hatter, four bakers, two livery stables, two tinsmiths, three blacksmiths,six tailors, seven shoemakers, one tobacconist, and an agency of the Bank of Upper Canada”. Smith, (1846;130).For St. Catherines, the list included: “6 physicians and surgeons, five lawyers, four grist mills (containing20 run of stones) , one trip hammer, one brewery, three distilleries, one tannery, one foundry, one ashery,one machine and pump factory, tow surveyors, one pottery, 14 stores, two auctioneers, 24 groceries, onestove store, one printer, one pail factory, one broom factory, one tallow chandler, 8 taverns, 3 saddlers,three cabinet makers, two booksellers and stationers, three druggists, one gunsmith, two watchmakers, threecarriage makers, three bakers, two hatters, two livery stables, 7 blacksmiths, one veterinary surgeon, three

4
Under English law, a mortgage was a conveyance of land in fee simple to the
creditor/grantee with a covenant that required return of the land if repayment of the loan
were done as prescribed in the mortgage. In England the harshness of mortgages (and
consequently their lack of appeal as security for a loan) had been modified by the creation
of an equity of redemption. That is, a borrower could be in default of his loan, and lose
his land, but if he subsequently repaid the loan and interest outstanding he could reclaim
his land. This right in turn was modified by the ability of lenders to ‘foreclose’ the equity
of redemption, by going to the Chancery Court and serving notice that if the borrower did
not repay within 6 months the equity of redemption would be gone. (The right to
foreclose the equity of redemption required appearance at court, and if the property were
worth more than the outstanding debt, the Court could order the property sold, and the
proceeds in excess of the debt returned to the borrower.) The effect of these laws was to
make the stated term of a mortgage unimportant, and “it became customary to fix the
initial legal redemption date very early, commonly at six months’ distance”.4
The existence of the equity of redemption in Upper Canada before 1834 was
unclear. While some lawyers argued that equity had “come over in the pockets of the
settlers” (i.e. was an established legal right) an alternative interpretation held that since
there was no Chancery Court, the equity of redemption could not be foreclosed and
therefore did not exist. While this ambiguity clouded the rights of lenders, Weaver (1990)
argues that by 1809 case law had evolved to the benefit of the mortgagee. The
mechanism was the right of “fieri facias”. This legislation provided for the seizure of
chattels by a creditor if a debtor were in default. In England the legislation explicitly
excluded the right to seize land. In 1732 English legislation (“An Act for the more easy
recovery of debts”) modified the application of “fi fa” in the colonies to permit the
seizure of land. Despite the assumption of English law in 1792, the courts permitted the
continuation of this modification in Upper Canada. Indeed (to protect themselves against
the possible existence of an equity of redemption) lenders seized both the land and the
tinsmiths, one tobacconist, 7 tailors, 9 shoemakers, one grammar school, 4 schools for young ladies, andagencies of the Bank of Montreal, Bank of Upper Canada, and the Commercial Bank. Smith, (1846; 178).4 Megarry and Wade (1975) p.890; Allen (1992) p. 102.

5
borrower’s equity of redemption under “fi fa”. A borrower in default would forfeit his
land if the lender acquired a judgment in ejection and a writ of possession.
The situation by which the lender held the upper hand was altered in 1834 by the
unambiguous establishment of the equity of redemption by legislation in 1834 (1834 UC
c1, c16) and subsequently by the introduction of the Court of Chancery in 1837.5 Yet as
noted below, the implications of these changes, in the absence of rules prohibiting the use
of “fi fa” for land and the equity of redemption, is unclear.
While land registration was not implemented generally in Britain until 1925
(Middlesex and Yorkshire being counterexamples) registration was introduced into Upper
Canada in 1795 (35 Geo. III c5).6 Registers were established in each County for the
registration of title (patents, deeds, grants and mortgages). The Act did not make
registration mandatory, and it did not change the legality of any document. However, a
registered document had priority over an unregistered document, and “every deed and
conveyance that shall at any time after any memorial is so registered …. shall be
adjudged fraudulent and void [with respect to subsequent mortgagees only]”. Lenders
thus had a strong incentive to register a mortgage, since otherwise the borrower could
take out a second mortgage and if that deed were registered it would have priority over
the first mortgage.7 Although the evidence is thin, Youdan (1986) argues that after 1795
registration of mortgages was “in fact rarely omitted”.8 The discharge of a mortgage
could also be registered but the incentive (for either party) to do so was considerably less.
Two other aspects of the legal environment affected mortgages. The first is the
married woman’s right of dower. The right of dower assigned a married woman the right
to one-third of the property of her husband, or the income thereof. Particularly, the
husband’s sale (or mortgage) of the land did not affect this right, and so the grantee of a
mortgage in default would not acquire clear title to the land if subsequently the husband
5 Weaver (1990) and Pearlston (1999) examine the politics of these legal changes.6 The motives for introducing the Registry are not known, although some historians attribute it to thetraditions of Loyalists from New England, while others (e.g. Neave) focus on the similarity between theUpper Canadian system and that of Middlesex.7 The costs of registering a mortgage were set in the Act at 2.6d. for the first 100 words, plus 1/- for eachsubsequent 100 words.8 Armour similarly states that registration was “rarely omitted”.

6
died, for his widow might have a valid claim to the land. To avoid this possibility, the
mortgagee could ask the wife to extinguish her right of dower, and typical mortgages
noted that the wife had done so in consideration for a nominal fee (often 6d.).
Finally, mortgage loans were subject to usury laws. These laws stated that all
contracts where the interest rate was greater than 6% were ‘utterly void’ and that if such a
contract could be proved, the lender would lose three times the amount lent.9 There were
no cases in the data where the explicit interest rate was greater than 6%, but whether the
actual transaction occurred at 6% is impossible to determine.10 Neufeld (p.544) argues
that the legislation was typically circumvented by selling mortgages at a discount, and
quotes from a letter to the Canadian Merchant Magazine and Commercial Review in
October 1857: “On private notes, and on private mortgages does not every one know, the
rate of interest brought by money, is in every case regulated by mutual conditions, in utter
indifference to all attempts at Parliamentary restraint”.
IV The Extent of Indebtedness
The data for this study come from the 1368 mortgages registered in the Niagara
District between 1795 and 1849. The data set was compiled by matching mortgages in the
Abstract Index of Deeds with the Copybook of Deeds. The Abstract Indexes were kept on
a geographical basis. There was essentially a book for each township with a page for each
lot on each concession. The information recorded included the type of transaction (sale,
mortgage, discharge of mortgage or probated will being the typical transactions), the
names of the parties, the date of the transaction, as well as the date of registration, and
(usually) the amount. The Copybook of Deeds, recorded chronologically, had a copy of
the entire document and included information on the addresses and occupations of the
parties, as well as the details of the repayment scheme: term, interest rate and whether it
would be amortised or paid in full at the end of the term.
9 This is from legislation in 1811, (51 Geo III c9) prior to 1811 lenders were bound by usury laws with
similar provisions in Quebec. The legislation was not significantly altered until 1853, although BuildingSocieties were granted an exemption in 1846. Neufeld (1972;188).10
A total of 7 cases named specific interest rates less than 6%.

7
Figure 1 shows the number of new mortgages registered each year. Prior to the
end of the War of 1812 (in 1815) there were very few mortgages, but the number of new
mortgages rose fairly steadily after that so that in 1847 and 1848 there were over 100 new
mortgages registered each year. The distribution of the value of mortgages remained
remarkably stable with the mean loan being about £400 and the median close to £200
throughout the period (see Figure 2).11 To put these numbers into perspective, note that
the majority of loans were to farmers and Lewis and Urquhart (1999) estimate that the
annual output of a (fully developed) farm in 1851 to have been $297 or £74. He also
estimates that the cost of purchasing a farm (land and animals) would be about £105. The
amounts being borrowed were significant.
The stock of outstanding mortgage debt is harder to estimate than the amount of
new debt because it requires information on the 'ex post' term of the debt and the schedule
of principal repayment. Data on one or both of those variables was omitted in about 50%
of the cases, typically because the mortgage was used to provide additional security for a
bonded debt, and the details of the repayment schedule were only recorded in the bond.
Of those that did state a repayment plan, 40% planned to repay the principal in equal
annual instalments, 40% planned to repay it in a lump sum, and the other 20% stated
other plans, such as half-yearly instalments or, after 1847, a building society plan.
Analysis of the mortgages that state a repayment schedule does not suggest an
easy way to determine the probable plans for those for which there is no data.
Specifically, there is no significant correlation between repayment plans and the amount
borrowed, the occupation of the lender or borrower, or the location of the lender (within
the Niagara District or from outside the District, or a finer breakdown). There is a
significant correlation between the term of the mortgage and the repayment plan, with
longer mortgages being more likely to be repaid in instalments. However, the R2 of a
Probit regression of repayment plans on the term of the mortgage is only 22%. The nature
of the correlation can be simply modelled by assuming that all mortgages whose term is 2
years or less will be repaid by lump sum, and all those of longer term will be repaid in
11 Throughout the period, the unit of account was the pound Halifax currency, which equated £1 to US$4.The high variability in the averages before 1821 should be seen in the context of the low sample size (see

8
equal annual instalments. Such a model predicts the repayment schedule accurately 67%
of the time. The Probit model yielded the correct prediction 68% of the time but without
incorporating the integer constraints implicit in a plan for annual instalments.
The second necessity for calculating the amount of mortgage debt outstanding is
to determine the actual term of the mortgages, which may have differed from the ex ante
planned term. Ideally, the date that mortgages were discharged would provide evidence
on the ex post term, however, data on discharges are incomplete with only a third of
mortgages discharged (up to 1860). It is unclear how to interpret the status of mortgages
for which no discharge was registered. Were they discharged without registration? Were
they in default? Or were they rolled over without a new mortgage being registered? High
default rates are not consistent with evidence from the Sheriff's courts so the choice is
between assuming that the mortgages were rolled over and assuming they were paid off.
The information on mortgages that were discharged can provide some guide.
For the set of 439 mortgages that were discharged and provided data on the ex
ante repayment schedule, Table 1 compares the term as stated in the mortgage and the
term as computed by comparing the date of discharge (not the date the discharged was
registered12) with the starting date of the mortgage. The ex post term of the mortgages
was far longer than the ex ante term: 84% of mortgages were written with terms of 5
years or less, however, only 54% had been discharged within that period.13
Although mortgages were not repaid as quickly as the deed stated, there was a
significant correlation between ex ante and ex post terms. The data in Table 2 indicate
that the term structure of mortgages that were discharged was similar to that of the whole
set of mortgages. I therefore proceed to estimate the stock of outstanding mortgage debt
on the assumption that the mortgages for which no discharge was registered were in fact
discharged at the same rate as those for which a discharge was registered. More
specifically I model the relationship between planned and actual mortgage term of
mortgages that are discharged. This is given by equation (1):
Figure 1).12 There was frequently a considerable lag between the registration of a discharge and the actual discharge.

9
Actual term = 2.78 +0.502 planned term – 0.154* year(5.12) (4.70) (-5.9)
R 2 = .13 n=381
where terms are measured in years, year is measured as (year of mortgage-1850) and t-
statistics are in parentheses.14 While the variables are significant, the explanatory power
of the regression is low.
The second step involves using the estimated coefficients to compute an ‘actual’
term for all mortgages, and then computing the stock of outstanding debt each year. This
is shown as the ‘stock’ variable in Figure 3. The impact of the War of 1812 is clear, as is
the expansion of activity following the War. The downturn in the late 1820s is steeper
than one might expect – it reflects the ‘assumed’ expiry of the spate of mortgages issued
after the War of 1812. In 1837 there were many new mortgages issued, yet these occurred
prior to the passage of the legislation introducing Chancery Courts. The dramatic increase
in the mortgage debt outstanding in 1837 reflects the 10 large mortgages totaling £45,500
issued to finance the construction of the Erie and Ontario Railroad. To highlight the effect
of this small set of mortgages, the data are also presented net of these 10 mortgages. The
stable mean value (especially after 1820) implies that the number of outstanding
mortgages shows roughly the same trend as the value of mortgages (see Table 3).
The data are roughly consistent with earlier work. In his study of Toronto Gore
Township, David Gagan linked mortgage data with the manuscript census and found that
in 1841 16% of proprietors had mortgage debts. The manuscript census for very few
townships in the Niagara District has survived, but those that do suggest that the number
of households is approximately one-sixth of the population and that half of those were
proprietors.15 The population of Niagara District in 1824 was about 17,552 and in 1841,
13 Rothenberg found that, for mortgages with a stated term of one year and for which discharges wereregistered, the ex post term averaged 8.75 years.14
The time trend does not seem to be a result of censoring - i.e. lack of data on discharges after 15 yearsfor mortgages taken out after 1845, after 12 years if taken out after 1848 etc.15 For example:Year Twp Population Hh heads % Popn Proprietors % Pop’n1828 Clinton 1513 253 17%1828 Gainsboro 814 164 20%

10
34,577 implying about 1,462 and 2,881 proprietors respectively. The stock of outstanding
mortgages in those years is estimated at 128 and 285 or about 9% or proprietors in each
year.
To put the data on the extent of indebtedness in context, Figure 3 also shows
data on the amount of bank loans (discounts) in Upper Canada. Since the population of
the Niagara District was about 10% of that of Upper Canada, the right hand side scale is
10 times that of the left hand side scale. (That is, if bank loans were proportionally
distributed across the province, bank loans in the Niagara District could be read off the
same scale as the stock of mortgage debt.) The data suggest that until the late 1840s the
mortgage market was of a similar order of magnitude to the scale of bank lending,
although both debtors and creditors were likely very different - an aspect to which we
now turn.
V. Characteristics of mortgages
With every loan the lender faces the prospect of not being repaid, and that
prospect has led to a variety of institutions to encourage repayment, and thereby
encourage lending. Recent historical analysis has shown that in the absence of formal
institutions, social sanctions may be an effective enforcement mechanism in small
communities. These sanctions work best in an environment where geographical mobility
(and therefore the ability to evade sanctions) is limited. In a frontier environment their
effectiveness would be limited. The development of the system for registering and
enforcing mortgages was an alternative method to enforce loan contracts. Yet
enforcement would still be incomplete and costly, and a lender would still be influenced
by the probability of repayment.16 The ability to determine that probability would have
varied by geographical proximity; lenders in the Niagara District would have more
information about the quality of land being mortgaged, and the reputation of borrowers.
1842 Stamford 2636 457 17% 269 10%1842 Thorold 2284 197 9%1842 Willoughby 979 207 21%
16 If usury laws were effective and binding, then we would expect that loans would not be made to groupsthat were unlikely to repay.

11
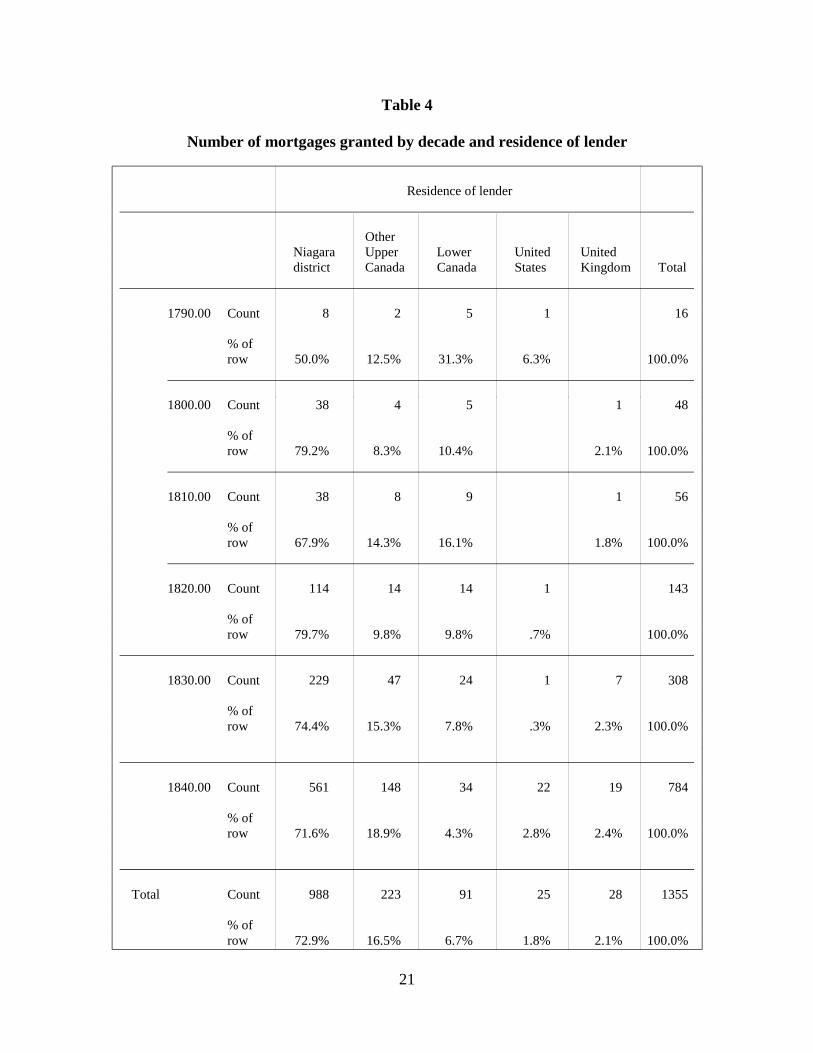
Table 4 shows the extent of lending broken down by the residence of the lender,
and how it changed over time. Column 1 includes mortgages where the lender lived in the
Niagara District; column 2 mortgages where the lender lived in Upper Canada but outside
the Niagara District - typically in Toronto but sometimes Kingston (especially prior to
1820) or Gore District adjacent to Niagara District; column 3 includes lenders from
Lower Canada, typically Montreal, and Columns 4 and 5 show lenders resident in the US
and UK respectively.
The Table shows that mortgages very largely supported local lending especially
after 1820. The sixteen mortgages granted in the 1790s included 5 (31%) from Montreal
merchants to Niagara District merchants. After 1800, although there are more such
mortgages in absolute numbers, their relative share fell to less than 10% after 1820, and
less than 5% in the 1840s. In part, this reflected the rise of Toronto as the metropolitan
centre for Niagara District, and in part the rise of lending to non-merchants who - as
shown below - tended to borrow locally. The other message from the Table is the very
small proportion of mortgages from lenders outside the Canadas. Inspection of the
mortgages by those lenders whose residence was in the UK shows that the majority had
close family connections with the borrower or had previously been resident in the
Niagara District.
Not shown in the Table is the frequency with which specific lenders made loans.
There were very few cases where a grantor (be it an individual, partnership or couple)
made more than one loan and with one exception no grantors made more than 20 loans.
That exception was the partnership of Thomas Clark and Samuel Street who, as partners
or individuals, made a total of 198 loans, accounting for 20% of the loans made by
residents of the Niagara District.
Remarkably little is known about Clark and Street. Samuel Street Sr. had been a
Loyalist immigrant from Conneticut, and Clark had immigrated from Scotland to work
for his cousin Robert Hamilton, one of the wealthiest men in Upper Canada at the time.17
The partners became well known for their milling operations and land speculation and
17 See Nelles (1966) and the Dictionary of Canadian Biography, vols. VI and VII.

12
finance. They borrowed money on mortgages 9 times over the period with an average
loan size of £1650, most of which was borrowed in the first 10 years of the sample period
to finance acquisition of land and their mill. There is no evidence that the partners acted
as an intermediary either by brokering or by taking deposits for on-lending.
Table 5 presents a summary of the type of borrowers, again broken down by the
residence of the lender. Occupations were almost always stated in the mortgage, however,
they were self-defined. The occupations most frequently listed were 'yeoman' -41% ,
'esquire' - 16%, 'merchant' - 8%, 'gentleman' - 8% and 'innkeeper' - 5%. The difficulty
lies in knowing how people defined themselves, particularly as some people defined
themselves differently on different mortgages; e.g. as a gentleman on one mortgage and
as an esquire on another, or a gentleman and a merchant. I have therefore combined these
categories into an 'elite' category, and aggregated all those who weren't yeomen or the
elite into an 'other' category, primarily comprising a wide variety of artisans and also
women who defined themselves as widows or spinsters (1% of borrowers).
Overwhelmingly, 'yeomen' and 'others' borrowed locally (85% and 80% of loans
respectively) while the 'elite' borrowed much more heavily outside the Niagara District
(41%).
I examined the disaggregated data for evidence of occupational segmentation
within the 'other' group, but found no evidence of such a bias. Of the 268 loans in this
group, there were only 7 cases where people borrowed within an occupation: one each
between carpenters, blacksmiths, shoemakers, joiners and saddlers, and 2 between
innkeepers.
The amount of money lent varied significantly with the residence of the lender
(see Table 6): the mean loan by a resident of the Niagara District was £308 cy. and by a
non-resident, £740 (the medians were £150 and £269 respectively). However, this
difference reflects the difference in mean loan to 'yeomen' and 'elite' borrowers - yeomen
averaged £224 per mortgage, and 'elite' £747. (The mean loan to 'other' borrowers was
£288, but the standard deviation in this category is much higher since the category is so
heterogeneous.) Finally, while the scale of lending to yeomen was not dependent on the
13
source of the funds, lending to 'elite' borrowers typically increased the further away the
lender.
The loans by Clark and Street were on average smaller than those by Niagara
District lenders, with a median loan size of £148, and a third of loans being for less than
£90. Clark and Street were also more likely than the 'average' Niagara District lender to
lend to yeomen, with 62% of their loans being made to yeomen. There is some evidence
that geographical proximity increased the probability of a loan from the partnership as
mortgages to residents of the township of Stamford (where Clark and Street resided)
made up 13% of loans whereas the township had only 8% of the population of Niagara
District in 1841. More broadly, geographical segmentation is suggested by the fact that
35% of all mortgages were between borrowers and lenders residing in the same township
(there were 22 townships in the District).
Having established that out-of-District lenders tended to lend more frequently to
the 'elite' and to lend larger sums, we turn to the question of whether there were
differences in the contract terms, especially whether there were differences that might
serve to enforce the contract or differentially compensate the lender for risk. As noted
earlier, when an interest rate was explicitly stated in the mortgages it was either 'the legal
rate' (83% of mortgages), or '6%' (16% of mortgages) so that little variation is observable
in this dimension.
There is also little difference in the ex ante term of mortgages by residence of
lender: Niagara District lenders averaged ex ante terms of 2.9 years, while out-of-district
lenders averaged 3.25 years, a difference that is not quite significant at the 5% level (p
value 5.7%). The difference between the two groups in ex post term - 6.3 years for the in-
district lenders, and 5.1 years for out-of-district lenders - is statistically significant. There
is, to my surprise, no difference in the rate at which discharges were registered: with 34%
of the mortgages with in-district lenders, and 31 % of those with out-of-district lenders,
having discharges registered.
Finally we examine the amount of collateral offered by borrowers by comparing
the amount borrowed with the value of the property being pledged. Data on the value of
the property is only available for half of the mortgages, for most of the other cases the

14
property was not acquired by purchase but by inheritance or patenting. Where the data are
available, they refer to the most recent land transaction which was frequently many years
before the mortgage was granted, and so the value of the land is undoubtedly biased
downward. On the positive side, the sample of mortgages for which the value of the land
is available seems to be a roughly random sample.
The results of regressions run to examine the determinants of collateral are
shown in Table 7. The first model regressed the amount borrowed on a constant, a
dummy variable equal to 1 if the borrower belonged to the 'elite' (elite), a dummy
variable equal to 1 if the lender lived outside the Niagara District (not ND), the price paid
for the property used as collateral (price paid), and interactive dummies capturing the
effect of out-of-district lenders (PP*ND) and elite borrowers (PP*Elite) on the coefficient
on price paid. The results suggested that the constant and the two interactive dummy
variables were insignificant so a second regression was estimated omitting those
variables.
The value of the property being mortgaged has a direct effect on the amount of
the loan, and for the majority of borrowers (who as we have seen were yeoman or others
who borrowed from a local lender) the amount they could borrow was about 50% of the
value of their land (coefficient on land of .515). The insignificance of the constant term
suggests that this proportion did not vary with the amount of the loan. For borrowers who
were in the elite or who borrowed from someone living outside the Niagara District the
insignificance of the two interactive dummy variables implies that the effect of an extra
£100 collateral was to increase the loan by about £50 as it was for the yeomen. However,
the dummy variables for non-resident and elite were both statistically and economically
significant and imply that for those two groups effective collateral requirements were
much less. For example, the median borrower from a non-resident of the Niagara District
borrowed £269 and their collateral would have been property estimated at £56 ((269 -
241)/.515).18
18 Similar analysis of loans made by Clark and Street showed that the 'best fit' regression estimated loansize as £81 plus 38% of the price paid, with both coefficients being statistically significant. When the
15
In summary, the most common type of mortgage was used by a yeoman to
borrow a sum of less than £200 from another resident of the Niagara District. But there
were also significant numbers of the 'elite' who borrowed much larger sums, with lower
rates of collateral and with a greater probability of borrowing from outside the District.
Most mortgages were for terms of 1 to 5 years, but borrowers took longer than planned to
pay back their debts. Borrowers typically promised to repay the principal in equal annual
installments if the loan was for more than 2 years, but as a lump sum if the term were
shorter. In almost all cases interest payments were, at a minimum, to be made annually.
VII. The motivation for borrowing
A few mortgages included the reason that the funds were being borrowed, but
the majority did not, leaving us to attempt to draw inferences from the data that do exist.
When a mortgage was used to secure a previously created bonded debt, the mortgage
typically stated that the lender gave the borrower 5/- 'in consideration' for the mortgage:
35% of the mortgages included such a clause, suggesting that mortgages were fairly
widely used to secure pre-existing debts. 19 The frequency of such a clause does not vary
by borrower class, or loan size.
A primary reason for borrowing against a mortgage was to purchase a farm.
Where it existed (689 cases - 50% of the total) I collected data on the land purchase that
most nearly preceded each mortgage, in the other cases the borrower acquired the land by
inheritance or grant. From this sample, for 343 mortgages the land was purchased in the
same year as the mortgage was granted, leading to the conclusion that these mortgages
(25% of the total) were for the objective of purchasing the land. The amount borrowed
varied (as discussed above) with 75% borrowing more than 50% of the purchase price.20
However, it must be remembered that the vast majority of land purchases were
constant term was forced to zero the coefficient on the price paid was 54%, not significantly different fromthat in the full sample.19 The rationale here is that for a valid contract both parties must give up something; since the debtpreexisted, the mortgage cannot be given in exchange for the debt, so the mortgage is given 'inconsideration' of the 5/- paid to the borrower.20 15% borrowed more than the value of the land, but whether this was because other lands were includedor because the lender was willing to make a less than fully secured loan cannot be determined.
16
accomplished without borrowing money. There may well have been 10,000 land
purchases in Niagara District, suggesting that about 4% were financed by a mortgage.
The proportion of borrowers who took a mortgage to purchase land varied across
borrower type: 28% of yeoman mortgages, 21% of 'elite' mortgages, and 30% of 'other'
mortgages were within the same year that the land was purchased. The most reasonable
interpretation of this difference (given a lack of data on the total number of land
purchases of each group) is that the 'elite' were far more likely to borrow for other reasons
than the other borrower classes.
The theoretical effect of business cycles and financial crises on the amount of
mortgage debt is ambiguous. During a financial crisis, some borrowers would be cash-
strapped and increase their demand for loans, whilst the supply of loanable funds might
decrease. If usury laws were binding we would expect to see a decline in the number of
mortgages, while if they were unenforceable the stock of mortgages might rise with an
increase in interest rates.
We see evidence of both effects in the data. Figure 4 shows that during the
financial crises of 1837 and 1847 the number of mortgages outstanding fell absolutely
and was significantly below trend (the trend is based on the estimated growth rate of 7%
pa.). But there is qualitative evidence of increased mortgaging to deal with a liquidity
shortage caused by the crisis of 1847. In that year, the Ball family, a prominent merchant
and milling family in St. Catherines, found themselves with a serious cash flow problem.
In 1847 and 1848 Frederick Ball and his cousin George PM Ball granted 11 mortgages as
they (successfully) staved off their (unsecured) creditors. They borrowed from family
members, from the new local Building Society, the Commercial Bank and even a local
surgeon.21
Finally, we can examine the extent to which mortgage activity was related to the
performance of grain prices. There is an on-going debate in Upper Canadian
historiography about the significance of export markets for grain for the performance of
21 Although banks were not permitted to lend against mortgages they could take mortgages as additionalcredit, which is apparently what they did here. The story behind the mortgage data is told in Millar (1974).
17
the Upper Canadian economy.22 Figure 5 shows the relationship between the price of
wheat in Montreal and the deviation of the number of mortgages from trend. The Figure
shows little relationship between the two, a conclusion supported by correlation
coefficients between the two series. This finding provides support for the McCalla and
McInnis position that the diversification of the economy muted the influence of wheat
export markets.
VIII. Conclusions
In this paper I have examined the characteristics of the mortgage market in one
of the earliest regions of Upper Canada to be settled, the Niagara District. The data show
that, while mortgages were not used by the majority of inhabitants, they played as large a
role in the economy as bank lending - albeit a different role. As a financial intermediary,
Upper Canadian banks primarily moved funds between members of the commercial elite,
and between the landed class and the commercial class. In contrast, two-thirds of
mortgage borrowers were yeomen farmers and artisans and a third of lenders were
yeomen farmers. Mortgage loans were long term, with the mean stated term being 3.2
years, the median 2.7 years. Mortgages were used for a variety of purposes: to secure
previously-unsecured debts, and perhaps one quarter of mortgages were used to buy land.
Quantitative evidence on the nature of the Upper Canadian economy is limited
and the available evidence is very much biased toward the export economy. Mortgage
markets provide a different window on the economy, one that has largely been
unexploited. This paper has sketched some of the views through that window.
22 See for example MacCallum (1980) who argues that such markets were central, and McCalla (1993) andMcInnis (1992) who argue that they were not.

18
Table 1
Comparison of stated and actual terms of mortgages
Stated term
6-10 More than0-2 years 3-5 years years 10 years Total
Actual Term 0-2 years Count 56 33 2 91
% ofcolumn 30.9% 17.7% 3.2% 20.7%
3-5 years Count 55 76 16 1 148
% ofcolumn 30.4% 40.9% 25.4% 11.1% 33.7%
6-10 years Count 41 51 30 3 125
% ofcolumn 22.7% 27.4% 47.6% 33.3% 28.5%
More than Count 29 26 15 5 7510 years
% ofcolumn 16.0% 14.0% 23.8% 55.6% 17.1%
Total Count 181 186 63 9 439
% ofcolumn 100.0% 100.0% 100.0% 100.0% 100.0%

19
Table 2
Stated term for discharged and undischarged mortgages
No DischargeDischarged Recorded Total
Stated Term 0-2 years Count 179 334 513
% ofrow 34.9% 65.1% 100.0%
3-5 years Count 162 279 441
% ofrow 36.7% 63.3% 100.%
6-10 years Count 50 91 141
% ofrow 35.5% 64.5% 100.0%
More than Count 8 16 2410 years
% ofrow 33.3% 66.7% 100.0%
Total Count 399 720 1119
% ofrow 35.7% 64.3% 100.0%

20
Table 3
Stock of outstanding mortgages
Number of mortgages
outstanding
1799 15
1809 57
1819 56
1829 126
1839 248
1849 505
21
Table 4
Number of mortgages granted by decade and residence of lender
Residence of lender
OtherNiagara Upper Lower United Uniteddistrict Canada Canada States Kingdom Total
1790.00 Count 8 2 5 1 16
% ofrow 50.0% 12.5% 31.3% 6.3% 100.0%
1800.00 Count 38 4 5 1 48
% ofrow 79.2% 8.3% 10.4% 2.1% 100.0%
1810.00 Count 38 8 9 1 56
% ofrow 67.9% 14.3% 16.1% 1.8% 100.0%
1820.00 Count 114 14 14 1 143
% ofrow 79.7% 9.8% 9.8% .7% 100.0%
1830.00 Count 229 47 24 1 7 308
% ofrow 74.4% 15.3% 7.8% .3% 2.3% 100.0%
1840.00 Count 561 148 34 22 19 784
% ofrow 71.6% 18.9% 4.3% 2.8% 2.4% 100.0%
Total Count 988 223 91 25 28 1355
% ofrow 72.9% 16.5% 6.7% 1.8% 2.1% 100.0%

22
Table 5
Number of mortgages granted by class of borrower and residence of lender
Residence of lender
OtherNiagara Upper Lower United Uniteddistrict Canada Canada States Kingdom Total
borrower yeoman Count 445 64 4 7 3 523class
% ofrow 85.1% 12.2% .8% 1.3% .6% 100.0%
elite Count 264 80 70 11 25 450
% ofrow 58.7% 17.8% 15.6% 2.4% 5.6% 100.0%
other Count 216 32 10 6 4 268
% ofrow 80.6% 11.9% 3.7% 2.2% 1.5% 100.0%
Total Count 925 176 84 24 32 1241
% ofrow 74.5% 14.2% 6.8% 1.9% 2.6% 100.0%

23
Table 6
Average size of mortgage by class of borrower and residence of lender
(pounds currency)
6.1 Borrower: YeomenMean Std. Deviation Median Count
Niagara District 223 259 137 445
Other Upper C. 241 396 141 64
Lower Canada 250 206 178 4
United States 211 98 150 7
United Kingdom 94 106 33 3
Total 224 276 138 531
6.2 Borrower: EliteMean Std. Deviation Median Count
Niagara District 530 1009 250 264
Other Upper C. 627 834 350 80
Lower Canada 1004 1244 500 70
United States 2267 3260 763 11
United Kingdom 2044 2047 1000 25
Total 747 1262 307 441
6.3 Borrower: OtherMean Std. Deviation Median Count
Niagara District 228 443 112 216
Other Upper C. 265 369 106 32
Lower Canada 1230 2400 470 10
United States 122 96 119 6
United Kingdom 1583 2329 615 4
Total 288 704 120 264

24
Table 7
Regression of Loan Size on collateral
Model 1 Model 2
Variable Coefficient Std. Error T Stat. Coefficient Std. Error T Stat.
Constant 47.9 38.2 1.2
Elite 268.4* 63.8 4.2 320* 48 6.6
Not ND. 250.5* 67.7 3.7 241* 50.6 4.8
Price paid .45* .08 5.6 .515* .04 12.7
PP * ND -6.4 E-02 .1 -.64
PP*Elite 8.6E-02 .095 .90
* significant at 1%

25
Bibliography
Allen, R.C. (1992) Enclosure and the Yeoman (Oxford: Clarendon Press).
Armour, E.D. (1925) The Investigation of Titles to Real Property in Ontario
Dictionary of Canadian biography various volumes.
Gagan, D. (1974) “The Security of Land: Mortgaging in Toronto Gore Township 1835-95” in Aspects of Nineteenth-Century Ontario ed. F.Armstrong, H. Stevenson, J.Wilson (Toronto: University of Toronto Press).
Guinnane, T. (1994) "A failed institutional transplant: Raiffeisen's credit cooperatives inIreland, 1894-1914" Explorations in Economic History, pp. 38-61.
Hoffman, P. G. Postel-Vinay, and J-L Rosenthal, (1992) "Private credit markets in Paris"Journal of Economic History, pp. 293-406.
Lewis, F. and M. Urquhart, (1999) "Growth and the Standard of Living in a PioneerEconomy". William and Mary Quarterly, (January): 151-81
McCalla, D. (1993) Planting the Province: The Economic History of Upper Canada1784-1870 Toronto: University of Toronto Press.
McCallum, John (1980) Unequal Beginnings: Agriculture and Economic Development inQuebec and Ontario until 1870 (Toronto: University of Toronto Press).
McInnis, (1992) Perspectives on Ontario Agriculture, 1815-1930 Gananoque: LangdalePress.
Megarry, R.E. and H.W.R. Wade (1975) The Law of Real Property (London: Stevens andSons).
Millar, WDJ (1974) "George PM Ball: A Rural Businessman in Upper Canada" OntarioHistory pp. 65-78.
Neal, L. (1990) The Rise of Financial Capitalism: International capital makrets in theAge of Reason New York: Cambridge University Press.
Neave, M. (1977) “Conveyancing..” Canadian Bar Review Vol. 55
Nelles, H.V. (1966) “Loyalism and Local Power: The District of Niagara, 1792-1837”Ontario History, pp.99-114.
Neufeld, E.P. (1972) The Financial System of Canada Toronto: Macmillan.
Pearlsten K. (1999) "For the more easy recovery of debts in his majesty's plantations":Credit and Conflict in Upper Canada, 1788-1809. LL.M. thesis University ofBritish Columbia.
Rayner W.B. and R.H. McLaren Falconbridge on Mortgages (Agincourt Ont., CanadianLaw Book).

26
Rothenberg, W. (1998) "Mortgage Credit at the Origins of a Capital market: MiddlesexCounty, Massachusetts, 1642-1770". Paper presented at the Economic HistoryAssociation conference, September 1998.
Smith, W.H. (1846) Smith’s Canadian Gazeteer Coles Canadiana Collection.
Snowden, K. (1987) "Mortgage Rates and American Capital Market Development in theLate Nineteenth Century" Journal of Economic History 47; 771-91.
Snowden, K. (1995) "The Evolution of Interregional Mortgage Lending Channels, 1870-1940: The Life Insurance-Mortgage Company Connection" in Coordination andInformation: Historical perspectives on the organization of enterprise. Chicago:University of Chicago Press, 209-47.
Snowden, K. (1997) "Building and Loan Associations in the U.S., 1880-1893: TheOrigins of Localization in the Residential Mortgage Market" Research inEconomics 51, 227-50.
Weaver, J (1990) “While equity slumbered: Creditor Advantage, a capitalist land market,and Upper Canada’s Missing Court” Osgoode Hall Law Journal Vol 28, pp871-914.
Wilson, B. G. (1983) The Enterprises of Robert Hamilton: A Study of Wealth andInfluence in Early Upper Canada, 1776-1812 (Ottawa: Carleton UniversityPress).
Youdan, T.G. (1986) “The Length of a Title Search in Ontario” Canadian Bar ReviewVol. 64 pp. 507-33.

27
Figure 1New Mortgages per Annum
0
20
40
60
80
100
120
140
1795
1797
1799
1801
1803
1805
1807
1809
1811
1813
1815
1817
1819
1821
1823
1825
1827
1829
1831
1833
1835
1837
1839
1841
1843
1845
1847
1849

28
Figure 2Mean and Median Loan Value
0
200
400
600
800
1000
1200
1800
1802
1804
1806
1808
1810
1812
1814
1816
1818
1820
1822
1824
1826
1828
1830
1832
1834
1836
1838
1840
1842
1844
1846
1848
1850
Po
un
ds
curr
ency
Mean
Median

29
Figure 3Value of Outstanding Mortgages
0
20000
40000
60000
80000
100000
120000
1800
1802
1804
1806
1808
1810
1812
1814
1816
1818
1820
1822
1824
1826
1828
1830
1832
1834
1836
1838
1840
1842
1844
1846
1848
£ cu
rren
cy
0
200000
400000
600000
800000
1000000
1200000
£ cu
rren
cy
Value (LH Scale)
Value wo Railroads (LH Scale)
Notes Discounted at Banks (RH Scale)

30
Figure 4Number of mortgages Outstanding
0
100
200
300
400
500
600
1795
1797
1799
1801
1803
1805
1807
1809
1811
1813
1815
1817
1819
1821
1823
1825
1827
1829
1831
1833
1835
1837
1839
1841
1843
1845
1847
1849

31
Figure 5Montreal wheat price and Number of outstanding mortgages
-40
-30
-20
-10
0
10
20
30
40
50
1795
1797
1799
1801
1803
1805
1807
1809
1811
1813
1815
1817
1819
1821
1823
1825
1827
1829
1831
1833
1835
1837
1839
1841
1843
1845
1847
1849
0
2
4
6
8
10
12
14
16
18
20
Deviation from trend (LH axis)
Montreal Price of Wheat (RH axis)