the monetary policy of the ecb - european central bank - europa
TRANSCRIPT

THe MoneTary Policyof THe ecb
2011
euro
Pean
cen
Tral
ban
kTH
e M
on
eTar
y Po
licy
of
THe
ecb
201
1

THe MoneTary Policyof THe ecb2011

© European Central Bank, 2011
AddressKaiserstrasse 29
60311 Frankfurt am Main
Germany
Postal addressPostfach 160319
60066 Frankfurt am Main
Germany
Telephone+49 69 13440
Internethttp://www.ecb.europa.eu
Fax+496913446000
Telex411 144 ecb d
This publication was produced under the responsibility of the Executive Board of the ECB.
All rights reserved. Reproduction for educational and non-commercial purposes is permitted provided that the source is acknowledged.
The cut-off date for the statistics included in this issue was end-January 2011.
ISBN 978-92-899-0777-4 (print)
ISBN 978-92-899-0778-1 (online)

3
CONTENTS
FOREWORD 7
INTRODUCTION 9
CHAPTER 1
The institutional framework of the single monetary policy 13
CHAPTER 2
The economic and financial structure of the euro area 29
2.1 Key characteristics of the real economy 29
2.2 Labour market 29
2.3 Government sector 32
2.4 External trade 37
2.5 Financial structure 39
2.6 Financial markets 43
2.7 Financial intermediaries 48
2.8 Economic diversity 52
CHAPTER 3
The ECB’s monetary policy strategy 55
3.1 The role of monetary policy and the benefits of price stability 55
3.2 The transmission mechanism of monetary policy 58
3.3 The ECB’s monetary policy strategy – general principles
and main elements 62
3.4 The ECB’s quantitative definition of price stability 64
3.5 The analysis of risks to price stability in the ECB’s monetary
policy strategy 69
3.6 Monetary policy, financial stability and asset prices 83
3.7 Transparency and communication 86
3.8 The ECB’s monetary policy strategy – a guidepost
in the financial crisis 90
CHAPTER 4
Monetary policy implementation 93
4.1 Objectives and general principles behind the design
of the operational framework 93
4.2 Overview of the Eurosystem’s operational framework 96
4.3 Minimum reserves 101
4.4 Open market operations 104
4.5 Standing facilities 108
4.6 Central bank liquidity and liquidity needs of the banking system 111
4.7 Experience since January 1999 115
4
CHAPTER 5
The conduct of monetary policy since 1999 117
5.1 Introduction 117
5.2 Main developments 118
5.3 An assessment of monetary policy since the introduction
of the euro in 1999 129
ANNEX
History – The three stages of Economic and Monetary Union 131
GLOSSARY 135
BIBLIOGRAPHY 151
INDEX 157
BOXES
1.1 Key provisions from the Treaties and the Statute of the ESCB 21
2.1 EU institutional arrangements for sound and sustainable public
finances 35
2.2 Financial markets – key terms 42
2.3 Monetary aggregates 50
3.1 Construction and features of the Harmonised Index of Consumer
Prices 65
3.2 The medium-term orientation of the ECB’s monetary policy 68
3.3 Alternative monetary policy strategies 70
3.4 Statistics relating to developments in the euro area 72
3.5 Extracting information from financial market prices 74
3.6 Money and prices in the long run 78
3.7 Tools for monetary analysis 81
3.8 Key communication channels used by the ECB 89
4.1 Counterparties and collateral 96
4.2 Changes to the maturity of the main refinancing operations
and the reserve maintenance period as of March 2004 103
4.3 Types of open market transaction 107
5.1 The Eurosystem’s non-standard measures since August 2007 126
TABLES
2.1 Key characteristics of the euro area real economy in 2009 30
2.2 Labour force participation rates by gender and age group in the
euro area and the United States in 2009 32
2.3 External trade in goods of the euro area in 2009 37
2.4 Trade weights of the euro area’s 20 main trading partners 38

5
2.5 Main financial assets and liabilities of non-financial sectors in the
euro area at the end of 2009 40
2.6 Amounts outstanding of euro-denominated short-term debt
securities issued by euro area residents 45
2.7 Amounts outstanding of euro-denominated long-term debt securities
issued by euro area residents 45
2.8 Amounts outstanding of debt securities denominated in national
currency issued by residents in the euro area, the United States
and Japan at the end of 2009 46
2.9 Stock market capitalisation in the euro area, the United States
and Japan 47
2.10 Number of domestic and foreign companies listed on stock markets
in the euro area, the United States and Japan 47
2.11 Number of euro area monetary financial institutions 48
2.12 Definitions of euro area monetary aggregates 50
2.13 Bank deposits and loans in the euro area, the United States
and Japan at the end of 2009 52
3.1 Weights of the main euro area HICP components applicable
for 2010 65
4.1 Eurosystem monetary policy operations 95
4.2 Credit institutions’ liabilities included in the reserve base 102
4.3 Central bank balance sheet structure 112
4.4 Contributions to the banking system’s liquidity 113
CHARTS
1.1 The decision-making bodies of the ECB 18
1.2 Three-group rotation system for the Governing Council
of the ECB with 27 countries in the euro area 20
2.1 Unemployment in the euro area, the United States and Japan 31
2.2 General government deficit and debt in the Euro 12 37
2.3 Functions of financial systems 39
2.4 Composition of the consolidated balance sheet of the euro area
MFIs (including the Eurosystem) at the end of 2009 49
2.5 Percentage shares of components of M3 at the end of 2009 51
2.6 Dispersion of annual inflation across euro area countries
and the United States 53
2.7 Dispersion of real GDP growth across euro area countries
and the United States 54
3.1 A stylised illustration of the transmission mechanism from interest
rates to prices 59
3.2 Frequency decomposition of M3 and the Harmonised Index of
Consumer Prices 79
3.3 The stability-oriented monetary policy strategy of the ECB 83
3.4 Inflation expectations in the euro area 91
4.1 Breakdown of assets submitted as collateral 98
4.2 Key ECB interest rates and the EONIA since 1999 100
4.3 The functioning of the Eurosystem’s reserve requirement system 104
4.4 Recourse to standing facilities 109
6
4.5 Recourse to standing facilities within a maintenance period 110
4.6 Volume of main and longer-term refinancing operations 114
4.7 Required reserves and autonomous liquidity factors 114
5.1 ECB key interest rates in the six phases 117
5.2 HICP Inflation 119
5.3 Nominal effective exchange rate of the euro and oil prices 119
5.4 M1 and loans to private sector 120
5.5 M3 growth 120
5.6 Real GDP, industrial production and industrial confidence
for the euro area 121
5.7 Indicators of long-term inflation expectations in the euro area 122
5.8 Spread between the three-month EURIBOR and the overnight
indexed swap rate 126
5.9 Spreads of the ten-year government bonds of selected euro area
countries against the German Bund 128

7
FOREWORD
On 1 January 1999 a new currency –
the euro – was created. Today the euro
is the official currency of 17 European
countries with more than 330 million
citizens, and an anchor of stability for
Europe.
The Treaty assigns the Eurosystem the
primary objective of maintaining price
stability, reflecting a broad consensus
in society that maintaining stable prices
is the best contribution that monetary
policy can make to economic growth,
job creation and social cohesion.
From the outset, the Governing Council
of the ECB has set itself a very clear
numerical benchmark, against which
our fellow citizens can assess the
performance of their single monetary
policy. The Governing Council aims to
maintain inflation below, but close to,
2% over the medium term.
From the start, the Eurosystem has
succeeded in maintaining price stability
in the euro area over the medium term.
In the first 12 years of the euro, the
average annual inflation rate in the
euro area has been below, but close to,
2% and inflation expectations have
remained fully anchored in line with
price stability. The credibility of the
euro, as measured by its ability to
preserve the purchasing power of euro
area households, has been better than
that of its legacy currencies over the
previous 50 years.
The conditions for achieving price
stability have not been easy and the
single monetary policy has faced a
number of significant challenges.
Several adverse shocks have hit the
euro area economy. The ECB has
been confronted with periods of strong
global commodity price movements,
which are not under the control of
monetary policy. It has had to deal
with bouts of uncertainty in the world
economy, including the geopolitical
tensions that prevailed in the aftermath
of the terrorist attacks of 11 September
2001 and the most serious financial
crisis since the Great Depression.
The recent crisis has revealed the need
for a quantum leap forward towards
reinforcing the institutional framework
of Economic and Monetary Union
(EMU). While the monetary aspects
of EMU have proven robust, some
weaknesses in its economic functions
have become obvious. There is a need
to reinforce economic governance in the
euro area, including the fiscal regime
enshrined in the Stability and Growth
Pact and the national economic policy
frameworks. We also have to build
and implement a rigorous and credible
surveillance framework.
This book provides a comprehensive
overview of the ECB’s monetary
policy. The third edition of the book
takes into account new developments
since the last edition was published in
2004. The implications for the legal
framework of the entry into force of the
Lisbon Treaty on 1 January 2009 have
been taken into account. The overview of
the main economic and financial features
of the euro area economy has been
updated with six years of additional
data. In mid-2007 the Governing
Council decided to embark upon a
research programme to enhance the
ECB’s monetary analysis, the key
results of which are presented together
with the ECB’s two-pillar monetary
policy strategy. The flexible design

8
and the broad range of instruments and
procedures within the Eurosystem’s
operational framework have supported
the ECB’s bold response to the financial
crisis, including the introduction of
a number of non-standard monetary
policy measures which are explained
in this edition. Finally, the book
provides a brief review of the conduct
of monetary policy during nearly
12 years of EMU.
I am sure this third edition of “The
monetary policy of the ECB” will
further enhance understanding of the
ECB’s monetary policy.
Frankfurt am Main, May 2011
Jean-Claude Trichet
President of the ECB

9
INTRODUCTION
On 1 January 1999 the ECB assumed
responsibility for monetary policy
in the euro area – the second largest
economic area in the world after
the United States. This represented
a milestone in a long and complex
process of integration among European
countries. Twelve years on, the ECB
enjoys a high degree of credibility
worldwide for its sound monetary policy
geared to maintaining price stability in
the euro area.
The ECB’s robust monetary policy
framework builds on lessons drawn
from the historical experiences of many
central banks over several decades in
the past, ranging from failed attempts
to fine-tune the economy and the
resulting stagflation that prevailed in
many industrialised countries in the
1970s to the successful experiences
in bringing inflation down to levels
consistent with price stability in the
1980s. The institutional framework of
the single monetary policy is based
on two fundamental principles that
are indispensable for sound monetary
policy-making. First, the central
bank’s mandate shall focus clearly and
unambiguously on maintaining price
stability. Second, the central bank shall
be independent. With the ratification
of the Lisbon Treaty, the assignment
of a clear and unambiguous mandate
to the ECB to maintain price stability
was confirmed, and even reinforced, by
the elevation of the primary objective
of the ECB – price stability – to an
objective of the European Union as
a whole. The ECB is granted full
independence from political inference
in the fulfilment of this mandate,
including the prohibition of monetary
financing of public authorities.
Since its inception the ECB has adopted
a clear monetary policy strategy, which
has been effective both in turbulent
times and during quieter periods.
Since 1998 the ECB has defined price
stability as a year-on-year increase in
the Harmonised Index of Consumer
Prices for the euro area of below 2%
over the medium term. The definition
makes it clear that inflation above 2%
is not consistent with price stability –
the primary objective of the ECB.
It also implies that very low inflation
rates, and especially deflation, are not
consistent with price stability either.
In 2003, in the context of the evaluation
of the monetary policy strategy, the
Governing Council confirmed the
quantitative definition of price stability
and clarified that, in pursuing price
stability, it will aim to keep the euro
area inflation rate at below, but close
to, 2% over the medium term.
One of the key features of the ECB’s
monetary policy strategy is its two-
pillar framework for the analysis of
the risks to price stability. The two
pillars represent two complementary
perspectives on the determinants of
price developments. One perspective,
referred to as the “economic analysis”,
is aimed at assessing the short to
medium-term determinants of price
developments, with a focus on real
activity and the cost factors driving
prices over those horizons. It takes
account of the fact that short to medium-
term price developments are influenced
largely by the interplay of supply and
demand in the goods, services and
factor markets.
While many factors can influence
price developments over shorter

10
horizons, it is an undisputed fact that
prolonged periods of high inflation are
associated with high money growth
and that inflation is ultimately a
monetary phenomenon. Therefore, the
second perspective, referred to as the
“monetary analysis”, is founded on the
relationship between money growth and
inflation over the medium to longer-
term horizon and exploits the fact
that monetary trends lead inflationary
trends. The monetary analysis serves,
in particular, as a means of cross-
checking, from a medium to long-term
perspective, the short to medium-term
indications for monetary policy derived
from the economic analysis.
Two important developments that
occurred after the second edition of this
book was published deserve special
mention.
The enhancement of the monetary
analysis
Experience has demonstrated that
communicating the monetary analysis
may at times be challenging. This can
be attributed partly to the fact that for
a long time, mainstream economics has
neglected the analysis of monetary data
and the developments in theoretical
and empirical research on interpreting
the interaction between money demand
and money creation and its impact on
the determination of prices.
As with all forms of analysis, to remain
relevant for policy-making, the tools
employed in the conduct of the
monetary analysis need to be
continuously refined and developed as
new data become available and
methods advance. In spring 2007 the
Governing Council of the ECB,
which was confronted with excessive
money growth and perceived serious
challenges down the road, decided to
give additional impetus to this ongoing
process by initiating a research
programme to enhance the ECB’s
monetary analysis. New research 1 has
deepened the understanding of the
relationship between longer-term trends
in monetary growth and inflation and
has led to a more refined view of how
it can be used to support monetary
policy decisions. This has confirmed
the soundness of the two-pillar
monetary policy strategy since the
introduction of the euro, including the
prominent role given to monetary
analysis as a useful guide for monetary
policy decisions.
The ECB’s response
to the financial crisis
The second challenge faced by the ECB
since the publication of the second
edition of this book was the global
financial crisis that started in 2007 and
fully erupted in autumn 2008. Relying on
a sound monetary policy strategy in such
uncertain times becomes a major asset.
The clear and unambiguous objective
of maintaining price stability provided
a strong focus for all of the ECB’s
decisions and created a focal point for
coordinating private sector expectations.
The ECB’s credibility ensured that price
stability could be maintained. In this
respect, our monetary policy strategy
has proved its robustness.
Throughout the crisis, monetary policy
reacted to economic and financial
shocks with the appropriate medium-
term orientation to ensure a solid
anchoring of inflation expectations
in line with the Governing Council’s
aim of keeping inflation rates below,
but close to, 2% over the medium
1 See Papademos, L. and Stark, J. (eds.) (2010), Enhancing monetary analysis, ECB.

11
term. This medium-term orientation
implied that monetary policy had to
look beyond short-term movements in
prices and remedy dysfunctionalities in
the monetary transmission mechanism.
It was the monetary analysis in
particular that ensured such a medium-
term orientation in the conduct of
monetary policy.
At times of heightened stress and
uncertainty, the ECB used its liquidity
operations in a pragmatic manner.
In addition to reducing conventional
interest rates to historically low levels,
the Governing Council decided to adopt
non-standard measures – which became
known as Enhanced Credit Support –
to restore the transmission mechanism
of monetary policy. All non-standard
measures are of a temporary nature
and are generally designed to phase
out automatically. They are all aimed
at ensuring continued maintenance of
price stability over the medium term.
---
The remainder of the book is structured
as follows. Chapter 1 describes the main
institutional aspects that are relevant
for understanding the single monetary
policy. Getting acquainted with the
ECB’s monetary policy requires a
sound knowledge of the institutional
framework of EMU. This chapter
covers fundamental aspects, such as the
primary objective of the Eurosystem
and central bank independence.
Chapter 2 offers a broad overview of
the main economic and financial
structures of the euro area economy.
The key characteristics of the real
economy are considered first, focusing
on the composition of output,
demographic and key labour market
features, fiscal policy and patterns of
trade between the euro area and the rest
of the world. The key characteristics of
the financial structure are also described
by examining financial markets and
financial institutions.
Chapter 3 describes the ECB’s monetary
policy strategy, i.e. the ECB’s general
approach to achieving its primary
objective of maintaining price stability.
After explaining the key features of
the monetary policy transmission
mechanism and their implications for
the conduct of monetary policy, the
chapter focuses on the central elements
of the ECB’s strategy. It also looks at
the role of the ECB’s monetary policy
strategy in guiding the policy response
to the global financial crisis.
Chapter 4 explains how the Eurosystem
implements monetary policy decisions
using its monetary policy instruments.
It starts with an overview of the
objectives and general principles
that govern the functioning of the
Eurosystem’s operational framework
and describes the main monetary policy
instruments in greater detail (open
market operations, the minimum reserve
system and the standing facilities).
It concludes with a brief assessment
of the operational framework’s
performance in the first 12 years of the
single monetary policy.
Chapter 5 describes how monetary
policy has been conducted in the
euro area since 1999. The period has
been challenging for the euro area,
given that it has been confronted
with a host of economic and financial
shocks of varying nature, size and
persistence. Against this backdrop, the
12
Governing Council took its monetary
policy decisions with a clear focus on
the need to maintain price stability
over the medium term.
In the bibliography you will find
references for further reading on topics
that could not be covered in full in this
publication.
The novelty and richness of the ECB’s
monetary policy strategy has often
sparked intense debate among both
academics and market practitioners.
This book should be seen as part of our
constant effort to explain the ECB’s
approach to monetary policy.
Frankfurt am Main, May 2011
Jürgen Stark
Member of the Executive
Board of the ECB

13
1 THE INSTITUTIONAL FRAMEWORK
OF THE SINGLE MONETARY POLICY
On 1 January 1999 the European Central Bank (ECB) assumed responsibility
for monetary policy decision-making in the euro area – the second largest
economic area in the world after the United States. The transfer of this
responsibility from 11 national central banks (NCBs) – which became 17
with the participation of Estonia on 1 January 2011 – to a new supranational
institution represented a milestone in a long and complex process of
integration among European countries. Twelve years on, the ECB enjoys a
high degree of credibility worldwide for its sound monetary policy of ensuring
price stability in the euro area. This chapter describes the main institutional
aspects that are relevant for understanding the single monetary policy.
The ECB, the Eurosystem and the ESCB
The legal basis for the single monetary
policy is laid down in the Treaty on
European Union (TEU), the Treaty on the
Functioning of the European Union
(TFEU), and the Statute of the European
System of Central Banks and of the
European Central Bank (the Statute of the
ESCB).1 Excerpts from the most relevant
legal provisions can be found in Box 1.1.
The Treaties and the Statute of the
ESCB, which is annexed to the Treaties
as a protocol, establish the ECB,
the Eurosystem and the European System
of Central Banks (ESCB). The ECB is
an institution of the EU (Article 13 of
the TEU). The Eurosystem is made up of
the ECB and the NCBs of the EU
Member States whose currency is the
euro,2 whereas the ESCB comprises the
ECB and the NCBs of all EU Member
States (Article 282(1) of the TFEU).3 As
long as there are EU Member States
whose currency is not the euro, it will be
necessary to make a distinction between
the “Eurosystem” and the “ESCB”.
Enlargement of the euro area
The term “euro area” refers to the area
formed by the EU Member States
whose currency is the euro. This area
currently stretches from Cyprus to
Ireland and from Portugal to Finland.
To date, more than half of the EU
Member States have adopted the euro
as their official currency.
Since the introduction of the euro
in 1999 in 11 EU Member States, the
euro area has undergone five rounds of
enlargement that have brought the
number of euro area countries to 17
(in 2011). There are currently 10 EU
Member States whose currency is not
the euro (i.e Bulgaria, the Czech
Republic, Denmark, Latvia, Lithuania,
Hungary, Poland, Romania, Sweden
and the United Kingdom). Denmark
and the United Kingdom have a special
status (based on an “opt-out clause”);
the other eight countries are prospective
candidates for adoption of the
euro (i.e. “Member States with a
derogation”).
Legal basis for the single
monetary policy
1 The Treaty of Lisbon entered into force on 1 January 2009 and has amended the Treaty on European Union.2 The governors of the NCBs of those EU Member States whose currency is not the euro do not participate in monetary
policy decision-making for the euro area and such NCBs do not participate in the operational implementation
of these decisions.3 In contrast to the ESCB as a whole, the ECB has been vested with legal personality by the Treaties. Each of the
NCBs has legal personality, as laid down by the national laws of the respective country.
The ECB, the Eurosystem
and the ESCB
Euro area
Euro area enlargement

14
Once a country has joined the euro area,
it is no longer able to use domestic
interest and exchange rate policies
as separate policy instruments.
If convergence is not sustainable, a
country might run into competitiveness
problems, which it can no longer address
through exchange rate adjustments.
Therefore, to be able to integrate
smoothly into the euro area, EU Member
States must fulfil a number of legal and
economic preconditions, known as
convergence criteria. The legal
convergence criteria oblige prospective
countries to bring their national laws
into line with the relevant legislation
applying to the Eurosystem (e.g. central
bank independence). The economic
convergence criteria refer to the need
for a high degree of price stability, a
sound fiscal position, exchange rate
stability and converging long-term
interest rates.
The Eurosystem’s mandate, independence
and reporting obligations
Article 127(1) of the TFEU – which
refers to the ESCB rather than to the
Eurosystem, since it was drawn up on
the premise that all EU Member States
would eventually adopt the euro –
states that the primary objective of the
ESCB is to maintain price stability and
that, without prejudice to the objective
of price stability, the ESCB will support
the general economic policies in the
EU with a view to contributing to the
achievement of the objectives of the
EU as laid down in Article 3 of
the TEU.
Article 3 of the TEU sets out the
objectives of the EU, which include,
among other things, the sustainable
development of Europe based on
balanced economic growth and price
stability, and a highly competitive
social market economy, aiming at
full employment and social progress.
Price stability is therefore not only
the primary objective of the ECB’s
monetary policy, but also an objective
of the EU as a whole. The Treaties
thus establish a clear hierarchy of
objectives for the Eurosystem, which
clarifies that price stability is the most
important contribution that monetary
policy can make to achieving a
favourable economic environment and
a high level of employment.
A flexible exchange rate regime has
been adopted for the euro, as is also the
case for the US dollar. Hence,
the exchange rate is not a separate
policy instrument. When conducting its
monetary policy, the ECB takes the
exchange rate into account insofar as it
affects the general economic situation
and outlook for price stability
(see Chapter 3). While the Treaties
foresee that decisions on foreign
exchange arrangements are a shared
responsibility of the ECOFIN Council
(de facto, the Eurogroup) and the ECB,
their provisions ensure that foreign
exchange policy is fully consistent with
the primary objective of the single
monetary policy. Article 119 of the
TFEU explicitly states that the primary
objective of both the single monetary
policy and exchange rate policy is to
maintain price stability. Furthermore,
as regards the overall framework within
which exchange rate policy is to be
conducted, the Treaties require that
decisions in this area be without
prejudice to the primary objective.
Finally, the sole competence for
deciding on and carrying out operations
in the foreign exchange market lies
with the Eurosystem.
The euro area is characterised by a
unique combination of centralised
monetary policy-making and largely
Need for sustainable
convergence
Overriding importance of price stability
Exchange rate regime supports price stability
Monetary policy and fiscal policies

15
decentralised, albeit closely coordinated,
fiscal policy-making. This feature of
“one monetary policy and many fiscal
policies” is at the heart of the
institutional set-up which governs the
interactions between monetary and
fiscal policies in the euro area and aims
to ensure the smooth functioning of
Economic and Monetary Union (EMU).
At the same time, EU Member States
have to treat their economic policies as
a matter of common concern and
coordinate them within the EU Council
(Article 121(1) of the TFEU).
The framework is based on clearly
specified objectives and a clear
allocation of responsibilities between
policy areas. Concerning the interactions
between monetary policy and fiscal
policies, the framework is conducive to
well-aligned policy outcomes, provided
that all policy-makers live up to their
responsibilities.
Fiscal policies have a significant impact
on economic growth, macroeconomic
stability and inflation. A number of
institutional arrangements for sound
fiscal policies have been agreed at the
EU level, also with a view to limiting
risks to price stability (see Box 2.1).
These include:
• the prohibition of monetary financing
(Article 123 of the TFEU);
• the prohibition of privileged access
to financial institutions (Article 124
of the TFEU);
• the no-bail-out clause (Article 125 of
the TFEU);
• the fiscal provisions for avoiding
excessive government deficits
(Article 126 of the TFEU, which
also sets out the excessive deficit
procedure);
• the Stability and Growth Pact
(secondary legislation based on
Articles 121 and 126 of the TFEU).
The institutional framework for the
single monetary policy has established a
central bank that is independent from
political influence. A large body of
theoretical analysis, supported by
substantial empirical evidence, indicates
that central bank independence is
conducive to maintaining price stability.
Article 130 of the TFEU lays down this
important principle.When exercising the
powers and carrying out the tasks and
duties conferred upon them, neither the
ECB nor the NCBs, nor any member of
their decision-making bodies, are
allowed to seek or take instructions
from EU institutions or bodies, from
any government of a Member State or
from any other body. Furthermore,
under this article, the EU institutions
and bodies and the governments of the
EU Member States must also respect the
principle of independence and not seek
to influence the members of the decision-
making bodies of the ECB or the NCBs
in the performance of their tasks.
There are also other provisions that
safeguard the independence of the
Eurosystem and the decision-making
bodies of the ECB. For example, the
ECB’s financial arrangements are kept
separate from the financial interests of
the EU: the ECB has its own budget,
and its capital is subscribed and paid up
by the euro area NCBs. Long terms of
office for the members of the ECB’s
Governing Council and a rule stipulating
that members of the ECB’s Executive
Board cannot be re-appointed also help
to protect individual members of the
ECB’s decision-making bodies from
potential political influence. Moreover,
the Eurosystem’s independence is
preserved further by the fact that the
Treaties prohibit any provision of
central bank credit to the public sector
(see Box 2.1).
Arrangements for sound fiscal
policies
Independence from political influence
Further provisions that help to safeguard independence
16
Reporting obligations
To ensure legitimacy, an independent
central bank must be accountable to
democratic institutions and the general
public for its actions in the pursuit
of its mandate. In full respect of the
Eurosystem’s independence, Article 15
of the Statute of the ESCB imposes
precise reporting obligations on the
ECB. For example, the ECB is required
to publish quarterly reports on the
activities of the Eurosystem, as well
as a weekly consolidated financial
statement. In addition, it must provide
an annual report on its activities and on
the monetary policy of both the previous
and the current year, which is addressed
to the European Parliament, the EU
Council, the European Commission
and the European Council. Moreover,
in keeping with Article 284 of the
TFEU, the ECB’s President and other
Executive Board members appear
frequently at hearings organised by
the European Parliament’s Committee
on Economic and Monetary Affairs.
In practice, the ECB has gone beyond
these statutory reporting requirements
(see Chapter 3).
Tasks carried out through
the Eurosystem
Under Article 127(2) of the TFEU,
the basic tasks carried out through the
Eurosystem are:
• the definition and implementation
of the monetary policy of the euro
area;
• the conduct of foreign exchange
operations;
• the holding and management of
the official foreign reserves of the
EU Member States;
• the promotion of the smooth operation
of payment systems.
Further tasks concern the following
areas: Banknotes: the ECB has
the exclusive right to authorise the
issuance of banknotes within the
euro area. Statistics: in cooperation
with the NCBs, the ECB collects the
statistical information necessary for
the Eurosystem to perform its tasks,
either from national authorities or
directly from economic agents. Financial stability and supervision: the
Eurosystem contributes to the smooth
conduct of policies pursued by the
authorities in charge of the prudential
supervision of credit institutions
and the stability of the financial
system. International and European cooperation: the ECB maintains
working relations with relevant
institutions, bodies and fora, both within
the EU and internationally, in respect of
tasks entrusted to the Eurosystem.
In an environment of financial stability,
price stability is the best contribution
monetary policy can make to achieving
other objectives (see also Chapter 3).
At the same time, financial instability
can undermine the central bank’s ability
to maintain price stability over the
medium term. In a free market economy,
achieving and maintaining financial
stability is first and foremost the
responsibility of market participants,
who are expected to assess and manage
their risks effectively and to bear the
financial consequences of their
transactions. The fact that financial
stability is deemed to be a “public
good” requires, nonetheless, that an
institutional framework to safeguard
financial stability and mitigate the
effects of instability is in place.
In order to promote financial stability,
the Treaties provide for specific
cooperation mechanisms. First, under
Article 127(5) of the TFEU, the
Eurosystem has to contribute to the
smooth conduct of policies pursued by
Monetary policy and financial stability
Existing mechanisms for cross-border cooperation
17
the competent authorities relating to the
prudential supervision of credit
institutions and the stability of the
financial system. Second, according to
Article 25.1 of the Statute of the ESCB,
the ECB must be consulted on any
proposed EU act or any draft
legislative provision of the national
authorities that relates to its fields of
competence. Similarly, the ECB may
offer advice to, and be consulted by, the
EU Council, the European Commission
and the competent national authorities
on the scope and implementation of EU
legislation relating to the prudential
supervision of credit institutions and the
stability of the financial system. Finally,
Article 127(6) of the TFEU foresees the
possibility of transferring specific
supervisory tasks to the ECB following
a simplified procedure without the need
to amend the legislation.
In order to address severe tensions in
financial markets the following new
programmes were created in 2010:
the European Financial Stabilisation
Mechanism (EFSM) and the European
Financial Stability Facility (EFSF).
The EFSM has been operational since
10 May 2010, and the EFSF became
fully operational on 4 August 2010. The
EFSF has been authorised to issue
bonds in the market, which will be
guaranteed by the euro area countries.
Loans to a country in difficulty under
the EFSM and EFSF must be
accompanied by a detailed and
demanding set of policy conditions. In
March 2011 the EU Council decided
to establish a permanent crisis
management framework, the European
Stability Mechanism (ESM). The ESM
will complement the new framework of
reinforced governance from June 2013.
The institutional framework does not
give the Eurosystem direct supervisory
competencies. In several euro area
countries, but not all, central banks are
responsible for, or at least closely
involved in, prudential supervision
and supervisory functions. The
decentralised allocation of
responsibilities has created a need for
close cooperation (i) within the
Eurosystem, between the ECB
and the NCBs, in order to monitor
potential euro area-wide risks to
financial stability, and (ii) between the
Eurosystem and national supervisors to
ensure the close coordination of central
banking and supervisory functions in
contributing to safeguard financial
stability.
The Eurosystem carries out two main
functions in these areas. First, it monitors
and assesses the main risks to euro
area financial system stability and also
conducts market operations that aim to
address general financial shocks and
relieve tensions in the euro area money
market. Moreover, the Eurosystem
contributes to the definition of the
financial stability policies of the
competent national and EU authorities
pertaining to financial stability
monitoring and assessment, financial
regulation and supervision, and crisis
management. Second, the Eurosystem
oversees market infrastructures as part
of its basic task of promoting the smooth
operation of payment systems.
As the financial crisis has shown yet
again, global financial markets and
interconnected financial institutions are
subject to systemic risks. In order to
mitigate the exposure of the system to
the risk of failure of systemic
components and to enhance the overall
EU financial system’s resilience to
shocks, important institutional changes
were introduced. On 1 January 2011
the EU’s new financial supervisory
architecture became operational.
It includes three new European
New mechanisms for cross-border
cooperation
No euro area-wide competence
for prudential supervision
A new EU financial supervisory architecture

18
Supervisory Authorities (ESAs) for
banking, insurance and securities
markets to enhance micro-prudential
supervision and the European Systemic
Risk Board (ESRB), an independent
EU body, responsible for the macro-
prudential oversight of the financial
system within the EU. The ECB
ensures the Secretariat function for the
ESRB, and is also in charge of providing
analytical, statistical, administrative
and logistical support to the new
EU body.
The ESRB contributes to the prevention
or mitigation of systemic risks to
financial stability in the EU that
arise from developments within the
financial system. For this purpose, and
particularly with a view to avoiding
widespread financial distress, the ESRB
takes into account macroeconomic
developments. The ESRB thus
contributes to the smooth functioning
of the internal market and thereby
ensures a sustainable contribution of
the financial sector to economic growth.
Its main tasks are to monitor and assess
systemic risk and to issue warnings
and, where necessary, recommendations
to the relevant policy-makers with a
timeline for the relevant policy
response. The ECB’s support of the
ESRB is without prejudice to the
principle of central bank independence.
All members of the ECB’s General
Council are voting members of the
General Board of the ESRB.
The President of the ECB is the first
Chair of the ESRB for a term of
five years. The first Vice-Chair is a
member of the General Council of the
ECB and is also appointed for a term of
five years. The Steering Committee of
the ESRB includes the President of
the ECB, the Vice-President of
the ECB and four other members of the
General Council.
The decision-making bodies of the ECB
The monetary policy of the ECB is
based on a collective decision-making
system (Articles 129 and 132 of the
TFEU). There are two decision-making
bodies of the ECB (Article 129(1)
of the TFEU) which are responsible
for the preparation, conduct and
implementation of the single monetary
policy: the Governing Council and
the Executive Board (see Chart 1.1).
A third decision-making body of the
ECB is the General Council.
The tasks of the ESRB
Chart 1.1 The decision-making bodies of the ECB
PresidentVice-President
PresidentVice-President
PresidentVice-President
Four other members of the Executive Board
Four other members of the Executive Board
Governors of the euro area NCBs
Governors of the NCBsof all EU Member States
EXECUTIVE BOARD GOVERNING COUNCIL GENERAL COUNCIL
THE DECISION-MAKING BODIES OF THE ECB

19
The Governing Council of the ECB
consists of the six members of the
Executive Board and the governors of the
euro area NCBs (17 governors in 2011).
Both the Governing Council and the
Executive Board are chaired by the
President of the ECB or, in his
absence, by the Vice-President. The
responsibilities of the Governing
Council are:
• to adopt the guidelines and take the
decisions necessary to ensure the
performance of the tasks entrusted to
the Eurosystem;
• to formulate the monetary policy of
the euro area.
In accordance with Article 12.1 of the
Statute of the ESCB, the formulation
of monetary policy for the euro
area includes taking decisions on
“intermediate monetary objectives,
key interest rates and the supply of
reserves” in the Eurosystem. Moreover,
the Governing Council establishes
the necessary guidelines for the
implementation of those decisions.
The Executive Board of the ECB
consists of the President, the Vice-
President and four other members,
all of whom – since the entry into force
of the Treaty of Lisbon – are appointed
by the European Council, acting
by a qualified majority, on a
recommendation from the Council of
the European Union. In accordance with
Articles 12.1 and 12.2 of the Statute of
the ESCB, the Executive Board:
• prepares the meetings of the
Governing Council;
• implements monetary policy in
accordance with the guidelines and
decisions laid down by the Governing
Council and, in so doing, gives the
necessary instructions to the euro
area NCBs;
• is responsible for the current business
of the ECB;
• assumes certain powers delegated to
it by the Governing Council, which
may include powers of a regulatory
nature.
The General Council of the ECB is
composed of the President and
Vice-President of the ECB and the
governors of the NCBs of all EU
Member States (27 in 2011). It will
remain in existence for as long as there
are EU Member States whose currency
is not the euro. The General Council
has no responsibility for monetary
policy decisions in the euro area.
It carries out those tasks inherited
from the European Monetary Institute
(EMI) that still have to be performed
precisely because the euro is not the
currency of all EU Member States.4
In accordance with Articles 43, 44
and 46 of the Statute of the ESCB and
Article 141(2) of the TFEU, the General
Council contributes to:
• strengthening the coordination of the
monetary policies of the EU Member
States whose currency is not the
euro, with the aim of ensuring price
stability;
• the collection of statistical information;
• the reporting activities of the ECB;
• the necessary preparations for
irrevocably fixing the exchange
rates of EU Member States whose
currency is not the euro.
Voting modalities
in the Governing Council
Decisions on monetary policy and on
the other tasks of the Eurosystem in the
euro area must be based on a euro area
perspective. When taking decisions,
the members of the Governing Council
do not act as national representatives
but in a fully independent, personal
Governing Council of
the ECB
Executive Board of the ECB
General Council of the ECB
4 For further details on the history of EMU, see also the annex.

20
capacity. Each member has one vote.
In the event of a tie, the President of the
ECB has a casting vote. Article 10.2
of the Statute of the ESCB states that
the Governing Council must act by a
simple majority. In practice, monetary
policy decisions have generally been
supported by a “consensus” among
members of the Governing Council.
With further enlargements of the euro
area, the Governing Council still needs
to take decisions in a timely and efficient
manner; so a new voting system was
required. On 21 March 2003 the
European Council approved an
amendment to Article 10.2 of the
Statute of the ESCB which provides
for an adjustment of the voting
modalities in the Governing Council.
The implementation of a new rotation
system aims to respect the principles of
“one member, one vote”, ad personam
participation, “representativeness”,
robustness and automaticity, equal
treatment, transparency and simplicity.
On 19 March 2009 the Governing
Council decided to implement a rotation
system for voting rights in the Governing
Council, as laid down in a new Article 3a
of the ECB’s Rules of Procedure. Under
this new system, all six members of the
Executive Board will maintain a
permanent voting right, but the voting
rights of NCB governors will be subject
to a rotation system once the number
of euro area countries exceeds 18.5
Governors will be allocated to groups
according to a key set out in Article
10.2 of the Statute of the ESCB.
Governors will rotate in and out of
voting rights after one month. For the
first group, the number of voting rights
that rotate in each one-month period
will be one; for the second and third
groups, the number of voting rights
Adjustment of voting
modalities in the Governing
Council
5 On 18 December 2008 the Governing Council decided to continue its current voting regime and to introduce the
rotation system only when the number of governors and presidents of the euro area NCBs exceeds 18, and not 15
as initially foreseen.
Chart 1.2 Three-group rotation system for the Governing Council of the ECB with 27 countries in the euro area
MEMBERS OF THEEXECUTIVE BOARD
THIRDGROUP
FIRSTGROUP
Eightgovernors
Fivegovernors
SECOND GROUPFourteen governors
Six permanentvotes
Fourrotating
votes
Threerotating
votes
Eight rotating votes
21votes
in total

21
that rotate in each one-month period
will be equal to the difference between
the number of governors allocated to
the group and the number of voting
rights assigned to it, minus two.
Chart 1.2 illustrates the three-group
rotation system for a euro area
comprising 27 countries. The rotation
system ensures high participation of
members combined with relative
stability of the composition of the
voting college. First, all governors
attend all meetings of the Governing
Council, irrespective of whether they
hold a voting right at the time. Second,
the rotation frequency will be such that
periods without a vote for individual
governors will be short.
The Eurosystem/ESCB committee
structure
Monetary policy decisions by the
Governing Council benefit from the
careful preparations and analyses of
Eurosystem/ESCB staff. With the launch
of the euro, the existing decentralised
architecture was applied and refined.
Eurosystem/ESCB committees are
responsible for coordinating those
Eurosystem/ESCB tasks that involve both
the ECB and the NCBs.
Eurosystem/ESCB committees
comprise experts from NCBs and the
ECB and cover most functional areas
of the Eurosystem/ESCB work. These
experts provide valuable input, in terms
of expertise and technical advice, to the
deliberations of the ECB’s decision-
making bodies. Moreover, these
committees may operate a variety of
working groups or task forces. Work at
various levels contributes to shaping
views and building consensus within
the Eurosystem/ESCB.
The current Eurosystem/ESCB
committees are: the Monetary Policy
Committee (MPC), the International
Relations Committee (IRC),
the Market Operations Committee
(MOC), the Statistics Committee
(STC), the Payment and Settlement
Systems Committee (PSSC), the
Financial Stability Committee (FSC),
the Banknote Committee (BANCO),
the Committee on Cost Methodology
(COMCO), the Information Technology
Committee (ITC), the Internal Auditors
Committee (IAC), the Eurosystem/ESCB
Communications Committee (ECCO),
the Legal Committee (LEGCO), the
Accounting and Monetary Income
Committee (AMICO), the Budget
Committee (BUCOM), Human Resources
Conference (HRC), the Eurosystem IT
Steering Committee (EISC) and the
Risk Management Committee (RMC).
Eurosystem/ESCB committees
Box 1.1 Key provisions from the Treaties and the Statute of the ESCB
This box includes selected key monetary policy provisions taken from the Treaty
on European Union, the Treaty on the Functioning of the European Union and the
Statute of the ESCB. The full legal texts are available from: www.europa.eu and
www.ecb.europa.eu.
1. EXCERPTS FROM THE TREATY ON EUROPEAN UNION
Article 3
3. The Union shall establish an internal market. It shall work for the sustainable
development of Europe based on balanced economic growth and price stability, a highly

22
competitive social market economy, aiming at full employment and social progress, and
a high level of protection and improvement of the quality of the environment. It shall
promote scientific and technological advance. […]
4. The Union shall establish an economic and monetary union whose currency is the
euro.
Article 13
1. The Union shall have an institutional framework which shall aim to promote its
values, advance its objectives, serve its interests, those of its citizens and those of the
Member States, and ensure the consistency, effectiveness and continuity of its policies
and actions.
The Union’s institutions shall be:
– the European Parliament,
– the European Council,
– the Council,
– the European Commission (hereinafter referred to as ‘the Commission’),
– the Court of Justice of the European Union,
– the European Central Bank,
– the Court of Auditors.
2. Each institution shall act within the limits of the powers conferred on it in the Treaties,
and in conformity with the procedures, conditions and objectives set out in them.
The institutions shall practice mutual sincere cooperation.
3. The provisions relating to the European Central Bank and the Court of Auditors and
detailed provisions on the other institutions are set out in the Treaty on the Functioning
of the European Union.
2. EXCERPTS FROM THE TREATY ON THE FUNCTIONING OF THE EUROPEAN UNION
Article 119
1. For the purposes set out in Article 3 of the Treaty on European Union, the activities of
the Member States and the Union shall include, as provided in the Treaties, the adoption
of an economic policy which is based on the close coordination of Member States’
economic policies, on the internal market and on the definition of common objectives,
and conducted in accordance with the principle of an open market economy with free
competition.
2. Concurrently with the foregoing, and as provided in the Treaties and in accordance
with the procedures set out therein, these activities shall include a single currency,
the euro, and the definition and conduct of a single monetary policy and exchange-rate
policy the primary objective of both of which shall be to maintain price stability and,
without prejudice to this objective, to support the general economic policies in the Union,
in accordance with the principle of an open market economy with free competition.
3. These activities of the Member States and the Union shall entail compliance with
the following guiding principles: stable prices, sound public finances and monetary
conditions and a sustainable balance of payments.

23
Article 121
1. Member States shall regard their economic policies as a matter of common concern
and shall coordinate them within the Council, in accordance with the provisions of
Article 120.
Article 127
1. The primary objective of the ESCB shall be to maintain price stability. Without prejudice
to the objective of price stability, the ESCB shall support the general economic policies in
the Union with a view to contributing to the achievement of the objectives of the Union as
laid down in Article 3 of the Treaty on European Union. The ESCB shall act in accordance
with the principle of an open market economy with free competition, favouring an efficient
allocation of resources, and in compliance with the principles set out in Article 119.
2. The basic tasks to be carried out through the ESCB shall be:
– to define and implement the monetary policy of the Union,
– to conduct foreign-exchange operations consistent with the provisions of Article 219,
– to hold and manage the official foreign reserves of the Member States,
– to promote the smooth operation of payment systems.
3. The third indent of paragraph 2 shall be without prejudice to the holding and management
by the governments of Member States of foreign-exchange working balances.
4. The European Central Bank shall be consulted:
– on any proposed Union act in its fields of competence,
– by national authorities regarding any draft legislative provision in its fields of
competence, but within the limits and under the conditions set out by the Council in
accordance with the procedure laid down in Article 129(4).
The European Central Bank may submit opinions to the appropriate Union institutions,
bodies, offices or agencies or to national authorities on matters in its fields of competence.
5. The ESCB shall contribute to the smooth conduct of policies pursued by the competent
authorities relating to the prudential supervision of credit institutions and the stability of
the financial system.
6. The Council, acting by means of regulations in accordance with a special legislative
procedure, may unanimously, and after consulting the European Parliament and
the European Central Bank, confer specific tasks upon the European Central Bank
concerning policies relating to the prudential supervision of credit institutions and other
financial institutions with the exception of insurance undertakings.
Article 129
1. The ESCB shall be governed by the decision-making bodies of the European Central
Bank which shall be the Governing Council and the Executive Board.
Article 130
When exercising the powers and carrying out the tasks and duties conferred upon them
by the Treaties and the Statute of the ESCB and of the ECB, neither the European Central
Bank, nor a national central bank, nor any member of their decision-making bodies shall
seek or take instructions from Union institutions, bodies, offices or agencies, from any

24
government of a Member State or from any other body. The Union institutions, bodies,
offices or agencies and the governments of the Member States undertake to respect this
principle and not to seek to influence the members of the decision-making bodies of the
European Central Bank or of the national central banks in the performance of their tasks.
Article 219
1. By way of derogation from Article 218, the Council, either on a recommendation from
the European Central Bank or on a recommendation from the Commission and after
consulting the European Central Bank, in an endeavour to reach a consensus consistent
with the objective of price stability, may conclude formal agreements on an exchange-
rate system for the euro in relation to the currencies of third States. The Council shall
act unanimously after consulting the European Parliament and in accordance with the
procedure provided for in paragraph 3.
The Council may, either on a recommendation from the European Central Bank or on a
recommendation from the Commission, and after consulting the European Central Bank,
in an endeavour to reach a consensus consistent with the objective of price stability,
adopt, adjust or abandon the central rates of the euro within the exchange-rate system.
The President of the Council shall inform the European Parliament of the adoption,
adjustment or abandonment of the euro central rates.
2. In the absence of an exchange-rate system in relation to one or more currencies of third
States as referred to in paragraph 1, the Council, either on a recommendation from the
Commission and after consulting the European Central Bank or on a recommendation
from the European Central Bank, may formulate general orientations for exchange-
rate policy in relation to these currencies. These general orientations shall be without
prejudice to the primary objective of the ESCB to maintain price stability.
Article 282
1. The European Central Bank, together with the national central banks, shall constitute
the European System of Central Banks (ESCB). The European Central Bank, together
with the national central banks of the Member States whose currency is the euro, which
constitute the Eurosystem, shall conduct the monetary policy of the Union.
2. The ESCB shall be governed by the decision-making bodies of the European Central
Bank. The primary objective of the ESCB shall be to maintain price stability. Without
prejudice to that objective, it shall support the general economic policies in the Union in
order to contribute to the achievement of the latter’s objectives.
3. The European Central Bank shall have legal personality. It alone may authorise
the issue of the euro. It shall be independent in the exercise of its powers and in the
management of its finances. Union institutions, bodies, offices and agencies and the
governments of the Member States shall respect that independence.
3. EXCERPTS FROM PROTOCOL (NO 4) ON THE STATUTE OF THE EUROPEAN SYSTEM
OF CENTRAL BANKS AND OF THE EUROPEAN CENTRAL BANK
Article 10 (The Governing Council)
10.2. Each member of the Governing Council shall have one vote. As from the date on
which the number of members of the Governing Council exceeds 21, each member of

25
the Executive Board shall have one vote and the number of governors with a voting right
shall be 15. The latter voting rights shall be assigned and shall rotate as follows:
– as from the date on which the number of governors exceeds 15, until it reaches 22,
the governors shall be allocated to two groups, according to a ranking of the size of the
share of their national central bank’s Member State in the aggregate gross domestic
product at market prices and in the total aggregated balance sheet of the monetary
financial institutions of the Member States whose currency is the euro. The shares in the
aggregate gross domestic product at market prices and in the total aggregated balance
sheet of the monetary financial institutions shall be assigned weights of 5/6 and 1/6,
respectively. The first group shall be composed of five governors and the second group
of the remaining governors. The frequency of voting rights of the governors allocated
to the first group shall not be lower than the frequency of voting rights of those of the
second group. Subject to the previous sentence, the first group shall be assigned four
voting rights and the second group eleven voting rights,
– as from the date on which the number of governors reaches 22, the governors shall be
allocated to three groups according to a ranking based on the above criteria. The first
group shall be composed of five governors and shall be assigned four voting rights. The
second group shall be composed of half of the total number of governors, with any fraction
rounded up to the nearest integer, and shall be assigned eight voting rights. The third group
shall be composed of the remaining governors and shall be assigned three voting rights,
– within each group, the governors shall have their voting rights for equal amounts of time,
– for the calculation of the shares in the aggregate gross domestic product at market
prices Article 29.2 shall apply. The total aggregated balance sheet of the monetary
financial institutions shall be calculated in accordance with the statistical framework
applying in the Union at the time of the calculation,
– whenever the aggregate gross domestic product at market prices is adjusted in accordance
with Article 29.3, or whenever the number of governors increases, the size and/or
composition of the groups shall be adjusted in accordance with the above principles,
– the Governing Council, acting by a two-thirds majority of all its members, with and
without a voting right, shall take all measures necessary for the implementation of the
above principles and may decide to postpone the start of the rotation system until the
date on which the number of governors exceeds 18.
The right to vote shall be exercised in person. By way of derogation from this rule,
the Rules of Procedure referred to in Article 12.3 may lay down that members of the
Governing Council may cast their vote by means of teleconferencing. These rules shall
also provide that a member of the Governing Council who is prevented from attending
meetings of the Governing Council for a prolonged period may appoint an alternate as a
member of the Governing Council.
The provisions of the previous paragraphs are without prejudice to the voting rights
of all members of the Governing Council, with and without a voting right, under
Articles 10.3, 40.2 and 40.3.
Save as otherwise provided for in this Statute, the Governing Council shall act by a
simple majority of the members having a voting right. In the event of a tie, the President
shall have the casting vote.
In order for the Governing Council to vote, there shall be a quorum of two-thirds of the
members having a voting right. If the quorum is not met, the President may convene an
extraordinary meeting at which decisions may be taken without regard to the quorum.

26
10.4. The proceedings of the meetings shall be confidential. The Governing Council may
decide to make the outcome of its deliberations public.
Article 12 (Responsibilities of the decision-making bodies)
12.1. The Governing Council shall adopt the guidelines and take the decisions necessary
to ensure the performance of the tasks entrusted to the ESCB under these Treaties
and this Statute. The Governing Council shall formulate the monetary policy of the
Union including, as appropriate, decisions relating to intermediate monetary objectives,
key interest rates and the supply of reserves in the ESCB, and shall establish the necessary
guidelines for their implementation.
The Executive Board shall implement monetary policy in accordance with the guidelines
and decisions laid down by the Governing Council. In doing so the Executive Board shall
give the necessary instructions to national central banks. In addition the Executive Board
may have certain powers delegated to it where the Governing Council so decides.
To the extent deemed possible and appropriate and without prejudice to the provisions
of this Article, the ECB shall have recourse to the national central banks to carry out
operations which form part of the tasks of the ESCB.
12.2. The Executive Board shall have responsibility for the preparation of meetings of
the Governing Council.
Article 15 (Reporting commitments)
15.1. The ECB shall draw up and publish reports on the activities of the ESCB at least
quarterly.
15.2. A consolidated financial statement of the ESCB shall be published each week.
15.3. In accordance with Article 284(3) of the Treaty on the Functioning of the
European Union, the ECB shall address an annual report on the activities of the ESCB
and on the monetary policy of both the previous and the current year to the European
Parliament, the Council and the Commission, and also to the European Council.
15.4. The reports and statements referred to in this Article shall be made available to
interested parties free of charge.
Article 17 (Accounts with the ECB and the national central banks)
In order to conduct their operations, the ECB and the national central banks may open
accounts for credit institutions, public entities and other market participants and accept
assets, including book entry securities, as collateral.
Article 18 (Open market and credit operations)
18.1. In order to achieve the objectives of the ESCB and to carry out its tasks, the ECB
and the national central banks may:
• operate in the financial markets by buying and selling outright (spot and forward)
or under repurchase agreement and by lending or borrowing claims and marketable
instruments, whether in euro or other currencies, as well as precious metals;
• conduct credit operations with credit institutions and other market participants,
with lending being based on adequate collateral.

27
Article 19 (Minimum reserves)
19.1. Subject to Article 2, the ECB may require credit institutions established in Member
States to hold minimum reserve on accounts with the ECB and national central banks
in pursuance of monetary policy objectives. Regulations concerning the calculation and
determination of the required minimum reserves may be established by the Governing
Council. In cases of non-compliance the ECB shall be entitled to levy penalty interest and
to impose other sanctions with comparable effect.
19.2. For the application of this Article, the Council shall, in accordance with the
procedure laid down in Article 41, define the basis for minimum reserves and the
maximum permissible ratios between those reserves and their basis, as well as the
appropriate sanctions in cases of non-compliance.

29
2 THE ECONOMIC AND FINANCIAL STRUCTURE
OF THE EURO AREA
The pursuit of the objective of price stability requires an understanding of the
factors that shape the price formation process, including the transmission of
monetary policy. This chapter provides an overview of the main economic
and financial structures of the euro area economy. The key characteristics
of the real economy are considered first, focusing on the composition of
output, demographic and key labour market features, fiscal policy, as well
as patterns of trade between the euro area and the rest of the world.
Following on from this, the key characteristics of the financial structure are
described by examining the money and capital markets and the main financial
institutions involved, distinguishing monetary financial institutions (MFIs)
from other financial intermediaries (OFIs).
2.1 KEY CHARACTERISTICS OF THE REAL
ECONOMY
While the individual economies that
now comprise the euro area may be
considered relatively small and open
economies, the euro area as a whole
forms a large, much more closed
economy. Therefore, the structural
features of the euro area are better
compared with those of the
United States or Japan than with those
of individual euro area countries.
A number of key macroeconomic
characteristics of the euro area are
presented in Table 2.1.6
Measured in terms of population,
the euro area is the largest developed
economy in the world. In 2009 it had a
total population of 330.5 million,
somewhat larger than that of the
United States and more than twice as
large as the population of Japan.
The euro area had a 15.1% share of
world GDP in 2009 (expressed in terms
of purchasing power parity), compared
with 20.4% for the United States and
6.0% for Japan. The shares of the
individual euro area countries were
significantly smaller, with the largest
economy within the euro area
accounting for 4.0% of world GDP
in 2009.
The structure of production in the euro
area closely resembles that in the United
States and Japan. In all three economies,
the services sector accounts for the
largest share of total output. There is,
however, an important difference in the
shares of the public and private sectors
in the overall services sector in the
United States compared with the euro
area. Specifically, the public services
sector in the United States is relatively
small, while it accounts for a much
larger share of the euro area economy.
In all three economies, the industrial
sector accounts for the second largest
share of total output. Given the highly
developed nature of these economies,
the share of agriculture, fishing and
forestry is relatively small.
2.2 LABOUR MARKET
Since 1999 more than 13 million jobs
have been created in the euro area,
whereas in the ten years prior to
The euro area economy is the second largest
in the world
6 Several tables and charts in this section are regularly updated on the ECB’s website.
Population and share in
world GDP
Services sector has largest share of euro area GDP
Structural unemployment in the euro area

30
Table 2.1 Key characteristics of the euro area real economy in 2009
Unit Euro area
United States
Japan
Population 1) millions 330.5 307.5 127.7
GDP (share of world GDP) 2) % 15.1 20.4 6.0
GDP per capita 2) € thousands 27.1 36.9 25.8
Value added by economic activity
Agriculture, fishing, forestry % of GDP 1.6 1.1* 1.6*
Industry (including construction) % of GDP 24.1 21.0* 27.3*
Services (including non-market services) % of GDP 74.3 77.9* 71.1*
Unemployment rate (share of the labour force) % 10.0** 9.6** 5.1**
Labour force participation rate 3) % 71.5 74.6 74.0
Employment rate 4) % 64.7 67.6 70.0
General government
Surplus (+) or deficit (-) % of GDP -6.3 -11.3 -8.7
Gross debt 5) % of GDP 79.2 68.6 180.4
Revenue % of GDP 44.6 26.6 31.6
of which: direct taxes % of GDP 11.4 9.7 7.8
of which: indirect taxes % of GDP 13.1 7.3 8.2
of which: social contributions % of GDP 15.7 6.9 11.7
Expenditure 6) % of GDP 50.8 37.9 40.4
of which: final consumption % of GDP 22.2 17.1 20.1
of which: social payments % of GDP 24.3 15 25.0
External 7)
Exports of goods % of GDP 14.4 7.6 10.8
Exports of goods and services % of GDP 19.7 11.1 13.3
Imports of goods % of GDP 14.0 11.2 9.9
Imports of goods and services % of GDP 18.9 13.8 12.9
Exports (share of world exports, including intra-euro area trade) % 29.1 8.6 4.7
Exports (share of world exports, excluding intra-euro area trade) % 16.9 10 5.5
Current account balance % of GDP -0.6 -2.7 2.8
Sources: Eurostat, IMF, European Commission, OECD, Thomson Reuters, ECB, national data and ECB calculations.
Notes:
1) Data for the euro area, United States and Japan refer to the annual average.
2) Data for the United States and Japan converted into euro at OECD purchasing power parities (PPPs).
3) Ratio of the labour force to the working age population (aged 15 to 64). US data refer to the proportion of the
civilian non-institutional population (aged 16 to 64) either at work or actively seeking work. Annual average.
4) Ratio of persons employed to the working age population (aged 15 to 64). US data refer to the proportion of the
civilian non-institutional population (aged 16 to 64) at work. Annual average.
5) Data follow Maastricht debt concepts and definitions. General government debt consists of deposits, securities
other than shares and loans outstanding at nominal value and consolidated within the general government sector.
Year-end.
6) European definition also applies to data for the United States and Japan.
7) Euro area data are based on extra-euro area transactions.
*2008 figures.
**2010 figures.

31
monetary union 7 million jobs were
created. The unemployment rate – the
number of unemployed persons as a
share of the labour force – displayed
cyclical fluctuations throughout the last
decade. In the 1980s and 1990s the
unemployment rate in the euro area
reached very high levels as a result of
both major shocks and structural
rigidities (see Chart 2.1). In 2010 the
average unemployment rate was 10.0%,
corresponding to around 15.8 million
unemployed persons in the euro area as
a whole. The figures in 2010 were
similar for both the euro area and US
economies. By contrast, since 1980 the
euro area unemployment rate has been,
on average, markedly higher than that
of the United States. This gap reflects
structural differences between the
labour markets in the United States and
those in the euro area, which have led
to a higher level of structural
unemployment in the euro area.
Reforms affecting institutional features
of labour markets were implemented in
euro area countries during the 1990s,
but to differing degrees. In some cases,
these reforms significantly reduced the
level of unemployment. Nevertheless,
structural rigidities remain and these
explain the still high levels of
unemployment in the euro area.
Besides a relatively high unemployment
rate, remarkably the euro area has a
relatively low labour force participation
rate (see Table 2.2). While the gap
between the euro area and the US labour
force participation rate has narrowed
considerably over time, in 2009 the
overall rate in the euro area (71.5%) was
still lower than in the United States
(74.6%). In terms of gender, the 2009
figures show that the gap was around
4 percentage points in the case of female
participation, around twice the size of
that for males. The lower overall labour
force participation rate in the euro area
relative to the United States mainly
reflects differences in the youngest and
oldest age groups. In general, Europeans
Relatively low labour force participation in the euro area
Chart 2.1 Unemployment in the euro area, the United States and Japan
(as a percentage of the labour force; annual data)
0
2
4
6
8
10
12
0
2
4
6
8
10
12
1979 19821970 1973 1976 1985 1988 1991 1994 1997 2006 20092000 2003
euro area
United States
Japan
Source: European Commission.

32
in the youngest age group participate
significantly less in the labour force than
their American counterparts. This could
be linked to differences in the traditions
and structures of the education and
social systems. People in the euro area
also tend to leave the labour force at a
younger age than people in the
United States. By contrast, the difference
between the participation rates for those
aged 25 to 64 years is somewhat
smaller.
The lower labour force participation
rate in the euro area results in a lower
employment rate (measured as the
number of employed persons as a share
of the population aged between 15 and
64) than in either the United States or
Japan. In Japan’s case this is also on
account of a lower unemployment rate
than in the euro area. The employment
rate in the euro area in 2009 was around
65%, lower than in the United States
and Japan (see Table 2.1). The relatively
low employment rate in the euro area,
together with a smaller number of
hours worked per employed person, is
one of the main reasons why GDP
per capita is lower than in the
United States.
The institutional aspects of labour
markets, such as job protection
legislation, unemployment benefit
systems, the wage formation process
and the taxation of labour, play a
significant role in determining
economic developments. For instance,
structural rigidities in labour markets
reduce the speed at which an economy
adjusts to adverse economic shocks.
Structural rigidities are therefore
typically associated with relatively high
and persistent unemployment rates.
Moreover, rigidities in the labour market
tend to limit the pace at which an
economy can grow without fuelling
inflationary pressures.
2.3 GOVERNMENT SECTOR
Fiscal policies have a significant impact
on economic growth and inflation
through a number of channels.
Of particular relevance are the level and
composition of government expenditure
and revenue, as well as budget deficits
and government debt. Unbalanced
public finances may result in demand
and inflationary pressures, forcing the
monetary authority to keep short-term
interest rates at a higher level than would
Euro area employment rate is relatively low
Structural rigidities can hamper the efficient functioning of the labour market
Fiscal policies affect the economy
Table 2.2 Labour force participation rates by gender and age group in the euro area and the United States in 2009
(as a percentage of the working age population)
Euro area United StatesMales Females Total Males Females Total
All age groups 78.5 64.6 71.5 80.4 69.0 74.6
15-24 1) 46.9 40.8 43.9 58.5 55.2 56.9
25-34 91.2 78.8 85.1 90.3 75.0 82.7
35-44 94.7 79.6 87.2 91.7 75.9 83.7
45-54 91.7 75.1 83.3 87.4 76.0 81.6
55-59 74.4 55.5 64.8 78.0 68.5 73.1
60-64 38.2 22.4 30.1 60.9 49.9 55.1
Sources: Eurostat and Bureau of Labour Statistics.
1) US data refer to the 16 to 24 age group.

33
otherwise be necessary. For instance,
an excessive increase in government
spending that stimulates aggregate
demand could create inflationary
pressure if it occurs when the economy
is already operating at close to full
capacity. Fiscal imbalances may also
undermine confidence in a stability-
oriented monetary policy if there are
expectations that excessive government
borrowing will in the end be
accommodated by the central bank.
Moreover, high levels of government
debt may endanger financial stability by
forcing the central bank to intervene in
order to ensure the proper functioning of
markets and the monetary transmission
mechanism. Such levels of government
debt may also have adverse effects on
the real economic environment.
For instance, excessive recourse to
capital markets by governments tends to
raise the cost of capital and possibly
reduce private investment (resulting in
what is known as “crowding out”). The
Treaty on the Functioning of the
European Union contains several
provisions to avoid such risks, but it
remains important for the ECB to follow
fiscal policy developments in the euro
area countries closely.
Fiscal discipline is a basic component
of a smooth functioning monetary
union. In an integrated single currency
area with integrated financial markets,
fiscal developments will also have an
impact on other member countries.
Although in Stage Three of EMU
budgetary policies remain the exclusive
competence of Member States, a
number of institutional arrangements at
the EU level ensure sound and
sustainable public finances in all
countries and therefore the euro area as
a whole (see Box 2.1). In particular, the
excessive deficit procedure provided
for in the Treaty on the Functioning of
the European Union aims to limit the
risks to price stability that might
otherwise arise from unsound national
fiscal policies. Those procedures were
further developed and clarified in the
Stability and Growth Pact adopted
in 1997. It was significantly weakened
by the reform in 2005 that introduced
more flexibility and increased political
discretion. The revised Stability and
Growth Pact allows a Member State to
present its own country-specific
medium-term objective, which is then
assessed by the EU Council. It also
defines an annual structural budgetary
adjustment effort of 0.5% of GDP
to be pursued by a country as a
benchmark, while taking into account
possible budgetary costs as a result of
implementing structural reforms.
Given the potential problems associated
with fiscal imbalances, the obligation to
avoid excessive deficits and maintain a
sound medium-term budgetary position
is vital to ensuring that national fiscal
policies are conducive to overall
macroeconomic and financial stability.
In the decades preceding EMU, fiscal
policies in many European countries
were characterised by unsustainable
rates of growth in spending, rising
tax burdens and the steady build-up
of government debt. Since then,
the interest rate on outstanding debt
has fallen considerably, particularly in
the countries that benefited the most
from the elimination of exchange
rate risk and the transition to more
stability-oriented policies in EMU.
In the first years of EMU, the
Stability and Growth Pact was broadly
successful in ensuring the correction
of excessive deficits once they
occurred, albeit with undue delays and
on the back of favourable economic
conditions. However, the compliance
by Member States with sound
Sound fiscal policies
needed for macroeconomic
and financial stability

34
medium-term budgetary objectives was
generally disappointing. In the wake
of the financial crisis, European
institutions have therefore undertaken
preparatory work to reinforce the
SGP and establish a framework for
the surveillance of macroeconomic
imbalances.
The general government sector
(i.e. central, state and local government,
as well as the social security sector)
makes up a larger share of the euro area
economy than it does in the United States
or Japan. Government expenditure in
the euro area accounted for 50.8% of
GDP in 2009. In the United States,
general government expenditure was
lower at around 37.9% of GDP. Japan,
meanwhile, recorded a ratio of
government expenditure to GDP of
around 40.4%.
The relatively large share of government
expenditure in GDP in the euro area
reflects, in particular, high levels of
both final government consumption
and social transfers to households.
The cross-economy variation is partly
caused by differences in the distribution
of functions between the private and
public sectors. Given the characteristics
of social security systems in Europe,
the age structure of the euro area
population also contributes to the high
level of government expenditure.
Unless policy reforms are undertaken
in the Member States affected, the
situation will be exacerbated in the
future by the expected ageing of the
population. According to the baseline
scenario of the European Commission
and the Economic Policy Committee
(2009), the ratio of age-related public
expenditure to GDP in the euro area is
projected to rise by 5.2 percentage
points during the period 2007-60,
assuming no change in policy.
The projections also suggest that the
rise in public pension expenditure in
the euro area is likely to accelerate
after 2020, before slowing down
somewhat after 2050.
With regard to the structure of
government revenue, the euro area
relies more heavily on social
contributions than either the United
States or Japan. Moreover, greater use
is made of indirect taxation as a source
of revenue in the euro area, while the
United States relies more heavily than
the euro area on direct taxation as a
share of total tax revenue.
Government expenditure exceeded
government revenue in the euro area as
a whole throughout the period
1970-2009. Accordingly, the general
government budget balance recorded a
deficit in each year. The aggregate
deficit for the euro area widened to
close to 6% of GDP in 1993, but then
diminished gradually to 1% of GDP
in 2000 (see Chart 2.2). Thereafter,
partly as a result of expenditure
slippages, the government deficit
increased again. In 2003 it accounted
for 3% of GDP, but by the end of 2007
it had fallen again to below 1%
owing mainly to favourable economic
conditions. For its part, general
government gross debt for the euro
area as a whole reached a peak of 74%
of GDP in 1996-97, having risen
steadily over the previous two decades.
Following a broad stabilisation for
some years, the debt ratio declined
moderately to attain 66% of GDP by
the end of 2007. At the same time,
at the national level, government deficit
and debt ratios in many cases remained
too high, considering the challenges
arising from ageing populations.
The relatively large share of
government expenditure in
euro area GDP...
...reflects the high levels of
final government consumption and
social transfers to households
Government revenue
General government budget balance and gross debt
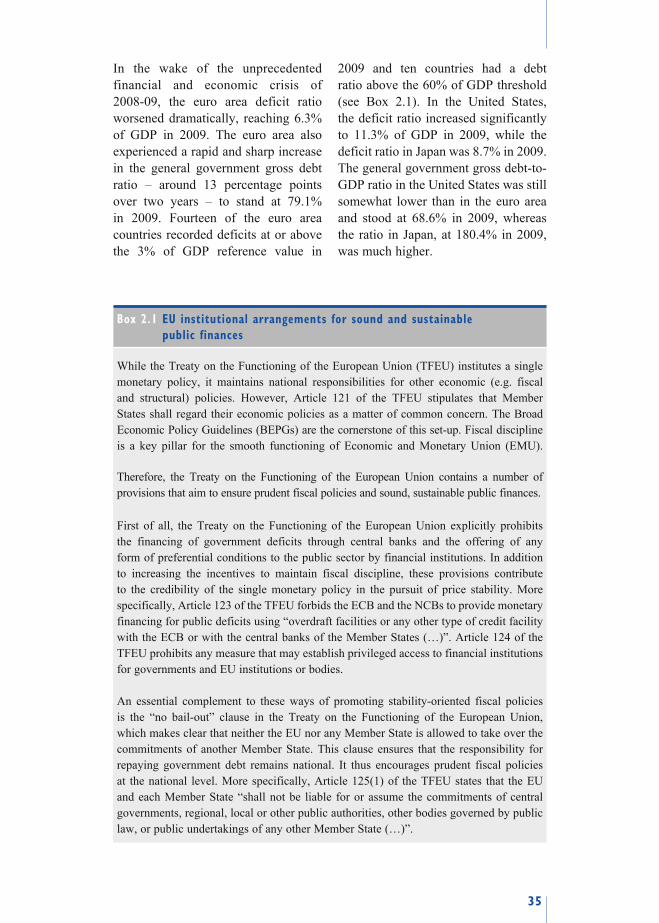
35
In the wake of the unprecedented
financial and economic crisis of
2008-09, the euro area deficit ratio
worsened dramatically, reaching 6.3%
of GDP in 2009. The euro area also
experienced a rapid and sharp increase
in the general government gross debt
ratio – around 13 percentage points
over two years – to stand at 79.1%
in 2009. Fourteen of the euro area
countries recorded deficits at or above
the 3% of GDP reference value in
2009 and ten countries had a debt
ratio above the 60% of GDP threshold
(see Box 2.1). In the United States,
the deficit ratio increased significantly
to 11.3% of GDP in 2009, while the
deficit ratio in Japan was 8.7% in 2009.
The general government gross debt-to-
GDP ratio in the United States was still
somewhat lower than in the euro area
and stood at 68.6% in 2009, whereas
the ratio in Japan, at 180.4% in 2009,
was much higher.
Box 2.1 EU institutional arrangements for sound and sustainable
public finances
While the Treaty on the Functioning of the European Union (TFEU) institutes a single
monetary policy, it maintains national responsibilities for other economic (e.g. fiscal
and structural) policies. However, Article 121 of the TFEU stipulates that Member
States shall regard their economic policies as a matter of common concern. The Broad
Economic Policy Guidelines (BEPGs) are the cornerstone of this set-up. Fiscal discipline
is a key pillar for the smooth functioning of Economic and Monetary Union (EMU).
Therefore, the Treaty on the Functioning of the European Union contains a number of
provisions that aim to ensure prudent fiscal policies and sound, sustainable public finances.
First of all, the Treaty on the Functioning of the European Union explicitly prohibits
the financing of government deficits through central banks and the offering of any
form of preferential conditions to the public sector by financial institutions. In addition
to increasing the incentives to maintain fiscal discipline, these provisions contribute
to the credibility of the single monetary policy in the pursuit of price stability. More
specifically, Article 123 of the TFEU forbids the ECB and the NCBs to provide monetary
financing for public deficits using “overdraft facilities or any other type of credit facility
with the ECB or with the central banks of the Member States (…)”. Article 124 of the
TFEU prohibits any measure that may establish privileged access to financial institutions
for governments and EU institutions or bodies.
An essential complement to these ways of promoting stability-oriented fiscal policies
is the “no bail-out” clause in the Treaty on the Functioning of the European Union,
which makes clear that neither the EU nor any Member State is allowed to take over the
commitments of another Member State. This clause ensures that the responsibility for
repaying government debt remains national. It thus encourages prudent fiscal policies
at the national level. More specifically, Article 125(1) of the TFEU states that the EU
and each Member State “shall not be liable for or assume the commitments of central
governments, regional, local or other public authorities, other bodies governed by public
law, or public undertakings of any other Member State (…)”.

36
In addition, the Treaty on the Functioning of the European Union specifies an excessive
deficit procedure, as defined in Article 126 and a protocol annexed thereto. This
procedure lays down the conditions that must prevail for a budgetary position to be
judged sound. Article 126(1) of the TFEU decrees that “Member States shall avoid
excessive government deficits.” Compliance with this requirement is assessed on the
basis of a reference value for the government deficit-to-GDP ratio of 3% and a reference
value for the government debt-to-GDP ratio of 60%. Under conditions defined in the
Treaty on the Functioning of the European Union and further specified in the Stability
and Growth Pact, deficit or debt ratios above the reference values may be considered
not to imply the existence of an excessive deficit. Should the EU Council decide
that an excessive deficit exists in a certain country, the excessive deficit procedure
provides for further steps to be taken, ultimately including sanctions for persistent
non-compliance.
The fiscal framework was significantly enhanced in 1997 with the adoption of
the Stability and Growth Pact, which came into effect from the start of Stage
Three of EMU. It consists of the Resolution of the European Council on the Stability
and Growth Pact, the Council Regulation on the strengthening of the surveillance of
budgetary positions and the surveillance and coordination of economic policies and the
Council Regulation on speeding up and clarifying the implementation of the excessive
deficit procedure. By agreeing to the Stability and Growth Pact, Member States have
committed themselves to pursuing the medium-term objective of budgetary positions that
are “close to balance or in surplus”. The idea is that having such positions would allow
them to deal with the budgetary impact of normal cyclical fluctuations without breaching
the 3% of GDP reference value and ensure a rapid convergence of debt ratios to prudent
levels.
The “preventive arm” of the Stability and Growth Pact introduces a more concrete
procedure of multilateral surveillance, whereby euro area EU Member States submit
a stability programme and non-euro area EU Member States submit a convergence
programme. These annual programmes present an overview of the economic and
fiscal developments in each country, a medium-term objective for fiscal policy and
an adjustment path towards the medium-term objective. In addition, the Stability and
Growth Pact clarifies and streamlines the different steps and timetable of the excessive
deficit procedure through its “corrective arm”.
The reform of the Stability and Growth Pact in 2005 introduced greater flexibility into
the procedures related to the preventive and the corrective arms. With regard to the
preventive arm, the revised Stability and Growth Pact introduced increased discretion
concerning the setting of and progress towards the medium-term objective. As for the
corrective arm, the use of discretion in determining an excessive deficit was widened
and procedural deadlines were extended. Many observers, including the ECB, expressed
concern at the time that these changes would undermine the effectiveness of the EU
fiscal framework and could endanger the sustainability of the public finances of euro
area countries. Following the strong deterioration of budgetary positions in the period
to 2009, a further review of the Stability and Growth Pact in the context of a more general
strengthening of economic governance in the EU and the euro area is underway.
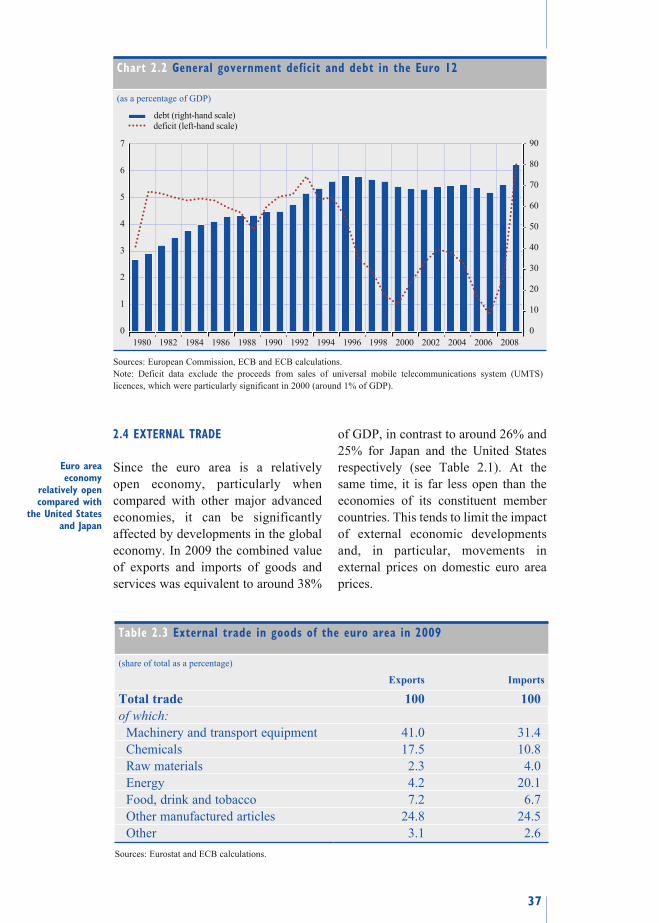
37
2.4 EXTERNAL TRADE
Since the euro area is a relatively
open economy, particularly when
compared with other major advanced
economies, it can be significantly
affected by developments in the global
economy. In 2009 the combined value
of exports and imports of goods and
services was equivalent to around 38%
of GDP, in contrast to around 26% and
25% for Japan and the United States
respectively (see Table 2.1). At the
same time, it is far less open than the
economies of its constituent member
countries. This tends to limit the impact
of external economic developments
and, in particular, movements in
external prices on domestic euro area
prices.
Euro area economy
relatively open compared with
the United States and Japan
Table 2.3 External trade in goods of the euro area in 2009
(share of total as a percentage)
Exports Imports
Total trade 100 100of which:
Machinery and transport equipment 41.0 31.4
Chemicals 17.5 10.8
Raw materials 2.3 4.0
Energy 4.2 20.1
Food, drink and tobacco 7.2 6.7
Other manufactured articles 24.8 24.5
Other 3.1 2.6
Sources: Eurostat and ECB calculations.
Chart 2.2 General government deficit and debt in the Euro 12
(as a percentage of GDP)
0
1
2
3
4
5
6
7
0
10
20
30
40
50
60
70
80
90
debt (right-hand scale)
deficit (left-hand scale)
1980 1982 1984 1986 1988 1990 1992 1994 1996 1998 2000 2002 2004 2006 2008
Sources: European Commission, ECB and ECB calculations.
Note: Deficit data exclude the proceeds from sales of universal mobile telecommunications system (UMTS)
licences, which were particularly significant in 2000 (around 1% of GDP).

38
With regard to the composition of trade,
goods account for around three-quarters
of both euro area imports and euro area
exports. Within the goods category,
machinery and transport equipment made
up more than 40% of exports in 2009.
They also constituted the largest share of
euro area goods imports (see Table 2.3).
The second largest component was that
of other manufactured articles, which had
broadly the same share in both imports
and exports. In 2009 chemicals accounted
for 17.5% of goods exports but only
10.8% of imports, whereas the shares of
raw materials and energy were
considerably larger for imports than for
exports. These figures show that, in net
terms, the euro area tends to import raw
materials and intermediate goods, and to
export processed goods. This in turn
reflects the international division of
labour and the availability of raw
materials in the euro area.
Turning to the geographical distribution
of euro area trade, the United Kingdom
and the United States are the two largest
trading partners of the euro area. Based
on average trading flows over the period
1999-2009, the two countries together
accounted for almost 28% of total euro
area imports and exports (see Table 2.4).
Over the same period, the euro area has
also been trading increasingly with other
non-euro area EU Member States,
representing 11.1% of total euro area
Goods account for the largest share of extra-
euro area trade
Geographical distribution of euro area trade
Table 2.4 Trade weights 1) of the euro area’s 20 main trading partners
(percentage points)
1 United Kingdom 14.96
2 United States 12.81
3 Other EU Member States 2) 11.11
4 China 6.25
5 Switzerland 5.42
6 Russia 4.58
7 Japan 3.75
8 Sweden 3.58
9 Turkey 2.25
10 Denmark 2.24
11 Norway 2.10
12 Korea 1.61
13 Brazil 1.46
14 India 1.18
15 Taiwan 1.18
16 Canada 1.14
17 Saudi Arabia 1.11
18 Algeria 1.11
19 Singapore 1.03
20 South Africa 0.96
Source: ECB calculations based on Eurostat trade data.
1) Trade weights are the sum of exports and imports expressed as total of euro area exports and imports and are
average figures for the period 1999-2009.
2) The other main trading partners that are also EU Member States are the Czech Republic, Cyprus, Estonia, Latvia,
Lithuania, Hungary, Malta, Poland, Slovenia and Slovakia until 2006. In 2007 Bulgaria and Romania were
added, while Slovenia was removed. In 2008 Cyprus and Malta were removed.

39
trade, followed by China, Switzerland
and Russia, with trade weights of 6.3%,
5.4% and 4.6% respectively.
2.5 FINANCIAL STRUCTURE
The financial system performs the
essential economic function of
channelling funds from those who are
net savers (i.e. who spend less than
their income) to those who are net
spenders (i.e. who spend more than
their income). The functions of financial
systems are shown schematically in
Chart 2.3. The most important lenders
are normally households, but firms,
the government and non-residents also
sometimes find themselves with excess
funds and so lend them out. Conversely,
the principal borrowers are typically
firms and the government, but
households and non-residents also
sometimes borrow to finance their
purchases.
Funds flow from lenders to borrowers
via two routes. In the case of direct
or “market-based” financing (the route
shown at the top of Chart 2.3), debtors
borrow funds directly from lenders
in financial markets by selling them
financial instruments, also called
securities (such as debt securities
and shares), which are claims on the
borrower’s future income or assets.
If financial intermediaries play an
additional role in the channelling
of funds, one refers to indirect or
“bank-based” financing (see the route
at the bottom of Chart 2.3). Financial
intermediaries can be classified into
credit institutions, other monetary
financial institutions (MFIs) and other
financial intermediaries.
In the functioning of the financial
system, financial markets and financial
intermediaries are not separate
entities but are strongly interlinked.
For example, funds can flow in
both directions between direct and
indirect financing (see the middle of
Chart 2.3). Funds flow from markets
to banks when financial intermediaries
Direct and indirect
financing
Chart 2.3 Functions of financial systems
DIRECT FINANCE
INDIRECT FINANCE
Lenders/net savers• Households• Firms• Government• Non-residents
Financial markets• Money market• Capital markets
INDIRECT FINANCE
Financial intermediaries• Credit institutions• Other monetary financial institutions• Other
Borrowers/net spenders• Firms• Government• Households• Non-residents
Funds
Funds
Funds
FundsFunds

40
issue debt and equity securities to raise
funds in order to finance their activities.
Conversely, funds flow from banks
to markets when, for instance, financial
intermediaries purchase securities
issued by governments and firms
either as own investments or as part of
a money market fund. Another example
of the interrelationship between financial
markets and financial intermediaries lies
in the fact that non-financial corporations
that issue securities often depend on
bridge financing – temporary loans
to bridge the period before the funds
obtained through securities issuance
become available – and take advice from
financial intermediaries. More recently,
innovations in credit markets, such as
securitisation and credit derivatives,
have had a significant impact. In fact,
by shifting the risk of corporate and
household loans off their balance sheets,
banks have progressively assumed a new
role, moving from their more traditional
asset transformation role towards one
in which they increasingly manage and
trade credit risk via the financial markets.
The other main structural development
affecting corporate finance in recent
years has been the growth of institutional
investors such as pension funds,
insurance companies, private equity
and hedge funds. These investors have
altered the channels of funds available to
corporations and have changed the set of
incentives faced by corporations.
Before describing in more detail the
financial markets where direct financing
takes place and the financial
intermediaries that are involved in
indirect financing, Table 2.5 provides
Main financial assets and liabilities of the non-financial sectors
Table 2.5 Main financial assets and liabilities of non-financial sectors in the euro area at the end of 2009 1)
(outstanding amounts)
Selected financial assets EUR billions %
Total 20,889.3 100.0Currency and deposits 8,858.0 42.4
Currency 656.0 3.1
Deposits with 8,202.0 39.3
Euro area MFIs 7,691.1 36.8
Non-MFIs 510.8 2.4
Securities other than shares 2,169.0 10.4Short-term 181.2 0.9
Long-term 1,988.1 9.5
Shares 2) 4,236.0 20.3Quoted shares 2,329.1 11.1
Mutual fund shares 1,906.6 9.1
o/w money market fund shares/units 473.8 2.3
Insurance technical reserves 5,627.0 26.9Net equity of households in life insurance and pension funds reserves 5,137.1 24.6
Prepayments of insurance premiums and reserves for outstanding claims 489.4 2.3
Sources: ECB and Eurostat.
1) Non-financial sectors comprise general government, non-financial corporations and households, including
non-profit institutions serving households.
2) Excluding unquoted shares.

41
an overview of the main financial assets
and liabilities of the non-financial
sectors in the euro area in terms of
percentages of total amounts outstanding
at the end of 2009. The outstanding
financial assets and liabilities constitute
the “stocks” in the quarterly framework
of financial accounts.
The total financial assets shown in
Table 2.5 amounted to € 20,890 billion
(around 233% of annual GDP in the
euro area) at the end of 2009. Currency
and deposits accounted for around 42%
of total assets at the end of 2009, while
securities and shares accounted together
for around 31%. Insurance technical
reserves, i.e. the provisions of pension
funds, insurance and non-financial
corporations to cover the claims of
policy holders, accounted for the
remaining 27%.
Total financial assets
Table 2.5 (cont’d)
(outstanding amounts)
Selected financial liabilities EUR billions %
Total 26,437 100.0Loans 15,467 58.5
a) Taken from
Euro area MFIs 10,668 40.4
o/w short-term 1,570 5.9
o/w long-term 9,098 34.4
Other financial intermediaries 4,799 18.2
b) Granted to
General government 1,350 5.1
Short-term 185 0.7
Long-term 1,165 4.4
Non-financial corporations 8,313 31.4
Short-term 2,385 9.0
Long-term 5,928 22.4
Households 3) 5,805 22.0
Short-term 358 1.4
Long-term 5,447 20.6
Securities other than shares 6,996 26.5General government 6,175 23.4
Short-term 1,008 3.8
Long-term 5,167 19.5
Non-financial corporations 821 3.1
Short-term 304 1.2
Long-term 517 2.0
Quoted sharesissued by non-financial corporations 3,430 13.0
Depositsliabilities of central government 212 0.8
Pension fund reservesof non-financial corporations 332 1.3
3) Including non-profit institutions serving households.
42
Box 2.2 Financial markets – key terms
Financial markets can be classified according to several criteria, illustrating different
essential features of these markets. One possible classification is whether the financial
transaction relates to the first purchase of a securities issue (“primary” market) or is a
trade between holders of securities (“secondary” market). In turn, the secondary market
can be organised in two ways. One is to organise exchanges, where buyers and sellers
of securities meet in one central location to conduct trades (“exchange-traded” markets).
The other is to have an “over-the-counter” (OTC) market, in which dealers transact
securities with counterparties on a bilateral basis.
Markets can also be classified according to the original maturity of the financial contract
traded on them. Generally a distinction is made between original maturities of less than
one year and those of one year or more (“money” or “capital” markets). The money
market differs somewhat from other financial markets in that it is typically a wholesale
interbank market where transaction sizes are large. Moreover, the Eurosystem, through
its monetary policy operations, can directly influence conditions in the money market
(see Chapter 4). As the ECB is the monopoly supplier of central bank money, it can set
the refinancing conditions for credit institutions in the euro area. This, in turn, influences
the conditions at which credit institutions and other money market participants transact
in the euro area money market.
Furthermore, for money and capital market instruments, a distinction is made between
“collateralised” and “uncollateralised“ instruments. For example, in the money market,
the euro interbank offered rate (EURIBOR) refers to uncollateralised lending, whereas
collateralised lending often takes the form of “repurchase agreements”, in which the
borrower pledges collateral. If the collateral value is required to exceed the amount of
funds borrowed, it is referred to as a “haircut”. In the capital markets, collateralised
securities exist, for example, in the form of “covered bonds”, where the promise of the
issuer to redeem the bond at maturity is backed by specific collateral. The “cover pool”,
which typically includes mortgages, offers additional protection against default.
A final, commonly used classification refers to the form of the financial instrument
traded in a market. One important distinction is between “equity” and “debt” markets.
The main difference between equity and debt is that equity does not have to be repaid by
the issuer, whereas debt is a financial claim which has to be repaid (in specified amounts,
at a specified interest rate and on a specified date).
“Derivatives” constitute another important category of financial instruments. These are
financial contracts the value of which derives from underlying securities prices, interest
rates, foreign exchange rates, market indices or commodity prices. The basic classes of
derivatives are futures, options, swaps and forward rate agreements. For example, the holder
of a call (put) option has the right, but not the obligation, to buy (sell) a financial instrument
(e.g. a bond or share) at a given price at a specified time in the future. Many other
derivatives contracts have been developed by combining the basic categories. Derivatives
can assist the functioning of the financial markets because they can be used to improve
the pricing and allocation of financial risks. However, misvaluation and subsequent
changes in the price of financial derivatives can induce disruptive movements in other
asset prices.

43
The main liabilities shown in Table 2.5
amounted to €26,440 billion (295% of
GDP) at the end of 2009. Loans
accounted for 59% of total liabilities,
whereas securities, including quoted
shares, comprised around 40% of the
financing sources of the non-financial
sectors. Most of the funding (almost
81% of the liabilities) was at maturities
exceeding one year.
2.6 FINANCIAL MARKETS
This section introduces the main
features of the money, debt and equity
markets in the euro area. Box 2.2
provides an overview of some key
terms relating to financial markets.
The money market
The money market plays a crucial part
in the transmission of monetary policy
decisions, since changes in monetary
policy instruments affect the money
market first (see Chapter 4). A deep
and integrated money market is a
precondition for an efficient monetary
policy, since it ensures an even
distribution of central bank liquidity
and a homogeneous level of short-term
interest rates across the single currency
area. In the euro area, this precondition
was met right from the start of Stage
Three of EMU, when the national
money markets were successfully
integrated into an efficient euro area
money market. The financial market
turmoil in August 2008 and the
subsequent crisis severely challenged
the functioning of the money market,
as they affected interbank relationships
directly through an increase in liquidity
risk and counterparty credit risk. The
ECB adopted non-standard measures in
order to help banks extend credit to the
real economy, thereby promoting an
efficient monetary policy transmission
mechanism (see Box 5.1).
The rapid creation of the euro area
money market was also supported by
developments in the payment systems
infrastructure, above all the establishment
of the TARGET (Trans-European
Automated Real-time Gross settlement
Express Transfer) system, which allows
the smooth functioning of the settlement
of cross-border payments. The TARGET
system interconnects the euro real-time
gross settlement systems operated by the
NCBs in the EU and the ECB’s payment
mechanism. The Governing Council of
the ECB is responsible for the management
and control of TARGET.
There are various “cash” segments in
the euro area money market. One
important segment is the unsecured
market. The unsecured market is mainly
devoted to the management of the
liquidity needs of banks and, hence, the
unsecured transactions are strongly
concentrated on short maturities.
There are two important reference rates
for the unsecured money market, the
EONIA (euro overnight index average)
and the EURIBOR (euro interbank
offered rate), which together provide
uniform price references for maturities
from overnight to one year.
The other main cash segments of the
money market are the “repo” market
and the market for swaps against
foreign currencies. These markets are
known as secured markets, since
lending is done against assets acting as
collateral. Over recent years, the repo
market has developed to become the
most important segment of the euro
area money market. Repo transactions
and swaps against foreign currencies
are mainly concentrated on maturities
of up to one month.
In addition to the cash segments
mentioned above, the euro area money
Total financial liabilities
Integration of the money
market
Role of the payment systems
Unsecured parts of the money market
Secured parts of the money market
Derivatives markets

44
market also includes derivatives
segments. Interest rate swaps and
forward rate agreements, as well as
futures and options, are the most
important derivatives. The most active
instruments in these market segments
are the EONIA swaps and EURIBOR
futures.
From its inception until 2007, the euro
money market displayed substantial
(average) annual growth rates. However,
this changed somewhat with the start of
the financial turmoil in 2007. According
to data from the ECB’s Euro Money
Market Survey, aggregate turnover in
the euro money market decreased for a
third consecutive year in the second
quarter of 2010. This continued decline
can be explained mainly by the ongoing
adverse impact of the financial crisis on
interbank activities and by the surplus
liquidity environment that prevailed in
the euro interbank market as a result of
the high allotment volumes at the ECB
refinancing operations with full
allotment. The most notable decreases
in activity took place in the EONIA
swaps and the unsecured market
segments. The contraction in unsecured
turnover could partly be explained by
the continued shift to secured funding
resulting from the ongoing trend towards
avoiding counterparty credit risk and by
the decline in demand for liquidity
resulting from the surplus liquidity
environment that prevailed in the second
quarter of 2010. There are also
indications that an increasing share of
banks’ term funding took place through
the issuance of short-term securities
rather than through the collection of
interbank deposits.
The secured market remained the
largest segment of the euro money
market and continued to grow in the
second quarter of 2010. The increase
in turnover was driven by maturities
of up to one month, which continued
to account for the largest part of the
secured market. The increase is largely
explained by the continued trend for a
reduction of counterparty credit risk.
In the derivatives market segments,
over the past four years there has been
a notable decline in the EONIA swaps
segment, which used to be the most
liquid derivatives segment. This has
mainly been driven by the need of
banks to shorten their balance sheets
in the light of the financial turmoil and
by the relative stability of short-term
interest rate expectations. On the other
hand, there has been an increase in
the importance of the forward rate
agreements and foreign exchange
swaps segments. Although the financial
turmoil has been a challenge for market
integration, ECB data show that the
euro money market segments generally
remain highly integrated.
Debt securities markets
The money market also includes the
market for short-term securities
(e.g. commercial paper, certificates of
deposit, etc). The total amount
outstanding of short-term debt securities
issued by euro area residents increased
steadily throughout the past decade,
peaking in the spring of 2009. Disrupted
by the recent financial turmoil,
the short-term debt securities market
has contracted somewhat since then,
amounting to €1,625 billion at the end
of 2009, i.e. 18.1% of euro area GDP
(see Table 2.6). This is still twice as
much as at the beginning of the decade
and illustrates the substantial
development of this market segment,
which, despite some improvement,
remains one of the most fragmented
among euro area financial markets.
During the past decade, monetary
financial institutions tended to be,
by far, the most important issuer,
representing more than half of total
Major developments
in the euro money market until mid-2010
Lower relative importance of short-termdebt securities…

45
issuance. In the aftermath of the
financial crisis, and as short-term public
financing needs became more acute,
the government sector’s share of
issuance rose again, reaching nearly
half of the total issuance by the
end of 2009.
Euro-denominated long-term debt
securities represented about 90% of
overall debt securities issued by euro
area residents during the past decade.
Unlike for short-term maturities,
the amount outstanding of these debt
instruments continued to increase
throughout the recent financial turmoil,
amounting to €13,677 billion at the
end of 2009, i.e. 152.5% of GDP –
compared with 97.6% ten years earlier
(see Table 2.7). The public sector
(i.e. central government and other
general government) is the most
important long-term debt issuer in terms
of volume, although the share of the
MFI sector increased rapidly during the
second half of the previous decade.
More recently, against the background
of the financial turmoil, the relative
importance of long-term debt securities
issued by MFIs decreased somewhat.
By contrast, that of non-monetary
financial institutions grew noticeably,
…when compared with long-term debt
securities
Table 2.6 Amounts outstanding of euro-denominated short-term debt securities issued by euro area residents
(end of year; EUR billions; (percentage of GDP))
1995 2000 2005 2007 2008 2009
Monetary financial institutions
111(2.0)
315(4.7)
482(5.9)
788(8.7)
822(8.9)
733(8.2)
Non-monetary financial institutions
4(0.1)
6(0.1)
19(0.2)
37(0.4)
66(0.7)
75(0.8)
Non-financial corporations
45(0.8)
90(1.3)
79(1.0)
100(1.1)
116(1.2)
71(0.8)
Public sector 322(5.8)
254(3.8)
367(4.5)
3634.0
591(6.4)
746(8.3)
Total 482(8.7)
665(9.8)
947(11.6)
1,28714.3
1,595(17.2)
1,625(18.1)
Source: ECB.
Table 2.7 Amounts outstanding of euro-denominated long-term debt securities issued by euro area residents
(end of year; EUR billions; (percentage of GDP))
1995 2000 2005 2007 2008 2009
Monetary financial institutions
1,012(18.2)
2,462(36.3)
3,629(44.6)
4,261(47.3)
4,450(48.1)
4,646(51.8)
Non-monetary financial institutions
76(1.4)
370(5.5)
934(11.5)
1,467(16.3)
2,104(22.7)
3,151(35.1)
Non-financial corporations
173(3.1)
341(5.0)
508(6.2)
556(6.2)
593(6.4)
743(8.3)
Public sector 1,162(20.9)
3,402(50.2)
4,266(52.4)
4,497(49.9)
4,687(50.6)
5,137(57.3)
Total 2,424(43.6)
6,575(97.0)
9,337(114.6)
10,782(119.7)
11,834(127.8)
13,677(152.5)
Source: ECB.

46
reflecting the use of securitisation
by bank-sponsored special-purpose
vehicles. Comparatively, the issuance
of debt securities by non-financial
corporations in the euro area did not
increase much during most of the past
decade, rising from 6.2% of GDP before
the financial turmoil to 8.3% by the end
of 2009. While this could be mainly
explained by substantial improvements
in firms’ funding conditions in the
capital market, it could also partly
reflect the deterioration of the
availability of bank financing through a
tightening of terms and conditions on
bank loans during the financial turmoil.
The issuance of debt securities remains
lower in the euro area than in the
United States and Japan. The amounts
outstanding at the end of 2009 were
155% of GDP in the euro area,
compared with 176% and 225% of
GDP in the United States and Japan
respectively (see Table 2.8). The high
figure in Japan can be explained by the
size of the government bond market,
which is more than twice that of the
United States or the euro area. The use
of debt financing in the form of
securities issuance by euro area
non-financial corporations represents a
significantly smaller percentage of
GDP than in both the United States and
Japan. At the end of 2009, the amount
outstanding of debt securities issued by
the non-financial corporate sector in
the euro area was around 8% of GDP,
compared with 19.5% and 15.3% of
GDP in the United States and Japan
respectively.
Despite the significant ongoing growth
of the euro area debt securities market,
some market segments, such as those
for debt with a low credit rating or
unrated debt, remain relatively
underdeveloped. Compared with the
United States, fewer euro area
non-financial corporations have credit
ratings, which restricts their access to
the corporate bond market.
Equity market
Turning to the equity market,
a commonly used indicator of its
importance is the market capitalisation
of stocks traded in terms of GDP.
Euro area stock market capitalisation
increased from 21% of GDP at the end
of 1990 to 56% of GDP at the end
of 2009, peaking twice at around 85% in
the last two decades (at the end of 2000
and 2007), but dropping sharply to a
historical low of 38% at the end of 2008
(see Table 2.9). High volatility and
sharp declines in stock prices around the
world, in the wake of a number of
events that have reshaped the entire
financial landscape and deteriorating
global macroeconomic conditions, have
strongly depressed equity prices and led
to the fall in stock market capitalisation.
By contrast, 2009 was characterised by
an impressive rebound in equity prices
globally. This was spurred by returning
Debt securities’ financing in the
euro area is low compared
with the United States
Some segmentsin euro areadebt securitiesmarket littledeveloped
Euro area stock market capitalisation growing…
Table 2.8 Amounts outstanding for debt securities denominated in national currency issued by residents in the euro area, the United States and Japan at the end of 2009
(as a percentage of GDP)
Total Issued by financial
corporations
Issued by non-financial corporations
Issued by general
government
Euro area 154.6 81.8 7.8 64.9
United States 175.8 89.8 19.5 66.5
Japan 224.8 21.1 15.3 188.2
Sources: ECB and BIS.

47
confidence and decreasing risk aversion
among investors, for which the large-
scale support measures of governments
and central banks were an important
driving force. Compared with levels at
the end of 2008, major stock market
indices in the euro area, the United
States and Japan increased by around
17, 24 and 1 percentage point(s),
amounting to 55%, 106% and 65% of
GDP respectively.
Total stock market capitalisation in the
euro area remained significantly lower
than in the United States, and the gap
between stock market capitalisation in
terms of GDP in the United States and
that in the euro area even widened,
from around 30 percentage points in
1990 to around 50 percentage points in
2009. By contrast, in Japan stock market
capitalisation declined from 97% of
GDP in 1990 to 65% of GDP in 2009,
peaking at 106% of GDP in 2006.
Another indication of the growing
importance of the equity market is
provided by statistics on the number of
listed companies. In the euro area,
this number grew from 4,276 at the end
of 1990 to 6,445 by the end of 2009
(see Table 2.10). By means of
comparison, the number of listed
companies in the United States and
Japan at the end of 2009 was 5,179
and 2,335 respectively.
Since the introduction of the euro, there
have been many initiatives to form
alliances or merge the activities of stock
exchanges of individual euro area
countries. Stock market participants also
increasingly seem to be taking into
account the economic factors common
to the euro area as a whole. The very
large oscillations in equity prices in
recent times do not seem to have had an
appreciable impact on the degree
of cross-border integration of
European equity markets. Between
2001 and 2007, euro area investors
increased their holdings of equity issued
in other euro area countries from 22% to
33% of their total portfolio of euro area
equity assets. Moreover, in 2008 this
share further increased very substantially
… but lower than in the
United States
Growing number of companies listed on euro area stock
markets
Increasing integration of euro area stock markets
Table 2.9 Stock market capitalisation in the euro area, the United States and Japan
(end of year; as a percentage of GDP)
1990 1995 1998 2000 2002 2006 2007 2008 2009
Euro area 21 27 63 86 50 80 84 38 55
United States 54 93 144 153 104 146 142 81 106
Japan 97 67 63 68 53 106 99 64 65
Source: World Federation of Exchanges.
Table 2.10 Number of domestic and foreign companies listed on stock markets in the euro area, the United States and Japan
(end of year)
1990 1995 1998 2000 2002 2006 2007 2008 2009
Euro area 4,276 5,106 4,546 5,516 6,651 6,392 6,601 6,686 6,445
United States 6,765 8,160 8,461 7,851 6,586 6,005 5,965 5,472 5,179
Japan 1,752 1,791 1,890 2,096 2,153 2,416 2,414 2,390 2,335
Source: World Federation of Exchanges.

48
to 38%. Notwithstanding, since 2001, the share of euro area equity assets held outside the euro area has remained at a much lower level and increased only marginally. The reallocation out of domestic equity and into equity issued elsewhere in the euro area was also due to the contribution of institutional investors. The percentage of investment funds’ total holdings of all shares and other equity (excluding investment fund shares/units) issued by residents of the euro area outside the Member State in which the investment fund is located actually increased from 17% in 1998 to around 25% by the end of 2009. The recent financial turmoil has only slightly affected the allocation of euro area investment.
2.7 Financial intermediaries
credit institutions and other monetary financial institutionsThere are two broad categories of financial intermediaries: monetary financial institutions (MFIs) and other financial intermediaries (OFIs). MFIs comprise the Eurosystem (the ECB and the NCBs of those countries that have adopted the euro), credit institutions and non-credit institutions (mainly money market funds) whose business is to receive deposits from entities other than MFIs and to grant credit and/or invest
in securities. The vast majority of euro area MFIs are credit institutions (i.e. commercial banks, savings banks, cooperative banks, post banks, specialised credit institutions, etc). They are clearly defined in two banking coordination directives 7 and are subject to common EU-wide supervisory standards. Credit institutions are the counterparties for central bank monetary policy operations (see Chapter 4). Since they grant credit to households and firms, notably on the basis of credit received from the central bank, they are crucial to the transmission of monetary policy decisions to the economy (see Chapter 3).
At the end of 2010, there were 6,334 credit institutions resident in the euro area, representing 80% of all euro area MFIs (see Table 2.11). With 1,474 institutions, money market funds accounted for most of the remaining 20%. Despite the enlargement of the euro area with the accession of Greece (2001), Slovenia (2007), Cyprus and Malta (2008), Slovakia (2009) and Estonia (2011), the number of MFIs in the euro area has decreased by nearly 20% since the introduction of the euro. This reflects an ongoing consolidation process in the European banking industry. The trend towards consolidation in the credit institution sector is a response to changing market conditions
definition of credit institutions
and mFis
7 The term “credit institution” is used to refer to any institution falling under the definition contained in Banking Coordination Directives 77/780/EEC of 12 December 1977 and 89/646/EEC of 30 December 1989, i.e. “an undertaking whose business is to receive deposits or other repayable funds from the public and to grant credit for its own account”.
number of mFis declined owing to financial consolidation
table 2.11 number of euro area monetary financial institutions
(end of year)
2000 2004 2008 2010
Credit institutions 7,521 6,406 6,570 6,334Money market funds 1,651 1,670 1,721 1,474Central banks and other institutions 21 19 19 20All MFIs 9,193 8,095 8,310 7,828
Source: ECB.

49
driven by a number of factors, such
as technological developments,
deregulation, liberalisation and
globalisation. The introduction of the
euro has probably been fuelling these
developments by creating more
transparency across national borders.
Germany and France accounted for
41.1% of all euro area MFIs, a share
broadly unchanged from that recorded
when the euro was introduced.
The ECB and the NCBs collect monthly
and quarterly statistics from the MFIs
in the euro area and compute both an
aggregated and a consolidated MFI
balance sheet at the euro area level.
The aggregated balance sheet of the
MFI sector is the sum of the harmonised
balance sheets of all the MFIs resident
in the euro area. The aggregated balance
sheet presents information on
inter-MFI positions on a gross basis. It
includes cross-border inter-MFI
activities both within the euro area and
vis-à-vis the rest of the world. This
information is useful for assessing the
integration of financial systems and the
importance of the interbank market.
The consolidated balance sheet of the
MFI sector is obtained by netting
positions between MFIs in the euro
area on the aggregated balance
sheet. The consolidated balance sheet
provides the basis for the regular
analysis of monetary and credit
developments in the euro area, including
monetary aggregates (see Box 2.3).
Chart 2.4 shows the composition of the
consolidated balance sheet of euro area
MFIs including the Eurosystem at the
end of 2010. Deposits accounted for
42% of total liabilities, while other
important liability items were external
liabilities and debt securities,
which accounted for 17% and 11%
respectively of total MFI liabilities.
Loans represented the largest share of
total assets (48% at the end of 2010).
External assets made up 19% of total
MFI assets, whereas lending in the
form of debt securities, shares and
other equity accounted for 14%.
Aggregated and consolidated
balance sheet of MFIs
Deposits and loans are the most important MFI balance sheet items
Chart 2.4 Composition of the consolidated balance sheet of euro area MFIs (including the Eurosystem) at the end of 2010
(percentage of the balance sheet total)
Total assets Total liabilitiesRemaining
assets
15%Loans
48%
Debt securities
14%
Shares and
other equity
3%
External
assets
19%
Fixed assets
1%
Deposits
42%
Currency
3%
Money market
fund shares/units
2%
Debt securities
11%
Capital and
reserves
8%
External
liabilities
17%
Remaining
liabilities
17%
Source: ECB.

50
Box 2.3 Monetary aggregates
The starting point for the definition of euro area monetary aggregates is the consolidated
balance sheet of the MFI sector. In general, the appropriate definition of a monetary aggregate
largely depends on the purpose for which the aggregate is intended. Given that many different
financial assets are substitutable and that the nature and characteristics of financial assets,
transactions and means of payment change over time, it is not always clear how money should
be defined and which financial assets belong to which definition of money. For these reasons,
central banks usually define and monitor several monetary aggregates.
The ECB’s definitions of euro area monetary aggregates are based on a harmonised
definition of the money-issuing sector and the money-holding sector, as well as of
harmonised categories of MFI liabilities. The money-issuing sector comprises MFIs
resident in the euro area. The money-holding sector includes all non-MFIs resident in the
euro area excluding the central government sector.1
Based on conceptual considerations and empirical studies, and in line with international
practice, the Eurosystem has defined a narrow (M1), an “intermediate” (M2) and a broad
monetary aggregate (M3). These aggregates differ with regard to the degree of liquidity
(as assessed on the basis of the criteria of transferability, convertibility, price certainty
and marketability) of the assets they include.
Table 2.12 sets out the definitions of euro area monetary aggregates. M1 comprises
currency in circulation and overnight deposits, which can be immediately converted into
currency or used for cashless payments. M2 includes, in addition, deposits that can be
converted into components of narrow money, although some restrictions may apply, such
as the need for advance notification, penalties and fees. Finally, M3 comprises M2 and
certain marketable instruments issued by the resident MFI sector. A high degree of liquidity
and price certainty make these instruments close substitutes for deposits. As a result of
their inclusion, broad money is less affected by substitution between various liquid asset
categories than narrower definitions of money and is more stable (see also Chapter 3).
1 Even though the central government sector is not considered to be part of the money-issuing sector, central
government liabilities of a monetary nature (e.g. deposits held by households with the post office) are included as
a special item in the definition of monetary aggregates because they are highly liquid.
Table 2.12 Definitions of euro area monetary aggregates
Liabilities 1) M1 M2 M3
Currency in circulation x x x
Overnight deposits x x x
Deposits with an agreed maturity of up to 2 years x x
Deposits redeemable at notice of up to 3 months x x
Repurchase agreements x
Money market fund shares/units x
Debt securities issued with a maturity of up to 2 years x
Source: ECB.
1) Monetary liabilities of MFIs and central government (post office, treasury) vis-à-vis non-MFI euro area
residents excluding central government.
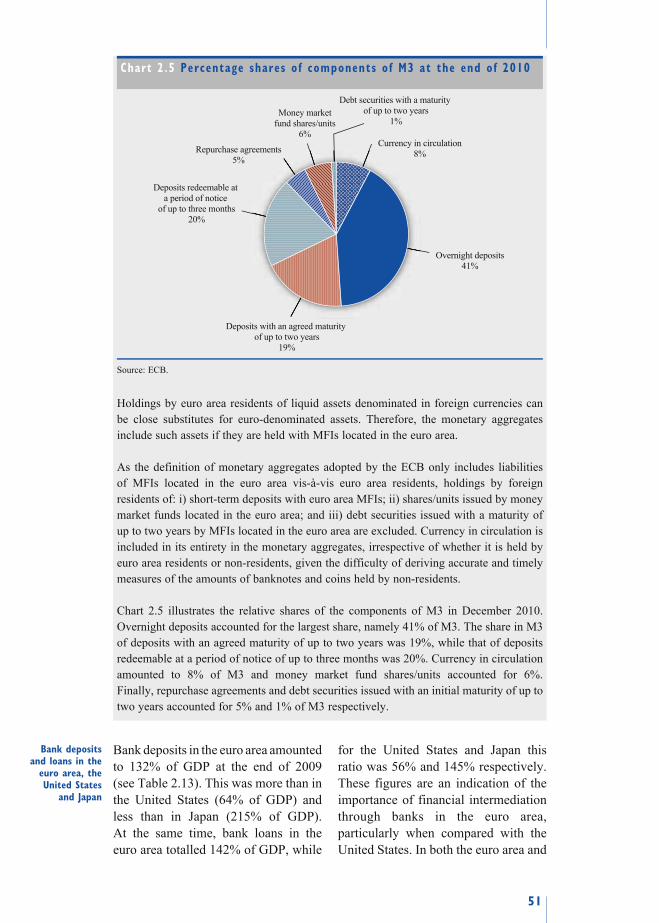
51
Bank deposits in the euro area amounted
to 132% of GDP at the end of 2009
(see Table 2.13). This was more than in
the United States (64% of GDP) and
less than in Japan (215% of GDP).
At the same time, bank loans in the
euro area totalled 142% of GDP, while
for the United States and Japan this
ratio was 56% and 145% respectively.
These figures are an indication of the
importance of financial intermediation
through banks in the euro area,
particularly when compared with the
United States. In both the euro area and
Bank deposits and loans in the
euro area, the United States
and Japan
Holdings by euro area residents of liquid assets denominated in foreign currencies can
be close substitutes for euro-denominated assets. Therefore, the monetary aggregates
include such assets if they are held with MFIs located in the euro area.
As the definition of monetary aggregates adopted by the ECB only includes liabilities
of MFIs located in the euro area vis-à-vis euro area residents, holdings by foreign
residents of: i) short-term deposits with euro area MFIs; ii) shares/units issued by money
market funds located in the euro area; and iii) debt securities issued with a maturity of
up to two years by MFIs located in the euro area are excluded. Currency in circulation is
included in its entirety in the monetary aggregates, irrespective of whether it is held by
euro area residents or non-residents, given the difficulty of deriving accurate and timely
measures of the amounts of banknotes and coins held by non-residents.
Chart 2.5 illustrates the relative shares of the components of M3 in December 2010.
Overnight deposits accounted for the largest share, namely 41% of M3. The share in M3
of deposits with an agreed maturity of up to two years was 19%, while that of deposits
redeemable at a period of notice of up to three months was 20%. Currency in circulation
amounted to 8% of M3 and money market fund shares/units accounted for 6%.
Finally, repurchase agreements and debt securities issued with an initial maturity of up to
two years accounted for 5% and 1% of M3 respectively.
Chart 2.5 Percentage shares of components of M3 at the end of 2010
Currency in circulation
8%
Overnight deposits
41%
Deposits with an agreed maturity
of up to two years
19%
Deposits redeemable at
a period of notice
of up to three months
20%
Repurchase agreements
5%
Money market
fund shares/units
6%
Debt securities with a maturity
of up to two years
1%
Source: ECB.
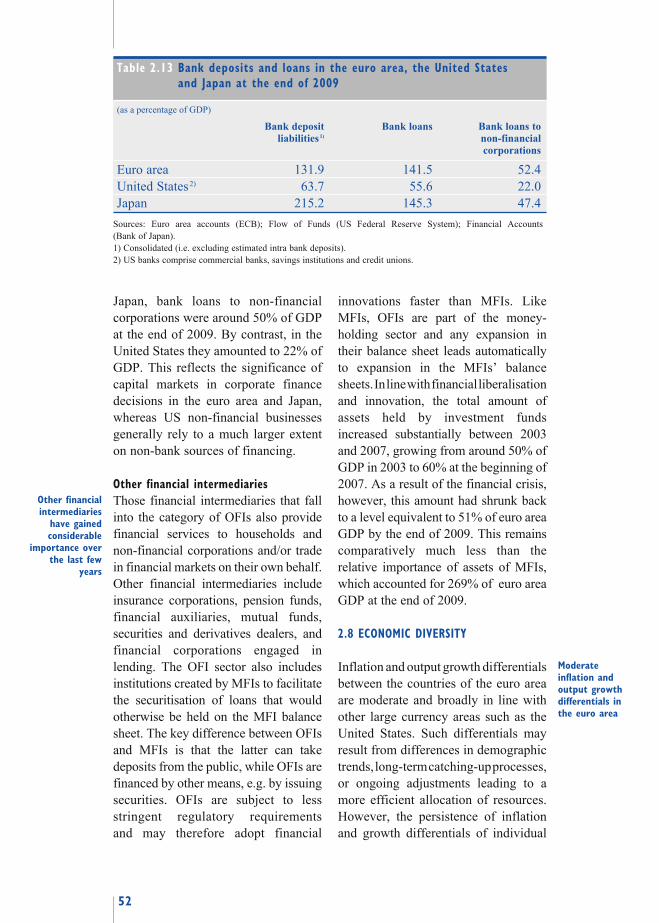
52
Japan, bank loans to non-financial
corporations were around 50% of GDP
at the end of 2009. By contrast, in the
United States they amounted to 22% of
GDP. This reflects the significance of
capital markets in corporate finance
decisions in the euro area and Japan,
whereas US non-financial businesses
generally rely to a much larger extent
on non-bank sources of financing.
Other financial intermediaries
Those financial intermediaries that fall
into the category of OFIs also provide
financial services to households and
non-financial corporations and/or trade
in financial markets on their own behalf.
Other financial intermediaries include
insurance corporations, pension funds,
financial auxiliaries, mutual funds,
securities and derivatives dealers, and
financial corporations engaged in
lending. The OFI sector also includes
institutions created by MFIs to facilitate
the securitisation of loans that would
otherwise be held on the MFI balance
sheet. The key difference between OFIs
and MFIs is that the latter can take
deposits from the public, while OFIs are
financed by other means, e.g. by issuing
securities. OFIs are subject to less
stringent regulatory requirements
and may therefore adopt financial
innovations faster than MFIs. Like
MFIs, OFIs are part of the money-
holding sector and any expansion in
their balance sheet leads automatically
to expansion in the MFIs’ balance
sheets. In line with financial liberalisation
and innovation, the total amount of
assets held by investment funds
increased substantially between 2003
and 2007, growing from around 50% of
GDP in 2003 to 60% at the beginning of
2007. As a result of the financial crisis,
however, this amount had shrunk back
to a level equivalent to 51% of euro area
GDP by the end of 2009. This remains
comparatively much less than the
relative importance of assets of MFIs,
which accounted for 269% of euro area
GDP at the end of 2009.
2.8 ECONOMIC DIVERSITY
Inflation and output growth differentials
between the countries of the euro area
are moderate and broadly in line with
other large currency areas such as the
United States. Such differentials may
result from differences in demographic
trends, long-term catching-up processes,
or ongoing adjustments leading to a
more efficient allocation of resources.
However, the persistence of inflation
and growth differentials of individual
Other financial intermediaries
have gained considerable
importance over the last few
years
Moderate inflation and output growth differentials in the euro area
Table 2.13 Bank deposits and loans in the euro area, the United States and Japan at the end of 2009
(as a percentage of GDP)
Bank deposit liabilities 1)
Bank loans Bank loans to non-financial corporations
Euro area 131.9 141.5 52.4
United States 2) 63.7 55.6 22.0
Japan 215.2 145.3 47.4
Sources: Euro area accounts (ECB); Flow of Funds (US Federal Reserve System); Financial Accounts
(Bank of Japan).
1) Consolidated (i.e. excluding estimated intra bank deposits).
2) US banks comprise commercial banks, savings institutions and credit unions.

53
euro area countries over longer periods
of time, if induced by structural
inefficiencies or misaligned national
policies, may be worrisome and would
need to be addressed by national policy
adjustments. In order to better gauge
the impact of euro area enlargement on
available indicators for dispersion,
in the following heterogeneity is
illustrated for the 12 countries that
introduced euro banknotes and coins
in 2002 and for the 16 countries that
made up the euro area in 2010.
Chart 2.6 presents the dispersion of
inflation across the euro area and the
United States, based on the unweighted
standard deviation. The curve for the
12 euro area countries shows a broadly
stable dispersion of HICP inflation
since the late 1990s, at a level similar
to that of the 14 US Metropolitan
Statistical Areas, but higher than that of
the four US census regions. In 2009
and the first months of 2010, dispersion
of inflation in the euro area increased
somewhat, reflecting differences across
countries in the extent and timing of
the impact of the economic recession
and recovery, as well as the fiscal
policy response (including indirect tax
increases). The rise highlights the need
for domestic economic policy
adjustments to tackle previously
accumulated imbalances at a national
level, which have started to be
implemented. In the second half of
2010 inflation dispersion in the euro
area declined and (at the beginning of
2011) stood close to its average over
the past decade. When it includes
Slovenia (a member of the euro area
since 2007), Cyprus and Malta
(members since 2008) and Slovakia
(a member since 2009), the dispersion
level of the 16 euro area countries
gradually converges towards that of the
12 euro area countries. The caveats for
Dispersion of annual inflation
Chart 2.6 Dispersion of annual inflation across euro area countries and the United States
(unweighted standard deviation in percentage points)
0
1
2
3
4
5
6
7
8
0
1
2
3
4
5
6
7
8
1990 1992 1994 1996 1998 2000 2002 2004 2006 2008 2010
euro area (16 countries)
euro area (12 countries)
United States (14 Metropolitan Statistical Areas)
United States (4 census regions)
Sources: Eurostat and US Bureau of Labor Statistics.

54
making such comparisons relate to the
comparability of the (unharmonised)
data and geographical entities.
With regard to real GDP growth,
Chart 2.7 shows the dispersion of
output growth across the euro area and
the United States, based on the
unweighted standard deviation. The
line for the 12 euro area countries
shows a broadly stable dispersion of
output growth for the 1990s, which
declined somewhat thereafter. More
recently, growth dispersion increased
moderately, returning to levels seen in
the early 2000s. When it includes
Slovenia, Cyprus, Malta and Slovakia,
the dispersion for the 16 euro area
countries has been very similar to the
dispersion for the 12 euro area countries
since 1994, although in recent years the
dispersion across the 16 euro area
countries has exceeded that for the
12 euro area countries. As can be seen,
euro area growth dispersion has been
broadly similar to that of the US states.
Again, the caveats for making such
comparisons relate to the comparability
of the (unharmonised) data and
geographical entities.
Dispersion of real GDP growth
Chart 2.7 Dispersion of real GDP growth across euro area countries and the United States1)
(unweighted standard deviation; percentage points)
0.0
0.5
1.0
1.5
2.0
2.5
3.0
3.5
4.0
0.0
0.5
1.0
1.5
2.0
2.5
3.0
3.5
4.0
euro area (16 countries)
euro area (12 countries)
United States (50 states and District of Columbia)
United States (8 regions)
1990 1992 1994 1996 1998 2000 2002 2004 2006 2008
Sources: European Commission’s autumn 2010 forecast and US Bureau of Economic Analysis (BEA).
1) There is a statistical break in the US regional data in 1998. For the US states and regions, the
data refer to GDP by state. The eight regions are defined by the BEA and cover the whole country.
Data for Slovakia start in 1992.
55
3 THE ECB’S MONETARY POLICY STRATEGY
This chapter describes the monetary policy strategy of the European Central
Bank (ECB), i.e. the ECB’s general approach to achieving its primary objective of
maintaining price stability. The first section focuses on the reasons underlying the
assignment of this objective to monetary policy. The second section summarises
the key features of the monetary policy transmission mechanism (i.e. the way
in which monetary policy influences price developments) and discusses their
implications for the conduct of monetary policy. The sections that follow explain
the central elements of the ECB’s strategy in greater detail. The final section
describes how the ECB’s monetary policy strategy guided policy choices during
the global financial crisis.
3.1 THE ROLE OF MONETARY POLICY
AND THE BENEFITS OF PRICE STABILITY
What monetary policy can
and what it cannot do
The way in which monetary policy exerts
its influence on the economy can be
explained as follows. The central bank is
the sole issuer of banknotes and bank
reserves, i.e. it is the monopoly supplier
of the monetary base. By virtue of this
monopoly, the central bank is able to
influence money market conditions and
steer short-term interest rates.
In the short run, a change in money
market interest rates induced by
the central bank sets in motion a
number of mechanisms and actions by
economic agents, ultimately influencing
developments in economic variables
such as output or prices. This process –
also known as the monetary policy
transmission mechanism – is complex
and, while its broad features are
understood, there is no unique and
undisputed view of all the aspects
involved.
The neutrality of money is a widely
accepted and empirically validated
proposition in the economic profession.
In the long run, i.e. after all adjustments
in the economy have worked through,
a change in the quantity of money in
the economy (all other things being
equal) will be reflected in a change in
the general level of prices and will not
induce permanent changes in real
variables such as real output or
employment. A change in the quantity
of money in circulation ultimately
represents a change in the unit of
account (and thereby the general price
level) which leaves all other variables
unchanged.
This general principle, referred to as
“the long-run neutrality” of money,
underlies all standard macroeconomic
thinking and theoretical frameworks.
Real income or the level of employment
in the economy are, in the long run,
essentially determined by real (supply-
side) factors. These are technology,
population growth, the preferences of
economic agents and all aspects of the
institutional framework of the economy
(notably property rights, tax policy,
welfare policies and other regulations
determining the flexibility of markets
and incentives to supply labour and
capital and to invest in human
capital).
In the long run, the central bank cannot
influence economic growth by changing
the money supply. Related to this is the
By controlling the supply of the monetary
base…
…the central bank can influence economic
developments
In the long run, changes in the money supply will affect the general price
level…
…but not the level of real income or employment
Inflation is ultimately a monetary phenomenon

56
assertion that inflation is ultimately a
monetary phenomenon. Indeed,
prolonged periods of high inflation are
typically associated with high monetary
growth. While other factors (such as
variations in aggregate demand,
technological changes or commodity
price shocks) can influence price
developments over shorter horizons,
over time their effects can be offset by
some degree of adjustment of the
money stock. In this sense, the longer-
term trends of prices or inflation can be
controlled by the central bank.
The close association between the
growth of money and inflation in the
economy and the long-run neutrality of
monetary policy have been confirmed
by a very large number of economic
studies, covering various periods and
countries. Both empirical and theoretical
research has confirmed that the costs of
inflation and deflation are substantial.
In a regime of price stability, however,
these costs are small and more difficult
to discern empirically. Consequently,
it is widely acknowledged today that
price stability contributes to increasing
economic welfare and the growth
potential of an economy.
The benefits of price stability
The objective of price stability refers to
the general level of prices in the
economy and implies avoiding both
prolonged inflation and deflation. There
are several ways in which price stability
contributes to achieving high levels of
economic activity and employment.
First, price stability makes it easier for
people to disentangle changes in
relative prices (i.e. movements in prices
of any individual good or service) from
changes in the general price level. In
such an environment, people know that
movements in prices typically mirror
changes in the “relative scarcity” of the
individual goods and services which
result from changes in the supply of,
and demand for, these goods and
services. This allows the market to
allocate resources more efficiently.
By helping the market to guide
resources to where they can be used
most productively, price stability
increases the welfare of households
and thus the productive potential of the
economy.
Second, if creditors can be sure that
prices will remain stable in the future,
they will not demand an “inflation risk
premium” to compensate them for the
risks associated with holding nominal
assets over the longer term. By reducing
such risk premia in the real interest
rate, monetary policy credibility
contributes to the efficiency with which
the capital markets allocate resources
and thus increases the incentives to
invest. This in turn fosters economic
welfare.
Third, the credible maintenance of
price stability also makes it less likely
that individuals and firms will divert
resources from productive uses in order
to hedge against inflation. For example,
in a high-inflation environment there is
an incentive to stockpile real goods
since they retain their value better in
such circumstances than money or
certain financial assets. However,
stockpiling goods is not an efficient
investment decision, and therefore
hinders economic growth.
Fourth, tax and welfare systems can
create perverse incentives which distort
economic behaviour. In most cases,
these distortions are exacerbated by
inflation or deflation, as fiscal systems
do not normally allow for the
indexation of tax rates and social
Price stability enhances the potential for
economic growth
Price stability supports
higher living standards by…
…improving the transparency of
relative prices,…
…reducing inflation risk premia in interest rates,…
…avoiding unnecessary hedging activities,…
…reducing distortions of tax systems and social security systems,…
57
security contributions to the inflation
rate. Price stability eliminates the real
costs entailed when inflation exacerbates
the distortionary impact of tax and
social security systems.
Fifth, inflation acts as a tax on holdings
of cash. In an inflationary environment,
households have an incentive not to use
cash as often in order to reduce
transaction costs. These so-called
“shoe-leather” costs arise because
individuals have to visit the bank
(or cash machine) more frequently to
withdraw banknotes.
Sixth, maintaining price stability
prevents the considerable and arbitrary
redistribution of wealth and income
that arises in inflationary as well as
deflationary environments, where price
trends change in unpredictable ways
(e.g. redistribution effects from
creditors to debtors). Typically, the
weakest groups of society often suffer
the most from inflation, as they have
only limited possibilities for hedging
against it. An environment of stable
prices thus helps to maintain social
cohesion and stability. As several
examples in the twentieth century have
demonstrated, high rates of inflation or
deflation often create social and
political instability.
Seventh, sudden revaluations of financial
assets may undermine the soundness
of the banking sector’s balance sheets
and decrease households’ and firms’
wealth. By contrast, if monetary policy
succeeds in maintaining price stability
in a credible manner, inflationary as
well as deflationary shocks to the
real value of nominal assets can be
avoided. In this way, monetary policy
aimed at price stability provides an
important contribution to financial
stability.
All these arguments suggest that a
central bank that maintains price
stability makes a substantial contribution
to the achievement of broader economic
goals, such as higher standards of
living, high levels of economic activity
and better employment prospects. This
is in line with a host of empirical
studies for a wide range of countries
which point to the existence of a
negative relationship between inflation
and growth. A permanent rise in
inflation outweighs any short-term gain
in nominal income, and eventually
causes real income to decline
permanently.
Assignments of the Treaties
The basic and widely shared principles
outlined above are reflected in the
sound allocation of objectives and
responsibilities to the different policy-
making authorities in European
Monetary Union (EMU) (see Chapter 1).
The primary objective of the Eurosystem,
and of the single monetary policy for
which it is responsible, is specified by
the Treaty on the Functioning of the
European Union as the maintenance of
price stability. Moreover, and “without
prejudice to the objective of price
stability”, the Eurosystem shall also
“support the general economic policies
in the Union with a view to contributing
to the achievement of the objectives of
the Union” which include, inter alia,
“full employment” and “balanced
economic growth”.
The institutional framework is founded
on the principle that the Eurosystem’s
objective of maintaining price stability
is of overriding importance. Since
monetary policy can ultimately only
influence the price level in the economy,
price stability is the best contribution
that a central bank can make to
economic welfare and to the long-term
…increasing the benefits of holding cash,…
…preventing the arbitrary redistribution of wealth and
income...
…and contributing to
financial stability
By maintaining price stability the central bank contributes to broader economic goals
The provisions of the Treaties reflect these general principles…
…by setting price stability as the primary objective of monetary policy

58
growth prospects of the economy. By
ensuring lasting conditions of price
stability, the central bank promotes a
steady course of economic development
over longer horizons, encourages
capital formation, and hence contributes
indirectly to income growth. Assigning
monetary policy an objective for real
income or employment would have
been sub-optimal, since monetary policy
has no scope for exerting any lasting
influence on real variables in the short
to medium term. This can be explained
on the basis of two considerations.
First, a central bank has only one
instrument at its disposal in the pursuit
of its mandate. Second, it is the task of
other economic policy-makers, notably
those responsible for fiscal and
structural policies, to smooth real
economic activity in the short term
and to directly enhance the growth
potential of the economy. The clear
hierarchy of objectives on which the
Eurosystem is founded reflects decades
of practical experience and numerous
economic studies which suggest that
monetary policy will contribute most to
improving economic prospects and
raising the living standards of citizens
by maintaining price stability in a
lasting way.
3.2 THE TRANSMISSION MECHANISM
OF MONETARY POLICY
The transmission mechanism
and its channels
The process through which monetary
policy decisions affect the economy in
general, and the price level in particular,
is known as the transmission
mechanism of monetary policy. The
transmission of monetary impulses to
the real sector involves a number of
different mechanisms and actions by
economic agents at various stages of
the process. As a result, monetary
policy action usually takes a
considerable time to affect price
developments. Furthermore, the size
and strength of the different effects can
vary according to the state of the
economy, which makes the precise
impact difficult to estimate. Taken
together, central banks typically see
themselves confronted with long,
variable and uncertain lags in the
conduct of monetary policy.
Identifying the transmission
mechanism of monetary policy is
complicated by the fact that, in
practice, economic developments are
continuously influenced by shocks
from a wide variety of sources. For
instance, changes in oil or other
commodity prices or in administered
prices can have a short-term, direct
impact on inflation. Similarly,
developments in the world economy
or in fiscal policies may influence
aggregate demand and thereby price
developments. Furthermore, financial
asset prices and exchange rates depend
on many other factors in addition to
monetary policy. Monetary policy
must therefore monitor the transmission
chain to avoid that exogenous shocks
to the financial structure interfere
with the transmission of monetary
impulses. It should also take into
account all other developments
relevant for future inflation in order to
prevent these having an impact on
longer-term inflation trends and
expectations in a way that is
inconsistent with price stability. The
required path of monetary policy is
therefore always dependent on the
nature, size and duration of the shocks
hitting the economy. It is an ongoing
challenge for the central bank to
identify the factors driving price trends
in order to apply the appropriate
monetary policy reaction.
The transmission is characterised
by long, variable and uncertain
time lags…
…and is influenced by exogenous shocks
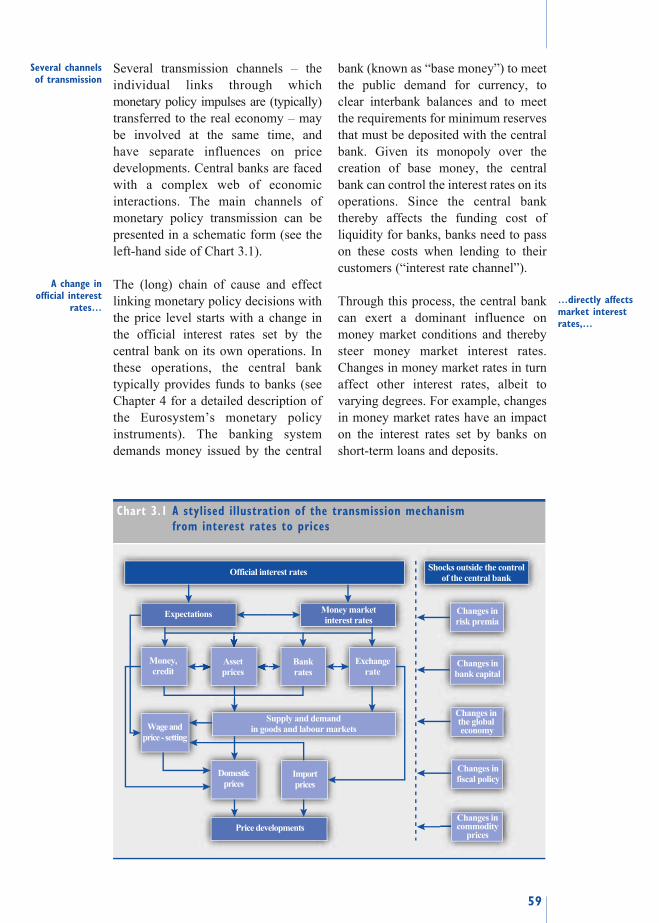
59
Several transmission channels – the
individual links through which
monetary policy impulses are (typically)
transferred to the real economy – may
be involved at the same time, and
have separate influences on price
developments. Central banks are faced
with a complex web of economic
interactions. The main channels of
monetary policy transmission can be
presented in a schematic form (see the
left-hand side of Chart 3.1).
The (long) chain of cause and effect
linking monetary policy decisions with
the price level starts with a change in
the official interest rates set by the
central bank on its own operations. In
these operations, the central bank
typically provides funds to banks (see
Chapter 4 for a detailed description of
the Eurosystem’s monetary policy
instruments). The banking system
demands money issued by the central
bank (known as “base money”) to meet
the public demand for currency, to
clear interbank balances and to meet
the requirements for minimum reserves
that must be deposited with the central
bank. Given its monopoly over the
creation of base money, the central
bank can control the interest rates on its
operations. Since the central bank
thereby affects the funding cost of
liquidity for banks, banks need to pass
on these costs when lending to their
customers (“interest rate channel”).
Through this process, the central bank
can exert a dominant influence on
money market conditions and thereby
steer money market interest rates.
Changes in money market rates in turn
affect other interest rates, albeit to
varying degrees. For example, changes
in money market rates have an impact
on the interest rates set by banks on
short-term loans and deposits.
Several channels of transmission
A change in official interest
rates… …directly affects market interest rates,…
Chart 3.1 A stylised illustration of the transmission mechanism from interest rates to prices
Exchangerate
Shocks outside the controlof the central bank
Changes inrisk premia
Changes inbank capital
Changes in the global economy
Changes infiscal policy
Changes incommodity
prices
Official interest rates
Expectations Money marketinterest rates
Money,credit
Assetprices
Bankrates
Wage andprice - setting
Supply and demandin goods and labour markets
Domesticprices
Importprices
Price developments
60
In addition, expectations of future
official interest rate changes affect
longer-term market interest rates, since
these reflect expectations of the future
evolution of short-term interest rates.
However, the impact of money market
rate changes on interest rates at very
long maturities (e.g. ten-year
government bond yields, long-term
bank lending rates) is less direct. Those
rates depend to a large extent on market
expectations for long-term growth and
inflation trends in the economy. In
other words, changes in the central
bank’s official rates do not normally
affect these longer-term rates unless
they were to lead to a change in market
expectations concerning long-term
economic trends. Monetary policy can
also guide economic agents’
expectations of future inflation and
thus influence price developments
(see Chart 3.1).
Changes in interest rates affect the
saving, spending and investment
decisions of households and firms. For
example, all other things being equal,
higher interest rates tend to make it less
attractive for households or companies
to take out loans in order to finance their
consumption or investment. Higher
interest rates also make it more attractive
for households to save their current
income rather than spend it, since the
return on their savings is increased.
As a consequence of changes in
consumption and investment, the level
of domestic demand for goods and
services relative to domestic supply
will change. When demand exceeds
supply, all other things being equal,
upward pressure on prices is likely to
result. Moreover, changes in aggregate
demand may translate into tighter or
looser conditions in labour and
intermediate product markets, and these
in turn can affect price and wage-
setting in the respective market.
Because of their impact on financing
conditions in the economy and on
expectations, monetary policy decisions
can affect other financial variables such
as asset prices (e.g. stock market prices)
and exchange rates. Changes in the
exchange rate can affect inflation
directly, insofar as imported goods are
part of the consumption basket, but they
may also work through other channels
(see Chart 3.1). Changes in other asset
prices typically affect inflation indirectly,
to the extent that wealth effects impact
on the private sector’s consumption
decisions. They may also have
implications for financial stability when
protracted asset price bubbles suddenly
burst. Boom-bust cycles in asset prices
are often associated with periods of
prolonged loose monetary policy.
Furthermore, changes in official interest
rates may also affect the supply of
credit (“credit channel”). Following an
increase in interest rates, the risk that
some borrowers cannot safely pay back
their loans may increase to a level such
that the bank will not grant a loan to
these borrowers (the “bank lending
channel” of the credit channel). As a
consequence, such borrowers,
households or firms are forced to
postpone their consumption or
investment plans. Interest rate changes
also affect firms’ balance sheets. An
increase in interest rates leads to a
lower net worth of firms which means
a lower collateral value and thus a
reduced ability to borrow (the “balance
sheet channel” of the credit channel).
In addition to the traditional bank
lending channel, which focuses on the
quantity of loans supplied, a “risk-
taking channel” may exist when banks’
…affects expectations,…
…affects saving and investment
decisions,…
…leads to a change in
aggregate demand and
prices,…
…affects asset prices,…
…affects the supply of credit,…
…and may affect the overall risk-taking behaviour of the economy

61
incentive to bear risk related to the
provision of loans is affected. The risk-
taking channel is thought to operate
mainly via two mechanisms. First, low
interest rates boost asset and collateral
values. This, in conjunction with the
belief that the increase in asset values
is sustainable, leads both borrowers
and banks to accept higher risks.
Second, low interest rates make riskier
assets more attractive, as agents search
for higher yields. In the case of banks,
these two effects usually translate into
a softening of credit standards, which
can lead to an excessive increase in
loan supply.
Changes in the exchange rate will
normally affect inflation in three ways.
First, exchange rate movements may
directly affect the domestic price of
imported goods. If the exchange rate
appreciates, the price of imported goods
tends to fall, thus helping to reduce
inflation directly, insofar as these
products are directly used in
consumption. Second, if these imports
are used as inputs into the production
process, lower prices for inputs might,
over time, feed through into lower
prices for final goods. Third, exchange
rate developments may also have an
effect via their impact on the
competitiveness of domestically
produced goods on international
markets. If an appreciation in the
exchange rate makes domestically
produced goods less competitive in
terms of their price on world markets,
this tends to constrain external demand
and thus reduce overall demand
pressure in the economy. All other
things being equal, an appreciation of
the exchange rate would thus tend to
reduce inflationary pressures. The
strength of exchange rate effects
depends on how open the economy is
to international trade. Exchange rate
effects are in general less important for
large economies than for small open
economies. Furthermore, financial
asset prices like the exchange rate
depend on many other factors in
addition to monetary policy.
The expectations channel mainly works
by influencing the private sector’s
longer-term expectations. It has gained
particular relevance for the conduct of
monetary policy over past decades.
Its effectiveness crucially depends
on the credibility of central bank
communication which primarily rests
on a sound monetary policy framework.
For instance, if a central bank enjoys a
high degree of credibility in pursuing
its objective, monetary policy can exert
a powerful direct influence on price
developments by guiding economic
agents’ expectations of future inflation
and thereby influencing their wage and
price-setting behaviour. The credibility
of a central bank to maintain price
stability in a lasting manner is crucial
in this respect. If economic agents
believe in the central bank’s ability and
commitment to maintain price stability,
inflation expectations will remain
firmly anchored to price stability. This,
in turn, will influence wage and price-
setting in the economy given that, in an
environment of price stability, wage
and price-setters will not have to adjust
their prices upwards for fear of higher
inflation in the future. In this respect,
credibility facilitates the task of
monetary policy.
Empirical knowledge
of the transmission process
Understanding the transmission
mechanism is crucial for monetary
policy. It is, therefore, not surprising
that numerous researchers have tried to
analyse the complex interactions
underlying it. Over time, more
The exchange rate channel
The expectations channel
Research contributes to a better understanding of the transmission mechanism

62
information and research results have
become available and there is now a
better understanding of monetary
transmission in the euro area. One of the
main findings of the Monetary
Transmission Network is that monetary
policy affects the economy mainly
through the interest rate channel.
Although the use of empirical methods
for the quantification of the transmission
mechanism and its channels has proved
to be of great help in recent decades, the
results have shed only partial light on
the complex process involved. The
learning process is therefore still
underway and the ECB will continue to
monitor possible behavioural and
structural changes.
When the ECB took responsibility for
an entirely new currency area, it was
faced with an extraordinary level of
uncertainty – unknown to most other
central banks – regarding the
transmission process and the underlying
data. In addition, institutional and
behavioural changes following the
introduction of the single currency at
the beginning of 1999 may have altered
the relationships between different
economic variables.
With the benefit of hindsight, a number
of widely accepted and well-established
facts based on experience in other
economies have been confirmed to be
valid also for the euro area. First, long
and uncertain lags exist in the
transmission of monetary impulses to
the domestic price level. Second, in
normal times, monetary policy works
mainly through the interest rate channel:
a tightening of monetary policy leads
to a transitory decrease in output, which
is estimated to reach its maximum
between one and two years after the
interest rate increase. Prices tend to
decline more gradually, and respond
more sluggishly to the tightening of
monetary policy than output. Moreover,
recent research has revealed that the
monetary transmission mechanism and,
in particular, the response of output and
inflation to interest rate shocks have
not significantly changed since the
introduction of the single currency.
Third, beyond these aggregate effects,
interest rate changes also affect
economic activity via their impact on
firms’ cash flows and the supply of
bank loans, hence confirming the
relevance of the credit channel of
monetary policy.
3.3 THE ECB’S MONETARY POLICY
STRATEGY: GENERAL PRINCIPLES
AND MAIN ELEMENTS
Taking into account the knowledge
about the transmission process, the
Governing Council of the ECB aims to
influence conditions in the money
market. The level of short-term interest
rates can be set so as to ensure that
price stability is maintained over the
medium term. In so doing, the central
bank is continuously confronted with a
high level of uncertainty regarding
both the nature of the economic shocks
hitting the economy and the existence
and strength of the relationships that
link macroeconomic variables. Against
this background, it is possible to
identify some key characteristics of a
successful monetary policy.
First, the functioning of the money
market plays a vital role in the operation
of the interest rate channel. Its proper
functioning is central to the transmission
of the ECB’s policy rates. The smooth
transmission of the Governing
Council’s monetary policy intentions
to money market rates depends critically
on the behaviour of banks and on their
willingness to entertain smooth
Uncertainty about the
transmission process
Conventional response to
interest rate changes
The task of monetary policy
Monetary policy must preserve the functioning of the transmission mechanism

63
exchanges of liquidity in the interbank
market. Dysfunctional money markets
can weaken the capacity of monetary
policy to influence the outlook for
price stability through interest rate
adjustments alone. Recent events have
demonstrated that the orderly
transmission of monetary policy can be
hampered when massive financial
turbulences occur. In order to keep the
transmission mechanism fully
operational and to ensure the
maintenance of price stability over the
medium term, a central bank may need
to introduce non-standard policy
measures, i.e. liquidity interventions
aimed at facilitating the transmission of
the interest rate policy and enhancing
the flows of credit to the broad
economy.
Second, owing to the lags and stochastic
uncertainty in the transmission process,
changes in monetary policy today will
only affect the price level after a number
of quarters or years. This means that
central banks need to ascertain what
policy stance is needed today in order to
maintain price stability in the future,
after the transmission lags unwind.
In this sense, monetary policy must be
forward-looking and pre-emptive.
Third, as the transmission lags make it
impossible in the short run for monetary
policy to offset unanticipated shocks to
the price level (for example, those
caused by changes in international
commodity prices), some short-term
volatility in inflation rates is
unavoidable. In addition, owing to the
complexity of the transmission process,
there is always a large element of
uncertainty surrounding the effects of
monetary policy. For these reasons,
monetary policy should have a
medium-term orientation to avoid
excessive activism and the introduction
of unnecessary volatility into the
real economy.
Fourth, as stressed in Section 3.2,
monetary policy will be considerably
more effective if it firmly anchors
inflation expectations. In this respect,
the central bank should specify its goal,
elaborate and keep to a consistent and
systematic method for conducting
monetary policy, and communicate
clearly and openly. These are key
elements for acquiring a high level of
credibility, a necessary precondition
for influencing the expectations of
economic actors. Well-anchored
inflation expectations act as automatic
stabilisers in conditions of heightened
macroeconomic uncertainty and
amplify the potency of monetary policy
in those conditions in which the
transmission mechanism is perturbed.
Finally, just like any other central bank,
the ECB faces considerable uncertainty
about the reliability of economic
indicators, the structure of the euro area
economy and the monetary policy
transmission mechanism, among other
things. A successful monetary policy
therefore has to be broadly based, taking
into account all relevant information in
order to understand the factors driving
economic developments, and cannot
rely on a single model of the economy.
The ECB has adopted and announced a
monetary policy strategy to ensure a
consistent and systematic approach to
monetary policy decisions. This
monetary policy strategy embodies the
above-mentioned general principles in
order to meet the challenges facing the
central bank. It aims to provide a
comprehensive framework within
which decisions on the appropriate
level of short-term interest rates can be
taken and explained to the public.
Monetary policy must be
forward-looking and pre-
emptive,…
…focusing on the medium
term,…
…firmly anchoring inflation expectations,…
…and be broadly based
A comprehensive framework for monetary policy decisions
64
The ECB’s monetary policy strategy
comprises two main elements. The first
element of the strategy is a quantitative
definition of price stability. The second
element is a two-pillar approach to the
analysis of the risks to price stability.
This latter element provides a
framework which ensures that the
Governing Council assesses all the
relevant information and analyses
necessary to take monetary policy
decisions in a forward-looking and pre-
emptive manner. In this respect, the
ECB’s strategy also provides a
framework for explaining monetary
policy decisions to the public in a clear
and transparent manner. The following
sections of this chapter describe these
elements in detail.
3.4 THE ECB’S QUANTITATIVE
DEFINITION OF PRICE STABILITY
The Treaty on the Functioning of the
European Union clearly establishes the
maintenance of price stability as the
primary objective of the Eurosystem.
In order to specify this objective more
precisely, the Governing Council of the
ECB announced the following
quantitative definition in 1998: “Price
stability shall be defined as a
year-on-year increase in the Harmonised
Index of Consumer Prices (HICP) for
the euro area of below 2%. Price
stability is to be maintained over the
medium term”. Following a thorough
evaluation of its monetary policy
strategy in 2003, the Governing Council
further clarified that, within the
definition, it aims to maintain inflation
rates “below, but close to, 2% over the
medium term”.
The Governing Council decided to
publicly announce a quantitative
definition of price stability for a number
of reasons. First, by clarifying how the
Governing Council interprets the
ECB’s primary objective, the definition
helps to make the monetary policy
framework easier to understand and
makes monetary policy more
transparent. Second, the definition of
price stability provides a clear and
measurable yardstick against which the
public can hold the ECB accountable.
Deviations of price developments from
the definition of price stability can be
identified, and the ECB would then be
required to provide an explanation for
such deviations and to communicate
how it intends to re-establish price
stability within a realistic period of
time. Finally, the definition provides
guidance to the public for forming
expectations of future price
developments.
The ECB’s monetary policy has a euro
area-wide focus. Accordingly, price
stability is assessed on the basis of
price developments in the euro area
viewed as a whole, indicating that
decisions regarding the single monetary
policy aim at achieving price stability
for the aggregate economy. This focus
on the euro area as a whole is the
natural consequence of the fact that,
within a monetary union, monetary
policy can only steer the average money
market interest rate level in the area,
i.e. it must use a tool that is uniform
across the area.
The definition also identifies a specific
price index – namely the HICP for the
euro area – as that to be used for the
purposes of assessing whether price
stability has been achieved. This index
has been harmonised across the various
countries of the euro area. The HICP is
the index that most closely approximates
the changes over time in the price of a
representative basket of consumer
expenditures (see Box 3.1). Price
The main elements of the ECB’s monetary policy strategy
The ECB has defined price
stability in quantitative
terms
The definition both anchors
inflation expectations
and enhances the transparency
of the ECB’s monetary policy
Focus on the euro area as a whole
The HICP

65
stability is measured in terms of headline
inflation, which corresponds to the
representative basket. The use of a
harmonised index for headline inflation
makes transparent the ECB’s
commitment to the full and effective
protection against losses in the
purchasing power of money. The
so-called “core” inflation indices can
provide supplementary information
about the causes of underlying price
developments. They exclude certain
volatile components from the basket,
such as energy and unprocessed food.
The ECB monitors such indicators, but
does not consider core inflation to be an
appropriate yardstick for measuring
price stability in the euro area.
Box 3.1 Construction and features of the Harmonised Index of Consumer Prices
The Governing Council of the ECB has defined price stability in terms of the Harmonised
Index of Consumer Prices (HICP) for the euro area. The conceptual work related to the
compilation of this price index is carried out by the European Commission (Eurostat) in
close liaison with the national statistical institutes. As a key user, the Eurosystem has
been closely involved in this work.
The HICP data released by Eurostat are available from January 1995 onwards.
Estimated backdata, which are not fully comparable with HICP data from 1995, are
available for the overall HICP and its main components from 1990. Based on the
consumer expenditure weights applicable for 2010, goods account for 58.0% and
services account for 42.0% of the HICP (see Table 3.1). The main idea behind the
breakdown of overall HICP into individual components is to identify the different
economic factors that impact on consumer price developments. For example,
developments in the energy price component are closely related to oil price movements.
Food prices are divided into processed and unprocessed foods, because prices for the latter
are influenced by factors such as weather conditions and seasonal patterns, while such
Table 3.1 Weights of the main euro area HICP components applicable for 2010
Overall index 100.0Goods prices 58.0
Unprocessed food 7.3
Processed food 11.9
Non-energy industrial goods 29.3
Energy 9.6
Services 42.0
Housing services 10.2
Transport 6.6
Communication 3.3
Recreation and personal services 14.9
Miscellaneous 7.1
Source: Eurostat.

66
By referring to “an increase in the
HICP of below 2%” the definition
makes clear that not only inflation
above 2% but also deflation, i.e. a self-
sustaining fall in the broad price index,
is inconsistent with price stability. In
the pursuit of price stability, the
Governing Council’s explicit aim is to
maintain the inflation rate at a level
below, but close to, 2%. It thereby
signals its commitment to provide an
adequate margin to avoid the risks of
deflation. While deflation implies
similar costs to the economy as inflation
(see Section 3.1), avoiding deflation is
important because, once it occurs,
it may become entrenched in view
of the limitations encountered by
monetary policy when the nominal
interest rate falls to levels very close to
zero. In a deflationary environment,
if and when inflation expectations lose
their anchor and start projecting a self-
sustaining process of price level
declines, monetary policy may not be
able to provide a sufficient degree
of support to the economy by using
its interest rate instrument. Any attempt
to bring the nominal interest rate below
zero would fail, as the public
would prefer to hold cash rather than
to lend or hold deposits at a negative
rate. Although various stimulating
monetary policy actions are possible
even when nominal interest rates are at
zero, these alternative, unconventional
policies can be very costly. It is
therefore more difficult for monetary
policy to fight deflation than to fight
inflation.
By setting the upper bound for inflation
clearly above zero and aiming
at inflation below, but close to, 2%,
the ECB also takes into account
the possibility of HICP inflation
slightly overstating true inflation as a
result of a small but positive bias
in the measurement of price level
changes using the HICP. For various
reasons, consumer price indices may be
subject to measurement errors. Such
errors may arise if prices are not
adequately adjusted for changes in the
quality of the goods components
or if some relevant transactions
remain systematically out of the sample
used to construct the index. In the
past, a number of economic studies
have identified a small but positive
bias in the measurement of national
consumer price indices, suggesting
The definition excludes
deflation…
…takes into account a potential measurement bias…
factors have less of an impact on processed food prices. Services prices are sub-divided
into five components which, on account of different market conditions, typically show
differences in their respective developments.
The harmonisation measures introduced for the HICP in the different countries are based on
several EU regulations and guidelines agreed with the Member States. Among other things,
they concern coverage of consumer spending, initial standards for quality adjustment
procedures, the treatment of new goods and services, and the revision of weights. “Initial”
refers to the fact that some further harmonisation is envisaged in several areas. Moreover,
a detailed and harmonised classification has been agreed for sub-indices, allowing a
consistent comparison of price developments in consumer expenditure sub-groups across
countries. As a result of the harmonisation and statistical improvements aimed at enhancing
its accuracy, reliability and timeliness, the HICP has become a high-quality, international-
standard price index and a broadly comparable indicator across countries. Improvements
are still ongoing with regard to the standards for quality adjustment and sampling, as well
as the treatment of owner-occupiers’ housing costs.

67
that (as a result of quality improvements
in goods, for example) a measured
inflation rate of zero could in fact imply
a slight decline in the actual price level.
Where the euro area is concerned,
several measures have been taken to
ensure timely updates of price statistics.
Taking into account the continuous
improvements being made to the HICP’s
properties by Eurostat (the European
Commission agency responsible for this
area of statistics at EU level), any bias
is likely to be small.
The setting of a precise objective for
monetary policy in a monetary union
also takes into account the existence of
inflation differentials across regions in
the union which operate at different
stages of economic development.
The fact that some economies in the
euro area are in a structural “catching-up”
process might mean that – for a possibly
extended period of time – their inflation
rates will be higher than the average.
The inflation rate in countries at very
advanced stages of development
could – by implication – be forced to
structurally operate at excessively low
or negative inflation rates. In principle,
inflation differentials across regions
are a normal feature of any monetary
union. They are an integral part of the
adjustment mechanism resulting from
divergences in economic developments
across the regions’ economies.
Monetary policy can only influence the
price level of the euro area as a whole
and cannot affect inflation differentials
across regions or cities. Inflation
differentials may be due to transitory
factors and may thus be only temporary.
Such differentials are of little
economic concern. However, if real
convergence between regions in
a currency union is incomplete,
structural inflation differentials across
the regions comprising the union may
arise. For example, there may be
differences in initial income levels
and an ongoing process of catching-
up in standards of living within a
currency area.
Inflation differentials between the euro
area countries are moderate and broadly
in line with other large currency
areas, such as the United States
(see Section 2.8). Such differentials
may result from differences in
demographic trends, long-term
catching-up processes, or ongoing
adjustments leading to a more efficient
allocation of resources. To some extent,
the persistence of inflation differentials
of individual euro area countries may
be the result of structural inefficiencies
or misaligned national policies.
Persistent above-average inflation rates
can lead to a loss of competitiveness of
the respective countries. In a monetary
union, domestic policies must address
such inflation differentials. Taking the
existence of unavoidable inflation
differences into account, it has been
argued that the ECB’s monetary policy
should aim to achieve – over the
medium term – an inflation rate for the
area as a whole that is high enough to
prevent regions with structurally lower
inflation rates from having to meet the
costs of possible downward nominal
rigidities or entering periods of
protracted deflation. According to all
available studies, a rate of inflation
below, but close to, 2% for the euro
area provides a sufficient margin also
in this respect.
Finally, a fundamental aspect of the
ECB’s monetary policy is that it aims
to pursue price stability “over the
medium term”. As outlined above,
this reflects the consensus that
monetary policy cannot, and therefore
should not, attempt to fine-tune
…and the implications of inflation differentials
in the euro area
Unavoidable inflation differentials in the euro area
The medium-term orientation
68
developments in prices or inflation
over short horizons of a few weeks or
months. Changes in monetary policy
only affect prices with a variable time
lag, and the magnitude of the eventual
impact is uncertain and state dependent
(see Section 3.2). This implies that
monetary policy cannot offset all
unanticipated disturbances to the price
level. Some short-term volatility in
inflation is therefore inevitable.
As Box 3.2 explains, the medium-
term orientation also allows monetary
policy to make sure that in reacting to
shocks that have an impact on
inflation, the central bank does not
become an independent source of
unnecessary output fluctuations.
Box 3.2 The medium-term orientation of the ECB’s monetary policy
An economy is continuously subject to largely unforeseeable shocks that also affect price
developments. At the same time, monetary policy can only affect price developments
with significant time lags, which are variable and, like most economic relationships,
highly uncertain. Against this background, it would be impossible for any central bank
to keep inflation at a specific point target at all times or to bring it back to a desired
level within a very short period of time. Consequently, monetary policy needs to act in a
forward-looking manner and can only maintain price stability over longer periods of time.
This is the reasoning that lies at the core of the ECB’s medium-term orientation.
The ECB has not defined the medium term with reference to a predetermined horizon,
but deliberately retains some flexibility with regard to the exact time frame. Several
reasons underpin that choice. It is not advisable to specify ex ante a precise horizon for
the conduct of monetary policy, since the transmission mechanism spans a variable,
uncertain period of time. In addition, the ECB’s mandate is formulated in terms of a price
stability objective rather than an inflation target. This element helps policy-makers to
avoid mechanistic reactions in response to shorter-term developments aimed at restoring
the inflation target at a fixed short-term policy horizon. Furthermore, the optimal
monetary policy response to ensure price stability always depends on the specific nature
and size of the shocks affecting the economy. For a wide variety of shocks (e.g. demand
shocks that move output and prices in the same direction) a prompt reaction by monetary
policy is often adequate and will not only preserve price stability but also help to stabilise
the economy. However, there are other types of economic shocks (e.g. of a cost-push
nature, such as oil price hikes) that move output and prices in opposite directions. For
example, monetary policy has to accept the inflationary consequences caused by the
first-round effects of oil price shocks, since little – if anything – can be done to counter
them. An excessively aggressive policy response to restore price stability in a very short
span of time would, in these circumstances, risk imparting a significant cost in terms of
output and employment volatility which, over a longer horizon, could also affect price
developments. In these cases, it is widely recognised that a gradual response of monetary
policy is appropriate both to avoid unnecessarily high volatility in real activity and to
maintain price stability over a longer horizon. Thus, the medium-term orientation also
gives the ECB the flexibility required to respond in an appropriate manner to the different
economic shocks that might occur.
69
3.5 THE ANALYSIS OF RISKS
TO PRICE STABILITY IN THE ECB’S
MONETARY POLICY STRATEGY
The two pillars of the ECB’s monetary
policy strategy
In order to best serve its objective of
maintaining price stability, the
Governing Council regularly assesses
the risks to price stability. Its approach
to organising, evaluating and cross-
checking all information relevant for
assessing the risks to price stability is
based on two analytical perspectives,
referred to as the “two pillars”: the
economic analysis and the monetary
analysis. They form the basis for the
Governing Council’s monetary policy
decisions. This approach was confirmed
and further clarified by the Governing
Council in May 2003.
The comprehensive analysis of the
risks to price stability is organised on
the basis of two complementary
perspectives on determining price
developments. One perspective,
referred to as the “economic analysis”,
is aimed at assessing the short to
medium-term determinants of price
developments, with a focus on real
activity and cost factors driving prices
over those horizons. It takes account of
the fact that short to medium-term
price developments over those horizons
are influenced largely by the interplay
of supply and demand in the goods,
services and factor markets. A second
perspective, referred to as the
“monetary analysis”, focuses on a
medium to longer-term horizon.
It exploits the long-run link between
money and prices. The monetary
analysis serves, in particular, as a
means of cross-checking, from a
medium to long-term perspective, the
short to medium-term indications for
monetary policy derived from the
economic analysis.
The two-pillar approach is designed to
ensure that no relevant information is
lost in the assessment of the risks to
price stability and that appropriate
attention is paid to different perspectives
and the cross-checking of information
in order to reach an overall judgement
on the risks to price stability.
It represents, and conveys to the public,
the notion of diversified analysis and
ensures robust decision-making based
on different analytical perspectives
(see Box 3.3 for a discussion of
alternative strategies).
The two-pillar framework
is a tool for organising information…
…based on two analytical perspectives…
…to ensure that no relevant information is lost
In sum, the focus of the ECB’s monetary policy in pursuing its price stability
mandate is on the medium term. The ECB’s decision not to give the policy-
relevant horizon a precise time dimension has been an appropriate choice, both in
normal and crisis times. The medium-term orientation implies that the policy-
relevant horizon, defined as the horizon at which the ECB pursues the sustainable
alignment of consumer price inflation with its price stability objective, can be
of variable length over time, taking into account the fact that transmission lags
are not only long but also variable and uncertain. Furthermore, the inflationary
or deflationary impact associated with the accumulation of financial imbalances
may go beyond the standard horizon of two to three years commonly used in
inflation projections. This underlines the importance of the monetary analysis
(see Section 3.5) which provides policy-makers with the necessary tools to pursue a
medium to long-term perspective.

70
Box 3.3 Alternative monetary policy strategies
A number of other monetary policy strategies are, or have been, pursued by other central
banks. Several of these were considered by the European Monetary Institute and the ECB
before the decision was taken to adopt the stability-oriented two-pillar strategy.
One such strategy is monetary targeting. In practice, this means that a central bank
changes official interest rates in an attempt to either speed up or slow down monetary
growth to a specific and pre-announced rate. This target rate is derived so as to be
compatible with price stability. Such a strategy rests on two premises. First, a stable
relationship between money and the price level (e.g. in the form of a money demand
equation) should exist over the medium term. If so, a path consistent with price stability
can be derived for the money stock. Second, the money stock should be controllable
by monetary policy. Taken together, these conditions imply that the central bank can
use changes in official interest rates to keep the money stock on its prescribed path and
thereby – because of the stability of the money-price relationship – indirectly maintain
price stability.
While central bank experiences with this approach influenced the design of the ECB’s
strategy, the ECB decided not to adopt monetary targeting. This decision acknowledged
the existence of information in macroeconomic variables other than money that is
important for monetary policy decisions aimed at price stability. Furthermore, some
uncertainties about the empirical properties of money in the euro area were created by the
institutional and behavioural changes associated with the transition to monetary union,
and – more generally – by the possibility that special factors might temporarily distort
monetary developments. It is therefore not advisable to rely exclusively on monetary
analysis.
Another strategy is direct inflation targeting. Rather than using money to guide monetary
policy decisions, this approach focuses on developments in inflation itself relative to a
published inflation target. In practice, different forms of inflation targeting exist. They all
have in common a published numerical inflation target and a predefined policy horizon.
Central banks using this approach communicate monetary policy decisions in terms of a
more or less mechanical reaction to deviations in a forecast for a particular measure of
inflation from the inflation target at a particular horizon. The central bank’s forecast for
inflation is therefore placed at the centre of policy analysis and discussions, both within
the central bank and in its presentations to the public.
While there are many similarities between the ECB’s strategy and strategies of other
central banks, the ECB decided not to pursue a direct inflation targeting strategy in the
sense discussed above for a number of reasons. First, focusing entirely on a forecast
inflation figure does not provide a comprehensive and reliable framework for identifying
the nature of threats to price stability. The appropriate monetary policy response
generally depends on the sources of these risks to price stability. As a minimum,
it requires a deeper analysis of the underlying economic situation and behaviour than is
captured in an inflation forecast alone. Second, various aspects of the textbook inflation
targeting approach – such as the fixed horizon (e.g. two years) of the forecast from which
monetary policy decisions feed back – are somewhat arbitrary and in many circumstances
do not appear to be optimal. Factors that may affect inflation beyond the chosen horizon,
such as asset price imbalances, may need to be taken into account in current monetary
71
Economic analysis
The economic analysis focuses mainly
on the assessment of current economic
and financial developments and the
implied short to medium-term risks to
price stability. The economic and
financial variables that are the subject
of this analysis include, for example:
developments in overall output;
aggregate demand and its components;
fiscal policy; capital and labour market
conditions; a broad range of price and
cost indicators; developments in the
exchange rate, the global economy and
the balance of payments; financial
markets and the balance sheet positions
of euro area sectors. All these factors
are helpful in assessing the dynamics of
real activity and the likely development
of prices from the perspective of the
interplay between supply and demand
in the goods, services and factor markets
at shorter horizons. Moreover, staff
macroeconomic projection exercises
play an important role in the economic
analysis.
In the economic analysis, due attention is
paid to the need to identify the nature of
shocks hitting the economy, their effects
on cost and pricing behaviour and the
short to medium-term prospects for their
propagation in the economy. To take
appropriate decisions, the Governing
Council needs to have a comprehensive
understanding of the prevailing economic
situation and must be aware of the
specific nature and magnitude of any
economic disturbances threatening price
stability. For example, the appropriate
monetary policy response to the
inflationary consequences of a temporary
rise in the international price of oil might
be different from the appropriate response
to higher consumer prices resulting from
wage increases not in line with
productivity growth. The former results
in a transient and short-lived increase in
inflation which quickly reverses. If this
shock does not lead to higher inflation
expectations, it may pose less of a threat
to price stability over the medium term.
In the case of excessive wage increases,
however, the danger exists that a self-
sustaining spiral of higher costs, higher
prices and higher wage demands may be
created. To avoid such a spiral, a
determined monetary policy reaction to
reaffirm the central bank’s commitment
to the maintenance of price stability,
Analysis of short to medium-term
risks to price stability…
…contributes to revealing the nature of shocks
policy decisions. This became particularly obvious during the recent financial crisis, and
led some inflation targeting central banks to adopt a more flexible stance concerning
the policy horizon. Third, it is nevertheless difficult to integrate the information
contained in monetary aggregates into inflation forecasts that are based on conventional
macroeconomic models. Finally, the ECB takes the view that relying on a single forecast
would not be appropriate, given the considerable uncertainty relating to the structure of
the euro area economy. It is considered preferable to adopt a diversified approach to the
analysis of economic data based on a variety of analytical methodologies.
A third strategy is exchange rate targeting, which was pursued by several European
countries prior to monetary union in the context of the exchange rate mechanism of
the European Monetary System. For small open economies where the production
and consumption of internationally traded goods are a large part of the economy,
developments in the exchange rate can have a significant impact on the price level
through their effect on the price of imports. An exchange rate targeting strategy was not
considered appropriate for the euro area, as it is a large and relatively closed economy
where the impact of exchange rate developments on the price level is more modest.

72
thereby helping to stabilise inflation
expectations, may be the appropriate
response.
Against this background, the ECB
regularly reviews developments in
overall output, demand and labour
market conditions, a broad range of price
and cost indicators, and fiscal policy, as
well as the balance of payments for the
euro area. Among other things, these
indicators help to assess movements in
aggregate demand, aggregate supply and
the degree of capacity utilisation. The
ECB also carries out several surveys that
provide further input into the economic
analysis, such as the Survey of
Professional Forecasters (SPF). Box 3.4
provides information on the euro area
indicators that are analysed by the ECB.
Analysis of real economy
indicators
Box 3.4 Statistics relating to developments in the euro area
As explained in Section 3.2, the chain of causes and effects linking monetary policy
decisions with the price level is complex and involves time lags, which may be
significant. Therefore, policy-makers need to monitor a wide range of indicators when
assessing the outlook for price stability. High quality statistics are vital to obtain a reliable
picture of the economy. Policy mistakes attributable to incomplete or unreliable statistics
can be costly in terms of higher inflation and output volatility. Common methodological
standards have been defined for many areas of euro area statistics. The provision of
statistics for the euro area is being continuously developed and improved. This box gives
a brief overview of the main building blocks of euro area statistics.
Access to euro area statistics
ECB press releases and the “ Euro area statistics” section of the ECB’s Monthly Bulletin
(or the Statistics Pocket Book) are the main official sources. They can be downloaded
from the ECB’s website or acquired in hard copy free of charge. More detailed statistical
information is available from the ECB’s Statistical Data Warehouse (http://sdw.ecb.
europa.eu) in the “Statistics” section of the ECB’s website. Here, users can extract data in
various formats and obtain information on the respective (legal) definitions and concepts
used for the various statistics.
General economic statistics
Data on prices, costs, output, demand and the labour market are of crucial importance
for the ECB’s conduct of monetary policy. The ECB defines price stability, its primary
objective, in terms of the HICP for the euro area. Price and cost developments may play
an important role in signalling future changes in consumer prices as changes in production
costs feed through to consumer prices. Labour costs, which are an important element of
overall production costs, have a significant impact on price formation. Indicators of
output and demand (national accounts, short-term statistics on activity in industry and
services, orders, and qualitative survey data) and labour market data (on employment,
unemployment, vacancies and labour market participation) provide information on the
cyclical position of the economy.
Monetary statistics and statistics relating to financial institutions
and markets
Each month the ECB compiles and disseminates a wide range of monetary statistics and
statistics relating to financial institutions and markets. Monetary aggregates and their
counterparts are calculated from the balance sheet of the monetary financial institution (MFI)

73
sector (see Section 2.7). These statistics also provide the basis for calculating the minimum
reserves that MFIs must hold with euro area national central banks (NCBs) (see Section 4.3).
Moreover, the ECB is in charge of statistics for credit institutions and money market funds,
which are both part of the MFI sector, as well as statistics for investment funds. The ECB also
compiles harmonised statistics on the interest rates applied by MFIs on loans to and deposits
from euro area households and firms. It produces detailed statistics on financial markets (e.g.
the euro area yield curve which is published every day).
Balance of payments and other external statistics
Balance of payments data for the euro area include the main transactions between euro area
residents and residents of countries outside the euro area. Along with external trade statistics,
they provide important information on how developments in exports and imports and the
respective price movements may affect inflationary pressures via their impact on demand
conditions. The ECB publishes effective exchange rates for the euro area and harmonised
competitiveness indicators for euro area countries. These indices contribute to the assessment
of the potential impact on import prices of movements in the exchange rate and changes in
commodity prices. In addition, the ECB publishes other external statistics, such as the quarterly
and annual statistics on the international investment position of the euro area, which provide an
overall picture of the euro area’s claims and liabilities vis-à-vis the rest of the world.
Euro area accounts
Economic and financial accounts for the euro area present financial transactions and
balance sheets for all economic sectors, such as households and financial and non-financial
corporations. These statistics show the different sectors’ financial investment and financing
activities, the development of wealth and debt, and the financial interrelationships between
the sectors. They follow the integrated approach outlined in the European system of national
and regional accounts (ESA 95). Among other applications, the statistics are required for an
analysis of the sources of portfolio shifts in financial balance sheets and for cross-checking
the consistency of the high-frequency data provided by monetary and financial statistics.
Government finance statistics
The ECB receives annual data necessary to assess convergence (i.e. a Member State’s
readiness to adopt the euro) and statistics relating to the excessive deficit procedure
and the Stability and Growth Pact. Annual government finance data cover revenue and
expenditure, government debt and the relationship between the government deficit and
changes in government debt. Quarterly government finance statistics (including data on
revenue and expenditure) form an important part of the integrated system of sectoral non-
financial and financial accounts for the euro area.
Surveys
Business and consumer tendency surveys provide leading and timely information for
quantitative indicators. Such surveys are carried out by the European Commission, commercial
data providers and statistical institutes. In addition, the Eurosystem conducts its own surveys
which facilitate a timely assessment of euro area financing conditions. A quarterly bank
lending survey provides information on supply and demand conditions in the euro area credit
markets and on the lending policies of euro area banks. A biannual survey on the access
to finance of small and medium-sized enterprises helps to assess enterprises’ financing
needs, the structure of financing and the availability of finance. The Survey of Professional
Forecasters provides information on expectations regarding euro area inflation, GDP growth
and unemployment rates by sector. A new survey on euro area households’ finance and
consumption will enhance the understanding of households’ economic decisions.
74
Developments in financial market
indicators and asset prices (see Box 3.5)
are also closely monitored under the
economic analysis to the extent that
movements in asset prices affect price
developments via income and wealth
effects. For example, as equity prices
rise, share-owning households become
wealthier and may choose to increase
their consumption. This will add to
consumer demand and may fuel domestic
inflationary pressures. Conversely, when
equity prices fall, households may well
reduce consumption.
Analysis of financial
market developments
Box 3.5 Extracting information from financial market prices
Financial market prices incorporate investors’ expectations about future economic
developments. As such, they are a valuable source of information for monetary policy-
makers. In particular, the term structures of nominal and real bond yields can be used to
gauge private sector expectations of future interest rates and inflation.
Forward rates, which represent the path of expected future short-term interest rates and
related risk premia, can be derived from the term structure of nominal bond yields. This
path is clearly important information for the central bank, as it indicates when and to what
extent market participants expect policy rates to change.
A joint analysis of nominal and real bond yields helps to gauge private sector inflation
expectations. The yield on a conventional nominal bond reflects three components: the
real interest rate, investors’ inflation expectations, and a risk premium, which compensates
investors for inflation uncertainty. The other required ingredient for extracting inflation
expectations is the yield on an inflation-linked bond. In the euro area, there is a large
market for these government debt instruments whose principal and coupon payments are
determined by inflation developments as measured by the HICP (excluding tobacco). In this
way, bond holders are essentially shielded from inflation risk, and the yields on the bonds
can be understood as measures of real interest rates. Accordingly, the difference between
a conventional nominal and an inflation-linked bond yield with the same residual maturity
represents investors’ inflation expectations and related inflation risk premia. This nominal/
real yield difference is known as the break-even inflation rate (BEIR).
Since BEIRs can be computed for various maturities, they are useful for monitoring
inflation expectations and related risk premia over a wide range of horizons. Moreover,
it is possible to derive forward BEIR measures from this term structure. For example, the
five-year forward break-even inflation rate five years ahead is a measure of the anchoring
of longer-term inflation expectations.
As BEIRs are based on daily financial market data, they provide information at a high
frequency. However, some caution is warranted in interpreting the signals from BEIRs.
First, the BEIRs reflect both “pure” inflation expectations and inflation risk premia.
Although certain econometric approaches based on asset pricing models address this
issue, the resulting decomposition into expectations and premia is subject to considerable
uncertainty. Second, some additional factors influence the trading and pricing of nominal
and inflation-linked bonds, such as, for example, bond market liquidity conditions or
strong flight-to-safety flows in times of financial stress, which usually have different
impacts on nominal and inflation-linked bonds. These factors can appreciably affect

75
Asset prices and financial yields can
also be analysed to derive information
about the expectations of the financial
markets, including expected future
price developments. For example, when
buying and selling bonds, financial
market participants implicitly reveal
their expectations about future
developments in real interest rates and
inflation. Using a variety of techniques,
the ECB can analyse financial prices to
extract the markets’ implicit
expectations about future developments.
Asset markets, and thus also asset
prices, are by their very nature forward-
looking. Changes in asset prices
therefore largely reflect “news” –
information about developments that
the asset markets had not been
expecting. In this sense, the monitoring
of asset prices might help to identify
shocks that are currently hitting the
economy, including shocks to
expectations about future economic
developments. In analysing financial
markets, statistical information on
financial asset prices from various
sources is assessed. On top of this, the
ECB collects certain statistical
information itself (see Box 3.4).
Developments in the exchange rate are
also closely assessed for their
implications for price stability. As
already discussed in Section 3.2,
exchange rate movements have a direct
effect on price developments through
their impact on import prices. Changes
in the exchange rate may also alter the
price-competitiveness of domestically
produced goods on international
markets, thereby influencing demand
conditions and potentially the outlook
for prices. If such exchange rate effects
alter the expectations and behaviour of
wage and price-setters, the potential for
second-round effects stemming from
the exchange rate may exist.
The ECB’s economic analysis has been
enhanced over time. This is largely due
to the progress made in the production
of euro area real economy and financial
statistics and in the analytical processing
Asset prices contain
information on private sector
expectations
Analysis of exchange rate developments
The economic analysis has been enhanced over time
measured BEIRs, without any underlying changes in inflation expectations and related
risk premia. Such influences, blurring the inflation-related information in BEIRs, were
particularly noticeable during various phases of the financial crisis that started in 2007.
For these reasons, it is crucial to cross-check information from BEIRs with signals
from other indicators. These may include survey measures of inflation expectations
(although available at a lower frequency), as well as other financial market instruments,
such as inflation swap rates. Inflation swaps are derivative instruments under which the
two contract parties agree to exchange a fixed payment with a payment that is linked
to actual inflation developments during the contract period. Using these instruments,
inflation expectations and related risk premia can be derived in a similar fashion as in the
case of BEIRs. At the same time, the factors that distort the information content of BEIRs
are not expected to affect inflation swaps simultaneously.
Besides the term structure of nominal and real interest rates, other asset prices contain
relevant information about private sector expectations. These include expectations of
the level and variability of future asset prices, but also, more indirectly, expectations
of future economic activity. Accordingly, the toolkit of monetary policy analysis also
includes methods for extracting market expectations from instruments such as exchange
rate futures or stock options.

76
of such information. Furthermore, a
number of analytical and empirical
models have been developed to better
assess and understand past and ongoing
developments, to make more reliable
short-term forecasts and to underpin
the regular macroeconomic projection
exercises for the euro area economy.
By monitoring incoming data and using
all the available analytical tools, a
comprehensive assessment of the
economic situation and the outlook for
the euro area can be conducted and
updated continuously.
The ECB publishes macroeconomic
projections for the euro area four times
a year in its Monthly Bulletin.
Eurosystem staff projections, which
are produced jointly by experts from
both the ECB and the euro area NCBs
twice a year, are published in the June
and December issues. ECB staff
projections are published in the March
and September issues. These staff
macroeconomic projection exercises
play an important role in the economic
analysis. They help to structure and
synthesise a large amount of economic
data and ensure consistency across
different sources of economic evidence.
In this respect, they are a key element
in sharpening the assessment of
economic prospects and the short to
medium-term fluctuations of inflation
around its trend.
Projections are referred to as such to
underline that they are the results of
a scenario based on a set of underlying
technical assumptions. Initially, staff
projections were conditioned on
a constant interest rate path. In fact,
it represents a scenario that is
unlikely to materialise in practice, since
monetary policy will always act
to address any threats to price stability.
Since June 2006 the underlying
assumption for short-term interest rates
has been based on market expectations.
The change was of a purely technical
nature, and was motivated by the
potential for further improvements in
the quality and internal consistency of
the projections. Given deviations
between the assumed interest rate path
and the actual outcome, it is clear that
the projection will not, in general, be
the best predictor of future outcomes,
in particular at somewhat longer
horizons. Therefore, the macroeconomic
projections of inflation by Eurosystem/
ECB staff should not, under any
circumstances, be seen as questioning
the commitment of the Governing
Council to maintaining price stability
over the medium term. Wage and price-
setters (i.e. the government, firms and
households) should rely on the ECB’s
quantitative definition of price stability
and especially the aim to keep inflation
below, but close to, 2% as the best
prediction of medium and long-term
price developments.
Staff macroeconomic projections
are produced using a number of tools
and inputs. Several different
macroeconometric models are available
for the euro area as well as for individual
member countries. In a situation of
model uncertainty, it is preferable to
employ a variety of them, embodying
various views of economic structure
and estimated using different
methodologies, rather than rely on a
unique and all-encompassing
framework. The projections produced
by these models are adjusted in the
light of the technical expertise of staff
both at the ECB and at the NCBs. They
are presented in the form of
ranges, thereby acknowledging the
inevitable uncertainty surrounding
macroeconomic projections. Various
methods have been applied to compute
Euro area macroeconomic
projections…
…based on technical
assumptions,…
…models and technical expertise of staff…

77
these ranges. Since December 2009 the
width of the ranges has been derived
from errors made in past staff
projections, where large errors are
identified as outliers and excluded from
the sample.
Although they play a useful role, the
staff macroeconomic projections have
their limitations. First, the final
projection depends to a considerable
extent on the underlying conceptual
framework and the techniques
employed. Any such framework is
bound to be a simplification of reality
and may on occasions neglect the key
issues that are relevant for monetary
policy. Second, economic projections
can only provide a summary description
of the economy and thus do not
incorporate all relevant information. In
particular, important information, such
as that contained in monetary
aggregates, is not easily integrated into
the framework used to produce the
projections, or information may change
after the projections are finalised.
Third, expert judgement is inevitably
incorporated into projections, and there
can be good reasons not to agree with
particular views. Fourth, projections
are always based on specific
assumptions – such as those concerning
oil prices or exchange rates – with
which it is possible to disagree or
which can change rapidly, making the
projections outdated. A further
consideration relates to the fact that the
degree to which forecasts prove reliable
tends to fall significantly as the length
of the forecasting horizon increases.
On some occasions, notably in the face
of uncertainty about the sustainability
of asset price movements, it may be
advisable for a central bank to set
interest rates in response to such
developments that might otherwise
impact on price stability at horizons
extending well beyond conventional
forecasting horizons.
Finally, with a view to the assumptions
usually underlying the models used for
forecasts, a central bank is well advised
to evaluate and compare the robustness
of the information stemming from
various sources. To fully assess the
economic situation and the outlook for
price stability, the Governing Council
must receive input based on a variety
of techniques and policy simulations
based on various models, and must use
its own judgement, particularly with
regard to the likelihood that certain
hypothetical scenarios will eventually
materialise. An articulated and broadly
based analysis of the economic forces
at work in the economy must therefore
always accompany the use of
projections.
For all these reasons, staff
macroeconomic projections play an
important but not all-encompassing
role in the ECB’s monetary policy
strategy. The Governing Council
evaluates them together with many
other pieces of information and forms
of analysis organised within the two-
pillar framework. These include
monetary analysis and analyses of
financial prices, individual indicators
and the forecasts of other institutions.
The Governing Council neither assumes
responsibility for the projections nor
does it use the staff projections as its
only tool for organising and
communicating its assessment.
Monetary analysis
The ECB’s monetary policy strategy
assigns a prominent role to monetary
analysis. This role reflects the robust
relationship between monetary growth
and inflation over the medium to long
run (Box 3.6 summarises several studies
…are useful, although
projections have some
limitations…
…which points to the need to use various sources and techniques
Overall, projections play an important, but not all-encompassing role
Money provides a nominal anchor

78
on this issue). This widely accepted
relationship provides a firm and reliable
nominal anchor for the conduct of
monetary policy, offering an insight into
trends in inflation persisting beyond the
horizons typically associated with
conventional inflation forecasts.
Assigning a prominent role to monetary
analysis in the ECB’s strategy therefore
also helps to underpin the medium-term
orientation of the single monetary policy.
In this respect, the monetary analysis
ensures adherence to a fundamental
principle: in responding to economic
developments, a central bank must never
lose sight of the need to ensure that the
rate of money growth is consistent with
price stability over sufficiently extended
horizons. By taking policy decisions and
evaluating their consequences not only
on the basis of the short-term indications
stemming from the analysis of economic
and financial conditions but also on the
basis of money and liquidity
considerations, a central bank can see
through the transient impact of the
various short-term shocks on the price
level and not be tempted to take an
overly activist course in determining the
monetary policy stance.
Box 3.6 Money and prices in the long run
The long-run link between money growth and inflation is one of the most robust
and enduring empirical findings in the entire economic literature. Importantly, this
relationship has been found to hold across time, countries and monetary policy regimes,
suggesting that it is “hardwired” into the structure of the economy.
The existence of a robust long-run relationship between money growth and inflation has
been documented for the euro area in a number of studies that use different empirical
techniques. For illustrative purposes, it is convenient to rely on statistical filtering methods
that disentangle fluctuations in money and inflation according to their different degrees
of persistence. In particular, this technique distinguishes the more persistent, trend-like
movements in money (the so-called “low-frequency component”) from movements that
exhibit shorter fluctuations associated with the business cycle and from movements
that reflect erratic and transitory developments (the “high frequency component”).
The evidence provided in Chart 3.2 confirms the long-run link between money and prices
in two respects: the low-frequency component of M3 growth moves closely in line with
the low-frequency component of inflation, and developments in trend money growth tend
to systematically lead developments in trend inflation.
A robust long-run link between money growth and inflation does not preclude the
existence of a close relationship also at higher frequencies. Indeed, empirical studies have
shown that the persistence of movements in money that are best linked to trend inflation
varies depending on the nature of the shocks hitting the economy. In general, however,
short-run movements in money tend to be affected by temporary shifts in money demand
and changes in the financial system that have no bearing on price developments, thereby
obscuring the link between money growth and inflation in the short run. For this reason,
the assessment of the short to medium-term inflation dynamics in the ECB’s monetary
policy framework relies mainly on the economic analysis.

79
The medium to long-term perspective
on risks to price stability provided by
the monetary analysis implies that the
link between short-term monetary
developments and monetary policy
decisions can never be direct. The
practical challenge is to identify the
unobserved underlying rate of monetary
expansion, i.e. the rate of money growth
that provides the relevant signal for
risks to price stability in the medium to
long term. The statistical filtering
A practical approach
to identifying monetary trends
The observation that the link between money growth and inflation is most robust in the
long run, i.e. in the trend movements of the two variables, does not challenge the policy
relevance of the relationship. Trend movements in inflation are central to monetary policy-
making: they are intimately related to long-term inflation expectations and, precisely
because of their persistent, trend-like nature, will exert a lasting influence on inflation that
must be taken into account when formulating monetary policy aimed at maintaining price
stability. In addition, it is important to appreciate that observed movements in inflation at
any point in time reflect movements in the components of all frequencies, including the
trend component. The advance information regarding movements in trend inflation that is
embedded in monetary trends is therefore of particular relevance for monetary policy.
Chart 3.2 Frequency decomposition of M3 and HICP
(annual percentage changes; deviations from mean)
High frequencies
-9
-6
-3
0
3
6
9
-9
-6
-3
0
3
6
9
1974 1982 1990 1998 2006
M3
HICP
-1.5
-1.0
-0.5
0.0
0.5
1.0
1.5
-1.5
-1.0
-0.5
0.0
0.5
1.0
1.5
1974 1982 1990 1998 2006
Business cycle frequencies Low frequencies
-4.5
-3.0
-1.5
0.0
1.5
3.0
4.5
-4.5
-3.0
-1.5
0.0
1.5
3.0
4.5
1974 1982 1990 1998 2006-8
-4
0
4
8
-8
-4
0
4
8
1974 1982 1990 1998 2006
M3
HICP
Sources: ECB, ECB calculations.

80
approach to the identification of
monetary trends discussed in Box 3.6 is
useful for illustrating the long-run link
between money and prices, but it is not
a reliable practical framework for
deriving policy assessments in real
time. The smoothing implicit in any
filtering approach requires the use of
both known past and unknown future
observations of money in order to
extract accurately the low-frequency
component at the end of the sample.
The ECB’s monetary analysis therefore
adopts a more practical approach to
identifying the underlying rate of
monetary expansion. This approach
entails a comprehensive analysis of
the liquidity situation, going well
beyond the headline M3 aggregate and
extending to a careful examination of
the balance sheet context of M3 growth
(i.e. the counterparts of M3 in the
consolidated balance sheet of the MFI
sector, in particular loans to the private
sector), as well as the composition of
M3 growth (i.e. the components and
sectoral contributions).
The approach draws on a complementary
use of expert knowledge and more
formal and structured methods,
involving a suite of models and
analytical tools (Box 3.7 provides an
overview of some of the tools regularly
employed). Expert knowledge of the
institutional features of the financial
and monetary sector helps to identify
the component of observed monetary
developments that is attributable to
transitory factors, such as, for instance,
changes in the tax treatment of interest
or capital income, or adjustments in
the portfolio allocation behaviour of
the money-holding sectors. Monetary
developments driven by such “special
factors” are not informative about the
outlook for price stability.
This approach is also relevant for the
operational use of the ECB’s reference
value for the growth of the broad
monetary aggregate M3. Deviations of
actual monetary developments from
this reference value can reflect both
transitory and more persistent factors.
Only the latter tend to have a bearing
on the trend of price developments.
Monetary policy hence does not react
mechanically to deviations of M3
growth from the reference value. Such
deviations, however, trigger increased
efforts to identify and assess the nature
and persistence of the forces responsible.
A much richer set of information than
M3 alone – including inter alia the
components and counterparts of M3 in
the banks’ balance sheet, the behaviour
of interest rate spreads and information
from the ECB’s bank lending survey –
is used to support these efforts. But the
concept of the reference value illustrates
the ECB’s commitment to conducting a
thorough analysis of monetary
developments and thus provides a
guarantee of this medium to long-term
orientation.
The robust long-run link between
money growth and price developments
enables assessments to be made
regarding the medium to long-term
risks to price stability without having
to take a specific view on the operation
of the transmission mechanism. At the
same time, the lags with which
protracted deviations of monetary
dynamics from historical norms lead
to risks to price stability can be long
and varying. This underlines the
importance of understanding the
channels through which monetary
dynamics ultimately have a bearing on
price developments. While trends in
monetary developments are the prime
focus of monetary analysis, persistent
deviations from those trends are
The ECB’s reference value for monetary growth
Monetary analysis focuses on the medium to long-term risks to price stability…

81
of particular interest insofar as they
have implications for asset market
dynamics. Monetary imbalances in the
form of excess money and credit
creation may manifest themselves in
higher asset prices before they can
become an active factor in determining
consumer price trends over the medium
to long term (this link is discussed in
Section 3.6).
The ECB’s monetary analysis aims to
identify the underlying rate of monetary
expansion that is robustly linked to
inflation dynamics over the medium to
longer term. At the same time, the
comprehensive analysis of monetary
and credit developments can provide
valuable insights into the operation
of the transmission mechanism. In this
latter respect, monetary analysis helps
sharpen the analysis of adjustments to
households’, firms’ and bank portfolios
in response to changes in the
yield configuration and in asset prices
more broadly. In addition, the detailed
analysis of bank balance sheets is
critical to the assessment of the
condition of the banking sector and
therefore the availability of funding
to the non-financial sector. Ultimately,
these types of insight are also
particularly helpful when forming a
view on the sustainability of a given
asset price configuration and the
observed trends in financial markets.
From this latter perspective,
incorporating a systematic analysis of
monetary imbalances into the policy
process in the form of a strategic
monetary pillar can offer a central
bank a tool which can be used to
assess whether financial market
developments are healthy and
sustainable, or rather a source of
potential threat for the stability of
prices and of the broader economy
over a longer horizon. In the latter case,
a monetary pillar can promote a sort
of “leaning against the wind” attitude
vis-à-vis financial imbalances which
can provide a valuable pre-emptive
line of defence against risks to price
stability that are likely to materialise in
the long term.
… and provides valuable insights
on the transmission
mechanism
Box 3.7 Tools for monetary analysis
The ECB’s monetary analysis has been significantly enhanced over past years. Through the
development of new tools, the operationalisation of the relationship between monetary trends
and underlying price level dynamics has become richer and better underpinned analytically.
Against this background, the box describes four categories of analytical tools that are regularly
and extensively used in the ECB’s monetary analysis: money demand models, structural
general equilibrium models with an active role for money and credit, money-based inflation
risk indicators and flow-of-funds analysis.
Money demand models are used to extract policy-relevant assessments from monetary
developments in two broad ways. First, they are used to quantify the contributions of the
various macroeconomic determinants to observed monetary growth. Such an analysis enables
a deeper understanding of the causes of monetary growth, which is necessary to form a view on
the underlying rate of monetary expansion. Second, the models are used to develop normative
benchmarks for the level of money or money growth that is consistent with price stability over
the medium term. However, deviations of actual money growth from such benchmarks should
be interpreted with caution. Such deviations may be reversed through a protracted period of
82
Cross-checking information
from the two pillars
Regarding the Governing Council’s
decisions on the appropriate stance of
monetary policy, the two-pillar
approach provides a cross-check of the
indications that stem from the shorter-
term economic analysis with those
from the longer term-oriented monetary
analysis. As explained in more detail
above, this cross-check ensures that
monetary policy does not overlook
important information relevant for
assessing future price trends.
All complementarities between the two
pillars are exploited, as this is the best
way to ensure that all the relevant
information for assessing price
prospects is used in a consistent and
efficient manner, facilitating both the
decision-making process and its
communication (see Chart 3.3).
This approach reduces the risk of policy
error caused by the over-reliance on a
single indicator, forecast or model.
By taking a diversified approach to the
interpretation of economic conditions,
the ECB’s strategy aims at adopting a
robust monetary policy in an uncertain
environment.
Cross-checking the two
analyses...
low money growth, rather than higher inflation, linked, for instance, to a deleveraging of the
money-holding sectors.
Structural general equilibrium models incorporating an active role for money and credit
offer a complementary approach to money demand modelling. These models offer scope
to identify the factors driving money and credit developments more precisely. They also
provide an internally consistent behavioural view of how money growth may be linked to
price developments, for instance, via expectational effects or asset price movements.
The process of forming a view on the underlying monetary trends and, ultimately, of
drawing implications for risks to price stability is first and foremost a judgemental
exercise of synthesising across models, tools, datasets and analyses. This exercise is,
however, complemented by the compilation of money-based inflation risk indicators.
These are empirical tools that exploit the leading indicator properties of smoothed
measures of monetary growth for average inflation over a medium-term horizon and
are therefore used to provide a summary measure of the risks to price stability over this
horizon signalled by the monetary data.
Flow-of-funds analysis draws on the consistent sectoral framework of the integrated euro
area accounts. It complements and enriches the monetary analysis based on MFI balance
sheets in three main ways. First, it expressly considers portfolio investment and financing
decisions across a broader set of financial instruments and a wider spectrum of financial
intermediation channels. Second, it is used to produce financial projections, which are part
of the regular macroeconomic projection exercises, to reconcile financial information with
the baseline implicit in real-sector projections and as an input for scenario analysis. Third,
in conjunction with indicators on real variables and asset prices, flow-of-funds analysis
provides additional insights into the working of the monetary transmission mechanism.
In the presence of continuous financial innovation and structural change, the analytical
tools used in monetary analysis must be constantly refined, extended and improved in
order to derive reliable and robust policy assessments. The ECB’s monetary analysis
therefore maintains a dynamic and constantly evolving analytical toolset.
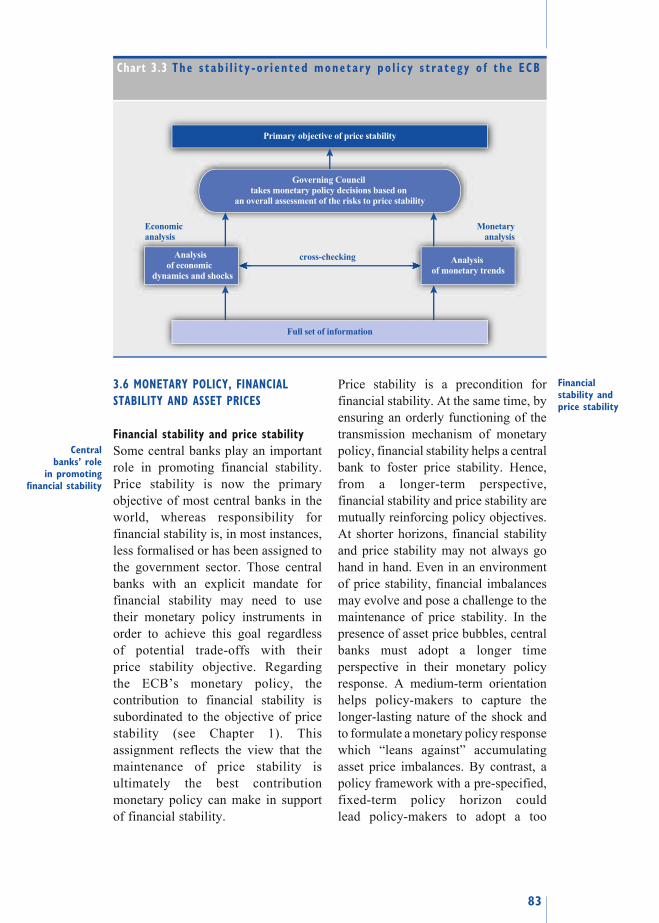
83
3.6 MONETARY POLICY, FINANCIAL
STABILITY AND ASSET PRICES
Financial stability and price stability
Some central banks play an important
role in promoting financial stability.
Price stability is now the primary
objective of most central banks in the
world, whereas responsibility for
financial stability is, in most instances,
less formalised or has been assigned to
the government sector. Those central
banks with an explicit mandate for
financial stability may need to use
their monetary policy instruments in
order to achieve this goal regardless
of potential trade-offs with their
price stability objective. Regarding
the ECB’s monetary policy, the
contribution to financial stability is
subordinated to the objective of price
stability (see Chapter 1). This
assignment reflects the view that the
maintenance of price stability is
ultimately the best contribution
monetary policy can make in support
of financial stability.
Price stability is a precondition for
financial stability. At the same time, by
ensuring an orderly functioning of the
transmission mechanism of monetary
policy, financial stability helps a central
bank to foster price stability. Hence,
from a longer-term perspective,
financial stability and price stability are
mutually reinforcing policy objectives.
At shorter horizons, financial stability
and price stability may not always go
hand in hand. Even in an environment
of price stability, financial imbalances
may evolve and pose a challenge to the
maintenance of price stability. In the
presence of asset price bubbles, central
banks must adopt a longer time
perspective in their monetary policy
response. A medium-term orientation
helps policy-makers to capture the
longer-lasting nature of the shock and
to formulate a monetary policy response
which “leans against” accumulating
asset price imbalances. By contrast, a
policy framework with a pre-specified,
fixed-term policy horizon could
lead policy-makers to adopt a too
Central banks’ role
in promoting financial stability
Financial stability and price stability
Chart 3.3 The s tab i l i t y -o r i en ted moneta ry po l i c y s t ra tegy o f the ECB
Analysis of economic
dynamics and shocks
Analysis of monetary trends
cross-checking
Economic analysis
Monetaryanalysis
Primary objective of price stability
Governing Council takes monetary policy decisions based on
an overall assessment of the risks to price stability
Full set of information
84
short-sighted perspective of the risks
to price stability, and possibly to
destabilise inflation expectations.
Central banks’ response to asset prices
At times, asset prices seem to rise
beyond levels that are considered
consistent with an appropriate valuation
of the underlying asset. Such
developments may indicate the existence
of a “bubble” in the asset market, i.e. a
rapid and sustained increase in prices
that is bound to revert – possibly in a
disruptive manner – at some time in the
future. When asset price bubbles
emerge, the information content of asset
prices becomes blurred. In normal
times, asset prices are very important
information variables. Asset prices are
inherently forward-looking variables, in
the sense that they are determined
mainly by market participants’
expectations of the future evolution of
their underlying pay-offs. But, when a
bubble forms, expectations of the
productive potential of the underlying
asset might come to reflect excessively
optimistic beliefs.
The formation of bubbles can distort
the allocation of resources in the
economy and harm macroeconomic
stability for a prolonged period of
time. Given its implications for
macroeconomic stability, an asset price
collapse – when expectations of
excessive returns are sharply corrected
– can mark the beginning of periods of
economic contraction. Whenever the
building-up of a bubble is associated
with excess credit and liquidity
creation, asset price crashes can
become the cause of deflationary
trends. Following the collapse of an
asset price bubble, the economy may
undergo an extended period of
adjustment with below-average growth
rates until it stabilises.
Asset price bubbles therefore pose an
important challenge for the monetary
policy strategy of a central bank.
In order to detect a speculative bubble,
it is necessary to have a good
understanding of what the “correct”
valuation of assets is likely to be. Such
benchmark scenarios are normally
subject to considerable uncertainty.
Against this background, it may be
difficult for policy-makers to identify
asset price bubbles in real time.
This holds especially true in the nascent
stage of a bubble. As a result, asset
price bubbles can often only be
identified with some degree of
confidence ex post.
While the above difficulties in detecting
bubbles are certainly serious, economic
history suggests that concomitant and
mutually reinforcing signs of “excesses”
may sound an alarm bell that an asset
price bubble is forming. For example,
aggregate indicators of monetary and
financial imbalances can provide
evidence that helps assess the
sustainability of an asset price boom.
Among these latter indicators, intense
empirical research has identified a
number of monetary and financial
variables that seem to have a clear
correlation with asset price inflation,
particularly during asset price bubbles
that end in financial distress. Of these
variables, the volume of aggregate
credit demonstrates a fairly systematic
leading relationship with episodes of
asset price turbulence.
The literature has discussed several
approaches by which a central bank
could respond to asset price bubbles.
The most radical approach is to include
asset prices directly in the price index
defining price stability. Targeting asset
prices in a similar way to consumer
prices – whether by inclusion in a
Asset price bubbles…
…may threaten the economy…
…and are difficult to identify in real time
Indicators of emerging financial imbalances
Monetary policy responses to asset price bubbles
85
broadened price index or otherwise –
is, however, not a reasonable approach.
It would most likely lead to a policy
whereby the bubble is pricked by
monetary policy, which would inject
unnecessary instability into the economy.
A further option, which was supported
by many central bankers prior to the
global financial crisis, is to refrain from
using monetary policy to address an
asset price bubble but instead “clean up”
its effects after it has burst.
The option – “pricking” bubbles by
means of monetary policy – is not
viable for a stability-oriented monetary
policy. Such an approach would require
a strong tightening of the policy stance
in order to counter speculation when a
bubble is detected. It would also
adversely affect growth perspectives,
and may therefore pose serious risks
for the entire economy. Moreover, a
bubble could initially prove resilient to
aggressive interest rate hikes, thus
increasing the risk that monetary policy
overreacts. Similarly, experience
gained during the financial crisis has
challenged the conventional wisdom
according to which central banks
should let asset price bubbles burst
naturally, rather than acting to contain
them, and then ease policy aggressively
to repair its adverse macroeconomic
fallout. This policy – if conducted
systematically – can introduce a bias in
the stance of monetary policy which
can increase the probability of a bubble
forming in the first place.
An approach which has gained
increasing popularity over time is to
“lean against the wind” of financial
market excesses. Such an approach
does not entail targeting any particular
asset price or index. Rather, it aims to
incorporate an analysis of risks to price
stability over medium to long-term
horizons stemming from asset price
developments into the overall
comprehensive assessment supporting
monetary policy decisions. Thus, the
central bank would adopt a somewhat
tighter policy stance in the face of an
inflating asset market than it would
have done if confronted with a similar
macroeconomic outlook under more
normal market conditions. In this way
a central bank would, at an earlier stage
of market dynamics, err on the side of
caution by trying to avoid feeding the
bubble with an accommodative policy.
An important argument in favour of the
“leaning against the wind” approach is
its implicit symmetry. In contrast to the
“clean up” approach according to which
monetary policy mainly acts in support
of the economy when asset prices have
sharply declined, interest rates would
already be used in order to counter the
build-up of an asset price bubble.
Moreover, and unlike the “asset price
targeting” approach, the policy reaction
would not be automatic but involve a
degree of judgement concerning the
source of the bubble and the state of the
economy when the bubble occurs.
In this respect, the ECB’s two-pillar
monetary policy strategy offers an
appropriate framework to reveal the
conditions and circumstances in which
a sustained trend development in asset
prices can have negative implications
for macroeconomic stability. While
the ECB does not target asset prices, it
closely monitors phenomena –
mounting excesses in the creation of
money and credit – which, if detected
in conjunction with sustained market
dynamics, can reveal the nature of the
financial facts and provide information
on whether these financial facts should
be taken into account in tracing out the
policy course. Monetary analysis helps
“Pricking” bubbles can be
costly
The “leaning against
the wind” approach…
…has advantages
The ECB’s monetary policy strategy takes asset price developments into account
86
to assess developments in asset prices
and the degree to which they pose a
risk to price stability in a more distant
future. This is how elements of the
“leaning against the wind” approach
have been incorporated in the ECB’s
strategy. Furthermore, a regular cross-
check of the outcome of the economic
analysis with that of the monetary
analysis lengthens the horizon over
which the ECB traces the likely
developments in consumer prices.
Thanks to the medium to long-term
perspective provided by the monetary
pillar and the systematic monitoring of
monetary and credit developments
conducted within the monetary
analysis, the two-pillar strategy does
not overlook the potential role of such
developments as driving forces of
consumer price inflation in the medium
to long run.
3.7 TRANSPARENCY
AND COMMUNICATION
Central bank independence,
accountability and transparency
As explained in Chapter 1, there are
good reasons to entrust the task of
maintaining price stability to an
independent central bank, which is not
subject to potential political pressure.
At the same time, in democratic
societies, central bank independence
needs to be balanced with accountability
to the public and its elected
representatives. Accountability can be
understood as the legal and political
obligation of an independent central
bank to properly explain and justify its
decisions to the citizens and their
elected representatives, thereby holding
the central bank responsible for
fulfilling its objective. Accountability
is a fundamental precondition for, and
a core element of, democratic
legitimacy. A clearly defined mandate
is the basis for the democratic legitimacy
of delegating monetary policy to an
independent central bank, and an
overriding focus on the mandate of
price stability enables the public to
hold an independent central bank more
easily accountable. In this sense,
accountability imposes discipline on
the central bank to perform its tasks
with high levels of professionalism.
The appropriate channels for ensuring
the accountability of a central bank
depend on the institutional framework
and on the bank’s mandate. As a body
established by virtue of the Treaties,
and acting within the limits of the
powers conferred upon it, the ECB has
the statutory task of maintaining price
stability and of performing other central
banking functions for the euro area as a
whole. Therefore, the ECB is
accountable first and foremost to EU
citizens, and – more formally – to the
European Parliament, which is the only
European institution directly elected by
EU citizens.
The ECB’s relationship with the
European Parliament fully respects
central bank independence. The Treaty
on the Functioning of the European
Union sets down a number of reporting
requirements for the ECB (e.g. the
presentation of the Annual Report by
the President to the European Parliament
and the EU Council) and provides that
the President (and other Executive
Board members on an ad hoc basis)
may appear before the European
Parliament, with a view to ensuring
accountability (see Chapter 1).
A concept closely related to yet distinct
from accountability is that of central
bank transparency. Transparency can
be defined as an environment in which
the central bank provides the general
Independence and transparency
The ECB is accountable to EU citizens
The ECB’s relations with the European Parliament
Transparency
87
public and the markets with all relevant
information on its strategy, assessments
and policy decisions as well as its
procedures, and does so in an open,
clear and timely manner. Today, most
central banks, including the ECB,
consider transparency to be a crucial
component of their monetary policy
framework, emphasising the importance
of effective communication and proper
interaction with the public. Ultimately,
all efforts to enhance transparency are
aimed at ensuring that monetary policy
is better understood by the public and
therefore becomes more credible and
effective.
First and foremost, transparency
requires the central bank to clearly
explain how it interprets its mandate
and to be forthcoming about its policy
goals. This helps the public to monitor
and evaluate the central bank’s
performance. In addition, the central
bank needs to explain the analytical
framework used for its internal
decision-making and its assessment of
the state of the economy, and to
frequently make clear the economic
rationale underlying its policy decisions.
In this respect, transparency can be
enhanced by providing a systematic
framework for both internal decision-
making and external communication
with the public, in particular by means
of a publicly announced monetary
policy strategy. The bank’s overriding
concern with regard to transparency
must be the effectiveness of monetary
policy in meeting its statutory
objectives. Transparency can render
monetary policy more effective for
several reasons.
First, being clear about its mandate and
how it goes about fulfilling it helps a
central bank to foster credibility. When
a central bank is perceived as being
able and willing to achieve its policy
mandate, inflation expectations are
well anchored. In this respect, frequent
communication about the central bank’s
assessment of the economic situation is
particularly useful. Furthermore, it is
helpful for central banks to be open and
realistic about what monetary policy
can do and, even more importantly,
what it cannot do (see Section 3.1).
Second, a strong commitment to
transparency imposes self-discipline on
policy-makers. This helps to ensure that
their policy decisions and explanations
are consistent over time. Facilitating
public scrutiny of monetary policy actions
enhances the incentives for the decision-
making bodies to fulfil their mandates in
an appropriate manner.
Third, by publicly announcing its
monetary policy strategy and
communicating its regular assessment of
economic developments, the central bank
provides guidance to the markets so that
expectations can be formed more
efficiently and accurately. This helps the
markets to understand the systematic
response pattern of monetary policy to
economic developments and shocks and
thus to anticipate the broad direction of
monetary policy over the medium term,
making policy moves more predictable.
Such predictability is important for the
conduct of monetary policy: while central
banks only directly control very short-
term interest rates, the expected path of
these rates over longer horizons and the
premia for uncertainty are also significant
for the transmission of monetary policy to
the economy. If agents can broadly
anticipate policy responses, this allows a
rapid incorporation of any (expected)
changes in monetary policy into financial
variables. This in turn can shorten the
process by which monetary policy is
transmitted into investment and
What makes a central bank
transparent?
Transparency fosters
credibility,…
…imposesself-discipline on policy-makers…
…and provides guidance to the markets

88
consumption decisions and accelerate any
necessary economic adjustments, thus
potentially enhancing the effectiveness of
monetary policy.
The communication role of the ECB’s
monetary policy strategy
In order to promote a better understanding
of monetary policy, the main aspects of
the process of monetary policy-making
should be made understandable for the
general public. In practice, however, it is
difficult to provide the public with a
completely exhaustive and intelligible
communication of all the detailed
elements and aspects of the internal
monetary policy-making process while
at the same time ensuring that this
information is properly understood.
Therefore, in presenting monetary policy
to the public, various choices have to be
made. Transparency means more than
simply releasing information. It also
requires structuring that information in
such a way that it can be understood by
the public. Transparency has helped to
solidly anchor inflation expectations. By
publicly announcing its monetary policy
strategy and communicating its regular
assessments of the risks to price stability
in a transparent manner, the ECB has
achieved a high degree of predictability,
thus making monetary policy more
effective. Indeed, the ability of financial
markets to predict monetary policy
decisions has generally increased over
the last decade. The ECB’s transparent
approach has enhanced the markets’
understanding of monetary policy.
However, efforts to convey a clear
message should not detract from the
need to explain the actual nature of
policy-making. Any communication
must reflect the fact that monetary policy
has to operate in a complex, uncertain
and constantly evolving environment.
The external communication of the
ECB’s monetary policy strategy places
a premium on faithfully reflecting this
environment. The external presentation
of the ECB’s strategy may be relatively
complex compared with some other
strategies (such as monetary targeting or
inflation targeting, see Box 3.3), but it
realistically reflects the diversified
approach to monetary policy that the
ECB has adopted for its internal decision-
making. Effective communication also
requires the central bank to address a
variety of audiences and to use a variety
of channels. To this end, in its
communication activities, the ECB
has gone beyond the formal
requirements of the Treaty on the
Functioning of the European Union in
adopting additional means of ensuring
accountability and transparency
(see Box 3.8).
Presentation of monetary policy to the
public…
…needs to take into account
the complexity of policy-making…
…and be consistent with internal decision-making

89
Box 3.8 Key communication channels used by the ECB
The monthly press conferences held by the President and the Vice-President and
the Monthly Bulletin are two of the most important communication channels used
by the ECB. The President’s introductory statement at the press conference provides a
comprehensive summary of the policy-relevant assessment of economic developments.
It is structured along the lines of the ECB’s monetary policy strategy and its text is agreed
by the Governing Council. The monthly press conference includes a question and answer
session, which is attended by various media representatives from across the euro area and
beyond, and provides a platform for a timely and even-handed explanation of monetary
policy decisions to the public. Transcripts of the press conference are made available on
the ECB’s website only a few hours later. The press conference is therefore an effective
means of presenting and explaining the discussions in the Governing Council and thus
the monetary policy decision-making process.
The Monthly Bulletin provides the general public and the financial markets with a detailed and
comprehensive analysis of the economic environment. It is usually published one week after
the meeting of the Governing Council and contains the information that the Governing Council
possessed when it took its policy decisions. The Monthly Bulletin also contains articles which
provide insights into long-term developments, general topics or into the analytical tools used
by the Eurosystem within the framework of the monetary policy strategy.
In addition, the President of the ECB appears four times a year before the European
Parliament’s Committee on Economic and Monetary Affairs. The President explains the
ECB’s policy decisions and then answers questions posed by Committee members. The
Committee meetings are open to the public and the transcripts of the President’s testimonies
are subsequently published on the websites of both the European Parliament and the ECB.
Other members of the Executive Board of the ECB also appear before the Committee.
The members of the Governing Council take on numerous public engagements. Speeches
by the President and other members of the Executive Board and Governing Council are
important tools for explaining the ECB’s views to the public. Another major channel for
reaching international as well as local target groups is interviews granted by Governing
Council members. The ECB also receives a large number of visits from members of the
general public as well as experts from a variety of institutions. It is committed to open
dialogue with the academic world. Research results of a technical nature and policy-
related studies of general interest are published by staff members in the ECB’s Working
Paper and Occasional Paper series respectively.
Finally, the transparency of monetary policy also requires that the statistical data
collected by the central bank (see Box 3.4) be published, once their reliability has been
confirmed. The timely publication of the data enables the ECB to share with the public
the information it possesses on economic developments in the euro area and thereby
facilitates the communication of monetary policy decisions by the Governing Council.
Given that the Eurosystem is obliged to communicate in a multicultural and multilingual
environment, the NCBs are essential players in the communication strategy. They
maintain close contact with national and regional audiences, translating the policy signals
into different languages and tailoring them to the national context.

90
3.8 THE ECB’S MONETARY POLICY
STRATEGY: A GUIDEPOST
IN THE FINANCIAL CRISIS
The ECB’s response to the financial
crisis
A good strategy should be appropriate
both in normal times and when policy-
makers face heightened uncertainty.
During the financial crisis, the ECB’s
monetary policy strategy continued
to perform its role as a guidepost
for monetary policy decisions.
The experience gained throughout the
crisis has demonstrated the robustness
and effectiveness of the two-pillar
framework. It enabled the Governing
Council to adopt a broad set of measures
and to focus on price stability over
the medium term. Indeed, the main
elements of the strategy have provided
useful guidance in formulating and
explaining the ECB’s monetary policy
since the introduction of the euro
(see Chapter 5).
In response to the financial crisis, the
Eurosystem has taken measures that are
unprecedented in nature, scope and
magnitude. They represent an
extraordinary response to exceptional
circumstances in a context of unusally
high uncertainty and instability in
financial markets. In addition to
conventional interest rate cuts to
historically low levels, the Governing
Council decided to adopt non-standard
measures comprising Enhanced Credit
Support and the Securities Markets
Programme (see Box 5.1).
The ECB’s formal exit strategy
comprises a set of principles to guide it
in phasing out the various non-standard
measures adopted during the financial
crisis. An accommodative monetary
policy for an overly long period risks
the emergence of inflationary pressures
in the future and also paves the way for
imbalances in the financial markets.
Against the background of extremely
low interest rates and abundant liquidity,
the central bank’s credible commitment
to unwind the standard and non-standard
measures once conditions returned to
normal was of the essence. Indeed, it
was emphasised by the ECB that the
non-standard measures were designed
with exit considerations in mind. At the
same time, to avoid premature
expectations of an exit, the ECB stressed
that having an exit strategy in place was
not to be confused with activating this
exit. The ECB also explained in detail
the rationale underlying the introduction
and phasing-out of its non-standard
measures.
The ECB’s communication during
the financial crisis
As explained in Section 3.7,
communication is an important element
of the ECB’s monetary policy strategy.
As an essential tool for managing the
expectations of the private sector, it
makes a significant contribution to
enhancing the effectiveness and
credibility of monetary policy. This is
particularly important during periods
of heightened uncertainty. Throughout
the financial crisis and in its aftermath,
the aim of the ECB’s communication
has been to explain the reasoning
behind the exceptional measures
introduced and to contribute to restoring
private sector confidence in the
economy and the functioning of
markets. In this respect, the ECB has
provided timely and factual information
in order to be as transparent as possible
given the extraordinary circumstances.
The ECB’s communication since the
onset of the financial turmoil in August
2007 has largely contributed to keeping
longer-term inflation expectations in
the euro area firmly anchored at levels
Non-standard measures
The ECB’s exit strategy
Communication as a tool to preserve confidence

91
consistent with the ECB’s definition of
price stability (see Chart 3.4).
The ECB has communicated that its
exit from the non-standard measures
relies on four cornerstones.
One cornerstone of the exit strategy is
the close link to the ECB’s monetary
policy strategy and the primary
objective of price stability. This implies
that the non-standard measures could
be maintained as long as significantly
abnormal tensions, credit distortions
and the impairment of the monetary
policy transmission mechanism
persist. As soon as their continuation
poses a threat to the achievement of
price stability, however, their prompt
withdrawal is unavoidable.
A second cornerstone is the forward-
looking initial design of the measures.
All non-standard measures are of a
temporary nature and, to a certain
degree, have built-in and self-correcting
mechanisms. The overwhelming
majority of measures were designed
to phase out automatically unless
expressly maintained.
The third conceptual cornerstone of the
exit strategy is the ECB’s permanent
ability to act, i.e. the technical and
institutional capability to take
appropriate decisions and to implement
them whenever circumstances
warrant. This condition is supported
by the operational framework of
the Eurosystem and the institutional
independence provided by the Treaties.
The fourth cornerstone is the credibility
of the Eurosystem and its reputation for
acting when deemed appropriate. The
ECB has earned this reputation thanks
to its clear track record established over
the first decade of EMU. The ECB’s
credible commitment to maintaining
price stability helped to stabilise
inflation expectations in the euro area
throughout the crisis.
Cornerstones of the exit
strategy
Chart 3.4 Inflation expectations in the euro area
(annual percentage changes)
-1
0
1
2
3
4
5
-1
0
1
2
3
4
5
6 6
1990 1992 1994 1996 1998 2000 2002 2004 2006 2008 2010
Stage Threeof EMU
HICP inflation
five-year forward five years ahead BEIR upper bound of definition of price stability
HICP inflation expectations (SPF) for the five-year period ahead
longer-term inflation expectations (six to ten years)
Sources: ECB, Eurostat, Reuters and Consensus Economics.
Note: BEIR refers to break-even inflation rate.


93
4 MONETARY POLICY IMPLEMENTATION
This chapter explains how the Eurosystem implements monetary policy
decisions using its monetary policy instruments. The first section gives an
overview of the objectives and general principles that govern the functioning
of the Eurosystem’s operational framework. The second section briefly
describes the main monetary policy instruments (open market operations,
the minimum reserve system and the standing facilities), while the subsequent
sections examine these in greater detail and present the interaction between
the monetary policy instruments and the banks’ liquidity needs in the context
of a central bank balance sheet. The final section provides a brief assessment
of the operational framework’s performance in the first 12 years of the single
monetary policy.
4.1 OBJECTIVES AND GENERAL
PRINCIPLES BEHIND THE DESIGN
OF THE OPERATIONAL FRAMEWORK
As discussed in Chapter 3, short-term
money market rates play a pivotal role
in the transmission of monetary policy.
By steering such rates, monetary policy
exerts significant influence over
short-term nominal market interest
rates and, through various channels,
over the spending decisions of
companies and households, monetary
and financial developments and,
ultimately, the price level.
In order to achieve its primary objective
of maintaining price stability for the
euro area as a whole, the Eurosystem
uses a set of monetary policy instruments
and procedures. These provide
the operational framework for the
implementation of monetary policy
decisions in practice.
The operational framework and the
monetary policy strategy each have
a specific role in the implementation
of monetary policy. The strategy
determines which level of money market
interest rates is required to maintain
price stability over the medium term,
whereas the operational framework
determines how to achieve this interest
rate level using the available monetary
policy instruments and procedures.
A central bank steers short-term money
market rates by signalling its monetary
policy stance through its decisions on
key interest rates and by managing the
liquidity situation in the money market.
The central bank, as the sole issuer of
banknotes and bank reserves, is the
monopoly supplier of the monetary
base. The monetary base of the euro
area consists of currency (banknotes
and coins) in circulation, the reserves
held by counterparties with the
Eurosystem and recourse by credit
institutions to the Eurosystem’s deposit
facility. These items are liabilities on
the Eurosystem’s balance sheet.
Reserves can be broken down further
into required and excess reserves.
In the Eurosystem’s minimum reserve
system, counterparties are obliged to
hold reserves with the national central
banks (NCBs) (see Section 4.3).
In addition to these required reserves,
credit institutions usually hold only a
small amount of voluntary excess
reserves with the Eurosystem. This
may, however, be different in periods
The money market and the transmission of
monetary policy
The operational framework…
…and the monetary policy
strategy
The functions of the operational framework include steering short-term interest rates and managing liquidity, …

94
of acute financial market tensions. By
virtue of its monopoly, a central bank is
able to manage the liquidity situation in
the money market and influence money
market interest rates. Broadly speaking,
the Eurosystem allocates an amount of
liquidity that allows euro area credit
institutions to fulfil their liquidity needs
at a price that is in line with its signalled
policy intentions, as reflected in the
key interest rates set by the ECB.
In addition to steering interest rates by
managing liquidity, a central bank can
also signal its monetary policy stance
to the money market. To signal a
change in the monetary policy stance,
a central bank usually changes the
conditions under which it is willing to
enter into transactions with credit
institutions. The most obvious of these
are the key interest rates set by the
central bank.
In its operations, a central bank also
aims to ensure an orderly functioning
of the money market and to help credit
institutions to meet their liquidity needs
in a smooth manner. This is achieved
by providing regular refinancing to
credit institutions, as well as facilities
that allow them to deal with end-of-day
imbalances and transitory liquidity
fluctuations.
The operational framework of the
Eurosystem is based on a number of
guiding principles. These principles act
in a complementary and mutually
reinforcing manner. The overriding
principle is operational efficiency.
This can be defined as the capacity of
the operational framework to enable
monetary policy decisions to feed
through as precisely and as quickly as
possible to short-term money market
rates. These in turn affect the price
level through the various channels of
the monetary policy transmission
mechanism. In other words, operational
efficiency ensures the signalling and
transmission of monetary policy.
As regards effective signalling, the
operational framework needs to allow
the determination of the monetary policy
stance to be kept separate from liquidity
management. Specifically, this implies a
strict distinction between, on the one
hand, monetary policy decisions that are
geared towards the maintenance of price
stability and, on the other hand, liquidity
operations intended to keep market
interest rates close to the level determined
by the monetary policy stance.
To ensure the efficient transmission
of monetary policy, the operational
framework has to be consistent with the
principles of a market-oriented economy
in which competition is key to ensuring
the efficient allocation of resources.
This principle is enshrined in the Treaty
on the Functioning of the European
Union. Article 127 of the Treaty
states that, in pursuing its objectives,
the Eurosystem “… shall act in
accordance with the principle of an open
market economy with free competition,
favouring an efficient allocation of
resources …”. The proper functioning
of the interbank market is vital to the
transmission of monetary policy from
the very short end of the money market
to the real economy and prices.
Other important principles are equal
treatment of financial institutions and
the harmonisation of rules and
procedures throughout the euro area.
Given the area-wide focus, credit
institutions must be treated equally
across the euro area, irrespective of their
size or location. This harmonisation of
rules and procedures aims to ensure
equal treatment by providing identical
…signalling the monetary
policy stance, …
…and ensuring an orderly functioning
of the money market
The key principles of
the operational framework are
operational efficiency, …
…separation between monetary policy formulation and implementation, …
…and market orientation
Other guiding principles are equal treatment, harmonisation, …
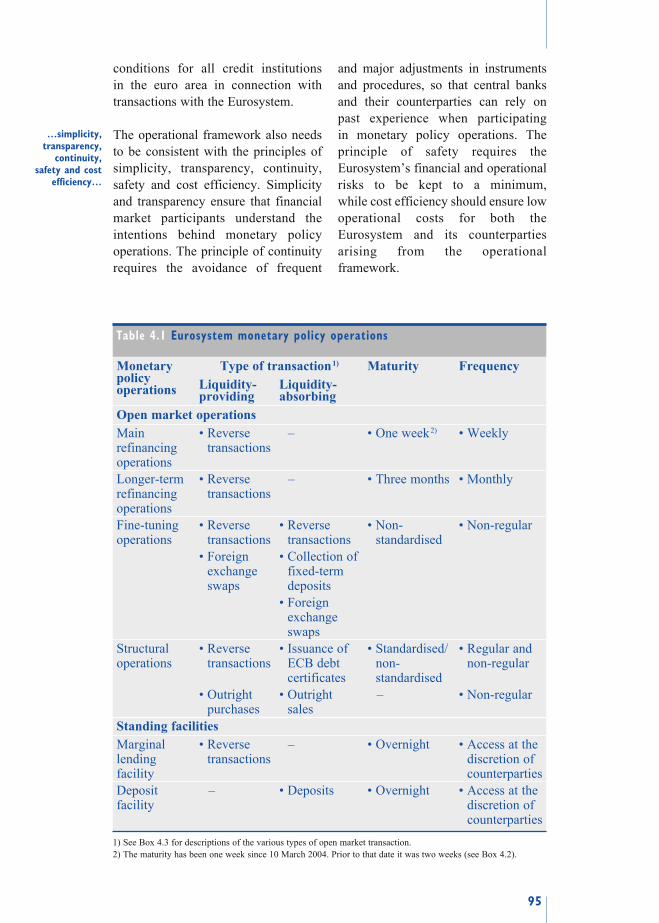
95
conditions for all credit institutions
in the euro area in connection with
transactions with the Eurosystem.
The operational framework also needs
to be consistent with the principles of
simplicity, transparency, continuity,
safety and cost efficiency. Simplicity
and transparency ensure that financial
market participants understand the
intentions behind monetary policy
operations. The principle of continuity
requires the avoidance of frequent
and major adjustments in instruments
and procedures, so that central banks
and their counterparties can rely on
past experience when participating
in monetary policy operations. The
principle of safety requires the
Eurosystem’s financial and operational
risks to be kept to a minimum,
while cost efficiency should ensure low
operational costs for both the
Eurosystem and its counterparties
arising from the operational
framework.
…simplicity, transparency,
continuity, safety and cost
efficiency…
Table 4.1 Eurosystem monetary policy operations
Monetary policy operations
Type of transaction 1) Maturity FrequencyLiquidity- providing
Liquidity- absorbing
Open market operationsMain refinancing operations
• Reverse transactions
– • One week 2) • Weekly
Longer-term refinancing operations
• Reverse transactions
– • Three months • Monthly
Fine-tuning operations
• Reverse transactions
• Reverse transactions
• Non-standardised
• Non-regular
• Foreign exchange swaps
• Collection of fixed-term deposits
• Foreign exchange swaps
Structural operations
• Reverse transactions
• Issuance of ECB debt certificates
• Standardised/ non-standardised
• Regular and non-regular
• Outright purchases
• Outright sales
– • Non-regular
Standing facilities Marginal lending facility
• Reverse transactions
– • Overnight • Access at the discretion of counterparties
Deposit facility
– • Deposits • Overnight • Access at the discretion of counterparties
1) See Box 4.3 for descriptions of the various types of open market transaction.
2) The maturity has been one week since 10 March 2004. Prior to that date it was two weeks (see Box 4.2).

96
Finally, one principle that is specific to
the Eurosystem is the decentralisation of
the implementation of monetary policy.
In accordance with this principle,
the Eurosystem’s monetary policy
operations are normally implemented
through the NCBs, which means that
the ECB coordinates the operations,
while the transactions are carried out
by the NCBs.
4.2 OVERVIEW OF THE EUROSYSTEM’S
OPERATIONAL FRAMEWORK
The Eurosystem’s operational
framework is described in greater
detail in the ECB publication entitled
“The implementation of monetary
policy in the euro area – General
documentation on Eurosystem monetary
policy instruments and procedures”.
The Eurosystem uses two types of
operation: open market operations and
standing facilities. Table 4.1 provides
an overview of the essential features of
these operations. The most important
operations are open market operations.
This is the term used for operations that
are conducted on the initiative of the
ECB, usually in the money market.
As described in Section 2.6, “ money
market” refers to the market in which
the maturity of transactions is generally
less than one year. Open market
operations include main refinancing
operations (MROs), longer-term
refinancing operations (LTROs), fine-
tuning operations (FTOs) and structural
operations. These operations play an
important role in steering interest rates,
signalling the stance of monetary policy
and managing the liquidity conditions
for the euro area banking sector.
MROs are the most important open
market operations and represent the
key monetary policy instrument of the
Eurosystem. Through MROs, the
Eurosystem lends funds to its
counterparties. In order to protect the
Eurosystem against financial risks,
lending is always against adequate
collateral. For more detailed
information on the Eurosystem’s
counterparties and on the collateral
required in its liquidity-providing
operations, see Box 4.1.
…as well as decentralised
implementation
Open market operations
Main refinancing operations
Box 4.1 Counterparties and collateral
1. Counterparties
The Eurosystem’s monetary policy framework is formulated with a view to ensuring
the participation of a broad range of counterparties. Counterparties to Eurosystem
monetary policy operations must fulfil certain eligibility criteria. These criteria are
defined in such a way as to ensure equal treatment for institutions across the euro area
and that counterparties fulfil certain operational and prudential requirements. The general
eligibility criteria are uniform throughout the euro area.
To be an eligible counterparty, a credit institution must be subject to the Eurosystem’s
minimum reserve system and at least one form of harmonised European Union/
European Economic Area (EU/EEA) supervision by national authorities, as well as being
financially sound. Financially sound institutions operating in the euro area and subject to
non-harmonised supervision by competent national authorities of a standard comparable
to harmonised EU/EEA supervision may also be accepted as counterparties (e.g. branches

97
established in the euro area of institutions incorporated outside the EEA). In addition,
counterparties must fulfil any operational criteria specified in the relevant contractual
or regulatory arrangements applied by their NCB (or by the ECB), so as to ensure the
efficient conduct of Eurosystem monetary policy operations. At the end of January 2011
there were 6,334 credit institutions established in the euro area. However, only 2,267
fulfilled the operational criteria for participation in open market operations, 2,395 the
operational criteria for access to the marginal lending facility and 2,789 the operational
criteria for access to the deposit facility.
The number of counterparties actually participating in open market operations is normally
much lower than the number of eligible counterparties. In the second half of 2010 the
number of counterparties participating in tenders for MROs averaged 145. The average
number of counterparties participating in LTROs was 94.
The Eurosystem may select a limited number of counterparties to participate in FTOs.
For foreign exchange swaps conducted for monetary policy purposes, the Eurosystem
uses active players in the foreign exchange market which are established in the
euro area.
A credit institution fulfilling the general eligibility criteria may access the Eurosystem
standing facilities and participate in Eurosystem open market operations based on
standard tenders through the NCB of the Member State in which it is incorporated.
If a credit institution has establishments (a head office or branches) in more than one
Member State, each establishment has access to these operations through the NCB of
the Member State in which it is established. However, in each Member State, the bids
of an institution may be submitted by only one establishment (either the head office or a
designated branch).
In accordance with the provisions in the contractual or regulatory arrangements applied
by the respective NCB or by the ECB, the Eurosystem may suspend, limit or exclude
counterparties’ access to monetary policy instruments on the grounds of prudence.
The Eurosystem implements its monetary policy operations in a decentralised manner.
The decentralised approach has been very efficient and has run smoothly thanks to careful
preparation and efficient information systems. The Eurosystem continues to benefit
greatly from the close contacts which the NCBs have built up over the decades with their
local counterparties.
2. Collateral
The liquidity-providing operations of the Eurosystem are based on a broad range of
assets that counterparties can use as collateral in their credit operations. Article 18.1
of the Statute of the ESCB, according to which the ECB and the NCBs are allowed
to transact in financial markets by buying and selling underlying assets outright or
under repurchase agreements, requires all Eurosystem credit operations to be based on
adequate collateral.
In order to protect the Eurosystem from losses, ensure the equal treatment of counterparties
and enhance operational efficiency, underlying assets provided by counterparties have
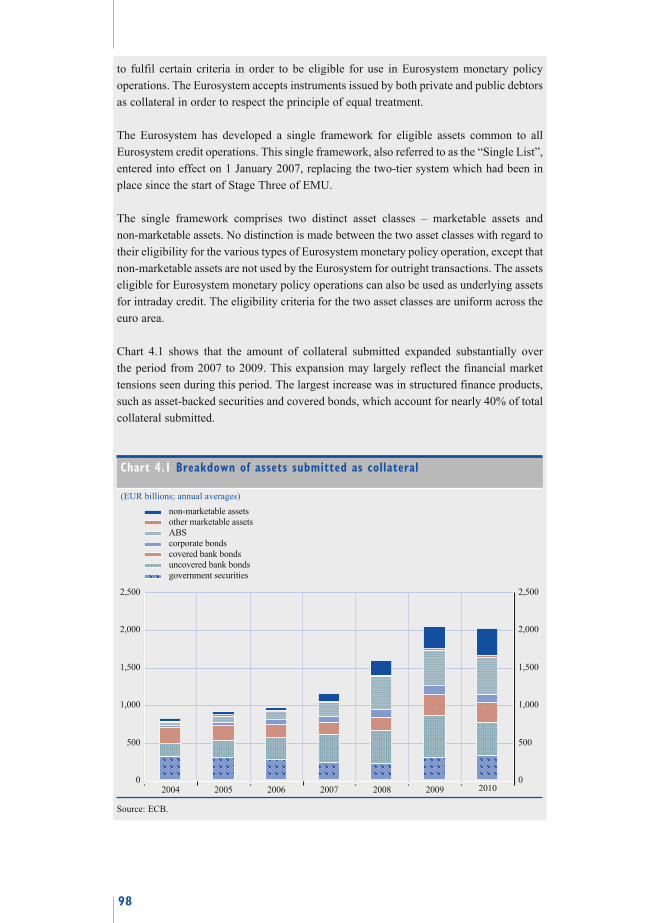
98
to fulfil certain criteria in order to be eligible for use in Eurosystem monetary policy
operations. The Eurosystem accepts instruments issued by both private and public debtors
as collateral in order to respect the principle of equal treatment.
The Eurosystem has developed a single framework for eligible assets common to all
Eurosystem credit operations. This single framework, also referred to as the “Single List”,
entered into effect on 1 January 2007, replacing the two-tier system which had been in
place since the start of Stage Three of EMU.
The single framework comprises two distinct asset classes – marketable assets and
non-marketable assets. No distinction is made between the two asset classes with regard to
their eligibility for the various types of Eurosystem monetary policy operation, except that
non-marketable assets are not used by the Eurosystem for outright transactions. The assets
eligible for Eurosystem monetary policy operations can also be used as underlying assets
for intraday credit. The eligibility criteria for the two asset classes are uniform across the
euro area.
Chart 4.1 shows that the amount of collateral submitted expanded substantially over
the period from 2007 to 2009. This expansion may largely reflect the financial market
tensions seen during this period. The largest increase was in structured finance products,
such as asset-backed securities and covered bonds, which account for nearly 40% of total
collateral submitted.
Chart 4.1 Breakdown of assets submitted as collateral
(EUR billions; annual averages)
0
500
1,000
1,500
2,000
2,500
0
500
1,000
1,500
2,000
2,500
non-marketable assets
other marketable assets
ABS
corporate bonds
covered bank bonds
uncovered bank bonds
government securities
2004 2005 2006 2007 2008 2009 2010
Source: ECB.

99
Lending through open market operations
normally takes place in the form of
reverse transactions. In these reverse
transactions, the central bank buys assets
under a repurchase agreement or grants a
loan against assets pledged as collateral
(see Box 4.3). Reverse transactions
are therefore temporary open market
operations which provide funds for a
limited, pre-specified period only.
For the purpose of controlling short-term
interest rates in the money market
and, in particular, restricting their
volatility, the Eurosystem also
offers two standing facilities to its
counterparties: the marginal lending
facility and the deposit facility. Both
facilities have an overnight maturity and
are available to counterparties on their
own initiative. The interest rate on the
marginal lending facility is normally
substantially higher than the
corresponding money market rate,
and the interest rate on the deposit
facility is normally substantially lower
than the money market rate.
As a result, credit institutions normally
only use the standing facilities in the
absence of other alternatives. As there
are no limits on access to these facilities
(except for the collateral requirements
of the marginal lending facility),
the rate on the marginal lending facility
and the rate on the deposit facility
normally provide a ceiling and a floor,
respectively, for the overnight rate in
the money market. These instruments
are examined in more detail in
Section 4.5.
Reverse transactions
Standing facilities
Eurosystem counterparties may use eligible assets on a cross-border basis, i.e. they may
obtain funds from the NCB of the Member State in which they are established using
assets deposited in another Member State.
3. Risk control measures
All assets eligible for Eurosystem credit operations are subject to specific risk control
measures in order to protect the Eurosystem against financial loss if underlying assets
have to be realised (i.e. sold) owing to the default of a counterparty.
The Eurosystem applies specific risk control measures according to the type of
underlying asset offered by the counterparty. The ECB determines the appropriate risk
control measures for both marketable and non-marketable eligible assets. The risk control
measures are broadly harmonised across the euro area to ensure consistent, transparent
and non-discriminatory conditions for all types of eligible asset.
These risk control measures include valuation haircuts, meaning that the value of the
underlying asset is calculated as the market value of the asset minus a certain percentage
(the “haircut”). The Eurosystem also requires the haircut-adjusted market value of
the collateral to be maintained over time by applying variation margins (marking-
to-market). Finally, the risk control measures include limits on the use of unsecured
debt instruments.
The Eurosystem can apply additional risk control measures if these are required to ensure
adequate risk protection. On the grounds of prudence, the Eurosystem may also reject
assets, limit the use of assets or apply supplementary haircuts to assets submitted as
collateral in Eurosystem credit operations by specific counterparties.

100
By setting the rates on the standing
facilities, the Governing Council
effectively determines the corridor
within which the overnight money
market rate can fluctuate. Chart 4.2
shows the development of key ECB
interest rates since January 1999 and
how the interest rates on the standing
facilities have provided a ceiling and a
floor for the overnight market interest
rate, measured by the euro overnight
index average (EONIA).
Chart 4.2 shows that, in normal times,
the EONIA has generally remained
close to the rate on the MROs, thus
demonstrating the importance of these
operations as the main monetary policy
instrument of the Eurosystem. This
behaviour changed in October 2008,
when the Eurosystem adopted non-
standard measures to counter the
negative effects of the intensification
of the financial crisis (see Box 5.1 and
Chapter 5). Chart 4.2 also shows that
the EONIA exhibits a pattern of
occasional spikes. This pattern is
related to the Eurosystem’s minimum
reserve system, as explained further
in Section 4.3.
Finally, Chart 4.2 shows that the
differences between the standing
facility interest rates and the rate
on the MROs were kept unchanged
between April 1999 and October 2008
at ±1 percentage point. The width
of the corridor was then temporarily
narrowed to ±0.5 percentage point,
before being widened again to
±0.75 percentage point in May 2009,
when the Governing Council
decided to set the rate for the MROs
at 1.0%.
Corridor of standing facility
interest rates
EONIA, key ECB interest
rates and the minimum
reserve system
Chart 4.2 Key ECB interest rates and the EONIA since 1999
(percentages per annum; daily data)
0
1
2
3
4
5
6
7
0
1
2
3
4
5
6
7
1999 2000 2001 2002 2003 2004 2005 2006 2007 2008 2009 2010
marginal lending rate
deposit rate
EONIA
main refinancing/minimum bid rate
Source: ECB.
1) Before 28 June 2000 MROs were conducted as fixed rate tenders. Starting with the operation settled on
28 June 2000, and until the operation settled on 15 October 2008, MROs were conducted as variable rate tenders
with a pre-announced minimum bid rate. Since the operation settled on 15 October 2008, MROs have been
conducted as fixed rate tenders with full allotment. This procedure is scheduled to remain in place at least until the
maintenance period ending on 12 July 2011. The minimum bid rate refers to the minimum interest rate at which
counterparties may place their bids (see Section 4.4).
101
4.3 MINIMUM RESERVES
The first key function of the minimum
reserve system is to stabilise money
market interest rates. This function is
performed by the averaging provision.
The averaging provision allows
credit institutions to smooth out daily
liquidity fluctuations (e.g. those arising
from fluctuations in the demand for
banknotes), since transitory reserve
imbalances can be offset by opposite
reserve imbalances generated within
the same maintenance period.
The averaging provision implies that
institutions can profit from lending in the
market and run a reserve deficit whenever
the shortest money market rates are
above those expected to prevail for the
remainder of the maintenance period. In
the opposite scenario, they can borrow
in the market and run a reserve surplus.
In theory, this “intertemporal arbitrage”
should ensure equality throughout
the maintenance period between the
current level of the shortest money
market rates and their expected level
at the end of the maintenance period.
This mechanism stabilises the overnight
interest rate during the maintenance
period and makes it unnecessary for the
central bank to intervene frequently in
the money market.
The averaging provision works very
smoothly during the maintenance
period. However, at the end of the
period, the reserve requirement
becomes binding and banks can no
longer transfer a liquidity surplus or
deficit into the future. This explains the
spikes in the EONIA towards the end
of each maintenance period, which can
be seen in Chart 4.2.
A second important function assigned
to the minimum reserve system is the
enlargement of the structural liquidity
shortage of the banking system.
The need for credit institutions to hold
reserves with the NCBs contributes to
increasing the demand for central bank
credit which, in turn, makes it easier
for the ECB to steer money market
rates through regular liquidity-
providing operations.
Description of the system
The ECB requires credit institutions in
the euro area to hold compulsory
deposits on accounts with the NCBs:
these are called “minimum” or
“required” reserves.8 The amount of
required reserves to be held by each
institution is determined by its reserve
base. The reserve base of an institution
is defined in relation to the elements of
its balance sheet. Table 4.2 shows the
main liability items included in the
reserve base.9
In order to determine an institution’s
reserve requirement, the reserve base is
multiplied by a reserve ratio. The ECB
applies a uniform positive reserve ratio
to most of the items included in the
reserve base. This reserve ratio was set
at 2% at the start of Stage Three of
EMU. Most of the short-term liabilities
on credit institutions’ balance sheets
are subject to a positive reserve ratio.
As can be seen from Table 4.2, neither
long-term liabilities nor repurchase
Stabilisation of money market interest rates
Enlargement of the structural liquidity shortage
Required reserves and the reserve base
8 The legal framework for the Eurosystem’s minimum reserve system is based on Article 19 of the Statute of the
ESCB. The details of the minimum reserve system are contained in several legal acts, the most important being
Council Regulation (EC) No 2531/98 concerning the application of minimum reserves by the European Central
Bank and Regulation (EC) No 2818/98 of the European Central Bank on the application of minimum reserves
(ECB/1998/15), as amended.9 Liabilities vis-à-vis other credit institutions included in the list of institutions subject to the Eurosystem’s minimum
reserve system and liabilities vis-à-vis the ECB and the NCBs are not included in the reserve base.
Reserve ratio

102
agreements are subject to a positive
reserve ratio.
Institutions can deduct a uniform
lump-sum allowance from their reserve
requirement. Since the introduction of
the euro they have been entitled to
deduct €100,000. This allowance is
designed to reduce the administrative
costs arising from managing very small
reserve requirements.
In order to meet their reserve
requirements, credit institutions have to
hold balances on their current accounts
with the NCBs. In this respect, the
Eurosystem’s minimum reserve system
enables counterparties to make use of
averaging provisions. This means that
compliance with reserve requirements
is determined on the basis of the average
of the daily balances on the institutions’
reserve accounts over the maintenance
period of around one month.
A maintenance period starts on the
settlement day of the first MRO
following the Governing Council
meeting at which the monthly
assessment of the monetary policy
stance is scheduled and ends on the day
preceding the corresponding settlement
day in the following month. A different
schedule was in place before March 2004
(see Box 4.2). To help credit institutions
prepare their reserves management, a
maintenance period schedule for the
calendar year, together with an
indicative schedule for the MROs, is
published three months before the start
of each year.
The Eurosystem aims to ensure that the
minimum reserve system neither puts a
burden on the banking system
in the euro area nor hinders the
efficient allocation of resources. For
this reason, credit institutions’ holdings
of required reserves are remunerated.
The remuneration corresponds to the
average, over the maintenance period,
of the “marginal rate of allotment”
(weighted according to the number
of calendar days) of the MROs
(see also Section 4.4). As the marginal
tender rates are normally very close
to the short-term money market
interest rates, the required reserves are
normally remunerated at close to the
market rate.
Lump-sum allowance
Averaging provisions
Reserve maintenance
period
Remuneration of required reserves
Table 4.2 Credit institutions’ liabilities included in the reserve base
(stock levels as at the end of January 2011; EUR billions)
(A) Liabilities to which a 2% reserve ratio is applied Deposits (including overnight deposits, deposits with an agreed maturity up to two years and deposits redeemable at a period of notice of up to two years) 9,840.2
Debt securities issued with a maturity of up to two years (including money market paper) 651.6
Sub-total (A) 10,491.8
(B) Liabilities to which a zero reserve ratio is applied Deposits (including deposits with an agreed maturity of over two years and deposits redeemable at a period of notice of over two years) 2,780.6
Debt securities issued with a maturity of over two years 4,356.0
Repurchase agreements 1,395.8
Sub-total (B) 8,532.4
Total reserve base (A)+(B) 19,024.1Source: ECB.

103
Chart 4.3 illustrates how the Eurosystem’s
reserve requirement is determined. In this
example, the aggregate reserve base of
the credit institutions is calculated on
the basis of the liabilities on their
balance sheets as at 31 May 2007. By
applying the 2% reserve ratio to the
relevant reserve base of €9,588 billion
and deducting the aggregate lump-sum
allowance of €0.5 billion, the aggregate
reserve requirement is determined for
the maintenance period starting in the
second subsequent calendar month
(in this case, the period starting on 11 July
and ending on 7 August 2007). The dark
blue line in Chart 4.3 shows how
Determination of reserve
requirements
Box 4.2 Changes to the maturity of the main refinancing operations
and the reserve maintenance period as of March 2004
As noted in Section 4.4, there have been periods of tension in the past when pronounced
speculation on an imminent interest rate change has affected counterparties’ bidding in
the MROs. On several occasions in spring 2000, when expectations were high that the
key ECB interest rates were about to be increased, counterparties submitted increasingly
excessive bids in the MROs which, at the time, were conducted as fixed rate tenders
(leading to “overbidding”). Similarly, on occasion, expectations of an imminent cut
in the key ECB rates led counterparties to submit bids that, on aggregate, fell short of
the amount needed to ensure that the reserve requirements were met (“underbidding”).
Both problems stemmed mainly from the fact that the timing of the reserve maintenance
periods – which started on the 24th calendar day of each month and ended on the
23rd calendar day of the following month – was independent of the dates of the
Governing Council meetings at which changes in key ECB rates were decided. Thus
changes in key ECB interest rates could occur during a reserve maintenance period. In
addition, the maturity of the weekly MROs (which was two weeks) was such that at least
the last operation of each reserve maintenance period overlapped with the subsequent
reserve maintenance period. As a result, bidding behaviour in MROs conducted at the end
of a maintenance period could be affected by expectations of changes in key ECB interest
rates in the next reserve maintenance period.
In response to this problem, the Governing Council decided on two measures which came
into effect in March 2004 to prevent rate change speculation during a maintenance period
from affecting very short-term money market conditions: (i) the timing of the reserve
maintenance periods was changed, and (ii) the maturity of the MROs was shortened
to one week. Specifically, it was decided that maintenance periods would start on the
settlement day of the first MRO following the Governing Council meeting at which the
monthly assessment of the monetary policy stance was pre-scheduled, and would end on
the day preceding the corresponding settlement day in the following month. This direct
link between the Governing Council meeting and the start of the reserve maintenance
period should ensure that, as a rule, there can be no expectation that changes in key ECB
rates might occur during a reserve maintenance period. The shortening of the maturity
of the MROs was aimed at eliminating the spillover of interest rate speculation from
one reserve maintenance period to the next. The objective of the combined measures
was to contribute towards stabilising the conditions in which credit institutions bid in
the MROs.

104
averaging provisions work in the
Eurosystem’s minimum reserve system.
A credit institution’s current account
holding may fluctuate freely around its
reserve requirement, but the average
current account holding must be at least
equal to the reserve requirement over the
maintenance period as a whole. In the
example, the average of the credit
institutions’ aggregate holdings on
current accounts with the Eurosystem
amounted to €192.0 billion, implying
voluntary excess reserves of €0.7 billion
over the aggregate reserve requirement
of €191.3 billion.
4.4 OPEN MARKET OPERATIONS
The Eurosystem’s open market
operations can be divided into the
following four categories according
to aims, regularity and procedures
followed: main refinancing operations
(MROs), longer-term refinancing
operations (LTROs), fine-tuning
operations (FTOs) and structural
operations (see Table 4.1 and Box 4.3).
Main refinancing operations
As mentioned above, MROs are the
most important open market operations
conducted by the Eurosystem.
They play a pivotal role in steering
interest rates, managing the liquidity
situation in the market and signalling
the stance of monetary policy through
the main refinancing rate set by the
Governing Council. They also normally
provide the bulk of liquidity to the
banking system. MROs are executed
in a decentralised manner by the
NCBs.
MROs are liquidity-providing operations
that are conducted regularly on a
weekly basis. They generally have a
maturity of one week. (Before
March 2004, the maturity of the MROs
Four categories of open market
operation
Functionsof MROs
Frequency and maturity
Chart 4.3 The functioning of the Eurosystem’s reserve requirement system
(EUR billions)
0
50
100
150
200
250
300
350
400
450
500
0
2,000
4,000
6,000
8,000
10,000
12,000
reserve base (left-hand scale)
reserve requirement (right-hand scale)
daily reserve holdings (right-hand scale)
e.g. €9,588 billion × 2% - €0.5 billion = €191.3 billion
End of month Start ofmaintenance period
End ofmaintenance period
Reserve base × reserve ratio - lump allowances = reserve requirement
Source: ECB.
Note: The example is based on data referring to the last maintenance period before the outbreak of the financial
market tensions in August 2007, i.e. the period from 11 July to 7 August 2007. During the financial market
tensions, the behaviour of market participants changed, as there was a desire to frontload the fulfilment of reserve
requirements.
105
was two weeks, see Box 4.2). The
maturity of the MROs and LTROs may
also vary occasionally, depending on,
inter alia, bank holidays in Member
States.
MROs are executed through standard
tenders. In the context of the operational
framework of the Eurosystem,
“standard” indicates tender operations
that are conducted in accordance with a
pre-announced schedule, which is
completed within a period of 24 hours
from the announcement of the tender to
the communication of the results.
All counterparties fulfilling general
eligibility criteria may participate in
these operations. In principle, all credit
institutions located in the euro area are
potentially eligible counterparties of
the Eurosystem (see Box 4.1).
The Eurosystem may execute its tenders
in the form of fixed rate or variable rate
tenders. In the former, the ECB specifies
the interest rate in advance and
participating counterparties bid, the
amount of money they wish to transact
at the fixed interest rate. In the latter,
counterparties bid both the amount of
money they wish to transact and the
interest rate at which they wish to enter
into the transaction. Counterparties
may submit multiple bids with different
interest rate levels. In each bid, they
must state the amount of money that
they are willing to transact at the
respective interest rate. The Governing
Council may set a minimum bid rate
for variable rate tenders in order to
signal the monetary policy stance.
Under both tender procedures, the ECB
decides the amount of liquidity to be
provided. In a fixed rate tender, this
normally implies a pro rata allotment
to the participating banks, depending
on the ratio between total bids and total
liquidity to be allotted. In a variable
rate tender, the bids with the highest
interest rates are satisfied first, followed
by bids with successively lower rates,
until the total amount of liquidity to be
provided is exhausted. At the lowest
accepted rate, the “marginal rate of
allotment”, bids are satisfied pro rata
in line with the ECB’s decision on
the total amount of liquidity to be
allotted. For each individual allotment,
the interest rate is equal to the interest
rate bid. In exceptional circumstances,
the ECB may decide to allot all the
liquidity requested by counterparties,
i.e. to accommodate all bids in full.
This full allotment procedure was
introduced during the period of acute
financial market tensions which began
in 2007.
From the beginning of 1999 to
June 2000 the Eurosystem conducted
its MROs as fixed rate tenders.
From 27 June 2000 the MROs were
conducted as variable rate tenders with
a minimum bid rate using a multiple
rate procedure. Starting from the
operation settled on 15 October 2008,
the MROs were conducted as fixed rate
tenders with full allotment. The reason
for the change in 2000 was severe
“overbidding” in the fixed rate MROs,
which was the result of a wide and
persistent spread between money market
interest rates and the fixed rate applied
to the MROs in early 2000. This spread
was, in turn, largely driven by market
expectations of further increases in
ECB interest rates, especially in the
spring of 2000. The spread between
market rates and the ECB’s main
refinancing rate made it very attractive
for banks to obtain funds from the
central bank and led to very high bids
by the banks. In a variable rate tender,
by contrast, banks have no incentive to
overbid, since they would have to pay a
Standard tenders
Fixed and variable rate
tenders
Use of tender proceduressince 1999

106
higher price if they wanted to obtain
more liquidity.
However, a different problem arose
with variable rate tenders with a
minimum bid rate. In a few cases,
the aggregate of all bids submitted in
the tender was lower than the amount
needed for the smooth fulfilment of
reserve requirements (“underbidding”).
As these episodes also stemmed from
significant interest rate speculation,
the Governing Council decided
to adjust its operational framework
as of March 2004 (see Box 4.2).
In October 2008 a fixed rate full
allotment procedure was introduced
for all refinancing operations for a
certain period (see Box 5.1). This was
intended to mitigate the adverse effects
that dysfunctional money markets were
having on the liquidity situation of
solvent banks in the euro area and to
support the flow of credit to firms and
households.
When it switched to variable rate
tenders, the Eurosystem also started to
announce, each week, the estimated
liquidity needs of the banking system
for the period until the day before
the settlement of the next MRO.
The publication of this estimate assists
counterparties in preparing their
bids for the forthcoming MRO.
Section 4.6 describes the factors which
determine the liquidity needs of the
banking system.
Longer-term refinancing operations
In addition to the weekly MROs,
the Eurosystem also executes regular
monthly LTROs with a three-month
maturity. The Eurosystem may also
conduct additional LTROs which
can have other maturities (e.g. one
maintenance period, six months
or twelve months) (see Box 5.1).
These operations are aimed at providing
longer-term liquidity to the banking
system. This is deemed useful in order
to prevent all the liquidity in the money
market from having to be rolled over
each week and to give counterparties
access to longer-term refinancing. Like
the MROs, these LTROs are conducted
as standard tenders in a decentralised
manner, and all counterparties fulfilling
general eligibility criteria may
participate (see Box 4.1).
Since it was not considered desirable
for the Eurosystem to influence money
market rates at more than one point
along the maturity spectrum, the
LTROs have been designed to ensure
that the Eurosystem acts as a “rate
taker” in these operations. In order not
to blur the signal arising from the
Eurosystem’s MROs, LTROs are
normally executed in the form of pure
variable rate tenders with pre-
announced allotment volumes. The
Governing Council normally indicates
in advance the volume to be allotted in
forthcoming tenders. Under exceptional
circumstances, the Eurosystem may
also execute LTROs through fixed rate
tenders and may decide to accommodate
all bids in the operations (full allotment
procedure) (see Box 5.1).
Fine-tuning operations
The Eurosystem may also carry out
open market operations on an ad hoc
basis, i.e. FTOs. The frequency and
maturity of such operations are not
standardised. FTOs can be liquidity-
absorbing or liquidity-providing.
They are aimed at managing the
liquidity situation in the money market
and steering interest rates,
in particular in order to smooth the
effects on interest rates of unexpected
liquidity fluctuations in the market.
FTOs may be conducted on the last day
Publication of liquidity needs
LTROs
Eurosystem as a “rate taker”
FTOs

107
of a reserve maintenance period to
counter liquidity imbalances which
may have accumulated since the
allotment of the last MRO. FTOs are
primarily executed as reverse
transactions, but may also take the
form of foreign exchange swaps or the
collection of fixed-term deposits
(see Box 4.3).
In view of their purpose, FTOs are
normally executed through “quick”
tenders. These take one hour from their
announcement to the communication of
the allotment results. FTOs can also be
executed through bilateral procedures,
where the Eurosystem conducts a
transaction with a limited number of
counterparties without a tender.
Quick tenders and bilateral procedures
Box 4.3 Types of open market transaction
Reverse transactions are the main open market instrument of the Eurosystem and can
be used for all kinds of liquidity-providing open market operation. The Eurosystem has
four other instruments available to it for the conduct of FTOs and structural operations:
outright transactions, the issuance of ECB debt certificates, foreign exchange swaps and
the collection of fixed-term deposits (see Table 4.1).
1. Reverse transactions
Reverse transactions refer to operations where the Eurosystem buys or sells eligible
assets under repurchase agreements or conducts credit operations against eligible assets
as collateral. Reverse transactions are used for MROs and LTROs. In addition, the
Eurosystem can use reverse transactions for FTOs and structural operations.
Where reverse transactions take the form of a repurchase agreement, the difference
between the purchase price and the repurchase price corresponds to the interest due on the
amount of money borrowed or lent over the maturity of the operation, i.e. the repurchase
price includes the interest to be paid. The interest rate on a reverse transaction in the form
of a collateralised loan is determined by applying the specified interest rate on the credit
amount over the maturity of the operation.
2. Outright transactions
Outright open market transactions refer to operations where the Eurosystem buys or sells
eligible assets outright on the market.
3. Foreign exchange swaps
Foreign exchange swaps executed for monetary policy purposes consist of simultaneous
spot and forward transactions in euro against a foreign currency. They can be used for
fine-tuning purposes, mainly aimed at managing the liquidity situation in the market and
steering interest rates.
4. Collection of fixed-term deposits
The Eurosystem may invite counterparties to place remunerated fixed-term deposits with
the NCB in the Member State in which the counterparty is established.
5. Issuance of ECB debt certificates
The ECB may issue debt certificates with the aim of adjusting the structural position
of the Eurosystem vis-à-vis the financial sector so as to create (or enlarge) a liquidity
shortage in the market.

108
The potential need for rapid action in
the event of unexpected market
developments makes it desirable for
the Eurosystem to retain a high degree
of flexibility in the specification of
FTOs. They are normally executed in a
decentralised manner by the NCBs,
but the Governing Council can decide,
under exceptional circumstances,
to have bilateral FTOs executed
by the ECB. For operational reasons,
only a limited number of selected
counterparties may participate in FTOs.
In order to facilitate access during the
financial crisis, the list of counterparties
eligible for FTOs was extended,
increasing from around 140 to around
2,000 eligible counterparties.
Structural operations
The operational framework also
provides the Eurosystem with the
possibility of conducting “structural
operations”. These operations are
executed at the initiative of the ECB to
adjust the structural liquidity position
of the Eurosystem vis-à-vis the financial
sector, i.e. the amount of liquidity in
the market over the longer term.
These operations can be conducted
using reverse transactions, outright
operations or the issuance of ECB debt
certificates (see Box 4.3).
In principle, structural operations can be
liquidity-providing or liquidity-absorbing
and their frequency can be regular or
non-regular. Structural operations in
the form of reverse transactions and
the issuance of debt instruments are
normally carried out through standard
tenders. Structural operations in the form
of outright transactions are normally
executed through bilateral procedures.
4.5 STANDING FACILITIES
As mentioned above, the Eurosystem
also implements monetary policy by
setting the interest rates on its
standing facilities. Standing facilities
provide or absorb liquidity with an
overnight maturity on the initiative of
counterparties. Two standing facilities
are available to eligible counterparties:
the marginal lending facility and
the deposit facility. In normal
circumstances, there is little incentive
for banks to use standing facilities, as
the interest rates applied to them are
normally unfavourable when compared
with market rates.
Chart 4.4(a) shows the average
daily use of the standing facilities
from January 1999 to August 2008.
Their use largely remained below
€1 billion before the onset of the
financial turmoil in August 2007,
demonstrating that the facilities serve
mainly to provide and absorb
liquidity in exceptional circumstances.
Chart 4.4(b) illustrates that the use of
the standing facilities increased
abruptly during the financial crisis as a
number of banks preferred to keep
more central bank reserves than
required and to deposit the additional
reserves in the deposit facility instead
of lending them out to other banks.
The reasons for this included
uncertainty and perceived counterparty
risk. Under the full allotment procedure
introduced by the Eurosystem in
October 2008, the total amount of
liquidity provided by the Eurosystem
is the sum of the amounts of liquidity
requested by individual banks. As the
overall amounts requested by banks
were higher than the liquidity needs of
the banking system during this period,
the excess liquidity was deposited in
the deposit facility. This points both to
precautionary liquidity hoarding and
to market segmentation (as the banks
requesting liquidity may not be the
same as those depositing excess
liquidity with the Eurosystem).
High degreeof flexibility
Structural operations
Marginal lending and deposit
facilities are…
…important in exceptional circumstances…
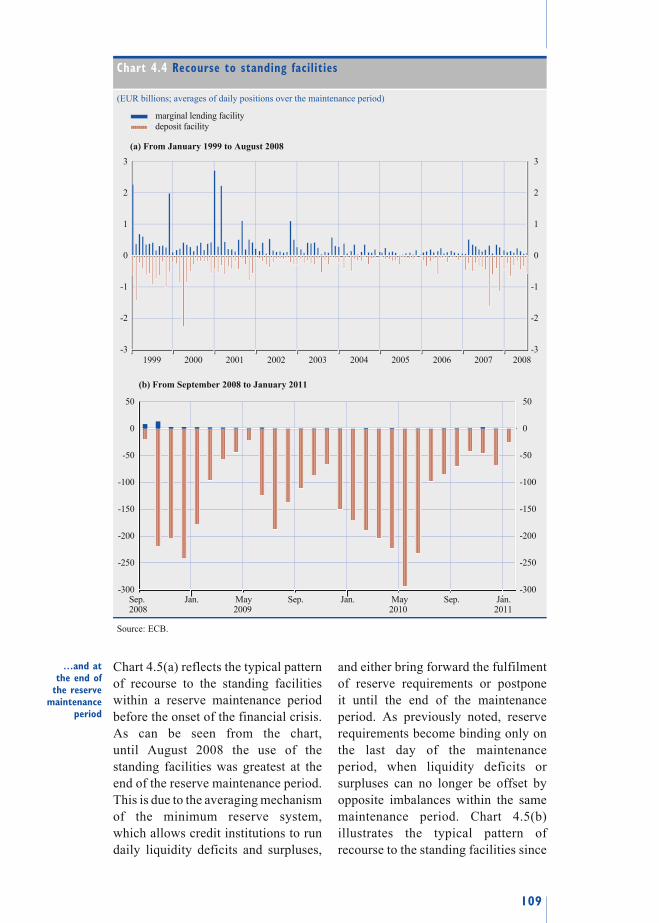
109
Chart 4.5(a) reflects the typical pattern
of recourse to the standing facilities
within a reserve maintenance period
before the onset of the financial crisis.
As can be seen from the chart,
until August 2008 the use of the
standing facilities was greatest at the
end of the reserve maintenance period.
This is due to the averaging mechanism
of the minimum reserve system,
which allows credit institutions to run
daily liquidity deficits and surpluses,
and either bring forward the fulfilment
of reserve requirements or postpone
it until the end of the maintenance
period. As previously noted, reserve
requirements become binding only on
the last day of the maintenance
period, when liquidity deficits or
surpluses can no longer be offset by
opposite imbalances within the same
maintenance period. Chart 4.5(b)
illustrates the typical pattern of
recourse to the standing facilities since
…and at the end of
the reserve maintenance
period
Chart 4.4 Recourse to standing facilities
(EUR billions; averages of daily positions over the maintenance period)
marginal lending facility
deposit facility
(a) From January 1999 to August 2008
-3
-2
-1
0
1
2
3
-3
-2
-1
0
1
2
3
1999 2000 2001 2002 2003 2004 2005 2006 2007 2008
(b) From September 2008 to January 2011
-300
-250
-200
-150
-100
-50
0
50
-300
-250
-200
-150
-100
-50
0
50
Sep. Jan.Sep.Jan. May Sep.Jan. May2008 2009 2010 2011
Source: ECB.
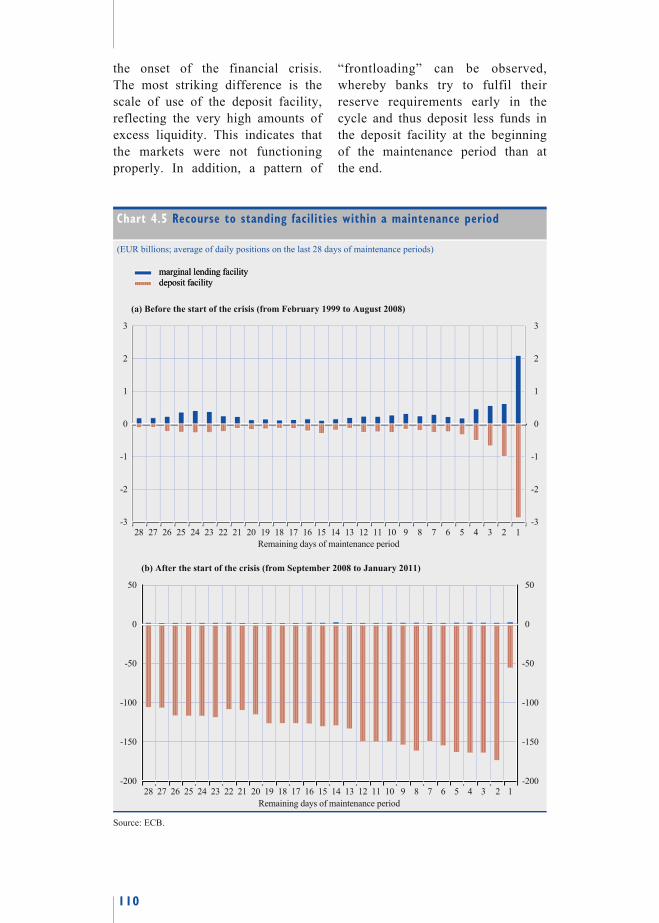
110
the onset of the financial crisis.
The most striking difference is the
scale of use of the deposit facility,
reflecting the very high amounts of
excess liquidity. This indicates that
the markets were not functioning
properly. In addition, a pattern of
“frontloading” can be observed,
whereby banks try to fulfil their
reserve requirements early in the
cycle and thus deposit less funds in
the deposit facility at the beginning
of the maintenance period than at
the end.
Chart 4.5 Recourse to standing facilities within a maintenance period
(EUR billions; average of daily positions on the last 28 days of maintenance periods)
marginal lending facility
deposit facility
marginal lending facility
deposit facility
(a) Before the start of the crisis (from February 1999 to August 2008)
-3
-2
-1
0
1
2
3
-3
-2
-1
0
1
2
3
28 27 26 25 24 23 22 21 20 19 18 17 16 15 14 13 12 11 10 9 8 7 6 5 4 3 2 1
Remaining days of maintenance period
(b) After the start of the crisis (from September 2008 to January 2011)
-200
-150
-100
-50
0
50
-200
-150
-100
-50
0
50
28 27 26 25 24 23 22 21 20 19 18 17 16 15 14 13 12 11 10 9 8 7 6 5 4 3 2 1
Remaining days of maintenance period
Source: ECB.

111
4.6 CENTRAL BANK LIQUIDITY
AND LIQUIDITY NEEDS OF THE
BANKING SYSTEM
To sum up, the operational framework
comprises a set of instruments and
procedures which the Eurosystem uses
to steer interest rates, manage liquidity
in the money market and signal monetary
policy intentions. The euro area banking
system – on account of its need for
banknotes and the obligation to fulfil
reserve requirements, in particular – has
an aggregate liquidity deficit in normal
times and is reliant on refinancing from
the Eurosystem. Thus the Eurosystem
acts as a supplier of liquidity and can
steer money market interest rates, as
well as transmitting monetary policy
impulses across the euro area.
The interaction between the Eurosystem
and the banking system can be
illustrated with the help of the
consolidated balance sheet of the
Eurosystem. Table 4.3 presents a
simplified illustration of the structure
of a standardised central bank
balance sheet.
On the assets side, there are three main
liquidity-providing items: “refinancing
to credit institutions”, “marginal
lending facility” and “net foreign
assets”. “Refinancing to credit
institutions” refers to the outstanding
amount of liquidity-providing open
market operations. In the case of the
Eurosystem, these operations always
include MROs and LTROs. Any
liquidity-providing FTOs and structural
operations are also included under this
item. “Marginal lending facility” refers
to overnight credit provided by the
central bank to those credit institutions
that have recourse to this facility. “Net
foreign assets” refers to assets in
foreign currency owned by the central
bank, net of any central bank liabilities
denominated in foreign currency.
On the liabilities side, there are five main
items: “credit institutions’ holdings on
current accounts”, “deposit facility”,
“banknotes in circulation”, “government
deposits” and “other factors (net)”.
“Credit institutions’ holdings on current
accounts” (also known as “reserves”)
refers to balances held by credit
institutions with the central bank in order
to meet settlement obligations from
interbank transactions and to fulfil
reserve requirements. “Deposit facility”
refers to the total overnight recourse to
this standing facility. “Banknotes in
circulation” indicates the value of the
banknotes put into circulation by the
central bank at the request of credit
institutions. This is usually the largest
item on the liabilities side. “Government
deposits” reflects the existence of current
account balances held by national
treasuries with NCBs. Finally,
“other factors (net)” is a balancing item
encompassing the remaining items on
the balance sheet.
From an accounting point of view,
the respective amounts of total assets
and liabilities must always be equal.
In order to understand how a central
bank operates, it is convenient to split
the balance sheet into three elements,
as indicated by the lower three panels of
Table 4.3. As shown in the table, the net
amount of liquidity that is actually
supplied by the central bank to credit
institutions is the sum of two elements.
The first element is made up of the
“autonomous factors” (the sum of
“banknotes in circulation” plus
“government deposits” minus “net
foreign assets” plus “other factors (net)”,
which is the net effect of the remaining
balance sheet items affecting money
market liquidity). These factors influence
The Eurosystem as a supplier of
liquidity
Consolidated balance sheet of the Eurosystem
Assets
Liabilities
Liquidity supply and demand

112
the liquidity of the banking system and
are labelled “autonomous” in central
bank jargon because they are not
normally the result of the use of monetary
policy instruments. Some of the
autonomous factors are not under the
control of the monetary authorities
(“banknotes in circulation” and
“government deposits”). Other factors,
such as “net foreign assets”, can be
controlled by the monetary authorities,
but transactions in these assets are not
normally related to monetary policy
operations (except in the case of foreign
exchange swaps; see Box 4.1). The
second element is made up of credit
institutions’ reserves (“credit institutions’
holdings on current accounts”). The sum
of the autonomous factors plus the
reserves equals the supply of liquidity
through monetary policy operations
(the sum of “refinancing to credit
institutions” plus “marginal lending
facility” minus “deposit facility”).
Moving from this schematic analysis to
the Eurosystem’s actual balance sheet,
Table 4.4 shows the contributions of
the main items to the banking system’s
liquidity in the reserve maintenance
period from 19 January 2011 to
8 February 2011. The bulk of the
liquidity was provided through
the MROs and LTROs. Additional
liquidity was provided through other
operations, notably the covered bond
purchase programme (CBPP) and the
Securities Markets Programme (SMP).
Standing facilities normally have only
a marginal impact on the banking
system’s liquidity. Owing to the
liquidity surplus of the banking sector
in the context of credit operations at
fixed rate with full allotment, banks
Contributions of the main items
Table 4.3 Central bank balance sheet structure
A standardised central bank balance sheet: Assets Liabilities Refinancing to credit institutions Credit institutions’ holdings on
current accounts (reserves)
Marginal lending facility Deposit facility
Net foreign assets Banknotes in circulation
Government deposits
Other factors (net)
Can be rearranged as follows: Liquidity supply through monetary policy operations
refinancing to credit institutions+ marginal lending facility
- deposit facility
=Autonomous factors
banknotes in circulation+ government deposits
- net foreign assets+ other factors (net)
+ Reserves
credit institutions’ holdings on current accounts

113
have made larger recourse to the
deposit facility than in normal times.
The second part of Table 4.4 shows
the autonomous factors. The liquidity-
absorbing effect of autonomous factors
is mainly generated by banknotes in
circulation and government deposits
with the Eurosystem. Banknotes
in circulation absorb the banking
system’s liquidity because they have
to be obtained from the central bank,
and credit institutions have to borrow
funds from the central bank because of
this. There is also a counter-effect on
the banking system’s liquidity relating
to the net foreign assets held by the
Eurosystem. Purchases of foreign assets
by the Eurosystem inject liquidity into
the banking system and reduce the
need for liquidity-providing monetary
policy operations. Required reserves
have a liquidity-absorbing effect which
is similar in size to the effect of all
the autonomous factors together. The
difference between credit institutions’
holdings on current accounts with the
Eurosystem and reserve requirements
makes up the excess reserves
(which have generally been very low,
at around 0.5% of required reserves in
the euro area).
Charts 4.6 and 4.7 show how the main
liquidity-providing and liquidity-
absorbing factors developed from
January 1999 to January 2011. Chart 4.6
shows that the bulk of the liquidity up
to September 2008 was provided
through the MROs, reflecting the key
Relative importance of liquidity-providing factors
Table 4.4 Contributions to the banking system’s liquidity
(EUR billions; daily average stocks from 19 January 2011 to 8 February 2011)
Liquidity-providing
Liquidity-absorbing
Net contribution
Assets LiabilitiesMonetary policy operations of the Eurosystem Main refinancing operations 185.4 – +185.4
Longer-term refinancing operations 318.2 – +318.2
Other open market operations 1) 137.2 81.3 +55.9
Standing facilities 0.1 39.2 -39.2
Sub-total (a) 604.9 120.5 +520.4 Autonomous factors affecting the banking system’s liquidity Banknotes in circulation – 822 -822
Government deposits with the Eurosystem
– 101.2 -101.2
Net foreign assets 549.7 – +549.7
Other factors (net) – -66.7 +66.7
Sub-total (b) 549.7 856.5 -306.8 Reserves = credit institutions’ holdings on current accounts with
the EurosystemRequired reserves (c) +212.3
Excess reserves (d) +1.3
Total (a)+(b) = (c)+(d) +213.6 Source: ECB.
1) “Other open market operations” include securities held for monetary policy purposes and foreign currency
liquidity operations. The latter operations actually absorbed liquidity.

114
role played by this monetary policy
instrument. Following the introduction
of a fixed rate full allotment procedure
from October 2008 onwards for all
refinancing operations, the weight of
the refinancing operations shifted
towards LTROs. As can be seen from
Chart 4.6, LTROs reached a volume of
Chart 4.6 Volume of main and longer-term refinancing operations
(EUR billions; averages of daily positions over maintenance period)
0
100
200
300
400
500
600
700
800
900
0
100
200
300
400
500
600
700
800
900
1999 2000 2001 2002 2003 2004 2005 2006 2007 2008 2009 2010
outstanding main refinancing operations (MROs)
outstanding longer-term refinancing operations (LTROs)
total refinancing operations
Source: ECB.
Chart 4.7 Required reserves and autonomous liquidity factors
(EUR billions, averages of daily positions over maintenance period)
0
100
200
300
400
500
600
700
0
100
200
300
400
500
600
700
1999 2000 2001 2002 2003 2004 2005 2006 2007 2008 2009 2010
reserve requirements
autonomous factors 1)
total liquidity needs in the banking system
Source: ECB.
1) Autonomous factors include banknotes in circulation plus government deposits plus other factors less net
foreign assets.
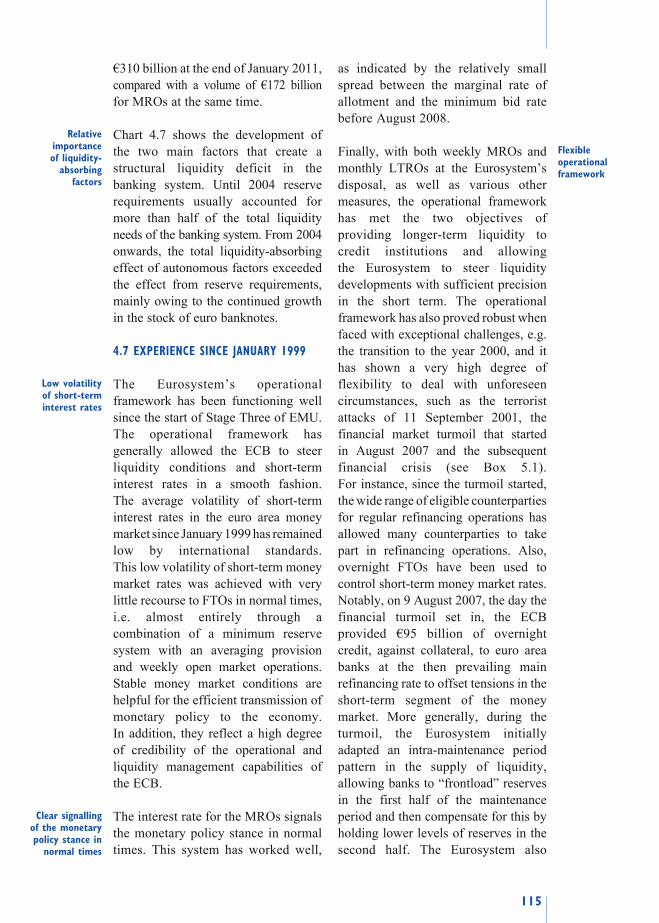
115
€310 billion at the end of January 2011,
compared with a volume of €172 billion
for MROs at the same time.
Chart 4.7 shows the development of
the two main factors that create a
structural liquidity deficit in the
banking system. Until 2004 reserve
requirements usually accounted for
more than half of the total liquidity
needs of the banking system. From 2004
onwards, the total liquidity-absorbing
effect of autonomous factors exceeded
the effect from reserve requirements,
mainly owing to the continued growth
in the stock of euro banknotes.
4.7 EXPERIENCE SINCE JANUARY 1999
The Eurosystem’s operational
framework has been functioning well
since the start of Stage Three of EMU.
The operational framework has
generally allowed the ECB to steer
liquidity conditions and short-term
interest rates in a smooth fashion.
The average volatility of short-term
interest rates in the euro area money
market since January 1999 has remained
low by international standards.
This low volatility of short-term money
market rates was achieved with very
little recourse to FTOs in normal times,
i.e. almost entirely through a
combination of a minimum reserve
system with an averaging provision
and weekly open market operations.
Stable money market conditions are
helpful for the efficient transmission of
monetary policy to the economy.
In addition, they reflect a high degree
of credibility of the operational and
liquidity management capabilities of
the ECB.
The interest rate for the MROs signals
the monetary policy stance in normal
times. This system has worked well,
as indicated by the relatively small
spread between the marginal rate of
allotment and the minimum bid rate
before August 2008.
Finally, with both weekly MROs and
monthly LTROs at the Eurosystem’s
disposal, as well as various other
measures, the operational framework
has met the two objectives of
providing longer-term liquidity to
credit institutions and allowing
the Eurosystem to steer liquidity
developments with sufficient precision
in the short term. The operational
framework has also proved robust when
faced with exceptional challenges, e.g.
the transition to the year 2000, and it
has shown a very high degree of
flexibility to deal with unforeseen
circumstances, such as the terrorist
attacks of 11 September 2001, the
financial market turmoil that started
in August 2007 and the subsequent
financial crisis (see Box 5.1).
For instance, since the turmoil started,
the wide range of eligible counterparties
for regular refinancing operations has
allowed many counterparties to take
part in refinancing operations. Also,
overnight FTOs have been used to
control short-term money market rates.
Notably, on 9 August 2007, the day the
financial turmoil set in, the ECB
provided €95 billion of overnight
credit, against collateral, to euro area
banks at the then prevailing main
refinancing rate to offset tensions in the
short-term segment of the money
market. More generally, during the
turmoil, the Eurosystem initially
adapted an intra-maintenance period
pattern in the supply of liquidity,
allowing banks to “frontload” reserves
in the first half of the maintenance
period and then compensate for this by
holding lower levels of reserves in the
second half. The Eurosystem also
Relative importance of liquidity-
absorbing factors
Low volatility of short-term interest rates
Clear signalling of the monetary policy stance in
normal times
Flexible operational framework
116
increased the amount of liquidity
provided in LTROs by introducing
supplementary refinancing operations
with maturities of three and six months
(later extended to 12 months during the
financial crisis).

117
5 THE CONDUCT OF MONETARY POLICY SINCE 1999
This chapter illustrates how monetary policy has been conducted in the euro
area since 1999. The period has been challenging for the euro area, given that
it was confronted with a host of economic and financial shocks, the nature,
size and persistence of which varied over time. Against this backdrop, the
Governing Council took its monetary policy decisions with a clear focus on
the need to maintain price stability over the medium term.
5.1 INTRODUCTION
Since the beginning of Stage Three of
EMU in 1999, the conduct of monetary
policy in the euro area has been
guided by the overriding objective of
maintaining price stability over the
medium term. In assessing risks to
price stability in the euro area, the
Governing Council has always relied
on the framework laid down in its
monetary policy strategy, implying a
comprehensive analysis of both
economic and monetary developments
in the euro area (see Chapter 3).
In the first years of Monetary Union,
the Governing Council assessed the
monetary policy stance at meetings held
every two weeks. In November 2001,
however, the Governing Council
decided that – as a rule – it would
henceforth assess the monetary policy
stance at its first meeting of the month.
Accordingly, it was announced that
interest rate decisions would normally
be taken at that meeting, while the
second meeting of the month would
focus on issues related to the other tasks
and responsibilities of the ECB and the
Eurosystem.
Overall, six phases can be distinguished
as regards the conduct of monetary
policy (see Chart 5.1). The challenges
faced by the single monetary policy
Priority for the maintenance of price stability
over the medium term
Frequent Governing
Council meetings to assess the
monetary policy stance
Six phases can be distinguished: transition to Monetary Union, period until mid-1999…
Chart 5.1 Key ECB interest rates in the six phases
(annual percentage changes; daily data)
0
1
2
3
4
5
6
7
0
1
2
3
4
5
6
7
2 3 4 5 61
1999 2001 2003 2005 2007 2009
marginal lending rate
deposit ratemain refinancing/minimum bid rate
2000 2002 2004 2006 2008 2010
Source: ECB.

118
during these six phases are explained
in the next section. A first phase was
the transition to Monetary Union:
in response to downward risks to price
stability, the Governing Council
lowered the ECB’s main refinancing
rate by 50 basis points to 2.5% in
April 1999.
Second, in order to contain inflationary
pressures against the backdrop of
strong economic growth, increasing
import prices and high monetary
growth, the Governing Council raised
the key interest rates by a total of
225 basis points in the period from
November 1999 to October 2000. This
brought the main refinancing rate to
4.75% in that month.
Third, in response to receding
inflationary pressures in an environment
of subdued economic growth, marked
adjustments in financial markets
and high geopolitical uncertainty,
the Governing Council cut the key
interest rates by a total of 275 basis
points between May 2001 and June
2003, thereby reducing the main
refinancing rate to 2%.
Fourth, given contained price pressures,
the Governing Council then left the
key ECB interest rates unchanged until
December 2005.
Fifth, with inflation increasing against
the background of sound economic
growth and a rapid expansion of the
supply of money and credit in the euro
area, the degree of monetary policy
accommodation was gradually reduced.
With upside risks to price stability
prevailing until mid-2008, the
Governing Council raised the key
interest rates by a total of 225 basis
points, bringing the main refinancing
rate to 4.25% in July 2008.
Sixth, taking account of subdued
inflationary pressures in a setting in
which financial strains had weakened
the economic outlook and significantly
diminished upside risks to price
stability, the Governing Council
reduced the main refinancing rate
rapidly by 325 basis points to 1%
between October 2008 and May 2009.
In addition, the Governing Council has
adopted a number of temporary non-
standard measures, referred to as the
Enhanced Credit Support and the
Securities Markets Programme.
5.2 MAIN DEVELOPMENTS
Phase 1 – Transition to Monetary Union
(mid-1998 to mid-1999)
The convergence process leading to
Stage Three of EMU was successfully
completed when the ECB assumed
responsibility for monetary policy in
the euro area on 1 January 1999. Price
stability had been achieved in the
countries forming the euro area,
allowing the Governing Council to
start its operations at a time when
interest rates were at low levels. The
first interest rate on the main refinancing
operations was set at 3%, with the rates
on the marginal lending and deposit
facilities set at 4.5% and 2%
respectively. These rates, announced
on 22 December 1998, followed the
coordinated reduction on 3 December
of key interest rates by all the NCBs of
the countries set to adopt the euro from
the outset.
At the beginning of 1999, a combination
of factors that had already been
affecting the countries that were joining
the euro area contributed to downward
risks to price stability. HICP inflation
was below 1% (see Chart 5.2) as a
result of, in part, a significant drop
in oil prices (see Chart 5.3) and
…mid-1999 to end-2000…
…early 2001 to mid-2003…
…mid-2003 to end-2005…
…end-2005 to the summer
of 2008…
…and a sixth phase starting in the autumn of 2008
Transfer of responsibility for monetary policy to the ECB
Reduction of key ECB interest rates in response to downward risks to price stability in early 1999
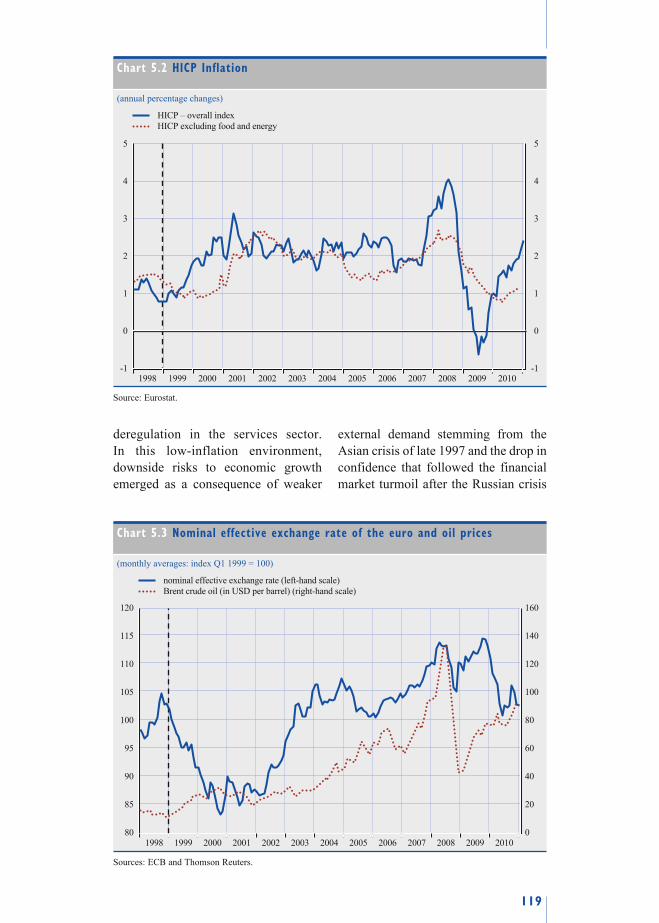
119
deregulation in the services sector.
In this low-inflation environment,
downside risks to economic growth
emerged as a consequence of weaker
external demand stemming from the
Asian crisis of late 1997 and the drop in
confidence that followed the financial
market turmoil after the Russian crisis
Chart 5.2 HICP Inflation
(annual percentage changes)
-1
0
1
2
3
4
5
-1
0
1
2
3
4
5
2000 2001 2002 2003 2004 2005 2006 2007 2008 2009 2010
HICP – overall index
HICP excluding food and energy
19991998
Source: Eurostat.
Chart 5.3 Nominal effective exchange rate of the euro and oil prices
(monthly averages: index Q1 1999 = 100)
80
85
90
95
100
105
110
115
120
0
20
40
60
80
100
120
140
160
1998 1999 2000 2001 2002 2003 2004 2005 2006 2007 2008 2009 2010
nominal effective exchange rate (left-hand scale)
Brent crude oil (in USD per barrel) (right-hand scale)
Sources: ECB and Thomson Reuters.
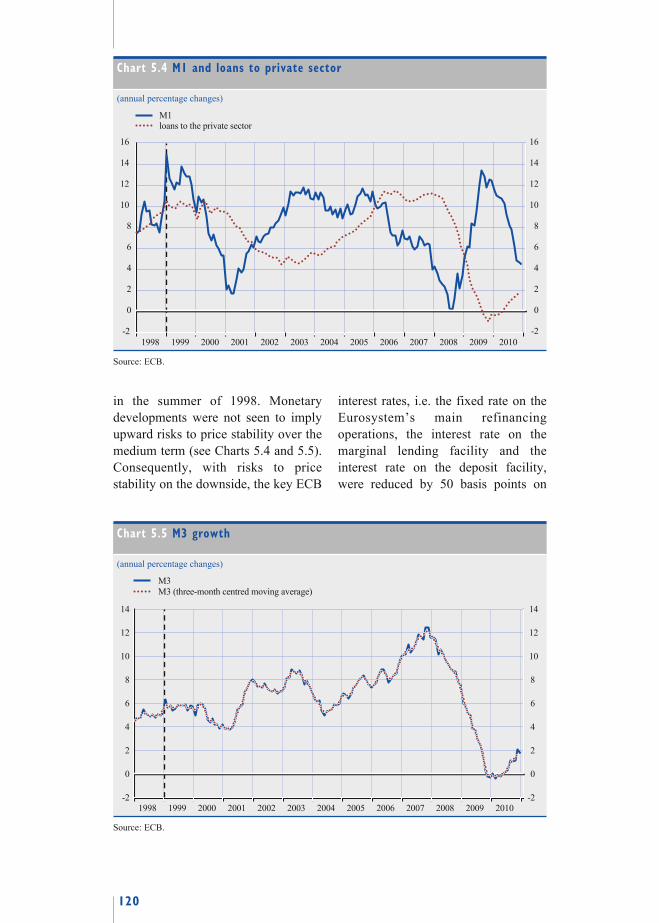
120
in the summer of 1998. Monetary
developments were not seen to imply
upward risks to price stability over the
medium term (see Charts 5.4 and 5.5).
Consequently, with risks to price
stability on the downside, the key ECB
interest rates, i.e. the fixed rate on the
Eurosystem’s main refinancing
operations, the interest rate on the
marginal lending facility and the
interest rate on the deposit facility,
were reduced by 50 basis points on
Chart 5.4 M1 and loans to private sector
(annual percentage changes)
-2
0
2
4
6
8
10
12
14
16
-2
0
2
4
6
8
10
12
14
16
1998 1999 2000 2001 2002 2003 2004 2005 2006 2007 2008 2009 2010
M1loans to the private sector
Source: ECB.
Chart 5.5 M3 growth
(annual percentage changes)
-2
0
2
4
6
8
10
12
14
-2
0
2
4
6
8
10
12
14
1998 1999 2000 2001 2002 2003 2004 2005 2006 2007 2008 2009 2010
M3
M3 (three-month centred moving average)
Source: ECB.
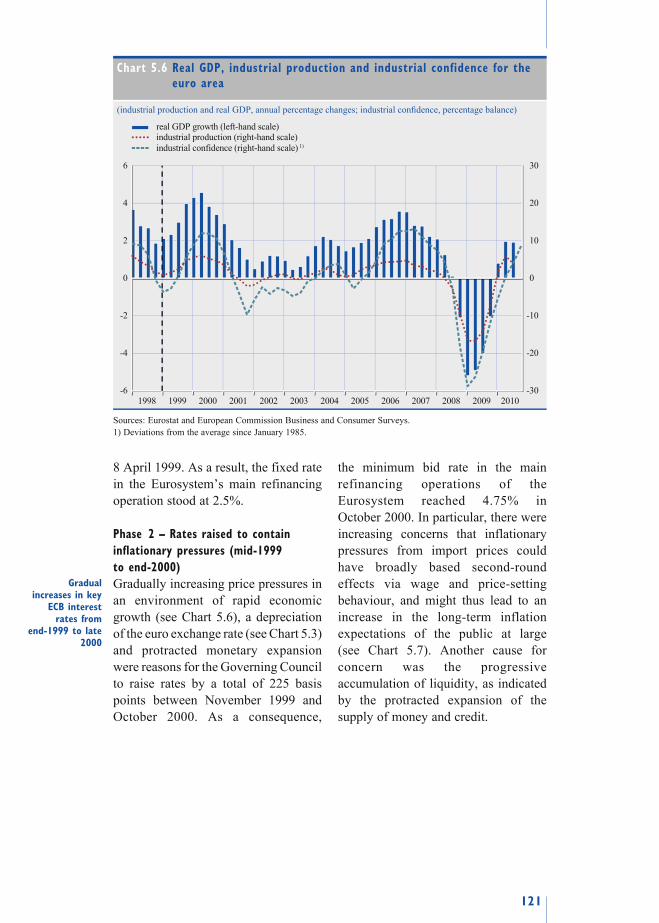
121
8 April 1999. As a result, the fixed rate
in the Eurosystem’s main refinancing
operation stood at 2.5%.
Phase 2 – Rates raised to contain
inflationary pressures (mid-1999
to end-2000)
Gradually increasing price pressures in
an environment of rapid economic
growth (see Chart 5.6), a depreciation
of the euro exchange rate (see Chart 5.3)
and protracted monetary expansion
were reasons for the Governing Council
to raise rates by a total of 225 basis
points between November 1999 and
October 2000. As a consequence,
the minimum bid rate in the main
refinancing operations of the
Eurosystem reached 4.75% in
October 2000. In particular, there were
increasing concerns that inflationary
pressures from import prices could
have broadly based second-round
effects via wage and price-setting
behaviour, and might thus lead to an
increase in the long-term inflation
expectations of the public at large
(see Chart 5.7). Another cause for
concern was the progressive
accumulation of liquidity, as indicated
by the protracted expansion of the
supply of money and credit.
Gradual increases in key
ECB interest rates from
end-1999 to late 2000
Chart 5.6 Real GDP, industrial production and industrial confidence for the euro area
(industrial production and real GDP, annual percentage changes; industrial confi dence, percentage balance)
-30
-20
-10
0
10
20
30
-6
-4
-2
0
2
4
6
1998 1999 2000 2001 2002 2003 2004 2005 2006 2007 2008 2009 2010
real GDP growth (left-hand scale)
industrial confidence (right-hand scale) 1)
industrial production (right-hand scale)
Sources: Eurostat and European Commission Business and Consumer Surveys.
1) Deviations from the average since January 1985.

122
Phase 3 – Downward adjustments to
key ECB interest rates (early 2001 to
mid-2003)
Between early 2001 and mid-2003,
the Governing Council reduced the
ECB’s key rates by a total of 275 basis
points, bringing the main refinancing
rate to 2% in June 2003. This was a
reaction to the continued decline in
inflationary pressures over this period,
which had been triggered mainly by
deteriorating prospects for economic
growth in the wake of severe shocks
that had hit the world economy and
global financial markets. In particular,
the terrorist attacks on the United States
on 11 September 2001 led to high
uncertainty and a loss of confidence
across the globe. Indeed, this event had
the potential to accelerate the downward
trend in economic activity and disrupt
the functioning of financial markets.
Given the high uncertainty prevailing
in the aftermath of the terrorist attacks
of September 2001, the strong
monetary expansion was not seen as
an indication of upside risks to price
stability over the medium term.
It was found that high volatility in
financial markets caused many
investors to shift investment away
from risky financial assets into
monetary assets, i.e. safer and more
liquid short-term assets. At the same
time, the growth of lending to the
private sector, especially that to non-
financial corporations, continued to
decline in an environment of subdued
economic activity.
Key ECB interest rates reduced
in response to receding
price pressures between early
2001 and mid-2003…
…while demand for liquid assets rose in times of heightened uncertainty
Chart 5.7 Indicators of long-term inflation expectations in the euro area
(annual percentage changes)
1.0
1.5
2.0
2.5
3.0
1.0
1.5
2.0
2.5
3.0
0.5 0.51999 2000 2001 2002 2003 2004 2005 2006 2007 2008 2009 2010
Consensus Economics 1)
SPF five-years-ahead 2)
five-year forward break-even inflation rate five years ahead 3)
ten-year break-even inflation rate 3), 4)
Sources: Thomson Reuters, EuroMTS, Consensus Economics and the ECB.
1) Survey of prominent financial and economic forecasters, as published by Consensus Economics.
2) Survey of Professional Forecasters conducted by the ECB on different variables at different horizons. Participants
are experts affiliated with institutions based within the European Union.
3) The break-even inflation rate reflects the average value of inflation expectations over the given horizon. From
2004, it is a constant maturity break-even inflation rate, estimated from the euro area nominal and real government
bond yield curves. Before 2004, it is calculated as the difference between the nominal yield on a standard bond and
the real yield on an inflation indexed-linked bond, issued by the same issuer and with similar maturity.
4) The ten-year break-even inflation rate in the period from January 1999 to October 2001 is the ten-year break-even
inflation rate for France, while that in the period from November 2001 to October 2010 is the ten-year break-even
inflation rate for the euro area.
123
Phase 4 – No changes to key ECB
interest rates (mid-2003 to end-2005)
Contained price pressures induced the
ECB to keep interest rates unchanged
between mid-2003 and end-2005.
Indeed, despite large increases in
commodity and energy prices, as well
as rises in indirect taxes and
administered prices, underlying
domestic inflationary pressures
remained contained over the period.
The recovery of economic activity in
the euro area was relatively modest
and gained momentum only gradually.
It started in the second half of 2003,
driven by exports against the
backdrop of a renewed dynamism of
the world economy. It then continued
in 2004 and 2005, also benefiting from
very favourable financing conditions.
Evidence from the monetary side
confirmed the view that the levels
of uncertainty and risk aversion were
gradually normalising, as reflected in
the unwinding of past portfolio shifts
into monetary assets. As a consequence,
monetary dynamics moderated in
2003 and early 2004, before gaining
momentum as from mid-2004.
Phase 5 – Withdrawal of monetary
accommodation (end-2005 to mid-2008)
Between December 2005 and July 2008,
the Governing Council raised interest
rates by a total of 225 basis points,
establishing the main refinancing rate
at 4.25% in July 2008. This adjustment
of the accommodative stance was
warranted to address upside risks to
price stability in a setting of sound
economic growth and a rapid expansion
of the supply of money and credit in
the euro area.
At the start of the adjustment cycle,
it was monetary analysis that provided
early signals of upside risks to price
stability at medium to longer-term
horizons. Robust credit growth as
from mid-2004 reflected the stimulative
effect both of the very low prevailing
level of interest rates in the euro area
and, at a later stage, of the renewed
dynamism of the euro area economy.
The strong monetary expansion
contributed further to the already ample
liquidity in the euro area.
Indications from economic analysis,
by contrast, were rather mixed at
the beginning of the adjustment of
key interest rates. However, in the first
half of 2006, economic growth in
the euro area gained momentum
and gradually became more broadly
based and increasingly self-sustaining,
with domestic demand acting as the
main driver.
As a result of substantial increases in
international oil and food prices in the
second half of 2007, annual inflation
rose sharply, and it continued to do so
in the first half of 2008. It reached
levels significantly above 2% around
the turn of 2008. Despite these price
shocks, wage developments remained
rather moderate and medium to
longer-term inflation expectations
stayed anchored at levels consistent
with price stability. In the first half
of 2008, however, the risks to price
stability over the medium term remained
clearly on the upside. In particular, the
possible emergence of second-round
effects in wage and price-setting as a
consequence of higher commodity
prices and elevated headline inflation
rates posed substantial upside risks to
price stability.
The expansion of money and credit
remained very dynamic throughout
this period. This was supported
by a persistently strong growth of
loans to the private sector, which
added further to the liquidity already
accumulated.
Contained price pressures caused
the Governing Council to keep
ECB interest rates unchanged
until end-2005
Gradual reduction of
the degree of monetary policy accommodation
between end-2005 and
mid-2008…
…triggered by signals from
monetary analysis…
…before the recovery gained momentum
Upside risks to price stability continued to prevail until mid-2008…
…confirmed by a cross-check with monetary analysis

124
When the first signs of financial market
tensions emerged in August 2007,
the ECB acted swiftly and decisively to
avoid a disruption of the interbank
market. It de facto provided unlimited
overnight liquidity through fine-tuning
operations. In addition, the provision of
liquidity to financial institutions was
frontloaded. In the months that
followed, temporary reciprocal
currency arrangements (swap lines)
were moreover established with other
central banks, primarily to address the
mounting pressure in short-term US
dollar funding markets. This caused the
tensions in the short-term segment of
the euro area money market to abate
considerably (see Box 5.1 for an
overview of the non-standard measures
taken by the Eurosystem).
Phase 6 – The ECB’s response to the
financial crisis (since autumn 2008)
Following the collapse of Lehman
Brothers, a US financial institution, on
15 September 2008, the financial turmoil
turned into a global financial and
economic crisis. Growing uncertainty
about the financial health of major banks
worldwide led to a collapse in activity in
a large number of financial market
segments. The crisis also began to spread
to the real sector, with a rapid and
synchronised deterioration in economic
conditions in most major economies and
a free fall in global trade.
The ECB, like other major central
banks, reduced its key interest rates to
historically low levels and embarked
on a series of non-standard policy
measures, with a view to preserving
price stability, stabilising the financial
situation and limiting contagion
vis-à-vis the real economy.
As regards the standard conduct of
monetary policy, the ECB first reduced
the key interest rates by 50 basis points
on 8 October 2008, in a concerted and
historic move together with other
major central banks, namely the Bank
of Canada, the Bank of England,
the Federal Reserve System, Sveriges
Riksbank and the Swiss National Bank.
Subsequently, taking into account the
weakened economic outlook and
significantly diminished upside risks to
price stability over the medium term,
the Governing Council reduced the key
interest rates further. The main
refinancing rate was cut by a total of
325 basis points to 1% within a period
of only seven months, i.e. between
October 2008 and May 2009
(see Chart 5.1).
At the same time, and fully in line with
its primary objective of maintaining
price stability, the Governing Council
adopted a number of temporary
non-standard measures to support
financing conditions and credit flows
to the euro area economy over and
beyond what could be achieved through
reductions in key interest rates alone.
Without addressing the persistent
funding problems of financial
institutions, the ECB would have run
the risk of the changes in key interest
rates being significantly less effective
than in normal times. These measures
were subsequently referred to as the
Enhanced Credit Support. The approach
comprised the five key elements
described in Box 5.1.
In the course of 2009, there were
increasing signs of improvement in
financial market conditions, with
uncertainty still prevailing. Thus,
in line with its exit strategy
(see Section 3.8), in December 2009
the Governing Council initiated
a gradual phasing-out of those
non-standard measures that were no
ECB also took measures
to address emerging
tensions in financial markets in 2007 and the
first half of 2008
Financial turmoil turned into
a crisis in autumn 2008
ECB responded with both
standard and non-standard
measures…
…key ECB interest rates were cut
to a historical low…
…and non-standard measures were introduced to ensure the proper transmission of these rate cuts and to enhance credit support
Some of the non-standard measures started to be phased out in late 2009

125
longer needed, while keeping other
elements of the Enhanced Credit
Support in place. In particular, it
announced the ending of the one-year
refinancing operations, after three such
operations had been launched during
2009. A number of other measures
were also phased out, but this proved
short-lived in view of the subsequent
emergence of tensions in some
sovereign debt markets.
In early 2010 tensions re-emerged in
some financial market segments,
in particular in the government bond
markets of some euro area countries
(see Chart 4.10). This was mainly the
result of increasing market concerns
about the sustainability of public
finances in view of rising government
deficits and debt, causing some
secondary markets to dry up.
For purposes of ensuring depth and
liquidity in those market segments that
were dysfunctional and restoring the
proper functioning of the monetary
policy transmission mechanism, the
Governing Council announced a
number of measures on 10 May 2010.
In particular, it introduced the Securities
Markets Programme with the aim of
intervening in the euro area public
and private debt securities markets
(see Box 5.1). In addition, the
Governing Council re-introduced some
of the non-standard measures that had
been withdrawn earlier, in order to
avoid spillovers from domestic
sovereign bond markets to other
financial markets. Overall, the measures
implemented by the Eurosystem in
response to the financial crisis helped
to sustain financial intermediation in
the euro area by safeguarding the
refinancing of solvent banks and
restoring confidence among financial
market participants. In turn, preserving
the viability of the banking system and
important segments of the financial
market was instrumental in keeping
credit available to households and
companies at accessible rates and,
ultimately, in maintaining price stability.
Non-standard monetary policy
measures are extraordinary steps
taken in response to exceptional
circumstances. They are temporary in
nature and are separate from, and
complement, the standard interest rate
instrument, and they can be adjusted
regardless of the prevailing level of
interest rates. At the beginning of 2011,
the emergence of short-term upward
pressure on overall inflation, mainly
owing to energy prices, warranted very
close monitoring of all developments.
Tensions in sovereign bond
markets in spring 2010…
…called for a new
non-standard measure
The monetary policy stance and the provision of liquidity will continue to be adjusted as appropriate
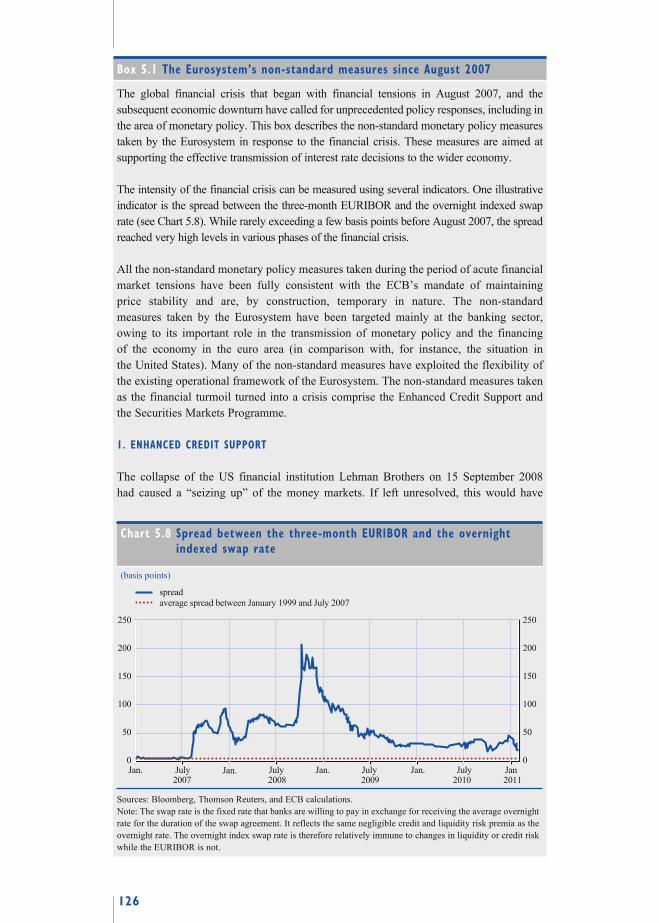
126
Box 5.1 The Eurosystem’s non-standard measures since August 2007
The global financial crisis that began with financial tensions in August 2007, and the
subsequent economic downturn have called for unprecedented policy responses, including in
the area of monetary policy. This box describes the non-standard monetary policy measures
taken by the Eurosystem in response to the financial crisis. These measures are aimed at
supporting the effective transmission of interest rate decisions to the wider economy.
The intensity of the financial crisis can be measured using several indicators. One illustrative
indicator is the spread between the three-month EURIBOR and the overnight indexed swap
rate (see Chart 5.8). While rarely exceeding a few basis points before August 2007, the spread
reached very high levels in various phases of the financial crisis.
All the non-standard monetary policy measures taken during the period of acute financial
market tensions have been fully consistent with the ECB’s mandate of maintaining
price stability and are, by construction, temporary in nature. The non-standard
measures taken by the Eurosystem have been targeted mainly at the banking sector,
owing to its important role in the transmission of monetary policy and the financing
of the economy in the euro area (in comparison with, for instance, the situation in
the United States). Many of the non-standard measures have exploited the flexibility of
the existing operational framework of the Eurosystem. The non-standard measures taken
as the financial turmoil turned into a crisis comprise the Enhanced Credit Support and
the Securities Markets Programme.
1. ENHANCED CREDIT SUPPORT
The collapse of the US financial institution Lehman Brothers on 15 September 2008
had caused a “seizing up” of the money markets. If left unresolved, this would have
Chart 5.8 Spread between the three-month EURIBOR and the overnight indexed swap rate
(basis points)
0
50
100
150
200
250
0
50
100
150
200
250
Jan. July Jan. July Jan. July Jan. July Jan
spread
average spread between January 1999 and July 2007
2007 2008 2009 2010 2011
Sources: Bloomberg, Thomson Reuters, and ECB calculations.
Note: The swap rate is the fixed rate that banks are willing to pay in exchange for receiving the average overnight
rate for the duration of the swap agreement. It reflects the same negligible credit and liquidity risk premia as the
overnight rate. The overnight index swap rate is therefore relatively immune to changes in liquidity or credit risk
while the EURIBOR is not.

127
made the refinancing of many bank assets impossible, risking a massive and disorderly
deleveraging by credit institutions, with severe consequences for the real economy and
price stability. The ECB’s Enhanced Credit Support is a set of non-standard measures
to support financing conditions and the flow of credit beyond what could be achieved
through reductions in key ECB interest rates alone. These measures were adopted in
October 2008 and complemented in May 2009. Reflecting the financial structure of the
euro area, these measures are primarily bank-based and help to ensure a more normal
functioning of money markets.
Extension of the maturity of liquidity provision
The Eurosystem had already increased the amount of liquidity provided in longer-term
refinancing operations (LTROs) after the ECB’s decision to introduce supplementary
refinancing operations with maturities of three and six months during the period of
financial turmoil. After the collapse of Lehman Brothers, the maximum maturity of the
LTROs was temporarily extended to twelve months. This increased the Eurosystem’s
inter mediation role aimed at easing refinancing concerns of the euro area banking system,
especially for term maturities. Reduced uncertainty and a longer liquidity planning
horizon was expected to encourage banks to continue providing credit to the economy.
Moreover, the measures were expected to contribute to keeping money market interest
rates at low levels.
Fixed rate full allotment
A fixed rate full allotment tender procedure was also adopted for all refinancing operations
during the financial crisis. Thus, contrary to normal practice, eligible euro area financial
institutions had unlimited access to central bank liquidity at the main refinancing rate,
subject to adequate collateral.
Currency swap agreements
The Eurosystem also temporarily provided liquidity in foreign currencies during the
financial crisis, most notably in US dollars, at various maturities. It used reciprocal
currency arrange ments with the Federal Reserve System to provide funding in US dollars
against Eurosystem eligible collateral at various maturities at fixed interest rates with full
allotment. This measure supported banks which otherwise faced a massive shortfall in
US dollar funding during the period of financial crisis.
Collateral requirements
The list of eligible collateral accepted in Eurosystem refinancing operations was extended
during the financial crisis, and this allowed banks to use a larger range and proportion of
their assets to obtain central bank liquidity. The ability to refinance illiquid assets through
the central bank provides an effective remedy to liquidity shortages caused by a sudden
halt in interbank lending. This includes, for instance, asset-backed securities, which
became illiquid when the market collapsed after the default of Lehman Brothers.
Covered bond purchase programme
Within the scope of this programme, the Eurosystem purchased euro-denominated
covered bonds issued in the euro area at a value of €60 billion over the period between
May 2009 and June 2010. The covered bonds market had virtually dried up in terms of
liquidity, issuance and spreads. The aim of the covered bond purchase programme was
to revive the covered bond market, which is a very important financial market in Europe
and a primary source of financing for banks.

128
As a result of the non-standard measures taken during the financial crisis, the relationship
between the main refinancing rate and money market rates temporarily changed. Whereas
in normal circumstances the EONIA rate closely follows movements in the main
refinancing rate, the high demand from banks for central bank liquidity in refinancing
operations with full allotment has resulted in the deposit rate playing a greater role in
steering the EONIA, as can be seen in Chart 4.2.
2. SECURITIES MARKETS PROGRAMME
The Securities Markets Programme was introduced in response to tensions in some
segments of the financial market, in particular in the euro area sovereign bond markets,
in May 2010. Chart 5.9 illustrates the large increases in the spreads between the yields on
ten-year bonds of some euro area governments and the German Bund yield.
Under the programme, Eurosystem interventions can be carried out in the euro area public
and private debt securities markets to ensure depth and liquidity in dysfunctional market
segments and to restore the proper functioning of the monetary policy transmission
mechanism. In line with the provisions of the Treaty on the Functioning of the European
Union, Eurosystem purchases of government bonds are strictly limited to secondary
markets. To ensure that liquidity conditions are not affected, all purchases are fully
neutralised through liquidity-absorbing operations.
Chart 5.9 Spreads of the ten-year government bonds of selected euro area countries against the German Bund
(basis points)
0
250
500
750
1,000
0
250
500
750
1,000
Jan.2007 2008 2009 20112010July Jan. July Jan. July Jan. Jan.July
Greece
Ireland
Italy
Portugal
Spain
Source: Thomson Reuters and ECB calculations.
129
5.3 AN ASSESSMENT OF MONETARY
POLICY SINCE THE INTRODUCTION
OF THE EURO IN 1999
Since the introduction of the euro
in 1999, the single monetary policy has
had to weather a number of different
shocks. A series of substantial adverse
upside price shocks has hit the economy
during this time, notably the significant
increase in oil prices, substantial rises
in international food prices and, on the
domestic side, almost regular increases
in indirect taxes and marked increases
in administered prices in most euro
area countries. At the same time,
the bursting of the “new economy”
bubble in 2000-2001, the terrorist
attacks on the United States in
September 2001 and acute financial
market tensions from 2007 onwards
have highlighted the vulnerability of
the world economy and the international
financial system.
Monetary policy had to react to
these shocks with the appropriate
medium-term orientation to ensure a
solid anchoring of inflation expectations
in line with the ECB’s definition
of price stability. This medium-term
orientation also implied that monetary
policy had to look beyond short-term
movements in prices and, at times,
mitigate dysfunctionalities in the
monetary policy transmission
mechanism. The monetary analysis, in
particular, ensured such a medium-
term orientation in the conduct of
monetary policy.
Despite a series of adverse shocks to
the inflation rate and, as of autumn
2008, a crisis period of a magnitude
that has not been seen since at least the
Great Depression in the 1930s, average
annual HICP inflation in the euro area
between January 1999 and early 2011
has been fully in line with the aim of
the Governing Council to keep inflation
rates below, but close to, 2% over the
medium term. Since the beginning of
1999, all indicators of long-term
inflation expectations in the euro area
have moreover remained firmly
anchored in line with price stability. It
is also notable that inflation expectations
remained at those levels in periods of
both rising and falling inflationary
pressures. This indicates that the
general public and the markets have
had faith in the ECB’s determination to
maintain price stability over the
medium term. This not only holds true
for the long-term inflation expectations
revealed by surveys of private
economists, but can also be
seen in the long-term inflation
expectations embedded in bond prices
(see Chart 5.7). These are positive
indications that the ECB has been able,
from the outset, to gain credibility and
to convince the public and the markets
that it was committed to maintaining
price stability over the medium term.
In a challenging environment of economic and financial
shocks…
…the ECB acted with a
medium-term perspective,
underpinned by its monetary
analysis,…
…and maintained
credibility in fulfilling its
price stability mandate


131
ANNEXHISTORY – THE THREE STAGES OF ECONOMIC AND MONETARY UNION
In June 1988 the European Council confirmed the objective of a progressive
realisation of economic union and mandated a Committee chaired by Jacques
Delors (President of the European Commission at the time) to study and propose
concrete stages leading to this union. The Committee was composed of the
governors of the central banks of the Member States of the European Community,
Alexandre Lamfalussy (General Manager of the Bank for International Settlements
at the time), Niels Thygesen (Professor of Economics in Copenhagen) and
Miguel Boyer (President of the Banco Exterior de España). The resulting “Delors
Report” proposed that economic and monetary union should be achieved in three
discrete but evolutionary steps.
Stage One of Economic and Monetary Union
On the basis of the Delors Report, the European Council decided in June 1989
that the first stage of the realisation of Economic and Monetary Union (EMU)
should begin on 1 July 1990 – the date on which, in principle, all restrictions on
the movement of capital between Member States were abolished. At that time,
the Committee of Governors of the Central Banks of the Member States of the
European Economic Community, which had played an increasingly important
role in monetary cooperation since its creation in May 1964, was given additional
responsibilities. These were laid down in a Council Decision dated 12 March
1990 and included holding consultations on, and promoting the coordination
of, the monetary policies of the Member States, with the aim of achieving price
stability. In view of the relatively short time available and the complexity of the
tasks involved, the preparatory work for Stage Three of EMU was also initiated
by the Committee of Governors. The first step was to identify all the issues that
should be examined at an early stage, to establish a work programme by the end
of 1993 and, on the basis thereof, to define the mandates of the existing sub-
committees and the working groups established for that purpose.
For the realisation of Stages Two and Three, it was necessary to revise the Treaty
establishing the European Economic Community (the “Treaty of Rome”) in order
to establish the required institutional structure. To this end, an Intergovernmental
Conference on EMU was convened, which was held in 1991, in parallel with the
Intergovernmental Conference on political union. The negotiations resulted in
the Treaty on European Union which was agreed upon in December 1991 and
signed in Maastricht on 7 February 1992. On account of delays in the ratification
process, however, the Treaty (which amended the Treaty establishing the
European Economic Community – changing its name to the Treaty establishing
the European Community – and introduced, inter alia, the Protocol on the Statute
of the European System of Central Banks and of the European Central Bank and
the Protocol on the Statute of the European Monetary Institute) did not come into
force until 1 November 1993.

132
Stage Two of Economic and Monetary Union – establishment of the EMI and the ECB
The establishment of the European Monetary Institute (EMI) on 1 January 1994
marked the start of the second stage of EMU and, consequently, the Committee of
Governors ceased to exist. The EMI’s transitory existence also mirrored the state
of monetary integration within the Community. The EMI had no responsibility
for the conduct of monetary policy in the European Union – this remained the
preserve of the national authorities – nor had it any competence for carrying out
foreign exchange intervention.
The two main tasks of the EMI were:
i. to strengthen central bank cooperation and monetary policy coordination;
and
ii. to make the preparations required for the establishment of the European
System of Central Banks (ESCB), for the conduct of the single monetary
policy and for the creation of a single currency in the third stage.
To this end, the EMI provided a forum for consultation and for the exchange
of views and information on policy issues, and it specified the regulatory,
organisational and logistical framework necessary for the ESCB to perform its
tasks in Stage Three.
In December 1995 the European Council agreed to name the European currency
unit to be introduced at the start of Stage Three the “euro”, and confirmed that
Stage Three of EMU would start on 1 January 1999. A chronological sequence
of events was pre-announced for the changeover to the euro. This scenario was
based mainly on detailed proposals put forward by the EMI. At the same time,
the EMI was given the task of carrying out preparatory work on the future
monetary and exchange rate relationships between the euro area and other
EU countries. In December 1996 the EMI presented its report to the European
Council. This report became the basis of a Resolution of the European Council
on the principles and fundamental elements of the new exchange rate mechanism
(ERM II), which was adopted in June 1997.
In December 1996 the EMI also presented to the European Council – and,
subsequently, to the public – the design series selected for the euro banknotes to
be put into circulation on 1 January 2002.
In order to complement and flesh out the Treaty provisions on EMU, the European
Council adopted the Stability and Growth Pact in June 1997 – two Regulations
form part of the Stability and Growth Pact, which aims to ensure budgetary
discipline in respect of EMU. The Pact was supplemented, and the respective
commitments enhanced, by a Declaration of the Council in May 1998.
On 2 May 1998 the Council of the European Union – in the composition of the
Heads of State or Government – unanimously decided that 11 Member States
(Belgium, Germany, Spain, France, Ireland, Italy, Luxembourg, the Netherlands,
Austria, Portugal and Finland) had fulfilled the conditions necessary for the adoption
of the single currency on 1 January 1999. These countries were therefore to participate
133
in the third stage of EMU. The Heads of State or Government also reached a
political understanding on the persons to be recommended for appointment as
members of the Executive Board of the ECB.
At the same time, the ministers of finance of the Member States adopting the
single currency agreed, together with the governors of the national central banks
of these Member States, the European Commission and the EMI, that the current
bilateral central rates of the currencies of the participating Member States in
the ERM would be used in determining the irrevocable conversion rates for
the euro.
On 25 May 1998 the governments of the 11 participating Member States
appointed the President, the Vice-President and the four other members of the
Executive Board of the ECB. Their appointment took effect from 1 June 1998 and
marked the establishment of the ECB. The ECB and the national central banks of
the participating Member States constitute the Eurosystem, which formulates and
defines the single monetary policy in Stage Three of EMU.
With the establishment of the ECB on 1 June 1998, the EMI had completed its
tasks. In accordance with Article 123 (ex Article 109l) of the Treaty establishing
the European Community, the EMI went into liquidation on the establishment of
the ECB. All the preparatory work entrusted to the EMI was concluded in good
time, and the rest of 1998 was devoted by the ECB to the final testing of systems
and procedures.
Stage Three of Economic and Monetary Union – irrevocable fixing of exchange rates
On 1 January 1999 the third and final stage of EMU commenced with the
irrevocable fixing of the exchange rates of the currencies of the 11 Member
States initially participating in Monetary Union and with the conduct of a single
monetary policy under the responsibility of the ECB.
The number of participating Member States increased to 12 on 1 January 2001,
when Greece entered the third stage of EMU. Slovenia became the 13th member
of the euro area on 1 January 2007, followed one year later by Cyprus and Malta,
by Slovakia on 1 January 2009 and by Estonia on 1 January 2011. On the day
each country joined the euro area, its central bank automatically became part of
the Eurosystem.


135
GLOSSARY
Accountability: the obligation of an independent institution to properly explain
and justify its decisions to the citizens and their elected representatives, thereby
making it responsible for fulfilling its objectives.
Asset: a resource controlled by an enterprise as a result of past events, from which
future economic benefits are expected to flow to the enterprise.
Bank lending survey (BLS): a quarterly survey on lending policies that has
been conducted by the Eurosystem since January 2003. It addresses qualitative
questions on developments in credit standards, terms and conditions of loans and
loan demand for both enterprises and households to a predefined sample group of
banks in the euro area.
Bond market: the market in which longer-term debt securities are issued and
traded.
Break-even inflation rate (BEIR): the spread between the yield on a nominal
bond and that on an inflation-linked bond of the same (or as similar as possible)
maturity.
Broad Economic Policy Guidelines (BEPGs): guidelines adopted by the
Council of the European Union in line with Article 121(2) of the TFEU to
provide the framework for defining the economic policies of the Member States
and of the EU.
Central bank independence: the legal provision which guarantees that a central
bank can carry out its tasks and duties without political interference. Article 130
of the TFEU establishes the principle of central bank independence for the
euro area.
Collateral: an asset or third-party commitment that is used by a collateral
provider to secure an obligation vis-à-vis a collateral taker.
Consolidated balance sheet of the MFI sector: a balance sheet obtained
by netting out inter-MFI positions (e.g. inter-MFI loans and deposits) on the
aggregated MFI balance sheet. It provides statistical information on the MFI
sector’s assets and liabilities vis-à-vis residents of the euro area not belonging
to this sector (i.e. the general government and other euro area residents) and
vis-à-vis non-euro area residents. It is the main statistical source for the calculation
of monetary aggregates and provides the basis for the regular analysis of the
counterparts of M3.
Convergence criteria: the four criteria set out in Article 140(1) of the TFEU that
must be fulfilled by each Member State before it can adopt the euro, namely a
stable price level, sound public finances (a deficit and a level of debt that are both
limited in terms of GDP), a stable exchange rate and low and stable long-term

136
interest rates. In addition, each Member State must ensure the compatibility of its
national legislation, including the statutes of the national central bank, with both
the Treaty on the Functioning of the European Union and the Statute of the
European System of Central Banks and of the European Central Bank.
Council: see Council of the European Union.
Council of the European Union (Council): the institution of the EU made
up of representatives of the governments of the EU Member States, normally
the ministers responsible for the matters under consideration, and the related
European Commissioner. The Council meeting in the composition of the ministers
of economics and finance is often referred to as the “ECOFIN Council”.
Counterparty: the opposite party in a financial transaction (e.g. any party
transacting with a central bank).
Credit institution: (i) an undertaking whose business is to receive deposits or
other repayable funds from the public and to grant credit for its own account;
or (ii) an undertaking or any other legal person, other than those under i), which
issues means of payment in the form of electronic money.
Credit to euro area residents: a broad measure of the financing of non-monetary financial institution (MFI) euro area residents (including general government and the private sector) provided by the MFI sector. It is defined as including MFI
loans to euro area residents and MFI holdings of securities issued by euro area
residents. The latter include shares, other equity and debt securities. As securities
can be seen as an alternative source of funds to loans, and as some loans can be
securitised, this definition provides more accurate information on the total amount
of financing provided by the MFI sector to the economy than a narrow definition
comprising loans only.
Currency in circulation: banknotes and coins in circulation that are commonly
used to make payments. Currency in circulation as included in M3 is a net
concept, meaning that it refers only to banknotes and coins in circulation that are
held outside the MFI sector (i.e. currency held by MFIs or “vault cash” has been
subtracted). Excluded are central banks’ stocks of own banknotes (as they have
not been put into circulation) and collector coins (as they are not intended for use
in making payments).
Debt market: the market in which debt instruments are issued and traded.
Securitised debt has to be repaid by the issuer at maturity.
Debt ratio: one of the fiscal criteria used to determine the existence of an
excessive deficit, as laid down in Article 126(2) of the TFEU. It is defined as
the ratio of government debt to gross domestic product at current market prices,
while government debt is defined in Protocol No 12 (on the excessive deficit procedure) as the total gross debt at nominal value outstanding at the end of the
year and consolidated between and within the sectors of general government.

137
Debt security: a promise on the part of the issuer (i.e. the borrower) to make one
or more payment(s) to the holder (the lender) at a specified future date or dates.
Such securities usually carry a specific rate of interest (the coupon) and/or are
sold at a discount to the amount that will be repaid at maturity. Debt securities
issued with an original maturity of more than one year are classified as long-term.
Money market paper and, in principle, private placements are included in the debt
securities statistics of the European Central Bank (ECB).
Deficit ratio: one of the fiscal criteria used to determine the existence of an
excessive deficit, as laid down in Article 126(2) of the TFEU. It is defined as
the ratio of the planned or actual government deficit to gross domestic product at
current market prices. The government deficit is defined in Protocol No 12 (on the
excessive deficit procedure) as net borrowing of the general government.
Deflation: a generalised, persistent and self-reinforcing decline in a broad set of
prices that results from a drop in aggregate demand and becomes entrenched in
expectations.
Degree of openness: a measure of the extent to which an economy depends on
trade with other countries or regions, e.g. the ratio of the sum of total imports and
exports to GDP.
Deposit facility: a standing facility of the Eurosystem which counterparties
may use to make overnight deposits at a national central bank. Such deposits
are remunerated at a pre-specified interest rate (see key ECB interest rates).
Deposits redeemable at notice: savings deposits for which the holder must
respect a fixed period of notice before withdrawing the funds. In some cases there
is the possibility of withdrawing on demand a certain fixed amount in a specified
period or of early withdrawal subject to the payment of a penalty. Deposits
redeemable at a period of notice of up to three months are included in M2 (and hence in M3), while those with a longer period of notice are included in the
(non-monetary) longer-term financial liabilities of the MFI sector.
Deposits with an agreed maturity: mainly time deposits with a given maturity
that, depending on national practices, may be subject to the payment of a penalty
in the event of early withdrawal. Some non-marketable debt instruments, such
as non-transferable (retail) certificates of deposit, are also included. Deposits
with an agreed maturity of up to two years are included in M2 (and hence
in M3), while those with an agreed maturity of over two years are included in the
(non-monetary) longer-term financial liabilities of the MFI sector.
Derivative: a financial contract whose value depends on the value of one or more
underlying reference assets, rates or indices, on a measure of economic value or
on factual events.
ECOFIN Council: see Council of the European Union.

138
Economic and Financial Committee (EFC): a committee which contributes
to the preparation of the work of the ECOFIN Council and the European
Commmission. Article 134(2) of the TFEU contains a list of the tasks of the
EFC which include reviewing the economic and financial situation of both the
Member States and the EU, and contributing to budgetary surveillance.
Economic and Monetary Union (EMU): the process that led to the single
currency, the euro, and the single monetary policy in the euro area, as well as the
coordination of the economic policies of the EU Member States. This process,
as laid down in the Treaty establishing the European Community, took place
in three stages. Stage Three, the final stage, started on 1 January 1999 with
the transfer of monetary competence to the European Central Bank and the
introduction of the euro. The cash changeover on 1 January 2002 completed the
process of setting up EMU.
ECU (European Currency Unit ): prior to Stage Three of EMU, the ECU was a
basket currency made up of the sum of fixed amounts of 12 out of the 15 currencies
of the Member States. The value of the ECU was calculated as a weighted average
of the value of its component currencies. The ECU was replaced by the euro on a
one-for-one basis on 1 January 1999.
Eligible assets (eligible collateral): assets which can be used as collateral in
order to obtain credit from the Eurosystem.
Employment Guidelines: guidelines adopted by the Council of the European Union in line with Article 148(2) of the TFEU to provide the framework for
defining the employment policies of the Member States and of the EU.
Enhanced Credit Support: the non-standard measures taken by the
ECB/Eurosystem during the financial crisis with a view to supporting
financing conditions and credit flows above and beyond what could be achieved
through reductions in key ECB interest rates alone.
EONIA (euro overnight index average): a measure of the effective interest
rate prevailing in the euro interbank overnight market. It is calculated as a
weighted average of the interest rates on unsecured overnight lending transactions
denominated in euro, as reported by a panel of contributing banks.
Equity market: the market in which equities are issued and traded.
ERM II (exchange rate mechanism II): the exchange rate arrangement which
provides the framework for exchange rate policy cooperation between the euro area countries and the non-euro area EU Member States. ERM II is a multilateral
arrangement with fixed, but adjustable, central rates and a standard fluctuation
band of ±15%. Decisions concerning central rates and, possibly, narrower
fluctuation bands are taken by mutual agreement between the EU Member State
concerned, the euro area countries, the European Central Bank (ECB) and

139
the other EU Member States participating in the mechanism. All participants
in ERM II, including the ECB, have the right to initiate a confidential procedure
aimed at changing the central rates (realignment).
EURIBOR (euro interbank offered rate): the rate at which a prime bank is
willing to lend funds in euro to another prime bank. The EURIBOR is computed
daily, based on the rates of a sample of selected banks, for different maturities of
up to 12 months.
Euro: the name of the European single currency adopted by the European Council at its meeting in Madrid on 15 and 16 December 1995.
Euro area: the area formed by the EU Member States whose currency is the
euro and in which a single monetary policy is conducted under the responsibility
of the Governing Council of the European Central Bank (ECB). In 2011 the
euro area comprises Belgium, Germany, Estonia, Ireland, Greece, Spain, France,
Italy, Cyprus, Luxembourg, Malta, the Netherlands, Austria, Portugal, Slovenia,
Slovakia and Finland.
Eurogroup: an informal gathering of the ministers of economics and finance of
the EU Member States whose currency is the euro. Its status is recognised under
Article 137 of the TFEU and in Protocol No 14 (on the Euro Group). The European Commission and the ECB are regularly invited to take part in its meetings.
European Central Bank (ECB): the ECB lies at the centre of the Eurosystem
and the European System of Central Banks (ESCB) and has its own legal
personality in accordance with the Treaty (Article 282(3)). It ensures that the tasks
conferred upon the Eurosystem and the ESCB are implemented either through its
own activities or through those of the NCBs, pursuant to the Statute of the ESCB.
The ECB is governed by the Governing Council and the Executive Board, and,
as a third decision-making body, by the General Council.
European Commission: the Union institution which ensures the application of
the provisions of the Treaty. The Commission develops EU policies, proposes
EU legislation and exercises powers in specific areas. In the area of economic
policy, the Commission produces Integrated Guidelines for Growth and Jobs, containing the Broad Economic Policy Guidelines and the Employment Guidelines, and reports to the Council of the European Union (Council)
on economic developments and policies. It monitors public finances within the
framework of multilateral surveillance and submits reports to the Council.
European Council: the institution of the EU consisting of the Heads of
State or Government of the EU Member States and, as non-voting members,
the President of the European Commission and the European Council’s own
President. It provides the EU with the necessary impetus for its development and
defines the general political directions and priorities thereof. It does not have a
legislative function.
140
European Monetary Institute (EMI): a temporary institution established at the
start of Stage Two of Economic and Monetary Union on 1 January 1994. It went
into liquidation following the establishment of the European Central Bank on
1 June 1998.
European Parliament: an EU institution that currently consists of 736 directly
elected representatives of the citizens of the Member States. It plays a role in
the EU’s legislative process, although with differing prerogatives that depend
on the procedures through which the respective EU legislation is to be enacted.
Where monetary policy and the ESCB are concerned, the powers of the European
Parliament are mainly consultative in character, although the Treaty on the Functioning of the European Union provides for certain procedures with respect
to the democratic accountability of the ECB vis-à-vis the Parliament (presentation
of the ECB’s Annual Report, including a general debate on monetary policy, and
hearings before the competent parliamentary committees).
European System of Accounts 1995 (ESA 95): a comprehensive and integrated
system of macroeconomic accounts based on a set of internationally agreed
statistical concepts, definitions, classifications and accounting rules aimed at
achieving a harmonised quantitative description of the economies of the EU
Member States. The ESA 95 is the EU’s current version of the world System of
National Accounts 1993 (SNA 93).
European System of Central Banks (ESCB): composed of the European Central Bank and the national central banks of all EU Member States, i.e. it
includes, in addition to the members of the Eurosystem, the national central
banks of those Member States whose currency is not the euro.
Eurostat: the Statistical Office of the EU. Eurostat is part of the European Commission and responsible for the production of EU statistics.
Eurosystem: the central banking system of the euro area. It comprises the
European Central Bank and the national central banks of the EU Member States whose currency is the euro.
Eurosystem/ECB staff projections: the results of exercises conducted by
Eurosystem/ECB staff to project possible future macroeconomic developments
in the euro area as part of the economic analysis.
Excessive deficit procedure: the provision set out in Article 126 of the TFEU
and specified in Protocol (No 12) on the excessive deficit procedure requires
EU Member States to maintain budgetary discipline, defines the criteria for a
budgetary position to be considered an excessive deficit and regulates steps to be
taken following the observation that the requirements for the budgetary balance or
government debt have not been fulfilled. Article 126 is supplemented by Council Regulation (EC) No 1467/97 of 7 July 1997 on speeding up and clarifying the
implementation of the excessive deficit procedure (as amended by Council
Regulation (EC) No 1056/2005 of 27 June 2005), which is one element of the
Stability and Growth Pact.

141
Exchange rate targeting: a monetary policy strategy that aims for a given
(usually a stable or even fixed) exchange rate against another currency or group
of currencies.
Executive Board: one of the decision-making bodies of the European Central Bank (ECB). It comprises the President and the Vice-President of the ECB and
four other members appointed by the European Council, acting by a qualified
majority, on a recommendation from the Council of the European Union, after
it has consulted the European Parliament and the ECB.
Financial markets: markets in which those who have a surplus of funds lend to
those who have a shortage.
Financial stability: the condition in which the financial system – comprising
financial intermediaries, markets and market infrastructures – is capable of
withstanding shocks and the unravelling of financial imbalances, thereby
mitigating the likelihood of disruptions in the financial intermediation process
which are severe enough to significantly impair the allocation of savings to
profitable investment opportunities.
Fine-tuning operation: an open market operation executed by the Eurosystem in order to deal with unexpected liquidity fluctuations in the market. The
frequency and maturity of fine-tuning operations are not standardised.
Fixed rate tender: a tender procedure, in which the interest rate is specified in
advance by the central bank and in which participating counterparties bid the
amount of money they want to transact at the fixed interest rate.
Foreign exchange swap: simultaneous spot and forward transactions exchanging
one currency against another.
Forward rate agreement (FRA): an agreement whereby one party undertakes to
pay another party a certain interest rate on a certain principal amount for a certain
period of time beginning at some point in the future.
Futures contract: a contract to buy or sell securities or a commodity at a
predetermined price on a specified future date.
General Council of the ECB: one of the decision-making bodies of the ECB.
It comprises the President and the Vice-President of the ECB and the governors
of all EU national central banks.
General government: a sector defined in the European System of Accounts 1995 (ESA 95) as comprising resident entities that are engaged primarily in
the production of non-market goods and services intended for individual and
collective consumption and/or in the redistribution of national income and wealth.
Included are central, regional and local government authorities, as well as social
security funds. Excluded are government-owned entities that conduct commercial
operations, such as public enterprises.

142
Governing Council of the ECB: the supreme decision-making body of the
European Central Bank (ECB). It comprises all the members of the Executive Board of the ECB and the governors of the national central banks of the
Member States whose currency is the euro.
Haircut: a risk control measure applied to underlying assets whereby the value
of those underlying assets is calculated as the market value of the assets reduced
by a certain percentage (the “haircut”). Haircuts are applied by a collateral taker
in order to protect itself from losses resulting from declines in the market value of
a security in the event that it needs to liquidate that collateral.
Harmonised Index of Consumer Prices (HICP): a measure of the development
of consumer prices that is compiled by Eurostat and is harmonised across for all
EU Member States. The HICP is the measure of prices used by the ECB to define
price stability in quantitative terms.
Households: one of the institutional sectors in the European System of Accounts 1995 (ESA 95). The household sector covers individuals or groups
of individuals as consumers, but also as entrepreneurs (i.e. sole proprietorships
and partnerships). Non-profit institutions serving households are a separate
institutional sector according to the ESA 95, although they are often reported
together with households.
Inflation: an increase in the general price level, e.g. in the consumer price
index.
Inflation risk premium: compensation of investors for the risks associated with
holding assets (denominated in nominal terms) over the longer term.
Inflation targeting: a monetary policy strategy aimed at maintaining price stability by focusing on deviations in published inflation forecasts from an
announced inflation target.
Inflation-indexed government bonds: debt securities issued by the general
government, the coupon payments and principal of which are linked to a specific
consumer price index.
Integrated Guidelines: guidelines adopted by the Council of the European Union (Council) to promote growth and jobs, bringing together the Broad Economic Policy Guidelines and the Employment Guidelines.
Interbank money market: the market for short-term lending between banks,
usually involving the trading of funds with a maturity of between one day
(overnight or even shorter) and one year.
Key ECB interest rates: the interest rates, set by the Governing Council, which
reflect the monetary policy stance of the European Central Bank. They are the
rates on the main refinancing operations, the marginal lending facility and the
deposit facility.

143
Labour force: the sum total of persons in employment and the number of
unemployed.
Labour force participation rate: the labour force as a proportion of the total
working age population. The working age population is normally defined as the
population aged between 15 and 64 years of age. The labour force comprises both
employed and unemployed persons.
Leading indicators: economic variables which anticipate or contain useful
information for predicting future developments in other variables.
Liability: a present obligation of the enterprise arising from past events, the
settlement of which is expected to result in an outflow from the enterprise of
resources embodying economic benefits.
Loans to euro area residents: funds lent by monetary financial institutions (MFIs) to borrowers and not evidenced by negotiable documents or represented
by one single document (if it has become negotiable). This description includes
loans granted to households, non-financial corporations and government. Loans
to households can take the form of consumer credit (loans granted for personal
use in the consumption of goods and services), lending for house purchases
(credit extended for the purpose of investing in housing, including building and
home improvements) and other lending (loans granted for purposes such as debt
consolidation, education, etc.) (see also credit to euro area residents).
Long-term interest rates: the rates of interest or the yield on interest-bearing
financial assets with a relatively long period to maturity, for which the yield on
government bonds with a maturity of ten years are often used as a benchmark.
Longer-term refinancing operation: a credit operation with a maturity of
more than one week that is executed by the Eurosystem in the form of reverse transactions. The regular monthly operations have a maturity of three months.
During the financial market crisis, supplementary operations with maturities
ranging from one maintenance period to one year were conducted, the frequency
of which varied.
M1: a narrow monetary aggregate that comprises currency in circulation plus
overnight deposits held with MFIs and central government (e.g. at the post office
or treasury).
M2: an intermediate monetary aggregate that comprises M1 plus deposits
redeemable at a period of notice of up to and including three months (i.e. short-
term savings deposits) and deposits with an agreed maturity of up to and including
two years (i.e. short-term time deposits) held with MFIs and central government.
M3: a broad monetary aggregate that comprises M2 plus marketable instruments,
in particular repurchase agreements, money market fund shares/units, and debt
securities with a maturity of up to and including two years issued by MFIs.

144
Main refinancing operation: a regular open market operation executed by the
Eurosystem in the form of reverse transactions. Such operations are conducted
through a weekly standard tender and normally have a maturity of one week.
Maintenance period: the period over which credit institutions’ compliance
with reserve requirements is calculated. The maintenance period begins on the
settlement day of the first main refinancing operation following the meeting of
the Governing Council at which the monthly assessment of the monetary policy
stance is pre-scheduled. The European Central Bank publishes a calendar of the
reserve maintenance periods at least three months before the start of the year.
Marginal interest rate: the interest rate at which the total tender allotment is
exhausted.
Marginal lending facility: a standing facility of the Eurosystem which
counterparties may use to receive overnight credit from a national central bank
at a pre-specified interest rate against eligible assets (see key ECB interest rates).
Member State: a country that is a member of the European Union.
MFI: see monetary financial institution.
Minimum bid rate: the lower limit to the interest rates at which counterparties
may submit bids in the variable rate tenders (see key ECB interest rates).
Minimum reserves: the minimum amount of reserves a credit institution is
required to hold with a central bank. In the minimum reserve framework of
the Eurosystem, the reserve requirement of a credit institution is calculated by
multiplying the reserve ratio for each category of items in the reserve base by the
amount of those items on the institution’s balance sheet. In addition, institutions
are allowed to deduct a lump-sum allowance from their reserve requirement.
Monetary aggregate: currency in circulation plus outstanding amounts of
certain liabilities of monetary financial institutions (MFIs) that have a relatively
high degree of liquidity and are held by non-MFI euro area residents outside the
central government sector. The Governing Council has announced a reference
value for the growth of M3 (see also reference value for monetary growth).
Monetary base: currency (banknotes and coins) in circulation plus the minimum reserves credit institutions are required to hold with the Eurosystem and any
excess reserves they may voluntarily hold in the Eurosystem’s deposit facility,
all of which are liabilities on the Eurosystem’s balance sheet. The monetary base
is sometimes also referred to as “base money”.
Monetary financial institutions (MFIs): financial institutions which together
form the money-issuing sector of the euro area. These include the Eurosystem,
resident credit institutions (as defined in EU law) and all other resident financial
institutions whose business is to receive deposits and/or close substitutes for

145
deposits from entities other than MFIs and, for their own account (at least in
economic terms), to grant credit and/or invest in securities. The latter group
consists predominantly of money market funds, i.e. funds that invest in
short-term and low-risk instruments usually with a maturity of one year or less.
Monetary policy strategy: the general approach to the conduct of monetary
policy. The monetary policy strategy of the ECB comprises a quantitative
definition of the primary objective of price stability and an analytical framework
based on two pillars – economic analysis and monetary analysis – which forms the
basis of the Governing Council’s overall assessment of the risks to price stability
and its monetary policy decisions. It also provides the framework for explaining
monetary policy decisions to the public.
Monetary policy transmission mechanism: the process through which monetary
policy decisions, e.g. the interest rate decisions taken by the Governing Council
in the case of the euro area, affect the economy in general and the price level in
particular.
Monetary targeting: a monetary policy strategy aimed at maintaining price stability by focusing on the deviations of money growth from a pre-announced
target.
Money demand: a key economic relationship that represents the demand for
money balances by non-MFIs. The demand for money is often expressed as a
function of prices and economic activity, which serves as a proxy for the level of
transactions in the economy, and certain interest rate variables, which measure the
opportunity costs of holding money.
Money market: the market in which short-term funds are raised, invested and
traded using instruments which generally have an original maturity of up to and
including one year.
Money market fund: a collective investment undertaking that primarily invests
in money market instruments and/or other transferable debt instruments with a
residual maturity of up to and including one year, and/or that pursues a rate of
return that approaches the interest rates on money market instruments.
National central bank (NCB): a central bank of a Member State of the
European Union.
Neutrality of money: a basic economic principle stating that, in the long run,
changes in the money supply only lead to changes in nominal variables, but not
in real variables. Changes in the money supply will therefore have no long-term
effect on variables such as real output, unemployment or real interest rates.
Nominal effective exchange rate (EER) of the euro: nominal euro EERs are
weighted averages of bilateral euro exchange rates against the currencies of the
euro area’s main trading partners. The ECB publishes nominal EER indices for

146
the euro against the currencies of a narrow and a broad group of trading partners.
The weights used reflect the share of each partner country in euro area trade.
Non-financial corporation: a corporation or quasi-corporation that is not
engaged in financial intermediation, but is active primarily in the production of
market goods and non-financial services.
Non-standard measures: measures taken by the ECB to support the effective
transmission of interest rate decisions to the wider euro area economy, in a
context of a dysfunctional situation in some financial market segments and the
financial system.
Open market operation: an operation executed on the initiative of the central
bank in the financial market. With regard to their aims, regularity and procedures,
Eurosystem open market operations can be divided into four categories: main refinancing operations, longer-term refinancing operations, fine-tuning operations and structural operations. As for the instruments used, reverse transactions are the main open market instrument of the Eurosystem and can
be employed in all four categories of operations. In addition, the issuance of debt
certificates and outright transactions are available for structural operations, while
outright transactions, foreign exchange swaps and the collection of fixed-term
deposits are available for the conduct of fine-tuning operations.
Opportunity cost: a measure of the costs of holding an asset, typically measured
as the spread between its own return and the return on an alternative asset.
Options: financial instruments that give the owner the right, but not the obligation,
to buy or sell specific assets (e.g. a bond or a stock) at a predetermined price (the strike
or exercise price) at or up to a certain future date (the exercise or maturity date).
Output gap: the difference between the actual and potential levels of output of
an economy, expressed as a percentage of potential output. Potential output is the
level of output that can be achieved when the factors of production are utilised at
non-inflationary levels.
Outright transaction: a transaction whereby assets are bought or sold outright
in the market (spot or forward).
Other financial intermediaries (OFIs): corporations or quasi-corporations
(other than an insurance corporation and pension fund) that are engaged mainly
in financial intermediation by incurring liabilities in forms other than currency,
deposits and/or close substitutes for deposits from institutional entities other than
MFIs. OFIs include, in particular, corporations engaged primarily in long-term
financing (such as financial leasing), securitised asset holdings, other financial
holdings, securities and derivatives dealing (on their own account), venture
capital and development capital.
Overnight deposits: deposits with next-day maturity. This instrument category
comprises mainly those sight/demand deposits that are fully transferable
147
(by cheque or similar instrument). It also includes non-transferable deposits that
are convertible on demand or by close of business the following day. Overnight
deposits are included in M1 (and hence in M2 and M3).
Pension fund: a provision or similar fund set aside by non-financial corporations
to pay for their employees’ pensions.
Price stability: the maintenance of price stability is the primary objective of the
Eurosystem. The Governing Council defines price stability as a year-on-year
increase in the Harmonised Index of Consumer Prices (HICP) for the euro area of below 2%. The Governing Council has also made it clear that, in the pursuit
of price stability, it aims to maintain inflation rates below, but close to, 2% over
the medium term.
Projections: see Eurosystem/ECB staff projections.
Real effective exchange rate (EER) of the euro: real euro EERs are nominal
euro EERs deflated by a weighted average of foreign, relative to domestic, prices
or costs. They are, thus, measures of price and cost competitiveness.
Reference value for monetary growth: the annual growth rate of M3 growth
that is deemed to be compatible with price stability over the medium term.
Reference value for the fiscal position: Protocol No 12 on the excessive deficit procedure, as annexed to the Treaty on the Functioning of the European Union,
sets explicit reference values for the general government deficit ratio (3% of
GDP) and the debt ratio (60% of GDP) (see also Stability and Growth Pact).
Repurchase agreement: the process of borrowing money by combining the sale
of an asset (usually a fixed income security) with the subsequent repurchase of
that same asset for a slightly higher price (which reflects the borrowing rate).
Repurchase operation (repo): a liquidity-providing reverse transaction based
on a repurchase agreement.
Reserve base: the sum of the elgible balance sheet items (in particular liabilities)
that constitute the basis for calculating the reserve requirement of a credit institution.
Reserve ratio: the ratio defined by the central bank for each category of eligible
balance sheet items included in the reserve base. The ratio is used to calculate
reserve requirements.
Reserve requirement: the minimum amount of reserves a credit institution
is required to hold with the Eurosystem over a predefined maintenance period.
Compliance with the requirement is determined on the basis of the average of the
daily balances in the reserve accounts over the maintenance period.
148
Reverse transaction: an operation whereby the central bank buys or sells assets
under a repurchase agreement or conducts credit operations against collateral.
Securities Markets Programme (SMP): an ECB programme for conducting
interventions in the euro area public and private debt securities markets to ensure
depth and liquidity in dysfunctional market segments with a view to restoring an
appropriate monetary policy transmission mechanism.
Stability and Growth Pact: intended to serve as a means of safeguarding sound
government finances in the EU Member States in order to strengthen the conditions
for price stability and for strong, sustainable growth conducive to employment
creation. To this end, the Pact describes that Member States specify medium-term
budgetary objectives. It also contains concrete specifications on the excessive deficit procedure. The Pact consists of Resolution of the Amsterdam European Council
on 17 June 1997 on the Stability and Growth Pact and two Council Regulations,
namely: i) Regulation (EC) No 1466/97 of 7 July 1997 on the strengthening of
the surveillance of budgetary positions and the surveillance and coordination of
economic policies as amended by Regulation (EC) No 1055/2005 of 27 June 2005;
and ii) Regulation (EC) No 1467/97 of 7 July 1997 on speeding up and clarifying the
implementation of the excessive deficit procedure as amended by Regulation (EC)
No 1056/2005 of 27 June 2005. The Stability and Growth Pact is complemented
by the ECOFIN Council’s report entitled “Improving the Implementation of
the Stability and Growth Pact“, which was endorsed by the Brussels European
Council of 22 and 23 March 2005. It is also complemented by a Code of Conduct
entitled “Specifications on the implementation of the Stability and Growth Pact and
Guidelines on the format and content of stability and convergence programmes”,
which was endorsed by the ECOFIN Council on 11 October 2005.
Stability programmes: these are medium-term government plans and assumptions
provided by euro area countries regarding the development of key economic
variables with a view to the achievement of the medium-term objective of a
budgetary position close to balance or in surplus, as referred to in the Stability and Growth Pact. These programmes present measures for the consolidation of
fiscal balances as well as the underlying economic scenarios. Stability programmes
must be updated annually. They are examined by the European Commission and
the Economic and Financial Committee (EFC). Their reports serve as the basis
for an assessment by the ECOFIN Council, focusing in particular on whether the
medium-term budgetary objective in the programme is in line with a budgetary
position close to balance or in surplus, providing for an adequate safety margin
to ensure that an excessive deficit is avoided. Member States whose currency is
not the euro must submit annual convergence programmes, in accordance with
the Stability and Growth Pact.
Standard tender: a tender procedure used by the Eurosystem in its regular
open market operations. Standard tenders are carried out within 24 hours.
All counterparties fulfilling the general eligibility criteria are entitled to
submit bids.
149
Standing facility: a central bank facility available to counterparties at their own
initiative. The Eurosystem offers two overnight standing facilities: the marginal lending facility and the deposit facility.
Stock market: see equity market.
Structural operation: an open market operation executed by the Eurosystem
mainly in order to adjust the structural liquidity position of the financial sector
vis-à-vis the Eurosystem.
Survey of Professional Forecasters (SPF): a quarterly survey that has been
conducted by the ECB since 1999 to collect macroeconomic forecasts on euro area inflation, real GDP growth and unemployment from a panel of experts
affiliated to financial and non-financial organisations based in the EU.
Swap: an agreement to exchange future cash flows according to a prearranged
formula (see foreign exchange swap).
Systemic risk: the risk that the inability of one participant to meet its obligations
in a system will cause other participants to be unable to meet their obligations
when they become due, potentially with spillover effects (e.g. significant liquidity
or credit problems) threatening the stability of or confidence in the financial
system. That inability to meet obligations can be caused by operational or
financial problems.
TARGET (Trans-European Automated Real-time Gross settlement Express Transfer system): the Eurosystem’s real-time gross settlement system for the
euro. The first-generation TARGET system was replaced by TARGET2 in
May 2008.
TARGET2: the second-generation TARGET system. It settles payments in euro
in central bank money and functions on the basis of a single IT platform, to which
all payment orders are submitted for processing.
TFEU: see Treaty on the Functioning of the European Union.
Transmission mechanism: see Monetary policy transmission mechanism.
Treaties: unless stated otherwise, all references in this report to the “Treaties”
refer to both the Treaty on the Functioning of the European Union and the
Treaty on European Union.
Treaty: unless stated otherwise, all references in this report to the “Treaty” refer
to the Treaty on the Functioning of the European Union, and the references to
article numbers reflect the numbering in effect since 1 December 2009.
Treaty of Lisbon (Lisbon Treaty): the Treaty of Lisbon amends the Union’s
two core treaties: the Treaty on European Union and the Treaty establishing
the European Community. The latter has been renamed the Treaty on the
150
Functioning of the European Union (TFEU). The Treaty of Lisbon was signed
in Lisbon on 13 December 2007 and entered into force on 1 December 2009.
Treaty on the Functioning of the European Union (TFEU): following the entry
into force of the Treaty of Lisbon on 1 December 2009, the Treaty establishing
the European Community was renamed the Treaty on the Functioning of the
European Union. This Treaty – referred to as the Treaty of Rome (signed in
Rome on 25 March 1957) – entered into force on 1 January 1958 to establish the
European Economic Community (EEC). The Treaty establishing the European
Community was subsequently amended by the Treaty on European Union (often
referred to as the Maastricht Treaty) signed on 7 February 1992 and entering into
force on 1 November 1993, thereby establishing the European Union. Thereafter,
both the Treaty establishing the European Community and the Treaty on European
Union were amended by the Treaty of Amsterdam, signed in Amsterdam on 2
October 1997 and entering into force on 1 May 1999, the Treaty of Nice, signed
on 26 February 2001 and entering into force on 1 February 2003, and then by the
Treaty of Lisbon.
Unemployed: according to the EU definition, any person aged 15 to 74,
who is: (i) without work during the reference week; (ii) currently available for
work; and (iii) actively seeking work.
Unemployment rate: the number of unemployed persons as a percentage of the
labour force.
Unit labour costs: a measure of total labour costs per unit of output calculated
for the euro area as the ratio of total compensation per employee to labour
productivity (defined as GDP (volume) per person employed).
Variable rate tender: a tender procedure whereby the counterparties bid both
the amount of money they want to transact with the central bank and the interest
rate at which they want to enter into the transaction.
Yield curve: a graphical representation of the relationship between the interest
rate or yield and the residual maturity at a given point in time for sufficiently
homogenous debt securities with different maturity dates. The slope of the yield
curve can be measured as the difference between the interest rates or yield at
two selected maturities.

151
BIBLIOGRAPHY
CHAPTER 1
Official ECB publications
ECB (1999 to 2010), Annual Report. ECB (2000 to 2010), Convergence Report.ECB (2006), “Monetary and exchange rate arrangements of the euro area with
selected third countries and territories”, Monthly Bulletin, April.
ECB (2008), Monthly Bulletin – 10th anniversary of the ECB, special edition,
May.
ECB (2008), “One monetary policy and many fiscal policies – ensuring a smooth
functioning of EMU”, Monthly Bulletin, July.
ECB (2009), “Rotation of voting rights in the Governing Council of the ECB”,
Monthly Bulletin, July.
ECB (2010), “The ECB’s relations with European Union institutions and bodies –
trends and prospects”, Monthly Bulletin, January.
Other documents
Bini Smaghi, L. and Gros, D. (2000), Open Issues in European Central Banking,
Macmillan Press.
Constâncio, V. (2010), “The establishment of the European Systemic Risk Board
– challenges and opportunities”, speech presented at the Eurofi Financial
Forum, introductory remarks at the plenary session on “Implementing the de
Larosière Agenda”, Brussels, 29 September 2010.
European Monetary Institute (1998), Convergence Report, March.
Jung, A., Moutot, P. and Mongelli, F.P. (2010), “How are the Eurosystem’s
monetary policy decisions prepared?”, Journal of Common Market Studies,
Vol. 48(2), pp. 319-346.
Scheller, H.-P. (2006), The European Central Bank – history, role and functions,
second revised version.
Tumpel-Gugerell, G. (2008), “Ten years of European Monetary Union – what
is the role of national central banks today?”, speech at the Oesterreichische
Nationalbank’s High Level Evening Panel Discussion, Brussels, 6 May 2008.
CHAPTER 2
Official ECB publications
ECB (2005), “Comparability of statistics for the euro area, the United States and
Japan”, Monthly Bulletin, April.
ECB (2005), “The Lisbon Strategy – five years on”, Monthly Bulletin, July.
ECB (2005), “The reform of the Stability and Growth Pact”, Monthly Bulletin,
August.
ECB (2005), “Indicators of financial integration in the euro area”, Technical Report, September.
ECB (2006), “Fiscal policies and financial markets”, Monthly Bulletin, February.
ECB (2006), “The importance of public expenditure reform for economic growth
and stability”, Monthly Bulletin, April.
152
ECB (2006), “Demographic change in the euro area: projections and consequences”,
Monthly Bulletin, October.
ECB (2007), “Challenges to fiscal sustainability in the euro area”, Monthly Bulletin,
February.
ECB (2007), “From government deficit to debt – bridging the gap”, Monthly Bulletin,
April.
ECB (2007), “The euro bonds and derivatives market”, June.
ECB (2008), “The analysis of the euro money market from a monetary policy
perspective”, Monthly Bulletin, February.
ECB (2008), Monthly Bulletin – 10th anniversary of the ECB, special edition,
May.
ECB (2008), “One monetary policy and many fiscal policies: ensuring a smooth
functioning of EMU”, Monthly Bulletin, July.
ECB (2008), “Ten years of the Stability and Growth Pact”, Monthly Bulletin,
October.
ECB (2009), “The functional composition of government spending in the
European Union”, Monthly Bulletin, April.
ECB (2009), Euro money market survey, September.
ECB (2010), “Entitlements of households under government pension schemes in
the euro area – results on the basis of the new system of national accounts”,
Monthly Bulletin, January.
ECB (2010), “Labour markets adjustments to the recession in the euro area”,
Monthly Bulletin, July.
ECB (2010), “Harmonised ECB statistics on euro area investment funds and their
analytical use for monetary policy purposes”, Monthly Bulletin, August.
ECB (2010), Euro money market study, December.
Other documents
Briotti, M.G. (2005), “Economic reactions to public finance consolidation:
a survey of the literature”, Occasional Paper Series, No 38, ECB, October.
Buldorini, L., Makrydakis, S. and Thimann, C. (2002), “The effective exchange
rates of the euro”, Occasional Paper Series, ECB, No 2, February.
Giammarioli, N., Nickel, C. Rother, P. and Vidal, J.-P. (2007), “Assessing fiscal
soundness”, Occasional Paper Series, No 56, March.
Morris R., Ongena, H. and Schuknecht, L. (2006), “The reform and implementation
of the Stability and Growth Pact”, Occasional Paper Series, No 47, ECB, June.
Moutot, P. (ed.), Gerdesmeier, D., Lojschová, A. and von Landesberger, J. (2007),
“The role of other financial intermediaries in monetary and credit developments
in the euro area”, Occasional Paper Series, No 75, ECB, October.
Task Force of the Monetary Policy Committee of the ESCB (2006), “Competition,
productivity and prices in the euro area services sector”, Occasional Paper Series, No 44, ECB, April.
Stark, J. (2009), “Monetary and fiscal policy: criteria and timing for the phasing
out of crisis measures”, speech delivered at 80th Kieler Konjunkturgespräch,
Berlin, 15 September 2009.
Trichet, J.-C. (2009), “European financial integration”, speech delivered at
23. Internationales ZinsFORUM ”Zinsen 2009”, Frankfurt am Main,
11 December 2008.

153
Van Riet, A. (ed.) (2010), “ Euro area fiscal policies and the crisis”, Occasional Paper Series, No 109, ECB, April.
CHAPTER 3
Official ECB publications
ECB (1999), “The stability-oriented monetary policy strategy of the Eurosystem”,
Monthly Bulletin, January.
ECB (1999), “ Euro area monetary aggregates and their role in the Eurosystem’s
monetary policy strategy”, Monthly Bulletin, February.
ECB (2000), “The two pillars of the ECB’s monetary policy strategy”,
Monthly Bulletin, November.
ECB (2001), A guide to Eurosystem staff macroeconomic projection exercises,
June.
ECB (2002), “The accountability of the ECB”, Monthly Bulletin, November.
ECB (2002), “Transparency in the monetary policy of the ECB”, Monthly Bulletin,
November.
ECB (2003), “The outcome of the ECB’s evaluation of its monetary policy
strategy”, Monthly Bulletin, June.
ECB (2004), “Monetary analysis in real time”, Monthly Bulletin, October.
ECB (2005), “Monetary policy and inflation differentials in a heterogeneous
currency area”, Monthly Bulletin, May.
ECB (2005), “The Harmonised Index of Consumer Prices – concept, properties
and experience to date”, Monthly Bulletin, July.
ECB (2006), “The predictability of the ECB’s monetary policy”, Monthly Bulletin,
January.
ECB (2007), “Communicating monetary policy to financial markets”,
Monthly Bulletin, April.
ECB (2008), “Price stability and growth”, Monthly Bulletin, May.
ECB (2008), “The role of banks in the monetary policy transmission mechanism”,
Monthly Bulletin, August.
ECB (2009), “Central bank communication in periods of heightened uncertainty”,
Monthly Bulletin, November.
ECB (2009), “Monetary analysis in an environment of financial turmoil”,
Monthly Bulletin, November.
ECB (2009), “New procedure for constructing Eurosystem and ECB staff
projection ranges”, 3 December 2009.
ECB (2010), ECB statistics: a brief overview, April.
ECB (2010), “ Monetary policy transmission in the euro area, a decade after the
introducion of the euro”, Monthly Bulletin, May.
ECB (2010), “The ‘Great Inflation’ – lessons for monetary policy”, Monthly Bulletin,
May.
ECB (2010), “Tools for preparing short-term projections of euro area inflation”,
Monthly Bulletin, April.
ECB (2010), “The ECB’s response to the financial crisis”, Monthly Bulletin,
October.
ECB (2010), “Enhancing the monetary analysis”, Monthly Bulletin, November.
ECB (2010), “Asset price bubbles and monetary policy revisited”, Monthly Bulletin, November.

154
Other documents
Altunbas, Y., Gambacorta, L. and Marqués-Ibáñez, D. (2010), “Does monetary
policy affect bank risk-taking?”, Working Paper Series, No 1166, ECB.
Angeloni, I., Kashyap, A. and Mojon, B. (2003), Monetary Policy Transmission in the Euro Area, Cambridge University Press.
Beyer, A. and Reichlin, L. (eds.) (2006), “The role of money – money
and monetary policy in the 21st century”, Fourth ECB central banking
conference, November.
Borio, C., Zhu, H. (2008), Capital regulation, risk-taking and monetary policy:
a missing link in the transmission mechanism?, Working Paper Series,
No 268, Bank for International Settlements.
Duisenberg, W. (2001), “The ECB’s quantitative definition of price stability and
its comparison with such definitions or inflation targets applied in other large
economic areas”, letter by the President of the ECB to the Chairperson of the
Committee on Economic and Monetary Affairs, Mrs Christa Randzio-Plath,
16 October 2001.
Duisenberg, W. (2001), “The ECB’s monetary policy strategy and the quantitative
definition of price stability”, letter of the President of the ECB to
the Chairperson of the Committee on Economic and Monetary Affairs,
Mrs Christa Randzio-Plath, 13 December 2001.
ECB (2003), Herrero, A., Gaspar, V., Hoogduin, L., Morgan J. and Winkler,
B. (eds.) (2001), “Why price stability?”, First ECB Central Banking
Conference, June.
González-Páramo, J.M. (2009), “National Accounts for monetary policy
making – reflections on the use of the euro area accounts in the light of the
financial crisis”, speech presented at the Eurostat National Accounts Conference
2009 “Reading the present to prepare the future”, Brussels, 16 September 2009.
Issing, O. (ed.) (2003), Background studies for the ECB’s evaluation of its monetary policy strategy, November.
Issing, O. (2005), “Communication, transparency, accountability – monetary
policy in the twenty-first century”, Federal Reserve Bank of St. Louis Review, Vol. 87(2), pp. 65-83.
Moutot, P. and Vitale, G. (2009), “ Monetary policy strategy in a global
environment”, Occasional Paper Series, No 106, ECB, August.
Papademos, L. (2009), “Financial stability and macro-prudential supervision –
objectives, instruments and the role of the ECB”, speech presented at the ECB
Watchers Conference, Frankfurt am Main, 4 September 2009.
Papademos, L. and Stark, J. (eds.) (2010), Enhancing the monetary analysis, ECB.
Stark, J. (2010), “Enhancing the ECB’s monetary analysis – what have we
learnt?”, speech presented at the ECB’s Watchers Conference, Frankfurt am
Main, 9 July 2010.
Trichet, J.-C. (2009), “Credible alertness revisited”, speech presented at the
annual symposium organised by Federal Reserve of Kansas, Jackson Hole,
Wyoming, 22 August 2009.
Trichet, J.-C. (2009), “The ECB’s exit strategy”, speech presented at the ECB’s
Watchers Conference, Frankfurt am Main, 4 September 2009.

155
CHAPTER 4
Official ECB publications
ECB (2002), “The liquidity management of the ECB”, Monthly Bulletin, May.
ECB (2003), “Changes to the Eurosystem’s operational framework for monetary
policy”, Monthly Bulletin, August.
ECB (2005), “Initial experience with the changes to the Eurosystem’s operational
framework for monetary policy implementation”, Monthly Bulletin, February.
ECB (2008), Monthly Bulletin – 10th anniversary of the ECB, special edition,
May.
ECB (2009), “The implementation of monetary policy since August 2007”,
Monthly Bulletin, July.
ECB (2010), “The ECB’s monetary policy stance during the financial crisis”,
Monthly Bulletin, January.
ECB (2010), “Liquidity conditions and monetary policy operations in the period
from 10 February 2010 to 11 May 2010”, Monthly Bulletin, June.
ECB (2010), “The ECB’s response to the financial crisis”, Monthly Bulletin,
October.
ECB (2011), The implementation of monetary policy in the euro area – General documentation on Eurosystem monetary policy instruments and procedures,
February.
Other documents
Bindseil, U. (2004), Monetary Policy Implementation: Theory, Past, and Present, Oxford University Press.
Mercier, P. (2009), “The Liquidity Management of the Eurosystem during the
Financial Turmoil”, Revue Bancaire et Financière, Vol. 2-3, pp. 96-104.
Mercier, P. and Papadia, F. (eds.) (2011), Implementing Monetary Policy in the Euro Area, Oxford University Press.
Trichet, J.-C (2010), “The financial crisis and the ECB’s response”, Journal of Common Market Studies, Vol. 48, pp. 7-19.
CHAPTER 5
Official ECB publications
Please refer to the following official sources for detailed information on the monetary policy decisions of the ECB:
– Introductory Statements to the press conferences by the President of the ECB
– Editorial sections of the ECB’s Monthly Bulletin
– Statements of the President before the Committee on Economic and Monetary
Affairs of the European Parliament
– Annual Reports of the ECB

156
ECB (2008), 10th anniversary of the ECB, Monthly Bulletin, special edition, May.
ECB (2010), “The ECB’s monetary policy stance during the financial crisis”,
Monthly Bulletin, January.
ECB (2010), “The ECB’s response to the financial crisis”, Monthly Bulletin,
October.
Other documents
International Monetary Fund, “Staff report on the euro area policies in the context
of the Article IV consultations with euro area countries”, various issues.
Issing, O. (2000), “The ECB’s Monetary Policy: Experience after the First Year”,
Journal for Policy Modelling, Vol. 22(3), pp. 325-343.
Organisation for Economic Co-operation and Development , “Economic Surveys:
Euro Area”, various issues.
Trichet, J.-C. (2010), “The financial crisis and the ECB’s response”, Journal of Common Market Studies, Vol. 48, pp. 7-19.
Trichet, J.-C. (2010), “Reflections on the nature of monetary policy
non-standard measures and finance theory”, opening address at the 6th ECB
Central Banking Conference, Frankfurt am Main, 18 November 2010.

157
INDEX
Accountability 86-89, 136
Asset 26, 39-52, 56-61, 70, 74-86,
97-99, 107, 111-114, 122-123,
127, 136
Bank lending survey (BLS) 73, 136
Bilateral central rate 134
Bond market 46, 74, 125, 127-128,
136
Break-even inflation rate (BEIR)
74-75, 136
Broad Economic Policy Guidelines
(BEPGs) 35, 136
Central bank independence 11, 14-15,
18, 86-88, 136
Collateral 4, 5, 26, 42-43, 60-61,
96-99, 107, 115, 127, 136
Consolidated balance sheet of the MFI
Sector 49-50, 80, 136
Convergence criteria 14, 136
Council of the European Union
(Council) 16-22, 26, 36, 132-133,
137
Counterparty 43-44, 96, 99, 107-108,
137
Credibility 7, 9-10, 13, 35, 56, 61, 63,
87, 90-91, 115, 129
Credit 11, 15-17, 23-27, 35, 39-52,
56-63, 73, 81-86, 90-127, 137
Credit institution 16-17, 23, 26-27,
39, 42, 48-52, 73, 93-99, 101-105,
109, 111-115, 127, 137
Currency in circulation 50-51, 137
Debt market 42, 125, 137
Debt ratio 34-36, 137
Debt security 138
Debt securities market 44-46, 125,
128, 149
Deficit ratio 35, 138
Deflation 9, 56-57, 66, 69, 84, 138
Degree of openness 37, 138
Deposit facility 93, 95, 97, 99,
108-113, 120, 138
Deposits redeemable at notice 50-51,
102, 138
Deposits with an agreed maturity
50-51, 102, 138
Derivative 40-44, 52, 75, 138
Downward nominal rigidities 31-32,
67
ECOFIN Council 14, 137-139
Economic and Financial Committee
(EFC) 139
Economic and Monetary Union
(EMU) 7-8, 11, 15, 19, 33, 35-36,
43, 57, 91, 98, 101, 115, 117-118,
132-134, 139
Effective exchange rates 19, 73,
146-148
Eligible asset 98-99, 107, 139
Employment Guidelines 139
Enhanced Credit Support 11, 90, 118,
124-127, 139
Equity market 43, 46-48, 139
EU enlargement 13-14, 20, 48, 53
Euro 7, 9-26, 29-54, 62-78, 82, 86,
89-102, 105-107, 111, 113, 115,
117-129, 133-134, 140
Euro area 7, 9, 11, 13-21, 29-54, 62 -67,
70-78, 82, 86, 89-99, 101- 102,
105- 106, 111-118, 121-129,
133-134, 140
Euro area enlargement 13, 53
Euro interbank offered rate
(EURIBOR) 42-43, 140
Euro overnight index average
(EONIA) 43, 100, 139
Eurogroup 14, 40
European Central Bank (ECB) 13, 55, 140
European Commission 16-17, 22, 30,
31, 34, 37, 54, 65, 67, 73, 121,
132, 140
European Currency Unit (ECU)
133,139
European Council (see Council of the
European Union) 16-22, 26, 36,
132-133, 140
European Monetary Institute (EMI)
19, 133, 141
European Parliament 16, 22-26, 86,
89, 141
European System of Accounts 1995
(ESA 95) 73, 141

158
European System of Central Banks
(ESCB) 13, 24, 133, 141
European Union (EU) 9, 13, 19, 21,
22-23, 26, 33, 35-36, 57, 64, 86,
88, 94, 96, 122, 128, 132-133
Eurostat 30, 32, 37-38, 40, 53, 65, 67,
91, 119, 121, 141
Eurosystem 7, 8, 11, 13-21, 24, 42,
48-50, 57-59, 64-65, 73, 76,
89-117, 120-128, 134, 141
Eurosystem staff projections 76, 141
Excessive deficit procedure 15, 33, 36,
73, 141
Exchange rate targeting 71, 142
Executive Board of the ECB 12, 19,
89, 134, 142
Financial markets 11, 17, 26, 33, 39,
40-44, 52, 71, 73, 75, 81, 89-90,
97, 118, 122-125, 142
Fine-tuning operation 95, 104, 106,
124, 142
Fixed-rate tender 42, 44, 142
Forward rate agreement 42, 44, 142
Foreign exchange swap 44, 95, 97,
107, 112, 142
Futures contract 142
General Council of the ECB 18, 19, 142
General government 30, 34-35, 37,
40-46, 142
Governing Council of the ECB 7, 10,
19, 20, 43, 62-65, 143
Haircut 42, 99, 143
Harmonised Index of Consumer Prices
(HICP) 64-65, 143
Households 7, 34, 39, 40-41, 48, 50,
52, 56-57, 60, 73-74, 76, 81, 93,
106, 125, 143
Inflation targeting 70-71, 88, 143
Inflation risk premium 56, 143
Integrated Guidelines 143
Interbank money market 143
Investment 33, 40, 48, 52, 56, 60, 73,
82, 87, 122
Key ECB interest rates 100, 103,
117-118, 121-127, 143
Labour force 30-32, 144
Labour force participation rate
30-32, 144
Leading indicators 144
Liability 49, 63, 66, 89, 101, 144
Loans 17, 30, 40-41, 43, 46, 49,
51 -52, 59, 60-62, 73, 80, 120, 124,
144
Long-term interest rates 14, 144
Longer-term refinancing operation
95-96, 106, 113-114, 127, 144
M1 50, 120, 144
M2 50, 138, 144
M3 50-51, 78-80, 120, 136-138, 144
Maastricht Treaty 132, 151
Main refinancing operation 95-96,
103-104, 113-114, 118, 120-121,
145
Maintenance period 100-115, 145
Marginal interest rate 145
Marginal lending facility 95, 97, 99,
108-112, 120, 145
Member State 13-19, 22-27, 33-38,
48, 66, 73, 97, 99, 105, 107,
132-134, 145
Minimum bid rate 100, 105-106, 115,
117, 121, 145
Minimum reserves 27, 59, 73, 101,
145
Monetary aggregate 49, 50-51, 71-72,
77, 80, 145
Monetary base 55, 93, 145
Monetary financial institution (MFI)
29, 39-52, 72, 145
Monetary policy strategy 7, 9, 10-12,
55-92, 117, 146
Monetary policy transmission
mechanism 11, 33, 43, 55, 58- 68,
71, 80-83, 91, 94, 101, 109, 125,
128-129, 133, 146
Monetary targeting 70, 88
Money demand 10, 70, 78, 81-82, 146
Money market 17, 40- 44, 48, 51, 55,
59-62, 64, 73, 93-94, 96, 99,
100-106, 111, 115, 124-128, 146
Money market funds 48, 51, 73, 146
National central bank (NCB) 23, 25,
146
Neutrality of money 55, 146
Nominal effective exchange rates 19,
73, 146

159
Non-financial corporations 40-41, 46,
52, 73, 122, 147
Non-standard measures 11, 43, 90-91,
100, 118, 124-128, 147
Open market operation 104, 107, 147
Opportunity cost 147
Options 42, 85, 147
Other financial intermediary (OFI) 29,
48, 52, 147
Output gap 147
Outright transaction 147
Overnight deposits 50-51, 102, 147
Pension fund 41, 148
Predictability 87-88
Price stability 7-24, 29, 33, 35, 55-72,
75-91, 93-94, 117-118, 120-127,
129, 132, 148
Projections 76, 141
Real effective exchange rates 19, 73, 148
Reference value for monetary
growth 80, 148
Reference value for the fiscal
position 35-36,148
Repurchase agreement 26, 99, 107,
148
Repurchase operation (repo) 148
Reserve base 101-104, 148
Reserve ratio 101-104, 148
Reserve requirement 5, 101-106,
109-115, 148
Reverse transaction 95, 99, 107-108,
149
Risks to price stability 9, 15, 33, 64,
69, 70-71, 79-85, 88, 117-124
Securities Markets Programme 90,
112, 118, 125-126, 128, 149
Survey of Professional Forecasters
(SPF) 72-73, 122, 150
Stability and Growth Pact 7, 15, 33,
36, 73, 133, 149
Stability programmes 36, 149
Stage Three of EMU 33, 36, 43, 91,
98, 101, 115, 117-118, 132-134,
139
Standard tender 97, 105-108, 149
Standing facility 100, 111, 150
Stock market 5, 46-47, 60, 150
Structural operation 95-96, 104,
107-108, 111, 150
Swap 6, 42-44, 75, 95, 97, 107, 112,
124-127, 150
TARGET 43, 68, 70-71, 84-85, 88-89,
126, 150
TARGET2 43, 68, 70-71, 84-85,
88-89, 126, 150
Transmission mechanism 11, 33, 43,
55, 58-68, 71, 80-83, 91, 94, 101,
109, 125, 128-129, 133, 150
Transparency 20, 49, 56, 64, 86-89, 95
Treaty of Lisbon 13, 19, 150
Treaty on European Union (TEU) 13, 150
Treaty on the Functioning of the
European Union (TFEU) 13, 21,
22, 26, 33, 35-36, 57, 64, 86, 88,
94, 128, 151
Unemployed 31, 151
Unemployment rate 30-32, 73, 151
Unit labour costs 151
Variable rate tender 100, 105-106, 151
Yield curve 73, 122, 151

THe MoneTary Policyof THe ecb
2011
euro
Pean
cen
Tral
ban
kTH
e M
on
eTar
y Po
licy
of
THe
ecb
201
1