the modeling of deformation process in soils with use of
TRANSCRIPT

Missouri University of Science and Technology Missouri University of Science and Technology
Scholars' Mine Scholars' Mine
International Conference on Case Histories in Geotechnical Engineering
(2008) - Sixth International Conference on Case Histories in Geotechnical Engineering
13 Aug 2008, 5:15pm - 6:45pm
The Modeling of Deformation Process in Soils With Use of Ansys The Modeling of Deformation Process in Soils With Use of Ansys
and Ls-Dyna Programs and Ls-Dyna Programs
G. G. Boldyrev Penza State University of Architecture and Construction, Penza, Russia
A. J. Muyzemnek CAD-FEM GmbH, Moscow, Russia
Follow this and additional works at: https://scholarsmine.mst.edu/icchge
Part of the Geotechnical Engineering Commons
Recommended Citation Recommended Citation Boldyrev, G. G. and Muyzemnek, A. J., "The Modeling of Deformation Process in Soils With Use of Ansys and Ls-Dyna Programs" (2008). International Conference on Case Histories in Geotechnical Engineering. 37. https://scholarsmine.mst.edu/icchge/6icchge/session_01/37
This work is licensed under a Creative Commons Attribution-Noncommercial-No Derivative Works 4.0 License.
This Article - Conference proceedings is brought to you for free and open access by Scholars' Mine. It has been accepted for inclusion in International Conference on Case Histories in Geotechnical Engineering by an authorized administrator of Scholars' Mine. This work is protected by U. S. Copyright Law. Unauthorized use including reproduction for redistribution requires the permission of the copyright holder. For more information, please contact [email protected].

THE MODELING OF DEFORMATION PROCESS IN SOILS WITH USE OF ANSYS AND LS-DYNA PROGRAMS
G.G. Boldyrev А.J. Muyzemnek Penza State University of Architecture and Construction CAD-FEM GmbH, Moscow Penza-Russia Moscow-Russia ABSTRACT In this paper the results of experimental and numerical researches of sand deformation in the basis of a rigid stamp loaded with central and eccentric loads in conditions of a plane and 3D space problem are shown. The numerical solution of a problem is executed with use of programs ANSYS, LS-DYNA and models of soil Drucker-Prager and Сар. The movement equations solution is executed with use of Arbitrary Lagrangian-Eulerian (ALE) method that has allowed to solve a problem at large deformations, even for the sandy basis stability loss. Localization of deformations in the form of shear strips formed at large soil deformations is one of the main features of stability loss process of the bases foundations. Another feature of stability loss process is its dynamism in the form of continuous change of deformation character of the basis at its loading. The complex behaviour of the bases during their stability loss causes certain difficulties in numerical modeling of this process. Nowadays there are some approaches to the movement description of the deformable continuous environment. It is the approach of Lagrange, the approach of Euler and combined Lagrangian-Eulerian approach (ANSYS Theoretical Manual). Ranges of these approaches use are well-known. Therefore, our purpose is not to list all of their strengths and weaknesses, we shall accentuate only some of them. In the Lagrangian approach the observer watches movement of material particles of the moving continuous environment. Unknown quantities that are searched during the solution are connected with the material particles. Unknown quantities are movings and speeds of material particles and their pressure and deformations. The finite elements method (program ANSYS (Belytschko Ted et al [2000])) is mostly used in Lagrangian approach to the continuous environment movement description for 3D space discretization. For the solution of dynamic problems the finite elements method is used with the obvious or implicit scheme of integration of the first or second order (program LS-DYNA (Boldyrev G. G. and Nikitin E. V. [2005])). During stability loss there are shear deformations in the basis that exceed hundreds percent. Soil elements undergo very
large deformations that exceed the size of finite elements. Therefore, if these excessively deformable or destroyed elements are not excluded from the solution, the environment material behavior will become rigid. That is why sometimes they say that environment becomes isolated at shear. Use of adaptive mesh and finite elements with one integration point allows to carry out numerical modeling of deformation process to the point of stability loss. However, bad conditionality of a system rigidity matrix, owing to excessive distortion of a mesh, often leads to impossibility of the adequate solution both at approach of deformation process to the limiting stability load and behind of the failure load. In Euler’s approach to the continuous environment movement description the observer watches points of space. Unknown quantities such as speeds of environment movement, pressure and deformations, are connected with points of space. Lagrangian approach is used for solution of geotechnical problems much more often than Euler’s one. It is caused by necessity to use additional procedures for definition of the continuous environment movings, including its boundary, and by complexity of the internal variables transfer registration that characterize a condition of ground material particles. In a number of references values, that describe inwardness of the continuous environment material particles, are often called historical variables. The Lagrangian-Eulerian approach or Arbitrary Lagrangian-Eulerian formulation (ALE) (as it is called in foreign literature) combines both of the approaches (ANSYS Theoretical Manual). A number of deformable body problems solutions methods are developed on the basis of Lagrangian-Eulerian approach. The
Paper No. 1.08 1

main methods are Arbitrary Lagrangian-Euleran method, Multi-material Eulerian method and Multi-material Arbitrary Lagrangian-Euleran method. At the problem solution with Arbitrary Lagrangian-Euleran method the finite element mesh nodes can move within the area, which is occupied by material to reduce distortion of a mesh. Each finite element contains one material. If we use a Multi-material Euler method the material flows through the mesh, which is fixed in space. Each element can contain a mix of several materials. In a Multi-material Lagrangian-Euleran method the material flows through a moving grid in space. Each element can contain a mix of several materials. The solutions based on Arbitrary Lagrangian-Eulerian method, have advantages of methods Lagrange and Euler concerning continuous environment movement description. At the same time they do not have lacks described above. In a number of references examples of their successful use for the solution of geomechanics problems (Belytschko Ted et al [2000], Boldyrev G. G. and Nikitin E. V. [2005], Di Y. and Sato T. [2003]) are shown. At the problems solution there are often situations when various parts of considered system show various types of mechanical behaviour. For example, one part of system behaves as a liquid, another – as a solid body. In such situation Lagrangian method can be used for the description of a solid part movement, and Eulerian method for the description of a liquid movement. In this case, the algorithm of linkage Lagrangian-Eulerian realized, for example, in program LS-DYNA can be used for modeling of considered parts interaction. In foreign literature it is called Fluid-Structure Interection (FSI). The similar approach is used in works (Di Y. and Sato T. [2003], Di Y. and Sato T. [2004], Li S. and Liu W.K. [2000]) for the description of saturated soils behaviour. It is necessary to note, that of late years two methods based on approach of Lagrange to the continuous environment movement description, which allow effective modeling of stability loss process of the bases, are realized in a number of systems of the automated engineering analysis, for example in LS-DYNA program. It is a mesh-free method of the smoothed particles (Smoothed Particle Hydrodynamics) and a mesh-free method based on Galerkin method (Element Free Galerkin method). Both methods are mesh-free, they are based on local approximation of movings nodes or particles so they are not sensitive to large distortions of a mesh. Therefore they are so efficient for the solution of considered problem. Method Galerkin is applied in works (LS-DYNA Theoretical Manual, Malyshev М.V. [1953]). The features of soil deformation and destructions, the importance of registering numerous factors, which influence soils behaviour, cause necessity to use multistage procedure of the various tasks solution in the field of geoengineering. Such
procedure assumes presence of the following stages – the test of a material, the parameter identification of constitutive relations (the material model), the test tasks solution, the semi-natural tests realization and modeling, the real deforming processes modeling. The contents and volume of each stage is determined by the purposes of mathematical modeling or calculation. The procedure can be iterative. The given solution procedure has been applied in research of the deformation mechanism of the sandy basis loaded by a rigid stamp. The problem was solved in some stages. At the first stage the experiences with model of a rigid stamp on the sandy basis have been executed. At the second stage the soil model has been chosen and its parameters has been defined by laboratory researches of samples of the same sandy soil which was used at modeling the sandy basis. At the third stage calculations of the intense-deformed condition of the sandy basis have been executed by method Lagrange (program ANSYS) and by Arbitrary Lagrangian-Eulerian (program LS-DYNA). The purpose of present work was the estimation of ANSYS and LS-DYNA programs opportunities for the decision of geoengineering tasks. Thus, the special attention was given to opportunities of using material models intended for this purpose. In ANSYS program there are two material models for the description of soil behaviour – the model of Druker-Prager (DP) and Extended model of Druker-Prager (EDP). The latter model has appeared in ANSYS of version 10.0 for the first time. In LS-DYNA program the following models are intended for the description of soil behaviour – the Kreig ground (#5), the Kreig ground with destruction (#14), the geological model which is taking into account two invariant of stress tensor - CAP-model (#25), the Schwer-Murray geological model (#145), the ground FHWA (#147), the model of clay (#192) and the Druker-Prager model (#193). Let's consider the contents of the basic stages of a typical sequence of deformation process modeling in soils. 1. The test of a soil. The purpose of the tests is the primary information sufficient for parameter identification, used in further soil models calculations. Soil tests are carried out when the material model for the description of stress-strain soil behaviour is chosen and its parameter identification procedure is defined. The realization of triaxial compression and expansion, direct simple shear and hydrostatic compression tests suffices for parameter identification of the majority of material models for soils mentioned above. The equipment of firm "Geotek" (www.geoteck.ru) can be used for realization of the given tests. It includes the automated triaxial device (Fig. 1,a), direct shear device (Fig. 1,b) and so on. The technique description of
Paper No. 1.08 2

tests realization is given in works on site www.geoteck.ru and GOST 12248-96 [4]. The loading of each sand sample was carried out in two stages. At the first stage the hydrostatic compression by pressure accordingly 100 and 200 kPa was carried out. Further lateral pressure was supported at the given level, and the vertical pressure increased before sample failure. Two samples tests are enough, for example, for definition of all parameters of Druker-Prager model (DP) and advanced Druker-Prager model (EDP) which is realized in the ANSYS program. The yield surfaces Druker-Prager and Cap are shown in Fig. 1. Advanced Druker-Prager model using a parabolic or hyperbolic surface of fluidity and plastic potential demands a greater number of tests to define the same parameters. Additional odometer tests are required for parameters definition of CAP-model (*25) realized in LS-DYNA program. The accuracy of material model parameters definition can be increased by enlargement of tests number and by LS-DYNA program approximation with the least squares method. 2.The parameter identification of constitutive relations. The equation of a yield surface in Druker-Prager model (DP) is [6]
0σβσ3 =−+= ymTF , (1)
where T is the intensity of shear stress; is the average stress; , are the parameters of the model.
mσ
yβ yσ The results of tests submitted in a Fig. 2 allow to determine two points laying on a yield surface: and ( )11σ T,m ( )22σ T,m . Substituting the given values in the equation (1) and solving the received system concerning unknown parameters, we have:
12
12
31
mm
TTσσ
β−−
−= ; . (2) 11 βσ3σ my T +=
a)
b)
3)( max31
2σσ −
=DJ ; 311 2σσ +=J
Fig.1. The yield surfaces: Druker-Prager (a) and Cap (b) The , parameters are connected with Mohr-Coulomb parameters by the following dependences [6]
yβ yσ
( )( )( )φ33
φ2βsin
sin−
= ; ( )( )( )φ33φ6σ
sincosc
y−
= . (3)
where с is the cohesion and is the angle of internal friction.
φ
From the first relation (3) by a known value of parameter β it is possible to define numerically or graphically an angle of internal friction. Then, the cohesion can be determined from the second equation (3).
Paper No. 1.08 3

( )( )( )φ6
φ3σ3cos
sinc y −= . (4)
Third parameter of Druker-Prager model (DP) is the angle of dilatancy . With the help of this angle we can define the following parameter:
φ′
( )( )( )φ33
φ2β′−
′=′
sinsin
, (5)
which enters into relation of plastic potential
. (6) 0σσβ3 =−+= ym'TQ
Fig. 2. The Druker-Prager surface (curve 1) and the trajectory
of loading process of the cube (curve 2) in space (T - p) According the plastic deformation values on the appropriate coordinate axes determined as a result of tests of cylindrical samples on triaxial compression, the following parameter can be defined:
pz
py
px ε,ε,ε
( ) ( ) ( )( ) ⎟⎟⎟
⎠
⎞
⎜⎜⎜
⎝
⎛
⎟⎟⎟
⎠
⎞
⎜⎜⎜
⎝
⎛
++
++=′
2223sin
31
pz
py
px
pz
py
pxatg
εεε
εεεβ . (7)
On the certain value of β , it is possible to define a angle of dilatancy numerically or graphically by use of Eq. (5).
′
The Extended Druker-Prager model (EDP) using a parabolic or hyperbolic yield surface and the plastic potential for definition of the appropriate parameters requires the realization of the greater number of tests, and for definition of parameters of CAP-model (#25) realized in LS-DYNA program. It is required to realize the odometer tests in
addition. The accuracy of material model parameters definition can be increased by enlargement of tests number and by LS-DYNA program approximation with the least squares method. 3. The solution of test tasks. The purpose of the test tasks solution is to check the correspondence of deformation process modeling results realized at laboratory samples tests, carried out for definition of materials model parameters, to experimental data, on which the required parameters of models were received. As an example we shall consider the stress-strain state of cube, to which sides the pressure p1 p2, p3 as function of time are enclosed, as shown on Fig. 3. Let pressure on the cube side change as:
( )( )⎩⎨⎧
≤<−−+≤≤
=
⎪⎩
⎪⎨
⎧
≤<
≤≤==
.21where110 where
.21where
;10where
121
13
1
1
21
ttPPPttP
p
tkP
tktP
pp(8)
where k is parameter P1 и P2 are the parameters of loading process; t is a time. Let P1 = 20 kPa, P2 = 100 kPa, . The surface failure (curve 1) and the stress path (curve 2) in space (T - p) are shown on Fig. 2. Here T is the intensity of shear stress and p is the hydrostatic pressure.
1=k
Fig. 3. The diagram of deforming process
During solution we shall use Druker-Prager model with the following parameters: the module of deformation Е = 5,1 MPa; Puasson factor µ = 0,25; cohesion с = 11 kPa; an angle of internal friction = 19 degrees and an angle of dilatancy φ’ = 19 degrees.
Paper No. 1.08 4

Let's define pressure 3p , at which stress in cube achieved the yield surfaces. Further we shall assume, that the yield surface will be achieved at . For definition .t 21 ≤< 3p we shall write down equations for definition of the intensity of shear stress T and average stress : mσ
kppT 1
331
−= ; ⎟⎠⎞
⎜⎝⎛ +−= 3
1231σ p
kp
m . (9)
Having substituted and in Eq. (6), we shall receive: T mσ
ypkp
kpp σ2
31β3
31
311
3 =⎟⎠⎞
⎜⎝⎛ +−− . (10)
From Eq. (10) we shall determine the pressure, at which stress in cubed achieved the yield surfaces:
β3
1
β23
1σ 1
3−
⎟⎟⎠
⎞⎜⎜⎝
⎛++
=kp
py
. (11)
At the given parameters of material model and loading conditions we shall receive kPa703 =p . Let's carry out modeling the loading process of a cube in ANSYS. At modeling we shall use the associated law of plasticity as 19=′=φφ degrees. The results of deformation process modeling are submitted in a Fig. 4 and Fig 5. The analysis of modeling results allows to make the following conclusions: - The process is ideal elastic-plastic, the value of pressure 3p , at which the cube material passes into elastic-plastic state equals 70 kPa (see Fig. 7) and corresponds to the analytical decision; - The plastic deforming is accompanied by change of cube volume (see Fig. 3); - The Eq. (7) allows to inspect conformity of a dilatancy angle to the calculated values of plastic deformations. So the received values of plastic deformation at are:
; ,
ct 2=
015,0== pz
px εε 0075,0−=p
yε
( ) ( ) ( )2360
εεε3
εεε31β
222,sinatan
pz
py
px
pz
py
px =
⎟⎟⎟⎟
⎠
⎞
⎜⎜⎜⎜
⎝
⎛
⎟⎟⎟⎟
⎠
⎞
⎜⎜⎜⎜
⎝
⎛
⎟⎠⎞⎜
⎝⎛ ++
++=′ (12)
The angle of dilatancy is 19,4 degrees, that will be corresponded to the original data.
Fig. 4. The relationship between stress (Pa) and time:
s_11 - σxx; s_22 - σyy; s_33 - σzz; s_i - σi
Fig. 5. The relationship between plastic strains and time:
EP_11 - εpxx; EP_22 - εp
yy; EP_33 - εp zz; EP_V - εp
v During calculation we use CAP-model of stress-strain state of cube at pressure P1 = 20 kPa, P2 = 40 kPa. On Fig. 6 CAP-surface (curve 1) and stress path (curve 2) in space of stress invariant are shown. are the first and second invariants of stress tensor.
21 J,J
The definition of pressure value 3p , at which the trajectory of loading process reaches yield surface, is carried out numerically. The results of modeling are submitted on Fig. 7 and Fig. 8. The analysis of modeling results allows to make the following conclusions:
5 Paper No. 1.08

- The process is elastic-plastic with weak hardening, the pressure value 3p , at which the cube material passes into elastic-plastic state corresponds to the numerical decision; - The plastic deforming is accompanied by the change of cube volume (Fig. 8).
Fig. 6. The CAP-surfaces in space ( 2J - ) (curve 1) 1J
and the trajectory of cube loading process (curve 2)
Fig. 7. The relationship between stress (Pa) and time:
s_11 - σxx ; s_22 - σyy; s_33 - σzz; s_i - σi
Fig. 8. The relationship between plastic strain and time EP_11 - εp
xx; EP_22 - εpyy; EP_33 - εp
zz; EP_V - εpv
4. The modeling of semi-natural tests. The purpose of semi-natural test realization was the research of deformation and destruction laws of a real sandy soil with geometrical similarity of model and real base. The considered tests consisted in indenter of a steel plate by size 0,4×0,3×0,1 m in the layer of a sandy by size of 3×3×2,5 m, placed in a box. The basis has been executed from fine-grained sand with density 16,0 kN/m3. Sand kept within a tray layers on 0,20 m with compaction soil up to noted density. Moisture of sand = 1,4 %. During the loading process we registered the loading on a plate and the vertical displacement of a plate, and also the vertical displacement of sandy ground surface in longitudinal and cross sections. In the first series of experiences the behaviour of the sandy basis was investigated at the central action of loading. In the second series of experiences vertical loading was put with eccentric in 0,05 m, and in the third series with eccentric in 0,10 m in a direction of the long party of a stamp on its axis of symmetry. Loading on a stamp was put by steps of 10 % from settlement limiting with endurance at each step until stabilization of deformations. Vertical moving of a stamp was measured in two points on the opposite parties of a stamp on a long axis of symmetry. Measurement of the settlement was carried out to four LVDT with accuracy of 0,01 mm. In experiences measurement of deformation of the basis surface in a direction of both axes of a stamp symmetry by ten LVDT. Loading was created by a hydraulic jack.
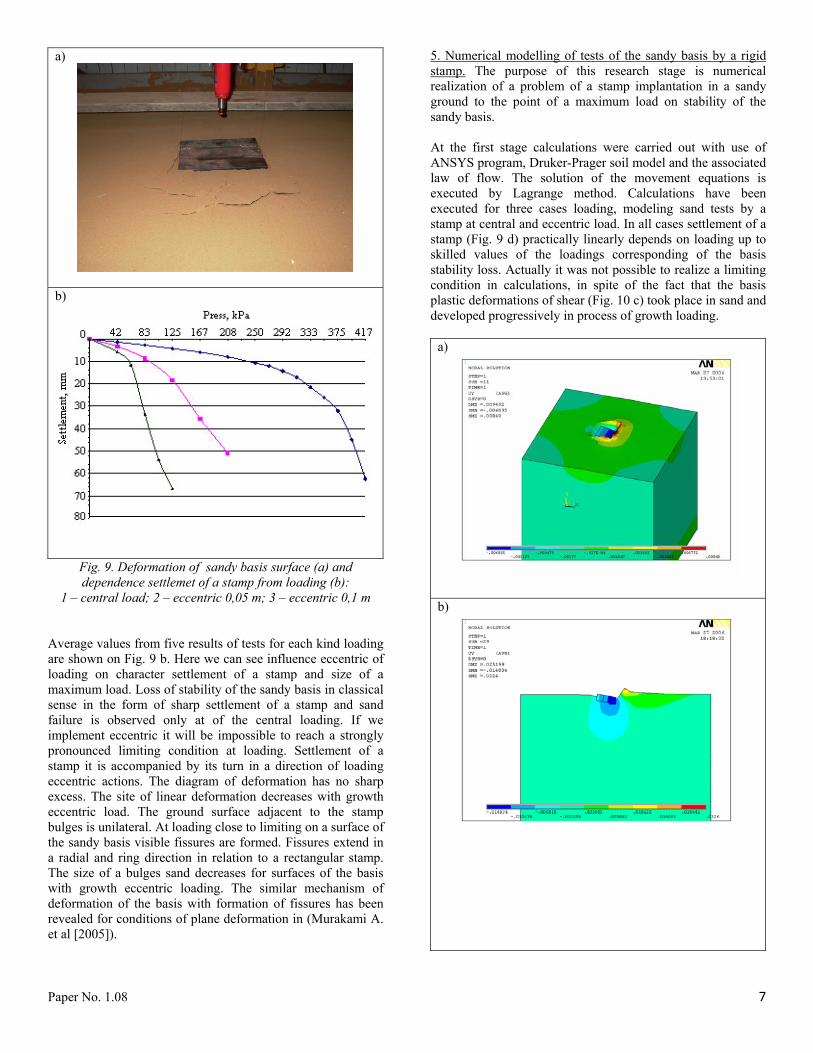
The character of deforming of sandy basis surface in conditions of space deformation is shown on Fig. 9 a. The feature of given process is the significant depth of plate settlement to the sand, which made more than 0,06 m. Thus essential reduction of inclination of "loading - vertical displacement" curve was observed, that is the certificate of deforming process approximation to loss of stability (Fig. 9 b).
Paper No. 1.08 6
a)
b)
Fig. 9. Deformation of sandy basis surface (a) and dependence settlemet of a stamp from loading (b):
1 – central load; 2 – eccentric 0,05 m; 3 – eccentric 0,1 m
Average values from five results of tests for each kind loading are shown on Fig. 9 b. Here we can see influence eccentric of loading on character settlement of a stamp and size of a maximum load. Loss of stability of the sandy basis in classical sense in the form of sharp settlement of a stamp and sand failure is observed only at of the central loading. If we implement eccentric it will be impossible to reach a strongly pronounced limiting condition at loading. Settlement of a stamp it is accompanied by its turn in a direction of loading eccentric actions. The diagram of deformation has no sharp excess. The site of linear deformation decreases with growth eccentric load. The ground surface adjacent to the stamp bulges is unilateral. At loading close to limiting on a surface of the sandy basis visible fissures are formed. Fissures extend in a radial and ring direction in relation to a rectangular stamp. The size of a bulges sand decreases for surfaces of the basis with growth eccentric loading. The similar mechanism of deformation of the basis with formation of fissures has been revealed for conditions of plane deformation in (Murakami A. et al [2005]).
5. Numerical modelling of tests of the sandy basis by a rigid stamp. The purpose of this research stage is numerical realization of a problem of a stamp implantation in a sandy ground to the point of a maximum load on stability of the sandy basis. At the first stage calculations were carried out with use of ANSYS program, Druker-Prager soil model and the associated law of flow. The solution of the movement equations is executed by Lagrange method. Calculations have been executed for three cases loading, modeling sand tests by a stamp at central and eccentric load. In all cases settlement of a stamp (Fig. 9 d) practically linearly depends on loading up to skilled values of the loadings corresponding of the basis stability loss. Actually it was not possible to realize a limiting condition in calculations, in spite of the fact that the basis plastic deformations of shear (Fig. 10 c) took place in sand and developed progressively in process of growth loading.
a)
b)
Paper No. 1.08 7

c)
d)
Fig. 10. Some results of calculation of the sandy basis at eccentric loading of 0,05 m with use of model of soil Druker-
Prager and programs ANSYS: a - model of the basis; b - vertical displacement; c - plastic strain of shear; d - relation
settlement of a stamp from loading.
At the second stage LS-DYNA program has been used, but calculations have been executed for the conditions of plane deformation. ALE method realized in program LS-DYNA, has been used in a combination to CAP-model. Some results of mathematical modeling are presented on Fig. 11, 12 (for model of central loaded stamp), and on Fig. 13, 14 (for a stamp with eccentric loading). A stamp loading was carried out continuously with the set speed of 0,2 m/s. Distributions of the module of speed in vertical section of settlement area during the various moments of time are shown on Fig. 11. Change of distribution character at increase in vertical loading testify to occurrence, expansion and interaction of area of plastic deformations with lateral walls of a box (Fig. 11 b,c). Under a stamp there is an area of sand, which moves with a speed of 0,2 m/s (Fig. 11, 12), equal to speed of movement of a stamp. This area changes the volume
in process of growth of external loading and coincides under the form with the compacted soil body observable in experiences.
a b c Fig. 11. The distribution of speed module (m/s) in settlement area: a, b, c is the vertical displacement of a plate 21, 31 and
41 mm accordingly
On Fig. 10, in the area 1 which does not move with growth deposits of a stamp is shown. The size given, as though "зависшей" areas of sand changes with growth deposits of a stamp, decreasing with its increase.
Distributions of sand density of the basis in vertical section of settlement area during the various moments of time are shown on Fig. 12. Initial density of sand is 1,614 g/sm3. In process of stamp settlement growth the density of sand decreases up to 1,600g/sm3 or increases up to 1,620 g/sm3 in sand under a stamp. In a zone of compaction it reaches the value of 1,620 g/sm3, and in a zone of the maximal dilatancy - 1,600 g/sm3. The zone of compaction has an outline in the form of a column, and a zone of expansion in the form of strips. Step-by-step loading leads to progressing development of a shear strip which is displaced from edge to the right from under a stamp in a direction to a free surface of the sandy basis.
a b c Fig. 12. The distribution of density sand (g/sm3):
a, b, c is the vertical displacement of a plate 21, 31 and 41 mm accordingly
Paper No. 1.08 8

The results of deformation field measurement in the sandy basis in conditions of a plane problem (Sokolovskij V.V. [1965]) are shown on Fig. 13. On Fig. 7 we can see, that deformations of shear arise in corners of a stamp and extend downwards and aside, and their maximal values are localized within the limits of rather narrow strip. Step-by-step loading leads to progressing development of a shear strip which edge is displaced to the right from under a stamp in a direction to a free surface of the sandy basis. On same figure the area 1 is shown. Here there are no deformations of shear at all loading steps. It adjoins a free surface of the basis, and its volume with growth of loading decreases owing to development of shear deformations on the bottom boundary. Experiments have shown, that at loading close to limit on stability, in the basis under a stamp volumetric deformations of expansion of sand prevail and only in a small zone under a stamp volumetric deformations of compression are observed. The most intensive expansion of sand is observed in a direction of development of the maximal deformations of shear.
Fig.13. The lines of equal deformations of shear at a
settlement of the stamp, equal: a - near to a maximum load; b- behind a maximum load
Similar character of the sandy basis deformation is received as a result of numerical calculation. The area 1 which does not move and its volume decreases with growth of loading is shown on Fig. 11. You can see the zones of sand compaction and expansion of on Fig. 12 a,b,c. At initial loading steps (Fig. 12) deformations of shear of the first kind, causing expansion of sand, as well as in experiments, develop from corners of a stamp. In sand the deformations of compaction dominate, mainly within the limits of a column of the stamp limited in the width, and on depth equal (3-4) b, where b -
width of a stamp. The average sand density in this area is 1,620 g/sm3. At loading more than 30 % from limiting (Fig. 12 b) there are deformations of shear of the second kind (from top of «an elastic soil kernel») on a vertical axis of symmetry on the depth of 1,5b. The narrow zone of sand expansion (density of 1,600 g/sm3) reaches a surface of the ground. Further with growth of loading (Fig. 12 с) shear deformations of the first and second kind are united in two strips dividing a zone of compaction symmetrically in four pieces. The first (located under a stamp) is the so-called compaction soil body, (sometimes, «an elastic soil kernel ») which has been revealed earlier experimentally (Malyshev 1953). It is necessary to note, that at load equal to bearing capacity the compaction of sand takes place in a column ground under a stamp in spite of the fact that it is divided into parts by shear strips. It is interesting to note the fact, that character of deformation of the sandy basis numerically is very similar to a mesh of sliding lines of the analytical decision of the theory of limit equilibrium state (Sokolovskij, 1960). On Fig. 12 c you can see, that the fan of the second strips starting radially from the corner of a stamp, represents the second family of sliding lines on Sokolovskij if to accept a shear strip starting from a corner of a stamp and leaving on a surface of the ground for the first family of lines of sliding.
Similar character of deformation of the sandy basis is observed and at eccentric floading (Fig. 14, 15).
Fig. 14. The distribution of density sand (g/sm3) at eccentric loadings equal 0,05 m
Fig. 15. The distribution of density sand (g/sm3) at eccentric
loadings equal 0,1 m
Paper No. 1.08 9

The bulges prism size decreases with growth of eccentric loading, as well as the value of a maximum load (Fig. 16). Initial density of sand of the basis on Fig. 14, 15 is 1,608g/sm3. The diagram of dependence of the vertical force acting on a plate, from vertical moving a plate is shown on Fig. 16. The schedule has obviously expressed nonlinear character.
Fig. 16. Dependence settlement from vertical loading at
various eccentric: A- central loading; B - eccentric 0,05 m; C – eccentric 0, 1 m
References
ANSYS Theoretical Manual. www.cadfem.ru. Belytschko Ted, Wing Kam Liu, Brian Moran [2000]. „Nonlinear Finite Elements for Continua and Structures”. Wiley. Boldyrev G. G. and Nikitin E. V. [2005]. “Deformation of sand in the bed of a strip footing”. Journal Soil Mechanics and Foundation Engineering. SpringerLink, pp. 36-40. Di Y. and Sato T. [2003]. “Remapping Scheme in ALE Method for Liquefaction Simulation”. 16 th ASCE Engineering Mechanics Conference. University of Washington, Seattle. Di Y. and Sato T. [2004]. “Computational Modelling of Large Deformation of Saturated Soils Using an ALE Finite Element Method”. Annuals of Disas. Prev. Res. Inst., Kyoto Univ., No. 47 C. Li S. and Liu W.K. [2000]. “Numerical simulation of strain localization in inelastic solids using mesh-free methods”. International Journal for Numerical Methods in Engineering, No. 48, pp. 1285-1309. LS-DYNA Theoretical Manual. www.cadfem.ru.
Malyshev М.V. [1953]. “Theoretical and experimental researches of bearing capacity of the sandy basis”. Moscou, Inst. VODGEO (in Russian). Murakami A., Arimoto S., Setsuyasu T., Nishiyama T. [2005]. “Mesh-Free Method for Predicting the Behavior of Saturated Soil”. In: Geomechanics. Testing, Modelling, and Simulation, pp. 664-672. Nazem M. and Sheng D. [2005]. “Arbitrary Lagrangian-Euleran Method for Consolidstion Problems in Geomechanics”. VIII International Conference on Computational Plasticity. COMPLAS VIII. Eds.: E.Onate, D.R.J.Owen, Barcelona. Sokolovskij V.V. [1965]. “Statics of Granular Media”. Pergamon, Oxford.
Paper No. 1.08 10