the mineral industry in newfoundland and labrador: … · 2019. 9. 27. · development and current...
TRANSCRIPT

GOVERNMENT OFNEWFOUNDLAND AND LABRADOR
Department of Natural ResourcesGeological Survey
THE MINERAL INDUSTRY IN NEWFOUNDLANDAND LABRADOR: ITS DEVELOPMENT
AND ECONOMIC CONTRIBUTIONS
R.J. Wardle
Open File NFLD/2889
St. John’s, NewfoundlandOctober, 2004
CLICK HERE TO VIEW THE TABLE OF CONTENTS

NOTE
Open File reports and maps issued by the Geological Survey Division of the Newfoundland and LabradorDepartment of Natural Resources are made available for public use. The purchaser agrees not to providea digital reproduction or copy of this product to a third party. Derivative products should acknowledgethe source of the data.
DISCLAIMER
The Geological Survey, a division of the Department of Natural Resources (the “authors and publish-ers”), retains the sole right to the original data and information found in any product produced. Theauthors and publishers assume no legal liability or responsibility for any alterations, changes or misrep-resentations made by third parties with respect to these products or the original data. Furthermore, theGeological Survey assumes no liability with respect to digital reproductions or copies of original prod-ucts or for derivative products made by third parties. Please consult with the Geological Survey in orderto ensure originality and correctness of data and/or products.
Recommended citation:Wardle, R.J.
2004: The minerals industry in Newfoundland and Labrador: its development and economic contri-butions. Government of Newfoundland and Labrador, Geological Survey, Department of NaturalResources, St. John’s, Open File NFLD/2889, 96 pages.

GOVERNMENT OFNEWFOUNDLAND AND LABRADOR
Department of Natural ResourcesGeological Survey
THE MINERAL INDUSTRY IN NEWFOUNDLANDAND LABRADOR: ITS DEVELOPMENT
AND ECONOMIC CONTRIBUTIONS
R.J. Wardle
Open File NFLD/2889
St. John’s, NewfoundlandOctober, 2004

REMARKS
This document presents a brief overview of the economicdevelopment and current status of the Newfoundland and Labradorminerals industry, including its exploration sector. It is a non-tech-nical document with an emphasis on the review of statistical data,many of which have not been previously compiled in an easilyaccessible format. The first part reviews the history of mining andmineral policy in the province; followed by a presentation on themodern mining scene. This is followed by an examination of thehistorical trends in the gross value of mineral production, mineraltaxation, and employment in the province. Finally, the last sectionexamines the provincial historical trends in the mineral explorationsector.

CONTENTS
Page
SUMMARY . . . . . . . . . . . . . . . . . . . . . . . . . . . . . . . . . . . . . . . . . . . . . . . . . . . . . . . . . . . . . . . . . . . . . . . . . .
INTRODUCTION . . . . . . . . . . . . . . . . . . . . . . . . . . . . . . . . . . . . . . . . . . . . . . . . . . . . . . . . . . . . . . . . . . . . . Mines and Mineral Deposits – The Importance of Size . . . . . . . . . . . . . . . . . . . . . . . . . . . . . . . . . . . . .
A SHORT HISTORY OF MINING IN NEWFOUNDLAND AND LABRADOR . . . . . . . . . . . . . . . . . . . . . . . . . . Early Days . . . . . . . . . . . . . . . . . . . . . . . . . . . . . . . . . . . . . . . . . . . . . . . . . . . . . . . . . . . . . . . . . . . . . . . . Modern Mining . . . . . . . . . . . . . . . . . . . . . . . . . . . . . . . . . . . . . . . . . . . . . . . . . . . . . . . . . . . . . . . . . . . . Summary – A Cyclical History . . . . . . . . . . . . . . . . . . . . . . . . . . . . . . . . . . . . . . . . . . . . . . . . . . . . . . . .
THE DEVELOPMENT OF PROVINCIAL MINERAL POLICY . . . . . . . . . . . . . . . . . . . . . . . . . . . . . The Pre-confederation Period, 1800 to 1949 . . . . . . . . . . . . . . . . . . . . . . . . . . . . . . . . . . . . . . . . . . . . . . The Post-confederation Period, 1949 to 1972 . . . . . . . . . . . . . . . . . . . . . . . . . . . . . . . . . . . . . . . . . . . . . The Period 1972 to 1993 . . . . . . . . . . . . . . . . . . . . . . . . . . . . . . . . . . . . . . . . . . . . . . . . . . . . . . . . . . . . . Recent Developments, 1993 to Present . . . . . . . . . . . . . . . . . . . . . . . . . . . . . . . . . . . . . . . . . . . . . . . . . .
THE PRESENT-DAY (ca. 2003) MINING INDUSTRY IN NEWFOUNDLAND AND LABRADOR. Producing Operations – Metals . . . . . . . . . . . . . . . . . . . . . . . . . . . . . . . . . . . . . . . . . . . . . . . . . . . . . . . . Producing Operations – Industrial Minerals . . . . . . . . . . . . . . . . . . . . . . . . . . . . . . . . . . . . . . . . . . . . . . Producing Operations – Dimension Stone. . . . . . . . . . . . . . . . . . . . . . . . . . . . . . . . . . . . . . . . . . . . . . . . Inactive Operations . . . . . . . . . . . . . . . . . . . . . . . . . . . . . . . . . . . . . . . . . . . . . . . . . . . . . . . . . . . . . . . . . Developing Operations. . . . . . . . . . . . . . . . . . . . . . . . . . . . . . . . . . . . . . . . . . . . . . . . . . . . . . . . . . . . . . . Other Deposits with Development Potential . . . . . . . . . . . . . . . . . . . . . . . . . . . . . . . . . . . . . . . . . . . . . . Significant Undeveloped Resources . . . . . . . . . . . . . . . . . . . . . . . . . . . . . . . . . . . . . . . . . . . . . . . . . . . .
THE ECONOMIC VALUE OF MINERAL PRODUCTION – PRESENT DAY AND HISTORICALPERSPECTIVES . . . . . . . . . . . . . . . . . . . . . . . . . . . . . . . . . . . . . . . . . . . . . . . . . . . . . . . . . . . . . . . . . . . . . .
Key Statistics . . . . . . . . . . . . . . . . . . . . . . . . . . . . . . . . . . . . . . . . . . . . . . . . . . . . . . . . . . . . . . . . . . . . . . Present-Day Mineral Production . . . . . . . . . . . . . . . . . . . . . . . . . . . . . . . . . . . . . . . . . . . . . . . . . . . . . . . Historical Value of Mineral Production . . . . . . . . . . . . . . . . . . . . . . . . . . . . . . . . . . . . . . . . . . . . . . . . . .
The Pre-confederation Period 1867-1949. . . . . . . . . . . . . . . . . . . . . . . . . . . . . . . . . . . . . . . . . . . . . The Post-confederation Period, 1950-2002 . . . . . . . . . . . . . . . . . . . . . . . . . . . . . . . . . . . . . . . . . . .
Trends in the Gross Value of Mineral Production – The Controlling Influence of Iron-Ore Prices? . . . Effects of Other Metal Prices. . . . . . . . . . . . . . . . . . . . . . . . . . . . . . . . . . . . . . . . . . . . . . . . . . . . . . . . . . The Gross Value of Mineral Production broken down by Mining Project . . . . . . . . . . . . . . . . . . . . . . . Estimated Effects of a Voisey’s Bay Mining Operation on the Value of Mineral Production . . . . . . . . Comparison of Historical Mineral Production and Offshore Oil Project Values . . . . . . . . . . . . . . . . . . Summary . . . . . . . . . . . . . . . . . . . . . . . . . . . . . . . . . . . . . . . . . . . . . . . . . . . . . . . . . . . . . . . . . . . . . . . . .
TAXATION AND EMPLOYMENT BENEFITS FROM MINING . . . . . . . . . . . . . . . . . . . . . . . . . . . . . Taxation Benefits . . . . . . . . . . . . . . . . . . . . . . . . . . . . . . . . . . . . . . . . . . . . . . . . . . . . . . . . . . . . . . . . . . .
Mining Taxes and Royalties . . . . . . . . . . . . . . . . . . . . . . . . . . . . . . . . . . . . . . . . . . . . . . . . . . . . . . . Other Taxation Revenue . . . . . . . . . . . . . . . . . . . . . . . . . . . . . . . . . . . . . . . . . . . . . . . . . . . . . . . . . . Comparison of Mining and Oil Revenues . . . . . . . . . . . . . . . . . . . . . . . . . . . . . . . . . . . . . . . . . . . .
Employment and Wages. . . . . . . . . . . . . . . . . . . . . . . . . . . . . . . . . . . . . . . . . . . . . . . . . . . . . . . . . . . . . . Summary . . . . . . . . . . . . . . . . . . . . . . . . . . . . . . . . . . . . . . . . . . . . . . . . . . . . . . . . . . . . . . . . . . . . . . . . .
THE MINERAL EXPLORATION INDUSTRY . . . . . . . . . . . . . . . . . . . . . . . . . . . . . . . . . . . . . . . . . . . . Introduction . . . . . . . . . . . . . . . . . . . . . . . . . . . . . . . . . . . . . . . . . . . . . . . . . . . . . . . . . . . . . . . . . . . . . . . Historical Exploration Expenditures . . . . . . . . . . . . . . . . . . . . . . . . . . . . . . . . . . . . . . . . . . . . . . . . . . . .
. . . . . . . vii
. . . . . . . 1
. . . . . . . 1
. . . . . . . 2
. . . . . . . 2
. . . . . . . 4
. . . . . . . 6
. . . . . . . 9
. . . . . . . 9
. . . . . . . 10
. . . . . . . 11
. . . . . . . 12
. . . . . . . 14
. . . . . . . 14
. . . . . . . 16
. . . . . . . 17
. . . . . . . 17
. . . . . . . 18
. . . . . . . 18
. . . . . . . 18
. . . . . . . 19
. . . . . . . 20
. . . . . . . 20
. . . . . . . 22
. . . . . . . 22
. . . . . . . 25
. . . . . . . 29
. . . . . . . 31
. . . . . . . 33
. . . . . . . 36
. . . . . . . 38
. . . . . . . 39
. . . . . . . 40
. . . . . . . 40
. . . . . . . 40
. . . . . . . 42
. . . . . . . 43
. . . . . . . 43
. . . . . . . 45
. . . . . . . 46
. . . . . . . 46
. . . . . . . 46
i

Page
Other Measures of Exploration Activity . . . . . . . . . . . . . . . . . . . . . . . . . . . . . . . . . . . . . . . . . . . . . . . . . Comparisons with other Canadian Jurisdictions . . . . . . . . . . . . . . . . . . . . . . . . . . . . . . . . . . . . . . . . . . . Adequacy of Exploration Expenditures . . . . . . . . . . . . . . . . . . . . . . . . . . . . . . . . . . . . . . . . . . . . . . . . . . Summary . . . . . . . . . . . . . . . . . . . . . . . . . . . . . . . . . . . . . . . . . . . . . . . . . . . . . . . . . . . . . . . . . . . . . . . . .
ACKNOWLEDGMENTS. . . . . . . . . . . . . . . . . . . . . . . . . . . . . . . . . . . . . . . . . . . . . . . . . . . . . . . . . . . . . . .
REFERENCES . . . . . . . . . . . . . . . . . . . . . . . . . . . . . . . . . . . . . . . . . . . . . . . . . . . . . . . . . . . . . . . . . . . . . . .
APPENDIX 1: AN ENCAPSULATED HISTORY OF MINING IN NEWFOUNDLAND ANDLABRADOR . . . . . . . . . . . . . . . . . . . . . . . . . . . . . . . . . . . . . . . . . . . . . . . . . . . . . . . . . . .
APPENDIX 2: SOURCES OF PRE-CONFEDERATION DATA . . . . . . . . . . . . . . . . . . . . . . . . . . . . . . .
APPENDIX 3: DEFINITION AND CALCULATION OF CONSTANT DOLLAR VALUES . . . . . . . . .
APPENDIX 4: STATISTICAL INFORMATION . . . . . . . . . . . . . . . . . . . . . . . . . . . . . . . . . . . . . . . . . . . . Appendix 4A. Duration of Newfoundland and Labrador mining operations to 2001. . . . . . . . . . . . . . . .
The following appendices are also included as Microsoft Excel format spreadsheet files on the attachedCD-ROM.
Appendix 4B. Gross Value of Newfoundland and Labrador Mineral Production (GVMP) plus MiningTax & Royalties revenue,1865 - 2002 . . . . . . . . . . . . . . . . . . . . . . . . . . . . . . . . . . . . . . . .
Appendix 4C. Pre-confederation mineral production by quantity and value . . . . . . . . . . . . . . . . . . . . . . Appendix 4D. Gross Value of Mineral Production 1949 - 2002, by product, in current and year-2000
Canadian dollars . . . . . . . . . . . . . . . . . . . . . . . . . . . . . . . . . . . . . . . . . . . . . . . . . . . . . . . . . Appendix 4E. Newfoundland and Labrador Iron Ore Production; Tonnage produced vs Value . . . . . . . Appendix 4F. Historical values of selected Newfoundland and Labrador Mining Operations . . . . . . . . Appendix 4G. Labrador Iron Ore Production, by Operation . . . . . . . . . . . . . . . . . . . . . . . . . . . . . . . . . . . Appendix 4H. Historical Mineral Commodity Prices . . . . . . . . . . . . . . . . . . . . . . . . . . . . . . . . . . . . . . . . Appendix 4I. Mining Tax & Royalties and Other Taxation revenue, 1990 to 1998; A – in current dol-
lars, B – in year-2000 dollars . . . . . . . . . . . . . . . . . . . . . . . . . . . . . . . . . . . . . . . . . . . . . . . Appendix 4J. Employment and Annual Wages in the Newfoundland and Labrador Mining Industry . . Appendix 4K. Historical Exploration Statistics for Newfoundland and Labrador . . . . . . . . . . . . . . . . . . Appendix 4L. Historical Canadian exploration expenditures, by Province and Territory, in year-2000
dollars . . . . . . . . . . . . . . . . . . . . . . . . . . . . . . . . . . . . . . . . . . . . . . . . . . . . . . . . . . . . . . . . .
. . . . . . . 48
. . . . . . . 48
. . . . . . . 50
. . . . . . . 53
. . . . . . . 55
. . . . . . . 55
. . . . . . . 58
. . . . . . . 61
. . . . . . . 62
. . . . . . . 63
. . . . . . . 63
. . . . . . . 64
. . . . . . . 67
. . . . . . . 73
. . . . . . . 81
. . . . . . . 82
. . . . . . . 84
. . . . . . . 86
. . . . . . . 92
. . . . . . . 94
. . . . . . . 96
ii

FIGURES
Page
Figure 1. Past and present mining operations of Newfoundland and Labrador . . . . . . . . . . . . . . . . . . . .
Figure 2. Historical development of mining in Newfoundland and Labrador, 1860 to 2001 . . . . . . . . .
Figure 3. Summary of the number of mine openings and closings per decade . . . . . . . . . . . . . . . . . . . .
Figure 4. Number of mines in operation per decade in Newfoundland and Labrador. Note that somemines may only have operated for part of a decade . . . . . . . . . . . . . . . . . . . . . . . . . . . . . . . . .
Figure 5. Location of current mining operations and significant mineral deposits in Newfoundland andLabrador. . . . . . . . . . . . . . . . . . . . . . . . . . . . . . . . . . . . . . . . . . . . . . . . . . . . . . . . . . . . . . . . . . .
Figure 6. Relative share of real Gross Domestic Product (GDP) for the Goods Producing Industries,Newfoundland and Labrador, 2001 in 1997 Canadian dollars . . . . . . . . . . . . . . . . . . . . . . . . .
Figure 7. Value of Canadian minerals production (metals and non-metals), by province, 2000 (project-ed) . . . . . . . . . . . . . . . . . . . . . . . . . . . . . . . . . . . . . . . . . . . . . . . . . . . . . . . . . . . . . . . . . . . . . . .
Figure 8. Value of Canadian minerals and fuels production, by province, 2000 (projected). . . . . . . . . .
Figure 9. Value of Canadian minerals production (metals and non-metals), by province, 1989-2000based on year-2000 dollars . . . . . . . . . . . . . . . . . . . . . . . . . . . . . . . . . . . . . . . . . . . . . . . . . . . .
Figure 10. Total value of Newfoundland and Labrador mineral production, 1867 to 2002; in current andconstant (year-2000) dollars . . . . . . . . . . . . . . . . . . . . . . . . . . . . . . . . . . . . . . . . . . . . . . . . . . .
Figure 11. The Gross Value of Mineral Production during the pre-confederation period, in annualCanadian dollars – showing metals vs non-metals share . . . . . . . . . . . . . . . . . . . . . . . . . . . . .
Figure 12. The Gross Value of Mineral Production during the pre-confederation period, in year-2000Canadian dollars – showing metals vs non-metals share . . . . . . . . . . . . . . . . . . . . . . . . . . . . .
Figure 13. Value of major pre-confederation mine output, in year-2000 dollars . . . . . . . . . . . . . . . . . . . .
Figure 14. The Gross Value of Mineral Production, 1949 to 2002 in current Canadian dollars – showingmetals vs non-metals share . . . . . . . . . . . . . . . . . . . . . . . . . . . . . . . . . . . . . . . . . . . . . . . . . . . .
Figure 15. The Gross Value of Mineral Production, 1949 to 2002 in year-2000 Canadian dollars – show-ing metals vs non-metals share . . . . . . . . . . . . . . . . . . . . . . . . . . . . . . . . . . . . . . . . . . . . . . . . .
Figure 16. The share of individual metallic mineral commodities of the Gross Value of MineralProduction, 1949 to 2002. In year-2000 Canadian dollars . . . . . . . . . . . . . . . . . . . . . . . . . . . .
Figure 17. The share of individual non-metallic commodities of the Gross Value of Mineral Production,1949 to 2002. In year-2000 Canadian dollars . . . . . . . . . . . . . . . . . . . . . . . . . . . . . . . . . . . . . .
Figure 18. Provincial production of iron ore vs value of iron ore shipments in year-2000 Canadian dol-lars . . . . . . . . . . . . . . . . . . . . . . . . . . . . . . . . . . . . . . . . . . . . . . . . . . . . . . . . . . . . . . . . . . . . . . .
Figure 19. Price of iron ore 1949 to 2000 in current and year-2000 dollars . . . . . . . . . . . . . . . . . . . . . . .
. . . . . . . 3
. . . . . . . 7
. . . . . . . 8
. . . . . . . 9
. . . . . . . 15
. . . . . . . 20
. . . . . . . 21
. . . . . . . 21
. . . . . . . 22
. . . . . . . 23
. . . . . . . 24
. . . . . . . 24
. . . . . . . 25
. . . . . . . 26
. . . . . . . 26
. . . . . . . 27
. . . . . . . 28
. . . . . . . 29
. . . . . . . 30
iii

Page
Figure 20. World production of iron ore vs world value of iron-ore production, in year-1998 US dollars
Figure 21. Comparison of Canadian vs Newfoundland and Labrador gross values of mineral production;in current and year-2000 Canadian dollars . . . . . . . . . . . . . . . . . . . . . . . . . . . . . . . . . . . . . . . .
Figure 22. Metals price index in year-1997 US dollars (copper, gold, iron ore, lead and zinc) . . . . . . . .
Figure 23. Copper and gold prices in year-1997 US dollars . . . . . . . . . . . . . . . . . . . . . . . . . . . . . . . . . . .
Figure 24. The comparative historical value of Newfoundland and Labrador mining operations in year-2000 US dollars . . . . . . . . . . . . . . . . . . . . . . . . . . . . . . . . . . . . . . . . . . . . . . . . . . . . . . . . . . . . .
Figure 25. The comparative historical value of Newfoundland and Labrador mining operations in year-2000 US dollars, also showing estimated in-situ values for the Voisey’s Bay deposit. . . . . . .
Figure 26. Gross Value of Mineral Production in constant Canadian dollars showing hypothetical effectof Voisey’s Bay production added to year-2002 values . . . . . . . . . . . . . . . . . . . . . . . . . . . . . .
Figure 27. The comparative historical value of selected mining operations compared to estimated in-situvalues for the Hibernia and Terra Nova oil fields, in year-2000 US dollars and using a long-term price of US$20 per barrel . . . . . . . . . . . . . . . . . . . . . . . . . . . . . . . . . . . . . . . . . . . . . . . . .
Figure 28. Direct Provincial Revenue (right axis) vs Gross Value of Mineral Production (left axis) inyear-2000 Canadian dollars . . . . . . . . . . . . . . . . . . . . . . . . . . . . . . . . . . . . . . . . . . . . . . . . . . . .
Figure 29. Direct Provincial Revenue as a percentage of the annual Gross Value of Mineral Production.Bold line is a moving-average trendline . . . . . . . . . . . . . . . . . . . . . . . . . . . . . . . . . . . . . . . . . .
Figure 30. Breakdown of total Provincial Mineral Revenue averaged over the period 1990 to 1998. Inyear-2000 Canadian dollars . . . . . . . . . . . . . . . . . . . . . . . . . . . . . . . . . . . . . . . . . . . . . . . . . . . .
Figure 31. Total annual employment vs the Gross Value of Mineral Production (GVMP) in year-2000Canadian dollars . . . . . . . . . . . . . . . . . . . . . . . . . . . . . . . . . . . . . . . . . . . . . . . . . . . . . . . . . . . .
Figure 32. Total annual employment vs average wages for Newfoundland and Labrador mining in year-2000 Canadian dollars . . . . . . . . . . . . . . . . . . . . . . . . . . . . . . . . . . . . . . . . . . . . . . . . . . . . . . . .
Figure 33. Employment in Newfoundland and Labrador mining; iron-ore mines vs all operations, 1994to 2002 . . . . . . . . . . . . . . . . . . . . . . . . . . . . . . . . . . . . . . . . . . . . . . . . . . . . . . . . . . . . . . . . . . . .
Figure 34. Employment in Newfoundland and Labrador mining; metallic vs non-metallic sectors, 1994to 2002 . . . . . . . . . . . . . . . . . . . . . . . . . . . . . . . . . . . . . . . . . . . . . . . . . . . . . . . . . . . . . . . . . . . .
Figure 35. Historical exploration expenditures in current Canadian dollars . . . . . . . . . . . . . . . . . . . . . . .
Figure 36. Historical exploration expenditures in year-2000 Canadian dollars . . . . . . . . . . . . . . . . . . . . .
Figure 37. Number of claims staked per year. . . . . . . . . . . . . . . . . . . . . . . . . . . . . . . . . . . . . . . . . . . . . . .
Figure 38. Number of metres of diamond drilling per year . . . . . . . . . . . . . . . . . . . . . . . . . . . . . . . . . . . .
. . . . . . . 31
. . . . . . . 32
. . . . . . . 33
. . . . . . . 34
. . . . . . . 35
. . . . . . . 37
. . . . . . . 38
. . . . . . . 39
. . . . . . . 41
. . . . . . . 42
. . . . . . . 42
. . . . . . . 44
. . . . . . . 45
. . . . . . . 45
. . . . . . . 45
. . . . . . . 47
. . . . . . . 47
. . . . . . . 49
. . . . . . . 49
iv

Page
Figure 39. Canadian vs Newfoundland and Labrador exploration expenditures 1989 to 2002, in year-2000 dollars . . . . . . . . . . . . . . . . . . . . . . . . . . . . . . . . . . . . . . . . . . . . . . . . . . . . . . . . . . . . . . . .
Figure 40. Exploration expenditures for Newfoundland and Labrador vs other provinces and territories1989 to 2002, in year-2000 Canadian dollars . . . . . . . . . . . . . . . . . . . . . . . . . . . . . . . . . . . . . .
Figure 41. Average annual exploration expenditures 1989 to 2002 by Canadian provinces and territoriesas a percentage of the Canadian total . . . . . . . . . . . . . . . . . . . . . . . . . . . . . . . . . . . . . . . . . . . .
. . . . . . . 50
. . . . . . . 51
. . . . . . . 52
v

vi
TABLES
Page
Table 1. Gross value of mineral production for 2002, in decreasing order of value . . . . . . . . . . . . . . .
Table 2. Historical total gross values of mineral production for Newfoundland and Labrador mineraloperations. . . . . . . . . . . . . . . . . . . . . . . . . . . . . . . . . . . . . . . . . . . . . . . . . . . . . . . . . . . . . . . . . .
Table 3. Estimated gross in-situ value of the Voisey’s Bay deposits . . . . . . . . . . . . . . . . . . . . . . . . . . .
Table 4. Mining Tax and Royalties vs Other Taxes for the period 1990 to 1998, in millions of year-2000 Canadian dollars . . . . . . . . . . . . . . . . . . . . . . . . . . . . . . . . . . . . . . . . . . . . . . . . . . . . . . . .
Table 5. Production to Date vs Remaining Resources Metallic commodities . . . . . . . . . . . . . . . . . . . .
Table 6. Production to Date vs Remaining Resources Non-metallic minerals . . . . . . . . . . . . . . . . . . . .
Table 7. The ratio of exploration expenditures to the gross value of mineral production for eachCanadian province and territory for the year 2000 and as an average for the period 1989 to2000 . . . . . . . . . . . . . . . . . . . . . . . . . . . . . . . . . . . . . . . . . . . . . . . . . . . . . . . . . . . . . . . . . . . . . .
. . . . . . . 21
. . . . . . . 36
. . . . . . . 37
. . . . . . . 43
. . . . . . . 53
. . . . . . . 54
. . . . . . . 54

vii
SUMMARY
This document presents a brief overview of the economic development and present-day statusof the Newfoundland and Labrador minerals industry, including its exploration sector. It is a most-ly non-technical document that has an emphasis on the review of statistical data, much of whichhave not been previously compiled in an easily accessible format. Details of mining history are dis-cussed, where appropriate, but the document does not attempt to provide a comprehensive accountof the mining industry in Newfoundland and Labrador.
Mining is the process of extracting minerals from the earth. The industry has long been a vitalcomponent in the development of nations and has made significant historical contributions to thedevelopment of Newfoundland and, in particular, Labrador. This Province has a long history ofmining that on a small scale extends back to pre-historic times but which, in a modern sense, com-menced with the discovery and extraction of copper in the 1860s. This ushered in the first miningboom in what has proved to be a cyclical history of boom and recession. The period 1860-1900was dominated by a surge in copper production in Notre Dame Bay and also by the discovery ofthe Wabana iron deposits of Bell Island. This was then followed by a prolonged period of quies-cence lasting until the late 1940s, punctuated only by the widely spaced discoveries of theAguathuna (limestone), Buchans (base metals) and St. Lawrence (fluorite) deposits. Buchans wasthe stellar discovery of the period and experienced rapid growth even through the GreatDepression and Second World War. The end of the Second World War in 1945 was followed by thegreatest mining boom in the Province’s history. This saw a series of discoveries and mine openingsthat lasted until ca. 1970, with perhaps the greatest achievement being the development of the west-ern Labrador iron mines at Schefferville1 (Knob Lake), Labrador City and Wabush. Significant dis-coveries also occurred in Newfoundland resulting in important mines such as Baie Verte (asbestos)and Rambler (base metals).
In contrast, the following period of 1970 to 1990 marked a decline in mining activity that sawthe closure of many operations that represented the heart of the Province’s mining industry. Two ofthe more important closures were Buchans and Schefferville. The period 1990 to present has seena gradual recovery in activity, notably a renaissance in the dimension-stone industry and mostimportantly, the discovery of the Voisey’s Bay nickel–copper–cobalt deposit. This latter major dis-covery is presently scheduled to enter production in 2005 and promises to revitalize the provincialmining industry.
Government policy with respect to the mining industry has evolved considerably. Policy in thepre-confederation era was driven principally by the need to open up the interior of Newfoundlandand provide economic development. Therefore, mining was seen very much as a frontier activitythat would create jobs and provide infrastructure, and where direct financial benefits through tax-ation and royalties was a secondary consideration. Regulation of the industry began in the 1860s,and provided for the staking of claims as well as the awarding of mineral rights through fee sim-ple grants. In the early half of the 20th century, particularly in the period that followed the instal-lation of the Commission of Government in 1934 (during which Newfoundland reverted to Britishcolonial administration), a growing tendency emerged to award mineral rights by special agree-ment – the so-called concession system. This system was based upon the award of large tracts ofland to selected companies or individuals for extended periods of time; the rationale being that thiswas the most effective manner in which to attract the exploration and development capital requiredto mount large-scale, prolonged exploration surveys in remote regions. Following confederationwith Canada in 1949, Newfoundland regained control of its mineral resources and began a sys-tematic effort to promote its mineral potential to take advantage of the surging post-war demand
1The operation was originally referred to as Knob Lake but later became based on the town of Schefferville on the Québecside of the Québec/Labrador border and became more commonly known under that name. Schefferville is therefore used inthis report but with the understanding that for the most part it only refers to production from the Labrador part of the oper-ation. Production was approximately equal from both sides of the border.

for such resources. This post-war period was characterized by almost exclusive use of the conces-sion system. Many significant discoveries were made under this system and all, including the land-mark iron ore developments in western Labrador, came into production under the terms of specialagreements that also determined the level of government royalties. Royalties, however, continuedto be a secondary consideration after jobs and development. By the 1970s, the merits of the con-cession system were being questioned on the basis of the meager royalties that it generated and theperception that the Province was becoming under-explored in comparison with other areas ofCanada. A series of reforms in the mid-1970s drastically overhauled the mineral tenure system andreplaced the concession system with one based upon the competitive claim staking that had becomethe norm elsewhere in Canada. Measures were also brought in to encourage concession holders tosurrender land so that it could be explored under the new regime. Concomitant changes were alsomade to the mining tax legislation to provide for increased royalties, however, these only appliedto operations that came on stream after 1978. This revised legislative framework has survived moreor less intact to the present day. Modifications in ca. 1995, prompted in large part by the Voisey’sBay discovery of 1994, focused on ensuring that a greater degree of primary processing takes placein the Province, and on dealing with the mineral-resource aspects of aboriginal land claims. Agrowing focus on resource management issues and the need to provide for adequate closure andrehabilitation measures have also driven increased regulation of the mining industry, notablythrough the Mining Act of 1999.
In 2003, the mining sector in Newfoundland and Labrador consisted of 12 operations, three ofwhich are metal mines, seven are industrial-mineral operations and three are dimension-stoneoperations. The major metallic mining operations are the iron ore mines of the Iron Ore Companyof Canada and Wabush Mines in western Labrador. The only other metallic mining operation is thesmall Hammer Down gold mine operated by Richmont Mines Inc. in northeastern Newfoundland.The industrial-mineral operations are dominated by limestone, dolomite and dimension stone, andlesser amounts of peat, silica and gypsum. The largest industrial-mineral operation is that ofAtlantic Minerals Ltd. at Lower Cove, which produces high-purity limestone and dolomite forexport. Construction materials such as sand, gravel and aggregate stone are also a significant partof the industry but are dispersed as a number of small quarrying operations across the Provinceand service a mostly domestic market. The dimension-stone industry has seen considerable growthover the last decade and produces slate and ‘granite’ (including a variety of different rock types).
Also, there are some significant undeveloped deposits that may see production in the near tomedium term. The most significant of these, is the Voisey’s Bay nickel–copper–cobalt deposit ofLabrador which is scheduled to enter production in 2005. The Duck Pond base-metal deposit ofcentral Newfoundland is also being considered for production. Other undeveloped resourcesinclude the Strange Lake yttrium–zirconium deposit of northern Labrador, and a number of smallgold, base-metal and industrial-mineral deposits in Newfoundland. Most of these will requireeither higher commodity prices or additions to their mineral resource bases to become economic.
Mining brings benefits to the Province through shareholder profits, taxes, wages, and the spin-off gains that accrue from local employment and purchasing. Measures of the contribution of theindustry that are examined here include the Gross Value of Mineral Production – a measure of thesales revenue that is received for each mineral commodity produced in the Province; taxationreturns, and wage and employment levels. Some recent (ca. 2003) key statistics for the industry are:
• Mining in 2001 accounted for 8% of the Gross Domestic Product of the provincial goods-pro-ducing sector and 3% of the overall Gross Domestic Product of the Province.
• Mining in the Province employs about 2500 persons at an average wage of $66 000, basedupon 1999 wage data.
• The Province currently produces almost 6% of the total gross value of mineral shipments inCanada and ranks 6th in terms of other provinces and territories.
viii

• The Province is the leading producer of iron ore in Canada, accounting for 63% of Canadianiron ore production, and 2% of world production.
• When the Voisey’s Bay nickel deposit enters production ca. 2005, the Province will probablybe the second largest supplier of nickel in Canada, yielding 30 to 34% of total Canadian pro-duction.
The Gross Value of Mineral Production is examined from the start of records in 1867 to thepresent. Between 1867 and 1945 the industry was characterized by highly cyclical activity that wasdisrupted by the economic upheavals associated with two world wars and the intervening GreatDepression. Pronounced growth in the gross value of production followed the Second World Warand lasted almost unabated until 1979, at which point it began a steep cyclical decline that haslasted to the present day. Mineral production up until the 1960s was fairly diversified but has sincebecome progressively dominated by iron ore with this product presently accounting for 91% of min-eral production. Of the remainder, 3% consists of gold production and 6% of non-metals, chieflythe construction materials (sand, gravel, and aggregate stone), dimension stone and dolomite. Inrecent years, the main growth in the non-metals area has been in crushed rock aggregate, dolomiteand dimension-stone production.
The extent of the change in the gross value of production is reflected in the fact that the his-torical peak production value achieved in 1979 was $2700 million, in constant year-2000Canadian dollars, compared to a current value of around $800 million. In constant-dollar terms,present-day production is only at early 1960s levels. The reason for this pronounced decline isthought to be a combination of mine closures (e.g., Buchans and Schefferville), coupled with asteep decline in the constant-dollar price of iron ore and most metals. These price declines weredriven by global trends, chiefly the emergence of new sources of cheaper minerals, technologicalchanges that drove down the cost of production, and oversupply. The Province's iron-ore industrysuffered in particular from the impact of cheap new production from offshore competitors (notablyBrazil) in its principal market areas of the United States and Europe.
The gross value of the Province's historical mineral production has been further examined interms of the contributions of individual mining operations. The overall value of production fromeach operation has been calculated in year-2000 US dollars using historical commodity prices.Pertinent facts that emerge from this analysis are:
• 89% of the value of the Province’s historical mineral production has been provided by fouroperations: Labrador City, Schefferville, Wabush and Buchans.
• One operation (Labrador City) has contributed 46% of the total value of production.
• Iron-ore operations (Wabana, Schefferville, Labrador City and Wabush) have accounted for75% of the total value of mineral production.
• The historical total gross value of mineral production from 1867 to present is estimated ataround US$54,000 million year-2000 dollars.
This underscores the message from elsewhere in the world that it is the few, very large depositsthat contribute the bulk of the value of mineral production; a global rule of thumb (e.g., Singer,1995) being that the top 10% of deposits are estimated to contain between 50 and 80% of the totalreserves for the most commonly used metal ores. After the four large provincial operations notedabove, the next highest contributor was Wabana, which provided 3% of the total.
A further analysis considers the hypothetical impact of the Voisey’s Bay project when it comeson stream in 2005. Based on present day price forecasts and mining of the 32-million-tonne ovoiddeposit, this will increase the 2002 gross value of mineral production by ca. 85%, and thus restore
ix

it to a ca. 1984 level. The overall value in-situ2 of the Voisey’s Bay deposit at this level appearscomparable to that of the Buchans, Wabush and Schefferville operations but is easily exceeded bythe gross production value to date of the Iron Ore Company of Canada’s Labrador City operation.
Similar analysis indicates that the Province’s major mining projects also compare favourablyin terms of their gross value of production with the predicted gross in-situ value of the Hiberniaand Terra Nova offshore-oil projects; in fact the value produced to date by the Labrador City ironore operation exceeds the predicted value of the in-situ recoverable reserves of each oil project.
An analysis of taxation revenues examines Mining Tax and Royalty payments as well othertaxes that are applied to the mining sector. Mining Tax and Royalties consist of tax paid under theMining and Mineral Rights Tax Act, and royalties paid under a number of long-standing privateacts, particularly in the iron-ore industry. Revenue to the Province from these sources hasincreased from an average value of about $10 million in the 1949-76 period, to an average levelof about $25 million in the 1985-2002 period. When looked at as a percentage of the gross valueof mineral production (GVMP), this translates to an increase from an average value of 1% ofGVMP in the former period to 2.5% of GVMP in the latter - an overall increase of about 150%.This increase was primarily due to the impact of the Mining and Mineral Rights Tax Act of 1975on the private royalties paid by the iron-ore industry, and to a lesser extent to new mining opera-tions, such as Daniel’s Harbour, that came on stream under the Act.
Other taxation revenue (corporate, fuel, retail sales, municipal and sundry taxes), for whichdata are only available for the 1990-98 period, exceeded Mining Tax and Royalties revenue by afactor of four and averaged 8.7% of the gross value of mineral production. Total taxation revenueamounted to 11% of the gross value of mineral production during the 1990-98 period.
Employment in the mining industry appears to have been roughly correlated with the grossvalue of mineral production, rising from 3500 in 1949 to a peak of around 7000 ca. 1970 (perhapsrising even higher at the time of peak mineral production in the late 1970s to mid 1980s – a peri-od for which data are unavailable), followed by a steady decline to a present level of about 2500.Current employment levels are the lowest in the province’s mining history. Metallic mining (most-ly iron ore) has accounted for 81% of employment in the provincial mining industry over the pastdecade.
In contrast to the decline in employment, average wages have shown a consistent increasesince 1949, even when adjusted to constant dollar values. The 1999 average annual wage ofaround $66 000 (the most recent data available) was reputedly one of the highest in the provincialresource sector. Since the late 1980s, average wages have continued to increase strongly in the faceof declining employment, probably as the result of increased technical specialization and higherskill requirements in the industry.
The final section of this document examines the exploration sector, which is the vital forerun-ner to mining development and is an essential component of a healthy and sustainable industry.The measures of exploration activity examined are exploration expenditures, claim staking activi-ty and amount of diamond drilling carried out. Records for these activities extend back to 1945,however, expenditure figures may not be fully representative of overall provincial activity for thepre-1981 period. Prior to 1981, much land was held under the concession system and explorationactivity tended to be under-reported. Exploration expenditures have been strongly cyclical, show-ing peaks in the late 1950s-60s, late 1980s and mid 1990s corresponding to periods of high metalprices and new discoveries, and intervening lows that generally correlate with downturns or reces-sions. The boom of the late 1950s-early 1960s was sparked by demand for steel and the result ofexploration for iron ore in western Labrador. This peaked at expenditure levels of $100 million
x
2In-situ value as used here refers to the theoretical value of a reserve that is still completely or largely in place in the ground.Obviously, this value is based on long-term price assumptions and differs from a realized production value.

(year-2000 dollars). The mid-1980s peak was driven by gold exploration (aided by a program offederal flow-through share incentives) and focused predominantly on the Island of Newfoundland.The Hope Brook gold mine resulted from this phase, as did some smaller discoveries that havesince become mines (e.g., Nugget Pond and Hammer Down). The mid-1990s phase was promptedoriginally by diamond exploration but switched rapidly to nickel following the serendipitous dis-covery of the Voisey’s Bay deposit in northern Labrador. The exploration surge following this dis-covery resulted in another expenditure peak of $100 million dollars (year-2000 Canadian dollars)in 1996. This was followed by the most recent cycle, which has been a downturn that apparentlybottomed in 1999-2000. Expenditures are now increasing and the current level of $42 million isabove the historical average of $35 million (in year-2000 dollars). This mimics national explo-ration trends, although it should be noted that much of the expenditure has been directed towardthe Voisey’s Bay project in Labrador.
Claim staking and diamond drilling activity have generally followed the expenditure patterns.The Voisey’s Bay discovery resulted in record claim staking activity, and in drilling activity thatequaled that of the mid-1980s boom. Claim staking and diamond drilling now appear to be increas-ing following a cyclical low in 1999-2001.
At a national level, the Province has accounted for an average of 6% of total Canadian explo-ration expenditures over the 1989-2001 period and has ranked 6th highest amongst the provincesand territories. In terms of the ratio of exploration expenditure to value of production, the Provinceranks 4th highest in Canada. Therefore by national standards at least, the Province seems to bedoing comparatively well at attracting exploration dollars in proportion to the size of its miningindustry. It is also to be expected that the development of the Voisey’s Bay project will result in afurther rise in provincial exploration expenditures, as may the renewed gold exploration in insularNewfoundland.
The purpose of exploration is to sustain the industry through the discovery of new orebodies.A brief examination of the state of the Province’s reserves and resources indicates that for the vitaliron-ore operations, these are sufficient for the foreseeable future – provided that present techno-logical and economic requirements do not change. Significant new resources have been discoveredfor nickel, cobalt and copper, the Voisey’s Bay deposit having more than replaced the copper pro-duced from the Province to date. On the downside, however, resources for zinc, lead, gold and sil-ver are in significant decline and exploration has failed to replace those consumed through min-ing. Industrial-mineral and construction-material resources for operations currently in productionare adequate for the foreseeable future. Increased production in this sector will probably dependmore on market improvements than additional discoveries.
In conclusion, the mining industry of Newfoundland and Labrador has changed significantlyover the years, moving from a well-diversified state prior to 1960, to one presently overwhelming-ly dominated by iron ore. An analysis of the gross-production value of the industry indicates that90% has come from four mines; Buchans (base metals) and Schefferville, Wabush and LabradorCity (iron ore). The existence of this “big four” reinforces the message derived from elsewhere inthe world that it is the few, very large mineral deposits that make by far the greatest contributionto provincial and national economies. This is not to decry the value of other smaller operations buttheir benefits are orders of magnitudes lower and have likely been more significant at the region-al rather than provincial level. The industry grew to its heyday in the late 1970s but then entereda prolonged decline that has lasted in a cyclical fashion to the present day. This decline has beendriven by global economic forces that have affected the Canadian mining industry as a whole andhave been beyond the Province’s ability to control. The decline will be offset to a considerabledegree by the Voisey’s Bay mine, which when it enters production in 2005, has the capacity toincrease the present gross value of production by 85%. A further bright note is that the averageindustry wage continues to increase despite falling employment levels, indicating a trend to asmaller but more highly paid workforce. Exploration activity appears to be emerging from the lat-est cyclical downturn at a strong level.
xi
INTRODUCTION
The mineral industry has had a profound effect on theeconomic development of Newfoundland and Labrador. Inaddition to its substantial contributions to the provincialtreasury, the industry has been the principal agent of growthin several regions of the Province. For example, late 19th cen-tury copper mining in the Notre Dame Bay area spearheadedthe drive to construct the trans-Newfoundland railroad andthus connect the scattered settlements of the former colonyfor the first time. Subsequent 20th century developments ledto the growth of Baie Verte, Wabana, Springdale andBuchans as towns that depended heavily, if not exclusively,on mining. Perhaps the greatest impact of mining, though,was in the mid 20th century drive to open up and developLabrador. The result of this was the establishment of theWabush–Labrador City area as one of the Province’s mainindustrial centres. When the Voisey’s Bay project enters pro-duction in 2005, it will revitalize the Province’s mineral pro-duction and have a significant impact on economic develop-ment.
This document presents a brief overview of the econom-ic development and present-day status of the Newfoundlandand Labrador minerals industry, including its explorationsector. It is a relatively non-technical review that is intendedto provide a factual analysis of the historical development ofthe industry and its mineral production. The emphasisthroughout is on review of statistical data, many of whichhave not been previously compiled into an easily accessibleformat. Details of mining history are discussed where appro-priate and a comprehensive account of the mining industry inNewfoundland and Labrador has been more than adequatelyaccomplished in other publications (e.g., Martin, 1983). Thefindings for the most part are self evident. Analysis is provid-ed where appropriate but it is not the purpose of this docu-ment to comment or make recommendations on industry orgovernment policy. The raw statistical data are presented inAppendix 4 in both tabular and spreadsheet (MS Excel 2000;see CD-ROM enclosed) format.
This paper first examines the history of mining and min-eral policy in the Province followed by a review of the mod-ern day mining scene. It then examines the economic bene-fits that the province derives from mining, namely throughthe gross value of production, the revenues that accrue tovarious levels of government through taxes and royalties,and employment. Finally, it examines the exploration sector,which is vital to the sustainable development of mining in theProvince.
Mines and Mineral Deposits – The Importance of Size
Mining is the process of extracting and processing min-erals from a mineral deposit. A mineral deposit is a mineral
concentration that is generally defined by its size (common-ly expressed in millions of tonnes) and grade (the degree towhich the deposit is enriched in the desired mineral or ele-ment). When a mineral deposit is proven to have sufficienttonnage and grade that it can be mined at a profit, it is thenreferred to as an orebody or ore reserve.
An important point is that mineral deposits are not cre-ated equally – they exist in all combinations of grade andsize. As a result, of the many mineral deposits that have beenfound in Newfoundland and Labrador, only a few haveproven rich or large enough to be mined. It is also one of theunder-appreciated aspects of mineral deposits that their valueis very much concentrated in the larger deposits of the so-called giant or world-class type. These are usually defined asthe top 10% of deposits on a global basis in terms of theamount of metal that they contain, and are estimated to con-tain between 50 and 80% of the most commonly used metalores. Thus, a relatively small number of deposits have anentirely disproportionate influence on metal supply and prof-itability. These large deposits have sustained production formany decades, even exceeding a century in some cases. Thewealth that they have generated has built substantial commu-nities and in many cases has provided the impetus for thegrowth of entire regions and states. Australia for exampleowes much of its early growth to giant base-metal and golddiscoveries; South Africa grew on the basis of world-classdiamond and gold discoveries, and Ontario benefitted enor-mously from the nickel deposits of the Sudbury area. World-class deposits are also known as company-builders in thesense that their discovery has formed the basis for thegrowth of many of the world’s leading mining companies(e.g., Rio Tinto, BHP-Billiton, Inco). Understandably, there-fore, giant or world-class deposits are intensely sought afterby the worlds mining community.
Newfoundland and Labrador has been fortunate to pos-sess at least one mineral operation that is clearly world-class,namely the Labrador City–Wabush iron-ore mining complex(also including its cross-border extension in the Fermont areaof Québec and the now-closed Schefferville operations).This area of Labrador–Québec is the premier source of ironin Canada and ranks as a global asset. Also, the Province hashad another very valuable, arguably world-class, group ofdeposits at Buchans in central Newfoundland. These pro-duced base metals and closed in the mid 1980s. As will bedemonstrated elsewhere, these four deposits (or deposit areasto be correct because each site includes multiple deposits),namely Labrador City, Wabush, Schefferville and Buchanscollectively account for about 90% of the historical value ofmineral production from the Province, reinforcing, in a localfashion, the message that it is the very large deposits thatreally matter. Another world-class deposit at Voisey’s Baywas discovered in the mid 1990s and is scheduled for pro-duction in 2005.
1

A SHORT HISTORY OF MINING INNEWFOUNDLAND AND LABRADOR
Early Days
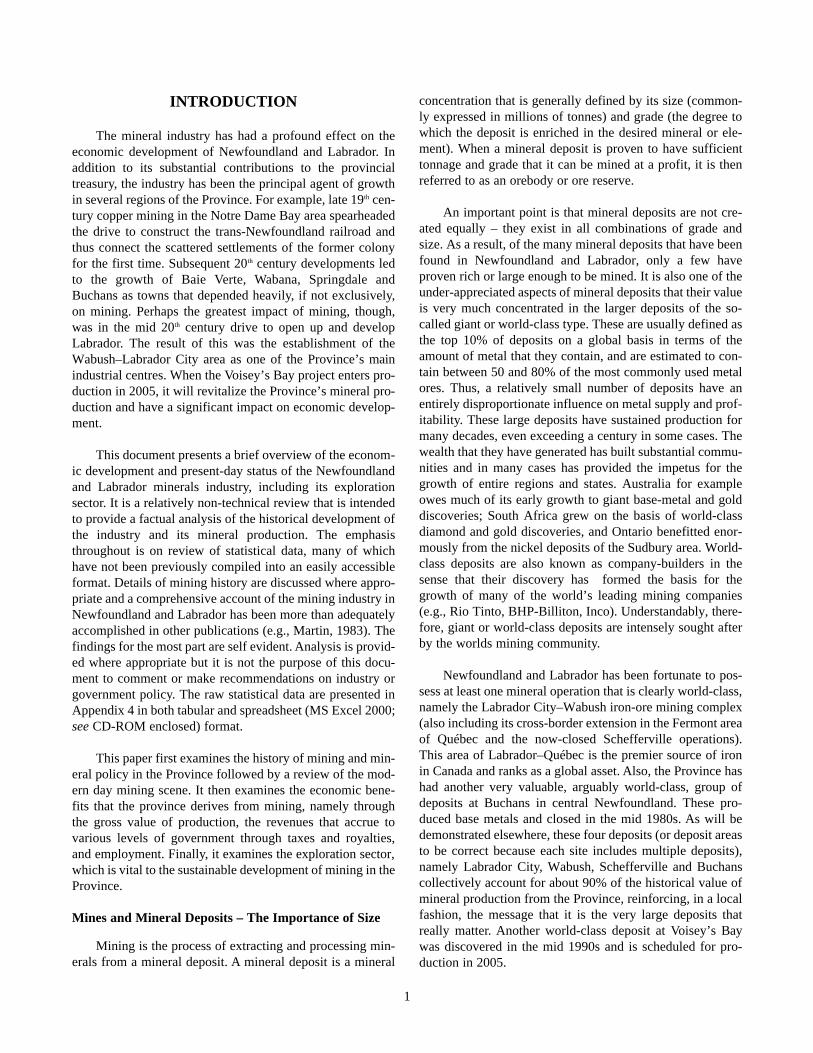
The record of pre-confederation (pre-1949) mining inNewfoundland has been compiled by Martin (1983) andSnelgrove (1938) and most of the following is summarizedfrom that account, supplemented for post-confederationyears by information from Snelgrove and Baird (1953),Gibbons and Mercer (1982) and unpublished records of the*Department of Mines and Energy. The locations of histori-cally significant mining operations are illustrated in Figure 1.
The first record of mining in the Province was in Pre-historic times, commencing about 4000 years ago, when theMaritime Archaic Indians mined chert from northernLabrador, and the Dorset Eskimos quarried soapstone fromdeposits near Baie Verte on the Island of Newfoundland.Both cultures developed extensive coastal trading networksthat, at least in part, depended upon these minerals. There isalso evidence that the Vikings, who settled in northeasternNewfoundland ca. 1000 A.D., mined bog iron ore near theirsettlement at L’Anse aux Meadows. The potential mineralresources of Newfoundland were noted by early Europeansettlers in the 16th and 17th centuries; however, it was not untilthe mid 19th century that the first attempts at mining for com-mercial purposes were made. A number of ventures com-menced between 1855 and 1860 around the Avalon Peninsulaand Notre Dame Bay areas, the most notable being the LaManche lead mine, which managed some intermittent pro-duction until final closure in 1873. The first commerciallysuccessful venture was the Tilt Cove copper mine in NotreDame Bay, which commenced production in 1864. This ush-ered in the Newfoundland copper boom, which peaked in the1880s and finally expired in 1913. This period saw the devel-opment of several successful mines in the Notre Dame Bayarea, notably Little Bay, Betts Cove and Pilley’s Island and ahost of smaller short-lived operations. During this time,Newfoundland was for a while the sixth largest producer ofcopper in the world. Most of the copper was shipped tosmelters in Swansea, Wales, however, several of the minesestablished local smelting operations with varying degrees ofsuccess – and pollution. The wane of the copper boom wasdetermined partly by poor management – many mines weresubject to high-grading during market lows – but also bycompetition from new and cheaper sources of copper fromlarge open-pit resources in Spain, the southwest USA andSouth America. A plunge in copper prices following WorldWar I provided the coup de grace to the Newfoundlandindustry. An interesting sidebar to the copper boom was thedevelopment of the Sops Arm (Browning) and Goldenvillemines (1900-06) in the Baie Verte area. Although short-lived,
these mines were Newfoundland’s first experience with goldmining, something that would not attract attention again untilthe 1980s.
Just as the copper boom was waning, a new miningindustry sprang to life with the discovery of iron ore on BellIsland. Although this resource had been noted in the early19th century, it was not until 1892 that the full potential wasrealized. The discovery led to the development of theWabana mining operations by the Scotia Company in 1894,joined later by the Dominion Company. These companiesmerged in 1921 as the British Empire Steel Corporation(BESCO), which in 1930 came under the control of theDominion Steel and Coal Company (DOSCO). Throughouttheir lives, these mines shipped primarily to the Cape Bretonsteel plants but also periodically to European markets,notably Germany where re-armament was underway, in theyears leading up to World War II. Their life began to declinefollowing the war when huge new resources were discoveredin Labrador, but also when steel-making plants began todemand ore with lower phosphorous contents, and whenhigher grades of iron ore were becoming internationallyavailable. As a result, production declined and the operationfinally closed in 1966. In addition to iron ore, the CapeBreton steel plants also required a plentiful supply of lime-stone for use as a flux. The limestone was initially suppliedfrom Cape Breton but in 1913 the Dominion Company com-menced development of the Aguathuna quarry on the westcoast of Newfoundland. This finally closed in 1967 due tothe discovery of more proximal limestone resources in CapeBreton.
Although dominated by copper and iron, the early daysof mining also included a number of ventures in what aretoday termed industrial and construction minerals. The quar-rying of roofing slate near Trinity, ca. 1860, started an indus-try that was to last until 1910. Also, brick manufacturingcommenced in the Trinity area in 1866, starting a smallindustry that was to supply the domestic market intermittent-ly until 1999. Limestone quarries were also developed atCobbs Arm, Notre Dame Bay, as early as 1882 and provideda long-term source of supply of lime for agricultural andindustrial uses that lasted until 1966.
The construction of the Newfoundland railway in 1897,prompted in large part by the need to connect the AvalonPeninsula with the mining developments of Notre Dame Bay,finally opened the interior of the Island to resource explo-ration. Initial interest focused on the timber potential, how-ever, this soon spread to minerals. Coal was discovered inwestern Newfoundland and was worked sporadically butwith little success until 1929. Railway construction alsorequired the opening of a number of stone quarries across the
2
* Now Department of Natural Resources.

3
Figure 1. Past and present mining operations of Newfoundland and Labrador.

Island and these also temporarily became a source of build-ing stone across Newfoundland. However, the most signifi-cant result of the opening of the interior was the discovery in1905 of copper, lead and zinc mineralization at what was tobecome the Buchans mine site. The complexity of theBuchans ore prevented its development until the late 1920s,when additional ore was discovered and when the AmericanSmelting and Refining Company (ASARCO) developed anew processing technique for the complex ores. As a result,mining was able to commence in 1928 and lasted withoutinterruption until the ore bodies were exhausted and themines closed in 1984.
Modern Mining
The late 19th century was a period of great technologicalchange in the industry. Prior to 1860, mining was a difficultand dangerous activity that relied on hand drilling, blackpowder explosives, candles or safety lamps for illumination,and either men or horses for haulage. Ore processing consist-ed of hand picking the highest grade pieces prior to smelting;a tedious and labour-intensive process that prevented miningof anything but high-grade ore. The period 1860 to 1900 sawthe development of compressed air tools for drilling, theinvention of dynamite, the introduction of electrification foruse in both haulage and illumination, and the development ofmechanical crushing and milling methods. Collectively thesetransformed mining into an industry capable of developinglarge, lower grade deposits that in previous decades wouldhave been uneconomic. Commensurate advances were alsomade in exploration technology. The introduction of dia-mond drilling in the late 1800s and the development of earlygeophysical techniques in the 1920s meant that it was nowpossible to prospect for commercial deposits without thelaborious necessity of sinking shafts.
The Buchans mines were able to benefit from many ofthese advances and proved to be some of the most profitablein the Province’s history. The discovery of new ore bodies ca.1925 also resulted from one of the first uses of electrical geo-physical prospecting, heralding the introduction of a tech-nique that still dominates exploration technology for basemetals.
The onset of the Great Depression in the early 1930sproved a traumatic time for Newfoundland, resulting in arequest to the British Government that it resume administra-tion of the former colony. The resulting Commission ofGovernment was established in 1934 and lasted untilConfederation with Canada in 1949. Mining, together withall other industries was hard hit during this period. Wabana,Aguathuna and Buchans were the only mines able to survivethe Depression, Wabana being the most hard hit and reducedalmost to bankruptcy. However, in the midst of the crisis, in
1933, a new mining operation came into being at St.Lawrence on the south coast of Newfoundland. This wasbased upon the production of fluorite and led to the creationof two mining operations by the St. Lawrence Corporationand the American Newfoundland Fluorspar Corporation. Thelatter was later sold to the Aluminum Company of Canada(ALCAN), which eventually acquired the assets of both min-ing operations and used the fluorspar mostly as a flux in alu-minum smelting. Increasing competition from cheaperMexican ore eventually led to closure in 1978. Despite abrief and unsuccessful attempt to resume mining in the mid1980s, the deposits have remained inactive.
The end of the Second World War saw an enormousincrease in the demand for metals and minerals and resultedin a new boom in exploration and mine development. At theforefront of this effort was the expansion of exploration intoLabrador. Hitherto, this was a remote and largely unknownregion, however, the advances in aviation technology result-ing from World War II now offered a cost-effective means ofopening up this huge area. Initial interest had started in 1936when the Newfoundland Government granted a concessionto the Labrador Mining and Exploration (LME) company tobegin its investigation of the iron deposits that had beenreported by early explorers in western Labrador. LabradorMining and Exploration was acquired in 1942 by HollingerConsolidated Gold Mines Ltd., with minority participationby the M.A. Hanna Company of Cleveland, a prominent USiron mining company. It, together with its sister company inQuébec, the Hollinger North Shore Exploration company,proceeded to explore the concession area and rapidly identi-fied major iron ore resources in the Knob Lake (nowSchefferville) area. Development proceeded rapidly follow-ing the end of the war and saw the construction, starting in1950, of a 588 km-long railway from Sept-Îlse on the Gulf ofSt. Lawrence, to Schefferville on the Québec–Labrador bor-der. Mining commenced in 1954 under the control of the IronOre Company of Canada (IOCC), a private company ownedby a number of US and Canadian steel companies, includingthe M.A. Hanna corporation, and operating on LME leases.By 1958, four mines were in production and numerous otherpotential deposits identified. Production continued until theearly 1980s but then declined, when the growing use of elec-tric open-hearth furnaces for steelmaking forced the marketaway from the direct-shipping ores of the Knob Lakedeposits toward higher quality ores suitable for concentrationand pelletizing. As a result, the operation was closed in 1983.At around the same time that the Knob Lake area was beingdeveloped, LME also began investigating discoveries of ironore in southwest Labrador. These led to the development ofthe Carol Lake mining project by IOCC and the constructionof the town of Labrador City in 1961, followed by produc-tion in 1962. Simultaneously, the Canadian JavelinCompany, operating on a concession granted to the
4

Newfoundland and Labrador Company Ltd. (NALCO),developed the Wabush iron mining project on deposits to thesouthwest of those found by IOCC. This led to constructionof the townsite of Wabush and to production in 1965. TheWabush operation was financed by several US and Canadiansteel companies and following several changes in ownershipis today owned by the Cleveland-Cliffs Company of the USAand Stelco Incorporated and Dofasco Incorporated ofCanada. Both the Wabush and IOCC (Labrador City) opera-tions have remained in production, more or less withoutinterruption, to the present day.
The Island part of the Province also saw renewed activ-ity in the post-Second World War period. An increase in theprice of copper led to re-activation of the Tilt Cove and LittleBay mines between 1957 and 1969, this time using modernbulk-mining techniques to extract previously uneconomic,low-grade ore, and also to the development of the short-livedWhalesback, Gullbridge and Little Deer mines (1965-1974).These were all located in the area of northeasternNewfoundland that had supported the 19th century copperboom (Figure 1). However, the most important discovery ofthis time was that of the Rambler copper–lead–zinc depositsnear Baie Verte. These were brought into production byConsolidated Rambler Mines Ltd. in 1964 and lasted until1982. The 1960s also saw the discovery of the Daniel’sHarbour zinc deposit on the west coast of Newfoundland, adeposit that entered production in 1975 under the control ofNewfoundland Zinc Mines Ltd., and that closed followingexhaustion in 1990.
The post-Second World War boom of the 1950s and1960s also saw an expansion in the development of industri-al minerals in the Province. This commenced with develop-ments based upon the limestone-hosted resources of westernNewfoundland. The Flat Bay gypsum mine (1951-1994) wasopened, initially under Government control (the AtlanticGypsum Company), but later under the ownership ofFlintkote Canada to supply material for wallboard construc-tion. The operation was later sold to Domtar Inc. in 1987 andalthough officially closed in the same year, resumed produc-tion from 1988 to 1994. A similar government-sponsoredventure in 1952 created the North Star cement companybased upon shale and limestone quarries in the Corner Brookarea. This operation was later privatized and did not closeuntil 2000 when changes in market demand rendered ituneconomic. In 1963, the Baie Verte asbestos mine wasestablished in northeastern Newfoundland. Owned initiallyby Advocate Mines and then Baie Verte Mines Ltd., thisremained in production until the early 1980s, when it beganto experience difficulties in the face of declining marketdemand, and finally closed in 1987 after several furtherchanges of ownership. In 1957, Newfoundland Minerals (adivision of Armstrong world Industries) developed the pyro-
phyllite mine at Manuels on the Avalon Peninsula andshipped the product to the United States for use in productionof ceramic tiles. The mine closed in 1996 following a deci-sion by a new owner to switch to talc as the base for its tilemaking. Finally, in 1968 the Villa Marie silica mine operatedby the Dunville Mining Company opened to supply raw sili-ca to the ERCO phosphorous plant at Long Harbour, south-east Newfoundland. The operation was phased out in 1988following closure of the phosphorous plant.
In contrast, the following decades of the 1970s and early1980s were marked by the progressive closure of manyprominent operations that unfortunately were not replacedwith sufficient new discoveries. Exploration did, however,continue. The energy crisis of the early 1970s sparked arenewed international interest in uranium as a fuel mineraland it was exploration for this commodity that dominated theperiod. Limited success was achieved in Labrador where twosmall but potentially economic deposits were identified inthe Makkovik area, however, the collapse of prices followingthe Three Mile Island accident in the US and the recession ofthe early 1980s forestalled their development.
The 1980s were introduced by a surge in the price ofgold, sparked in part at least by the inflationary excesses ofthe previous decade. This gold renaissance produced a spateof exploration that although driven initially by high goldprices, was also given considerable impetus by federal explo-ration tax credits related to flow-through shares, and by theincreasing amount of land coming open for claim staking(see section, The Development of Provincial MineralPolicy). Newfoundland, which until that time had fewrecorded gold occurrences, benefitted considerably from thisperiod of exploration. The first success was the discovery ofthe Hope Brook deposit on the south coast of the Island byBP Minerals. This deposit entered production in 1987 butclosed in 1991 due to production problems and lower goldprices. The operation was resumed by Royal Oak Mines Ltd.in 1992 and lasted until its exhaustion in 1997. The goldexploration boom of the 1980s also resulted in the discoveryof numerous small gold deposits in northeasternNewfoundland. Although insufficiently large to be of interestat the time, two of these deposits at Nugget Pond andHammer Down later became mines. The same period ofexploration also saw the discovery of the Duck Pond base-metal deposit, a potential future mine.
Industrial minerals had declined in importance since the1960s but a new interest began to appear in 1990 with thedevelopment of a limestone aggregate operation at LowerCove in western Newfoundland. This operation was latertaken over by Atlantic Minerals Ltd., which changed thefocus of production to high-purity limestone and dolomite,chiefly for use in the iron and steel industry, and has main-tained production to this date.
5

The 1990s was a decade of globalization following thecollapse of the Soviet Union and the spread of democraticgovernment into many parts of the third world. The resultwas a huge diversification of investment by the major inter-national mining companies into areas previously deemed tohave too high a political risk. South America was the primarybeneficiary of this change, whereas Canada began to experi-ence a net decline in the level of major company exploration.It was thus left to the junior exploration sector to assume theleadership in many areas of the country, includingNewfoundland. The decline was partially offset by the 1991discovery of diamonds in the Northwest Territories; the firstcommercial discovery of this mineral in Canada. This land-mark discovery fueled a surge of exploration activity thatrolled across the country, eventually reaching Newfoundlandand Labrador where a small company called ArcheanResources managed to attract sufficient funding to mount adiamond exploration program in Labrador. The result wasthe serendipitous discovery of the Voisey’s Bay nickel–cop-per–cobalt discovery in 1994, which in turn generated itsown exploration boom. This boom, which peaked in 1996,resulted in a huge staking rush in Labrador and a peak explo-ration expenditure level of $93 million. The deposit was lateracquired by Inco Ltd. but development was delayed by pro-tracted discussions with the Province over issues related toprimary processing. Following an agreement between theseparties in 2002, the deposit is now scheduled for productionin 2005.
Elsewhere in the Province, a previous gold discovery atNugget Pond in northeastern Newfoundland was broughtinto production by Richmond Mines in 1997. This smallmine proved remarkably successful in the face of the steepdecline in gold prices that took place in the 1990s and fol-lowing exhaustion in 2001 was replaced by a new mine at thenearby Hammer Down deposit.
A side-benefit of the Voisey’s Bay boom was the devel-opment of a Newfoundland-based junior-exploration compa-ny sector that has since been remarkably successful in gener-ating exploration projects. After the Voisey’s Bay boom sub-sided, junior exploration companies focused their attentionon central Newfoundland, where the breakup of one of thelast surviving concession areas (see section, The Deveolp-ment of Provincial Mineral Policy) enabled the junior sectorto acquire mineral licenses in the region that had given riseto the Buchans mines. At the time of writing it is likely thatone of these deposits in this area – the Duck Pond deposit –will come into production in the near future. This was origi-nally discovered by Noranda in 1987, was acquired byThundermin Resources Incorporated and then sold to AurResources Inc. who, as of late 2003, are considering a devel-opment decision. Junior exploration has since broadened to
include most areas of the Province and has resulted in thediscovery of new mineralization.
Overshadowed during the 1990s by the Voisey’s Baydiscovery and the ensuing controversy over its development,was a renaissance in the Province’s dimension-stone indus-try. This commenced in 1992, when Newfoundland SlateIncorporated resurrected the slate industry in the Trinity Bayarea (previously exploited in the late 19th century) with pro-duction of roofing slate for shipment to Europe and thenortheastern US. The operation subsequently closed but pro-duction has been resumed by the Hurley SlateworksCompany. In 1993, the Ten Mile Bay anorthosite quarry nearNain, northern Labrador, was developed by TorngatUjanganniavingit Corporation (a subsidiary of the LabradorInuit Development Corporation). This high-value producthas been largely exported to Italy for finishing and re-export.These operations were joined in 1996 by the InternationalGranite Company, which began producing black granite foruse in the monument industry from its Jumpers Brook quar-ry in central Newfoundland. Several other small quarrieshave been opened across the Island and efforts are underwayto expand the industry.
Summary – A Cyclical History
Figures 2, 3 and 4 summarize the mining history of theProvince. Figure 2 depicts the historical development ofmine development, each bar corresponding to the life of anindividual mining operation. Figures 3 and 4 look at the samedata but in terms of the number of mine openings and clos-ings per decade, and the number of mines in operation perdecade respectively. Appendix 4A summarizes the opera-tional history of Provincial mining operations. From Figures2, 3 and 4, it is evident that mine development was highlycyclical, consisting of booms and intervening lows. Figure 4also correlates these cycles with the major socio-economicupheavals of the period 1860-2002, namely the two worldwars, the depression and the post-World War II boom. Thefirst boom cycle in the period 1860 to 1900 was marked by aspate of early mines focused mostly on copper in the NotreDame Bay area (“copper boom”, Figure 4), but also includ-ed the Wabana iron-ore discovery. The number of mines thatopened and closed in this period (Figures 2 and 3) mayappear understated to those familiar with the mining historyof Notre Dame Bay; however, this is due to the fact thatmany of the smaller “mines” were in reality test explorationprojects, since actual mining was the only practical methodat the time of exploring a deposit, and did not result in sig-nificant commercial production. The period 1900-1910 sawan increased number of mine closings and marked the end ofthe Newfoundland copper boom.
6

7
Figure 2. Historical development of mining in Newfoundland and Labrador, 1860 to 2001 (Soutce Appendix 4A).

The following interval 1910 to 1950 was a low in themining cycle (Figure 4), punctuated only by the widelyspaced development of the Aguathuna, Buchans and St.Lawrence deposits. The lack of activity during this periodwas probably due to the depression and the ensuing SecondWorld War (Figure 4), both of which served to depress glob-al trade in metals and minerals. The inactivity may also havebeen aided by the government policy of the time which per-haps did not provide sufficient focus on the mining potentialof the Province (see section, The Development of ProvincialMineral Policy). The period of 1950-1970 that followed theSecond World War introduced the second boom cycle andsaw the mining industry in Newfoundland experience itsgreatest surge. This was undoubtedly driven primarily bypost-war reconstruction and ensuing industrial expansion,and the rising metal prices that accompanied these forces.However, a determined effort by the fledgling Province topromote its opportunities to the international mining industry
may also have contributed strongly. This was the time of newbase-metal, iron-ore and industrial mineral developmentsand the period when the number of mines in operationreached its peak (Figure 3). Without doubt the most signifi-cant developments of this period were those of the iron oreindustry in western Labrador. This industry grew steadily inmagnitude to a peak ca. 1980 and, despite the closure of theSchefferville operations and a subsequent decline in theoverall level of production (see section, The Present-dayMining Industry in Newfoundland and Labrador), continuesto dominate provincial mineral production. The boom in newmine openings was to some extent offset by a number ofclosings in the 1960-1970 period, testament to the short-livednature of some of the operations of this period.
The following two decades of 1970 to 1990 saw the endof the boom and an acceleration in the number of mine clos-ings as opposed to openings (Figure 3). The result was a
8
Figure 3. Summary of the number of mine openings and closings per decade (Source Appendix 4A).

steady decrease in the number of mines in operation (Figure4), a trend that continues to the present day. This was theperiod of increased volatility during which many operationsthat had represented the heart of Newfoundland mining, e.g.,Aguathuna, Buchans, Baie Verte, Rambler, Schefferville, St.Lawrence and Wabana, closed. The ensuing period 1991 to2000 saw a partial resurgence in mine openings dominatedby gold, industrial minerals and dimension stone (Figure 4),however, this only marginally exceeded the number of clos-ings (Figure 3). Not apparent from Figures 2, 3 or 4, is thefact that in recent decades new “mines” (many of which aredimension-stone quarry operations) have been characterizedby a trend toward smaller operations of lower overall produc-tion value – a trend that hopefully will be changed by devel-opment of the Voisey’s Bay project. These matters are morefully discussed later.
THE DEVELOPMENT OF PROVINCIALMINERAL POLICY
The Pre-confederation Period, 1800 to 1949
Information on this period has been taken largely fromJohnston (1973). The government was initially slow to rec-ognize the potential for mining development, and early min-eral rights generally involved special government grants thatwere usually given in perpetuity. It was not until theNewfoundland copper boom of the 1860s that systematic
efforts were made to produce a uniform code for the admin-istration of mineral rights. Highlights of this period were:
1860 - The first mining law was proclaimed providingfor granting of mineral title in Fee Simple for aperiod of 999 (sic) years and on condition of a2.5% royalty to the Crown. The Fee Simple pro-vision meant essentially that ownership of themineral rights was vested in the holder of theproperty.
1864 - Prompted by a surge of mining activity, theNewfoundland Government inaugurated theGeological Survey of Newfoundland to com-mence geological studies of the Island and itsmineral potential.
1880 - The first Crown Lands Act was proclaimed, fol-lowed by a revised version in 1884. This provid-ed for staking of 40-acre claims, a size that re-mained more or less constant through subsequentlegislative development. Claims could be con-verted to a fee-simple status after expenditure of$6000.
1891 - Following widespread abuse and patronage in theawarding of mineral rights, the NewfoundlandGovernment reformed the Crown Lands Act toenhance prospectors rights.
9
Figure 4. Number of mines in operation per decade in Newfoundland and Labrador (Source Appendix 4A). Note that somemines may only have operated for part of a decade.

1893 - The Reid Newfoundland Company was grantedall rights to minerals, water, timber and land inFee Simple over 4100 square miles of land alongthe course of the Newfoundland railway.
1905 - The Anglo-Newfoundland Development Com-pany was granted a 99-year lease to 2000 squaremiles of timber, minerals and land in centralNewfoundland. Although timber was the primeinitial interest, this lease led to the discovery inthat year of the first of the Buchans base-metalsdeposits. The Pulp and Paper Act of that year alsoset a 5% net profits royalty on mineral revenue.
ca. 1910 - The Newfoundland Government passed a num-ber of acts designed to preserve copper smeltingin northeast Newfoundland – with little success.At the same time, a number of special acts wereproclaimed providing exclusive access to miner-als, including coal in western Newfoundland and,more importantly, a grant to the Dominion Steeland Coal company for rights to the Wabana irondeposits. This heralded a growing tendency overthe coming years to award mineral rights by spe-cial acts of the legislature rather than through theCrown Lands Act.
1913 - The Geological Survey of Newfoundland wasdisbanded at a time when the copper boom wasin decline and interest in mining was waning.
1934 - As a result of the Great Depression, a Commis-sion of Government was established in responseto the economic collapse of Newfoundland andits reversion to British rule. The Commission’srule was noted for its austerity, however, it didrevive the Geological Survey of Newfoundlandand begin a series of detailed geological investi-gations.
1936 - An Act Relating to Small Concessions for theDevelopment of the Natural Resources ofLabrador was passed that removed all Labradorlands from the Crown Lands Act and providedthe basis for granting of mineral rights by specialagreement – the basis of the so-called concessionsystem that was to dominate Newfoundland'smineral tenure system for the next 40 years.
1938 - The Labrador Mining and Exploration Companyobtained a seven-year concession to 22 000square miles, including water and mineral rights,in western Labrador, acquired from an earlieroption granted to Weaver Minerals of Montreal.
This led to the discovery of significant iron-oreresources that later formed the basis for the KnobLake/Schefferville mining operation.
Mineral policy in the pre-confederation period was driv-en by the need to open up the interior of Newfoundland andprovide economic development. During this time, New-foundland was essentially a collection of isolated coastalcommunities linked primarily by sea and later in part by thetrans-Newfoundland railway. The prime expectation of min-ing was that it would create jobs and provide infrastructurein remote regions. These expectations were not unique toNewfoundland; mining at this time being typically regardedas a means of frontier development throughout NorthAmerica. Direct financial benefits to the NewfoundlandGovernment through royalties were generally a secondaryconsideration. The initial methods of granting mineral rightswere based on the claim-staking system then in use in mostparts of North America, with the option of in some cases ofconverting these claims to fee-simple awards. Toward theend of the period, during the Commission of Government’srule, a growing tendency emerged to grant mineral rights byspecial agreement in the form of concessions – a tendencythat was to accelerate in the coming years.
The Post-confederation Period, 1949 to 1972
Following the Second World War, the world entered aperiod of prolonged economic expansion that, as discussed inthe previous section, dramatically increased the demand formineral resources. Highlights of this period (Johnston, 1973)were:
1949 - Newfoundland joined Canada in confederationand regained responsibility for the administra-tion and development of its mineral resources.This was followed by the granting of more con-cession agreements. The Geological Survey ofCanada also took over the geological mappingof the new Province, the Geological Survey ofNewfoundland being relegated to a minor role.
1951 - The Crown Lands (Mines and Quarries) Act,modeled after Québec legislation of the time,was proclaimed. Amongst other changes, thisgave Government the right to negotiate exclu-sive mineral exploration agreements with indi-viduals and corporations. In theory at least, theact also continued to permit the staking ofclaims either as individual claims or as blocks.In the same year, the Newfoundland andLabrador Corporation (NALCO) was formedas a crown entity responsible for explorationon concessions totaling 21 000 square miles.
10

Concessions were also granted to FrobisherLtd. in Labrador, and to Falconbridge Ltd. forparts of Newfoundland.
1952 - The Undeveloped Mineral Areas Act wasdeclared giving the provincial government theright to take over mineral properties deemednot to have been explored within the preceding10 years.
1953 - The British Newfoundland Company Ltd.(BRINCO) was granted rights to water, miner-als and land over 60 000 square miles inNewfoundland and Labrador. Although numer-ous mineral discoveries were made, the onlyproducing mine to emerge from the concessionwas the short-lived Whalesback mine in theNotre Dame Bay area. The major benefit of theconcession proved to be the rights to water inthe Labrador part of the concession. Theseeventually led to the Churchill Falls Powerdevelopment of the early 1970s.
1954-1973 - Numerous smaller concessions were grantedunder a series of special agreements that variedconsiderably in the nature of the rights grantedand tenure. A trend in the later agreements wasto require better reporting of exploration workand to restrict the rights to minerals, as opposedto all surface and subsurface resources. Manyearlier concession agreements were renewedand extended during this period.
The 1949-1972 period was characterized by the over-whelming use of the concession system such that within fouryears of confederation, 77% of the total area of the Provinceand 99% of its best mineral lands lay under the control ofeight major corporations. Most of the concession agreementswere negotiated through the Premier’s office, the Depart-ment of Mines being relegated largely to the role of observ-er. The role of the Department of Mines was further reducedby the assumption that the exploration companies were per-forming most of the basic geological mapping and technicalwork on the concession areas, and that the Geological Surveyof Canada was performing the remaining regional work. Tosome extent this was correct, however, the quality and quan-tity of work performed by the exploration companies variedconsiderably and not all was reported to the Province. TheGeological Survey of Canada also began to limit itself toregional mapping at the 1:250 000 scale thus leaving manyareas of the Province unmapped at more detailed scales.
The successes and drawbacks of the concession systemhave been argued over the years with perhaps no clear con-
sensus. Clearly the system did result in significant resourcesbeing brought into production, e.g., the Buchans base-metaldeposits, the Labrador iron-ore mines, the Baie Verteasbestos deposit, west coast gypsum, the reactivation of theNotre Dame Bay copper mines and the Manuels pyrophyllitemine. It was also argued that only large international compa-nies had the resources to explore the vast inaccessibleregions of the Provinces’s interior, particularly Labrador, andthat special rights and incentives were required to attract andreward them for doing this. In the early years this was prob-ably a sensible argument, however, as time passed it becameapparent that many concession owners were content to focuson the small parts of their properties where the potential fordevelopment was high, and to largely ignore the remainder.As a result, huge areas of land became fallow and exemptfrom competitive exploration. In contrast, during this periodthe remainder of Canada moved away from the concessionsystem towards one of more universal access based on claimstaking. The advantage of the claim system from the govern-ment-policy perspective was that it provided explorationcompanies with access to smaller areas of land for shorterperiods of time and, through the use of escalating expendi-ture requirements, forced a periodic turnover of land. This al-lowed mineral properties to be acquired by successive own-ers each of whom might bring new capital and new ideas,thus increasing the chances of eventual economic discovery.
The Period 1972 to 1993
In 1972, the Newfoundland Government changed handsand a major re-thinking of minerals policy began. Thissprang largely from misgivings concerning the concessionsystem and a suspicion that the Province was falling behindthe rest of Canada in its ability to attract mineral explorationand to benefit from its development. A number of major stud-ies were launched, the most noteworthy being a RoyalCommission on Mineral Revenue (Goundrey, 1974) and areport by the Study Group on Mining (McKillop et al.,1973). A significant contribution to the Study Group onMining report was a specific report on mineral land tenure byJohnston (1973). Collectively these studies recommended acomplete overhaul of the Province’s approach to mining andmineral exploration based upon the following conclusions:
• The concession system of mineral land tenure was out-dated and should be replaced by a more competitive onebased upon claim staking.
• In order to free land up so that it could be more effec-tively explored, some means of encouraging concessionholders to surrender land was required.
• The previous fiscal policy, which had focused on miningprincipally as a method of opening the frontier and of
11

creating employment, should be overhauled in order toobtain fair market value for the Province’s mineral prod-ucts and to enhance government revenue. At the time itwas estimated that Government collected only 1.13% ofthe gross value of mineral production. As an example,the two highest value producers, the Iron Ore Companyof Canada and Asarco (Buchans) paid only a 5% profit-based tax. Other operations paid a 5% tax on net income.It was suggested that many of the more profitable oper-ations could have afforded much higher taxes in theorder of at least 10%.
• The Mines Department was grossly underfunded incomparison to other resource departments, particularlywhen the value of mining to the economy was consid-ered. It was recommended that government increase thedepartment’s regulatory capacity and in particular itsgeoscience capacity. The latter was deemed necessary inorder for the Province to catch up with other parts ofCanada, which had benefitted from much higher levelsof geoscience investment.
As a result, a number of reforms took place that dramat-ically revised the Province’s mineral policies:
1971 - The first of a series of Federal–Provincial fundingagreements was announced providing for increasedlevels of mineral commodity studies. These agree-ments were expanded in 1974 and 1976 to providefor a broad spectrum of geoscientific and commod-ity studies lasting until 1996, when the federal gov-ernment curtailed its funding involvement in suchprograms.
1975 - A new Mining and Mineral Rights Tax Act was pro-claimed that levied a profit-based 15% tax on min-ing companies and a 20% tax on any private royal-ties paid by these companies. However, the Act onlyapplied to operations that came into productionunder the Mineral Act. Existing operations contin-ued to be taxed under the terms of their original spe-cial acts. However, an important exception appliedto private royalties, which, regardless of their antiq-uity, were taxed under the 20% provision of the newact.
1976 - A new Mineral Act was proclaimed. This usedclaim-staking as the basis for mineral land tenureand provided a system of escalating expenditurerequirements designed to encourage companies tosurrender ground once the initial exploration workhad been done. The Act also provided for rigorousreporting of work done on mineral properties. Theuse of the Mining Lease as the preferred form ofadvanced title was continued from earlier acts.
1977 - The Quarry Materials Act was proclaimed givingseparate treatment to quarry materials such as sand,gravel, aggregate, dimension stone and peat. Thesematerials were previously included with minerals inthe Crown Lands (Mines and Quarries) Act
1978 - The Minerals Holdings Impost Act was proclaimedrequiring holders of mineral rights obtained prior tothe declaration of the Mineral Act to either performwork on their lands or to pay an escalating per-hectare tax. The objective of the Act was to encour-age the surrender of land so that it became availablefor claim-staking.
The proclamation of the Mineral Act, the MineralHoldings Impost Act and the Mining and Mineral Rights TaxAct implemented most of the reforms advocated by the vari-ous studies of the early 1970s. It took time, though, for thislegislation to take full effect. The new legislation was effec-tive in promoting a rapid surrender of concession land.Whereas in 1970 only 10% of crown land was available forclaim staking, by 1981, 87% had become available and at thepresent day 99.5% is available. The only concession landsthat remain today are small parts of the Labrador Mining andExploration Company concession in western Labrador, mostof which persist as mining leases; several relicts of the ReidNewfoundland and Anglo-Newfoundland DevelopmentCompany corporation lands in central Newfoundland; andsome small fee-simple areas. However, many of the mostprospective mineral areas were only slowly released; theconcession holders preferring to explore these lands and thusoffset the Mineral Holdings Impost Act tax rather than sur-render them. For example, the old Anglo-NewfoundlandDevelopment Corporation lands in central Newfoundland –arguably some of the most valuable in the Province – werepassed by a series of private agreements to a number of suc-cessor companies and were not fully surrendered until thelate 1990s.
The recommendations to increase the budget of theDepartment of Mines and Energy were eventually imple-mented with the assistance of a number of federal-provincialfunding agreements between 1971 and 1996. These allowedthe Province to achieve detailed geoscientific coverage ofmost of its lands by the end of this funding period, althoughnot to the levels existing in neighboring provinces.
Government was less successful in its intent to increasetaxation revenue from mining. Although the new Mining andMineral Rights Tax Act considerably increased the tax rate(to 15%), it did not override the previous special acts thatgoverned most of the Province’s mineral revenue at the time.Relatively few new mines have come into operation underthe Act, thus a large part of the Province’s mineral industry,
12

most of it consisting of the western Labrador iron-ore opera-tions, has continued to be taxed under these original specialagreements. The Mining and Mineral Rights Tax Act does,however, apply to private royalties paid by these companiesand helps offset the lower taxation rates of the special acts.When the Voisey’s Bay operation enters production in 2005,it will be the first large mining operation to come fully underthe terms of the Act.
Recent Developments, 1993 to Present
Highlights of this period were:
1993 - The Federal Government, as part of fiscal restraintmeasures, announced its intent to wind-down min-erals-funding agreements with the provinces. Theresult was a marked decrease in the level of geosci-entific work carried out by the NewfoundlandGeological Survey, particularly in Labrador.
1994 - The Mining and Minerals Rights Tax Act wasrevised to allow a 10-year corporate income taxcredit (tax holiday) for new mines as an incentive tomineral development. This came at the time of aneconomic downturn and was prompted by the per-ceived need to encourage more mineral investmentin the Province.
1994 - The Voisey’s Bay nickel–copper–cobalt discoveryinitiated a surge of exploration activity in Labradorand prompted Government to re-examine its policyregarding taxation and primary processing
1998 - The Mineral Act was revised to reinforce conditionsin the Act that required primary processing (such assmelting and refining) of minerals to take place inthe Province unless it was demonstrably economi-cally unfeasible to do so. Cabinet was given theauthority to decide whether companies should beexempted from the these conditions of the Act.
1998 - A new Quarry Materials Act with increasedenforcement provisions was declared. The Act alsoredefined quarry materials to exclude dimensionstone, which instead came under the control of theMineral Act. However, the new definition did notapply to Labrador where dimension stone continuedto be treated as a quarry material.
1999 - A new Mining Act was proclaimed requiring thatcompanies must submit development, annual oper-ating, and rehabilitation and closure plans. The Actalso required provision of financial assurance inorder to allow government to rehabilitate the minesite in cases of bankruptcy or default by the owner.
1999 - An Agreement-in-Principle was reached with theLabrador Inuit Association regarding their claim toaboriginal rights and lands in northern Labrador.The agreement, when ratified in its final form(expected in 2004), will give the Labrador Inuitpreferential rights over 28 000 square miles of landand ownership of 6100 square miles within thatarea. They will receive a share of revenues and ben-efits from mineral operations and will haveapproval rights over exploration on their lands.
2002 - A final agreement was reached between theProvince and Inco Ltd. regarding the developmentof the Voisey’s Bay mining project in mid 2002.This agreement committed Inco to primary process-ing of nickel concentrate in the Province, once ithad evaluated the most suitable technology fordoing so, and resolved a dispute that had delayeddevelopment since 1998. Inco also reached agree-ments with the Innu Nation and Labrador InuitAssociation regarding provision of benefits to abo-riginal communities. This was a new developmentfor mining operations in the Province, which in thepast had never been required to address aboriginalclaims.
2002 - The Mining and Mineral Rights Tax Act wasamended to cap the corporate income tax credit.
A prominent development of the 1990s was the in-creased focus on environmental and aboriginal land claimsissues. Environmental pressures forced revisions to theMinerals Act requiring better conduct of exploration proj-ects and were also instrumental in the development of theMining Act as the means to deal with the problem of aban-doned mines and their environmental legacy; notablythrough the requirement for filing of rehabilitation and clo-sure plans. This was given impetus by concern over the aban-doned Hope Brook mine and its potential for environmentaldamage. Aboriginal land claims have focused on mineralresources in Labrador, largely as a result of the Voisey’s Baydiscovery and the expectation of revenues from this develop-ment. The agreements of 2002 in relation to the Voisey’s Bayproject guaranteed the Labrador Inuit Association and theInnu Nation a share of the benefits from this project as wellas a strong role in environmental monitoring of the project.A final and legally binding agreement on the Labrador Inuitland Claim is expected to be reached in 2004 and a similaragreement is being negotiated with the Innu Nation. Theseagreements in their final version will cede selected parts ofLabrador as aboriginal-owned lands and will set out themeans by which exploration and development will be con-ducted on these lands.
13

With respect to government activities, the withdrawal offederal funding from provincial geoscience in 1993 left theProvince with a significant gap in its capacity to fund geo-science programs at previous levels. This, coupled withnumerous reductions in the provincial budget, has led to agreatly diminished geoscience program that is funded at lessthan half of its mid-1980s levels.
THE PRESENT-DAY MINING INDUSTRYIN NEWFOUNDLAND AND LABRADOR
As of 2003, there were 12 producing operations in theProvince, in addition to numerous seasonal sand and graveloperations. The producing operations are divided into metal,industrial mineral (including construction materials) anddimension-stone operations, and discussed in order of eco-nomic importance. Most of the material is taken from theperiodic Department of Mines and Energy reviews of miningactivity (Newfoundland and Labrador Department of Minesand Energy 2002 and updates). The location of the variousoperations is shown in Figure 5. Reserve and resource dataare quoted where available, however, due to the historicalnature of some of the information, they may not fully matchthe current National Instrument 43-101 standards forresource and reserve definition. It should also be noted thatthe production and reserve information becomes outdatedvery quickly. For updates see the Department of Mines andEnergy web site at http://www.gov.nl.ca/mines&en/.
Producing Operations – Metals
1. Iron Ore Company of Canada (IOCC)Annual production - 16.2 million tonnes of pellets
and concentrateWork force - 1450Product - Iron oxide concentrate and pel-
lets for shipment predominant-ly to US and European steelplants
This is by far the largest of the Province’s mining oper-ations and has been in production since 1962. It is based inLabrador City and is operated by IOCC on leases issued tothe Labrador Mining and Exploration Company Ltd. TheIOCC is owned by Rio Tinto Plc (59%), Mitsubishi Corpor-ation (26%) and the Labrador Iron Ore Royalty Fund (15%).Mining is based upon two large open pits and feeds an on-site pellet plant. Concentrate and pellets are shipped via the420-km Québec North Shore and Labrador (QNS&L) rail-way to the port of Sept-Îlse on the north shore of the St.Lawrence estuary. The mine has an overall annual produc-tion capacity of 35-38 million tonnes averaging 38% iron.Mill and concentrator capacity is 17.6 million tonnes of con-centrate, of which 12.5 million tonnes can be pelletized.
The Iron Ore Company was originally developed as awholly-owned subsidiary of a number of US and Canadiansteel companies, however, in 1997 it was sold to NorthCompany Ltd., which was in turn acquired by Rio Tinto plcin 2000. This company has indicated that it plans to continuewith North’s earlier $1.1 billion capital investment programdirected at expansion, growth and increased product diversi-ty. Plans include; strategic replacement and upgrading of keyassets, increased capacity, changes to processes, and anenhanced environmental program. As part of this investmentprogram in 2000, IOCC continued with the construction of anew mine maintenance facility; a tailings management study;and the purchase of 15 new 255-tonne haulage trucks. Someof the additional concentrate was planned to be shipped to areactivated pelletizer in Sept-Îlse, Québec, however, theseplans were put on hold due to an unexpected downturn inmarkets during 2002.
Ore resources include 1.4 billion tonnes of proven andprobable reserves, plus an additional 4.1 billion tonnes ofindicated and inferred resources.
2. Wabush Mines (operated by Cleveland-Cliffs Incor-porated, USA)Annual production - 6.1 million tonnes of concen-
trate per yearWork force - 440Product - Iron oxide concentrate for ship-
ment to pelletizing plant
This is the second largest iron mining operation in theProvince and began operations in 1965. It is based upon twoopen pits and a concentrating plant located near the townsiteof Wabush (adjacent to Labrador City). The mine has anoverall capacity of about 18 million tonnes of ore per year,from which up to 7 million tonnes of concentrate can be pro-duced. The concentrate is shipped by the Québec NorthShore and Labrador railway to a pelletizing plant and port atPointe Noire on the north shore of the St. Lawrence estuary.The operation is managed by Cleveland-Cliffs, a major USiron-ore producer and part owner of the operation (26.8%).Other owners are Stelco Incorporated (44.6%) and DofascoIncorporated (28.6%) of Canada. The operation mines ore at36-38% iron, which is similar in grade to that at LabradorCity but has the drawback of higher manganese levels. Planshave been considered for a manganese extraction plant, butare on hold. Ore reserves are reported to be in excess of 800million tonnes but a detailed breakdown is not available.
3. Richmont Mines IncorporatedAnnual production - 44 000 ouncesWork force - 85Product - Gold bars
14

15
Figure 5. Location of current mining operations and significant mineral deposits in Newfoundland and Labrador.

Mining at Nugget Pond commenced in 1988 utilizing anunderground operation. In 2001, the reserves at Nugget Pondwere largely exhausted and production was shifted to thenearby Hammer Down deposit, which was exploited by ini-tial open-pit mining and entered commercial undergroundproduction in 2001. At the present time this is the onlyremaining metal mining operation in the island part of theProvince. As of November 2002, reserves at Hammer Downstood at 144 242 tonnes at a grade of 15.1 g/t. The ore istrucked to Nugget Pond mill for processing and should besufficient to support operations until mid 2004.
Producing Operations – Industrial Minerals
4. Atlantic Minerals LimitedAnnual production - 1.0 to 1.6 million tonnesWork force - 95Product - Crushed and sized limestone
and dolomite for use in constru-ction, iron ore pelletizing andsteel-making
This is the largest industrial minerals operation in theProvince and is located at Lower Cove on the Port au PortPeninsula, in western Newfoundland. Atlantic Minerals Ltd.acquired the property in 1995. The operation consists ofthree quarries, a 2-million-tonne per year processing plantand a deepwater ship-loading facility. Initial production bythe original owner was of crushed limestone primarily foruse as aggregate in construction, however, this has beenlargely switched to the production of high-purity limestoneand dolomite for use in the iron and steel industry. The com-pany continues, though, to export some limestone aggregate.A considerable amount of high-purity limestone is shipped toiron-ore companies in western Labrador and adjacent partsof Québec for use in the manufacture of fluxed pellets.Shipments for 2003 were forecast to be approximately 1.5million tonnes. Remaining resources are estimated at one bil-lion tonnes including 50 million tonnes of high-calciumlimestone and 70 million tonnes of dolomite. The remainderis suitable for aggregate use.
5. Iron Ore Company of CanadaAnnual production - about 300 000 tonnesWork force - 17Product - Dolomite for use in manufac-
ture of iron-ore pellets
This operation is wholly owned by the Iron OreCompany of Canada, which uses it to supply dolomite foruse in the manufacture of fluxed pellets at its Labrador Citypelletizing plant. Production started in 1986 based ondolomite deposits on the east side of Wabush Lake. Currentproduction comes from the Leila Wynne quarry.
6. C-Mac Construction LimitedAnnual production - 4000 tonnesWork force - 4 seasonalProduct - Agricultural lime
This small intermittent operation produces limestone foragricultural use (aglime) from a quarry located nearCormack in western Newfoundland. The product is current-ly supplied under a government aglime contract, however,the operation also supplies aglime and crushed rock to localmarkets.
7. Galen Gypsum Mines LimitedAnnual production - about 70 000 tonnesWork force - about 10, seasonalProduct - Gypsum for use in wallboard
manufacturing
This small open-pit operation is located on the CoalBrook deposit near St George’s Bay, western Newfoundland.The gypsum was initially used in cement manufacturing byNorth Star Cement Ltd. of Corner Brook, however, thisended with the closure of that operation in 2000. The opera-tion currently supplies gypsum to Lafarge Canada for use intheir wallboard manufacturing operation in Corner Brook. In2002, the company supplied 60 000 tonnes to the plant andwas forecast to do the same for 2003.
8. Hi-Point Peat Industries (1991) LimitedAnnual production - Approximately $1.0 million of
productsWork force - 10 to 20Product - Peat moss for horticultural and
oil-absorbent use
There have been sporadic attempts to develop a peatmining industry in Newfoundland, the most successful ofthese being the current operation by Hi-Point Industries(1991) Ltd., which produces peat moss from bogs nearBishop’s Falls in central Newfoundland. The project wasoriginally conceived in the mid-1970s for fuel peat butevolved through several reorganizations to production ofpeat moss for horticultural and oil absorbency use. The oil-absorbent material is prepared on-site and marketed underthe name Oclansorb. A new bog has been prepared for pro-duction near Gander. Total reserves are sufficient for at least20 years.
9. Shabogamo Mining and Exploration LimitedAnnual production - 60 000 to 80 000 tonnes Work force - 15 - 20Product - Lump silica for manufacture of
silicon metal
16

This is a new open-pit operation in western Labradorthat commenced production in 2000. The company mineshigh-purity quartzite near Labrador City and has shipped thisvia the QNS&L railway and Sept-Îlse port to Bécancour Inc.of Québec, which uses the material to manufacturer siliconmetal. Shipments in 2003 are forecast to be worth $1.8 mil-lion. The company has also made test shipments toNorwegian markets.
10. Miscellaneous companiesAnnual production - 0.21 to 4.85 million tonnes Work force - 280 to 350Product - Sand, gravel and aggregate for
construction use
Stone, including sand, gravel and aggregate, is producedeither from surficial deposits or by crushing of bedrock frommany quarries located throughout the Province. Most of thisproduction is used within the Province for highway mainte-nance and for construction. Note that the above tonnage fig-ure excludes limestone aggregate produced by the LowerCove operation for construction use. Many of these quarry-ing operations are intermittent or seasonal in nature. Apartfrom Lower Cove, exports are limited.
Producing Operations – Dimension Stone
11. Torngait Ujaganniavingit Corp. (TUC)Annual production - 2 200 m3 (forecast)Work force - 35Product - Large anorthosite blocks
TUC, a subsidiary of the Labrador Inuit DevelopmentCorporation (LIDC), commenced quarrying of anorthosite atits Ten Mile Bay quarry near Nain on the north Labradorcoast in 1992. The anorthosite contains large labradoritecrystals, with the striking blue iridescence that gives the rockits trademark name of “Labrador Blue-Eyes”. It is shipped aslarge blocks to Italy for further processing and resale. In2001, a second quarry was opened at Igiak Bay, approxi-mately 20 km south of Nain. The stone from this quarry con-tains larger, multi-coloured crystals and is marketed as“Arctic Rainbow”. A stone plant for processing smallerblocks has recently been set up at Ten Mile Bay and a simi-lar plant at Hopedale, further south on the Labrador coast, isplanned. These plants will process undersized material forvarious uses such as monuments, tile and tabletops.
12. International Granite CorporationAnnual production - 1150 m3
Work force - 20 to 30 Product - Gabbro dimension stone, pri-
marily for monument use
This operation is based on quarries in the Mount Peyton(Jumpers Brook) area near Grand Falls, central Newfound-land. The operation, currently based on a quarry at FingerPond, produces large blocks of gabbro (black granite) thatare fed to a fabrication plant operated by Cabot GraniteFabricators Inc., which also imports some raw stone. Theoperation produces slabs, monument blanks, finished monu-ments, and architectural and landscaping products.
13. Hurley Slateworks CompanyAnnual production - 2000 to 4000 tonnesWork force - 45Product - Slate roofing tiles
This operation produces slate from a quarry at Nut Covein eastern Newfoundland and uses the same rock formationthat supported previous slate operations in this area as farback as 1860. Hurley Slateworks acquired the operation in1999, following the bankruptcy of the previous owner andre-entered production, shipping 2400 tonnes of roofing slateto international markets before shutting down in August2003. The company plans to resume slate production; purpleand green slate is processed on site into roofing tile andexported to western European and US markets. Capacity isabout 6000 tonnes per year.
Inactive Operations
Copper and accessory gold, were briefly produced byMing Minerals between 1995 and 1996 from remainingmaterial in the Ming West deposit of the old Rambler miningcamp. This operation processed ore using the Rambler mill,which remains under care-and-maintenance for possible fur-ther use.
Barite has been produced intermittently in the Province,most recently by Phoenix Minerals in 1998-99, from smallopen-pit operations at Collier Point, Trinity Bay; and byPennecon Ltd., who in 1999 produced 35 000 tonnes ofbarite and celestite from a quarry at Boswarlos in westernNewfoundland. Barite has been produced mostly as aweighting agent for the drilling mud used in petroleumexploration.
Antimony was mined in 1997 by Roycefield ResourcesLtd. from its underground Beaver Brook mine near Gander,central Newfoundland, and sold as concentrates through1997-99. The operation eventually closed due to depressedantimony prices. In 2003, the operation was the subject of apurchase agreement – subject to financing – by VVCExploration Corporation with the intention of resuming pro-duction in the first half of 2004. A total resource of 1.04 mil-lion tonnes was estimated to be present at a grade of 4.45%
17

antimony. A recent scoping study envisaged production of150 000 tons per year to the mill and a mine-mill operationthat could employ approximately 60 people.
Gypsum was produced briefly in 1996-1998 by AtlanticGypsum Resources Incorporated and then by LafargeCanada from the Fischells open-pit mine in westernNewfoundland. The operation produced about 30 000 tonnesannually and employed about 10 persons at the mine site.Gypsum production has since been switched to the GalenGypsum Mines Ltd. deposit at Coal Brook. Fischellsreserves are estimated at 17 million tonnes at 93% gypsum.
Developing Operations
1. Voisey’s Bay Deposit (Voisey’s Bay Nickel CompanyLtd.)Est. annual production - approximately 2.2 to 7.3
million tonnes per year ofore
Est. work force - about 400, increasing to800, if underground opera-tions commence
Product - Nickel and copper concen-trates for shipment to pro-cessing plants
Discovered in 1994, the Voisey’s Bay nickel–copper–cobalt deposit of Labrador is by far the most valuable unde-veloped deposit in the Province. It contains an estimated 150million tonnes of inferred resources in the form of threedeposits. One of these, the ovoid deposit, has proven reservesof 30 million tonnes of ore, at a grade of 2.85% Ni, 1.68%Cu and 0.14% Co that can be exploited by open-pit methods.The remaining deposits are lower in grade and, if proven tobe economic, would require underground mining. Plans callfor ore to be trucked to a mill-concentrator with a capacity ofabout 6000 tonnes per day. Concentrate will be stockpiledand shipped seasonally from a deep-water port at AnaktalakBay. The mine would be run on a fly-in, fly-out basis and willnot utilize a townsite. 54 million tonnes of indicatedresources and 16 million tonnes of inferred resources are cur-rently identified.
2. Duck Pond Deposit (Aur Resources Inc.)Est. annual production - 540 000 tonnes per yearEst. work force - 166Product - Zinc, lead and copper con-
centrates for shipment tosmelters
This deposit is located in central Newfoundland, nearthe town of Grand Falls. A detailed feasibility study commis-sioned by the previous owners, Thundermin Resources Inc.
in 2001, outlined proven and probable reserves of 5.48 mil-lion tonnes grading 3.3% Cu, 5.8% Zn, 0.9% Pb, 59 g/t Agand 0.8 g/t Au. The feasibility study envisaged the DuckPond mine producing at a rate of 1500 tonnes/day (540 000tonnes/year) and a mine life of 10.2 years with mining in thefirst year by open pit and thereafter by underground methods.Ore would be crushed and concentrated on site and thentrucked to the port of Botwood for shipment to smelters.
3. Aguathuna Quarry (Port au Port Quarries)Product - limestone and dolomite
This company has recently announced plans to establisha dolomite/limestone operation at Aguathuna on the Port auPort Peninsula. It will initially focus on dolomite for suchend-users as the iron and steel industries and on constructionaggregates. The results of a bulk sample extracted in 2002were positive. The company plans to construct its processingand marine facilities when market conditions improve, pos-sibly in 2004.
Other Deposits with Development Potential
Silica production has been investigated at the La Sciedeposit in northeastern Newfoundland and at Mary’sHarbour in southeast Labrador.
Fluorspar is being considered for production through aresumption of mining of the St. Lawrence deposits. The proj-ect could produce 180 000 tonnes per year of acid-gradefluorspar but has been stalled by financing difficulties andpoor market conditions.
Pyrophyllite production may be resumed at theManuels deposit in eastern Newfoundland. A new operatingcompany, Newfoundland Pyrophyllite, is exploring opportu-nities for uses in the filler, extender and refractory marketsand has shipped some material as test samples.
Barite production is being considered by BuchansBarite Company Ltd. using material recovered from theBuchans base metal tailings pile in Red Indian Lake, centralNewfoundland. The deposit contains 1.5 million tonnes ofrecoverable material at 30% barite. The end use of the baritewould be mostly as a weighting agent in the drilling mudused in petroleum exploration.
Undeveloped Resources
The Province has a number of deposits that for variousreasons have not yet proved to be economic. Some of themore significant ones that may see future development arelisted below (see also Figure 5). Note again that the quotedhistorical resources may not meet the current National
18

Instrument 43-101 standards for resource and reserve defini-tion. In 43-101 terms, most would best be considered asinferred resources.
Rare Metals - The Strange Lake deposit of northernLabrador contains 52 million tonnes of rare metals (yttrium,zirconium, niobium and beryllium) and rare-earth-elementmineralization and is a potential source of at least zirconium(2.93%) and yttrium (0.31%) production. The deposit wasdiscovered in 1978 and taken to the advanced explorationstage. Although the deposit represents a major resource forthese elements, a combination of remote location and uncer-tain markets have prevented development to date.
Uranium - Exploration in the 1950s - 1970s resulted inthe discovery of the small Kitts (0.2 million tonnes 0.73%uranium oxide) and Michelin (6.2 million tonnes 0.13% ura-nium oxide) deposits near Postville in eastern Labrador.Although considered potentially economic in the late 1970s,a considerable price increase would be required to renderthese deposits economic under present-day market condi-tions.
Base Metals - A number of base-metal deposits exist incentral Newfoundland, two of the more significant of whichare the Point Leamington (18.8 million tonnes 0.48% Cu,2.25% Zn) and Tulks Hill (0.7 million tonnes 1.3% Cu, 5.6%Zn and 2% Pb) deposits. Point Leamington has been consid-ered too low grade and Tulks Hill too small for developmentto date. In the Rambler camp (Baie Verte), the Ming Footwalldeposit contains a resource of 3 million tonnes at 1.6% Cuand the Ming West deposit contains 0.7 million tonnes at3.6% Cu and 2 g/t Au.
Gold - Gold exploration in the 1980s discovered theCape Ray gold deposit in western Newfoundland (455 000tonnes at 8.3 g/t) and a number of gold deposits on the BaieVerte and Springdale peninsulas of northeastern Newfound-land, notably Pine Cove (1 865 000 tonnes at 3.19 g/t),Stog’er Tight (350 000 tonnes at 4.5 g/t), Deer Cove (94 093tonnes at 6.0 g/t) and Orion (270 000 tonnes at 7.0g /t).
Talc - A small deposit of at least 3 million tonnes of 30%talc exists at Deer Cove on the Baie Verte Peninsula.
Marble - White marble deposits, with a resource poten-tial of at least 3 million tonnes, exist near Roddickton on theGreat Northern Peninsula and represent a potential source ofhigh-purity, high-brightness material for use as filler in thepaint, plastics and paper industries. Several bulk sampleshave been taken for testing but have not, as yet, resulted indevelopment.
Magnesium - The tailings left over from asbestos min-ing at Baie Verte have been considered as a possible sourceof magnesium using hydro metallurgical extraction tech-niques. Several potential deposits of high-magnesiumdolomite also exist along the Great Northern Peninsula.
Silica - Abundant silica resources, similar to those beingexploited by Shabogamo Mining, exist in the westernLabrador region. In Newfoundland, resources exist at VillaMarie (formerly the site of silica production for the LongHarbour phosphorous plant - 5.5 million tonnes at 94.7% sil-ica), Fortune (8.8 million tonnes 98% silica) and Grey River(12 million tonnes 95.5% silica).
Dimension stone - Several marble deposits are knownin western Newfoundland. There are also several sites inNewfoundland, such as those near Goobies, Terrencevilleand the Mount Peyton area where granite and gabbro havebeen tested for production purposes. The Nain area ofLabrador also contains abundant resources of anorthosite andother rocks that may form the basis for additional quarryoperations.
THE ECONOMIC VALUE OF MINERALPRODUCTION – PRESENT-DAY AND
HISTORICAL PERSPECTIVES
This section analyzes the current and historical contribu-tion of mining to the provincial economy. Mining contributesto the economy in four ways: through the direct return to theproducing company and its shareholders, i.e., through theprofit realized on a mining investment; through the revenuesthat accrue to various levels of government through taxes androyalties; through the spin-off benefits that come from min-ing investment and operations; and from employment, bothin the mining industry and in its support sector. Analysis ofsome of these contributions is beyond the scope of thisreview. For example, information regarding the profitabilityof individual mining operations is often private or simply notavailable. Information on spin-off benefits is widely dis-persed and would require a research effort well beyond thescope of this study. This section therefore focuses on theannual Gross Value of Mineral Production. This is a measureof the mineral production of the Province as realized in salesand is based on data collected through an annual census ofmineral producers by Natural Resources Canada. The value,more correctly referred to as the Gross Value of MineralShipments, is a measure of the revenue that a particular min-ing operation is producing. Although not a measure of prof-itability, it is probably, in a general way, proportionate toprofitability and provides some measure of the economicimportance of a mining operation. Benefits from taxation andemployment are examined in subsequent sections.
19

Key Statistics
Some key statistics with respect to the present-day min-ing industry in Newfoundland and Labrador are as follows:
• Mining in 2002 accounted for 8% of the Gross DomesticProduct of the goods-producing sector (Newfoundlandand Labrador Statistics Agency, 2003). As such, it liesbehind oil and gas but ahead of other resource industriessuch as forestry, fishing and agriculture (Figure 6).
• Mining in 2002 accounted for 3% of the overall grossdomestic product (Newfoundland and LabradorStatistics Agency, 2003) of the Province with all sectorsof the economy included.
• Mining in the Province currently employs about 2500persons at an average (1999) wage of $66 000 (derivedfrom aggregate wage data in Canadian MineralsYearbook, 2001).
• The Province currently produces almost 6% of the totalgross value of non-petroleum mineral shipments inCanada and as such ranks 6th in terms of jurisdictionsbehind Ontario, Québec, Saskatchewan, British Colum-
bia and Manitoba (see Figure 7). When hydrocarbonfuels are included, the Province accounts for 4% of thegross value of production (Figure 8), behind Alberta,Saskatchewan, British Columbia, Ontario and Québec(Canadian Minerals Yearbook, 2001).
• Over the period 1989 - 2000, the Province has averaged5% of the total gross value of non-petroleum mineralshipments in Canada and as such ranks 6th in terms ofjurisdictions behind Ontario, Québec, Saskatchewan,British Columbia and Manitoba (see Figure 9).
• The Province is the leading producer of iron ore inCanada, accounting for 63% of Canadian iron ore pro-duction, and 2% of world production.
• When the Voisey’s Bay nickel deposit enters productionca. 2005, the Province will (at projected levels) likely bethe second largest supplier of nickel in Canada at around30% of total production.
Present-Day Mineral Production
Table 1 illustrates the most recent breakdown of miner-al production in the Province for 2002, based on preliminary
20
Figure 6. Relative share of real Gross Domestic Product (GDP) for the Goods Producing Industries, Newfoundland andLabrador, 2001 in 1997 Canadian dollars (Source Newfoundland Statistics Agency and Statistics Canada). Not shown is theGDP share for the pulp and paper sector, which is confidential.

21
Figure 7. Value of Canadian minerals production (metalsand non-metals), by province, 2000 (projected). (SourceNatural Resources Canada data)
Figure 8. Value of Canadian minerals and fuels production,by province, 2000 (projected). (Source Natural ResourcesCanada data)
Table 1. Gross Value of Mineral Production for 2002, in decreasing order of value (estimated values). IOCC = Iron OreCompany of Canada; TUC = Torngat Ujaganniavingit Corporation.
Gross value of production Percentage of total value Main productionCOMMODITY in $ Canadian: 2002 (forecast) provincial production source
METALLICIron Ore 723 831 000 91.40% IOCC & Wabush MinesGold 24 234 000 3.06% Richmont Mines
Total Metallic 748 065 000 94.46%
NON-METALLICDimension stone 4 838 000 0.61% TUC, Int. Granite &
Hurley SlateworksSand and gravel 11 133 000 1.41% MultipleAggregate stone 11 020 000 1.39% MultipleDolomite 9 010 000 1.14% Atlantic MineralsLimestone 4 217 000 0.53% Atlantic MineralsSilica 2 178 000 0.28% Shabogamo MiningPeat 860 000 0.11% Hi-PointPyrophyllite 105 000 0.01% Trinity ResourcesGypsum 540 000 0.07% Galen/Lafarge Gypsum
Total Non-metallic 43 901 000 5.54%
TOTAL MINERALS 791 966 000 100%
Construction materials 22 153 000 2.8% (of total minerals(sand, gravel and aggregate stone) value)
50.46% (of total non-metals value)

values, and the source of the production. The mineral com-modities can be divided into metallic and non-metallic.
For 2002, and as for all preceding years, the value ofshipments was dominated by metallic mineral commoditiesand in particular by iron ore, which at 91%, accounted for thebulk of the Province’s mineral exports. Gold is the only othermetallic commodity currently in production and accounts for3% of the total value of production. Non-metals account forabout 5.5% of production value. The leading non-metalliccommodities were sand and gravel, crushed rock aggregateand dolomite. If sand, gravel and aggregate are groupedtogether as construction materials, they account for almost3% of the overall mineral production value and 50% of thevalue of non-metallic production. Statistics (Newfoundlandand Labrador Department of Mines and Energy, 2002) indi-cate that sand and gravel has consistently been the most valu-able non-metallic commodity produced over the past decade.Crushed rock aggregate has shown the most growth of thesecommodities over the same decade and is currently the sec-ond most valuable item in this group. Dimension stone wasshowing promising growth until 2001, but fell in value in2002.
Historical Value of Mineral Production
Historical data for the value of mineral production areavailable for the period 1865 to 2002 and are presented in
terms of current and constant (year-2000) Canadian dollarsin Figure 103. Current dollar values are the actual values fora particular year and have not been corrected for inflation.Constant dollar values have been adjusted for the effects ofinflation. Constant dollars, with the year 2000 being used asthe common reference base, have been used as the basis formost of the historical comparisons in this section. The calcu-lation of constant dollars is explained in Appendix 3. Aswould be expected, the constant-dollar curve in Figure 10shows higher historical values than the current dollar onebecause of the effects of inflation that have effectivelyreduced the purchasing power of the current-dollars overtime. The constant-dollar curve shows a fairly flat profileuntil the late 1940s, when, stimulated by post-war recon-struction and industrial expansion, it rises steeply to a peakca. 1980. After this point, the curve then declines in a cycli-cal fashion to its present-day level.
It should be noted that the constant-dollar curve inFigure 10 was generated using a deflator series based uponthe Gross Domestic Product (GDP) index (see Appendix 3for details), this being the only deflator series available thatextends back to the 1860s. The results produced using thisdeflator series are similar in most respects to those using theConsumer Price Index (CPI, used elsewhere in this report),except for the peak inflationary years 1970-83, where theGDP results are slightly lower than those produced using theCPI deflator. For this reason, the peak value of about $23 000million dollars indicated for the year 1979 in Figure 10 islower than that of $2700 million shown in the figures usedelsewhere in this section (e.g., see Figure 15), which use aCPI deflator series.
The value of production data is analyzed in more detailin the following sections, which divide the data into pre- andpost-confederation periods, i.e., pre and post-1949.
The Pre-Confederation Period 1867-1949
Data on mineral production for this period have beencompiled from the Newfoundland Government CustomsReturns (see Appendix 2). The pre-confederation gross valueof mineral production is plotted in terms of current dollars inFigure 11, and in year-2000 dollars in Figure 12. The data ineach case are shown in terms of metallic versus non-metalliccommodities. Major historical events are also shown to placethese graphs in context. From both figures it is evident thatthe gross value of production was dominated by metallicminerals. Non-metallic minerals generally formed less than10% of the total but rose to as high as 30% between 1880 -1910 and during the 1940s.
22
Figure 9. Value of Canadian minerals production (metalsand non-metals), by province, 1989-2000 based on year-2000 dollars. (Source Natural Resources Canada data)
3 Although 1865 is the earliest date for which production data are available, a deflation series is only available from 1867 – the starting point for Figure 10.

Mineral production rose to an early peak ca. 1877, thetime of the Notre Dame Bay copper boom, dipped in the late1880s then attained a fairly even plateau in the period 1893-1914 during which production was dominated by NotreDame Bay copper and (commencing ca. 1895), Wabana ironore. The onset of World War I (1914-18) produced a dramat-ic fall in output, largely due to the wartime curtailment ofNorth Atlantic shipping and loss of major European markets.The drop in production value persisted into the post-waryears but then recovered in 1923 and rose rapidly to a peakin 1929, largely due to the onset of production from theBuchans operation. 1929 saw the crash in world stock mar-kets and the start of the Great Depression, which lasted untilaround 1938. Not unexpectedly, Newfoundland’s value ofmineral production sustained a steep fall in the early part ofthe Depression but then recovered rapidly in the years 1935to 1939. The outbreak of World War II in 1939 initiatedanother plunge in production, again due to the difficulties ofwartime shipping and loss of European markets. Followingthe end of the war, production recovered rapidly and com-menced a steep rise that was to last well into the 1980s. Thisboom in production was fueled by the demands of post-warreconstruction and the huge growth in the North Americanand European industrial economies that took place duringthis time.
The performance of the pre-confederation mineral econ-omy is examined in more detail in Figure 13, which breaksthe value of production down in terms of the major mineralproducers. These were the Notre Dame Bay copper mines(chiefly Tilt Cove, Little Bay and Betts Cove), the Wabanairon-ore mines, the Aguathuna limestone operation, the St.Lawrence fluorspar mines and the Buchans base-metalmines. The production value for each of these operations isplotted separately in terms of constant dollars in Figure 13.From this it is evident that the early part of the period (1865to ca. 1905) was dominated by copper production associatedwith the Notre Dame Bay copper boom. This in itself washighly cyclical as shown by the steep plunge in production inthe mid-1880s associated with a crash in copper prices at thattime. The Wabana mines began significant production ca.1895 and then followed an erratic, deeply cyclical productionpath that was strongly influenced by World War I and theensuing 1920s. At this time, and following the merger thatresulted in the formation of BESCO, Wabana experiencedrepeated financial problems to the extent that managementrepeatedly pleaded for relief from royalty payments. Theonset of the Depression greatly curtailed demand for iron oreand added to these woes by forcing closure of two of the fourWabana mines. However, growing demand from Germany inthe late 1930s led to a rebound in demand (see Figure 13) and
23
Figure 10. Total value of Newfoundland and Labrador mineral production, 1867 to 2002; in current and constant (year-2000)dollars. The constant dollar plot was produced using a Gross Domestic Product deflator series. (Source Appendix 4B)

24
Figure 11. The Gross Value of Mineral Production during the pre-confederation period, in annual Canadian dollars – show-ing metals vs non-metals share. (Source Appendix 4C)
Figure 12. The Gross Value of Mineral Production during the pre-confederation period, in year-2000 Canadian dollars –showing metals vs non-metals share. (Source Appendix 4C)

re-opening of the mines. Demand was curtailed again by theoutbreak of World War II but was quickly re-established inthe post-war period. Buchans, which opened in 1928, offersan interesting comparison to Wabana in that it saw a rapidrise in value of production that was largely unaffected by theDepression, but which was, however, temporarily reduced bythe outbreak of World War II. In the post-war period it wasBuchans that quickly established itself as Newfoundland’spremier producer, enjoying a surge in growth that carried itwell into the succeeding decades.
A notable feature of the pre-confederation CustomsReturns, is the lack of any reported values for by-productprecious metals. The Notre Dame Bay copper mines con-tained significant amounts of gold and silver (up to 2 oz ofeach per ton of copper metal according to Martin, 1983),though the presence of these elements was not recognizeduntil the early 1890s. Similarly, the Buchans mines producedsignificant amounts of gold and silver throughout their histo-ry. In both cases, these precious metals were recovered at for-eign smelters but the added production value was not credit-ed back to the producing mine4, at least as reported in theCustoms data. The pre-confederation data may, therefore,understate the real value of mineral production during thatperiod.
The non-metals producers, Aguathuna and St. Lawrence,saw much lower overall growth in terms of value of produc-tion. St. Lawrence, however, did experience a rapid rise invalue during World War II, due no doubt to the increaseddemands of war time (including increased demand for alu-minium) and the fact that its main market was in NorthAmerica and thus less affected by the wartime difficultiesthat curtailed markets for other Newfoundland mines.
The Post-Confederation Period, 1950-2002
Data for the post-confederation period are taken fromthe largely unpublished files of the Newfoundland Depart-ment of Mines and Energy. Most of these data are derivedfrom the annual mineral production census data complied byNatural Resources Canada and reported in summary formatin the Canadian Minerals Yearbook.
The value of mineral production since 1949, subdividedinto metals and non-metals, is plotted in both current- andconstant-dollar terms in Figures 14 and 15. As for all infla-tion-corrected data, the constant-dollar plot of Figure 15shows the higher historical values and is the more meaning-ful in terms of historical comparisons. The essential point ofcomparison between the two figures is that whilst the current
25
Figure 13. Value of major pre-confederation mine output, in year-2000 Canadian dollars. (Source Appendix 4C)
4 This manner of reporting remains to the present day; by-product metals usually being accredited to the country where smelting takes place.

26
Figure 14. The Gross Value of Mineral Production, 1949 to 2002 in current Canadian dollars – showing metals vs non-met-als share. (Source Appendix 4D)
Figure 15. The Gross Value of Mineral Production, 1949 to 2002 in constant Canadian dollars – showing metals vs non-met-als share. (Source Appendix 4D)

dollar plot (Figure 14) shows a steady rise in the value ofproduction to ca. 1980, followed by an undulatory plateau ofvalues, the constant dollar plot (Figure 15) shows a pro-nounced peak ca. 1979 of about $2700 million, followed bya marked decline that only appears to have stabilized since1993. It is the constant dollar plot of Figure 15, that is tellingthe real story in this case, namely that the provincial value ofproduction has been in progressive decline since 1980. It canalso be seen from these figures that non-metals form only asmall part of the value of production. This has declined fromabout 10 to 18% for the years 1949-54 to around 8% to 1990then to around 5% in subsequent years.
The historical value of production for metallic and non-metallic commodities is further broken down in Figures 16
and 17. These show the various commodities that comprisethe two subdivisions as percentages of the total metallic andnon-metallic production respectively. The metallic mineralschart in Figure 16 illustrates changes in the composition ofmetallic shipments. In 1949, these were dominated by basemetals (copper, lead and zinc, mostly from Buchans) andiron ore (Wabana), however, in the years 1953 to 1969, thebase-metal share fell and was progressively replaced by iron-ore shipments coming from the new mines in Labrador, suchthat by 1973 iron ore accounted for about 90% of shipments.Gold temporarily accounted for up to 5% of the value ofshipments in the late 1980s and early 1990s due to produc-tion from Hope Brook. After this mine closed in 1997, ironore increased its dominance up to a recent level of around95%.
27
Figure 16. The share of individual metallic mineral commodities of the Gross Value of Mineral Production, 1949 to 2002. Inyear-2000 Canadian dollars. (Source Appendix 4D)

For non-metallic minerals, the corresponding break-down is given in Figure 17. A significant feature is the dom-inance firstly of fluorspar from St. Lawrence and thenasbestos from Baie Verte during the period leading to about1980. After this time, a more diversified picture develops inwhich the construction materials (sand, gravel and crushedrock aggregate) in association with dimension stone,dolomite and limestone, form the dominant commodities.The construction materials have also consistently formed 30to 50% of the value of non-metallic mineral production andhave been the most stable part of this sector. Gypsum fromFlat Bay was moderately significant in the period 1951-94,however, other commodities such as, silica, brick, pyrophyl-lite, barite and peat have formed only a small part of theoverall value. Cement production was also a consistent fea-ture of non-metal production until the demise of the Corner
Brook plant in 2000. Materials that have experienced promi-nent recent growth are:
Crushed rock aggregate - This commodity produced from avariety of sources has seen re-markable growth in the late 1990sto a present share of 25% of thenon-metals value. Demand isthought to have been largely driv-en by recent highway upgradingand construction.
Dolomite - Since 1990, production of thismineral commodity (chiefly fromLower Cove) has seen significantgrowth to its present level where
28
Figure 17. The share of individual non-metallic mineral commodities of the Gross Value of Mineral Production, 1949 to 2002.In year-2000 Canadian dollars. (Source Appendix 4D)

it accounts for about 20% of thenon-metals value.
Dimension stone - This material (from varioussources) saw rapid growth in themid-1990s but after reaching apeak in 2000 appears to have sta-bilized at about 10% of the non-metallic value.
Trends in the Gross Value of Mineral Production – TheControlling Influence of Iron-Ore Prices?
What has controlled the strong surge and then decline inthe provincial value of production in the years 1979 to pres-ent as shown in Figures 10 and 15? Obviously the industrialcycle and mine closures play a role (Figure 15). The early1980s were a time of deep recession and reduced demand formetals. The closure of Schefferville in 1983 and of Buchansin 1984 also removed two very significant producers fromthe provincial scene and thus exacerbated the negative effecton the overall value of production. However, although theindustrial cycle recovered from its recession in the mid tolate 1980s, the provincial mineral output did not. As a result,1979 remains as the watershed year for historical mineralproduction (see Figure 10). What then prevented a subse-quent recovery?
Since 1980, iron ore has generally formed over 95% ofthe Province’s mineral production value (Figure 16) and itfollows that a large part of the explanation for the markeddecline in overall production value since this date might besought in the behaviour of that commodity. This is shown inFigure 18, which compares post-1949 production of iron orein terms of tonnage (vertical bars keyed to left vertical axis),vs the value of production in constant Canadian dollars (blueline keyed to right vertical axis). Not surprisingly, the profilefor the value of iron-ore production is very similar to that forall mineral commodities depicted in Figure 15. For the pre-1979 period in Figure 18, there is a strong correlationbetween the value of iron-ore shipments and production, thesteep growth in both production and value in this periodbeing due to the growth of the Labrador iron ore sector,which more than offset the closure of Wabana in 1966(noticeable only as a slight dip in production). However,after 1979 there was a pronounced decline in production thatwas at least in part due to the wind down and eventual clo-sure of the Schefferville operation in 1983. Productionrecovered somewhat in subsequent years but never to theextent of completely replacing the lost production, whichaccounted for about one third of the province’s peak iron-oreproduction. Also apparent from Figure 18 is that ca. 1984there began a pronounced de-coupling of value and produc-tion, during which the gross value of production declinedmarkedly in comparison to the amount of production (which
29
Figure 18. Provincial production of iron ore vs value of iron ore shipments in year-2000 Canadian dollars. (Source Appendix4E)

remained relatively stable). This obviously indicates that realiron-ore prices (i.e., in constant dollars) fell after 1984, amatter that is examined further below.
The historical price trends for iron ore in both currentand constant terms for Canadian and US dollars are depictedin Figure 19. The early part of this graph, from 1949 to 1980,shows a steady growth in both Canadian and US prices to apeak at about 1980. The slope of the price increase is consid-erably less than that of the value of overall Newfoundlandand Labrador production (Figure 18) during this period,however, the time leading up to 1980 was a period duringwhich the rise in prices coincided with the marked growth inprovincial iron-ore production resulting from the develop-ments in western Labrador. Commencing in 1980, there fol-lowed a steady decline in prices which, in terms of the USprice continues to 2002. The Canadian price has apparentlyimproved since a low in 1994, however, this is probably duein most part to the steep depreciation of the Canadian againstthe US dollar during this period.
The behaviour of gross Labrador iron production valueclosely follows that of global iron-ore production value asshown in Figure 20. This figure (after Kelly and Kirk, inKelly et al., 2001) compares the amount of production intonnes (vertical bars keyed to the left vertical axis), with thevalue of world production (blue line keyed to the right axis).The value of world production reached a peak in 1979 andsince then has declined along a path similar to that for theNewfoundland and Labrador value of production. The differ-ence with the Newfoundland and Labrador situation (com-pare Figure 18) is that after prices started to fall in 1980,world production tonnage continued to rise along an almoststraight-line trend despite the fall in value. Clearly,
Newfoundland and Labrador failed to benefit from this con-tinued growth and must have lost market share.
What caused the iron-ore price peak ca. 1980 and whydid Newfoundland and Labrador apparently lose marketshare after this date? With regard to prices, one explanationfavoured by Kirk (2002) is that until ca. 1980 there were twointernational iron-ore price structures, one related to NorthAmerica and the other to external market economies. TheNorth American market was essentially a captive one due tothe fact that steel producers owned more than three quartersof the iron-ore production capacity. Prices were therefore seton the basis of production cost plus royalty and managementfees and were fairly stable, e.g., through the long-livedLower Lakes pricing system. The Labrador iron-ore mineswere owned by US and Canadian steel companies and thuslargely controlled by events in the North American market.Demand during this period was also high and the iron-oreindustry was continuing its post-World War II growth.However, in 1982, major structural changes occurred in theNorth American industry, one of which was the developmentof a spot market that led to price competition from offshoresources and the unwinding of the Lower Lakes pricing sys-tem. Exposure to international competition forced cuts incapacity and prices, re-negotiation of wage contracts and anoverall increase in competitiveness. As a result, US mines cutcosts by 30% and prices by 42% in a trend that continues tothis day.
The period following 1981 also saw major increases inthe supply of cheap, high-grade iron ore coming from newdevelopments in Australia, Brazil and Venezuela. The resultof this low-cost production was a steep decline in the globalprice of iron ore that in turn forced a decline in higher cost
30
Figure 19. Price of iron ore 1949 to 2000 in current and year-2000 dollars. (Source Natural Resources Canada data)

North American iron-ore production. Iron-ore prices roseagain in the period 1994-97 but then fell victim to the Asiandebt crisis and a recession in metal prices that continued to2002. All of the iron mines in Labrador and adjacent parts ofQuébec were affected by these structural changes. Accordingto Natural Resources Canada (Boyd and Perron, 1997),Brazil has been the most significant competitor for easternCanadian (largely Québec and Labrador) iron ore and hasmade significant inroads into south–southeastern US andEuropean markets. The only area where the Canadian pro-ducers have maintained a clear competitive advantage is inthe north–northeastern US where they benefit from proximi-ty to the market and cheaper transportation (Boyd andPerron, 1997). Globally, therefore, there is little doubt thatsince 1980 the Canadian producers, including Newfoundlandand Labrador, have lost market share to cheaper iron orefrom Brazil and other southern-hemisphere producers. Thesituation has stabilized somewhat since 1988, however, thefact remains that the value of shipments for Labrador iron oretoday is only about half of its peak in 1979 and is more typ-ical of the values of the late 1960s. From Figure 20 it is evi-dent that world demand for iron ore is continuing to increase.Strong economic growth in China has prompted a resurgencein Asian market demand and a rise in prices. However, sincetransportation costs are a critical component of iron-oreprices, it is likely that this increased demand will benefitAustralian and Brazilian producers to a greater extent thanNorth American ones.
The post-1980 changes have severely impacted theNewfoundland and Labrador iron-ore producers. BothWabush Mines and IOCC have experienced successive peri-ods of downsizing, periodic shutdowns and ownershipchanges. In response, both companies have successfullyimplemented major cost-cutting programs and have achievedlower cost production. Both companies have also becomemore market-driven and have diversified their sales bases.For example, IOCC now exports roughly 40% of its produc-tion to the US, 40% to Europe and 20% to the Asia/Pacificregion (Dempsey, 1999).
Effects of Other Metal Prices
Whilst the behaviour of iron ore prices may have beenthe controlling influence in Newfoundland and Labrador,there were apparently similar forces at work in other areas ofthe national mineral economy. This is shown by Figure 21,which compares the total value of mineral production forCanada (1886 to 2000) with that of Newfoundland andLabrador (as taken from Figure 10). The two sets of profilesare similar in that both show steep rises in the 1945-1980period followed by steep declines. The Canadian profile dif-fers, however, in that its post-1980 decline was less pro-nounced (a 30% decline vs the 50% decline shown byNewfoundland and Labrador) and shows signs of a recover-ing upward trend in recent years. It should be noted, though,that this recent upswing is due almost entirely to new dia-
31
Figure 20. World production of iron ore vs world value of iron-ore production, in year-1998 US dollars. (Source United StatesGeological Survey; Kelley et al., 2001)

32
Figure 21. Comparison of Canadian vs Newfoundland and Labrador gross values of mineral production; in current and year-2000 Canadian dollars (Source Natural Resources Canada for Canadian data and Appendix 4B for provincial data). The year-2000 dollar plots were produced using a Gross Domestic Product deflator series. (Source Appendix 4B)

mond production from the Northwest Territories. If this wereremoved, the value of production trend would show a declinesimilar to that of Newfoundland and Labrador’s production.Canadian mineral production is far more diverse than that ofNewfoundland and Labrador and is not controlled by anysingle commodity, although base and precious metals exert astrong influence. This suggests that the post-1980 decline isa phenomenon that to a greater or lesser extent seems to haveaffected major mineral commodities other than just iron ore.
A recent review by Sullivan et al. (2000) using priceindexes developed by the U.S. Geological Survey (USGS),has indicated that the long-term constant-dollar price of keyUS raw materials (based on five metal commodities – cop-per, gold, iron ore, lead and zinc – and seven industrial min-erals) has declined since 1900. The behaviour of the metalsgroup as a metals price index for the period 1950 to 1997 isshown in Figure 22 in terms of 1997 US dollars. The indexis significant as it includes the chief metal commodities pro-duced by Newfoundland and Labrador over this period. Theregression line for the index over the 1900-2000 period isalso shown for comparison. The index in Figure 22 shows astrong peak ca. 1980 followed by a steep but erratic pricedecline, a pattern similar to the behaviour of iron-ore pricesdescribed above. The behaviour of two significant compo-nents of the index; copper and gold, is broken out separatelyin Figure 23. From this it can be seen that 1980 marked a his-toric peak in gold prices. This followed the high inflation ofthe 1970s and in partnership with the iron-ore prices obvi-ously contributed strongly to the peak in the metals index atthis time (Figure 22). US copper prices (Figure 23) actuallypeaked ca. 1974 and then experienced a highly cyclical
behaviour with lows in the mid-1980s and early 1990s fol-lowing major recessions. The latest decline since 1997 isattributable to the Asian economic crisis and a huge increasein global production capacity. A contributing factor to theoverall decline in copper prices since the late 1970s has prob-ably been technological innovations that have progressivelybrought the real cost of production down. Coupled with this,there has been an increased globalization of the copper mar-ket, as a result of which production has become increasinglyinfluenced by South American and Asian producers. Thegeneral assumption is that the price decreases have beendriven by increased supply (at times leading to oversupply,as has been the recent case for copper and zinc), increasedtechnological efficiency that has resulted in lower productioncosts, and, in the case of iron ore at least, discovery of high-er grade deposits. Taken together with the closure of majoroperations such as Buchans and Schefferville, these factorshave contributed to a dramatic drop in the value ofNewfoundland and Labrador’s main metal ore exports in thepost-1980 period.
The Gross Value of Mineral Production Broken Down byMining Project
This section examines the historical contribution thateach of the Province’s mining operations has made to thetotal value of mineral production. The results of this analysisfor the period 1864 to 2000 are summarized in Figure 24 andthe following procedures were used to develop this figure:
1. The total amount of production, in metric tonnes,was determined for each of the Province’s mineral
33
Figure 22. Metals price index in year-1997 US dollars (copper, gold, iron ore, lead and zinc). Source United States GeologicalSurvey, Sullivan et al. (2000).

operations, including metals and industrial miner-als. These data were obtained principally from theCanadian Minerals Yearbook (Natural ResourcesCanada annual publication), supplemented byunpublished records of the Newfoundland andLabrador Department of Mines and Energy.
2. The annual historical price for each commodity pro-duced was determined in US dollars, chiefly fromthe work of Kelly et al. (2002) for the United StatesGeological Survey. Some values not available inthis list (e.g., dimension-stone prices) were deter-mined from Natural Resources Canada andNewfoundland and Labrador Department of Minesand Energy records (Appendix 4H). The annualprice was then converted to year-2000 constant USdollars using the US CPI (Appendix 4H; seeAppendix 2 for method). An average, annual con-stant-dollar price for the life of the operation wasthen calculated.
3. The total tonnage produced per operation from step1 was multiplied by the average, constant-dollarprice calculated in step 2 to produce an adjustedgross value of mineral production in year-2000 USdollars. For the major iron operations of Labrador(Schefferville, Wabush and Labrador City), a moredetailed method was used in which the annual valueof production for each operation was calculated bymultiplying the actual annual tonnage produced(taken from the Canadian Minerals Yearbook reportfor that year) by the year-2000 US dollar price
series (as calculated from the data of Kelley et al.,2002) and then calculating a total gross value ofproduction for each operation (Appendix 4G).
4. The adjusted gross values of mineral productioncalculated from step 3 are summarized in Table 2(taken from Appendix 4F) and plotted against theyear in which the operation commenced productionin Figure 24.
Figure 24, therefore, shows the relative value of each ofthe province’s mineral operations adjusted to a present dayvalue in terms of year-2000 US dollars. However, some cau-tions apply:
1. The main one is that for all operations exceptSchefferville, Labrador City and Wabush, the calcu-lation assumes a constant annual rate of production,which probably was not the case for most opera-tions. If production was biased towards a particularperiod when historical metal prices were higher, orlower, than the average then this could distort theresult – but probably not to the extent that it wouldchange the major conclusions derived below. Thiscaution does not apply to the Labrador iron-oreoperations of Schefferville, Labrador City andWabush, where as noted above, the value was deter-mined on an annual basis and is thus more accurate.
2. The calculations use historical US prices, sincecomparable Canadian prices were not available forall mineral commodities. The US prices may not
34
Figure 23. Copper and gold prices in year-1997 US dollars. Source United States Geological Survey, Sullivan et al. (2000).

have matched the Canadian price at all times, par-ticularly for industrial minerals where prices in ear-lier years were often determined locally rather thannationally or internationally. This also applies toiron ore that is usually traded under a series of long-term contracts and is thus not governed by a singleprice. The United States Geological Survey “price”that has been used is really an average unit valuethat has been determined by weight averaging thevalue of shipments and the value of imports (Kelleyand Jorgenson in Kelley et al., 2002). In the past 25years or so this has been dominated by pellet pro-duction (including that from Labrador) and thusprovides a good match for eastern Canadian pro-duction, much of which is pelletized. It may not,however, provide the best match for Wabana oreprices. The US price has historically been, and con-tinues to be, higher than the world price for iron ore.
3. Value estimates marked * in Table 2 are theoreticalvalues based upon the tonnage produced multipliedby the mill head grade multiplied by price. Thisdoes not account for milling-concentrating lossesand thus is an overestimate of the amount and valueof a particular commodity that was actually shippedand sold.
4. Finally, the historical price for some commoditiessuch as copper and limestone was not known for theearly parts of the production period and had to bebased upon later years (see Appendix 4F fordetails).
For any or all of the above reasons, the values deter-mined using the United States Geological Survey historicalprices may not match precisely those actually realized by theproducing companies. Nevertheless, they provide an inter-
35
Figure 24. The comparative historical value of Newfoundland and Labrador mining operations in year-2000 US dollars.(Source Appendices 4F, 4G and 4H). Note: mineral production values are based upon total tonnage produced in metric tonnesmultiplied by the average historical price adjusted to year-2000 US dollars. The percentages in brackets after the operationname are percentages of the total adjusted historical value of mineral production. The uncoloured part of the Schefferville barindicates the Québec component of production value.

nally consistent data set as the basis for inter-operation com-parisons.
Not surprisingly, the Labrador iron-ore operations ofSchefferville5, Wabush and Labrador City stand head andshoulders above the rest of the field. The only other compa-rable operation in terms of its historical value was Buchans.Perhaps surprisingly, the historical copper operations ofNotre Dame Bay (Tilt Cove, Little Bay and others) show acomparatively low overall value at ca. 2%, despite that factthat the value of recovered gold is probably overestimated inthe calculation (see Appendix 4F). This is probably due to thefact that though historical copper prices were much higher inreal terms than those of today, the overall production waslow by modern standards. The same is true of Wabana, which
despite its longevity, has a comparatively lowoverall value at ca. 3% of the total. In this respectit should be noted that Wabana’s annual produc-tion and grade of shipped product (ca. 48% iron)were much less than those of modern iron oremines. Also of note is the overall low value of theindustrial minerals operations in comparison tothose producing metals. Table 2 and Figure 24also show the percentage that each operationformed of the total historical value of mineralshipments, which amounts to $54 billion in year-2000 US dollars. Three pertinent observationsderived with respect to this are:
• Four mining operations (Labrador City,Schefferville6, Wabush and Buchans) con-tributed 89% of this total.
• One operation (Labrador City) contributed46% of the total.
• Iron-ore operations (Wabana, Schefferville,Labrador City and Wabush) accounted for75% of this total.
It should be remembered that the Buchansvalue, because it is based upon theoretical produc-tion values (Table 2) is probably overstated.However, even a 10% overvaluation would notsignificantly change either the above conclusions,or the standings in Table 2.
Estimated Effects of a Voisey’s Bay MiningOperation on the Value of Mineral Production
Following the recent decision to proceed with theVoisey’s Bay nickel–copper–cobalt project, it is interestingto analyze the projected gross in-situ value of this major dis-covery in comparison with past and existing operations. Thisis done in Figure 25, which adds estimated in-situ values forthe major components of the Voisey’s Bay deposit to the his-torical values for other deposits shown in Figure 24. The esti-mated Voisey’s Bay values are founded simply upon the cal-culated value of the ore as derived from the published valuesin Table 3. Allowance has been made for milling losses(based upon published recovery figures for the Ovoiddeposit, Voisey’s Bay Mine and Mill Environmental ImpactStatement 1997), but not for other potential losses such asincomplete mining of the resource. The value estimates arealso subject to deviation of real prices from the assumed
36
Table 2. Historical Total Gross Values of Mineral Production forNewfoundland and Labrador mineral operations
Gross value of % of totalproduction in provincial
Operation year 2000 US$ value
Tilt Cove (Cu,Au) $715 000 000 1.3Other Notre Dame Bay mines (Cu) $162 000 000 0.3Little Bay (Cu,Au) $224 000 000 0.4Wabana (Fe) $1 394 000 000 2.6Aguathuna (limestone) $65 840 000 0.1Buchans (Cu,Pb,Zn,Au) *$7 312 000 000 13.5St. Lawrence (Fluorite) *$759 000 000 1.4Flat Bay (Gypsum) *$266 000 000 0.5Schefferville (Fe) - $6 070 000 000 11.2Labrador component onlyLabrador City/Carol (Fe) $24 912 000 000 46.0Wabush (Fe) $9 129 000 000 17.0Baie Verte (asbestos) $675 000 000 1.2Rambler (Cu,Pb,Zn,Au) *$1 136 000 000 2.1Daniel's Harbour (Zn) $1 035,000 000 1.9Lower Cove (limestone, dolomite) $42 000 000 0.1Hope Brook (Au) $327 000 000 0.6Ten Mile Bay (anorthosite) $12 000 000 0.02Nugget Pond (Au) $60 000 000 0.1Total provincial value $54 472 000 000
See text for method of calculation (and cautions). Major operations interms of value are highlighted in bold. For detailed calculations seeAppendix 4F.
*Indicates that the value is based upon production tonnage multiplied bymill head grade rather than actual amount produced.
5 Note that the Schefferville operation straddled the Québec–Labrador border with production divided roughly evenly between the two provinces. Figure 24shows both the overall production and the Labrador component.
6 Schefferville production as used here includes only the Labrador component.

37
Figure 25. The comparative historical value of Newfoundland and Labrador mining operations in year-2000 US dollars, alsoshowing estimated in-situ values for the Voisey’s Bay deposit (Source Appendices 4F, 4G and 4H). Note: mineral productionvalues are based upon total tonnage produced in metric tonnes multiplied by the average historical price adjusted to year-2000 US dollars. The value for Voisey’s Bay is based upon the reserve tonnage, adjusted for processing losses multiplied byan assemed average long-term price in current US dollars.
Table 3. Estimated gross in-situ value of the Voisey’s Bay deposits; the assumptions used in this table are discussed in the text
Ore/Resources Grade Tonnes Forecast Recovered Assumed Value US$Deposit tonnes Metal (%) of metal Recovery (%) tonnes price US$ million
Ovoid 31 700 000 Ni 2.85 903 450 82.1 741 732 $6 614 $4 906Cu 1.68 532 560 93.8 499 541 $1 984 $991Co 0.14 44 380 85 37 723 $15 432 $582
Total $6 479
Eastern Deeps 47 000 000 Ni 1.39 653 300 82.1 536 359 $6 614 $3 548Cu 0.6 282 000 93.8 264 516 $1 984 $525Co 0.09 42 300 85 35 955 $15 432 $555
Total $4 627
Total 137 000 000 Ni 1.6 2 192 000 82.1 1 799 632 $6 614 $11 903Cu 0.85 1 164 500 93.8 1 092 301 $1 984 $2 167Co 0.09 123 300 85 104 805 $15 432 $1 617
Total $15 687

ones. In Figure 25 the deposit is divided into its major com-ponents (see also Table 3). The lower bar in Figure 25 is theOvoid, which is the only part of the deposit to date that con-stitutes a proven reserve and for which definite mining plansexist. The second bar is the Eastern Deeps deposit, whichdepending upon further exploration results, may be the nextmineable deposit, and the third bar represents all geologicalreserves discovered to date (137 million tonnes). The calcu-lated values are heavily dependant on assumptions and arethus not directly comparable with the value of mineral pro-duction data for other operations. Nevertheless, they allowan order-of-magnitude comparison with existing and pastoperations. On this basis, the Ovoid seems to be roughlycomparable to the Buchans operation, whereas the addedvalue of the Eastern Deeps and other components wouldmake the Voisey’s Bay deposit more comparable to the valueof the Schefferville and Wabush operations respectively, butstill less than that of Labrador City.
Clearly the Voisey’s Bay project will dramaticallyincrease the annual gross value of the province’s mineral pro-duction. The predicted average annual production and valuefrom the Voisey’s Bay Ovoid deposit has been published byInco (2003) in current dollars as:
Nickel – 110 000 000 lbs = 49 896 t = US$330 012 144Copper – 85 000 000 lbs = 38 556 t = US$ 76 495 104Cobalt – 5 000 000 lbs = 2 268 t = US$ 34 999 776Total = US$441 507 024
Total annual value of production in Canadian dollars(@0.66 US dollar exchange rate) = CAN$668 950 036
This is based on the anticipated annual production rateof about 2.19 million tonnes (6000 tonnes per day). The pre-dicted annual value of production will therefore be aboutCAN$669 million Canadian (mid-2003 exchange rates),which represents an 85% increase over the overall grossvalue of provincial mineral production for the year 2002.This is shown graphically in Figure 26 where the annualgross value of Voisey’s Bay production has been added to theadjusted constant-dollar graph for the value of mineral pro-duction of Figure 15. This would raise the gross value ofmineral production to levels last seen in 1984. Obviouslythe gross value could change depending upon whether aver-age metal prices exceed, or fall below, the assumptions inTable 3.
Comparison of Historical Mineral Production andOffshore Oil Project Values
In order to appreciate the significance of the historicalproduction values discussed in the previous section, it isprobably helpful to compare them to other non-renewableresource projects in the Province, particularly those involv-ing offshore oil production. The Province’s offshore oil pro-duction has grown greatly in recent years and is currentlyseen as one of the major revenue opportunities for futureyears. Figure 27 compares the historical production values
38
Figure 26. Gross Value of Mineral Production in constant Canadian dollars showing hypothetical effect of Voisey’s Bay pro-duction added to year-2002 values. (Source Appendix 4B and Table 3)

from Figure 25 with the value of in-situ reserves for theHibernia and Terra Nova offshore oil projects. This is basedupon recoverable reserves of 884 and 406 million barrels ofoil respectively for the Hibernia and Terra Nova projects(Canada-Newfoundland Offshore Petroleum Board 2003)and assumed long-term prices of US$20 and US$25 per bar-rel respectively. The value ranges derived from this areUS$17.7 to 22.1 billion for Hibernia and US$8.1 to 10.2 bil-lion for Terra Nova. Obviously these are predicted valuesthat are subject to the same uncertainties regarding long-termprice assumptions as those for the Voisey’s Bay calculations.This aside, the interesting aspect that emerges from Figure27 is that the Hibernia and Terra Nova projects fall within thesame range in terms of overall in-situ value as the Province’smajor mining projects. Both, however, are exceeded by thegross value of production from the Labrador City operation.It is also interesting that the Terra Nova and Voisey’s Bay
projects are broadly comparable in terms of in-situ value ofthe resource. This comparison does not take into accountpossible future gas production from these oil projects. Itshould also be noted that the current royalties from offshoreoil greatly exceed those from mining, thus underlining thecurrent value of offshore oil to the Province (see section,Taxation and Employment Benefits from Mining).
Summary
• Mining is the second most important resource industryin the Province in terms of gross domestic product.
• The Province accounts for 6% of the value of Canadianmineral production and ranks 6th highest in terms ofother provinces and territories.
39
Figure 27 The comparative historical value of selected mining operations compared to estimated in-situ values for theHibernia and Terra Nova oil fields, in year-2000 US dollars and using a long-term price of US$20 per barrel. (Source forrecoverable oil reserve data – Canada-Newfoundland Offshore Petroleum Board). The uncoloured part of the Hibernia andTerra Nova bars indicates the increase in value if a price of US$25 per barrel is assummed. See Figure 25 for notes concern-ing historical mine valuations. The values for Hibernia and Terra Nova are based on total extractable reserves of oil multi-plied by assumed long-term prices of $US20 and $25/barrel. Gas and near-gas liquids are excluded from the in-site value cal-culation.

• Historically, the Province’s mineral economy has movedfrom a diversified one prior to 1960, to one increasinglydominated by iron ore to the extent that in recent yearsthis product has accounted for 91 to 94% of the value ofmineral production. This is due as much to the closure ofother operations as to increases in iron-ore production.
• The Province is currently the lead producer of iron orein Canada at 63% and accounts for 2% of world produc-tion.
• Non-metals account for only 6% of mineral productionand are dominated by construction materials (sand,gravel, and aggregate stone), dimension stone anddolomite. Aggregate stone, dolomite and dimensionstone have all seen pronounced growth in the late 1990s.
• Historical trends in the value of mineral shipments, con-verted to constant dollars, show a steady increase to apeak ca. 1979, followed by a cyclical decline that haslasted to the present day. The present-day value of ship-ments, in constant-dollar terms, is comparable to that ofthe mid-1960s. This decline has been largely the resultof lower iron-ore prices since 1979, combined with adecrease in production due to closures such as theSchefferville and Buchans operations.
• The decline in iron-ore prices (and other metal prices)since ca. 1980 has been driven largely by increased com-petition from low-cost foreign sources, chiefly in theiron-ore markets, and by technological improvementsthat have lowered production costs world wide.
• The provincial trend for value of mineral production isvery similar to that for Canadian mineral production.
• Some pertinent facts concerning historical contributionsto provincial mineral production are:- 89% of the value of mineral production has been
provided by four operations (Labrador City,Schefferville, Wabush and Buchans).
- One operation (Labrador City) has contributed 46%of the total value of production.
- Iron-ore operations (Wabana, Schefferville,Labrador City and Wabush) have accounted for75% of the total value of mineral production.
• The total historical gross value of mineral production isestimated at around US$54 billion in year-2000 dollars.
• Production from the Voisey’s Bay deposit could result inan increase of ca. 85% over the current value of mineral
production in the Province, but will only restore thegross value of mineral shipments to a ca. 1984 levelvalue of production. The in-situ value of the Voisey’sBay deposit appears comparable in terms of value oftotal production to the Buchans, Wabush and Scheffer-ville operations but is easily exceeded by the value ofthe IOCC Labrador City operation.
• The Province’s major mining projects compare favour-ably in terms of their gross value of production with thepredicted in-situ value of the Hibernia and Terra Novaoffshore oil projects. The Labrador City iron-ore opera-tion exceeds both in terms of its value of production todate.
TAXATION AND EMPLOYMENTBENEFITS FROM MINING
This section examines the benefits derived from miningthrough taxation, employment and wages.
Taxation Benefits
These7 are considered under the headings of MiningTaxes and Royalties, which are the revenues paid directly togovernment under various acts, and Other Taxes, which com-prise more indirect sources of revenue.
Mining Taxes and Royalties
These accrue to the Province under the following acts:
1. The Mining and Mineral Rights Act, 1975 as amended1994, 2002. This act governs all mining operations thathave commenced since the introduction of the act in1975. It imposes a royalty of 15% on taxable income andan additional levy of 20% on any private royalties paidto a third party. Major sources of revenue under this lat-ter levy are the Labrador Iron Ore Royalty Income Fund,which on behalf of Labrador Mining and ExplorationCompany Ltd., is taxed on royalties that it receives fromthe Iron Ore Company of Canada; and ArbataxInternational Inc. (formerly Nalcap) and Knoll LakeMinerals, which are taxed on royalties that they receivefrom Wabush Mines.
2. The Labrador Mining and Exploration CompanyLimited Act, 1938. This governs the royalties paid by theIron Ore Company of Canada from its Labrador Cityoperations. Royalties are paid on the basis of 5% of prof-its as defined under the act.
40
7 This breakdown differs from that normally used in provincial tax accounting, where the mining/royalty, corporate, fuel, retail sales, payroll and sundry taxesare considered as direct, and municipal and other sundry taxes are considered as indirect.

3. The NALCO-Javelin (Mineral Lands) Act, 1957. Thisgoverns the royalties paid by Wabush Mines. TheProvince collects a basic royalty of $0.22 per tonne ofiron products shipped from Wabush Mines. Under theGovernment-Javelin Taxation (Confirmation of Agree-ment) Act of 1959, an escalation royalty is also collect-ed from Arbatax in agreement with a formula estab-lished in the Act. This is based on the amount by whichthe value of iron products shipped exceeds the LakeEyrie price of US$11.70 for Old Range non-Bessemerore analyzing 51.5% iron.
Figure 28 displays the existing Mining Tax andRoyalties revenue for the period 1949 to present plottedagainst the gross value of production data, both data setsbeing shown in terms of year-2000 Canadian dollars (note,however, the radically different scales for the two data sets).From this figure it can be seen that revenue for the period1949-73 increased steadily in overall correlation with thevalue of production until reaching a peak of ca. $52 millionin 1981, slightly postdating the peak of mineral productionvalue in 1979. After this date, the revenue then declines inapproximate correlation with the value of production, theexception being the years 1987-88 when revenue spiked toabout $45 million but in the absence of any correspondingincrease in production value. The reasons for this revenuespike are as yet unclear. One of the more interesting aspects
of Figure 28 is the manner in which Mining Tax and Royaltyrevenue as a proportion of the value of production, increaseswith time. This is more clearly portrayed in Figure 29 whichplots the revenue as a percentage of the value of production(the revenue percentage) against time. From this it is evidentthat ca. 1976, the revenue percentage began a fairly steepincrease from a previous average level of about 1%, to anaverage of about 2.5% in the period 1984 onwards. Putanother way, the revenue take increased from about $10 mil-lion to an average of $25 million over this period: anincrease of 150%. What initiated this increase? The magni-tude of the increase was such that it could only be accountedfor by events impacting the iron-ore industry, which at thistime was generating 85% of the gross value of mineral pro-duction. The explanation in this case is the application, start-ing in 1975, of the 20% tax provision in the Mining andMineral Rights Tax Act to the private royalties paid out byWabush Mines and later by IOCC. This is supported by thefact that at the present day, the tax derived from the privateroyalty revenues accounts for more than half of the direct taxtake from the iron-ore companies. The Mining and MineralRights Tax Act, however, did not affect the primary royaltystream to government, which continued to be governed bythe specific royalty agreements referred to above. Clearly, ifall revenue from these operations (and others such asBuchans) had come under the Act since its proclamation in1975, then the impact on provincial revenues would have
41
Figure 28. Direct Provincial Revenue (right axis) vs Gross Value of Mineral Production (left axis) in year-2000 Canadian dol-lars. (Source Appendix 4B)

been even greater. A subsidiary contribution to the increasein the revenue percentage was also the 1975 opening of theDaniel’s Harbour zinc mine, the first operation to be taxedcompletely under the new act. Mining tax from Daniel’sHarbour amounted to an average of $1.7 million over theoperating period and did not exceed an annual value of $5million (all in year-2000 dollars). Clearly, therefore, it wasonly a minor contributor to the rise in mineral revenues
Other Taxation Revenue
The Department of Mines and Energy records regardingother tax revenues since 1949 are very incomplete. The rawinformation probably exists in the form of the annual NaturalResources Canada census forms that each mining operationhas to complete, however, many of these data have not beenfully analyzed and thus were not available for use in thisreview.
Detailed revenue information is, however, available forthe period 1990-98 (source: unpublished Newfoundland andLabrador Department of Mines and Energy statistics) andallows comparison with Mining Tax and Royalties revenue.Other tax revenue comprises corporate, fuel, retail sales,municipal and sundry taxes as derived from mining opera-tions. The breakdown of these tax components, averagedover the 1990-1998 period, is shown graphically in Figure30. The largest individual tax contribution, at about 40%(Figure 30), comes from sundry taxes, which comprise per-sonal income, retail sales, gasoline, tobacco, alcohol andmotor vehicle taxes as applied to mining workforces.
The comparison between Mining Tax and Royalties andother taxes for the 1990-1998 period is shown in Table 4.
42
Figure 29. Direct Provincial Revenue as a percentage of theannual Gross Value of Mineral Production. Bold line is amoving-average trendline. (Source Appendix 4B)
Figure 30. Breakdown of total Provincial Mineral Revenue averaged over the period 1990 to 1998. (Source Appendix 4I). Inyear-2000 Canadian dollars.

From this it is apparent that over this period, Other TaxRevenue exceeded that from Mining Tax and Royalties by afactor of about 4. Furthermore, when examined as a percent-age of the gross value of mineral production, it is apparentthat Mining Tax and Royalties only amounted to 2.3 % (his-torically this ranged between 1 and 2.5% - Figure 28) of thisvalue during the period shown in Table 4, whereas OtherTaxation Revenue accounted for 8.7%. The total taxationrevenue accounted for 11%. It is not certain though whetherthe 11% value can be extrapolated over previous mineralproduction history.
Comparison of Mining and Oil Revenues
Following the comparison between the gross value ofmineral and oil production (see Section on The EconomicValue of Mineral Production - Present Day and HistoricalPerspectives, it is appropriate to briefly compare the rev-enues derived from these sectors. The figures below aretaken from the Government of Newfoundland and LabradorAnnual Statement of Public Accounts and deal only with
Oil Royalty Mining Tax andYear Revenues Royalties Revenues1998 $ 4 266 $27 8001999 $ 3 295 $24 4652000 $19 992 $18 2892001 $39 481 $19 3642002 $27 904 $17 0712003 $72 287 $17 360
(in millions ofcurrent dollars)
Mining Tax and Royalties vs oil revenues. As can be seen, theoil royalty revenues have surpassed those from mining inrecent years, a comparison that is worsened by the decline inmining revenue during this period. Mining Revenues willlikely increase substantially once Voisey’s Bay has paid offits capital costs; however, oil revenues are projected toincrease to levels of over $100 million in coming years.
Employment and Wages
This section examines trends in mining workforce num-bers and annual wages paid to the mining workforce. Thisdoes not include the supply or exploration sectors.
Wages paid to the mining workforce generate benefits tothe mining communities and the Province through purchasesof goods and services and also through the income and salestaxes described above. There are no data concerning theexact level of benefits derived from employment per opera-tion, however, it is presumed that the benefits will be propor-tional to the average wage levels and the workforce employ-ment numbers, common income multipliers being 1.32 to1.36. Data for average wages and employment numbers areavailable but with numerous gaps. A meager amount of datafor the pre-confederation period are available in annualreports by the Department of Agriculture and Mines and indi-cate levels of up to 2500 persons per year up to 1921. Datafor the period 1949-73 come from Department of Mines andEnergy annual reports, however, these are inconsistent andfor some years the relevant information is lacking. For thepost-1988 period more extensive data are available fromunpublished Newfoundland and Labrador Department of
43
Table 4. Mining Tax & Royalties vs Other Taxes for the period 1990-1998, in millions of year-2000 Canadian dollars
Revenue type 1990 1991 1992 1993 1994 1995 1996 1997 1998
Mining Tax & Royalties 26.0 25.0 17.0 15.9 18.9 21.0 23.3 24.9 29.1(millions of $)
Other Taxes (millions of $) 74.4 85.5 76.3 68.3 78.0 93.5 104.2 82.2 88.8
Total (millions of $) 100.4 110.5 93.2 84.2 97.0 114.4 127.4 107.1 117.9
Value of Mineral Production 1054 892 803 781 935 962 978 1065 1144(millions of $)
Average Mining Tax & Royalties = $22.3 million = 2.3% of AVMPAverage Other Taxes = $83.5 million = 8.7% of AVMPTotal average revenue = $105.8 million = 11% of AVMPAverage Value of Mineral Production (AVMP) = $957 millionConversion to constant dollars was carried out using the CPI series (Table D-2)

Mines and Energy statistics and for some years from theCanadian Minerals Yearbook.
Employment trends post-1949 are depicted in Figure 31,which plots the available employment data against the trendsin the value of mineral production through to the present.From this it appears that employment increased from a levelof about 3500 in 1949 to a peak of around 7000 in 1970 andhas since declined significantly to a present level of about2700. It should be noted that data are missing for the criticalperiod of the late 1970s–early 1980s when mineral produc-tion peaked and when employment may have been evenhigher. This trend is broadly correlated with that of the valueof mineral production, the post-1980 decline in mineral ship-ments being evidently matched by a proportional decline inemployment. Current employment levels are the lowest inthe Province’s post-confederation mining history.
The decline in employment is offset to some extent bythe trends in average8 annual individual wages, shown inFigure 32. These are plotted (adjusted to year-2000 dollars)against the employment data referred to in Figure 31. For theperiod 1949-1970, average wages appear to have increasedin proportion to employment, however, after 1988 thereappears to have been a strong decoupling with average indi-vidual wages continuing to increase despite the decline inemployment. The trend, therefore, has probably been drivenby technological improvement and has resulted in fewer but
more highly paid and more productive workers. As with allaspects of the Province’s mining industry, these trends wereprobably driven overwhelmingly by the Labrador iron-oreoperations (see below). This industry has undergone consid-erable downsizing over the past two decades whilst at thesame time increasing its reliance on technology and automa-tion in order to remain competitive. The recent trend ofincreasing individual wages in Figure 32 may, therefore,reflect the increasing skill-levels and consequent increasingwage levels in the industry as a result of these changes. Othereffects may also be at work, for example contracting-out ofsome lower paid work to the supply sector. The most recentaverage annual wage for which information is available(1999) was about $66 000 (derived by dividing the aggregatewage data for 1999 as provided in the Canadian MineralsYearbook for 2001, by the total employment number postedby the Newfoundland and Labrador Department of Minesand Energy for that year). This was reputedly – and presum-ably still is – one of the highest paid in the provincialresource sector.
The breakdown of employment in the Province’s miningindustry is considered further in Figures 33 and 34 for theperiod 1994-2002, based upon unpublished Department ofMines and Energy statistics. Figure 33 depicts the proportionof persons employed in iron-ore mining as opposed to over-all employment in the industry. This has varied between 68and 78% of the total employment and has averaged 74% over
44
8 Note that the annual wage data as derived from Natural Resources Canada sources may not include all seasonal work especially – that related to quarry oper-ations, which by virtue of its lower wage levels would tend to lower the industry average.
Figure 31. Total annual employment vs the Gross Value of Mineral Production (GVMP) in year-2000 Canadian dollars.(Source Appendices 4J and 4D)

this period. Employment in iron-ore mining thus dominatesthe industry but not to the extent that the gross value of iron-ore production (typically 95% plus, Table 1, Figure 16)dwarves other commodities.
Figure 34 compares employment in the metallic andnon-metallic sectors. Mining of metallic commodities, chief-ly iron ore, has employed an average of 81% of the miningworkforce over the period 1994-2002.
Summary
• Revenue from Mining Tax and Royalties has increasedfrom an average value of about 1% of the gross value ofmineral production in the 1949-76 period, to an averagelevel of 2.5% in 1985-2002 period; an increase of about150%. This increase reflects the introduction of theMining and Mineral Rights Tax Act in 1975.
45
Figure 32. Total annual employment vs average wages for Newfoundland and Labrador mining in year-2000 Canadian dol-lars. (Source Appendix 4D)
Figure 33. Employment in Newfoundland and Labradormining; iron-ore mines vs all operations, 1994 to 2002.(Source – unpublished Newfoundland and LabradorDepartment of Mines and Energy statistics)
Figure 34. Employment in Newfoundland and Labradormining; metallic vs non-metallic sectors, 1994 to 2002.(Source – unpublished Newfoundland and LabradorDepartment of Mines and Energy statistics)

• Other taxes from mining, data for which, are only avail-able for the 1990-98 period, exceeded Mining Tax &Royalties revenue by a factor of four and averaged8.7% of the gross value of mineral production duringthis period.
• Total revenue through taxation amounted to 11% of thegross value of mineral production during the 1990-98period.
• The largest source of taxation revenue in recent yearshas been sundry tax, which includes personal income,retail sales, gasoline, tobacco, alcohol and motor vehicletaxes as applied to mining operation workforces.
• Direct mining revenues have been greatly exceeded bythose from oil in recent years, however, a recovery in theiron-ore industry and future revenues from Voisey’s Baymay well improve the mining vs oil comparison.
• Employment in the mining industry appears to be rough-ly correlated with the gross value of mineral production,and shows a steady increase to the late 1970s–mid1980s, followed by a steady decline. Current employ-ment levels are the lowest in the Province’s mining his-tory.
• Average individual wages have shown a consistentincrease since 1949, even when adjusted to constant-dollar values. The 1999 average annual wage wasaround $66 000 and one of the highest in the provincialresource sector.
• Metal mining (largely iron ore) has accounted for 81%of employment in the provincial mining industry overthe past decade.
• Since the late 1980s, average individual wages havecontinued to increase strongly in the face of decliningemployment, probably as the result of increased techni-cal specialization and higher skill requirements in theindustry.
THE MINERAL EXPLORATIONINDUSTRY
Introduction
Mineral exploration is the essential forerunner to miningdevelopment and is a vital component of a healthy and sus-tainable industry. The exploration industry is commonlydivided into major and junior company sectors. The majorsector comprises companies that produce minerals and met-als and that are generally global in operational scope. The
junior sector is formed of smaller companies that rely on thepromotion and sale of exploration properties, rather than pro-duction, for their income and are usually more local in scope.
Exploration for minerals may also be considered interms of the stages that have to be covered in order to find amineable deposit. The initial part of the search is generallyreferred to as the grassroots stage and involves prospecting,surface sampling, geophysical and geochemical surveys thatcover fairly large areas of ground. This stage also involvesacquisition of legal rights in the form of mineral explorationlicenses or “claims”. In Newfoundland and Labrador, claimsare established by delineating the required areas on a map.The license holder then has the right to proceed to develop-ment, provided that other legal requirements are met. Oncesome evidence of promising mineralization has been found,the search moves to the intermediate exploration stage wherethe objective is to define the nature and size of the mineral-ization. This usually involves some combination of drilling,trenching and stripping, in conjunction with geological map-ping and detailed geophysical and/or geochemical surveys. Ifthe results of this work continue to be encouraging, the next(third) stage may be advanced exploration. This usually in-volves further diamond drilling, plus the taking of large bulksamples either by surface or underground means. The bulksamples are used to determine the type of mineral processingrequired and also to give a better picture of the ore grades.This would normally then be followed by pre- and final fea-sibility studies, financing arrangements and, hopefully, a pro-duction decision.
Exploration for industrial minerals, particularly non-metals, is typically rather different from that in the metalssector. There is a great deal of vertical integration amongstcompanies in this sector, consequently most of the explo-ration is done by producers, as opposed to a separate explo-ration sector, and is relatively small in scale compared to themetals sector. Grassroots exploration is generally minimaland initial work, usually consisting of sampling and drilling,can proceed fairly quickly to test mining or quarrying.
Historical Exploration Expenditures
A traditional measure of exploration activity is theamount that is spent annually on the search for mineraldeposits in the Province. Records for the pre-confederationperiod do not seem to have been collected (or preserved),however, a reasonable amount of data are available for thepost-confederation era (1949-2002). This is shown in currentdollars in Figure 35 and year-2000 Canadian dollars inFigure 36 (taken from largely unpublished records of theNewfoundland and Labrador Department of Mines andEnergy; and Swinden, 1993). Figure 36 also shows expendi-ture in relation to the opening of major metal mines in the
46

Province. It should be emphasized that exploration expendi-tures for the period 1949 to about 1980 may not be reliable.This is because of the fact that up to 1978, most explorationwas carried out under the concession system, which general-ly required companies to spend a minimum amount on explo-ration but which did not necessarily require them to report allof their expenditures. The reporting requirements changedfollowing the introduction of the Mineral Act of 1976, which
required companies to report all expenditures on lands heldunder that Act. The Mineral Holdings Impost Act in 1978,also gradually encouraged companies holding lands underthe old concession agreements to surrender those lands andthus to make them available for acquisition under theMineral Act. Since 1981, 87% or more of the mineral rightshave been held under the Mineral Act and thus expenditurereporting can be considered reasonably reliable.
47
Figure 35. Historical exploration expenditures in current Canadian dollars. (Source Appendix 4K)
Figure 36. Historical exploration expenditures in year-2000 Canadian dollars. (Source Appendix 4K)

For the post-1980 period, the expenditure data inFigures 35 and 36 are further broken down into expendituresfor insular Newfoundland versus Labrador. The expendituresin total are highly cyclical and reflect the fact that explo-ration is heavily dependant on profitability and therefore onmetal prices. The cycles are also strongly influenced by newdiscoveries and the regional exploration surges that often fol-low them. The first boom cycle is evident for the years 1949to 1960 when demand for steel was driving intensive explo-ration for iron ore in Labrador and expenditures reached apeak of about $100 million (in year-2000 dollars, Figure 36)in 1960. Actual corporate expenditures were probably muchhigher since an equal amount of work was probably done inadjacent parts of Québec. Expenditures then declinedmarkedly to a low in 1964 and then entered a relatively sta-ble period lasting to ca. 1984 when a surge in gold prices ini-tiated the boom of the late 1980s (Figure 36). This boom,which was largely restricted to Newfoundland expenditures,was also reinforced by the so-called “flow-through” era,when the federal government provided enhanced tax deduc-tions for investments in Canadian junior mining companies.This phase of exploration resulted in the discovery anddevelopment of the Hope Brook deposit, and also a numberof small deposits, two of which (Nugget Pond and HammerDown) became mines in 1997-2001. The third boom occur-red in the mid-1990s folowing the discovery of the Voisey’sBay nickel–copper–cobalt deposit in Labrador. This resultedin a peak expenditure of $100 million dollars in 1996 thatwas naturally focused largely in Labrador and which equaledthe earlier peak in 1960. This boom was not, however,induced by a rise in metal prices (most were falling in realterms) but rather by the spectacular nature of the discoveryand its revelation of Labrador as a grassroots nickel target.Newfoundland expenditures during this time stayed flat inresponse to the declining metal prices that characterized thelate 1990s-2003 period. Expenditures in Labrador fellsteeply in 1998 as the Voisey’s Bay boom waned and reacheda trough in 2002. Total provincial expenditure began torecover in 2001-02 and seems to be continuing this trend in2003. The current (2002) level of expenditure is $44 milliondollars; a figure that compares favourably with the averageannual expenditure over the 1981-2002 period of $35 million(in year-2000 dollars). Whilst the current upswing is encour-aging, it should be noted that much of the expenditure in thelast two years has been in Labrador where it has been asso-ciated with the assessment of the Voisey’s Bay deposit.Newfoundland expenditures have shown a more modestupswing, due mostly to renewed gold exploration.
Other Measures of Exploration Activity
Other exploration statistics collected by the Departmentof Mines and Energy on an annual basis include the numberof claims staked, the number of claims that remain in good
standing, and the number of metres of diamond drillingundertaken. The number of claims staked and the number ofthose remaining in good standing are broad measures of theamount of exploration activity taking place in the Provincebut tend to be biased towards the early phases of explorationcampaigns, when large amounts of ground are initiallyacquired. In contrast, the diamond-drilling statistics act moreas a measure of the level of intermediate and advancedexploration that is taking place. The claims-staking and dia-mond-drilling records are given in Figures 37 and 38 respec-tively. As was the case for the exploration expenditures, theclaims data for years prior to 1981 understate the activity tak-ing place. Claim-staking did not become widespread until theintroduction of the Mineral Act in 1976, and it was not untilthe 1980s that it came to represent the main form of mineralrights acquisition. The claims data in Figure 37 show a peakin the late 1980s related to the above mentioned boom ingold exploration, followed by a massive peak in 1995 relat-ed to the Voisey’s Bay discovery. This peak collapsed asquickly as it formed, due no doubt to the lack of immediatefurther discoveries in Labrador. Claim staking subsequentlysubsided to a low in 1999 but has recovered strongly to a cur-rent level of 33 000 claims in 2002. This is well above thehistorical 1981-2002 average of 25 000 claims per year (andmuch higher than the average of 14 258 claims if the anom-alous peak of 1995 is excluded). Figure 37 does not distin-guish between Newfoundland and Labrador data but analysisof the underlying Department of Mines and Energy statistics,indicates that converse to the expenditure situation, therecent increase has come largely from Newfoundland, whereit has resulted from the recent resurgence in gold exploration.
Diamond drilling statistics (Figure 38) show similarpeaks in activity related to the late 1980s gold boom and themid to late 1990s Voisey’s Bay rush. Note again that activityprior to the introduction of the Mineral Act does not neces-sarily represent total drilling activity. The Mineral Act of1976 did, however, require all companies to report drillingactivity regardless of the form of land tenure, therefore,reporting after 1976 may be considered representative.Annual drilling between 1976 and 2001 averaged 77 000metres per year, however, this was heavily influenced by thetwo exploration booms of the mid-late 1980s and mid-1990s.Activity for the past two years has averaged 57 000 metresper year; a level that is well below the historic average butwhich still compares favourably with levels outside of thetwo major booms (Figure 38). This also indicates that a rea-sonable amount of intermediate to advanced exploration istaking place.
Comparisons with other Canadian Jurisdictions
Figure 39 illustrates the performance of explorationexpenditures for Newfoundland and Labrador against those
48

for Canada as a whole for the period 1989-2001 (note the dif-ferent scales used to portray this data). Total Canadianexpenditures for this period (Natural Resources Canada,2002), plotted in year-2000 dollars, show a strongly cyclicalpattern that commences with a peak in the late 1980s, duelargely to the gold exploration boom that occurred through-out Canada at this time. This was followed by a trough in the
early 1990s, coinciding with the recession of that time, fol-lowed by a strong peak in 1996 marking the ensuing recov-ery and increase in metal prices. This recovery in traditionalprecious- and base-metals exploration was also strongly aug-mented by the diamond exploration boom resulting from dis-coveries in the Northwest Territories. Expenditures started todecline again in 1997, due largely to the Asian economic cri-
49
Figure 37. Number of claims staked per year. (Source Appendix 4K)
Figure 38. Number of metres of diamond drilling per year. (Source Appendix 4K)

sis and falling metal prices, and bottomed out in 1999, sincewhich time they have been gradually recovering. The closerelationship between metal prices and exploration expendi-ture is evident from the similarity in the profiles for explo-ration expenditures in Figure 39 and metal prices in Figures22 and 23.
Newfoundland and Labrador expenditures are broadlycorrelated with the Canadian total, although obviously at amuch lower dollar level. The peak in Newfoundland andLabrador expenditures in the late 1980s was due, as else-where in the country, to gold exploration, whereas that in1995 was due almost entirely to the Voisey’s Bay discovery.The exploration rush following this discovery contributedabout 10% of the overall Canadian expenditure at that timeand reinforced the national boom resulting from increases inmetal prices and diamond discoveries. Newfoundland andLabrador expenditures appear to have bottomed in 2000 andare now recovering in parallel with the Canadian expendi-tures.
Figure 40 compares Newfoundland and Labrador expen-ditures (in year-2000 dollars) with those of other Canadianprovinces and territories for the 1989-2001 period (NaturalResources Canada, 2002). For most of this period, New-foundland and Labrador placed in the lower part of theexpenditure scale, however, it experienced a brief excursioninto the middle rankings following the mid-1990s Voisey’sBay discovery. This was also a time of boom exploration inOntario, Québec, British Columbia and the Northwest
Territories. Since then, Newfoundland and Labrador has fall-en back to its more traditional place in the lower part of theexpenditure rankings. The Province’s ranking with respect toother jurisdictions is shown more clearly in Figure 41, whichshows the average exploration expenditure for each provinceand territory over the 1989-2001 period as a percentage ofthe Canadian total. Again, this is based on year-2000 dollars.Newfoundland and Labrador averaged about 6% of theCanadian total during this period, the overall ranking, in as-cending order, being:
Québec 21.1%Ontario 20.5%Northwest Territories 14.9%British Columbia 15.4%Saskatchewan 7.3%Newfoundland and Labrador 5.5%Manitoba 5.4% Yukon 3.5%New Brunswick 2.0%Alberta 1.7%Nunavut 1.6%Nova Scotia 0.9%
Adequacy of Exploration Expenditures
The important question concerning exploration expendi-tures is whether they are adequate in the long term to replace,through new discoveries, the minerals that are being con-sumed through extraction. This question is difficult to answer
50
Figure 39. Canadian vs Newfoundland and Labrador exploration expenditures 1989 to 2002, in year-2000 dollars (SourceAppendix 4L). Note that the figures used by Natural Resources Canada for Newfoundland and Labrador are somewhat lowerthan those calculated by the Province. (Source Appendix 4K)

satisfactorily. Table 5 presents a summary of the approximateamount of metals that have been produced from the Provinceto date, versus the amount remaining in the various cate-gories of reserves and resources that may eventually (assum-ing an optimistic perspective) be mineable. This, therefore,provides some indication of how successful exploration hasbeen in maintaining the Province’s inventory of mineralresources, though it is far from a complete answer to thequestion of how much exploration is enough.
From Table 5, reserves of iron ore in western Labradorwould appear to be plentiful for the foreseeable future,assuming of course that existing ore grades and productscontinue to be economic. Consequently there has been littlelarge-scale grassroots exploration, although IOCC hasrecently commenced a re-examination of the westernLabrador iron-ore belt. Most exploration expenditures haveinstead been focused on base and precious metals. In the caseof base metals, the discovery of the Voisey’s Bay deposit hasadded major amounts of nickel and cobalt to the Province'sinventory and has also more than replaced its copper inven-tory; the deposit containing more than double the Province’stotal historical copper production. Reserves of lead and zinc,however, remain depleted. Duck Pond remains the only like-ly source of new production for these metals but does not
contain enough reserves to replace previous levels of produc-tion from the Buchans, Rambler and Daniel’s Harbourmines. With respect to precious metals, significant reservesof gold have been identified, however, much of these arecontained in small deposits, not all of which may be mine-able. Also, collectively these do not replace what has beenmined to date. Remaining silver resources are also small incomparison to past production. Considerable resources ofantimony (Beaver Brook) and zirconium–yttrium (StrangeLake) also exist but will probably require significant marketimprovements for development to commence.
The decline in provincial zinc, lead and precious-metalresources is very similar to that for Canada as a whole(Cranstone, 2003a, b), and is perhaps a sign that those com-modities have matured as exploration targets (i.e., the likeli-hood of new discoveries is diminishing). Canadian reservesof nickel have been declining but the Voisey’s Bay develop-ment, coupled with other recent discoveries, promises toreverse this trend (Natural Resources Canada, 2003). Copperfrom Voisey’s Bay will add to diminishing Canadian reservesof this metal but not to the amount needed to reverse the con-tinuing decline. The proportion of the world that is open formineral development has expanded considerably over thepast two decades and countries such as Canada face
51
Figure 40. Exploration expenditures for Newfoundland and Labrador vs other provinces and territories 1989 to 2002, in year-2000 dollars (Source Appendix 4L). Note that the figures used by Natural Resources Canada for Newfoundland and Labradorare somewhat lower than those calculated by the Province. (Source Appendix 4K)

increased competition for exploration dollars, particularly forcommodities such as base metals where they are perceived tobe mature exploration targets.
As a final note, it is important to remember that explo-ration continues and that declines in resources can veryquicky be reversed through new discoveries, or offset by dis-covery of new commodities (e.g., nickel and cobalt atVoisey’s Bay).
Table 6 summarizes the total production versus theremaining reserve picture for the major non-metallic com-modities. Existing operations based upon limestone,dolomite and gypsum appear to have sufficient reserves toallow current production to continue well into the future.Dimension stone and construction material reserves have notbeen shown in Table 6 due to lack of published data. As ageneral statement, however, it would appear that there areplentiful reserves of anorthosite, black granite and slate forthe Province’s three main producing operations at Nain,Jumpers Brook and Nut Cove.
Asbestos remains in small quantities at Baie Verte, butsince the resource would require underground mining, and as
markets continue to diminish due to health and environmen-tal concerns, it is doubtful if it will ever be mined. Fluorsparis still plentiful at St. Lawrence, however, it will take a sig-nificant price recovery or lower-cost mining method to allowproduction to resume. Considerable resources of gypsum,pyrophyllite and barite remain, however, recent productionhas been small-scale and sporadic. For many of the non-metallic minerals it is not the quantity or quality of theresource that is the problem, rather it is the distance frommarkets. Exploration for non-metals has therefore been a lesspressing matter than for metals.
A further measure worth considering, is the relationshipbetween a Province’s exploration expenditure and its grossvalue of mineral production. This is summarized in Table 7for the year 2000 (the most recent data available) and as anaverage for the period 1989-2000.
The higher values indicate jurisdictions that are attract-ing relatively large exploration expenditures in proportion totheir value of production, and the lower numbers the con-verse. Clearly, the Northwest Territories and Nunavut leadthe rankings for both the year 2000 and the historical period.This is by virtue of the recent overwhelming emphasis on
52
Figure 41. Average annual exploration expenditures 1989 to 2002 by Canadian provinces and territories as a percentage ofthe Canadian total. (Source Appendix 4L)

diamond exploration in Canada and the fact that these twoterritories are currently perceived to have the greatest geo-logical potential for this mineral. Newfoundland andLabrador ranks fourth-highest in terms of the ratio for theyear 2000, and fifth for the historical period. This says noth-ing about whether the amount of exploration expenditure inNewfoundland and Labrador is sufficient to sustain a healthymining industry in the long term, however, it does indicatethat at a national level, the Province is doing reasonably wellin attracting a proportional share of exploration funds.
Following the recent announcement that the Voisey’sBay project is to proceed, it is to be expected that the pre-development and on-going underground exploration expen-ditures associated with this project will result in a further risein provincial exploration expenditures. The recent recoveryin gold prices will also continue to drive higher levels ofexploration expenditure in insular Newfoundland.
Summary
• Exploration expenditures have been strongly cyclicalshowing peaks in late 1950s-early 1960s (iron), the late1980s (gold) and mid 1990s (nickel). The most recentcycle has been a downturn that seems to have bottomedin 1999-2000. Expenditures are now increasing and thecurrent level of $44 million is above the historical aver-age of $35 million (in year-2000 dollars).
• Claim staking is also increasing following a low in 1999and the current level of 33 000 claims is well above thehistorical average. Current diamond drilling at ca. 51000 metres per year is below the historical average butappears to be increasing, along with other explorationindicators, into 2002.
• In comparison with total Canadian exploration expendi-tures, the Province has shown a similar expenditure pro-
53
Table 5. Production to Date vs Remaining Resources – Metallic commodities
Metal Produced Remaining Resources*to Date Source of (millon tonnes of Source of remaining
Commodity (million tonnes) Production (contained metal) Resources
Iron 840 Mt Wabana, Wabush, +3000 plus Mt Labrador City, WabushSchefferville, Labrador City
Copper 0.42 Mt Notre Dame Bay mines, 1.4 Mt Voisey’s Bay, Duck Pond,Rambler, Buchans Rambler
Zinc 3.2 Mt Rambler, Buchans, 0.4 Mt Duck PondDaniel’s Harbour
Lead 1.22 Mt Rambler, Buchans .07 Mt Duck Pond
Gold 65 tonnes Hope Brook, Buchans, 41 tonnes Cape Ray, Stog’er Tight,Rambler, Nugget Pond Pine Cove, Deer Cove,Hammer Down Duck Pond and other base
metal deposits
Silver 2100 tonnes Rambler, Buchans 414 tonnes Duck Pond, Cape Ray
Nickel minimal Tilt Cove 2.2 Mt Voisey’s Bay
Cobalt 0 0.1Mt Voisey’s Bay
Antimony 1000 tonnes Beaver Brook 0.08 Mt Beaver Brook
Zirconium 0 1.5 Mt Strange Lake
Yttrium 0 0.2 Mt Strange Lake
*The term Resources includes all reserves and resources (including geological resources) that, from an optimistic present-dayperspective, may at some future point be mineable.+ Excludes Wabush reserves, which were unavailable at time of writing.

54
Table 6. Production to Date vs Remaining Resources – Non-metallic minerals
* AmountProduced to Date Source of Remaining Resources* Source of remaining
Commodity (million of tonnes) Production (millon of tonnes Resources
Asbestos 1.3 Mt mineral fibre Baie Verte ~0.1 Mt mineral fibre Baie Verte
Limestone 10 Mt rock Aguathuna, Cobbs Arm, 1030 Mt chemical Lower Cove, Aguathuna,Lower Cove grade rock Cobbs Arm, Port au Port,
Coney Arm
900 Mt aggregate rock Lower Cove
Dolomite 3 Mt rock Lower Cove 590 Mt chemical- Lower Cove, Port au Port(NF only) grade rock Peninsula, Great Northern
Peninsula deposits
Fluorspar 3 Mt mineral St. Lawrence 3 Mt mineral St. Lawrence
Gypsum 17 Mt mineral Flat Bay, Fischells, 16 Mt+ mineral Fischells, Coal BrookCoal Brook
Pyrophyllite ~0.3 Mt mineral Manuels 1.7 Mt mineral Manuels
Barite 0.02 Mt mineral Colliers 0.5 Mt mineral Buchans tailings
* Use of the term rock or mineral in these columns indicates whether the amount is for raw ore, or the contained mineral prod-uct (calculated from published grades).The term Resources includes all reserves and resources that, from an optimistic present-day perspective, may at some futurepoint be mineable.
Table 7. The ratio of exploration expenditures to the gross value of mineral productionfor each Canadian province and territory for the year 2000 and as an average for theperiod 1989-2000
Exploration Average ExplorationExpenditure x 1000/ Expenditure x 1000/Value of Production, Average Value of
Province/Territory for year 2000 Production, 1989-2000
Nunavut 10.8 10.4Northwest Territories 5.7 13.4Manitoba 2.3 2.8Newfoundland and Labrador 1.9 3.2Yukon 1.5 6.8Québec 1.5 3.7British Columbia 1.5 4.3Saskatchewan 1.4 2.2Ontario 1.4 2.0Nova Scotia 1.3 2.7New Brunswick 1.1 1.2Alberta 0.9 1.9Total Canadian 1.8 3.2

file with peaks in the late 1980s and mid 1990s. BothCanadian and provincial expenditures have declinedsince 1996 but are now emerging from a cyclical troughthat reached its depth in 1999-2000.
• The Province’s share of national exploration expendi-tures has remained fairly stable throughout the lastdecade or so and appears to have returned to normal lev-els following the distortion of the Voisey’s Bay boom.The Province accounted for an average of 6% of totalCanadian exploration expenditures over the 1989-2001period and ranked 6th highest amongst other provincesand territories.
• With respect to status of remaining resources: reservesof iron ore are sufficient for the foreseeable future; sig-nificant new reserves and resources have been discov-ered for nickel, cobalt and copper; resources of zinc,lead, gold and silver are in significant decline.
• Resources of industrial minerals currently in productionare adequate for the foreseeable future. Increased pro-duction will probably depend more on increased demandthan additional discoveries.
• The Province’s share of exploration expenditure is verysimilar to its share of the value of national mineral pro-duction. In terms of the ratio of exploration expenditureto value of production, the Province ranks 4th highest inCanada. Therefore, by national standards at least, theProvince seems to be doing comparatively well atattracting exploration dollars in proportion to the size ofits mining industry.
• The development of the Voisey’s Bay project will resultin a further rise in provincial exploration expenditures,as may the renewed gold exploration in insularNewfoundland.
ACKNOWLEDGMENTS
This work owes much to the dedicated work by staff,past and present, of the Mineral Development and MineralLands divisions of the Newfoundland and Labrador Depart-ment of Mines and Energy. These persons compiled andmaintained the bulk of the statistics used in this review andtheir assistance was indispensable. Lew Higdon in particularis thanked for his tolerance and assistance in delving throughdusty records for long-forgotten files. Don Cranstone ofNatural Resources Canada is thanked for his provision ofGDP and Canadian mineral production data. Draft versionsof the manuscript were reviewed by Don Cranstone, LewHigdon, John Fleming and Allister Taylor, all of whom made
critical improvements to the final product. Errors of fact andomission no doubt remain but these are solely the responsi-bility of the author.
REFERENCES
Annual Reports of the Commission of Government1932 to 1945: Yearly reports published by His Majesty'sStationary Office, United Kingdom (series of individualannual reports housed in the Legislative Library, Con-federation Building).
Boyd, B. and Perron, L.1997: Iron Ore 2000. Minerals and Metals Sector,Natural Resources Canada, 128 pages.
Canadian Minerals Yearbooks1949 to 2001: Natural Resources Canada, Minerals andMetals Sector, Canadian Minerals Yearbooks, Statisticssection. Recent years are available at http://www.nrcan.gc.ca/mms/cmy/index_e.html
Cranstone, D.2003a: Canada’s Historical Mineral Production. InCanadian Minerals Yearbook, 2001, Natural ResourcesCanada, Minerals and Metals Sector, pages 8.1-8.18,http:// www.nrcan.gc.ca/mms/cmy/content/2001/hist_e.pdf
2003b: A History of Mining and Mineral Exploration inCanada and Outlook for the Future. Natural ResourcesCanada, Minerals and Metals Sector, Special Report,http://www.nrcan.gc.ca/mms/topi-suje/hist_e.htm
Customs Returns1931 to 1949: A series of annual reports published by theKings Printer, St. John’s, for the period 1931 to 1949.The most complete holdings of these documents are inthe Centre for Newfoundland Studies, the QueenElizabeth Library, Memorial University of Newfound-land, St. John’s, Newfoundland and Labrador.
Dempsey, E.1999: Keeping pace with the European Market. NorthAtlantic Minerals Symposium. Edited by G.A. Stanley.Extended Abstracts Volume, pages 53-56. Availablefrom Geological Survey of Ireland, Beggars Bush,Haddington Road, Dublin 4, Ireland.
Gibbons, R.V. and Mercer, N.1982: Mining in Newfoundland and Labrador: from1949 to 1982. The Canadian Institute of Mining andMetallurgy Directory, p.1-12.
55

Goundrey, G.K., Maher, W.H. and Martin, L.A.1974: Report of the Royal Commission on MineralRevenue. Report to the Lieutenant Governor ofNewfoundland, 103 pages.
Inco2003: Inco Limited completes bankable feasibility studyfor Mine/Concentrator as part of initial phase of Voisey’sBay project. News release, Inco Ltd., March 2003.http://www.inco.com/MediaCentre/ News/default.asp
Johnston, D.1973: Report on Mineral Land Tenure in Newfoundland- Labrador. Unpublished report to the MineralDevelopment Division, Department of Mines andEnergy, Government of Newfoundland, 128 pages.
Kelley, T.D. and Jorgenson, J.D.2002: Iron Ore Statistics. In T. Kelly, D. Buckingham, C.Di Francesco, K. Porter, T. Goonan, J. Sznopek, C.Berry and M. Crane. Historical Statistics for MineralCommodities in the United States. U.S. GeologicalSurvey Open-File Report (also available as 01-006http://minerals.usgs.gov/minerals/pubs/of01-006/version 5.9).
Kelly, T., Buckingham, D., Di Francesco, C., Porter, K.,Goonan, T., Sznopek, J., Berry, C., and Crane, M.
2001: Historical Statistics for Mineral Commodities inthe United States. U.S. Geological Survey Open-FileReport (also available as 01-006http://minerals.usgs.gov/minerals/pubs/of01-006/version 5.9).
2002: Historical Statistics for Mineral Commodities inthe United States. U.S. Geological Survey Open-FileReport 01-006 (on-line only, available as 01-006http://minerals.usgs.gov/minerals/pubs/of01-006/version 6.4).
Kirk, T.2002: Iron Ore. United States Geological Survey website, Special Publications, Metal Prices in the UnitedStates through 1998, http://minerals.usgs.gov/minerals/pubs/commodity/iron_ore/340798.pdf
Martin, W.1983: Once Upon a Mine: Story of Pre-ConfederationMines on the Island of Newfoundland. Harpell’s PressCooperative, Ste-Anne-de-Bellevue, Québec; reprinted1998 by the Canadian Institute of Mining andMetallurgy as Special Volume 26, 97 pages.
McKillop, J.H., Elver, R., Lukins, F., Ross, B., Fleming, J.,MacDonald, D., Spracklin, L., Kipnis, N., Robertson, A.,Watson, D. and Magyar, W.B.
1973: Mineral Resource Management, A NewApproach, report of the Study Group on Mining. Con-fidential report to the Planning Task Force of the CabinetPlanning Committee, Government of Newfoundland.
Murray, A. and Howley, J.P.1909: Reports of the Geological Survey of Newfound-land from 1881-1909; St. John’s, Newfoundland,Robinson and Company Ltd., Press, 1918, 725 p. Alsoavailable as Newfoundland Department of Mines andEnergy, Geological Survey Open File Nfld 652.
Natural Resources Canada2002: Overview of Trends in Canadian Mineral Explor-ation, 2001 issue. Natural Resources Canada, Mineralsand Metals Sector.
2003: Overview of Trends in Canadian Mineral Explor-ation, 2002 issue. Natural Resources Canada, Mineralsand Metals Sector.
Newfoundland and Labrador Department of Mines andEnergy
2002: Reviews of mining activity. Department of Minesand Energy, Government of Newfoundland andLabrador. http://www.gov.nf.ca/mines&en/MiningIndustryOverview-Nov.htm
2003: Reviews of mining activity. Department of Minesand Energy, Government of Newfoundland andLabrador. http://www.gov.nf.ca/mines&en/MiningIndustryOverview-Nov.htm
2003: Statistics, http://www.gov.nl.ca/mines&en/statis-tics/
Newfoundland and Labrador Statistics Agency2003: Tables for Gross Domestic Product at Basic Pricesby Industry, (http://www.nfstats.gov.nf.ca/ Statistics/)
Singer, D.A.1995: World Class Base and Precious Metal Deposits -A Quantitative Analysis. Economic Geology, Volume90, pages 88-104.
Snelgrove, A.K., revised and rewritten by Baird, D.M.1953: Mines and Mineral Resources of Newfoundland,Department of Mines and Resources, Mines Branch,
56

Geological Survey, Information Circular no. 4. Availableas Newfoundland and Labrador Department of Minesand Energy, Geological Survey Geofile NFLD 78, 149pages.
Snelgrove, A.K.1938: Geology of Gold Deposits of Newfoundland.Department of Natural Resources, Geological Section,St. John’s. Available from the Newfoundland andLabrador Department of Mines and Energy, GeologicalSurvey Division, Geofile No. NFLD/0035.
1938: Mines and Mineral Resources of Newfoundland,Newfoundland Department of Mines and Energy,Newfoundland and Labrador Geological Survey,Information Circular, no. 04, 170 pages. Geofile No.NFLD/0045
Sullivan, D.E., Sznopek, J.L. and Wagner, L.A.2000: 20th century mineral prices decline in constant dol-lars. U.S. Department of the Interior, U.S. GeologicalSurvey Open File Report 00-389 (Also available athttp://pubs.usgs.gov/openfile/of00-389/of00-389.pdf).
Swinden, H.S.1993: The impact of provincial government geoscienceprograms on mineral, petroleum and industrial develop-ment and land-use planning in Newfoundland andLabrador. Government of Newfoundland and Labrador,Department of Natural Resources, Geological SurveyDivision, Open File NFLD/2254, 63 pages.
57

ca. 4000 BC Maritime Archaic Indians mine chert fromnorthern Labrador, followed by the DorsetEskimo who quarry soapstone near Baie Verteon the Island of Newfoundland. Both culturesdevelop extensive coastal trading networks forthese minerals.
ca. 1000 AD The Vikings settle in northeastern Newfound-land and mine some bog iron ore near theirsettlement of L’Anse aux Meadows.
1500-1860 European settlers notice the potential mineralresources of Newfoundland but recorded min-ing does not occur until 1779, when the short-lived Shoal Bay Mine on the Avalon Peninsulastarts. This is followed by a number of ven-tures between 1855 and 1860 around theAvalon Peninsula and Notre Dame Bay areas,none of which achieve success.
1839-40 The first geological survey of Newfoundlandis undertaken by J.B. Jukes.
1857 Copper is discovered at Tilt Cove in NotreDame bay leading to the Province’s first com-mercially successful mine in 1864 and ushersin the Newfoundland copper boom. This peaksin the 1880s and finally expires ca. 1913. Theperiod sees the development of several suc-cessful mines in the Notre Dame Bay area,notably Little Bay, Betts Cove and Pilley’sIsland and a host of smaller short-lived opera-tions. During this time, Newfoundland is for awhile the sixth largest producer of copper inthe world.
1860 The quarrying of roofing slate near Trinitystarts an industry that is to last to 1910. Also inthe Trinity area, brick making commences in1866, starting a small industry that is to supplythe domestic market intermittently until 1999.
1864 The Tilt Cove copper mine opens and runsuntil its closure in 1917.
1864 The first systematic geological investigationsbegin with the inauguration of the GeologicalSurvey of Newfoundland under the director-ship of Alexander Murray.
1878 The Little Bay copper mine is opened andfinally closes in 1904.
1882 Limestone quarries are developed at CobbsArm, Notre Dame Bay, and provide a long-term source of lime for agricultural and indus-trial uses that last intermittently to 1966.
1892 Just as the copper boom is waning, a new min-ing industry springs to life with the discoveryof iron ore on Bell Island. Although thisresource had been noted in the early 17th cen-tury, it is not until now that its full potential isrealized. The discovery leads to the develop-ment, starting in 1894, of the Wabana miningoperations by the Scotia and then Dominioncompanies. These companies later merge in1921 as the British Empire Steel Corporation(BESCO), which in 1930 comes under thecontrol of the Dominion Steel and CoalCompany (DOSCO). Throughout their lives,these mines ship primarily to the Cape Bretonsteel plants but also periodically to Europeanmarkets. The operation closes in 1966 follow-ing a prolonged period of decline when steel-making plants began to demand ore with alower phosphorous content.
1897 The construction of the Newfoundland rail-way by the Reid Newfoundland Companyopens the interior of the Island to exploration.Initial interest is focused on the timber poten-tial, however, this soon spread to minerals.Railway construction leads to interest in coaldiscovered in western Newfoundland, whichis worked sporadically and with little successuntil 1929. The railway also requires the open-ing of a number of dimension-stone quarriesacross the Island that also become sources ofbuilding material for urban centres.
1900-05 The Sops Arm (Browning) and thenGoldenville mines, Newfoundland’s first goldmines, are developed but close by 1906 due tolack of adequate capital.
1905 Copper, lead and zinc mineralization is dis-covered at what is to become the Buchansmine site. Metallurgical difficulties preventfurther development at the time – see below.
1913 The Dominion Company opens the Aguathunaquarry on the west coast of Newfoundland tosupply limestone as a flux to the Cape Bretonsteel plants. This operation closes in 1967 due
58
APPENDIX 1: AN ENCAPSULATED HISTORY OF MININGIN NEWFOUNDLAND AND LABRADOR

to the discovery of more proximal resources inCape Breton.
1913 The copper boom finally ends, a demise duepartly to poor management – many minesbeing high-graded during market lows – butalso to competition from new and cheapersources of copper from large open-pitresources in Spain, the southwest USA andChile. A plunge in copper prices followingWorld War I provides the coup de grace.
1928 The Buchans mining operation is started bythe American Smelting and RefiningCompany (ASARCO) following the develop-ment of new techniques for processing thecomplex ores. Discovery of new ore bodiesprovides the basis for a mining operation thatlasts without interruption until the ore bodiesare exhausted and the mines close in 1984.
1933 Mining of fluorspar commences at St.Lawrence on the south coast of Newfound-land. This leads to the creation of two miningoperations by the St. Lawrence Corporationand the American Newfoundland FluorsparCorporation. The latter is later sold to theAluminium Company of Canada (ALCAN),which eventually acquires the assets of bothmining operations. The fluorspar ore is usedmostly as a flux in aluminum smelting. Themines close in 1978 due to competition fromcheaper Mexican ore. Despite a brief andunsuccessful attempt to resume mining in themid 1980s, the deposits have remained inac-tive.
1936 The Newfoundland Government grants a con-cession to the Labrador Mining and Explor-ation (LME) company to begin investigationof the iron deposits that had been reported byearly explorers in western Labrador. LME isacquired in 1942 by Hollinger ConsolidatedGold Mines Ltd with minority participation bythe M.A. Hanna Company of Cleveland – aprominent US iron mining company. LME,together with its sister company in Québec –the Hollinger North Shore Exploration compa-ny – proceeds to explore the concession areaand rapidly identifies the Knob Lake (nowSchefferville) area as a major iron-oreresource.
1950 Development of the Knob Lake iron depositsin Labrador proceeds rapidly and sees the con-
struction of the 588-km-long QNS&L railwayfrom Sept-Îlse to Knob Lake (now Scheffer-ville) on the Québec-Labrador border.
1951 The Flat Bay gypsum mine opens, initiallyunder Government control (Atlantic GypsumLtd.) but later under the ownership ofFlintkote Canada, to supply material for wall-board construction. The operation is later soldto Domtar Limited in 1987 and is officiallyclosed in the same year. However, the opera-tion continued to operate intermittently until1994.
1952 The North Star cement company opens quar-ries in the Corner Brook area. This is a govern-ment-sponsored venture that is later privatizedand does not close until 2000 when changes inmarket demand render it uneconomic.
1954 Mining of the Knob Lake iron deposits com-mences under the control of the Iron OreCompany of Canada, a private companyowned by a number of US and Canadian steelcompanies, including the M.A. Hanna corpo-ration and operating on LME leases. By 1958,four mines are in production and numerousother potential deposits identified. Productionlasts until 1983 when the operation closes dueto changes in steelmaking techniques and mar-ket demand. Production from stockpiles con-tinues for some time after closure.
1957 The Tilt Cove mine is reactivated using mod-ern bulk mining techniques to extract previ-ously uneconomic, low-grade ore. The opera-tion closes in 1967.
1957 A pyrophyllite mine is developed at Manuelson the Avalon Peninsula by NewfoundlandMinerals, a division of Armstrong WorldIndustries. The product is shipped to theUnited States for use in ceramic tiles. Themine closes in 1996.
1961 Discoveries of iron ore by LME in southwestLabrador lead to the development of the CarolProject by the Iron Ore Company of Canada(IOCC) and the construction of the town ofLabrador City.
1961 The Little Bay copper mine in Notre DameBay is reactivated to exploit remaining bulkore reserves. The mine closes in 1969.
59

1962 Production of iron ore by IOCC starts at CarolLake in 1962. Ore is shipped to the port ofSept-Îlse using a rail spur to connect to theQNS&L railway. This operation has remainedin production to the present day.
1963 The Baie Verte asbestos mine opens in north-east Newfoundland. Operated initially byAdvocate Mines Ltd. and then Baie VerteMines Ltd. The mine falters in 1981 asasbestos markets diminish and finally closesin 1987 after several changes of ownership.
1964 The Rambler copper–lead–zinc deposits arebrought into production by ConsolidatedRambler Mines Ltd. This operation lasts until1982.
1965 The Canadian Javelin Company, operating ona concession granted to the Newfoundland andLabrador Company Ltd. (NALCO), developsthe Wabush iron mining operation and town-site of Wabush (adjacent to Labrador City) insouthwestern Labrador. This operation hasremained in production to the present day.
1965 The Whalesback copper mine is opened by theBritish Newfoundland Exploration Company(BRINEX) in the Notre Dame bay area. Themine lasts until 1972.
1967 The Gullbridge (Gull Pond) copper mineopens, and closes in 1971.
1968 The Villa Marie silica mine, operated by theDunville Mining Company, is opened to sup-ply raw silica to the ERCO phosphorous plantat Long Harbour, southeast Newfoundland.The operation is phased out in 1988 followingclosure of the phosphorous plant.
1975 The Daniel’s Harbour zinc deposit on the westcoast of Newfoundland enters productionunder the control of Newfoundland ZincMines Limited. It closes in 1990.
1987 The Hope Brook gold mine is opened by BPMinerals Ltd. The operation experiences tem-porary closure in 1991-92, and is later operat-ed by Royal Oak Mines Ltd., prior to itsexhaustion in 1997.
1990 A limestone aggregate operation is developedat Lower Cove in western Newfoundland.This is later taken over by Atlantic Minerals
Limited who change the focus of production tohigh-purity limestone and dolomite, chieflyfor use in the iron and steel industry. The oper-ation is still in production.
1992 The Nut Cove slate deposit of Trinity Bay,eastern Newfoundland is opened to produceroofing slate for European and US markets.The operation subsequently closes butresumes production in 2001 as the HurleySlateworks Company.
1993 The Ten Mile Bay quarry near Nain in north-ern Labrador is opened for the production oflabradorescent anorthosite, primarily forexport to Italy. The operation expands in 2001-02 and remains in production.
1994 The Voisey’s Bay nickel–copper–cobaltdeposit is discovered in 1994 by ArcheanResources Ltd., generating a huge explorationboom in Labrador, which peaks in 1996, andresults in record exploration expenditures. Thedeposit is later acquired by Inco Ltd. and ispresently scheduled for production by 2005.
1996 The International Granite corporation beginsproducing black granite for use in the monu-ment industry from its Jumpers Brook quarryin central Newfoundland. The operationremains in production.
1997 The Nugget Pond gold deposit in northeasternNewfoundland is brought into production byRichmond Mines Inc. The ore runs out in 2001and production is shifted to the HammerDown deposit (below).
2001 The Hammer Down gold deposit of northeastNewfoundland, owned by Richmond MinesInc., enters production.
2001 The Duck Pond copper–zinc–lead deposit ofcentral Newfoundland, owned by ThunderminResources Inc. passes final feasibility studyand is sold to Aur Resources Inc. It currentlyawaits a development decision.
2001 Epoch Stone constructs a dimension-stoneprocessing plant at Argentia on the AvalonPeninsula that begins production in 2002. Theplant is designed primarily to handle largeblocks of imported stone but may also servelocal producers.
60

1865-1906. Taken from the compendium of GeologicalSurvey of Newfoundland reports by Murray and Howley(1909). This includes two types of data table. One type,which is used as the basis for this report, gives the value ofproduction reported by the mining operation. The secondtype (not used) lists the probable value of the mineral prod-ucts when sold on the world market. For metals this would bethe price for the finished product after smelting and refining.There are significant differences between the two datasets. Anotable example concerns gold, which is not listed as one ofthe commodities produced in Newfoundland, but which wasrecovered from Notre Dame Bay copper ores and from theBuchans ores when smelted abroad.
1907-1949. From the Customs Returns. Until 1930,these reports were published in the appendices of the annualJournals of the (Newfoundland) House of Assembly (avail-able at the Newfoundland and Labrador Legislative Libraryand the Provincial Archives of Newfoundland and Labrador),except for the years 1907-08 when the reports were pub-lished separately. For the years 1917 to 1930, mineral pro-duction data are also listed in reports by the Department ofMines and Agriculture, also incorporated into the JournalAppendices. There is, however, a remarkable variancebetween the two sets of reports. Whereas the Agriculture andMines data seem to have been derived from direct reportsfrom mining operations, the Customs Returns were basedupon assessments of mineral exports. There is no systematicvariation between the two datasets – each may exceed theother with a variance of as much as 130% in some years.Limestone in particular tends to be more consistently under-reported in the customs returns, sometimes by factors of up
to 12 times. The Customs Returns are also restricted to mate-rial exported from Newfoundland. This covered the mainmineral producers such as the Notre Dame Bay mines,Wabana, Aguathuna, St. Lawrence and Buchans, but did notinclude materials such as stone, brick, sand and gravel andsome amounts of limestone that were produced for domesticconsumption. For the sake of their consistency and greateravailability, the Customs Returns rather than the Departmentof Agriculture and Mines figures have been used in thisreport, however, the potential inaccuracies should be bornein mind. Howley, (page 387 in Murray and Howley, 1909)notes that Newfoundland was unusual at the time in not hav-ing legislation requiring the submission of mineral produc-tion data and caustically refers to the “inutility” (useless-ness!) of the customs data. Nevertheless, these are all that isavailable for the greater part of this period. From 1930onwards, the Customs Returns were published independent-ly as annual reports. Data for the years 1935-38 are alsoavailable in summary form in the Annual Reports of theCommission of Government. Note that data for 1943 wereonly reported for nine months and for this report have beenscaled up by 33% to give an assumed annual value of pro-duction.
A problem arises with precious metals values for thepre-confederation period. The Customs Returns data do notseem to include this, so Figure 10 may understate the realvalue of mineral production from Newfoundland at this time.However, the historical value calculations for individualoperations, notably Tilt Cove, Little Bay and Buchans(Figures 24, 25 and 27; Appendix 4F) include estimates forgold and silver production.
61
APPENDIX 2: SOURCES OF PRE-CONFEDERATION DATA

Constant dollars are those reported in terms of the valuethey had on a previous date. Constant dollars, therefore, havecomparable purchasing power in different time periods. Theadjustment from current dollars is done through use of adeflator series that removes the effect of inflation. There aretwo main types of deflator series used:
• The Consumer Price Index (CPI). This is an indexmaintained by the federal government that approxi-mates the changes in average prices through meas-urement of the annual changes in the cost of a bas-ket of common consumable goods and services. Asimilar price index is maintained by the USGovernment.
• The Gross Domestic Product (GDP). This measureschanges in total domestic economic activity andreflects both growth in the economy and pricechanges (inflation). When used as a deflator, theGDP is a measure of changes in the price of inputsinto the economy – essentially wages and profits. Itscoverage is therefore wider than the CPI.
The CPI index has been used for most of the deflationcorrections in this document. However, since the CPI onlyextends back as far as 1914, a GDP deflator was used for thefull range of historical data. The GDP deflator series wasmade available courtesy of Donald Cranstone of NaturalResources Canada and is in part based upon earlier work byDan Cavanagh, also of Natural Resources Canada. Thisindex extends as far back as 1867, hence this date is used asthe starting point for historical analysis (although actual pro-duction data are available from 1865). Test comparisons of
the CPI and GDP deflators on 1949-2000 Gross Value ofMineral Production data produced slightly different resultson a year to year basis, the CPI generally yielding slightlyhigher values than the GDP, particularly in the high-inflationyears between 1970 and 1983. However, over long periods oftime there is little difference between the two sets of results.
Adjustment of a current-dollar value is made by thesame calculation regardless of whether the CPI or GDPdeflator is used, namely:
Adjusted value for year x = Current value for year xmultiplied by (index year y / index year x)
Where year x refers to the year for which the compar-isons are to be indexed, year y is the year to which the dollarcomparison is to be made, and index is either the CPI orGDP. Thus, as an example, to adjust a value of $100 in 1986dollars to the equivalent in year-2000 dollars, the calculationwould be:
Adjusted dollar value for 2000 = 100 1986 dollars mul-tiplied by (index for year 2000/index for year 1986)
Using the CPI series in Appendix 4B:
= 100 (4.4505 /3.1350 )
= $141.96
All adjustment in this report, except where noted other-wise, has been made in terms of year-2000 dollars.
62
APPENDIX 3: DEFINITION AND CALCULATION OF CONSTANT-DOLLAR VALUES

63
APPENDIX 4: STATISTICAL INFORMATION
Appendix 4A. Duration of Newfoundland and Labrador mining operations to 2001. Note: Company name only refers to themajor operators; Opening Date may vary in historical records depending on whether the commencement of mine developmentor the date of first commercial shipment is used, similarly Closure Date may vary according to whether cessation of mining orcessation of shipments from stockpiles is quoted. The notation ‘2’ as in ‘Tilt Cove 2’ refers to a re-opened operation. Minorshut-downs or closures are not indicated. Bolded names are the major mining operations used in the historical analysis depict-ed in Figure 24. Source; unpublished records of the Newfoundland and Labrador Department of Mines and Energy.
Opening Closure DurationCompany Name Location Commodity Date Date (years)
Newfoundland Slate Company Nut Cove, Random Sound; Slate 1860 1910 50Trinity Bay
Tilt Cove Copper Co. Tilt Cove copper 1864 1917 53Betts Cove Mining Co. copper 1875 1883 8Newfoundland Consolidated Copper Mining Co. Little Bay copper 1878 1904 26Newfoundland Lime Manufacturing Co. Cobbs Arm limestone 1882 1966 84Brick and Tile Manufacturing Co. Trinity Bay brick 1866 1999 133Trinity Bay Brick Products (intermittent)Standard Pyrites Co. Pilleys Island pyrite 1886 1908 22Scotia and Dominion Cos., Dominion Wabana (Bell Island) iron ore 1894 1966 72Steel and Coal Co. (DOSCO)Reid Co. various granite 1898 1901 3Dominion Steel and Coal Co. (DOSCO) Aguathuna limestone 1913 1967 54American Smelting and Refining Co. Ltd. (ASARCO) Buchans base metals 1928 1984 56St Lawrence Corp., Newfoundland Fluorspar, St. Lawrence fluorspar 1933 1978 45Aluminum Co. Of Canada (ALCAN)Domtar Inc. Flat Bay gypsum 1951 1994 43North Star Cement Ltd. Corner Brook shale, limestone 1952 2000 48Iron Ore Company of Canada Schefferville (Knob Lake) iron ore 1954 1983 29Atlantic Coast Copper Corp. Ltd. Little Bay2 copper, gold 1961 1969 8First Maritimes Mining Corp. Ltd. Tilt Cove2 copper, gold 1957 1967 10Armstrong World Industries Canada Ltd. Manuels pyrophyllite 1957 1996 39Iron Ore Company of Canada Labrador City iron ore 1962 ongoing 39Wabush Mines Wabush iron ore 1965 ongoing 36Advocate Mines Ltd. Baie Verte asbestos 1963 1987 24British Newfoundland Exploration Co. (BRINEX) Whalesback (Springdale) copper 1965 1972 8Consolidated Rambler Mines Rambler (Baie Verte) base metals 1964 1982 18Gullbridge Mines Ltd. Gull Pond copper 1967 1971 4Dunville Mining Company Ltd. Villa Marie silica 1968 1988 20Green Bay Mining Ltd. Little Deer copper 1974 1974 <1Newfoundland Zinc Mines Ltd. Daniel’s Harbour zinc 1975 1990 15Newfoundland Resources and Mining Co. Ltd., Lower Cove limestone 1990 ongoing 11Atlantic Minerals Ltd. dolomiteIron Ore Company of Canada Leila Wynne (Wabush) dolomite 1986 ongoing 15Hope Brook Gold Inc., Royal Oak Mines Inc. Hope Brook gold, copper 1987 1997 10Newfoundland Slate Inc., Hurley Slateworks Nut Cove slate 1992 2001 9Torngait Ujaganniavingit Corp. Ten Mile Bay (Nain) anorthosite 1993 ongoing 8International Granite Jumpers Brook (Mt. Peyton) gabbro 1996 ongoing 5Hi-Point Industries (1991) Ltd. Bishops Falls peat 1982 ongoing 19Richmont Mines Inc. Nugget Pond gold 1997 2001 4Lafarge Gypsum Canada Ltd. Fischells Brook gypsum 1999 2001 2Galen Gypsum Mines Ltd. Coal Brook gypsum 1999 ongoing 2Shabogamo Mining & Exploration Inc. Roy’s Knob (Labrador City) silica 1999 ongoing 2Richmont Mines Inc. Hammer Down gold 2001 ongoing <1

Appendix 4B. Gross Value of Newfoundland and Labrador Mineral Production (GVMP), plus Mining Tax and Royaltiesrevenue, 1865 - 2002
Year *GVMP in current $
**GDP deflation index
**GVMPin year-2000 $, using GDP deflator
***Mining Tax & Royalties in
current $
Mining Tax & Royalties in year-2000
$, using GDP
deflator
****Canadian Consumer Price Index
(CPI) deflator
GVMPin year-2000 $, using CPI deflator
Mining Tax and Royalties in year-2000 dollars using CPI deflator
1865 $98,496
1866 $25,742
1867 $2,610 0.3236 $48,609
1868 $8 0.3232 $149
1869 $110,108 0.3256 $2,038,059
1870 $176,352 0.3219 $3,301,731
1871 $45,724 0.3285 $838,863
1872 $591,120 0.3653 $9,752,328
1873 $197,955 0.3665 $3,255,178
1874 $125,952 0.3493 $2,173,145
1875 $382,426 0.3354 $6,871,739
1876 $622,060 0.3146 $11,916,696
1877 $1,265,828 0.2982 $25,582,876
1878 $823,998 0.2765 $17,960,289
1879 $555,890 0.2667 $12,561,692
1880 $411,680 0.2917 $8,505,614
1881 $547,020 0.2941 $11,209,610
1882 $468,576 0.2944 $9,592,340
1883 $256,796 0.2955 $5,237,368
1884 $104,817 0.2733 $2,311,396
1885 $102,420 0.2581 $2,391,548
1886 $246,150 0.2620 $5,661,450
1887 $177,464 0.2674 $4,000,039
1888 $854,226 0.2781 $18,513,706
1889 $421,210 0.2781 $9,128,917
1890 $306,247 0.2834 $6,512,082
1891 $632,140 0.2834 $13,441,920
1892 $984,027 0.2620 $22,632,621
1893 $847,736 0.2674 $19,107,969
1894 $743,596 0.2460 $18,218,102
1895 $666,562 0.2406 $16,693,675
1896 $824,440 0.2353 $21,116,906
1897 $540,272 0.2406 $13,530,812
1898 $609,630 0.2513 $14,618,149
1899 $969,637 0.2567 $22,766,269
1900 $742,491 0.2620 $17,077,293
1901 $1,188,291 0.2620 $27,330,693
1902 $1,217,686 0.2781 $26,391,002
1903 $1,280,525 0.2834 $27,229,277
1904 $1,352,619 0.2834 $28,762,295
1905 $1,367,890 0.2941 $28,029,310
1906 $1,458,017 0.2995 $29,342,592
1907 $1,358,260 0.3209 $25,512,650
1908 $1,458,067 0.3209 $27,387,358
1909 $1,190,527 0.3262 $21,995,474
1910 $1,369,828 0.3262 $25,308,134
1911 $1,555,943 0.3369 $27,834,091
1912 $1,319,389 0.3583 $22,193,305
1913 $1,497,860 0.3422 $26,376,378
1914 $1,551,782 0.3583 $26,102,363
1915 $690,614 0.3797 $10,962,281
1916 $1,034,831 0.4545 $13,720,642
64

Appendix 4B. Gross Value of Newfoundland and Labrador Mineral Production (GVMP), plus Mining Tax and Royaltiesrevenue, 1865 - 2002
Year *GVMP in current $
**GDP deflation index
**GVMPin year-2000 $, using GDP deflator
***Mining Tax & Royalties in
current $
Mining Tax & Royalties in year-2000
$, using GDP
deflator
****Canadian Consumer Price Index
(CPI) deflator
GVMPin year-2000 $, using CPI deflator
Mining Tax and Royalties in year-2000 dollars using CPI deflator
1917 $1,921,925 0.6150 $18,834,865
1918 $972,186 0.6845 $8,559,794
1919 $833,910 0.7166 $7,013,556
1920 $690,660 0.8342 $4,989,576
1921 $662,843 0.5882 $6,791,128
1922 $840,744 0.5241 $9,668,556
1923 $1,806,642 0.5348 $20,360,855
1924 $1,357,712 0.5348 $15,301,414
1925 $1,958,036 0.5508 $21,424,336
1926 $2,055,663 0.5187 $23,883,837
1927 $1,699,596 0.5134 $19,952,549
1928 $2,807,928 0.5080 $33,310,893
1929 $3,879,561 0.5187 $45,074,899
1930 $7,023,975 0.5027 $84,212,977
1931 $4,371,278 0.4706 $55,982,163
1932 $3,408,002 0.4278 $48,010,228
1933 $3,167,722 0.4225 $45,190,161
1934 $4,708,522 0.4278 $66,331,304 $62,603 $881,920
1935 $5,793,610 0.4278 $81,617,481 $21,525 $303,233
1936 $6,152,984 0.4439 $83,547,144 $20,952 $284,493
1937 $10,125,806 0.4545 $134,256,275 $151,861 $2,013,498
1938 $8,479,315 0.4545 $112,425,741 $159,729 $2,117,819
1939 $9,426,036 0.4492 $126,465,983 $77,764 $1,043,334
1940 $7,174,659 0.4706 $91,884,553 $117,150 $1,500,319
1941 $8,099,386 0.5080 $96,084,295 $79,919 $948,092
1942 $7,271,359 0.5294 $82,775,976 $63,341 $721,064
1943 $7,368,225 0.5508 $80,621,258 $11,647 $127,439
1944 $8,029,416 0.5668 $85,369,357 $57,024 $606,283
1945 $7,016,286 0.5829 $72,544,535 $54,216 $560,564
1946 $9,313,975 0.5936 $94,566,215 $85,906 $872,217
1947 $13,505,511 0.6310 $128,989,075 $94,666 $904,141
1948 $15,754,316 0.7112 $133,497,099 $167,337 $1,417,961
1949 $27,561,155 0.7380 $225,082,766 $217,507 $1,776,307 0.5800 $217,067,855 $1,713,055
1950 $25,803,611 0.7540 $206,245,884 $454,636 $3,633,864 0.5970 $197,438,685 $3,478,689
1951 $32,392,960 0.8449 $231,056,113 $175,629 $1,252,746 0.6600 $224,198,547 $1,215,566
1952 $32,463,076 0.8770 $223,084,675 $415,723 $2,856,828 0.6760 $219,365,875 $2,809,205
1953 $32,326,884 0.8770 $222,148,770 $562,264 $3,863,851 0.6700 $220,401,800 $3,833,466
1954 $38,452,033 0.8877 $261,056,875 $282,476 $1,917,774 0.6740 $260,606,657 $1,914,466
1955 $68,396,343 0.8984 $458,825,468 $109,715 $736,005 0.6750 $462,865,918 $742,486
1956 $84,289,909 0.9305 $545,946,709 $140,124 $907,585 0.6850 $562,096,795 $934,433
1957 $82,655,713 0.9519 $523,331,396 $510,715 $3,233,572 0.7070 $534,047,096 $3,299,782
1958 $64,994,754 0.9626 $406,939,376 $1,135,832 $7,111,570 0.7260 $408,947,708 $7,146,667
1959 $72,156,996 0.9840 $441,961,601 $1,282,004 $7,852,275 0.7340 $449,064,248 $7,978,466
1960 $86,637,123 0.9947 $524,946,439 $347,845 $2,107,641 0.7430 $532,649,230 $2,138,568
1961 $91,618,709 1.0000 $552,161,952 $1,151,031 $6,936,962 0.7500 $558,019,017 $7,010,546
1962 $101,858,960 1.0160 $604,184,463 $934,745 $5,544,514 0.7590 $613,032,581 $5,625,712
1963 $137,796,907 1.0374 $800,500,589 $973,645 $5,656,175 0.7720 $815,357,864 $5,761,153
1964 $182,152,656 1.0642 $1,031,588,157 $1,031,381 $5,841,037 0.7860 $1,058,617,472 $5,994,082
1965 $207,557,627 1.1016 $1,135,521,581 $636,596 $3,482,736 0.8050 $1,177,792,845 $3,612,386
1966 $244,020,010 1.1604 $1,267,329,729 $2,582,878 $13,414,302 0.8350 $1,334,950,186 $14,130,044
1967 $266,317,101 1.2086 $1,328,050,322 $3,166,355 $15,789,744 0.8650 $1,406,400,598 $16,721,283
1968 $299,354,285 1.2567 $1,435,626,720 $3,509,890 $16,832,536 0.9000 $1,519,389,304 $17,814,642
65

Appendix 4B. Gross Value of Newfoundland and Labrador Mineral Production (GVMP), plus Mining Tax and Royaltiesrevenue, 1865 - 2002
Year *GVMP in current $
**GDP deflation index
**GVMPin year-2000 $, using GDP deflator
***Mining Tax & Royalties in
current $
Mining Tax & Royalties in year-2000
$, using GDP
deflator
****Canadian Consumer Price Index
(CPI) deflator
GVMPin year-2000 $, using CPI deflator
Mining Tax and Royalties in year-2000 dollars using CPI deflator
1969 $256,935,937 1.3102 $1,181,905,310 $2,824,897 $12,994,526 0.9410 $1,247,272,434 $13,713,209
1970 $353,204,018 1.3743 $1,548,875,207 $3,570,920 $15,659,248 0.9720 $1,659,913,533 $16,781,854
1971 $343,431,278 1.4225 $1,455,064,099 $3,219,426 $13,640,200 1.0000 $1,568,794,078 $14,706,338
1972 $290,659,060 1.5080 $1,161,605,534 $3,951,073 $15,790,281 1.0470 $1,268,128,544 $17,238,301
1973 $374,417,862 1.6471 $1,370,028,995 $3,664,933 $13,410,323 1.1290 $1,514,916,558 $14,828,533
1974 $448,102,101 1.8930 $1,426,584,937 $2,016,811 $6,420,751 1.2510 $1,636,235,330 $7,364,343
1975 $550,958,453 2.0856 $1,592,128,658 $2,725,154 $7,874,996 1.3860 $1,815,857,297 $8,981,604
1976 $743,492,023 2.2781 $1,966,937,817 $6,562,000 $17,360,033 1.4890 $2,280,907,697 $20,131,105
1977 $867,145,558 2.4332 $2,147,852,844 $10,044,000 $24,878,215 1.6080 $2,463,383,650 $28,532,955
1978 $675,095,984 2.5936 $1,568,728,194 $14,409,000 $33,482,357 1.7520 $1,760,181,767 $37,568,671
1979 $1,120,398,447 2.8396 $2,377,945,480 $13,278,000 $28,181,367 1.9120 $2,676,767,838 $31,722,753
1980 $1,035,653,000 3.1497 $1,981,631,462 $16,808,000 $32,160,638 2.1070 $2,245,307,501 $36,439,935
1981 $1,030,263,000 3.4973 $1,775,392,050 $27,093,000 $46,687,784 2.3670 $1,988,272,659 $52,285,942
1982 $646,702,000 3.7968 $1,026,525,569 $22,872,000 $36,305,273 2.6240 $1,125,813,543 $39,816,805
1983 $806,608,000 4.0000 $1,215,303,765 $21,290,000 $32,077,313 2.7740 $1,328,257,154 $35,058,659
1984 $978,032,000 4.1337 $1,425,927,638 $19,920,000 $29,042,484 2.8970 $1,542,164,369 $31,409,928
1985 $869,420,000 4.2353 $1,237,167,096 $16,696,000 $23,758,071 3.0090 $1,319,877,222 $25,346,403
1986 $817,159,000 4.3529 $1,131,373,701 $25,204,000 $34,895,464 3.1350 $1,190,680,163 $36,724,680
1987 $742,384,000 4.5615 $980,852,014 $32,474,000 $42,905,273 3.2730 $1,036,116,747 $45,322,711
1988 $864,766,000 4.7701 $1,092,591,123 $19,700,000 $24,890,022 3.4040 $1,160,473,293 $26,436,428
1989 $896,968,000 4.9893 $1,083,475,816 $22,600,000 $27,299,250 3.5740 $1,146,432,519 $28,885,506
1990 $864,263,000 5.1390 $1,013,552,967 $21,300,000 $24,979,292 3.7460 $1,053,911,742 $25,973,946
1991 $772,303,000 5.2781 $881,849,525 $21,657,975 $24,730,028 3.9560 $891,779,602 $25,008,501
1992 $705,877,000 5.3476 $795,523,379 $14,936,814 $16,833,789 4.0160 $802,899,934 $16,989,882
1993 $698,872,000 5.4278 $775,988,910 $14,247,979 $15,820,170 4.0880 $780,931,335 $15,920,932
1994 $838,325,000 5.4866 $920,850,171 $16,992,978 $18,665,776 4.0970 $934,700,659 $18,946,528
1995 $881,469,000 5.6096 $947,011,976 $19,238,459 $20,668,964 4.1870 $961,679,100 $20,989,081
1996 $911,331,000 5.7059 $962,577,354 $21,710,864 $22,931,719 4.2580 $977,679,664 $23,291,505
1997 $1,010,138,000 5.7594 $1,057,033,915 $23,580,257 $24,674,976 4.3340 $1,064,677,061 $24,853,395
1998 $1,095,795,000 5.7273 $1,153,091,471 $27,800,000 $29,253,595 4.3740 $1,144,396,790 $29,033,013
1999 $821,101,000 5.8182 $850,533,848 $24,465,000 $25,341,962 4.4505 $842,770,800 $25,110,659
2000 $975,255,000 6.0267 $975,255,000 $18,289,000 $18,289,000 4.5680 $975,255,000 $18,289,000
2001 $814,420,000 6.0428 $812,257,823 $19,364,000 $19,312,591 4.6877 $793,620,605 $18,869,465
2002 $791,260,000 6.0963 $782,236,860 $17,071,000 $16,876,331 4.7923 $754,232,697 $16,272,156
Notes:
All currency in Canadian dollars
**** Source for Canadian Consumer Price Index data is Statistics Canada, base year 1971
Cells shaded in grey are assumed or interpolated values
***Mining Tax and Royaty revenue is that derived from taxation, under the Mineral Rights Tax Act, and Royalties, as recorded in the Annual Statement of Public Accounts
**Adjustment to constant dollars has been performed using a Gross Domestic product deflation index (courtesy D. Cranstone of NRCan in part based on an earlier index by D.A. Cavanagh; NRCan) recalculated to base year 1961.
*The data for gross value of mineral production are taken from Geological Survey of Newfoundland reports for the period 1865 to 1906; from the Newfoundland Customs Returns for the period 1907 to 1949; and from unpublished files of the Newfoundland Department of Mines and Energy for the remaining years.
66

Appendix 4C. Pre-confederation mineral production by quantity and value
Year
Copper ore or
concentrate - tonnes
Copper value $
Nickel ore - tonnes
Nickel value $
Lead ore or concentrate
- tonnesLead value $
Zinc concentrate
- tonnesZinc value $ Pyrite - tonnes
Pyrite value $
Brick (number)
Brick value $
Building stone - tonnes
Building stone value
$
Chromite - tonnes
Chromite value $
Coal - tonnes
1865 236 $8,496 2250 $90,000
1866 284 $10,206 314 $15,036
1867 79 $2,370 5 $240
1868 0 $0 4 $8
1869 3,422 $109,504 2.5 $600 2 $4
1870 5,226 $167,232 38 $9,120
1871 1,407 $45,024 7 $700
1872 4,955 $588,560 8 $2,560
1873 5,553 $194,355 120 $3,600
1874 5,052 $121,248 98 $4,704
1875 10,018 $370,666 17.5 $5,520 130 $6,240
1876 25,134 $614,700 28 $2,800 95 $4,560
1877 47,454 $1,264,004 38 $1,824
1878 35,823 $822,606 10 $1,392
1879 28,405 $555,790 2 $100
1880 22,042 $411,680
1881 27,351 $547,020
1882 19,004 $468,576
1883 11,989 $256,724 10 $72
1884 4,079 $97,217 950 $7,600
1885 4,401 $102,420
1886 235 $246,150
1887 7,492 $168,864 10 $400 410 $8,200
1888 3,322 $816,386 1,850 $37,000 120,000 $840
1889 2,306 $356,370 7,530 $64,000 120,000 $840
1890 400 $226,792 8,670 $72,315 820,000 $7,140
1891 7,060 $565,850 19,150 $57,900 820,000 $7,140 0 $0 0
1892 26,643 $789,527 36,216 $186,080 870,000 $7,570 0 $0 0
1893 45,431 $639,401 39,953 $199,765 870,000 $7,570 0 $0 0
1894 44,893 $523,001 42,095 $210,475 870,000 $7,570 0 $0 0
1895 45,951 $483,698 34,330 $171,650 870,000 $7,570 0 $0 32 $640 0
1896 2,329 $584,325 27,274 $190,918 870,000 $7,570 500 $500 1,014 $15,210 0
1897 69,878 $289,961 32,790 $163,950 870,000 $7,570 500 $500 3,033 $42,462 0
1898 66,798 $274,452 32,335 $161,675 930,000 $8,010 100 $400 724 $15,000 2,900
1899 86,957 $460,524 25,954 $129,770 772,000 $8,464 500 $500 706 $10,399 5,000
1900 70,614 $399,775 0 $0 800,000 $11,200 500 $500 0 $0 0
1901 75,348 $360,094 7,532 $14,128 1,305,000 $13,050 5,000 $5,000
1902 74,608 $265,810 26,000 $117,000 1,625,000 $18,950 5,000 $6,000
1903 87,790 $343,050 42,000 $210,000 1,550,000 $14,120 4,000 $4,000
1904 107,839 $466,739 60,200 $210,700 1,236,000 $11,432 3,100 $4,650
1905 78,720 $358,880 50,720 $229,530 1,335,500 $9,690 1,000 $1,500
1906 75,989 $360,345 28,132 $84,396 906,000 $8,100 500 $750
1907 55,890 $278,950 29,805 $184,140 $0 $0
1908 54,667 $275,960 20,451 $135,186 $0 $0
1909 40,279 $220,895
1910 37,036 $197,709
1911 42,131 $231,693 5,448 $26,290
1912 32,057 $200,595
1913 17,800 $120,650
1914 13,797 $66,707 1,335 $13,430
1915 3,250 $39,000 4,139 $18,625
67

Appendix 4C. Pre-confederation mineral production by quantity and value
Year
Copper ore or
concentrate - tonnes
Copper value $
Nickel ore - tonnes
Nickel value $
Lead ore or concentrate
- tonnesLead value $
Zinc concentrate
- tonnesZinc value $ Pyrite - tonnes
Pyrite value $
Brick (number)
Brick value $
Building stone - tonnes
Building stone value
$
Chromite - tonnes
Chromite value $
Coal - tonnes
1916 9,450 $111,440
1917 16,066 $204,307
1918 5,087 $58,768
1919 56 $673 80 $2,900
1920 0 $0
1921 0 $0
1922 0 $0
1923 0 $0
1924 0 $0
1925 0 $0 230 $18,406
1926 8,450 $67,600 20 $1,200
1927 0 $0 $260
1928 0 $0 $0
1929 0 $0 10,501 $509,300 18,168 $556,816
1930 1,000 $51,976 23,451 $1,194,665 55,213 $1,189,670
1931 0 $0 29,229 $1,038,026 45,783 $508,885
1932 0 $0 41,240 $1,060,517 88,847 $960,651
1933 0 $0 43,088 $1,016,971 129,900 $1,499,646
1934 826 21296 43,945 $1,209,107 148,014 $2,367,408
1935 480 $22,040 40,120 $1,607,405 140,773 $1,869,624
1936 10,315 $467,232 42,107 $1,950,600 123,026 $1,505,921
1937 31,361 $1,701,634 41,423 $1,788,069 119,669 $1,964,790
1938 32,865 $1,466,879 47,119 $1,342,326 122,084 $977,316
1939 39,544 $2,010,778 41,771 $1,382,521 100,452 $1,168,317
1940 43,578 $1,970,642 42,897 $1,141,596 67,661 $782,732
1941 36,579 $1,605,853 48,169 $1,041,216 110,302 $1,185,289
1942 23,683 $1,166,544 24,658 $881,304 137,556 $1,542,430
**1943 19,675 $891,427 54,647 $2,164,498 93,553 $1,110,357
1944 20,498 $927,621 42,561 $1,414,535 261,299 $1,701,777
1945 24,251 $1,033,316 32,352 $1,290,331 75,096 $1,611,404
1946 17,944 $893,077 39,151 $1,711,890 102,746 $2,626,656
1947 17,631 $1,426,143 36,518 $3,512,139 93,580 $2,709,742
1948 16,604 $1,521,570 35,525 $5,149,339 69,360 $2,503,554
1949 14,580 $1,534,336 37,137 $7,336,566 76,175 $4,721,077
68

Appendix 4C. Pre-confederation mineral production by quantity and value
Year
1865
1866
1867
1868
1869
1870
1871
1872
1873
1874
1875
1876
1877
1878
1879
1880
1881
1882
1883
1884
1885
1886
1887
1888
1889
1890
1891
1892
1893
1894
1895
1896
1897
1898
1899
1900
1901
1902
1903
1904
1905
1906
1907
1908
1909
1910
1911
1912
1913
1914
1915
Coal value $Stone - tonnes
Stone value $
***Gold - troy ounces
***Gold value $
Iron ore - tonnes
Iron ore value $
***Silver - troy ounces
***Silver value $
Gypsum - tonnes
Gypsum value $
Limestone - tonnes
Limestone value $
Barite - tonnes
Barite value $
Sand & Gravel - tonnes
Sand & Gravel value
$
$500
$0 250 $1,250
$0 170 $850
$0 $1,000
$0 N/A $1,350 $1,200
$0 N/A $2,254 750 $750
$0 N/A $2,858 20,375 $20,375 4,000 $2,684
$0 N/A $2,358 30,787 $30,787 4,000 $2,684
$11,600 N/A $34,950 102,000 $102,000 2,616 $1,543
$20,000 N/A $33,100 306,880 $306,880 0 $0
$0 N/A $13,800 317,216 $317,216 0 $0
N/A $56,838 738,206 $738,206 2,888 $975
N/A $80,230 728,721 $728,721 1,150 $345 315 $630
N/A $97,640 149 $3,000 588,795 $588,795 1,200 $600 2,760 $19,320
N/A $51,350 11 $209 589,739 $589,739 2,000 $5,000 2,320 $5,800
N/A $51,700 689,970 $689,970 1,048 $2,620
N/A $31,411 147 $2,800 884,986 $966,615 1,200 $1,100 1,000 $2,500
$0 N/A $0 $0 809,700 $890,670 $0
N/A $0 $0 943,460 $1,037,806
N/A 880,120 $968,132
N/A $652 1,059,880 $1,165,867
N/A $5,258 1,175,185 $1,292,702
N/A $172 1,016,930 $1,118,622
N/A $740 1,243,200 $1,367,520 17,900 $8,950
N/A $21,720 1,245,797 $1,370,375 155,100 $79,550
N/A $25,600 511,990 $563,189 88,400 $44,200
69

Appendix 4C. Pre-confederation mineral production by quantity and value
Year
1916
1917
1918
1919
1920
1921
1922
1923
1924
1925
1926
1927
1928
1929
1930
1931
1932
1933
1934
1935
1936
1937
1938
1939
1940
1941
1942
**1943
1944
1945
1946
1947
1948
1949
Coal value $Stone - tonnes
Stone value $
***Gold - troy ounces
***Gold value $
Iron ore - tonnes
Iron ore value $
***Silver - troy ounces
***Silver value $
Gypsum - tonnes
Gypsum value $
Limestone - tonnes
Limestone value $
Barite - tonnes
Barite value $
Sand & Gravel - tonnes
Sand & Gravel value
$
834,310 $917,741 11,360 $5,650
902,380 $992,618 118,600 $59,300
N/A $3,780 731,080 $804,188 210,900 $105,450
709,338 $780,271 155,100 $77,550
510,600 $561,660 85,600 $42,800
514,203 $621,576 93,401 $46,705
484,322 $643,687 24,000 $12,000
1,004,138 $1,706,017 201,250 $100,625
744,075 $1,281,929 144,000 $144,000
1,117,429 $1,899,630 40,000 $40,000
1,063,973 $1,808,750 60,000 $60,000
929,159 $1,579,636 131,500 $131,525
1,542,292 $2,623,944 182,900 $182,900
1,334,148 $2,621,610 414,700 $414,700
1,644,708 $4,539,391 256,600 $256,600
974,223 $2,688,764 135,603 $135,603
470,404 $1,299,035 87,799 $87,799
594 $45,719 194,252 $536,127 $69,259 ?
659 28202 352,251 $972,234 95,500 $95,500
726,335 $2,004,674 220,760 $220,760
754,637 $1,946,463 162,600 $162,600
1,609,718 $4,104,280 365,000 $365,000
1,680,213 $4,284,543 187,480 $188,480
1,756,860 $4,481,989 163,200 $163,200
1,116,009 $2,858,219 253,400 $253,400
1,393,680 $3,558,998 405,500 $405,500
1,137,962 $2,918,128 378,000 $378,000
927,566 $2,364,693 130,340 $130,340
791,688 $2,019,695 306,150 $306,150
578,263 $1,474,346 313,250 $313,250
999,868 $3,051,630 224,500 $224,500
1,245,852 $4,486,187 326,320 $485,666
1,259,742 $5,163,799 276,259 $427,415
1,704,628 $7,767,731 333,053 $486,855
70

Appendix 4C. Pre-confederation mineral production by quantity and value
Year
1865
1866
1867
1868
1869
1870
1871
1872
1873
1874
1875
1876
1877
1878
1879
1880
1881
1882
1883
1884
1885
1886
1887
1888
1889
1890
1891
1892
1893
1894
1895
1896
1897
1898
1899
1900
1901
1902
1903
1904
1905
1906
1907
1908
1909
1910
1911
1912
1913
1914
1915
Talc (pyrophyllite) -
tonnes
Talc (pyrophyllite)
value $
Fluorspar - tonnes
Fluorspar value $
Miscellaneous - tonnes
Miscellaneous value $
Total value in current $
*Total value in year-2000 $
$98,496
$25,742
$2,610 $48,609
$8 $149
$110,108 $2,038,059
$176,352 $3,301,731
$45,724 $838,863
$591,120 $9,752,328
$197,955 $3,255,178
$125,952 $2,173,145
$382,426 $6,871,739
$622,060 $11,916,696
$1,265,828 $25,582,876
$823,998 $17,960,289
$555,890 $12,561,692
$411,680 $8,505,614
$547,020 $11,209,610
$468,576 $9,589,082
$256,796 $5,237,368
$104,817 $2,311,396
$102,420 $2,391,548
$246,150 $5,661,450
$177,464 $4,000,039
$854,226 $18,513,706
$421,210 $9,128,917
$306,247 $6,512,082
$632,140 $13,441,920
$984,027 $22,632,621
$847,736 $19,107,969
$743,596 $18,218,102
$666,562 $16,693,675
$824,440 $21,116,906
$540,272 $13,530,812
$609,630 $14,618,149
$969,637 $22,766,269
$742,491 $17,077,293
$1,188,291 $27,330,693
$1,217,686 $26,391,002
$1,280,525 $27,229,277
1,562 $7,000 $1,352,619 $28,762,295
6,000 $24,000 $1,367,890 $28,029,310
$1,458,017 $29,342,592
30 $4,500 $1,358,260 $0
$9,115 $1,458,067 $0
1,300 $1,500 $1,190,527 $21,995,474
1,400 $5,600 $1,369,828 $25,308,134
$1,555,943 $27,834,091
$1,319,389 $22,193,305
$1,497,860 $26,376,378
$1,551,782 $26,102,363
$690,614 $10,962,281
71

Appendix 4C. Pre-confederation mineral production by quantity and value
Year
1916
1917
1918
1919
1920
1921
1922
1923
1924
1925
1926
1927
1928
1929
1930
1931
1932
1933
1934
1935
1936
1937
1938
1939
1940
1941
1942
**1943
1944
1945
1946
1947
1948
1949
Talc (pyrophyllite) -
tonnes
Talc (pyrophyllite)
value $
Fluorspar - tonnes
Fluorspar value $
Miscellaneous - tonnes
Miscellaneous value $
Total value in current $
*Total value in year-2000 $
$1,034,831 $13,720,642
$1,256,225 $18,834,865
$972,186 $8,559,794
$861,394 $7,013,556
$604,460 $4,989,576
$668,281 $6,791,128
$655,687 $9,668,556
$1,806,642 $20,360,855
$1,425,929 $15,301,414
$1,958,036 $21,424,336
$1,937,550 $23,883,837
$1,711,421 $19,952,549
200 $800 $2,807,644 $33,310,893
$4,102,426 $45,074,899
$7,232,302 $84,212,977
$4,371,278 $0
$3,408,002 $0
$3,167,722 $0
2,400 $14,775 $4,708,522 $0
3,077 $18,462 441 $50,645 $5,793,610 $81,617,481
8,457 $50,682 637 $69,486 $6,152,984 $83,547,144
11,228 $78,596 571 $123,437 $10,125,806 $134,256,275
1,000 $1,490 14,000 $84,000 365 $134,281 $8,479,315 $112,425,741
$0 8,605 $60,235 $158,996 $9,426,036 $0
8,950 $62,375 201 $105,695 $7,174,659
300 $3,000 14,150 $122,250 392 $177,280 $8,099,386 $103,727,364
229 $3,400 16,390 $251,825 197 $129,728 $7,271,359 $86,261,280
922 $22,945 30,038 $561,519 $122,446 $7,368,225 $63,066,692
1,151 $32,226 66,615 $1,360,659 351 $266,753 $8,029,416 $63,066,692
354 $7,908 42,870 $1,059,384 $226,347 $7,016,286 $74,597,682
80 $1,218 21,750 $660,724 254 $144,280 $9,313,975 $96,301,375
261 $6,775 27,932 $765,634 296 $113,225 $13,505,511 $137,123,522
206 $5,721 34,050 $892,077 152 $90,841 $15,754,316 $150,467,069
0 $0 32,102 $782,908 260 $181,590 $22,811,063 $193,293,744
72
NotesAll currency figures are in Canadian dollars.
Tonnage values for copper, nickel and lead prior to 1925 would be forhand-picked ore. Copper shipments prior to 1891 also excludes regulusand ingots.
A blank cell indicates that data were either not reported or have beenlost.
Data prior to 1908 have been taken from the reports of TheNewfoundland Geological Survey (Murray and Howley, 1909).
Data after 1909 have been taken from the Customs Returns (seeAppendix 2). These do not include data for domestically consumed com-modities, such as brick and building stone, that were reported earlier.
*Total value in year-2000 dollars has been calculated using the GrossDomestic Product deflator - see Appendix 4B.
**Tonnage and $ values for 1943 are based on nine-month data thathave been scaled up to 12 months.
***Prior to 1949, gold and silver were not reported as by-products ofbase metal mining.

Appendix 4D. Gross Value of Mineral Production 1949-2002, by product, in current and year-2000 Canadian dollars
A. In current Canadian dollars
*METALS 1949 1950 1951 1952 1953 1954 1955 1956 1957 1958 1959 1960 1961 1962 1963
Iron Ore 7,947,914 5,851,488 9,145,960 8,668,192 14,201,842 21,749,304 45,701,801 55,620,755 57,898,102 38,226,828 42,974,837 54,673,717 59,889,125 67,753,153 99,601,987
Copper 1,444,837 1,508,910 1,606,283 1,689,079 238,066 2,029,876 2,250,672 2,574,274 2,625,986 7,499,372 8,876,570 8,398,362 9,195,817 10,731,154 8,827,797
Zinc 8,454,091 9,558,647 11,330,799 10,656,475 6,698,029 7,188,595 7,817,635 10,293,055 8,631,847 7,370,102 7,753,838 9,133,517 8,722,020 7,874,869 8,814,473
Lead 5,880,191 5,178,320 6,051,427 5,847,571 4,576,214 493,054 5,135,085 7,068,813 6,843,665 5,448,339 4,765,328 5,131,091 4,485,938 5,025,529 5,146,264
Gold 333,684 352,115 313,778 294,551 263,451 222,409 218,753 282,938 327,280 454,686 450,207 458,834 511,652 522,468 465,004
Silver 434,382 465,138 505,388 533,295 544,712 617,867 618,840 858,350 1,045,307 1,099,950 987,622 1,130,158 1,079,376 1,376,620 1,357,711
Cadmium 0 0 0 0 0 0 0 0 0 0 0 0 0 0 0
Antimony 0 0 0 0 0 0 0 0 0 0 0 0 0 0 0
Magnetite 0 0 0 0 0 0 0 0 0 0 0 0 0 0 0
Total metals $24,495,099 $22,914,618 $28,953,635 $27,689,163 $26,522,314 $32,301,105 $61,742,786 $76,698,185 $77,372,187 $60,099,277 $65,808,402 $78,925,679 $83,883,928 $93,283,793 $124,213,236
*NON-METALS
Asbestos 0 0 0 0 0 0 0 0 0 0 0 0 0 0 3,320,064
Barite 0 0 0 0 0 0 0 0 0 0 0 0 0 0 0
Clay/Brick 25,450 31,089 32,183 0 39,500 33,042 49,338 47,145 2,950 58,282 68,000 83,435 75,890 142,000 92,120
Cement 0 0 0 529,750 1,345,073 1,330,018 1,492,990 1,660,300 1,185,078 1,079,071 1,291,516 1,688,664 1,789,980 1,985,524 1,848,347
Dolomite 0 0 0 0 0 0 0 0 0 0 0 0 0 0 0
Fluorspar 1,405,033 1,290,361 1,966,477 2,484,943 2,631,698 2,946,896 2,678,641 3,395,061 1,662,602 1,483,368 1,749,903 1,820,769 1,951,800 1,870,184 1,976,006
Gemstone 0 0 0 0 0 0 0 0 0 0 0 0 0 0 0
Gypsum 0 0 0 54,881 117,208 124,385 175,829 186,727 121,800 144,510 148,617 141,668 101,696 284,564 766,298
Limestone 0 0 0 0 0 0 0 0 0 0 0 0 0 0 0
Peat 0 0 0 0 0 0 0 0 0 0 0 0 0 0 0
Pyrophyllite 0 0 0 0 0 230 120 12,077 47,328 109,551 200,275 262,925 404,059 343,210 476,745
Sand and Gravel 999,598 780,315 648,346 936,013 1,023,622 1,096,883 1,660,984 1,686,320 1,681,394 1,484,160 2,306,864 3,069,395 2,777,393 3,504,594 4,276,626
Quartz/Silica 0 0 0 0 0 0 0 0 0 0 0 0 0 0 0Stone (aggregate) 635,975 787,228 792,319 768,326 647,469 619,474 595,655 604,094 582,374 536,535 583,419 644,588 633,963 445,091 827,465
Stone (dimension) 0 0 0 0 0 0 0 0 0 0 0 0 0 0 0
Total non-metals $3,066,056 $2,888,993 $3,439,325 $4,773,913 $5,804,570 $6,150,928 $6,653,557 $7,591,724 $5,283,526 $4,895,477 $6,348,594 $7,711,444 $7,734,781 $8,575,167 $13,583,671
TOTAL PRODUCTION VALUE $27,561,155 $25,803,611 $32,392,960 $32,463,076 $32,326,884 $38,452,033 $68,396,343 $84,289,909 $82,655,713 $64,994,754 $72,156,996 $86,637,123 $91,618,709 $101,858,960 $137,796,907
73

Appendix 4D. Gross Value of Mineral Production 1949-2002, by product, in current and year-2000 Canadian dollars
B. **In Constant (year-2000) Canadian dollars
METALS 1949 1950 1951 1952 1953 1954 1955 1956 1957 1958 1959 1960 1961 1962 1963
Iron Ore 62,596,674 44,773,195 63,301,129 58,574,410 96,826,887 147,404,778 309,282,707 370,913,298 374,085,615 240,523,623 267,451,029 336,136,661 364,764,697 407,768,647 589,354,762
Copper 11,379,337 11,545,563 11,117,425 11,413,776 1,623,113 13,757,379 15,231,214 17,166,837 16,966,767 47,186,131 55,242,741 51,633,536 56,008,656 64,584,864 52,234,944
Zinc 66,583,255 73,138,860 78,422,863 72,010,026 45,666,562 48,720,329 52,905,121 68,640,402 55,771,255 46,372,763 48,255,493 56,153,305 53,122,916 47,394,469 52,156,104
Lead 46,311,573 39,622,388 41,883,210 39,514,356 31,200,217 3,341,648 34,751,212 47,139,179 44,217,626 34,281,009 29,656,701 31,546,196 27,322,353 30,245,872 30,450,951
Gold 2,628,049 2,694,240 2,171,724 1,990,398 1,796,185 1,507,365 1,480,391 1,886,804 2,114,590 2,860,889 2,801,833 2,820,934 3,116,302 3,144,445 2,751,474
Silver 3,421,133 3,559,046 3,497,898 3,603,686 3,713,798 4,187,562 4,187,942 5,724,004 6,753,836 6,920,898 6,146,400 6,948,266 6,574,119 8,285,112 8,033,710
Cadmium 0 0 0 0 0 0 0 0 0 0 0 0 0 0 0
Antimony 0 0 0 0 0 0 0 0 0 0 0 0 0 0 0
Magnetite 0 0 0 0 0 0 0 0 0 0 0 0 0 0 0
Nickel
Cobalt
Total metals $192,920,021 $175,333,291 $200,394,250 $187,106,652 $180,826,762 $218,919,062 $417,838,587 $511,470,524 $499,909,689 $378,145,313 $409,554,197 $485,238,899 $510,909,044 $561,423,408 $734,981,946
NON-METALS
Asbestos 0 0 0 0 0 0 0 0 0 0 0 0 0 0 19,645,146
Barite 0 0 0 0 0 0 0 0 0 0 0 0 0 0 0
Clay/Brick 200,441 237,880 222,745 0 269,307 223,940 333,890 314,392 19,060 366,711 423,193 512,962 462,221 854,619 545,083
Cement 0 0 0 3,579,731 9,170,587 9,014,128 10,103,672 11,071,898 7,656,911 6,789,527 8,037,664 10,381,988 10,902,172 11,949,768 10,936,851
Dolomite 0 0 0 0 0 0 0 0 0 0 0 0 0 0 0
Fluorspar 11,065,846 9,873,315 13,610,404 16,791,745 17,942,681 19,972,435 18,127,455 22,640,348 10,742,243 9,333,368 10,890,405 11,194,176 11,887,763 11,255,600 11,692,222
Gemstone 0 0 0 0 0 0 0 0 0 0 0 0 0 0 0
Gypsum 0 0 0 370,853 799,114 843,013 1,189,906 1,245,210 786,962 909,259 924,908 870,982 619,396 1,712,633 4,534,261
Limestone 0 0 0 0 0 0 0 0 0 0 0 0 0 0 0
Peat 0 0 0 0 0 0 0 0 0 0 0 0 0 0 0
Pyrophyllite 0 0 0 0 0 1,559 812 80,537 305,791 689,296 1,246,398 1,616,476 2,460,989 2,065,591 2,820,947
Sand and Gravel 7,872,696 5,970,651 4,487,340 6,325,011 6,978,963 7,434,068 11,240,555 11,245,416 10,863,660 9,338,351 14,356,614 18,870,789 16,916,175 21,092,207 25,305,217
Quartz/Silica 0 0 0 0 0 0 0 0 0 0 0 0 0 0 0Stone (aggregate) 5,008,851 6,023,547 5,483,808 5,191,883 4,414,386 4,198,453 4,031,040 4,028,469 3,762,779 3,375,884 3,630,869 3,962,958 3,861,257 2,678,756 4,896,192Stone (dimension) 0 0 0 0 0 0 0 0 0 0 0 0 0 0 0Total non-metals $24,147,834 $22,105,394 $23,804,298 $32,259,223 $39,575,038 $41,687,595 $45,027,331 $50,626,270 $34,137,407 $30,802,395 $39,510,051 $47,410,331 $47,109,973 $51,609,174 $80,375,919
TOTAL PRODUCTION VALUE $217,067,855 $197,438,685 $224,198,547 $219,365,875 $220,401,800 $260,606,657 $462,865,918 $562,096,795 $534,047,096 $408,947,708 $449,064,248 $532,649,230 $558,019,017 $613,032,581 $815,357,864
***Canadian Consumer Price Index 0.58 0.60 0.66 0.68 0.67 0.67 0.68 0.69 0.71 0.73 0.73 0.74 0.75 0.76 0.77
74

Appendix 4D. Gross Value of Mineral Production 1949-2002, by product, in current and year-2000 Canadian dollars
A. In current Canadian dollars
*METALS
Iron Ore
Copper
Zinc
Lead
Gold
Silver
Cadmium
Antimony
Magnetite
Total metals
*NON-METALS
Asbestos
Barite
Clay/Brick
Cement
Dolomite
Fluorspar
Gemstone
Gypsum
Limestone
Peat
Pyrophyllite
Sand and Gravel
Quartz/SilicaStone (aggregate)
Stone (dimension)
Total non-metals
TOTAL PRODUCTION VALUE
1964 1965 1966 1967 1968 1969 1970 1971 1972 1973 1974 1975 1976
137,038,680 156,888,970 188,603,259 207,408,843 246,508,466 194,971,157 292,582,028 289,912,158 235,249,411 314,838,603 372,188,155 468,600,400 631,272,628
9,095,013 11,147,108 17,415,394 20,897,555 22,413,551 21,049,062 17,639,532 14,762,654 9,689,977 11,031,913 9,664,523 10,541,388 11,197,883
11,047,407 10,928,579 10,316,464 10,099,901 10357709 10,022,171 9,530,344 6,970,621 10,138,934 4,199,158 14,689,531 26,619,174 35,251,008
6,831,452 6,793,882 6,500,156 5,583,296 5,084,119 6,737,575 5,609,750 3,639,735 3,765,175 2,725,614 6,414,818 2,331,396 6,435,294
631,067 892,555 967,903 1,028,989 294,251 338,532 249,010 259,460 810,487 1,397,375 1,802,489 2,127,843 170,494
1,525,647 1,521,769 1,535,298 1,858,701 2,071,768 1,977,553 1,467,794 879,222 956,790 1,447,191 2,572,284 2,005,188 2,486,483
0 0 0 0 0 0 0 0 401,764 191,093 22,573 37,041 311,320
0 0 0 0 0 0 0 0 0 0 0 0 0
0 0 0 0 0 0 0 0 0 0 0 0 0
$166,169,266 $188,172,863 $225,338,474 $246,877,285 $276,372,155 $235,096,050 $327,078,458 $316,423,850 $261,012,538 $335,830,947 $407,354,373 $512,262,430 $687,125,110
6,355,578 8,825,182 9,301,204 10,499,143 11,844,605 10,588,875 11,669,402 12,497,626 10,841,820 17,529,667 16,111,107 18,139,165 34,445,154
0 0 0 0 0 0 0 0 0 0 0 0 0
99,038 72,717 172,700 199,570 152,200 120,280 37,304 79,605 256,814 260,000 436,000 536,149 568,842
1,833,743 1,987,220 1,632,982 1,744,284 1,922,695 1,896,229 2,875,978 2,932,090 2,709,000 3,659,981 4,024,604 4,678,129 5,250,927
0 0 0 0 0 0 0 0 0 0 0 0 0
2,254,060 2,677,443 1,890,768 2,097,391 2,602,230 3,036,931 4,595,522 2,819,091 5,432,151 4,620,382 7,119,090 0 2,934,995
0 0 0 0 0 0 0 0 0 0 0 0 0
893,484 1,088,531 1,173,401 1,068,604 1,194,794 1,299,261 1,467,449 1,666,067 2,145,985 2,324,614 1,859,404 2,314,562 2,532,286
0 0 0 0 0 0 0 0 0 0 0 0 0
0 0 0 0 0 0 0 0 0 0 0 0 0
492,240 452,010 608,220 443,640 535,740 553,935 553,305 393,375 560,010 486,788 50,752 391,073 447,082
3,501,694 3,785,071 3,584,261 3,086,688 3,632,018 3,742,412 4,474,000 5,827,000 6,829,000 8,370,503 8,727,772 9,587,488 8,686,713
0 0 0 0 0 263,261 170,000 215,553 339,832 363,443 375,000 160,000 218,000553,553 496,590 318,000 300,496 1,097,848 338,703 282,600 577,021 531,910 971,537 2,043,999 2,889,457 1,282,914
0 0 0 0 0 0 0 0 0 0 0 0 0
$15,983,390 $19,384,764 $18,681,536 $19,439,816 $22,982,130 $21,839,887 $26,125,560 $27,007,428 $29,646,522 $38,586,915 $40,747,728 $38,696,023 $56,366,913
$182,152,656 $207,557,627 $244,020,010 $266,317,101 $299,354,285 $256,935,937 $353,204,018 $343,431,278 $290,659,060 $374,417,862 $448,102,101 $550,958,453 $743,492,023
75

Appendix 4D. Gross Value of Mineral Production 1949-2002, by product, in current and year-2000 Canadian dollars
B. **In Constant (year-2000) Canadian dollars
METALS
Iron Ore
Copper
Zinc
Lead
Gold
Silver
Cadmium
Antimony
Magnetite
Nickel
Cobalt
Total metals
NON-METALS
Asbestos
Barite
Clay/Brick
Cement
Dolomite
Fluorspar
Gemstone
Gypsum
Limestone
Peat
Pyrophyllite
Sand and Gravel
Quartz/SilicaStone (aggregate)
Stone (dimension)
Total non-metals
TOTAL PRODUCTION VALUE
***Canadian Consumer Price Index
1964 1965 1966 1967 1968 1969 1970 1971 1972 1973 1974 1975 1976
796,428,359 890,271,820 1,031,784,056 1,095,310,514 1,251,167,414 946,469,974 1,375,015,127 1,324,318,738 1,026,379,474 1,273,855,393 1,359,037,164 1,544,420,366 1,936,637,585
52,857,531 63,254,645 95,273,676 110,358,418 113,761,223 102,180,781 82,898,541 67,435,803 42,276,805 44,635,765 35,289,801 34,742,468 34,353,210
64,204,269 62,014,595 56,437,853 53,336,818 52,571,127 48,651,729 44,788,695 31,841,797 44,235,578 16,990,039 53,638,511 87,731,881 108,144,127
39,702,383 38,552,115 35,560,135 29,484,967 25,804,728 32,706,953 26,363,516 16,626,309 16,427,239 11,027,994 23,423,572 7,683,851 19,742,393
3,667,575 5,064,834 5,295,067 5,434,014 1,493,487 1,643,373 1,170,245 1,185,213 3,536,108 5,653,861 6,581,750 7,012,978 523,047
8,866,610 8,635,330 8,399,091 9,815,660 10,515,374 9,599,853 6,898,028 4,016,286 4,174,419 5,855,419 9,392,641 6,608,729 7,628,109
0 0 0 0 0 0 0 0 1,752,873 773,173 82,425 122,080 955,077
0 0 0 0 0 0 0 0 0 0 0 0 0
0 0 0 0 0 0 0 0 0 0 0 0 0
$965,726,727 $1,067,793,339 $1,232,749,879 $1,303,740,391 $1,455,313,354 $1,141,252,664 $1,537,134,152 $1,445,424,147 $1,138,782,496 $1,358,791,644 $1,487,445,864 $1,688,322,352 $2,107,983,548
36,936,743 50,078,797 50,883,712 55,445,185 60,117,951 51,402,743 54,841,387 57,089,156 47,302,229 70,926,057 58,829,366 59,783,337 105,671,903
0 0 0 0 0 0 0 0 0 0 0 0 0
575,580 412,635 944,783 1,053,914 772,500 583,888 175,313 363,636 1,120,465 1,051,975 1,592,045 1,767,048 1,745,111
10,657,173 11,276,548 8,933,487 9,211,433 9,758,745 9,205,073 13,515,913 13,393,787 11,819,209 14,808,497 14,695,756 15,418,249 16,108,955
0 0 0 0 0 0 0 0 0 0 0 0 0
13,099,931 15,193,242 10,343,746 11,076,164 13,207,763 14,742,509 21,597,062 12,877,608 23,700,158 18,694,336 25,995,206 0 9,004,068
0 0 0 0 0 0 0 0 0 0 0 0 0
5,192,665 6,176,906 6,419,276 5,643,217 6,064,243 6,307,146 6,896,406 7,610,594 9,362,808 9,405,524 6,789,574 7,628,369 7,768,625
0 0 0 0 0 0 0 0 0 0 0 0 0
0 0 0 0 0 0 0 0 0 0 0 0 0
2,860,754 2,564,946 3,327,364 2,342,830 2,719,178 2,689,028 2,600,306 1,796,937 2,443,291 1,969,573 185,320 1,288,904 1,371,572
20,350,812 21,478,515 19,608,269 16,300,567 18,434,509 18,167,203 21,025,959 26,617,736 29,794,529 33,867,544 31,869,275 31,598,590 26,649,365
0 0 0 0 0 1,277,977 798,930 984,646 1,482,667 1,470,512 1,369,305 527,330 668,787
3,217,087 2,817,917 1,739,669 1,586,897 5,572,189 1,644,203 1,328,104 2,635,832 2,320,692 3,930,895 7,463,619 9,523,117 3,935,763
0 0 0 0 0 0 0 0 0 0 0 0 0
$92,890,745 $109,999,506 $102,200,307 $102,660,208 $116,647,078 $106,019,770 $122,779,381 $123,369,931 $129,346,048 $156,124,914 $148,789,466 $127,534,944 $172,924,149
$1,058,617,472 $1,177,792,845 $1,334,950,186 $1,406,400,598 $1,571,960,432 $1,247,272,434 $1,659,913,533 $1,568,794,078 $1,268,128,544 $1,514,916,558 $1,636,235,330 $1,815,857,297 $2,280,907,697
0.79 0.81 0.84 0.87 0.90 0.94 0.97 1.00 1.05 1.13 1.25 1.39 1.49
76

Appendix 4D. Gross Value of Mineral Production 1949-2002, by product, in current and year-2000 Canadian dollars
A. In current Canadian dollars
*METALS
Iron Ore
Copper
Zinc
Lead
Gold
Silver
Cadmium
Antimony
Magnetite
Total metals
*NON-METALS
Asbestos
Barite
Clay/Brick
Cement
Dolomite
Fluorspar
Gemstone
Gypsum
Limestone
Peat
Pyrophyllite
Sand and Gravel
Quartz/SilicaStone (aggregate)
Stone (dimension)
Total non-metals
TOTAL PRODUCTION VALUE
1977 1978 1979 1980 1981 1982 1983 1984 1985 1986 1987 1988 1989
742,132,236 564,113,772 963,943,018 895,558,000 886,843,000 572,386,000 711,727,000 851,420,000 774,802,000 761,328,000 660,526,000 695,759,000 722,527,000
13,972,817 18,964,123 19,495,298 12,667,000 11,404,000 7,220,000 0 2,169,000 0 0 0 0 0
40,660,642 36,561,788 50,546,842 42,801,000 47,797,000 30,194,000 40,637,000 59,967,000 41,043,000 6,940,000 9,737,000 52,594,000 58,882,000
7,702,122 7,214,909 9,265,343 4,729,000 2,699,000 855,000 0 3,580,000 0 0 0 0 0
2,261,453 3,888,420 457,857 5,381,000 3,707,000 2,108,000 0 527,000 0 0 7,092,000 38,621,000 39,792,000
2,833,029 3,249,513 5,942,561 7,185,000 2,899,000 928,000 0 2,502,000 0 0 0 49,000 31,000
524,708 411,972 497,652 218,000 78,000 30,000 6,000 0 0 0 0 1,388,000 1,035,000
0 0 0 0 0 0 0 0 0 0 0 0 0
0 0 0 0 0 0 0 0 0 0 0 0 0
$810,087,007 $634,404,497 $1,050,148,571 $968,539,000 $955,427,000 $613,721,000 $752,370,000 $920,165,000 $815,845,000 $768,268,000 $677,355,000 $788,411,000 $822,267,000
29,449,609 18,381,495 36,242,039 45,151,000 51,592,000 9,620,000 16,686,000 25,339,000 18,259,000 16,354,000 19,191,000 26,895,000 24,874,000
0 0 0 0 0 0 0 0 0 0 0 0 0
550,000 592,000 659,000 806,000 921,000 860,000 1,381,000 1,546,000 1,342,000 1,273,000 1,132,000 1,520,000 954,000
5,175,463 5,685,020 6,784,000 6,415,000 5,580,000 6,321,000 10,034,000 7,675,000 8,779,000 8,530,000 9,722,000 11,011,000 15,367,000
0 0 0 0 0 0 0 0 0 0 0 2,086,000 1,642,000
8,685,119 68,119 0 0 0 0 0 0 0 0 1,656,000 6,258,000 6,422,000
0 0 0 0 0 0 0 0 0 0 0 34,000 160,000
3,213,601 4,942,700 5,198,250 4,312,000 3,824,000 3,284,000 3,731,000 4,549,000 6,096,000 6,038,000 5,338,000 1,949,000 1,981,000
0 0 0 0 0 0 0 0 0 0 0 3,132,000 1,071,000
0 0 0 0 0 0 0 0 0 0 0 53,000 77,000
756,104 663,916 1,024,879 1,040,000 1,003,000 603,000 1,141,000 1,654,000 1,734,000 1,346,000 1,655,000 1,702,000 1,832,000
7,022,954 7,452,175 15,708,513 6,066,000 9,074,000 9,317,000 18,389,000 11,637,000 12,589,000 11,112,000 16,451,000 18,077,000 18,039,000
0 742,502 1,710,233 636,000 768,000 1,213,000 1,445,000 2,138,000 1,584,000 1,526,000 1,349,000 1,371,000 02,205,701 2,163,560 2,922,962 2,688,000 2,074,000 1,763,000 1,431,000 3,329,000 3,192,000 2,712,000 8,535,000 2,267,000 2,282,000
0 0 0 0 0 0 0 0 0 0 0 0 0
$57,058,551 $40,691,487 $70,249,876 $67,114,000 $74,836,000 $32,981,000 $54,238,000 $57,867,000 $53,575,000 $48,891,000 $65,029,000 $76,355,000 $74,701,000
$867,145,558 $675,095,984 $1,120,398,447 $1,035,653,000 $1,030,263,000 $646,702,000 $806,608,000 $978,032,000 $869,420,000 $817,159,000 $742,384,000 $864,766,000 $896,968,000
77

Appendix 4D. Gross Value of Mineral Production 1949-2002, by product, in current and year-2000 Canadian dollars
B. **In Constant (year-2000) Canadian dollars
METALS
Iron Ore
Copper
Zinc
Lead
Gold
Silver
Cadmium
Antimony
Magnetite
Nickel
Cobalt
Total metals
NON-METALS
Asbestos
Barite
Clay/Brick
Cement
Dolomite
Fluorspar
Gemstone
Gypsum
Limestone
Peat
Pyrophyllite
Sand and Gravel
Quartz/SilicaStone (aggregate)
Stone (dimension)
Total non-metals
TOTAL PRODUCTION VALUE
***Canadian Consumer Price Index
1977 1978 1979 1980 1981 1982 1983 1984 1985 1986 1987 1988 1989
2,108,246,302 1,470,817,186 2,302,976,834 1,941,579,945 1,711,490,842 996,440,262 1,172,014,757 1,342,522,113 1,176,236,469 1,109,328,965 921,870,690 933,674,240 923,476,031
39,693,923 49,445,270 46,576,632 27,462,200 22,008,226 12,568,963 0 3,420,087 0 0 0 0 0
115,508,590 95,327,767 120,762,539 92,793,056 92,241,950 52,563,335 66,917,742 94,556,181 62,307,884 10,112,255 13,589,556 70,578,552 75,258,247
21,880,158 18,811,475 22,136,029 10,252,526 5,208,717 1,488,430 0 5,644,957 0 0 0 0 0
6,424,327 10,138,301 1,093,876 11,666,069 7,154,025 3,669,720 0 830,975 0 0 9,898,031 51,827,476 50,858,941
8,048,058 8,472,475 14,197,499 15,577,162 5,594,690 1,615,512 0 3,945,163 0 0 0 65,756 39,622
1,490,588 1,074,137 1,188,951 472,626 150,530 52,226 9,880 0 0 0 0 1,862,627 1,322,854
0 0 0 0 0 0 0 0 0 0 0 0 0
0 0 0 0 0 0 0 0 0 0 0 0 0
$2,301,291,945 $1,654,086,611 $2,508,932,360 $2,099,803,584 $1,843,848,980 $1,068,398,448 $1,238,942,379 $1,450,919,475 $1,238,544,354 $1,119,441,220 $945,358,277 $1,058,008,651 $1,050,955,696
83,660,332 47,926,181 86,586,629 97,887,882 99,565,803 16,747,012 27,477,162 39,954,626 27,719,213 23,829,369 26,784,139 36,091,763 31,791,951
0 0 0 0 0 0 0 0 0 0 0 0 0
1,562,438 1,543,525 1,574,431 1,747,417 1,777,409 1,497,134 2,274,120 2,437,738 2,037,307 1,854,885 1,579,889 2,039,765 1,219,326
14,702,435 14,822,586 16,207,799 13,907,793 10,768,669 11,003,936 16,523,184 12,101,968 13,327,508 12,429,040 13,568,621 14,776,219 19,640,866
0 0 0 0 0 0 0 0 0 0 0 2,799,309 2,098,673
24,672,651 177,607 0 0 0 0 0 0 0 0 2,311,215 8,397,927 8,208,085
0 0 0 0 0 0 0 0 0 0 0 45,626 204,499
9,129,185 12,887,131 12,419,250 9,348,465 7,379,819 5,716,963 6,143,911 7,172,880 9,254,413 8,797,953 7,450,041 2,615,462 2,531,955
0 0 0 0 0 0 0 0 0 0 0 4,202,989 1,368,866
0 0 0 0 0 0 0 0 0 0 0 71,123 98,415
2,147,937 1,731,032 2,448,560 2,254,732 1,935,659 1,049,735 1,878,907 2,608,033 2,632,407 1,961,253 2,309,820 2,284,000 2,341,515
19,950,780 19,430,100 37,529,544 13,151,157 17,511,632 16,219,534 30,281,526 18,349,263 19,111,516 16,191,265 22,960,027 24,258,442 23,056,002
0 1,935,930 4,085,954 1,378,855 1,482,139 2,111,655 2,379,510 3,371,206 2,404,690 2,223,530 1,882,747 1,839,814 0
6,265,947 5,641,063 6,983,311 5,827,615 4,002,548 3,069,125 2,356,456 5,249,179 4,845,815 3,951,648 11,911,971 3,042,202 2,916,669
0 0 0 0 0 0 0 0 0 0 0 0 0
$162,091,705 $106,095,156 $167,835,478 $145,503,916 $144,423,679 $57,415,095 $89,314,774 $91,244,893 $81,332,868 $71,238,944 $90,758,470 $102,464,642 $95,476,824
$2,463,383,650 $1,760,181,767 $2,676,767,838 $2,245,307,501 $1,988,272,659 $1,125,813,543 $1,328,257,154 $1,542,164,369 $1,319,877,222 $1,190,680,163 $1,036,116,747 $1,160,473,293 $1,146,432,519
1.61 1.75 1.91 2.11 2.37 2.62 2.77 2.90 3.01 3.14 3.27 3.40 3.57
78

Appendix 4D. Gross Value of Mineral Production 1949-2002, by product, in current and year-2000 Canadian dollars
A. In current Canadian dollars
*METALS
Iron Ore
Copper
Zinc
Lead
Gold
Silver
Cadmium
Antimony
Magnetite
Total metals
*NON-METALS
Asbestos
Barite
Clay/Brick
Cement
Dolomite
Fluorspar
Gemstone
Gypsum
Limestone
Peat
Pyrophyllite
Sand and Gravel
Quartz/SilicaStone (aggregate)
Stone (dimension)
Total non-metals
TOTAL PRODUCTION VALUE
1990 1991 1992 1993 1994 1995 1996 1997 1998 1999 2000 2001 2002
708,367,000 714,885,000 645,333,000 614,387,000 743,137,000 795,839,000 799,331,000 919,409,000 1,026,517,000 760,482,000 902,134,000 691,626,000 723,831,000
0 0 0 586,000 1,772,000 5,015,000 16,281,000 2,097,000 0 0 0 0 0
31,724,000 0 0 0 0 0 0 0 0 0 0 0 0
0 0 0 0 0 0 0 0 0 0 0 0 0
49,197,000 19,499,000 19,431,000 45,119,000 51,953,000 45,516,000 47,827,000 42,121,000 19,388,000 16,633,000 19,678,000 17,958,000 24,234,000
40,000 13,000 3,000 8,000 25,000 38,000 325,000 107,000 159,000 138,000 137,000 75,000 60,000
332,000 0 0 0 0 0 0 0 0 0 0 0 0
0 0 0 0 0 0 0 312,000 704,000 207,000 0 0 0
0 0 0 0 0 2,500,000 10,500,000 3,500,000 0 0 0 0 0
$789,660,000 $734,397,000 $664,767,000 $660,100,000 $796,887,000 $848,908,000 $874,264,000 $967,546,000 $1,046,768,000 $777,460,000 $921,949,000 $709,659,000 $748,125,000
29,005,000 3,259,000 3,531,000 4,023,000 2,045,000 983,000 388,000 0 0 0 0 0 0
0 0 0 0 0 0 0 0 530,000 36,000 0 0 0
795,000 785,000 725,000 4,000 537,000 381,000 228,000 358,000 300,000 300,000 0 0 0
13,972,000 10,643,000 9,557,000 8,083,000 7,237,000 7,163,000 8,500,000 8,617,000 9,218,000 10,700,000 6,915,000 0 0
2,291,000 2,611,000 1,266,000 786,000 3,402,000 2,252,000 3,533,000 8,193,000 7,484,000 7,179,000 9,498,000 8,349,000 9,010,000
2,300,000 0 0 0 0 0 0 0 0 0 0 0 0
0 0 0 0 0 0 0 0 0 0 0 0 0
3,571,000 2,930,000 2,409,000 3,797,000 500,000 0 273,000 207,000 264,000 948,000 558,000 464,000 540,000
1,040,000 2,717,000 2,428,000 2,123,000 3,216,000 1,775,000 3,338,000 4,139,000 5,301,000 5,369,000 6,925,000 2,815,000 4,217,000
68,000 141,000 725,000 948,000 1,046,000 1,092,000 1,035,000 873,000 964,000 1,172,000 817,000 813,000 860,000
1,748,000 1,027,000 1,590,000 1,139,000 1,340,000 1,103,000 4,000 0 0 45,000 5,000 0 105,000
14,456,000 11,396,000 17,610,000 14,509,000 16,200,000 12,027,000 11,269,000 11,719,000 17,764,000 9,904,000 10,528,000 11,719,000 11,133,000
0 0 0 0 0 0 0 0 0 0 2,640,000 2,178,000 2,178,000
5,357,000 2,362,000 1,064,000 2,148,000 1,006,000 1,300,000 3,654,000 3,064,000 3,250,000 4,931,000 9,683,000 11,600,000 11,020,000
0 35,000 205,000 1,212,000 4,909,000 4,485,000 4,845,000 5,422,000 3,952,000 3,057,000 4,704,000 7,064,000 4,838,000
$74,603,000 $37,906,000 $41,110,000 $38,772,000 $41,438,000 $32,561,000 $37,067,000 $42,592,000 $49,027,000 $43,641,000 $52,273,000 $45,002,000 $43,901,000
$864,263,000 $772,303,000 $705,877,000 $698,872,000 $838,325,000 $881,469,000 $911,331,000 $1,010,138,000 $1,095,795,000 $821,101,000 $974,222,000 $754,661,000 $792,026,000
79

Appendix 4D. Gross Value of Mineral Production 1949-2002, by product, in current and year-2000 Canadian dollars
B. **In Constant (year-2000) Canadian dollars
METALS
Iron Ore
Copper
Zinc
Lead
Gold
Silver
Cadmium
Antimony
Magnetite
Nickel
Cobalt
Total metals
NON-METALS
Asbestos
Barite
Clay/Brick
Cement
Dolomite
Fluorspar
Gemstone
Gypsum
Limestone
Peat
Pyrophyllite
Sand and Gravel
Quartz/SilicaStone (aggregate)
Stone (dimension)
Total non-metals
TOTAL PRODUCTION VALUE
***Canadian Consumer Price Index
1990 1991 1992 1993 1994 1995 1996 1997 1998 1999 2000 2001 2002
863,806,849 825,478,938 734,034,149 686,526,374 828,569,640 868,257,118 857,525,601 969,049,449 1,072,046,103 780,559,887 902,134,000 673,965,392 689,952,634
0 0 0 654,806 1,975,713 5,471,345 17,466,324 2,210,221 0 0 0 0 0
38,685,326 0 0 0 0 0 0 0 0 0 0 0 0
0 0 0 0 0 0 0 0 0 0 0 0 0
59,992,498 22,515,529 22,101,795 50,416,730 57,925,629 49,657,771 51,309,003 44,395,184 20,247,916 17,072,137 19,678,000 17,499,444 23,099,746
48,777 15,011 3,412 8,939 27,874 41,458 348,661 112,777 166,052 141,643 137,000 73,085 57,192
404,852 0 0 0 0 0 0 0 0 0 0 0 0
0 0 0 0 0 0 0 328,845 735,225 212,465 0 0 0
0 0 0 0 0 2,727,490 11,264,443 3,688,971 0 0 0 0 0
VB GVMS
$962,938,302 $848,009,478 $756,139,357 $737,606,849 $888,498,857 $926,155,181 $937,914,033 $1,019,785,447 $1,093,195,296 $797,986,132 $921,949,000 $691,537,921 $713,109,572
35,369,685 3,763,173 4,016,337 4,495,368 2,280,098 1,072,449 416,248 0 0 0 0 0 0
0 0 0 0 0 0 0 0 553,507 36,950 0 0 0
969,450 906,441 824,651 4,470 598,735 415,669 244,599 377,329 313,306 307,920 0 0 0
17,037,933 12,289,490 10,870,612 9,032,080 8,068,981 7,814,804 9,118,835 9,082,246 9,626,846 10,982,496 6,915,000 0 0
2,793,723 3,014,926 1,440,012 878,290 3,793,101 2,456,923 3,790,217 8,635,354 7,815,938 7,368,537 9,498,000 8,135,809 8,588,294
2,804,698 0 0 0 0 0 0 0 0 0 0 0 0
0 0 0 0 0 0 0 0 0 0 0 0 0
4,354,599 3,383,276 2,740,118 4,242,832 557,481 0 292,876 218,176 275,709 973,029 558,000 452,152 514,726
1,268,211 3,137,325 2,761,729 2,372,276 3,585,718 1,936,518 3,581,020 4,362,472 5,536,115 5,510,750 6,925,000 2,743,119 4,019,626
82,922 162,813 824,651 1,059,311 1,166,250 1,191,368 1,110,352 920,135 1,006,756 1,202,943 817,000 792,240 819,748
2,131,571 1,185,879 1,808,546 1,272,738 1,494,049 1,203,369 4,291 0 0 46,188 5,000 0 100,086
17,628,139 13,158,981 20,030,498 16,212,601 18,062,387 13,121,408 12,089,430 12,351,729 18,551,887 10,165,481 10,528,000 11,419,756 10,611,928
0 0 0 0 0 0 0 0 0 0 2,640,000 2,122,385 2,076,060
6,532,508 2,727,405 1,210,247 2,400,211 1,121,652 1,418,295 3,920,026 3,229,431 3,394,147 5,061,186 9,683,000 11,303,795 10,504,217
0 40,415 233,177 1,354,309 5,473,349 4,893,117 5,197,736 5,714,743 4,127,283 3,137,709 4,704,000 6,883,621 4,611,561
$90,973,439 $43,770,123 $46,760,578 $43,324,485 $46,201,802 $35,523,919 $39,765,631 $44,891,614 $51,201,494 $44,793,189 $52,273,000 $43,852,878 $41,846,247
$1,053,911,742 $891,779,602 $802,899,934 $780,931,335 $934,700,659 $961,679,100 $977,679,664 $1,064,677,061 $1,144,396,790 $842,779,321 $974,222,000 $735,390,799 $754,955,818
3.75 3.96 4.02 4.09 4.10 4.19 4.26 4.33 4.37 4.45 4.57 4.69 4.79
80
Notes*Mineral Production values (in current dollars) are taken from the Canadian Minerals Yearbook (NRCan) and unpublished files of the Newfoundland andLabrador Department of Mines and Energy.
**Deflation has been calculated using the Canadian Consumer Price Index.
***Canadian Consumer Price Index, base year 1971, from Statistics Canada.

Year*Metric Tonnes
produced
**Value of production in
current dollars
**Value of production in year-
2000 dollars
1949 1,504,011 $7,947,914 $62,596,6741950 1,060,993 $5,851,488 $44,773,1951951 1,564,886 $9,145,960 $63,301,1291952 1,500,373 $8,668,192 $58,574,4101953 2,437,135 $14,201,842 $96,826,8871954 3,409,677 $21,749,304 $147,404,7781955 6,537,974 $45,701,801 $309,282,7071956 7,678,023 $55,620,755 $370,913,2981957 7,416,035 $57,898,102 $374,085,6151958 4,890,429 $38,226,828 $240,523,6231959 5,539,106 $42,974,837 $267,451,0291960 6,904,914 $54,673,717 $336,136,6611961 6,904,891 $59,889,125 $364,764,6971962 7,245,603 $67,753,153 $407,768,6471963 8,784,273 $99,601,987 $589,354,7621964 11,578,920 $137,038,680 $796,428,3591965 13,154,628 $156,888,970 $890,271,8201966 15,010,450 $188,603,259 $1,031,784,0561967 15,405,418 $207,408,843 $1,095,310,5141968 17,876,362 $246,508,466 $1,251,167,4141969 13,350,325 $194,971,157 $946,469,9741970 21,372,715 $292,582,028 $1,375,015,1271971 19,846,442 $289,912,158 $1,324,318,7381972 16,394,405 $235,249,411 $1,026,379,4741973 22,133,101 $314,838,603 $1,273,855,3931974 22,026,637 $372,188,155 $1,359,037,1641975 22,585,445 $468,600,400 $1,544,420,3661976 26,756,991 $631,272,628 $1,936,637,5851977 26,658,063 $742,132,236 $2,108,246,3021978 18,782,158 $564,113,772 $1,470,817,1861979 30,220,000 $963,943,018 $2,302,976,8341980 24,620,000 $895,558,000 $1,941,579,9451981 25,686,000 $886,843,000 $1,711,490,8421982 15,806,000 $572,386,000 $996,440,2621983 18,405,000 $711,727,000 $1,172,014,7571984 21,184,000 $851,420,000 $1,342,522,1131985 20,192,000 $774,802,000 $1,176,236,4691986 19,185,000 $761,328,000 $1,109,328,9651987 18,423,000 $660,526,000 $921,870,6901988 20,507,000 $695,759,000 $933,674,2401989 20,662,000 $722,527,000 $923,476,0311990 18,970,000 $708,367,000 $863,806,8491991 19,799,000 $714,885,000 $825,478,9381992 17,691,000 $645,333,000 $734,034,1491993 18,238,000 $614,387,000 $686,526,3741994 20,279,000 $743,137,000 $828,569,6401995 19,969,000 $795,839,000 $868,257,1181996 19,657,813 $799,331,000 $857,525,6011997 21,747,537 $919,409,000 $969,049,4491998 21,631,073 $1,026,517,000 $1,072,046,1031999 18,742,573 $760,482,000 $779,421,5342000 21,091,478 $902,134,000 $902,134,0002001 17,310,000 $691,626,000 $673,965,3922002 17,500,000 $723,831,000 $689,952,634
Notes
Appendix 4E. Newfoundland and Labrador Iron-Ore Production; Tonnage produced vs Value. (All values in Canadian dollars.)
* Annual production tonnage and production value taken from the Canadian Minerals Yearbook, NRCan
** Deflation has been calculated using the Canadian Consumer Price Index (Statistics Canada) as per Appendix 4B
81

Appendix 4F. Historical values of selected Newfoundland and Labrador Mining Operations
OperationYear of initial commercial production
Year closed DurationCommodities
producedAmount produced in metric tonnes
*Average historical price
Subtotals for multi-commodity operations
in year-2000 $US
***Total historical value of production in
year-2000 $USNotes
Tilt Cove 1864 1917 53 copper 55,340 $6,056 $335,139,040 Price based on years 1886 to 1917
^gold 3.4 $11,179,408 $38,009,987 Price based on years 1900 -1917
Tilt Cove 1957 1967 10 copper 83,278 $4,005 $333,566,577
gold 1.3 $6,401,751 $8,322,276
Total Tilt Cove $715,037,880
Other NDB copper 1864 1917 53 copper 24,045 $6,056 $145,616,520 Price based on years 1886 - 1917
^gold 1.5 $11,179,408 $16,433,730
Total other NDB $162,050,250
Little Bay 1878 1904 26 copper 11,250 $5,634 $63,382,470 Price based on years 1886 - 1904
^gold 0.7 $12,100,938 $8,349,647 Price based on years 1900-04
Little Bay 1961 1969 8 copper 36,008 $4,198 $151,152,756
gold 0.2 $6,251,492 $1,250,298
Total Little Bay $224,135,172
Wabana 1894 1966 72 iron ore 38,710,760 $36 $1,393,587,360
****Aguathuna 1913 1967 54 limestone 4,702,795 $14 $65,839,130 Price based on years 1955-64
Buchans 1928 1984 56 copper 215,460 $3,703 $797,848,380
lead 1,224,720 $1,617 $1,980,372,240
zinc 2,350,620 $1,684 $3,958,444,080
gold 22 $1,129,931 $25,084,468
silver 2,041 $269,629 $550,312,789
Buchans total $7,312,061,957
St. Lawrence 1933 1978 45 fluorspar 3,010,761 $252 $758,711,772 Price based on years 1956-78
Flat Bay 1951 1994 43 gypsum 16,700,628 $15.90 $265,539,985
**IOCC Schefferville (Labrador component only) 1954 1983 29
iron ore, concentrate and pellets
111,041,340
see note ** and Table D-7
$6,069,719,158
**IOCC Labrador City 1962 2001 39
iron ore, concentrate and pellets
503,698,692
see note ** and Table D-7
$24,911,691,050
**Wabush Mines 1965 2001 36
iron ore, concentrate and pellets
186,944,196
see note ** and Table D-7
$9,128,557,282
Baie Verte Mines 1963 1987 24 asbestos fibre 1,046,107 $535 $559,667,245
1982 1987 5 asbestos fibre 244,198 $471 $115,017,258
Baie Verte Mines total total fibre 1,290,305 $674,684,503
Rambler 1964 1982 18 copper 111,286 $4,498 $500,564,428
zinc 273,887 $1,846 $505,595,402
gold 8 $13,621,628 $103,388,157
silver 61 $429,967 $26,013,004
Rambler total $1,135,560,990
Daniels Harbour 1975 1990 15 zinc 546,000 $1,896 $1,035,216,000
Lower Cove 1990 1995 5 limestone aggregate 2,267,827 $3.00 $6,803,481 Based on NDLME data
82

Appendix 4F. Historical values of selected Newfoundland and Labrador Mining Operations
OperationYear of initial commercial production
Year closed DurationCommodities
producedAmount produced in metric tonnes
*Average historical price
Subtotals for multi-commodity operations
in year-2000 $US
***Total historical value of production in
year-2000 $USNotes
Lower Cove1995 2001 6
high-purity limestone and dolomite
6,163,056 $5.65 $34,821,266 Based on NDLME data
Lower Cove total $41,624,747
Hope Brook 1987 1997 10 gold 19.4 $16,445,000 $319,033,000
1993 1997 4 copper 2,688 $2,774 $7,456,512
Hope Brook total $326,489,512
Ten Mile Bay 1993 2001 8 anorthosite 31,337 $387 $12,127,419
Nugget Pond 1997 2001 4 gold 6.2 $9,587,864 $59,435,169
4 silver 2.4 $162,824 $390,777
Total Nugget Pond $59,825,946
TOTAL = $54,292,460,114
Notes
NDB = Notre Dame Bay
***Due to the above price assumptions, the Total Historic Value of Production as calculated here may not match the actual values received. It does, however, provide a consistent basis for inter-operation comparison.
****The historical prices for limestone production from Aguathuna in its early years were not available, and the price is based on that for the period 1955-67 (Natural Resources Canada).
Historical prices for Lower Cove taken from Newfoundland and Labrador Department of Mines and Energy (NDLME) data in Appendix 4H.
*The Average Historic Prices for all commodities except iron ore were calculated by first converting annual historic prices for the duration of production to year-2000 US$ then averaging these over the period of mine production. Annual historic prices were taken in large part from the historical statistics of the United States Geological Survey (Kelly 2002 - see Appendix 4H). Some prices, e.g., dimension stone, limestone and anorthosite were taken from Natural Resources Canada and Newfoundland and Labrador Department of Mines and Energy data.
**The Total Historical Values of Production for the iron-ore mines of Schefferville (Labrador component only), Labrador City and Wabush are taken from Appendix 4G. These values were calculated directly by totaling the annual amounts of production multiplied by the annual US$ price.
^ Specific gold production amounts are only known for the period 1957 - 69. A crude estimate of earlier production has been made on the basis that the Tilt Cove ores averaged 2 ounces of gold per ton of copper (Snelgrove, 1935). Since gold was only recovered as a by-product from 1890 on, the amount calculated in this table for Little Bay and other Notre Dame Bay mines probably overstates the amount actually realized. Actual early recovery from Tilt Cove is based on the estimate conveyed by Snelgrove (1935) that the mine produced over 50,000 ounces of gold.
83

Appendix 4G. Labrador Iron-Ore Production, by Operation
Year ScheffervilleLabrador City
pellets Labrador City
concentrateLabrador City
totalWabush Mines Total Labrador
productionIron-ore price in year-2000 US$
Schefferville Labrador City total Wabush
1955 7,845,604 6,537,975 $46.39 $363,957,571
1956 12,215,933 7,678,024 $48.68 $594,671,622
1957 12,635,268 7,416,036 $49.58 $626,456,581
1958 8,094,846 4,890,429 $49.28 $398,914,033
1959 13,268,558 5,539,106 $50.12 $665,020,116
1960 9,966,405 6,904,915 $48.57 $484,068,292
1961 7,563,454 6,904,892 $52.58 $397,686,404
1962 9,954,212 751,875 751,875 7,245,604 $50.23 $500,000,092 $37,766,670
1963 6,861,365 1,864,446 2,252,576 4,117,022 8,784,274 $51.88 $355,967,636 $213,591,124
1964 7,793,080 5,021,304 1,574,873 6,596,177 11,578,921 $52.54 $409,448,449 $346,563,146
1965 7,137,730 5,410,450 1,529,151 6,939,601 132,086 13,154,628 $50.51 $360,526,751 $350,519,247 $6,671,669
1966 6,759,761 5,297,669 2,049,367 7,347,036 3,899,588 15,010,451 $50.43 $340,894,732 $370,511,018 $196,656,242
1967 6,620,562 6,621,578 1,378,776 8,000,354 5,053,818 15,405,419 $49.74 $329,306,766 $397,937,612 $251,376,896
1968 6,618,530 9,216,562 889,041 10,105,603 5,570,986 13,368,316 $48.43 $320,535,416 $489,414,376 $269,802,837
1969 4,298,895 8,225,917 333,263 8,559,180 3,374,292 13,350,326 $47.70 $205,057,285 $408,272,883 $160,953,733
1970 7,747,358 10,704,055 1,979,260 12,683,315 5,565,905 21,372,717 $46.10 $357,153,221 $584,700,808 $256,588,242
1971 6,017,030 9,628,061 1,823,804 11,451,866 5,686,815 19,846,443 $46.45 $279,491,059 $531,939,163 $264,152,559
1972 5,126,973 8,113,135 587,275 8,700,410 5,398,258 16,394,406 $49.79 $255,271,994 $433,193,437 $268,779,251
1973 7,727,037 9,876,993 3,109,104 12,986,097 5,524,248 22,133,104 $49.43 $381,947,460 $641,902,760 $273,063,556
1974 8,588,645 7,693,508 4,514,297 12,207,805 5,550,665 22,026,639 $54.15 $465,075,143 $661,052,625 $300,568,497
1975 7,139,432 9,161,000 6,462,000 15,623,000 3,258,000 22,585,446 $62.23 $444,286,853 $972,219,290 $202,745,340
1976 7,710,000 10,085,000 7,301,000 17,386,000 5,487,000 26,756,991 $68.28 $526,438,800 $1,187,116,080 $374,652,360
1977 7,621,000 11,158,000 6,435,000 17,593,000 5,640,000 26,658,063 $71.07 $541,624,470 $1,250,334,510 $400,834,800
1978 6,604,000 6,755,000 3,898,000 10,653,000 4,419,000 15,831,000 $73.25 $483,743,000 $780,332,250 $323,691,750
1979 8,818,000 10,649,000 8,363,000 19,012,000 5,539,000 30,219,792 $73.08 $644,419,440 $1,389,396,960 $404,790,120
1980 6,059,000 8,430,000 6,963,000 15,393,000 4,855,000 24,620,000 $72.09 $436,793,310 $1,109,681,370 $349,996,950
1981 4,181,000 10,057,000 7,091,000 17,148,000 5,291,000 25,686,000 $70.96 $296,683,760 $1,216,822,080 $375,449,360
1982 1,804,000 5,830,000 5,609,000 11,439,000 3,048,000 15,806,000 $69.04 $124,548,160 $789,748,560 $210,433,920
1983 1,601,000 6,590,000 5,618,000 12,208,000 5,180,000 18,404,585 $80.08 $128,208,080 $977,616,640 $414,814,400
1984 1,828,000 7,956,000 5,753,000 13,709,000 6,319,000 21,184,120 $66.21 $121,031,880 $907,672,890 $418,380,990
1985 1,830,000 8,168,000 4,997,000 13,165,000 5,696,000 20,192,123 $61.79 $113,075,700 $813,465,350 $351,955,840
1986 1,421,000 10,292,000 3,858,000 14,150,000 5,293,000 19,184,137 $53.77 $76,407,170 $760,845,500 $284,604,610
1987 1,173,000 9,135,000 2,958,000 12,093,000 5,478,000 18,423,302 $44.93 $52,702,890 $543,338,490 $246,126,540
1988 788,000 9,853,000 4,127,000 13,980,000 6,035,000 20,506,923 $41.26 $32,512,880 $576,814,800 $249,004,100
1989 177,000 9,838,000 5,130,000 14,968,000 5,953,000 21,119,380 $43.51 $7,701,270 $651,257,680 $259,015,030
1990 38,000 8,417,000 5,543,000 13,960,000 5,692,000 19,969,449 $40.72 $1,547,360 $568,451,200 $231,778,240
1991 264,000 7,906,000 7,096,000 15,002,000 4,796,000 19,799,248 $38.08 $10,053,120 $571,276,160 $182,631,680
Iron Ore Company of Canada Value of Production in year-2000 US$
PRODUCTION TONNAGE VALUE OF PRODUCTION
84

Appendix 4G. Labrador Iron-Ore Production, by Operation
Year ScheffervilleLabrador City
pellets Labrador City
concentrateLabrador City
totalWabush Mines Total Labrador
productionIron-ore price in year-2000 US$
Schefferville Labrador City total Wabush
Iron Ore Company of Canada Value of Production in year-2000 US$
PRODUCTION TONNAGE VALUE OF PRODUCTION
1992 120,000 7,831,000 4,818,000 12,649,000 5,176,000 17,691,747 $35.09 $4,210,800 $443,853,410 $181,625,840
1993 65,000 8,182,000 5,640,000 13,822,000 5,022,000 18,238,578 $30.75 $1,998,750 $425,026,500 $154,426,500
1994 0 10,031,000 5,475,000 15,506,000 5,076,000 20,278,926 $29.24 $0 $453,395,440 $148,422,240
1995 0 10,393,000 4,634,000 15,027,000 5,428,000 19,969,252 $31.34 $0 $470,946,180 $170,113,520
1996 0 10,674,000 4,038,000 14,712,000 5,337,000 19,957,813 $31.74 $0 $466,958,880 $169,396,380
1997 0 11,545,000 4,811,000 16,356,000 5,697,000 21,847,537 $32.11 $0 $525,191,160 $182,930,670
1998 0 10,982,637 5,031,162 16,013,799 5,617,274 23,265,706 $32.93 $0 $527,334,401 $184,976,833
1999 0 9,410,690 3,873,862 13,284,552 5,458,021 18,943,897 $27.68 $0 $367,716,399 $151,078,021
2000 0 11,500,000 3,900,000 15,400,000 5,897,240 21,091,517 $25.81 $0 $397,474,000 $152,207,764
2001 0 9,500,000 3,500,000 13,000,000 4,500,000 18,540,000 $23.08 $0 $300,040,000 $103,860,000
222,082,681 338,754,881 164,943,811 503,698,692 186,944,196 812,314,159 $12,139,438,316 $24,911,691,050 $9,128,557,282
*$6,069,719,158
Notes:
Schefferville: Newfoundland and Labrador component of total Schefferville production was about 50%.
Commercial mine production was from 1955-1982; thereafter from stockpiles.
Production data from 1984 on includes some Labrador City concentrate and may therefore be overvalued.
Production consisted mostly of direct-shipping ore but from 1973 to 1984 also included pellet production from Sept Isle.
Labrador City: Commercial production commenced 1959; pellets and concentrate.
Wabush: Commercial production commenced 1959; mostly pellets.
All production data taken from Canadian Minerals Year Book, Natural Resources Canada annual publications.
US$ price data was taken from United States Geological Survey historical statistics data Kelly (2002), updated for 2001 from Kirk (2002).
85

Appendix 4H. Historical Mineral Commodity Prices
YearCu unit value
($/t)
Cu unit value
($2000/t)
Iron ore unit value
($/t)
Iron ore unit value ($2000/t)
Lead unit value ($/t)
Lead unit value
($2000/t)
Zinc unit value ($/t)
Zinc unit value
($2000/t)
Gold unit value ($/t)
Gold unit value ($2000/t)
Silver unit value ($/t)
Silver unit value
($2000/t)
Limestone unit value
($/t)NRCAN
Limestone unit value ($2000/t) NRCAN
Limestone unit value
($/t) NLDME
Limestone unit value ($2000/t) NLDME
1886 $243 $4,6441887 $248 $4,7401888 $368 $7,0331889 $303 $5,791 $2.26 $43.191890 $347 $6,632 $2.25 $43.001891 $284 $5,428 $2.25 $43.001892 $255 $4,873 $2.01 $38.411893 $237 $4,529 $1.64 $31.341894 $211 $4,188 $1.12 $22.231895 $237 $4,892 $1.12 $23.121896 $240 $4,954 $1.40 $28.901897 $249 $5,139 $1.06 $21.881898 $265 $5,470 $1.12 $23.121899 $388 $8,008 $1.40 $28.90
1900 $357 $7,368 $2.35 $48.50 100 $2,064 $97 $2,002 $609,000 $12,569,760 $20,000 $412,800
1901 $355 $7,327 $1.68 $34.68 97 $2,002 $90 $1,858 $610,000 $12,590,400 $19,000 $392,160
1902 $256 $5,081 $1.82 $37.35 90 $1,786 $106 $2,104 $609,000 $12,086,308 $17,000 $337,385
1903 $291 $5,561 $1.88 $35.93 93 $1,777 $119 $2,274 $609,000 $11,638,667 $17,000 $324,889
1904 $282 $5,389 $1.55 $29.62 95 $1,816 $112 $2,140 $608,000 $11,619,556 $19,000 $363,111
1905 $344 $6,574 $1.75 $33.44 99 $1,892 $130 $2,484 $607,000 $11,600,444 $20,000 $382,222
1906 $425 $8,122 $2.09 $39.94 126 $2,408 $135 $2,580 $608,000 $11,619,556 $22,000 $420,444
1907 $441 $8,127 $2.53 $46.62 119 $2,193 $128 $2,359 $609,000 $11,223,000 $21,000 $387,000
1908 $291 $5,561 $2.25 $43.00 93 $1,777 $101 $1,930 $609,000 $11,638,667 $17,000 $324,889
1909 $289 $5,523 $2.13 $40.71 95 $1,816 $119 $2,274 $609,000 $11,638,667 $17,000 $324,889
1910 $284 $5,234 $2.46 $45.33 97 $1,788 $119 $2,193 $608,000 $11,204,571 $17,000 $313,286
1911 $277 $5,105 $1.98 $36.49 97 $1,788 $126 $2,322 $608,000 $11,204,571 $17,000 $313,286
1912 $363 $6,459 $1.95 $34.70 99 $1,762 $152 $2,705 $609,000 $10,836,000 $20,000 $355,862
1913 $342 $5,942 $2.12 $36.83 97 $1,685 $123 $2,137 $608,000 $10,563,232 $19,600 $340,525
1914 $293 $5,023 $1.76 $30.17 86 $1,474 $112 $1,920 $610,000 $10,457,143 $18,000 $308,571
1915 $385 $6,535 $1.83 $31.06 104 $1,765 $313 $5,313 $616,000 $10,455,789 $16,400 $278,368
1916 $627 $9,894 $2.40 $37.87 152 $2,399 $300 $4,734 $623,000 $9,830,826 $21,500 $339,266
1917 $644 $8,654 $3.12 $41.93 190 $2,553 $196 $2,634 $629,000 $8,452,188 $27,000 $362,813
1918 $544 $625 $3.46 $39.59 157 $1,796 $176 $2,014 $635,000 $7,265,188 $31,500 $360,399
1919 $401 $3,995 $3.20 $31.88 128 $1,275 $154 $1,534 $641,000 $6,385,251 $36,000 $358,610
1920 $386 $3,320 $4.14 $35.60 181 $1,557 $172 $1,479 $660,000 $5,676,000 $32,800 $282,080
1921 $279 $2,686 $3.00 $28.88 104 $1,001 $104 $1,001 $662,000 $6,372,985 $20,300 $195,425
1922 $299 $3,073 $3.32 $35.29 126 $1,295 $126 $1,295 $667,000 $6,856,016 $21,900 $225,108
1923 $325 $3,282 $3.44 $34.74 163 $1,646 $148 $1,494 $664,000 $6,704,971 $20,900 $211,045
1924 $293 $2,953 $2.83 $28.52 183 $1,844 $139 $1,401 $665,000 $6,701,953 $21,500 $216,680
1925 $315 $3,096 $2.57 $25.26 201 $1,976 $169 $1,661 $664,000 $6,526,171 $22,200 $218,194
1926 $310 $3,018 $2.52 $24.53 186 $1,811 $163 $1,587 $663,000 $6,454,868 $19,900 $193,743
1927 $288 $2,858 $2.50 $24.81 150 $1,488 $138 $1,369 $664,000 $6,588,923 $18,300 $181,592
1928 $327 $3,289 $2.45 $24.64 139 $1,398 $133 $1,338 $665,000 $6,688,889 $18,600 $187,088
1929 $405 $4,074 $2.65 $26.65 151 $1,519 $143 $1,438 $663,000 $6,668,772 $17,000 $170,994
1930 $292 $3,013 $2.47 $25.49 122 $1,259 $101 $1,042 $662,000 $6,831,840 $12,200 $125,904
1931 $185 $2,093 $2.36 $26.71 94 $1,064 $80 $905 $723,000 $8,181,316 $9,320 $105,463
1932 $128 $1,615 $1.41 $17.79 70 $883 $64 $807 $665,000 $8,389,731 $9,000 $113,545
1933 $160 $2,128 $3.52 $46.81 85 $1,130 $89 $1,184 $847,000 $11,264,227 $11,300 $150,278
1934 $191 $2,458 $2.64 $33.97 85 $1,094 $92 $1,184 $1,120,000 $14,411,970 $15,400 $198,165
1935 $196 $2,461 $2.66 $33.40 90 $1,130 $96 $1,205 $1,120,000 $14,061,314 $20,600 $258,628
1936 $214 $2,661 $2.64 $32.83 104 $1,293 $108 $1,343 $1,120,000 $13,925,783 $14,500 $180,289
86

Appendix 4H. Historical Mineral Commodity Prices
YearCu unit value
($/t)
Cu unit value
($2000/t)
Iron ore unit value
($/t)
Iron ore unit value ($2000/t)
Lead unit value ($/t)
Lead unit value
($2000/t)
Zinc unit value ($/t)
Zinc unit value
($2000/t)
Gold unit value ($/t)
Gold unit value ($2000/t)
Silver unit value ($/t)
Silver unit value
($2000/t)
Limestone unit value
($/t)NRCAN
Limestone unit value ($2000/t) NRCAN
Limestone unit value
($/t) NLDME
Limestone unit value ($2000/t) NLDME
1937 $295 $3,540 $2.82 $33.84 132 $1,584 $144 $1,728 $1,120,000 $13,440,000 $14,500 $174,000
1938 $225 $2,751 $2.56 $31.30 104 $1,272 $102 $1,247 $1,120,000 $13,694,787 $13,800 $168,739
1939 $247 $3,064 $2.99 $37.09 111 $1,377 $113 $1,402 $1,110,000 $13,768,269 $12,500 $155,048
1940 $254 $3,121 $2.52 $30.96 114 $1,401 $140 $1,720 $1,090,000 $13,391,429 $11,300 $138,829
1941 $265 $3,101 $2.65 $31.01 128 $1,498 $165 $1,931 $1,090,000 $12,753,741 $11,300 $132,218
1942 $265 $2,802 $2.61 $27.60 143 $1,512 $182 $1,924 $1,090,000 $11,525,410 $12,200 $129,000
1943 $265 $2,640 $2.62 $26.10 143 $1,424 $182 $1,813 $1,090,000 $10,857,915 $14,500 $144,440
1944 $265 $2,595 $2.69 $26.34 143 $1,400 $182 $1,782 $1,090,000 $10,672,486 $14,500 $141,973
1945 $265 $2,537 $2.72 $26.04 143 $1,369 $182 $1,742 $1,120,000 $10,722,078 $16,700 $159,874
1946 $310 $2,734 $3.01 $26.55 179 $1,579 $192 $1,694 $1,120,000 $9,878,974 $25,700 $226,687
1947 $469 $3,617 $3.44 $26.53 323 $2,491 $232 $1,789 $1,120,000 $8,638,565 $23,100 $178,170
1948 $492 $3,521 $3.88 $27.77 398 $2,848 $299 $2,140 $1,120,000 $8,015,534 $23,800 $170,330
1949 $430 $3,108 $4.46 $32.23 339 $2,450 $268 $1,937 $1,020,000 $7,371,429 $23,100 $166,941
1950 $476 $3,407 $4.92 $35.21 293 $2,097 $306 $2,190 $1,120,000 $8,015,534 $23,800 $170,330
1951 $540 $3,581 $5.40 $35.81 386 $2,560 $397 $2,633 $1,120,000 $7,428,278 $28,600 $189,686
1952 $540 $3,505 $6.21 $40.31 363 $2,356 $357 $2,317 $1,110,000 $7,204,528 $27,300 $177,192
1953 $640 $4,123 $6.81 $43.87 297 $1,913 $239 $1,540 $1,120,000 $7,214,981 $27,300 $175,865
1954 $660 $4,231 $6.76 $43.33 310 $1,987 $236 $1,513 $1,130,000 $7,243,230 $27,300 $174,991
1955 $827 $5,321 $7.21 $46.39 334 $2,149 $271 $1,744 $1,130,000 $7,270,324 $28,600 $184,010 1.95 $12.54
1956 $926 $5,870 $7.68 $48.68 353 $2,238 $297 $1,883 $1,130,000 $7,163,145 $29,300 $185,735 1.98 $12.56
1957 $665 $4,070 $8.10 $49.58 323 $1,977 $251 $1,536 $1,120,000 $6,855,516 $29,300 $179,345 1.87 $11.42
1958 $580 $3,456 $8.27 $49.28 267 $1,591 $227 $1,353 $1,130,000 $6,733,025 $28,600 $170,411 2.00 $11.90
1959 $683 $4,037 $8.48 $50.12 269 $1,590 $253 $1,495 $1,130,000 $6,679,038 $29,300 $173,182 1.85 $10.96
1960 $713 $4,148 $8.35 $48.57 263 $1,530 $286 $1,664 $1,130,000 $6,573,619 $29,300 $170,449 1.86 $10.84
1961 $668 $3,847 $9.13 $52.58 240 $1,382 $255 $1,469 $1,130,000 $6,507,589 $29,600 $170,464 2.07 $11.92
1962 $683 $3,890 $8.82 $50.23 212 $1,207 $256 $1,458 $1,130,000 $6,435,762 $35,000 $199,338 1.97 $11.23
1963 $683 $3,843 $9.22 $51.88 246 $1,384 $265 $1,491 $1,130,000 $6,358,561 $41,200 $231,834 1.96 $11.04
1964 $713 $3,960 $9.46 $52.54 300 $1,666 $299 $1,661 $1,130,000 $6,276,426 $41,500 $230,506 1.86 $10.31
1965 $780 $4,259 $9.25 $50.51 353 $1,927 $320 $1,747 $1,130,000 $6,170,159 $41,500 $226,603 7.62 $41.62
1966 $794 $4,215 $9.50 $50.43 333 $1,768 $320 $1,699 $1,130,000 $5,998,765 $41,500 $220,309 4.08 $21.64
1967 $840 $4,334 $9.64 $49.74 309 $1,594 $305 $1,574 $1,130,000 $5,830,800 $49,800 $256,968 1.08 $5.57
1968 $908 $4,496 $9.78 $48.43 291 $1,441 $298 $1,476 $1,290,000 $6,388,100 $68,800 $340,699 1.25 $6.18
1969 $1,050 $4,934 $10.15 $47.70 329 $1,546 $323 $1,518 $1,340,000 $6,297,268 $57,550 $270,454 1.51 $7.08
1970 $1,280 $5,679 $10.39 $46.10 346 $1,535 $338 $1,500 $1,170,000 $5,191,058 $56,910 $252,498 1.02 $4.51
1971 $1,150 $4,892 $10.92 $46.45 306 $1,302 $356 $1,514 $1,330,000 $5,657,708 $49,830 $211,973 1.98 $8.42
1972 $1,130 $4,653 $12.09 $49.79 331 $1,363 $391 $1,610 $1,880,000 $7,742,059 $54,010 $222,419 2.84 $11.71
1973 $1,310 $5,079 $12.75 $49.43 359 $1,392 $456 $1,768 $3,150,000 $12,211,871 $82,310 $319,098 2.69 $10.42
1974 $1,700 $5,939 $15.50 $54.15 496 $1,733 $793 $2,770 $5,140,000 $17,956,940 $151,400 $528,926 3.03 $10.60
1975 $1,410 $4,513 $19.44 $62.23 474 $1,517 $859 $2,750 $5,190,000 $16,613,151 $142,100 $454,861 2.87 $9.17
1976 $1,530 $4,630 $22.56 $68.28 509 $1,540 $816 $2,470 $4,030,000 $12,196,364 $139,900 $423,392 3.41 $10.33
1977 $1,470 $4,179 $25.00 $71.07 677 $1,925 $758 $2,155 $4,770,000 $13,560,992 $148,500 $422,182 2.79 $7.92
1978 $1,450 $3,829 $27.74 $73.25 743 $1,962 $683 $1,804 $6,220,000 $16,425,384 $173,600 $458,432 2.64 $6.97
1979 $2,030 $4,818 $30.79 $73.08 1,160 $2,753 $822 $1,951 $9,890,000 $23,473,965 $356,600 $846,392 1.77 $4.20
1980 $2,230 $4,662 $34.48 $72.09 937 $1,959 $825 $1,725 $19,700,000 $41,188,006 $663,300 $1,386,802 2.25 $4.70
1981 $1,860 $3,523 $37.46 $70.96 805 $1,525 $983 $1,862 $14,800,000 $28,035,242 $338,200 $640,643 3.02 $5.72
1982 $1,600 $2,856 $38.68 $69.04 562 $1,003 $848 $1,514 $12,100,000 $21,596,679 $255,600 $456,208 3.94 $7.03
1983 $1,690 $2,922 $46.31 $80.08 478 $827 $913 $1,579 $13,600,000 $23,517,426 $367,800 $636,008 3.34 $5.78
1984 $1,470 $2,438 $39.92 $66.21 564 $935 $1,070 $1,775 $11,600,000 $19,240,116 $261,700 $434,064 4.68 $7.76
1985 $1,480 $2,370 $38.58 $61.79 421 $674 $890 $1,425 $10,200,000 $16,335,196 $197,400 $316,134 5.04 $8.07
1986 $1,460 $2,294 $34.22 $53.77 485 $762 $838 $1,317 $11,800,000 $18,540,804 $175,900 $276,384 4.15 $6.52
1987 $1,820 $2,759 $29.64 $44.93 791 $1,199 $924 $1,401 $15,400,000 $23,344,301 $225,400 $341,676 8.88 $13.46
87

Appendix 4H. Historical Mineral Commodity Prices
YearCu unit value
($/t)
Cu unit value
($2000/t)
Iron ore unit value
($/t)
Iron ore unit value ($2000/t)
Lead unit value ($/t)
Lead unit value
($2000/t)
Zinc unit value ($/t)
Zinc unit value
($2000/t)
Gold unit value ($/t)
Gold unit value ($2000/t)
Silver unit value ($/t)
Silver unit value
($2000/t)
Limestone unit value
($/t)NRCAN
Limestone unit value ($2000/t) NRCAN
Limestone unit value
($/t) NLDME
Limestone unit value ($2000/t) NLDME
1988 $2,660 $3,874 $28.33 $41.26 818 $1,191 $1,330 $1,937 $14,100,000 $20,535,140 $209,900 $305,697 5.52 $8.05
1989 $2,890 $4,016 $31.31 $43.51 869 $1,208 $1,810 $2,515 $12,300,000 $17,093,455 $176,800 $245,701 5.55 $7.71
1990 $2,710 $3,573 $30.89 $40.72 1,010 $1,332 $1,640 $2,162 $12,400,000 $16,347,471 $155,000 $204,343 4.92 $6.48 $3.29 $4.34
1991 $2,410 $3,048 $30.11 $38.08 739 $935 $1,160 $1,467 $11,700,000 $14,797,059 $129,900 $164,285 4.71 $5.96 $3.53 $4.46
1992 $2,370 $2,910 $28.58 $35.09 774 $950 $1,290 $1,584 $11,100,000 $13,627,409 $126,700 $155,549 3.56 $4.38 $2.15 $2.64
1993 $2,020 $2,409 $25.79 $30.75 699 $834 $1,020 $1,216 $11,600,000 $13,833,141 $138,200 $164,805 1.99 $2.38 $1.21 $1.44
1994 $2,450 $2,847 $25.16 $29.24 820 $953 $1,090 $1,267 $12,400,000 $14,410,811 $170,100 $197,684 4.09 $4.76 $1.92 $2.23
1995 $3,050 $3,448 $27.73 $31.34 933 $1,055 $1,230 $1,390 $12,400,000 $14,016,210 $165,600 $187,184 3.90 $4.40 $2.16 $2.44
1996 $2,400 $2,635 $28.90 $31.74 1,080 $1,186 $1,130 $1,241 $12,500,000 $13,726,325 $166,900 $183,274 4.78 $5.25 $5.51 $6.05
1997 $2,360 $2,533 $29.92 $32.11 1,030 $1,105 $1,420 $1,524 $10,700,000 $11,483,361 $157,200 $168,709 5.45 $5.85 $6.24 $6.69
1998 $1,730 $1,828 $31.16 $32.93 992 $1,048 $1,130 $1,194 $9,490,000 $10,028,343 $164,000 $173,303 5.03 $5.32 $5.80 $6.13
1999 $1,670 $1,727 $26.77 $27.68 963 $996 $1,180 $1,220 $9,000,000 $9,306,613 $169,000 $174,758 4.70 $4.86 $5.42 $5.61
2000 $1,940 $1,940 $25.81 $25.81 962 $962 $1,230 $1,230 $9,000,000 $9,000,000 $161,000 $161,000 0.00 $5.39 $5.39
2001 $1,755 $1,697 $23.87 $23.08 962 $930 $970 $938 $8,398,000 $8,121,004 $141,000 $136,349 $4.19 $4.05
2002e $1,650 $1,565 $23.00 $21.82 970 $920 $890 $844 $9,806,000 $9,301,279 $145,000 $137,537
88

Appendix 4H. Historical Mineral Commodity Prices
Year
1886
1887
1888
1889
1890
1891
1892
1893
1894
1895
1896
1897
1898
1899
1900
1901
1902
1903
1904
1905
1906
1907
1908
1909
1910
1911
1912
1913
1914
1915
1916
1917
1918
1919
1920
1921
1922
1923
1924
1925
1926
1927
1928
1929
1930
1931
1932
1933
1934
1935
1936
Asbestos unit value
($/t)
Asbestos unit value ($2000/t)
Fluorspar unit value
($/t)
Fluorspar unit value ($2000/t)
Gypsum unit value
($/t)
Gypsum unit value ($2000/t)
Anorthosite unit value
($/t)
Anorthosite unit value ($2000/t)
US CPICanadian/US
dollar exchange rates
27
27
27
27
27
27
27
27
26
25
25
25
25
25$17 $352 25$20 $411 25$18 $353 26$21 $398 27$19 $366 27$15 $291 27$19 $355 27$20 $370 28$23 $442 27$22 $428 27$20 $376 28$17 $320 28$22 $392 29$22 $378 30 1$17 $287 30 0.9998$24 $404 30 1.01$33 $515 33 1.0081$38 $514 38 1.0094$51 $585 45 1.0244$61 $605 52 1.0525$63 $543 60 1.19$48 $464 54 1.1775$38 $388 50 1.0663$39 $389 51 1.03$34 $338 51 1.0359$34 $334 53 1.0047$35 $341 53 1.0063$41 $408 52 1.0019$43 $431 51 1.0044$47 $477 51 1.03$38 $389 50 1.0128$41 $464 46 1.2488$33 $416 41 1.195$30 $399 39 1.23$34 $438 40 1.0163$36 $452 41 1.0263$31 $385 42 1.0069
89

Appendix 4H. Historical Mineral Commodity Prices
Year
1937
1938
1939
1940
1941
1942
1943
1944
1945
1946
1947
1948
1949
1950
1951
1952
1953
1954
1955
1956
1957
1958
1959
1960
1961
1962
1963
1964
1965
1966
1967
1968
1969
1970
1971
1972
1973
1974
1975
1976
1977
1978
1979
1980
1981
1982
1983
1984
1985
1986
1987
Asbestos unit value
($/t)
Asbestos unit value ($2000/t)
Fluorspar unit value
($/t)
Fluorspar unit value ($2000/t)
Gypsum unit value
($/t)
Gypsum unit value ($2000/t)
Anorthosite unit value
($/t)
Anorthosite unit value ($2000/t)
US CPICanadian/US
dollar exchange rates
$31 $372 43 1.0031$26 $318 42 1.035$37 $459 42 1.11$37 $455 42 1.11$33 $386 44 1.11$36 $381 49 1.11$61 $608 52 1.11$63 $617 53 1.11$40 $383 54 1.105$40 $353 59 1.005$42 $324 67 1.005$54 $386 72 1.005$66 $477 71 1.105$76 $544 72 1.105$84 $557 78 1.0731$96 $623 $6.90 $44.8 80 1.0113$98 $631 $4.88 $31.4 80 0.9978
$109 $699 $5.21 $33.4 81 0.9875$111 $714 $4.17 $26.8 80 1.0006$127 $805 $48 $304 $5.56 $35.3 81 0.9997$124 $759 $30 $184 $4.61 $28.2 84 0.9863$129 $769 $31 $185 $4.43 $26.4 87 0.9916$106 $627 $31 $183 $4.42 $26.1 87 0.9819$103 $599 $45 $262 $4.56 $26.5 89 0.9981$91 $524 $45 $259 $2.63 $15.2 90 1.0438$97 $552 $45 $256 $3.42 $19.5 91 1.09$85 $478 $41 $231 $3.35 $18.9 92 1.0856$86 $478 $41 $228 $2.74 $15.2 93 1.0825$95 $519 $41 $224 $2.50 $13.6 95 1.085$97 $515 $44 $234 $2.59 $13.8 97 1.0841$99 $511 $46 $237 $2.47 $12.8 100 1.0834$95 $470 $49 $243 $2.77 $13.7 104 1.09$93 $437 $52 $244 $2.82 $13.2 110 1.0825$94 $417 $64 $284 $3.04 $13.5 116 1.0822
$103 $438 $71 $302 $3.19 $13.6 121 1.0253$112 $461 $72 $297 $3.19 $13.1 125 1.0094$120 $465 $72 $279 $3.13 $12.1 133 1.0116$139 $486 $72 $252 $3.71 $12.9 148 0.9956$159 $509 $95 $304 $3.82 $12.2 161 1.04$232 $703 $95 $288 $4.25 $12.9 171 1.043$260 $739 $95 $270 $4.78 $13.6 182 1.1157$273 $721 $103 $272 $5.35 $14.1 195 1.141$262 $621 $104 $247 $5.24 $12.4 217 1.171$283 $591 $106 $222 $5.82 $12.2 247 1.169$324 $614 $6.39 $12.1 272 1.199$285 $508 $6.51 $11.6 289 1.234$305 $527 $5.47 $9.5 298 1.233$313 $518 $6.62 $11.0 311 1.295$297 $475 $8.62 $13.8 322 1.366$246 $386 $8.82 $13.9 328 1.39$274 $415 $8.56 $13.0 340 1.326
90

Appendix 4H. Historical Mineral Commodity Prices
Year
1988
1989
1990
1991
1992
1993
1994
1995
1996
1997
1998
1999
2000
2001
2002e
Asbestos unit value
($/t)
Asbestos unit value ($2000/t)
Fluorspar unit value
($/t)
Fluorspar unit value ($2000/t)
Gypsum unit value
($/t)
Gypsum unit value ($2000/t)
Anorthosite unit value
($/t)
Anorthosite unit value ($2000/t)
US CPICanadian/US
dollar exchange rates
$252 $367 $7.47 $10.9 354 1.231$234 $325 $7.67 $10.7 371 1.184$261 $344 $7.57 $10.0 391 1.167$383 $484 $7.98 $10.1 408 1.146$394 $484 $8.73 $10.7 $321 $394 420 1.209$435 $519 $7.48 $8.9 $334 $398 433 1.290$506 $588 $7.26 $8.4 $334 $388 444 1.366$226 $255 $7.29 $8.2 $300 $339 457 1.373$222 $244 $7.54 $8.3 $353 $388 470 1.363$205 $220 $7.81 $8.4 $353 $379 481 1.385$200 $211 $7.12 $7.5 $394 $416 488 1.484
$0 $6.99 $7.2 $386 $399 499 1.486
$0 $7.00 $7.0 $409 $409 516 1.486
$373 $361 534 1.540
544
91
NotesAll data is taken from United States Geological Survey (USGS) historical statistics (Kelley etal., 2002) locally updated for 2000 - 2002 from USGS mineral commodity statistics http://min-erals.usgs.gov/minerals/pubs/commodity/#C, unless otherwise stated.
$/t = Historical US$/metric tonne value (i.e., in current dollars of the time)
$2000/t = year-2000 US$/metric tonne (i.e., deflated value)
e = estimated prices
Grey cells = Statistics Canada data
NRCAN = Natural Resources Canada, Canadian Minerals Yearbook
NLDME = Newfoundland and Labrador Department of Mines and Energy, unpublished data
NRCAN prices for gypsum
NLDME prices for flurospar
NLDME prices for high purity limestone and dolomite

Appendix 4I. Mining Tax Royalties and Other Taxation Revenue, 1990 to 1998
A. *Revenue breakdown In current Canadian dollars
Corporate tax Fuel tax Retail sales tax Payroll taxOther
revenueSundry tax
Municipal tax
Total Other Taxation Revenue
1998 $27,800,000 $5,838,000 $6,162,517 $26,481,752 $3,640,821 $1,200,000 $36,313,098 $5,314,544 $84,950,732 $112,750,732
1997 $23,580,257 $5,160,000 $8,537,076 $6,049,078 $3,820,819 $1,650,000 $47,231,976 $5,485,741 $77,934,690 $101,514,947
1996 $21,710,864 $4,717,000 $8,045,395 $23,721,058 $3,608,634 $6,297,831 $45,252,439 $5,491,344 $97,133,701 $118,844,565
1995 $19,238,459 $3,981,000 $7,313,048 $17,537,448 $3,520,923 $1,961,962 $46,447,395 $4,961,724 $85,723,500 $104,961,959
1994 $16,992,978 $3,209,000 $7,389,224 $11,218,225 $3,409,894 $812,325 $38,864,710 $5,140,030 $70,043,408 $87,036,386
1993 $14,247,979 $2,907,000 $7,349,339 $11,723,978 $3,225,485 $1,296,666 $29,591,920 $5,059,533 $61,153,921 $75,401,900
1992 $14,936,814 $3,052,000 $4,316,416 $18,716,233 $2,448,803 $1,644,178 $31,867,000 $5,060,258 $67,104,888 $82,041,702
1991 $21,657,975 $5,250,000 $8,227,884 $20,588,748 $2,182,600 $1,650,000 $31,779,100 $4,455,658 $74,133,990 $95,791,965
1990 $21,300,000 $4,473,000 $1,985,699 $13,634,711 $2,239,567 $1,600,000 $32,251,149 $4,906,791 $61,090,917 $82,390,917
Averages $20,162,814 $4,287,444 $6,591,844 $16,630,137 $3,121,950 $2,012,551 $37,733,199 $5,097,291 $75,474,416 $95,637,230
Average as a percentage of the total taxation value for 1990-1998 ($95,637,230)
21.08 4.48 6.89 17.39 3.26 2.10 39.45 5.33 100.00
Italicized figures indicates Corporate Tax that has been estimated on basis that it is historically an average 21% of mining tax + royalties
Year
***Canadian Consumer Price Index
(CPI)
Total Taxation Revenue in
constant year-2000 $
Direct Revenue in
constant year-2000 $
Indirect Revenue in
constant year-2000 $
2000 4.57
1999 4.45
1998 4.37 $117,859,346 $29,059,588 $88,799,758
1997 4.33 $107,094,752 $24,876,354 $82,218,398
1996 4.26 $127,437,083 $23,280,570 $104,156,513
1995 4.19 $114,431,081 $20,974,053 $93,457,028
1994 4.1 $96,971,271 $18,932,664 $78,038,607
1993 4.09 $84,214,151 $15,913,146 $68,301,005
1992 4.02 $93,225,496 $16,972,977 $76,252,519
1991 3.96 $110,499,418 $24,983,240 $85,516,178
1990 3.75 $100,363,122 $25,946,240 $74,416,882
Averages $105,788,414 $22,326,537 $83,461,877
Notes
*Revenue data is taken from unpublished files of the Newfoundland and Labrador Department of Mines and Energy
** Deflation has been calculated using the Canadian Consumer Price Index
*** Canadian Consumer price Index, base year 1971, from Statisitics Canada
B. **Direct and Indirect Provincial Revenue, 1990 to 1998, in constant year-2000 Canadian dollars
Mining Tax & Royalties
Other Taxation Revenue from MiningTotal Taxation Revenue (Mining & Royalties + Other)
Year
92

Appendix 4J. Employment and Annual Wages in the Newfoundland and Labrador Mining Industry
Year *Employment**Annual wages in current $
Annual wages in year-2000 $
Average individual
annual wage in year-2000 $
***CPI
1949 3507 $8,416,000 $66,283,255 $18,900 0.58
1950 0.597
1951 0.66
1952 0.676
1953 3800 $13,102,000 $89,328,263 $23,507 0.67
1954 3800 $14,000,000 $94,884,273 $24,970 0.674
1955 3796 $12,788,000 $86,541,606 $22,798 0.675
1956 0.685
1957 0.707
1958 0.726
1959 0.734
1960 0.743
1961 0.75
1962 4350 $21,000,000 $126,387,352 $29,055 0.759
1963 5000 $27,000,000 $159,761,658 $31,952 0.772
1964 5500 $28,000,000 $162,727,735 $29,587 0.786
1965 6000 $36,000,000 $204,283,230 $34,047 0.805
1966 6500 $40,000,000 $218,826,347 $33,666 0.835
1967 0.865
1968 0.9
1969 0.941
1970 0.972
1971 6955 $65,377,000 $298,642,136 $42,939 1
1972 6000 1.047
1973 1.129
1974 1.251
1975 1.386
1976 1.489
1977 1.608
1978 1.752
1979 1.912
1980 2.107
1981 2.367
1982 2.624
1983 2.774
1984 2.897
1985 3.009
1986 $98,696,000 $143,809,674 3.135
1987 $102,525,000 $143,090,192 3.273
1988 4361 3.404
1989 4580 $130,439,000 $166,716,663 $36,401 3.574
1990 4342 $161,747,000 $197,239,801 $45,426 3.746
1991 3357 $154,944,000 $178,914,103 $53,296 3.956
1992 3053 $163,098,000 $185,515,853 $60,765 4.016
1993 2832 $160,553,000 $179,404,624 $63,349 4.088
1994 2985 $160,370,000 $178,806,483 $59,902 4.097
1995 2850 $168,223,000 $183,530,610 $64,397 4.187
1996 2887 $170,078,000 $182,460,381 $63,201 4.258
1997 2996 $178,382,000 $188,013,146 $62,755 4.334
1998 2788 $181,834,000 $189,898,882 $68,113 4.374
1999 2732 $183,443,000 $188,286,175 $68,919 4.451
2000 2661 4.568
2001e 2437 4.688
2002f 2438 4.792
Notes:
***CPI = Canadian Consumer Price Index, source Statistics Canada
All currency in Canadian dollars
Blank cells indicate missing or not reported information
e = estimated, as of 2001
f = forecast, as of 2001
*Employment figures derived from Newfoundland Department of Mines and Energy (and predecessor departments) published and unpublished data (annual reports prior to 1973; unpublished data 1988 - 1993; web site data 1994 on).
** Annual wage data from Newfoundland Department of Mines and Energy (and predecessor departments) annual reports prior to 1973; and from Canadian Minerals Yearbook (Natural Resources Canada) from 1986 onward.
93

Appendix 4K. Historical Exploration Statistics for Newfoundland and Labrador
YearNF current
$LB current
$Total
current $NF, year-
2000 $LB, year-
2000 $ Total, year-
2000 $*CPI NF LB Total
Claims in good-
standingProduction Exploration NF LB
Total NF & LB
1949 1,000 $7,876 0.58 271 258
1950 2,000 $15,303 0.60
1951 1,500 $10,382 0.66
1952 3,000 $20,272 0.68
1953 1,500 $10,227 0.67 0 26,895
1954 2,000 $13,555 0.67 3 9,399
1955 3,000 $20,302 0.68
1956 3,500 $23,340 0.69
1957 5,500 $35,536 0.71 0
1958 12,000 $75,504 0.73 0
1959 16,000 $99,575 0.73 40
1960 4,500 $27,666 0.74 42 2,197
1961 4,000 $24,363 0.75 30 20,613
1962 5,000 $30,092 0.76 0 15,181
1963 2,000 $11,834 0.77 867 16,145
1964 2,500 $14,529 0.79 105 28,204
1965 3,000 $17,024 0.81 1 46,052
1966 3,500 $19,147 0.84 73 52,795
1967 4,500 $23,764 0.87 30 41,272
1968 4,000 $20,302 0.90 40 48,769
1969 6,000 $29,126 0.94 20 42,543
1970 6,500 $30,547 0.97 9 55,791
1971 5,500 $25,124 1.00 42 39,926
1972 5,000 $21,815 1.05 35 542 16,456
1973 6,500 $26,299 1.13 490 1,029 41,410
1974 6,000 $21,909 1.25 1,456 2,304 25,011
1975 7,000 $23,071 1.39 2,711 3,967 23,809
1976 6,000 $18,407 1.49 891 2,856 23,701
1977 7,500 $21,306 1.61 2,085 3,472 4,600
1978 8,500 $22,162 1.75 8,876 11,990 42,313
1979 13,000 $31,059 1.91 6,255 14,560 67,262
1980 13,000 $28,184 2.11 13,099 20,772 65,882
1981 13,482 2,518 16,000 $26,018 $4,859 $30,878 2.37 13,661 0 13,661 25,012 25,224 39,278 64,503 0 64,503
1982 9,360 2,640 12,000 $16,294 $4,596 $20,890 2.62 4,670 0 4,670 18,517 24,810 23,961 39,429 9,342 48,771
1983 6,334 1,366 7,700 $10,430 $2,249 $12,680 2.77 5,825 409 6,234 15,769 1,220 25,794 25,362 1,652 27,014
1984 7,596 444 8,040 $11,977 $700 $12,678 2.90 11,021 1,057 12,078 21,246 19,533 24,613 43,941 205 44,146
1985 12,347 253 12,600 $18,744 $384 $19,128 3.01 12,320 2,229 14,549 30,236 24,107 14,634 37,582 1,359 38,941
1986 11,738 62 11,800 $17,103 $90 $17,194 3.14 12,413 2,861 15,274 34,256 21,373 29,772 48,035 3,110 51,145
1987 32,309 191 32,500 $45,092 $267 $45,359 3.27 19,534 2,548 22,082 48,359 11,561 78,111 87,781 1,891 89,672
1988 40,706 453 41,159 $54,625 $608 $55,233 3.40 25,763 843 26,606 68,667 17,449 217,382 234,313 518 234,831
1989 35,028 1,221 36,249 $44,770 $1,561 $46,331 3.57 16,956 615 17,571 65,223 16,355 106,497 122,852 0 122,852
1990 22,520 754 23,274 $27,462 $919 $28,381 3.75 8,968 1,453 10,421 45,427 8,884 84,462 91,346 1,350 92,696
1991 10,933 1,131 12,064 $12,624 $1,306 $13,930 3.96 5,426 1,985 7,411 33,297 6,850 37,077 43,327 600 43,927
Claims Staked Diamond Drilling(m)Exploration expenditures $ (x000s)
94

Appendix 4K. Historical Exploration Statistics for Newfoundland and Labrador
YearNF current
$LB current
$Total
current $NF, year-
2000 $LB, year-
2000 $ Total, year-
2000 $*CPI NF LB Total
Claims in good-
standingProduction Exploration NF LB
Total NF & LB
Claims Staked Diamond Drilling(m)Exploration expenditures $ (x000s)
1992 7,429 3,712 11,141 $8,450 $4,222 $12,672 4.02 3,503 1,615 5,118 24,002 819 21,054 19,349 2,524 21,873
1993 7,251 1,654 8,905 $8,102 $1,848 $9,951 4.09 5,177 1,778 6,955 22,910 16,982 29,528 38,310 8,200 46,510
1994 11,241 1,155 12,396 $12,533 $1,288 $13,821 4.10 1,468 20,788 22,256 36,698 7,260 42,225 48,552 933 49,485
1995 10,295 60,818 71,113 $11,232 $66,352 $77,584 4.19 17,864 230,842 248,706 280,750 8,107 120,803 56,660 72,250 128,910
1996 11,104 81,443 92,547 $11,912 $87,372 $99,285 4.26 9,666 5,633 15,299 168,815 9,424 226,206 54,399 181,233 235,632
1997 10,266 61,486 71,752 $10,820 $64,806 $75,626 4.33 8,620 4,743 13,363 126,766 13,318 141,320 49,145 105,493 154,638
1998 10,989 37,011 48,000 $11,476 $38,653 $50,129 4.37 11,329 3,147 14,476 86,955 4,967 90,428 33,802 61,593 95,395
1999 14,096 18,257 32,353 $14,468 $18,739 $33,207 4.45 9,470 173 9,643 57,431 4,168 112,095 62,857 53,406 116,263
2000 15,378 11,939 27,317 $15,378 $11,939 $27,317 4.57 6,783 6,185 12,968 46,880 6,920 67,626 45,356 29,190 74,546
2001 11,010 17,432 28,442 $10,729 $16,987 $27,716 4.69 9,885 5,780 15,665 47,425 N/A N/A 32,700 14,476 47,176
2002 12,890 31,300 44,190 $12,287 $29,835 $42,122 4.79 27,574 5,552 33,126 66,287 N/A N/A 46,071 20,625 66,696
Notes:
Blank cells are missing or not reported data
NF = Newfoundland
LB = Labrador
*CPI = Canadian Consumer Price Index, source Statistics Canada
Source for all data is Newfoundland and Labrador Department of Mines and Energy (or predecessor departments). Information prior to 1981 is taken from Swinden 1993; that for post-1981 is available on the Department web site.
95

Appendix 4L. Canadian Exploration Expenditures, by Province and Territory 1989-2002, in year-2000 dollars
In millions of Canadian $
Jurisdiction 1989 1990 1991 1992 1993 1994 1995 1996 1997 1998 1999 2000 2001 *2002
Newfoundland and Labrador $43.7 $27.3 $13.8 $12.6 $9.9 $13.6 $76.4 $97.7 $61.2 $42.9 $30.4 $27.3 $28.4 $35.7
Nova Scotia $25.8 $12.9 $5.1 $3.7 $2.0 $1.9 $3.1 $7.3 $7.0 $5.1 $3.8 $3.6 $2.8 $3.4
New Brunswick $16.4 $19.4 $18.0 $13.8 $12.3 $11.0 $13.7 $15.6 $12.7 $10.5 $10.4 $12.1 $9.5 $3.0
Quebec $223.5 $230.3 $157.7 $106.0 $117.8 $143.1 $132.5 $144.9 $176.4 $130.0 $107.1 $94.1 $102.9 $114.3
Ontario $263.1 $179.0 $125.3 $87.3 $83.9 $124.1 $139.4 $205.9 $184.7 $117.1 $84.0 $117.9 $113.6 $140.2
Manitoba $44.7 $48.3 $33.9 $36.0 $30.4 $44.5 $35.0 $43.6 $42.2 $31.0 $23.4 $28.1 $28.7 $26.7
Saskatchewan $76.5 $49.5 $36.0 $29.2 $59.0 $55.6 $47.1 $53.4 $52.3 $60.8 $37.2 $45.6 $37.5 $38.8
Alberta $7.5 $12.5 $7.5 $6.1 $8.1 $10.3 $11.4 $11.5 $21.4 $22.7 $11.8 $7.2 $4.5 $5.8
British Columbia $225.4 $265.6 $154.9 $80.7 $73.3 $93.3 $85.3 $110.7 $100.3 $46.6 $34.6 $35.9 $29.1 $34.1
Yukon $18.2 $21.6 $18.8 $10.9 $21.3 $28.2 $42.2 $49.0 $42.5 $18.4 $12.7 $11.2 $7.8 $7.2
Northwest Territories $55.2 $42.2 $36.1 $48.1 $111.9 $164.2 $185.0 $205.5 $157.7 $120.8 $63.1 $51.4 $86.6 $60.0
**Nunavut $0.0 $0.0 $0.0 $0.0 $0.0 $0.0 $0.0 $0.0 $0.0 $0.0 $35.0 $62.1 $61.3 $64.9
Total Canada $1,000.0 $908.6 $607.1 $434.4 $529.9 $689.8 $771.1 $945.1 $858.4 $605.9 $453.5 $496.5 $512.7 $534.1
Notes:
Source - Natural Resources Canada, Minerals and Metals sector; figures for Newfoundland and Labrador differ from the provincial estimates in Appendix 4K.
Expenditures include field and overhead expenses for exploration and deposit appraisal.
Type of deflator used by NRCan is unknown.
* Preliminary estimate
**Nunavut was not constituted untill 1999
96