the middle institutions trap: a parabolic association
TRANSCRIPT

W&M ScholarWorks W&M ScholarWorks
Undergraduate Honors Theses Theses, Dissertations, & Master Projects
4-2015
The Middle Institutions Trap: A Parabolic Association Between The Middle Institutions Trap: A Parabolic Association Between
Institutions and Income For OPEC Countries Institutions and Income For OPEC Countries
Jake W. Schneider The College of William & Mary
Follow this and additional works at: https://scholarworks.wm.edu/honorstheses
Part of the Econometrics Commons, Economic History Commons, Economic Theory Commons,
Growth and Development Commons, International Economics Commons, Macroeconomics Commons,
Near and Middle Eastern Studies Commons, Other International and Area Studies Commons, Political
Economy Commons, and the Political Theory Commons
Recommended Citation Recommended Citation Schneider, Jake W., "The Middle Institutions Trap: A Parabolic Association Between Institutions and Income For OPEC Countries" (2015). Undergraduate Honors Theses. Paper 196. https://scholarworks.wm.edu/honorstheses/196
This Honors Thesis is brought to you for free and open access by the Theses, Dissertations, & Master Projects at W&M ScholarWorks. It has been accepted for inclusion in Undergraduate Honors Theses by an authorized administrator of W&M ScholarWorks. For more information, please contact [email protected].


! ! Schneider!2!
The$Middle$Institutions$Trap:$A$Parabolic$Association$Between$Institutions$and$Income$
$For$OPEC$Countries$$
Jake$Schneider1$$$
Undergraduate$Honors$Thesis,$Dept.$of$Economics$April$25,$2015$
$$
Abstract$$
The!literature!on!economic!development!asserts!that!institutions!are!positively!associated!with!economic!growth.!Empirically!I!demonstrate!this!relationship!for!a!sample!size!of!169!countries!of!the!world!when!institutions!(as!measured!by!the!Polity!IV!index)!are!regressed!upon!income!(represented!by!log!GDP!per!capita)!in!2010.!However,!something!fascinating!occurs!when!the!sample!size!is!restricted!to!only!Middle!East!North!Africa!(MENA)!and!Organization!of!Petroleum!Exporting!Countries!(OPEC)!countries.!In!these!cases,!contrary!to!predicted!outcomes!posited!by!the!literature,!this!relationship!between!income!and!institutions!is,!in!fact,!negative.!This!means!that!Middle!Eastern!and!oilVrich!countries!with!worse!institutions!perform!better!than!nations!with!stronger!institutions.!Furthermore,!these!results!persist!when!income!in!2010!is!expanded!into!the!average!growth!rate!between!1990!and!2010!and!the!model!is!enlarged!to!include!numerous!control!variables.!The!coefficient!for!OPEC!is!both!precisely!estimated!and!large,!and!implies!that!a!decrease!of!V0.27%!in!growth!for!every!one!step!increase!in!institutional!quality.!This!translates!to!a!4.48%!decrease!in!economic!growth!if!Saudi!Arabia!(V10),!the!OPEC!country!with!the!lowest!institutional!quality,!were!to!increase!its!institutional!quality!to!the!level!of!Ecuador!(+5),!the!OPEC!country!with!strongest!institutional!quality.!Consider!that!Saudi!Arabia’s!average!growth!rate!was!only!5.9%!per!year!for!this!period,!meaning!that!this!would!translate!to!a!75%!decrease.!Further!investigation!of!this!trend!demonstrates!a!Middle!Institutions!Trap,!where!oil!rich!countries!on!the!extremes!of!the!institutional!quality!spectrum!perform!better!than!those!in!the!center.!This!has!many!policy!implications,!including,!most!fundamentally,!how!these!more!extractive!oilVrich!regimes!will!transition!once!their!natural!resource!wealth!"dries!up.”!
!!!!!!!!!!!!!!!!!!!!!!!!!!!!!!!!!!!!!!!!!!!!!!!!!!!!!!!!1!Jake!is!an!undergraduate!in!the!Department!of!Economics!at!the!College!of!William!&!Mary,!Williamsburg,!VA!23187,!USA.!He!would!like!to!thank!his!thesis!advisor!Lance!Kent.!Lance!Kent!is!affiliated!with!the!Department!of!Economics!at!the!College!of!William!&!Mary,!Williamsburg,!VA!23187,!USA.!He!would!also!like!to!thank!Fahad!Bishara!for!his!assistance!throughout!the!project.!Fahad!Bishara!is!the!Prize!Fellow!in!Economics,!History!and!Politics!at!Harvard!University,!Cambridge,!MA!02138,!USA!and!a!Professor!of!History!at!the!College!of!William!&!Mary,!Williamsburg,!VA!23187,!USA.!!

! ! Schneider!3!
Table$of$Contents$!
Table$of$Figures$........................................................................................................................$4!
List$of$Tables$.............................................................................................................................$5!Chapter$1:$The$Empirical$Bivariate$Model$for$the$Relationship$Between$Institutional$Quality$and$Income$.......................................................................................$6!
Introduction$..............................................................................................................................$6!What$Are$Institutions$And$Why$Do$they$Matter?$.........................................................$7!
Does$the$Theory$Hold$With$169$Countries$of$the$World?$..........................................$9!Are$Institutions$Correlated$With$Middle$Eastern$and$OPEC$Countries?$...........$12!Empirical$Evidence$for$the$Negative$Correlation$......................................................$13!
What$Is$The$Key$Institution$For$This$Inverse$Relationship?$.................................$17!Does$Constraint$on$the$Executive$Fit$With$the$Model?$............................................$19!
Chapter$2:$Expanding$the$Empirical$Model$for$the$Growth$Rate,$Control$Variables,$and$An$Instrumental$Variable$.....................................................................$22!Controlling$for$the$Growth$Rate$......................................................................................$22!
Expanding$the$Model:$Controlling$for$Omitted$Variables$......................................$29!Main$Results$...........................................................................................................................$32!
Robustness$Test:$Instrumental$Variable$Regression$...............................................$36!
Implications$of$the$Main$Results$.....................................................................................$41!Chapter$3:$The$Middle$Institutions$Trap$......................................................................$43!
Introduction$To$the$Middle$Institutions$Trap$............................................................$43!Does$An$Upward]Facing$“U”$Signal$A$Middle$Institutions$Trap?$..........................$44!
Empirical$Evidence$for$the$Parabolic$“U”$.....................................................................$45!The$Middle$Institutions$Trap$Fitted$for$MENA$and$OPEC$Countries$...................$46!Does$The$Middle$Institutions$Trend$Persist$for$Income$At$The$Level?$..............$49!
The$Arab$Spring$As$Evidence$of$the$Middle$Institutions$Trap$..............................$53!The$Transition$.......................................................................................................................$53!The$Fate$of$Extractive$Institutions$.................................................................................$54!
Works$Cited$............................................................................................................................$56!Appendix:$Definitions$and$Descriptive$Statistics$......................................................$59!$

! ! Schneider!4!
Table$of$Figures$Figure!1:!TwoVWay!Scatter!Plot!and!Linear!Regression!of!Log!GDP!Per!Capita!(1995!
USD)!on!Constraint!on!the!Executive!(1990),!Proxy!for!Institutional!Strength,!for!54!Countries.!...............................................................................................................................!9!
Figure!2:!TwoVWay!Scatter!Plot!and!Linear!Regression!of!Log!GDP!Per!Capita!in!2010!(2005!USD)!on!Polity!IV!Score!in!2010,!Proxy!for!Institutional!Strength,!for!All!Countries.!............................................................................................................................!11!
Figure!3:!Two!Way!Scatter!Plot!and!Linear!Regression!of!Log!GDP!Per!Capita!in!2010!(2005!USD)!on!Polity!IV!Score!(2010),!Proxy!for!Institutional!Strength,!for!MENA!Countries.!...........................................................................................................................!14!
Figure!4:!Two!Way!Scatter!Plot!and!Linear!Regression!of!Log!GDP!Per!Capita!(2005!USD)!on!Polity!IV!Score!(2010),!Proxy!for!Institutional!Strength,!for!MENA!Restricted!countries.!....................................................................................................................!15!
Figure!5:!Two!Way!Scatter!Plot!and!Linear!Regression!of!Log!GDP!Per!Capita!(2005!USD)!on!Polity!IV!Score!(2010),!Proxy!for!Institutional!Strength,!for!OPEC!Countries.!..........................................................................................................................................!16!
Figure!6:!Two!Way!Scatter!Plot!and!Linear!Regression!of!Log!GDP!Per!Capita!(2005!USD)!on!Constraints!on!the!Executive!(2010),!Proxy!for!Institutional!Strength,!for!All!Countries.!............................................................................................................................!20!
Figure!7:!Two!Way!Scatter!Plot!and!Linear!Regression!of!Log!GDP!Per!Capita!(2005!USD)!on!Constraints!on!the!Executive!(2010),!Proxy!for!Institutional!Strength,!for!OPEC!Countries.!......................................................................................................................!21!
Figure!8:!TwoVWay!Scatter!Plot!and!Linear!Regression!of!Mean!Log!of!GDP!Per!Capita!Growth!Rate!(1990V2010)!and!Mean!Polity!IV!(1990V2010)!for!All!Sample.!...............................................................................................................................................!24!
Figure!9:!TwoVWay!Scatter!Plot!of!Leverage!and!Normalized!Residual!Squared!For!All!Sample.!........................................................................................................................................!25!
Figure!10:!TwoVWay!Scatter!Plot!and!Linear!Regression!of!Mean!Log!of!GDP!Per!Capita!Growth!(1990V2010)!and!Mean!Polity!IV!(1990V2010)!for!All!Sample!Restricted,!Excluding!Outliers.!................................................................................................!27!
Figure!11:!TwoVWay!Scatter!Plot!and!Linear!Regression!of!Mean!Log!of!GDP!Per!Capita!Growth!(1990V2010)!and!Mean!Polity!IV!(1990V2010)!for!MENA.!..........!28!
Figure!12:!TwoVWay!Scatter!Plot!and!Linear!Regression!of!Mean!Log!of!GDP!Per!Capita!Growth!(1990V2010)!and!Mean!Polity!IV!(1990V2010)!for!OPEC.!............!29!
Figure!13:!“The!Middle!Institutions!Trap”!for!OPEC!and!All!Restricted,!Qfit!for!All!Restricted,!Growth!Rate.!............................................................................................................!46!
Figure!14:!“The!Middle!Institutions!Trap”!for!MENA!and!All!Restricted,!Qfit!for!MENA,!Growth!Rate.!....................................................................................................................!47!
Figure!15:!“The!Middle!Institutions!Trap”!for!OPEC!and!All!Restricted,!Qfit!for!OPEC,!Growth!Rate.!....................................................................................................................................!48!
Figure!16:!“The!Middle!Institutions!Trap”!for!OPEC!and!All!Restricted,!Qfit!for!All,!Income!Level!in!2010.!.................................................................................................................!50!
Figure!17:!“The!Middle!Institutions!Trap”!for!MENA!and!All!Restricted,!Qfit!for!MENA,!Income!Level!in!2010.!..................................................................................................!51!
Figure!18:!“The!Middle!Institutions!Trap”!for!OPEC!and!All!Restricted,!Qfit!for!OPEC,!Income!Level!in!2010.!.................................................................................................................!52!
! ! Schneider!5!
List$of$Tables$Table!1:!Coefficients!of!Regressions!Between!Institutional!Quality!Variable!and!Log!
GDP!Per!Capita!...............................................................................................................................!18!Table!2:!Cook’s!Distance!of!Influential!Observation!Countries.!.........................................!26!Table!3:!Ordinary!Least!Squares!Regressions!of!Growth!Rate!on!Polity!IV!With!6!
Controls.!............................................................................................................................................!33!Table!4:!2VStage!Least!Squares!Regressions!of!Growth!On!Polity!IV!With!6!Controls!
Instrumenting!Tropics!for!Polity!IV.!.....................................................................................!39!Table!5:!OLS!Regressions!Between!Income!Or!Growth!and!Polity!IV!and!Polity2!......!45!Table!6:!Bivariate!Regressions!Between!Growth!and!The!Square!of!Polity!IV!for!All!
Restricted,!OPEC!and!nonVOPEC.!............................................................................................!49!
$
$!!!!!!!!!!!!
!!!!!!!!

! ! Schneider!6!
Chapter$1:$The$Empirical$Bivariate$Model$for$the$Relationship$Between$Institutional$Quality$and$Income$
Introduction$
$ The!literature!on!economic!development!provides!compelling!evidence!that!
institutions!are!positively!correlated!with!economic!growth.2!One!possible!
explanation!for!the!correlation!is!that!better!economic!institutions!are!mutually!
reinforcing!with!better!political!institutions,!which!enables!a!stable!environment!for!
business,!and!thus!growth.!!I!confirm!that!there!is!positive!association!between!
institutional!quality!(as!measured!by!the!Polity!IV!Index,!a!widely!recognized!
measure)!and!GDP!per!capita!(the!standard!measure!of!income)!when!considering!
169!of!the!countries!of!the!world!as!a!single!group.!However,!this!positive!
correlation!reverses!when!the!sample!is!restricted!to!MENA!(Middle!East!North!
African)!and!OPEC!(Organization!of!Petroleum!Exporting!Countries)!countries.!Why!
is!this!the!case?!!
Although!the!literature!asserts!that!higher!oil!rents!allow!extractive!regimes!
to!“buy”!patronage,3!I!argue!that!lower!(and!thus!worse)!Polity!IV!scores!may!
actually!be!more!conducive!to!stability!and!thus!still!allow!growth.4!Ultimately!this!
presents!a!challenge.!How!will!oilVrich!regimes!adjust!once!natural!resource!rents!
run!out?!!
!!!!!!!!!!!!!!!!!!!!!!!!!!!!!!!!!!!!!!!!!!!!!!!!!!!!!!!!2!See!Daron!Acemoglu!and!James!Robinson,!Why3Nations3Fail!(New!York:!Crown!Publishers,!2012).!3!See!Kevin!K.!Tsui,!"More!Oil,!Less!Democracy:!Evidence!From!Worldwide!Crude!Oil!Discoveries,"!The!Economic!Journal!121!(2010):!89V115.!4!More!discussion!of!the!necessity!of!stability!will!follow!in!Chapter!2!and!Chapter!3,!especially!with!discussion!of!the!Middle!Institutions!Trap.!

! ! Schneider!7!
What$Are$Institutions$And$Why$Do$they$Matter?$
! In!Institutions,3Institutional3Change3and3Economic3Performance,3Douglass!C.!
North!elaborates!on!his!Nobel!PrizeVwinning!research!on!economic!and!institutional!
change.5!In!this!text,!he!defines!institutions!as,!“[The]!rules!of!the!game!in!a!society!
or,!more!formally,![…]!the!humanly!devised!constraints!that!shape!human!
interaction”!(1990).!Expanding!on!North’s!assertions,!economists!and!political!
scientists!Daron!Acemoglu,!Simon!Johnson!and!James!Robinson!present!the!findings!
of!years!worth!of!research!that!demonstrate!that!institutions!are!the!causal!variable!
related!to!differences!in!GDP!between!nations!today.6!!
! Using!panel!data!regressions,!Acemoglu,!Johnson!and!Robinson,!find!a!
positive!correlation!between!institutions!and!GDP!per!capita,!substantiating!their!
previous!assertion:!Institutions!matter,!and!they!matter!a!lot.!In!Acemoglu!and!
Robinson’s!book!Why3Nations3Fail3(2012),!they!argue!that!institutions!can!either!be!
inclusive!or!extractive.!Inclusive!institutions!promote!incentives!for!economic!
output,!and!are!characterized!by!secure!property!rights,!an!unbiased!rule!of!law,!and!
fair!competition!(2012).!In!contrast,!extractive!institutions!“are!designed!to!extract!
incomes!and!wealth!from!one!subset!of!society!to!benefit!a!different!subset”!(2012).!
Ultimately,!inclusive!institutions!support!economic!growth!and!higher!GDP!per!
!!!!!!!!!!!!!!!!!!!!!!!!!!!!!!!!!!!!!!!!!!!!!!!!!!!!!!!!5!See!nobelprize.org!for!the!1993!winners!of!Robert!W.!Fogel!and!Douglass!C.!North.!6!See!Daron!Acemoglu,!Simon!Johnson!and!James!A.!Robinson,!“Reversal!of!Fortune:!Geography!and!Institutions!in!the!Making!of!the!Modern!World!Income,”!The3Quarterly3Journal3of3Economics!(Oxford!University!Press)!117,!no.!4!(Nov!2002):!1231V1294,!and!Daron!Acemoglu,!Simon!Johnson!and!James!A.!Robinson,!“The!Colonial!Origins!of!Comparative!Development:!An!Empirical!Investigation,”!The3American3Economic3Review!91,!no.!5!(Dee!2001):!1369V1401.!

! ! Schneider!8!
capita;!extractive!institutions!promote!infighting,!allow!for!income!inequality,!and!
all!around!retard!growth.!!
Inclusive!political!institutions!are!mutually!reinforcing!with!inclusive!
economic!institutions.!One!supports!the!other!through!a!positive!feedback!loop.!
Acemoglu!and!Robinson!write:!“Inclusive!economic!institutions,!in!turn,!are!forged!
on!foundations!laid!by!political!institutions,!which!make!power!broadly!distributed!
in!society!and!constrain!its!arbitrary!exercise![…]!facilitating!the!persistence!of!
inclusive!political!institutions”!(2012).!In!contrast,!extractive!economic!institutions!
perpetuate!extractive!political!institutions.!!The!persistence!of!institutional!systems!
is!an!important!component!of!economic!growth!and!explains!divergence!between!
differing!levels!of!income!in!the!world!today.!
The!positive!relationship!between!institutional!quality!and!economic!growth!
is!presented!in!the!twoVway!scatter!plot!and!regression!line!presented!below.!When!
log!GDP!per!capita!(in!this!case!for!1995)!is!regressed!against!“Contraint!on!the!
Executive”!(a!measure!of!institutions!taken!from!the!Polity!IV!Index),$!the!regression!
line!shows!a!positive!correlation!(see!Figure!2).!According!to!the!Polity!IV!Project!
manual,!Executive!Constraint!“refers!!to!the!extent!of!institutionalized!constraints!
on!the!decisionVmaking!powers!of!chief!executives,”!and!is!an!appropriate!measure!
for!institutions!because!it!shows!the!degree!of!“extractiveness”!of!the!political!
regime!(Marshall,!Gurr!and!Jaggers!2014).!
!
!!!!

! ! Schneider!9!
Figure!1:!TwoVWay!Scatter!Plot!and!Linear!Regression!of!Log!GDP!Per!Capita!(1995!USD)!on!Constraint!on!the!Executive!(1990),!Proxy!for!Institutional!Strength,!for!54!Countries.!$
!Source:!Acemoglu,!Johnson!and!Robinson,!An!African!Success!Story:!Botswana!2001!!! Empirically,!Acemoglu,!Johnson!and!Robinson’s!theory!that!institutions!are!
positively!correlated!with!income!is!borne!out!by!the!evidence.!“The!crossVcountry!
evidence!is!therefore!consistent!with!the!idea!that!Botswana!(the!target!country!in!
their!case!study)!was!successful!because!it!has!good!institutions,”!and!therefore!
good!institutions!are!related!to!higher!income!(Acemoglu,!Johnson!and!Robinson,!An!
African!Success!Story:!Botswana!2001).!There!are!two!problems!with!this!
regression.!First,!whether!“Constraints!on!the!Executive”!is!the!best!measure!of!
institutional!quality,!and!second,!the!fact!that!this!regression!only!includes!54!of!the!
world’s!recognized!countries.!Where!are!the!MENA!and!OPEC!countries?!
Does$the$Theory$Hold$With$169$Countries$of$the$World?$
! Before!we!examine!the!association!between!institutions!and!income!for!the!
MENA!and!OPEC!countries,!let’s!examine!the!relationship!between!institutions!and!

! ! Schneider!10!
income!for!the!world!a!little!further.!Marshall,!Gurr!and!Jagger’s!Polity!IV!Project!
Dataset!(2014)!includes!multiple!measures!for!institutions.!The!overarching!
measure!of!institutions!is,!in!fact,!the!Polity!IV!Score,!an!amalgamation!variable!of!
several!other!indices!of!institutions!measured!on!a!scale!from!V10!(perfect!
autocracy)!to!+10!(pure!democracy).!For!example,!the!countries!with!the!lowest!
Polity!IV!scores!(approximately!V10)!are!Saudi!Arabia!and!Qatar!(whom!both!
happen!to!be!in!MENA!and!OPEC),!and!the!countries!with!the!best!scores!
(approximately!+10)!are!all!of!the!Organization!of!Economic!Cooperation!and!
Development!(OECD)!countries,!including!the!United!States!and!Canada.!These!
Polity!IV!scores!are!highly!correlated!with!institutions!(and!thus!a!valid!“proxy”!
variable),!because,!as!the!Polity!IV!manual!states,!one!of!the!criteria!for!the!
democracy!and!autocracy!scores!is!“the!presence!of!institutions!and!procedures!
through!which!citizens!can!express!effective!preferences!about!alternative!policies!
and!leaders”!(Marshall,!Gurr!and!Jaggers!2014).!!
! What!does!the!data!show?!When!I!regressed!the!Polity!IV!score!(from!2010,!
chosen!because!it!was!the!year!with!the!most!robust!data!for!the!Middle!East!before!
the!turmoil!of!the!Arab!Spring)!on!log!GDP!per!capita!(as!was!done!by!Acemoglu,!
Johnson!and!Robinson!in!their!2011!article!“Botswana:!An!African!Success!Story”)!
for!169!of!the!world’s!countries!in!2010!for!which!data!was!available,!each!
incremental!increase!in!Polity!IV!score!is!associated!with!a!positive!7%!increase!in!
income.7!!This!can!be!seen!in!the!twoVway!scatter!plot!and!regression!presented!
below!(Figure!2).!
!!!!!!!!!!!!!!!!!!!!!!!!!!!!!!!!!!!!!!!!!!!!!!!!!!!!!!!!7!The!results!are!highly!statistically!with!a!PVvalue!of!0.000.!

! ! Schneider!11!
!
Figure!2:$TwoVWay!Scatter!Plot!and!Linear!Regression!of!Log!GDP!Per!Capita!in!2010!(2005!USD)!on!Polity!IV!Score!in!2010,!Proxy!for!Institutional!Strength,!for!All!Countries.$
!Source:!GDP!Per!Capita!(2005!USD)!from!World!Bank!World!Development!Indicators,!Polity!IV!from!Polity!IV!Project,!Author’s!Calculations.!!
Empirically,!the!association!theorized!by!the!literature!persists!in!the!larger!
sample.!There!is!a!positive!correlation!between!institutional!strength!and!GDP!per!
capita.!However,!notice!the!topVleft!corner.!There!is!a!large!subVset!of!countries!that!
have!both!high!GDP!per!capita!and!low!institutional!quality!(in!fact,!very!low).!Upon!
closer!inspection,!the!vast!majority!of!these!countries!are!from!the!Middle!East!and!
North!Africa.!Furthermore,!most!of!them!are!also!OPEC!members.!Therefore,!the!
question!remains:!What!is!the!trend!between!institutions!and!income!for!MENA!and!
OPEC!countries?!

! ! Schneider!12!
Are$Institutions$Correlated$With$Middle$Eastern$and$OPEC$Countries?$
! In!light!of!the!previous!evidence,!what!actually!happens!when!we!run!this!
same!regression!between!the!Polity!IV!score!and!GDP!per!capita!when!the!sample!is!
restricted!for!only!MENA!countries?!As!shown!by!the!twoVway!scatter!plot!
presented!in!Figure!3,!there!is!a!negative3correlation.!MENA!countries!with!worse!
institutions!have!higher!incomes.!This!completely!contradicts!both!the!institutions!
literature,!which!theorizes!that!better!institutions!lead!to!higher!incomes,!and!the!
natural!resource!literature,!which!predicts!that!countries!with!both!bad!institutions!
and!resource!deposits!will!be!victims!to!the!“natural!resource!curse.”!The!natural!
resource!curse!can!be!defined!as!the!following:!!
Countries!with!large!endowments!of!natural!resources,!such!as!oil!and!
gas,!often!perform!worse3in!terms!of!economic!development!and!good!
governance!than!do!countries!with!fewer!resources.!Paradoxically,!
despite!the!prospects!of!wealth!and!opportunity!that!accompany!the!
discovery!and!extraction!of!oil!and!other!natural!resources,!such!as!
endowment!all!too!often!impede!rather!than!further!balanced!and!
sustainable!development.!(Humphreys,!Sachs!and!Stiglitz!2007).!
In!fact,!Sachs!and!Warner!demonstrate!through!multiple!regressions!that!“countries!
with!great!natural!resource!wealth!tend!nevertheless!to!grow!more!slowly!than!
resourceVpoor!countries”!(Sachs!and!Warner!2001).!So!why!do!OPEC!and!MENA!
countries,!which!often!have!natural!resource!deposits,!experience!less!of!a!curse!
even!though!they!have!poor!institutions?!
!

! ! Schneider!13!
Empirical$Evidence$for$the$Negative$Correlation$
! The!empirical!results!in!Figure!3!show!there!is,!in!fact,!a!negative!correlation!
between!institutional!quality!and!economic!performance!for!MENA!countries.!The!
coefficient!on!the!Polity!IV!score!is!V0.059,!demonstrating!that!an!incremental!
increase!in!institutional!quality!results!in!a!6%!decrease!in!income!per!capita.!
However,!there!is!a!problem!with!this!regression.!The!PVvalue!of!the!slope!of!this!
regression!is!0.281,!meaning!that!the!slope!is!not!significantly!different!from!0.!
Clearly,!outliers!such!as!Lebanon!and!Israel,!neither!of!which!were!primarily!oilV
exporting!countries!during!the!year!of!this!analysis!2010,!are!skewing!the!results.8!
What!happens!when!we!run!this!same!regression!excluding!these!outliers?!!
!!!!!!!!!!!!!!!
!!!!!!!!!!!!!!!!!!!!!!!!!!!!!!!!!!!!!!!!!!!!!!!!!!!!!!!!8!Recently!Israel!has!made!significant!oil!discoveries,!including!the!Leviathan!oil!field!in!the!Mediterranean!Ocean.!However!it!is!not!yet!an!oil!exporter.!The!EIA!reports:!“While!historically!Israel!has!been!an!importer!of!natural!gas—most!recently!through!the!ArishVAshkelon!pipeline!from!Egypt!and!a!very!small!portion!through!a!newly!installed!floating!and!regasification!terminal—!the!discoveries!of!the!Tamar!and!Leviathan!fields!(among!several!others)!should!allow!the!country!to!become!a!significant!exporter!of!natural!gas!in!the!next!decade.”!See!EIA!country!analysis,!“Israel,”!March!2015.!April!2015.!(http://www.eia.gov/countries/countryVdata.cfm?fips=is).!Lebanon!is!also!heavily!dependent!on!oil!imports.!For!example,!the!EIA!reports!that!in!2010,!the!country!imported!120,000!bpd,!accounting!for!90%!of!their!energy!needs.!See!EIA!country!analysis,!“Lebanon,”!March!2015.!April!2015.!(http://www.eia.gov/countries/countryVdata.cfm?fips=le).!!

! ! Schneider!14!
Figure!3:!Two!Way!Scatter!Plot!and!Linear!Regression!of!Log!GDP!Per!Capita!in!2010!(2005!USD)!on!Polity!IV!Score!(2010),!Proxy!for!Institutional!Strength,!for!MENA!Countries.!
!Source:!GDP!Per!Capita!(2005!USD)!from!World!Bank!World!Development!Indicators,!Polity!IV!from!Polity!IV!Project,!Author’s!Calculations.!!
! As!evident!in!Figure!4,!the!results!are!promising.!Not!only!is!the!regression!
line!even!more!negative,!with!a!beta!coefficient!of!–!0.227,!it!is!also!highly!
statistically!significant!with!a!PVvalue!of!0.003.!!Since!the!countries!that!remain!after!
excluding!these!two!outliers!are!primarily!oil!exporting!countries,!one!possible!
!!!!!!!!!!!

! ! Schneider!15!
Figure!4:!Two!Way!Scatter!Plot!and!Linear!Regression!of!Log!GDP!Per!Capita!(2005!USD)!on!Polity!IV!Score!(2010),!Proxy!for!Institutional!Strength,!for!MENA!Restricted!countries.!
Source:!GDP!Per!Capita!(2005!USD)!from!World!Bank!World!Development!Indicators,!Polity!IV!from!Polity!IV!Project,!Author’s!Calculations.!$
reason!for!this!strong!and!significant!association!could!be!that!oilVexporting!
countries!are!different.!So!what!happens!when!we!run!this!same!regression!for!
OPEC!countries,!which!are!all!primarily!oilVexporters?$
!!!!!!!!!!!!!

! ! Schneider!16!
Figure!5:!Two!Way!Scatter!Plot!and!Linear!Regression!of!Log!GDP!Per!Capita!(2005!USD)!on!Polity!IV!Score!(2010),!Proxy!for!Institutional!Strength,!for!OPEC!Countries.!
!Source:!GDP!Per!Capita!(2005!USD)!from!World!Bank!World!Development!Indicators,!Polity!IV!from!Polity!IV!Project,!Author’s!Calculations.!
$
$ This!graph!of!OPEC!countries!confirms!that!the!reverse!trend!between!
institutions!and!GDP!per!capita!is!not!only!isolated!to!MENA!countries,!but!also!
appears!to!be!related!to!the!presence!of!oil.!Just!like!the!MENA!restricted!twoVway!
scatter!plot,!the!OPEC!scatter!plot!again!shows!a!negative!correlation!and!is!highly!
statistically!significant!with!a!PVvalue!of!0.001.!However,!Polity!IV,!as!was!previously!
stated,!is!an!amalgamation!variable!that!represents!several!other!measurements!of!
institutions.!Which!specific!institutional!characteristics!among!all!those!represented!
in!the!Polity!IV!database!exhibit!this!same!negative!relationship!within!MENA!and!
OPEC!countries,!and!thus!give!further!explanation!to!the!dynamics!of!this!trend?!

! ! Schneider!17!
What$Is$The$Key$Institution$For$This$Inverse$Relationship?$
! The!Polity!IV!project!includes!five!measures!of!institutions!in!addition!to!the!
overarching!Polity!IV!score,!including!Regime!Durability!(Durability),!Regulation!of!
the!Chief!Executive!Recruitment!(XRREG),!Competitiveness!of!Executive!
Recruitment!(XRCOMP),!Openness!of!Executive!Recruitment!(XROPEN),!and!
Executive!Constraints!(XCONST).!In!order!to!better!understand!this!apparent!
negative!relationship!between!institutions!and!GDP!per!capita!for!MENA!and!OPEC!
countries,!I!present!a!series!of!correlations!of!income!with!institutional!measures!to!
see!which!one!is!most!strongly!associated!with!this!counterintuitive!trend.!In!table!1,!
I!present!the!results!of!the!following!simple!bivariate!regressions!when!restricted!
for!these!various!groups.!These!bivariate!regressions!show!us!which!components!of!
the!Polity!score!are!significantly!correlated!with!income.!!
!
!
!
!
!
!
!
!
!
!
!

! ! Schneider!18!
Table!1:!Coefficients!of!Regressions!Between!Institutional!Quality!Variable!and!Log!GDP!Per!Capita!
Income All MENA MENA
Restricted OPEC
Polity IV 0.073*** - 0.059 - 0.227*** - 0.181***
(0.020) (0.052) (0.388) (0.040)
Durability 0.030*** 0.022* 0.026** 0.025*
(0.003) (0.011) (0.012) (0.011)
XRREG 1.444*** 1.022*** 1.001** 1.032*
(0.204) (0.345) (0.375) (0.502)
XRCOMP 0.578*** 0.422 0.336 - 0.521
(0.114) (0.399) (0.659) (0.437)
XROPEN 0.169* - 0.127 - 0.240 - 0.423**
(0.097) (0.193) (0.218) (0.190)
XCONST 0.269*** - 0.059 - 0.459 - 0.574**
(0.062) (0.180) (0.278) (0.200)
Source:!GDP!Per!Capita!(2005!USD)!from!World!Bank!World!Development!Indicators,!Polity!IV!from!Polity!IV!Project,!Author’s!Calculations.!Standard!Errors!in!parenthesis.!!*Significant!at!10%!**significant!at!5%!***significant!at!1%!!
! Both!the!categories!of!Durability!and!Regulation!of!the!Chief!Executive!
Recruitment!(XRREG)!have!a!positive!correlation!with!log!GDP!per!capita!and!both!
are!at!least!significant!at!the!10%!level.!Although!these!correlations!suggest!that!
stability!is!associated!with!economic!prosperity,!it!does!not!show!the!distinction!
between!all!countries!(henceforth!known!as!“All”)!versus!MENA!or!OPEC!countries!
because!in!all!cases!the!correlations!are!positive.!
! There!are!only!two!measures!of!institutions!that!show!the!negative!
correlation!we!found!with!the!Polity!IV!Score:!Openness!of!the!Executive!
Recruitment!(XROPEN)!and!Constraint!on!the!Executive!(XCONST).!Of!the!two,!
Constraint!on!the!Executive!appears!to!be!more!highly!correlated.!The!unrestricted!
sample!of!All!countries!has!the!highest!level!of!significance!and!MENA!Restricted!

! ! Schneider!19!
barely!missed!the!lowest!level!of!significance!(the!pVvalue!is!12%).!Furthermore,!
XCONST!is!a!more!precise!variable!measured!on!a!scale!of!0V7!(as!opposed!to!
XROPEN!which!is!measured!on!a!threeVpoint!scale).!!Therefore,!Constraint!on!the!
Executive!is!the!most!closely!associated!with!the!negative!association!between!
institutions!and!income.!
Does$Constraint$on$the$Executive$Fit$With$the$Model?$
$ When!Acemoglu,!Johnson!and!Robinson!used!Constraint!on!the!Executive!as!
a!measure!of!institutions!14!years!ago,!they!found!a!positive!association!with!GDP!
per!capita!(An!African!Success!Story:!Botswana!2001).!When!I!rerun!the!regression!
with!modern!data!for!a!sample!of!169!countries!of!the!world,!I!find!the!same!
positive!association!as!shown!in!the!twoVway!scatter!plot!below!(Figure!6).!!
!!!!!!!!!!!!!!!!!!!!!!!!!!

! ! Schneider!20!
Figure!6:!Two!Way!Scatter!Plot!and!Linear!Regression!of!Log!GDP!Per!Capita!(2005!USD)!on!Constraints!on!the!Executive!(2010),!Proxy!for!Institutional!Strength,!for!All!Countries.!
!Source:!GDP!Per!Capita!(2005!USD)!from!World!Bank!World!Development!Indicators,!Polity!IV!from!Polity!IV!Project,!Author’s!Calculations.!!
However,!when!the!countries!are!restricted!to!OPEC!members,!the!relationship!is!
again!negative.!We!would!expect!greater!constraints!on!the!leader!of!the!country!to!
promote!inclusive!institutions!and!avoid!oligarchy,!yet!here!it!is!negatively!
correlated.!!Perhaps!we!have!found!some!explanation!for!the!driver!of!this!inverse!
correlation,!although!more!research!into!the!mechanism!is!needed.!

! ! Schneider!21!
Figure!7:!Two!Way!Scatter!Plot!and!Linear!Regression!of!Log!GDP!Per!Capita!(2005!USD)!on!Constraints!on!the!Executive!(2010),!Proxy!for!Institutional!Strength,!for!OPEC!Countries.!
!Source:!GDP!Per!Capita!(2005!USD)!from!World!Bank!World!Development!Indicators,!Polity!IV!from!Polity!IV!Project,!Author’s!Calculations.!
$
$!!!

! ! Schneider!22!
Chapter$2:$Expanding$the$Empirical$Model$for$the$Growth$Rate,$Control$Variables,$and$An$Instrumental$Variable$$
Controlling$for$the$Growth$Rate$
Despite!being!a!quantitatively!sound!bivariate!approximation,!there!are!still!
problems!with!the!model!that!we!have!constructed!in!the!previous!chapter.!First,!
the!former!regression!series!only!consider!the!level!of!income!(GDP!per!capita)!in!
2010.!!This!snapshot!does!not!consider!fluctuations!in!income!and!thus!is!prone!to!
inaccuracies.!!While!institutions!may!influence!the!level!of!productivity!(and!
therefore!output)!at!any!point!in!time,!it!is!also!well!known!(e.g.!Sachs!and!Warner!
(2001))!that!institutions!also!influence!the!growth!rates!of!countries!over!time.!!A!
country’s!per!capita!GDP!may!reflect!the!influence!of!past!conditions!that!induced!its!
growth!positively!or!negatively!in!the!past,!in!a!way!that!could!potentially!be!
independent!of!its!current!institutions.!!To!more!deeply!explore!the!influence!of!
institutions!on!economic!outcomes,!I!extend!my!analysis!of!the!previous!section!to!
examine!the!association!between!institutions!and!growth!rates!of!output.!!I!find!the!
persistence!of!the!inverse!relationship!between!institutional!quality!and!growth!
among!oilVproducing!countries,!different!from!the!positive!association!presented!by!
the!literature!and!present!in!the!rest!of!the!countries!in!the!world.!!
Previous!studies!of!the!effects!of!institutions!on!growth!have!encountered!
problems!in!analyzing!oilVproducing!countries.!In!their!2001!paper,!“Natural!
Resources!and!Economic!Development:!The!Curse!of!Natural!Resources,”!
economists!Jeffrey!D.!Sachs!and!Mark!M.!Warner!compare!economic!growth!(the!
average!of!the!growth!rates!for!a!subVset!of!the!countries!of!the!world!between!

! ! Schneider!23!
1970V1989)!and!exports!of!natural!resources.!I!use!a!similar!methodology!in!the!
second!half!of!my!empirical!study!(utilizing!a!multiple!regression!with!several!
controls),!but!with!one!exception.!Sachs!and!Warner’s!model!contains!almost!none!
of!the!Organization!of!Petroleum!Exporting!Countries!(OPEC)!due!to!“lack!of!data.”!
By!Sach’s!and!Warner’s!own!admission,!it!then!“becomes!odd!to!study!the!
importance!of!oil!in!a!sample!that!does!not!include!either!Afghanistan,!Bahrain,!
Kuwait,!Morocco,!Nigeria,!Saudia!Arabia!or!Yemen”!(2001).!I!attempt!to!rectify!these!
omissions!by!including!data!for!all!OPEC!and!MENA!countries!in!my!own!study.!
By!taking!the!difference!of!the!log!of!the!income,!I!obtained!the!growth!rate!
for!each!country.!By!averaging!these!values!for!a!time!period,!I!obtained!the!average!
annual!growth!rate.!Drawing!on!what!was!common!in!the!literature!(including!the!
study!by!Sachs!and!Warner),9!I!selected!a!21Vyear!time!period!from!1990!to!2010!to!
compute!the!average!growth!rate!for!each!of!the!169!countries!of!the!world.10!Once!
we!consider!the!growth!rate!(instead!of!the!level!of!income!for!2010),!does!the!
positive!correlation!between!economic!growth!and!institutional!quality!remain!
true?!More!importantly!does!the!inverse!correlation!between!these!variable!remain!
consistent!for!MENA!and!OPEC?!
!!!!!
!!!!!!!!!!!!!!!!!!!!!!!!!!!!!!!!!!!!!!!!!!!!!!!!!!!!!!!!9!See!Sachs!and!Warner,!Natural!Resources!and!Economic!Development:!The!Curse!of!Natural!Resources!2001,!Sachs!and!Warner,!Natural!Resource!Abundance!and!Economic!Growth!1997.!10!All!169!countries!in!the!series!can!be!seen!in!the!Appendix!1A!at!the!end!of!the!paper.!

! ! Schneider!24!
Figure!8:!TwoVWay!Scatter!Plot!and!Linear!Regression!of!Mean!Log!of!GDP!Per!Capita!Growth!Rate!(1990V2010)!and!Mean!Polity!IV!(1990V2010)!for!All!Sample.!
Source:!Growth!(1990V2010)!calculated!from!Penn!World!Tables,!Polity!IV!from!Polity!IV!projects,!Author’s!Calculations.!!
Interestingly,!when!the!leftVhand!side!of!the!equation!is!changed!from!income!
at!the!level!to!the!average!growth!rate!from!1990!to!2010,!the!relationship!for!the!
169Vcountry!panel!becomes!negative3(instead!of!positively!correlated!as!the!theory!
would!predict).!Institutional!quality!(measured!by!the!Polity!IV!Index)!has!a!slope!of!
V0.04!and!is!highly!statistically!significant!with!a!pVvalue!of!0.000.!What!is!occurring!
here?!
As!is!evident!from!Figure!3.1,!there!is!a!precise!clustering!of!countries!with!
moderate!growth!and!strong!institutional!quality!on!the!right!side!of!the!graph,!
which!is!consistent!with!the!theory.!As!we!move!to!the!left,!however,!the!spread!of!
the!data!becomes!much!more!diffuse.!In!particular,!there!are!obvious!outliers,!such!

! ! Schneider!25!
as!Equatorial!Guinea!(GNQ),!China!(CHN),!and!Azerbaijan!(AZE)!that!are!throwing!
off!the!results.!Obviously,!our!data!is!victim!to!the!distortionary!power!of!influential!
observations.!
To!confirm!that!these!are!influential!observations,!we!need!to!test!the!
countries’!residuals!and!leverage.!The!residual,!or!error,!is!the!difference!between!
the!predicted!value!of!the!dependent!variable!and!its!actual!value.!Leverage!is!the!
measure!of!the!deviation!of!a!value!from!its!mean.11!We!can!graph!these!values!to!
discern!any!outliers.!
Figure!9:!TwoVWay!Scatter!Plot!of!Leverage!and!Normalized!Residual!Squared!For!All!Sample.!
Source:!Leverage!and!Residual!calculated!from!Growth!(1990V2010)!calculated!from!Penn!World!Tables,!Polity!IV!from!Polity!IV!projects,!Author’s!Calculations.!!!!!!!!!!!!!!!!!!!!!!!!!!!!!!!!!!!!!!!!!!!!!!!!!!!!!!!!!11!See!Besley,!D.A.,!Kuh,!E.!and!Welsch,!R.E.!Regression3Diagnostics.3John!Wiley!and!Sons,!New!York,!NY,!1980.!Cited!in!Moody,!Carl.!Basic3Econometrics3with3Stata.!Williamsburg,!VA,!2014!and!in!Wooldridge,!Jeffrey!M.!Introductory3Econometrics:3A3Modern3Approach,34e.!Mason,!OH,!2009.!

! ! Schneider!26!
!Empirically,!there!are!several!influential!observations.!We!can!see!that!
Equatorial!Guinea!(GNQ),!China!(CHN),!Azerbaijan!(AZE),!Qatar!(QAT)!and!Bosnia!
and!Herzegovina!(BIH)!have!either!large!residuals!or!large!leverage.!However,!
before!we!discard!them!as!outliers,!we!should!test!them!using!Cook’s!Distance.!
Cook’s!Distance!is!a!measure!that!combines!both!leverage!and!the!square!of!the!
residual!and!then!tests!if!the!distance!is!greater!than!4!divided!by!the!number!of!
observations.12!Below!is!a!table!with!the!countries!that!had!distances!greater!than!
0.001.!!
Table!2:!Cook’s!Distance!of!Influential!Observation!Countries.!
Isocode' Growth' Mean'Polity'IV' Distance'GNQ' 15.79' =5.286' 0.011'CHN' 11.13' =7' 0.005'BIH' 10.12' 0' 0.001'AZE' 10.34' =5.85' 0.003'BLR' 9.43' =3.85' 0.002'QAT' 9.2' =10' 0.003'ZWE' 0.77' =4.29' 0.001'ERI' 0.89' =6.56' 0.002'VNM' 8.05' =7' 0.001'Source:!Growth!(1990V2010)!calculated!from!Penn!World!Tables,!Polity!IV!from!Polity!IV!projects,!Author’s!Calculations.!!This!confirms!that!there!are!influential!observations!skewing!the!results.!The!
influential!observations!are!Equatorial!Guinea!(GNQ),!China!(CHN),!Bosnia!and!
Herzegovina!(BIH),!Azerbaijan!(AZE),!Belarus!(BLR),!Qatar!(QAT),!Zimbabwe!(ZWE),!
and!Eritrea!(ERI).!Once,!these!countries!are!removed,!the!twoVway!scatter!plot!is!in!
fact!positive!as!the!theory!would!predict!with!a!slope!of!0.01!and!a!pVvalue!of!0.039.!
!!!!!!!!!!!!!!!!!!!!!!!!!!!!!!!!!!!!!!!!!!!!!!!!!!!!!!!!12!See!State!Data!Analysis!Examples:!Robust!Regression.!UCLA:!Statistical!Consulting!Group.!(accessed!March!26,!2015).!

! ! Schneider!27!
Figure!10:!TwoVWay!Scatter!Plot!and!Linear!Regression!of!Mean!Log!of!GDP!Per!Capita!Growth!(1990V2010)!and!Mean!Polity!IV!(1990V2010)!for!All!Sample!Restricted,!Excluding!Outliers.!
Source:!Growth!(1990V2010)!calculated!from!Penn!World!Tables,!Polity!IV!from!Polity!IV!projects,!Author’s!Calculations.!!
What!is!occurring!in!MENA!and!OPEC?!Is!there!still!an!inverse!relationship!when!
regressing!institutional!quality!on!growth?!

! ! Schneider!28!
Figure!11:!TwoVWay!Scatter!Plot!and!Linear!Regression!of!Mean!Log!of!GDP!Per!Capita!Growth!(1990V2010)!and!Mean!Polity!IV!(1990V2010)!for!MENA.!
Source:!Growth!(1990V2010)!calculated!from!Penn!World!Tables,!Polity!IV!from!Polity!IV!projects,!Author’s!Calculations.!!Again,!MENA!is!negative!(with!a!slope!of!V0.0286),!but!it!is!not!statistically!
significant!(pVvalue!of!0.134).!When!we!regress!institutional!quality!on!growth!for!
OPEC,!we!find!a!coefficient!of!V0.0810!demonstrating!that!it!is!very!negative,!and!it!is!
extremely!statistically!significant!with!a!pVvalue!of!0.000.!!
!
!
!
!
!

! ! Schneider!29!
Figure!12:!TwoVWay!Scatter!Plot!and!Linear!Regression!of!Mean!Log!of!GDP!Per!Capita!Growth!(1990V2010)!and!Mean!Polity!IV!(1990V2010)!for!OPEC.!
!Source:!Growth!(1990V2010)!calculated!from!Penn!World!Tables,!Polity!IV!from!Polity!IV!projects,!Author’s!Calculations.!!
Expanding$the$Model:$Controlling$for$Omitted$Variables$
All!of!the!previous!regressions!were!simple,!bivariate!regressions!between!
only!two!variables,!but!are!there!other!variables!that!may!also!be!correlated!with!
growth!and!influence!the!impact!of!institutional!quality?!The!omission!of!these!
control!variables!is!known!as!Omitted!Variable!Bias,!and,!without!these,!the!
estimates!for!the!association!between!institutions!and!growth!could!be!biased!and!
inconsistent.!To!control!for!Omitted!Variable!Bias,!I!built!a!new!model!with!several!
other!related!variables,!as!presented!in!the!literature.!!

! ! Schneider!30!
The!basic!econometric!specification!for!testing!the!proposed!effects!of!
institutional!quality!and!growth!in!country!i!becomes:!
!"#$%ℎ! = !!! + !!!"#$! + !!!!! + !!! !
where!growth!is!the!average!annual!growth!rate!of!GDP!per!capita!for!the!period!
1990!to!2010,!!! !is!a!constant,!Inst3is!average!institutional!quality!measured!by!the!
nowVfamiliar!Polity!IV!index!for!the!same!period,!X’!is!a!vector!of!controls.,!and!!! !is!
the!error!term.!The!vector!of!controls!(X’)3includes!the!average!level!of!investment,!
average!trade!openness,!average!initial!growth!for!the!preceding!decade!(1980!to!
1990),!average!education!level!(measured!by!secondary!school!enrollment),!oil!
production!and!an!interaction!variable!of!oil!production!and!Polity!IV!for!the!period!
1990!to!2010.!!The!control!vector!also!includes!dummy!variables!for!whether!a!
country!i!belonged!to!All,!All!Restricted,!MENA!(Middle!East!North!Africa),!or!OPEC!
(Organization!for!Petroleum!Exporting!Countries).!!
! Levels!of!investment,!trade!openness,!initial!growth,!education!levels,!oil!
production,!and!an!oilVPolity!interaction!variable!are!important!control!variables!for!
estimating!economic!growth.!All!of!these!control!variables!are!averaged!for!the!
period!of!study!(1990!to!2010),!except!for!initial!growth,!which!is!the!average!of!the!
preceding!period!(1980!to!1990).!Investment!includes!spending!on!capital.!Because!
capital!improves!productivity!it!thus!is!related!to!economic!growth.!!Trade!
Openness!is!strongly!correlated!with!economic!growth!through!trade!liberalization,!
and!increases!in!competitiveness!(both!internationally!and!domestically).!In!their!
1995!paper!“Economic!Reform!and!the!Process!of!Global!Integration,”!Sachs!and!
Warner!empirically!show!that!both!developing!and!developed!economies!

! ! Schneider!31!
demonstrate!large!gains!to!trade!due!to!trade!openness.!For!example,!developing!
countries!that!were!open!grew!at!an!annualized!rate!of!4.40%!during!the!period!
1970!to!1989,!as!opposed!to!0.69%!for!closed!economies.!Likewise,!open!developed!
economies!grew!at!2.29%!per!year,!while!closed!economies!grew!at!0.74%!(1995).!
Finally,!initial!growth!rate!is!an!important!causal!factor!to!current!growth!rates!
because!countries!that!already!have!large!growth!rates!are!likely!to!continue!with!
high!growth.!Growth,!initial!growth,!trade!openness,!and!investment!are!all!
calculated!using!Penn!World!Tables!data.!
Education!is!also!an!important!control!for!growth,!because!it!improves!
human!capital!and!increases!labor!productivity.!Of!measures!for!education,!
economist!Thorvaldur!Gylfason!states!that!secondary!school!enrollment!is!
“probably!the!most!commonly!used!indicator!of!education!in!empirical!growth!
research.”!In!his!research,!it!is!the!variable!most!closely!correlated!with!economic!
growth!as!represented!by!a!40%!change!in!secondary!school!enrollment!rate!
translating!to!a!1%!increase!in!a!country’s!GNP!per!capita!growth!rate!(2000).!
However,!secondary!school!enrollment!rate!is!not!without!its!critics.!Daron!
Acemoglu!and!James!Robinson!point!out!in!Why3Nations3Fail3that!Uzbekistan,!under!
the!corrupt!and!extractive!reign!of!“democratically”!elected!President!Karimov,!had!
100%!secondary!school!enrollment.!The!only!problem!is!that!in!2006!(when!the!
study!was!conducted),!the!students!weren’t!actually!in!the!classroom:!They!were!
working!without!compensation!in!the!cotton!fields!during!mandatory!harvesting!
season!(2012).!Clearly!secondary!school!enrollment!is!an!imperfect!measure,!but!as!
compared!to!the!lack!of!consistent!data!reported!in!international!testing,!it!still!

! ! Schneider!32!
remains,!as!Gylfason!states,!the!gold!standard!in!empirical!research.!!My!secondary!
school!enrollment!data!was!compiled!utilizing!World!Bank!data.!
Oil!production!is!an!important!variable!to!include!in!order!to!test!oil’s!effect!
on!economic!growth!for!the!world,!and!especially!for!OPEC!countries.!Because!I!
hypothesize!that!the!negative!correlation!between!institutional!quality!and!growth!
in!OPEC!is!driven!by!the!presence!of!oil,!testing!this!with!the!variable!oil!production!
is!important.!Oil!production!(OilProd)!is!calculated!in!the!similar!method!used!by!
Boschini,!Petterson,!and!Jesper!(2003)!to!create!their!variable!“MidasProd,”!a!value!
of!gold!production.!OilProd!is!calculated!from!the!value!of!crude!oil!production!for!a!
country!multiplied!by!the!Brent!Crude!Oil!Prices!for!the!given!year,!calculated!using!
data!form!the!Energy!Information!Administration!(EIA).!This!product!is!then!scaled!
by!GDP!per!capita.!!Finally,!I!also!included!an!interaction!variable!called!“OilProd!
Interaction.”!This!was!calculated!by!multiplying!the!values!of!a!country’s!crude!oil!
production!by!the!Spot!Price,!and!then!multiplying!this!by!the!country’s!Polity!IV!
score!for!the!period!1990!to!2010,!again!scaled!by!GDP!per!capita.!This!variable!is!
important!in!order!to!test!the!impact!of!institutional!quality!combined!with!resource!
production!on!growth!to!control!for!a!possible!Resource!Curse.!
Main$Results$
$To!test!my!hypothesis,!I!ran!four!regressions,!demonstrated!by!the!equation!
given!previously,!for!my!sample!of!169!countries!(All),!All!Restricted,!MENA,!and!
OPEC.!My!results!are!given!in!the!table!below:!!
!

! ! Schneider!33!
Table!3:!Ordinary!Least!Squares!Regressions!of!Growth!Rate!on!Polity!IV!With!6!Controls.!
'' (1=LS)' (2=LS)' (3=LS)' (4=LS)'Growth' All' All'Restricted' MENA' OPEC'Polity'IV' =0.091***' =0.060***' =0.035' =0.269***'
'(0.013)' (0.011)' (0.043)' (0.045)'
' ' ' ' 'Investment' 1.534***' 1.162***' 1.303**' =1.745***'
'(0.171)' (0.145)' (0.622)' (0.456)'
' ' ' ' 'Openness' 0.452***' 0.384***' =0.027' =6.462***'
'(0.126)' (0.101)' (0.399)' (0.747)'
' ' ' ' 'Initial'Growth'
0.077***' 0.063***' .134**' 0.764***'(0.023)' (0.018)' (0.062)' (0.055)'
' ' ' ' 'Education' 0.005**' 0.007***' 0.042***' =0.074***'
'(0.002)' (0.002)' (0.014)' (0.011)'
' ' ' ' 'OilProd' =0.000' 0.002' 0.030' 0.004'
'(0.001)' (0.001)' (0.027)' =(0.009)'
' ' ' ' 'OilProd'Interaction'
=0.000' 0.002***' =0.001' =0.007***'(0.001)' (0.001)' (0.004)' (0.001)'
' ' ' ' 'Constant' =2.588***' =1.460***' =3.320' 41.026***'
'(0.641)' (0.523)' =(2.025)' (4.528)'
' ' ' ' 'R^2' 0.2014' 0.1888' 0.2986' 0.7866'Num.'of'Observations' 781' 739' 103' 67'Source:!Growth!(Calculated!from!GDP!Per!Capita!1990!to!2010),!Investment,!Trade!Openness,!and!Initial!Growth!(Calculated!from!GDP!Per!Capita!1980!to!1990)!from!Penn!World!Tables;!Education!from!World!Bank!World!Development!Indicators!Secondary!School!Enrollment;!Oil!Production!from!Energy!Intelligence!Administration!(EIA),!Brent!Spot!Prices!1987V2010!and!Polity!IV;!Polity!IV!from!Polity!IV!Project;!Author’s!Calculations.!Standard!Errors!in!parenthesis.!!Numbers!given!as!percent.!*Significant!at!10%!**significant!at!5%!***significant!at!1%!!
This!data!confirms!that!the!reverse!trend!between!institutional!quality!and!
economic!growth!persists!for!OPEC!countries!when!including!several!control!
variables.!In!fact,!this!negative!correlation!is!quite!large!with!a!V0.269%!decrease!in!

! ! Schneider!34!
annualized!growth!for!every!incremental!increase!in!institutional!quality.!This!result!
is!of!the!highest!significance!(beyond!the!1%!threshold).!The!coefficient!for!OPEC!is!
both!precisely!estimated!and!large.!For!example,!it!implies!that!improving!Saudi!
Arabia’s!institutional!quality!(V10!in!2010)!to!the!level!of!Ecuador!!(+5!in!2010),!the!
OPEC!country!with!the!highest!institutional!quality!in!that!year,!would!decrease!
Saudi!Arabia’s!growth!rate!by!4.48%!per!annual.!It!is!important!to!consider!that!
Saudi!Arabia’s!average!growth!rate!during!the!period!1990!to!2010!was!5.9%,!so!
this!change!would!decrease!Saudi!Arabia’s!growth!rate!by3precisely375%.!This!has!
important!policy!implications!for!how!these!extractive!countries!can!transition!from!
oil!based!states!to!inclusive!institutional!quality,!such!as!what!I!term!the!Middle!
Institutions!Trap.13$
Another!important!finding!of!these!regressions!is!the!predictive!power!of!
initial!growth!on!current!growth.!For!all!four!regressions,!the!results!of!initial!
growth!are!at!least!significant,!and!in!the!cases!of!All,!All!Restricted!and!OPEC,!they!
are!the!highest!level!of!significance!(beyond!1%).!Furthermore,!the!coefficients!are!
robust!and!large,!especially!for!MENA!and!OPEC.!For!example,!MENA!shows!that!a!
+1!incremental!change!in!initial!growth!yields!a!positive!0.11%!increase!in!current!
growth.!Furthermore,!for!OPEC!an!incremental!change!in!initial!growth!leads!to!a!
positive!0.76%!increase!in!current!growth.!To!put!into!perspective!how!large!this!
factor!is,!consider!that!the!average!growth!rate!for!OPEC!for!the!period!1990!to!
2010!was!5%,!so!a!positive!increase!of!only!6%!in!initial!growth!would!nearly!double!
GDP!per!capita!growth!for!the!OPEC!countries.!!
!!!!!!!!!!!!!!!!!!!!!!!!!!!!!!!!!!!!!!!!!!!!!!!!!!!!!!!!13!See!Chapter!3.!

! ! Schneider!35!
There!is!another!peculiar!result!for!the!OPEC!countries.!All!of!the!coefficients!
for!all!of!the!variables!except!for!initial!growth!are!negative.14!There!were!even!
negative!returns!to!investment!and!education,!both!of!which!are!variables!that!are!
usually!strongly!associated!with!positive!economic!growth.!This!only!adds!more!
support!to!my!findings!that!oilVproducing!countries!are!in!many!ways!
fundamentally!different!from!other!countries.!
Interestingly,!these!results!show!that!the!relationship!between!growth!and!
institutions!reverses!for!the!entire!sample.!The!growth!rate!appears!to!drop!by!!!!!!!!!!
V0.091%!for!every!incremental!change!in!institutional!quality!for!the!entire!sample!
and!this!number!is!of!the!highest!statistical!significance!(beyond!the!1%!threshold).!
This!inverse!trend!continues!even!for!the!All!Restricted!sample,!which!is!surprising!
considering!the!association!was!positive!in!the!bivariate!regression.!However,!this!
finding!does!not!necessarily!contradict!our!general!theories!that!for!the!world!
inclusive!institutions!are!positively!correlated!with!economic!growth.!More!research!
is!needed!to!understand!this!association.!
Finally,!we!must!consider!the!impact!of!oil!production!on!GDP!per!capita!
growth.!For!all!variables!in!the!OLS!regression,!OilProd!is!not!statistically!significant.!
However,!OilProd!Interaction!is!highly!statistically!significant!for!both!All!Restricted!
and!OPEC.!For!OPEC,!oil!production!has!the!highest!statistical!significance.!
Interestingly,!the!coefficient!is!negative,!which!means!that!the!interaction!of!OPEC’s!
very!low!institutional!quality!multiplied!by!its!crude!oil!production!decreases!
growth!by!0.007%.!One!interpretation!of!this!statistic!is!that!OPEC!countries!extract!!!!!!!!!!!!!!!!!!!!!!!!!!!!!!!!!!!!!!!!!!!!!!!!!!!!!!!!!14!All!were!negative!except!for!!OilProd,!which!was!positive!but!not!statistically!significant.!

! ! Schneider!36!
wealth!from!oil!revenues!to!entrench!the!elite!without!reinvesting!it!in!the!country,!
and!this!diminishes!overall!growth.!This!data!confirms!that!there!is!in!fact!a!
resource!curse!for!OPEC!countries.!The!association!between!oil!production!and!
institutional!quality!is!negatively!associated!with!the!growth!rate!of!OPEC!
countries.15!!!
Robustness$Test:$Instrumental$Variable$Regression$
! A!critical!concern!regarding!the!robustness!of!our!results!arises!from!the!fact!
that!our!independent!target!variable!Inst!(institutional!quality)!could!be!correlated!
with!the!error!term!(!!)!in!our!regression,!leading!to!the!possibility!of!an!
endogeneity!problem.!This!is!caused!by!the!unobserved!elements!(other!omitted!
variables!not!included!in!our!model)!hidden!in!the!error!term.!To!address!this!
concern,!I!run!an!instrumental!variable!(IV)!regression.!A!good!instrument!should!
be!both!exogenous!to!the!model!(not!correlated!with!the!error!term)!and!relevant!
(correlated!with!the!independent!target!variable).!There!are!many!candidates!for!an!
instrumental!variable!correlated!with!institutional!quality,!but!the!two!most!
prevalent!in!the!literature!are!measurements!of!geography!and!disease!prevalence.!
For!my!study,!I!selected!percent!of!the!land!area!in!the!geographical!tropics,!
henceforth!known!as!“Tropics”!(ESRI!1996).!!
Although,!authors!Acemoglu!and!Robinson!have!effectively!used!disease!
prevalence!(settler!mortality!rate)!as!a!“plausible!instrument!for!institutional!
!!!!!!!!!!!!!!!!!!!!!!!!!!!!!!!!!!!!!!!!!!!!!!!!!!!!!!!!15!See!Sachs!and!Warner,!Natural!Resource!Abundance!and!Economic!Growth!1997;!Boschini,!Petterson!and!Roine!2003;!van!der!Ploeg!2011;!Arezki!and!van!der!Ploeg!2011)!

! ! Schneider!37!
development”!(2002),!I!found!the!use!of!Tropics,!a!measure!of!geography,!as!an!
instrument!to!be!both!more!pervasive!in!the!literature,!and!more!compelling!
through!my!own!tests.!Qualitatively,!we!can!see!that!Tropics!is!highly!correlated!
with!institutional!quality!because!most!the!countries!of!the!world!with!poor!
institutional!quality!and!lowVgrowth!are!located!in!the!Tropics.!Consider!that!in!a!
1998!World!Bank!ranking!of!countries!with!the!highest!GDP!per!capita,!only!two!of!
the!30!best!performers!were!located!in!the!Tropics:!Hong!Kong!and!Singapore!
(Boom,!et!al.!1998).!Hall!and!Jones!(1998)!confirm!this,!stating,!“[It]!is!widely!known!
that!economies!further!from!the!equator![and!thus!tropics]!are!more!successful!in!
terms!of!per!capita!income.”!Therefore!the!use!of!Tropics!as!an!instrument!is!
relevant.!It!is!also!exogenous!because!being!outside!a!tropical!location!is!not!a!
necessary!condition!for!growth.!Growth!is!not!inherently!affected!by!the!location!of!
a!country!in!or!outside!of!the!Tropics.!!Economists!William!Easterly!and!Ross!Levine!
corroborate!both!the!relevance!and!exogeneity!of!Tropics!as!an!instrument,!stating:!
“We!find!no!evidence!that!tropics!…!affect!country!incomes!directly!other!than!
through!institutions,!nor!do!we!find!any!effect!of!policies!on!development!once!we!
control!for!institutions”!(Easterly!and!Levine!2003).!
My!own!tests!confirm!that!Tropics!is!a!robust!instrument.!In!order!for!an!
instrumental!variable!to!be!robust!it!must!pass!two!tests.!It!must!not!be!a!weak!
instrument!(meaning!that!the!instrument!is!not!strongly!associated!with!the!target!
independent!variable)!and!the!equation!must!not!be!underVidentified.!Using!a!
Bound,!Jaeger!and!Baker!F!Test,!I!found!that!Tropics!passes!the!threshold!of!10!for!
All,!MENA!and!the!target!OPEC!regressions,!confirming!that!in!these!cases!it!is!not!a!

! ! Schneider!38!
“weak!instrument.”!In!fact,!for!OPEC!the!F!statistic!far!surpasses!this!threshold!with!
a!value!of!225,!respectively!(see!Table!4).16!!
The!next!question!is!the!identification!concern.!Using!a!Sargan!Statistic,!I!found!
that!all!four!of!the!regressions!have!a!pVvalue!of!0.000!meaning!that!we!can!reject!
the!null!hypothesis!that!the!equation!is!overVidentified.!This!could!be!a!potentially!
fatal!discovery!if!the!equation!is!underVidentified.!Fortunately,!the!Anderson!
Lagrange!Multiplier!(LM)!statistic!for!all!four!models!can!reject!the!null!hypothesis!
that!the!equation!is!underVidentified.!Therefore!for!all!of!our!models,!the!equations!
are!exactly!identified,!meaning!these!equations!are!all!valid.!Even!without!the!formal!
statistical!tests,!we!know!institutively!that!the!model!is!perfectly!identified,!because!
my!model!has!one!instrument!and!one!variable!to!be!explained.!Since!the!model!for!
OPEC!passes!both!the!weakVinstrument!and!identification!tests,!we!can!conclude!
that!my!results!for!the!instrumental!variable!are!valid.!
The!Hausman!test!for!endogeneity!(HausmanVWu!Test)!fails!to!reject!that!Inst!
(institutional!quality)!is!exogenous!in!only!one!of!the!four!regression!series!(for!All!
Restricted)!(see!Table!4).17!Therefore,!we!can!conclude!that!OLS!suffers!from!an!
endogeneity!problem.!!!
!!!!!!!
!!!!!!!!!!!!!!!!!!!!!!!!!!!!!!!!!!!!!!!!!!!!!!!!!!!!!!!!16!Using!ivreg2,!I!confirm!these!results,!although!this!test!calls!the!statistic!a!CraggVDonald!Wald!F!Statistic.!In!both!cases,!it!has!the!same!critical!threshold!of!10.!17!A!Hausman!score!of!less!than!the!general!level!of!significance!of!10%!signals!the!possibility!of!an!endogeneity!problem.!

! ! Schneider!39!
Table!4:!2VStage!Least!Squares!Regressions!of!Growth!On!Polity!IV!With!6!Controls!Instrumenting!Tropics!for!Polity!IV.!!
'' (5=2SLS)' (6=2SLS)' (7=2SLS)' (8=2SLS)'Growth' All' All'Restricted' MENA' OPEC'Polity'IV' 0.106' 0.059' 0.149' =0.172***'
'(0.120)' (0.120)' (0.117)' (0.039)'
' ' ' ' 'Investment' 1.224***' 0.910***' 0.023' =1.853***'
'(0.272)' (0.242)' (1.044)' (0.431)'
' ' ' ' 'Openness' 0.851***' 0.543***' 0.961' =5.324***'
'(0.232)' (0.131)' (0.676)' (0.657)'
' ' ' ' 'Initial'Growth' 0.091***' 0.056***' 0.115' 0.741***'
'(0.029)' (0.021)' (0.080)' (0.056)'
' ' ' ' 'Education' =0.014' =0.005' 0.013' =0.063***'
'(0.012)' (0.011)' (0.0244)' (0.008)'
' ' ' ' 'OilProd' 0.000***' 0.000**' 0.000' 0.000*'
'(0.000)' (0.000)' (0.000)' (0.001)'
' ' ' ' 'OilProd'Interaction'
0.001' 0.003***' =0.006' =0.007***'(0.001)' (0.001)' (0.005)' (0.001)'
' ' ' ' 'Constant' =2.961***' =1.142*' =0.295' 35.782***'
'(0.726)' (0.693)' (2.865)' (3.640)'
' ' ' ' 'Centered'R2' =0.0132' 0.0865' 0.1600' 0.7825'Uncentered'R2' 0.8103' 0.8853' 0.8680' 0.9759'Num.'of'Observations' 739' 697' 97' 67'Hausman' 0.0653' 0.3125' 0.0052' 0.0000'F*'Statistic' 11.995' 7.395' 25.057' 224.552'Anderson' 0.001' 0.007' 0.000' 0.000'Sargan'' 0.000' 0.000' 0.000' 0.000'Source:!Growth!(Calculated!from!GDP!Per!Capita!1990!to!2010),!Investment,!Trade!Openness,!and!Initial!Growth!(Calculated!from!GDP!Per!Capita!1980!to!1990)!from!Penn!World!Tables;!Education!from!World!Bank!World!Development!Indicators!Secondary!School!Enrollment!Rate;!Oil!Production!from!Energy!Intelligence!Administration!(EIA)!and!Brent!Spot!Prices!1987V2010;!Polity!IV!from!Polity!IV!Project;!Tropics!from!ESRI;!Author’s!Calculations.!Standard!Errors!in!parenthesis.!!Numbers!given!as!percent.!Hausman!reports!the!pVvalues!of!the!regressionVbased!Hausman!test,!as!explained!in!the!text.!F*!Statistic!listed!as!value,!threshold!for!significance!is!10.!

! ! Schneider!40!
Anderson!reports!the!pVvalues!for!underVidentification.!Sargan!reports!the!pVvalues!for!overVidentification.!*Significant!at!10%!**significant!at!5%!***significant!at!1%!!
Table!5!contains!the!results.!!!!The!instrumental!variable!regression!confirms!
the!results!that!I!have!already!found!from!the!Ordinary!Least!Squares!regressions!
(regressions!1V4).!The!target!regression!(OPEC)!is!both!robust!and!statistically!
significant!for!all!of!the!coefficients.!In!particular,!the!results!show!that!economic!
growth!decreases!by!V0.172%!for!every!incremental!increase!in!institutional!quality!
for!OPEC!countries.!This!is!consistent!with!the!!V0.269%!value!that!I!found!in!the!
original!regression,!confirming!that!my!earlier!results!are!valid!and!not!an!anomaly.!!
Growth!initial!is!the!only!OPEC!variable!that!is!positive!(excluding!OilProd!
which!has!a!coefficient!of!nearly!0.0),!and!again!it!is!extremely!large!(positive!
0.740%).!Not!only!is!its!magnitude!large,!but!also!it!has!the!highest!level!of!
significance,!again!confirming!the!predictive!power!of!history.!Special!note!should!
be!given!to!the!oil!variables.!Both!OilProd!and!OilProd!Interaction!are!of!the!highest!
level!of!significance!as!well.!OilProd!has!a!coefficient!of!near!0.0,!demonstrating!
almost!no!return!to!growth!from!oil!production.!However,!OilProd!Interaction!
reports!a!V0.007%!decrease.!This!corroborates!my!earlier!analysis!that!OPEC!
countries!extract!oil!wealth.!Oil!production!on!its!own!has!no!return!to!growth!but!
in!the!presence!of!OPEC’s!extractive!institutions,!oil!has!a!negative!effect!on!growth.!
This!supports!my!central!thesis!that!oil!is!driving!the!downward!trend!between!
institutional!quality!and!growth.!
!

! ! Schneider!41!
Implications$of$the$Main$Results$
All!of!these!previously!stated!results!suggest!that!history!is!a!large!predictor!
of!destiny,!especially!for!MENA!and!OPEC!countries.18!This!has!harrowing!
implications!in!a!region!that!has!been!shrouded!in!unrest!and!extractive!institutions!
since!at!least!the!rise!of!Arab!Nationalism!and!independence!in!the!1950’s!and!
1960’s.!If!these!countries!can!break!from!the!extractive!policies!of!the!past!through!
what!Acemoglu!and!Robinson!term!a!“critical!juncture,”!they!may!be!able!to!harness!
some!of!the!high!growth!attainable!through!initial!growth!and!inclusive!institutions!
(2012).!Acemoglu!and!Robinson!cite!several!examples!of!critical!junctures,!events!
that!dislodge!a!country’s!current!economic!and!political!trajectory!and!push!it!down!
an!inclusive!path.!These!specifically!include!the!Glorious!Revolution!and!the!French!
Revolution.!These!events!bear!considerable!resemblance!to!the!Arab!Spring!today!in!
that!large!swaths!of!the!population!rose!up!against!the!entrenched!elite!to!demand!
improved!rights.!!This!could!potentially!bode!well!for!the!region!if!this!seminal!event!
can!break!from!the!extractive!policies!of!the!past!and!chart!a!new!path.!If!the!people!
can!translate!these!uprisings!into!tangible!results!through!the!establishment!of!
inclusive!institutions!and!protection!against!expropriation!by!the!elite,!then!these!
countries!may!be!able!to!begin!broadVbased!economic!growth.!!
However,!Acemoglu!and!Robinson!(2012)!also!present!their!theory!of!the!!
“Iron!Law!of!Oligarchy,”!which!demonstrates!that!new!extractive!regimes!often!take!
the!place!of!the!old!extractive!regime,!and!that!critical!junctures!often!do!not!in!fact!
lead!to!institutional!change.!This!might!explain!why!it!appears!that!the!Arab!Spring!
!!!!!!!!!!!!!!!!!!!!!!!!!!!!!!!!!!!!!!!!!!!!!!!!!!!!!!!!18!Consider!the!coefficients!on!initial!growth.!

! ! Schneider!42!
has!led!to!increased!extractiveness!and!authoritarianism,!rather!than!less.!If!oilVrich!
extractive!countries!can!transition!from!low!to!high!institutional!quality,!they!will!be!
able!to!harness!strong!economic!growth.!However,!as!I!will!show,!this!transition!is!
extremely!precarious!because!of!what!I!term,!“The!Middle!Institutions!Trap.”!
$
$
$
$
$
$
!!!!
!
!

! ! Schneider!43!
Chapter$3:$The$Middle$Institutions$Trap$
Introduction$To$the$Middle$Institutions$Trap$!$ Stability!is!critical!for!the!economic!environment!and!investment.!High!
growth!countries,!such!as!in!the!OECD,!have!greater!economic!performance!because!
their!institutions!promote!stability.!Countries!with!the!lowest!institutional!quality!
also!have!strong!economic!performance.!It!appears!that!extractive!oil!regimes,!such!
as!Qatar,!Saudi!Arabia,!and!Oman,!provide!the!necessary!stability!for!growth!by!not!
allowing!dissent.!
As!we!look!at!Figure!13!of!“The!Middle!Institutions!Trap”!between!
institutions!and!GDP!per!capita,!we!see!that!OPEC!countries!with!comparatively!
worse!institutions!have!higher!GPD!per!capita!growth.!On!the!other!end!of!the!
spectrum,!countries!in!the!All!sample!with!better!institutional!quality!also!have!
higher!GDP!per!capita!growth.!However,!countries!in!the!middle!of!the!graph,!which!
have!neutral!institutional!quality,!have!lower!GDP!per!capita!growth!than!the!
extremes.!This!leads!me!to!hypothesize!that!there!is!perhaps!a!“Middle!Institutions!
Trap”!for!oilVproducing!countries.!On!the!extremes!of!the!institutions!spectrum,!
countries!provide!the!stability!necessary!for!economic!growth.!Yet!in!the!middle!of!
the!spectrum,!countries!fare!far!worse.!This!may!be!because!there!is!enough!
political!latitude!for!dissent!but!not!enough!to!allow!for!inclusive!institutions!and!
what!Acemoglu!and!Robinson!call!the!“virtuous!circle”!(2012).!High!inclusiveness!
provides!for!growth!because!the!environment!is!stable.!Extreme!extractiveness!also!
appears!to!provide!the!stability!critical!for!growth!on!the!other!end!of!the!spectrum!

! ! Schneider!44!
by!squashing!all!dissent.!As!opposed!to!extractive!institutional!quality,!it!is!within!
middle!institutional!values!where!oil!nations!really!fail.!
Does$An$Upward]Facing$“U”$Signal$A$Middle$Institutions$Trap?$
When!considering!Table!5,!it!is!evident!that!this!upwardVfacing!“U”!shaped!
trend!exists,!where!extreme!values!of!Polity!IV!have!a!high!correlation!with!
economic!growth!and!income.!This!“U”!shape!exists!empirically!in!all!of!the!graphs!
that!have!been!presented!previously,!and!numerically!below!through!consideration!
of!the!association!between!the!square!of!Polity!IV!(labeled!in!the!table!as!“Polity2”)!
and!growth!or!income.!All!of!the!correlations!are!at!least!statistically!significant!(and!
in!almost!all!cases!are!the!highest!level!of!significant)!proving!that!the!association!is!
statistically!statistic.!Furthermore,!the!coefficients!disprove!that!there!is!not!a!
correlation!between!extreme!values!of!Polity!IV!and!growth.19!!
! The!question!ultimately!lies!in!whether!the!“U”!shape!(signifying!lower!
growth!for!middle!institutional!quality)!constitutes!the!“Middle!Institutions!Trap.”!
For!a!Middle!Institutions!Trap!to!exist,!the!quadratic!regression!line!would!have!to!
fit!the!overlaid!downward!and!upwardVsloping!linear!regressions.!I!will!go!on!to!
prove!that!only!in!OPEC!(as!demonstrated!in!Figure!15!and!Figure!18)!does!the!
quadratic!regression!line!fit!this!criterion.!
!!!!!!!!!!!!!!!!!!!!!!!!!!!!!!!!!!!!!!!!!!!!!!!!!!!!!!!!19$$If!the!coefficients!were!zero,!then!there!would!be!no!correlation,!and!this!trend!
would!not!exist.!
!

! ! Schneider!45!
Table!5:!OLS!Regressions!Between!Income!Or!Growth!and!Polity!IV!and!Polity2!
'' (1=OLS)' (2=OLS)' (3=OLS)' (4=OLS)' (5=OLS)' (6=OLS)'
Growth'All'Restricted'
All'Restricted' MENA' MENA' OPEC' OPEC'
Polity'IV' =0.002' =0.033***' =0.029' 0.018' =0.081***' =0.059**'
'(0.005)' (0.006)' (0.019)' (0.019)' (0.020)' (0.023)'
Polity2' =' 0.009***' =' 0.023***' =' 0.007*'
'=' (0.001)' =' (0.003)' =' (0.004)'
Constant' 4.171***' 3.857***' 4.523***' 3.694***' 4.687***' 4.466***'
'(0.035)' (0.049)' (0.128)' (0.160)' (0.132)' (0.183)'
' ' ' ' ' ' ''' (7=OLS)' (8=OLS)' (9=OLS)' (10=OLS)' (11=OLS)' (12=OLS)'Income' All' All' MENA' MENA'' OPEC' OPEC'Polity'IV' 0.098***' 0.044***' 0.038***' 0.031***' =0.041***' =0.020**'
'(0.006)' (0.005)' (0.012)' (0.009)' (0.012)' (0.010)'
Polity2' =' 0.026***' =' 0.026***' =' 0.021***'
'=' (0.001)' =' (0.000)' =' (0.002)'
Constant' 7.504***' 6.218***' 8.281***' 6.939***' 8.655***' 7.275***'
'(0.042)' (0.061)' (0.089)' (0.106)' (0.093)' (0.172)'
Source:!Income!from!World!Bank!World!Development!Indicators,!Growth!(Calculated!from!GDP!Per!Capita!1990!to!2010)!from!Penn!World!Tables;!Polity!IV!and!Polity^2!from!Polity!IV!Project.!*Significant!at!10%!**significant!at!5%!***significant!at!1%!
Empirical$Evidence$for$the$Parabolic$“U”$
Looking!at!Figure!13,!we!can!clearly!see!the!upward!facing!“U”!clearly!by!
superimposing!the!downward!sloping!regression!line!for!OPEC!countries!(presented!
in!Chapter!2)!with!the!upward!sloping!regression!line!for!All!Restricted.20!Using!
Stata’s!quadratic!graphing!mechanism!(qfit),!I!fit!the!parabolic!shape!to!the!data!
when!restricted!for!the!All!Restricted!data!set.!This!parabola!empirically!
demonstrates!that!the!graph!reaches!a!minimum!in!the!growth!rate!centered!on!an!
institutional!quality!of!0.!Does!this!constitute!as!the!Middle!Institutions!Trap?!
!!!!!!!!!!!!!!!!!!!!!!!!!!!!!!!!!!!!!!!!!!!!!!!!!!!!!!!!20!All!Restricted!has!been!used!as!the!All!sample!because!of!the!presence!of!influential!observations!as!demonstrated!in!the!previous!chapter.!

! ! Schneider!46!
Figure!13:!“The!Middle!Institutions!Trap”!for!OPEC!and!All!Restricted,!Qfit!for!All!Restricted,!Growth!Rate.!
!Source:!Growth!(1990V2010)!calculated!from!Penn!World!Tables,!Polity!IV!from!Polity!IV!projects,!Author’s!Calculations.!!Although!this!quadratic!regression!line!shows!lower!growth!for!neutral!institutional!
quality,!it!does!not!model!the!trend!evident!from!the!downwardVsloping!OPEC!and!
upwardVsloping!All!regressions!lines.!For!example,!the!quadratic!regression!line!has!
a!minimum!at!near!0,!whereas!the!trend!has!an!intersection!point!at!+7.!Clearly,!the!
quadratic!regression!when!fit!for!the!All!sample!does!not!model!the!Middle!
Institutions.!Do!MENA!or!OPEC!quadratic!regression!lines!fit!the!model?!
!
The$Middle$Institutions$Trap$Fitted$for$MENA$and$OPEC$Countries$! !

! ! Schneider!47!
! I!have!argued!that!oil!is!the!critical!variable!driving!the!downward!
relationship!between!institutional!quality!and!economic!growth!in!the!previous!two!
chapters.!Therefore,!we!would!expect!that!if!the!quadratic!fit!were!restricted!to!
MENA,!it!would!not!be!indicative!of!the!Middle!Institutions!Trap.!
Figure!14:!“The!Middle!Institutions!Trap”!for!MENA!and!All!Restricted,!Qfit!for!MENA,!Growth!Rate.!
Source:!Growth!(1990V2010)!calculated!from!Penn!World!Tables,!Polity!IV!from!Polity!IV!projects,!Author’s!Calculations.!!
To!demonstrate!the!Middle!Institutions!Trap,!the!quadratic!fit!line!should!
approximate!both!the!downward!slope!of!the!MENA!restricted!sample!and!the!
upward!slope!of!the!All!Restricted.!When!fit!for!MENA,!this!graph!does!not!
substantiate!this!association,!and!MENA!does!not!display!the!Middle!Institutions!
Trap.!Its!minimum!appears!to!be!centered!on!a!Polity!IV!score!of!0,!but!the!

! ! Schneider!48!
intersection!point!of!the!downward!slope!of!MENA!and!the!upward!slope!of!All!
Restricted!appears!to!occur!a!Polity!IV!score!of!+6.!Does!OPEC!demonstrate!the!
Middle!Institutions!Trap?!
Figure!15:!“The!Middle!Institutions!Trap”!for!OPEC!and!All!Restricted,!Qfit!for!OPEC,!Growth!Rate.!
Source:!Growth!(1990V2010)!calculated!from!Penn!World!Tables,!Polity!IV!from!Polity!IV!projects,!Author’s!Calculations.!!
When!the!data!is!quadratically!fit!for!OPEC,!it!best!approximates!the!Middle!
Institutions!Trap.!The!parabola!reaches!a!minimum!near!+6,!then!turns!slightly!
positive.!This!is!confirmed!through!regression!analysis.!The!bivariate!regressions!
presented!in!Table!6!demonstrate!that!strength!of!the!association!of!growth!to!the!
squared!value!of!Polity!IV!is!stronger!for!OPEC!than!for!NonVOPEC!countries.!
Because!taking!the!square!of!a!value,!it!will!increase!its!absolute!magnitude.!Table!6!
shows!that!there!is!a!stronger!association!between!more!extreme!Polity!IV!values!in!

! ! Schneider!49!
OPEC!than!in!nonVOPEC,!verifying!that!OPEC!is!a!key!driver!of!the!low!growth!of!
middle!institutional!quality.!The!difference!between!the!association!of!squared!
Polity!IV!between!OPEC!!(0.012)!and!nonVOPEC!(0.003)!is!0.009,!very!close!to!the!
0.006!associated!with!the!All!Restricted!Sample.!Because!most!of!the!strength!of!the!
association!in!All!Restricted!can!be!accounted!for!with!the!presence!of!OPEC,!we!can!
conclude!that!OPEC!and!oil!are!key!to!the!Middle!Institutions!Trap.!
Table!6:!Bivariate!Regressions!Between!Growth!and!The!Square!of!Polity!IV!for!All!Restricted,!OPEC!and!nonVOPEC.!
'' (1=OLS)' (2=OLS)' (3=OLS)'Growth' All'Restricted' OPEC' Non=OPEC'Polity2' 0.006***' 0.012***' 0.003***'
'(0.001)' (0.003)' (0.001)'
Constant' 3.879***' 4.446***' 4.157***'
'(0.049)' (0.185)' (0.066)'
Source:!Growth!(1990!to!2010)!from!Penn!World!Tables;!Polity2!from!Polity!IV!Project.!!*Significant!at!10%!**significant!at!5%!***significant!at!1%!
Does$The$Middle$Institutions$Trend$Persist$for$Income$At$The$Level?$!! I!began!this!study!with!bivariate!regressions!between!log!GDP!Per!Capita!
income!at!the!level!(in!2010)!and!institutional!quality.21!Does!the!Middle!Institutions!
trend!persist!when!considering!the!original!regression!series?!!
!!!!!!!!!!!!!!!!!!!!!!!!!!!!!!!!!!!!!!!!!!!!!!!!!!!!!!!!21!See!Chapter!1.!

! ! Schneider!50!
Figure!16:$“The!Middle!Institutions!Trap”!for!OPEC!and!All!Restricted,!Qfit!for!All,!Income!Level!in!2010.$
Source:!Income!(2010)!calculated!from!World!Bank!World!Development!Indicators,!Polity!IV!from!Polity!IV!projects,!Author’s!Calculations.!!When!the!downward!MENA!regression!line!for!income!at!the!level!is!overlaid!with!
the!positive!All!regression!line,!we!see!clearly!that!a!Middle!Institutions!Trap!exists!
for!OPEC!countries,!where!there!is!a!minimum!centered!near!the!institutional!
quality!of!Iraq!at!+3.!Yet!when!an!quadratic!regression!line!is!fitted!to!the!model!
restricted!for!the!All!sample,!it!does!not!fit!the!model!because!it!has!a!minimum!
centered!near!an!institutional!quality!of!0!(and!not!+3).!Can!MENA!explain!the!
Middle!Institutions!Trap?!

! ! Schneider!51!
Figure!17:!“The!Middle!Institutions!Trap”!for!MENA!and!All!Restricted,!Qfit!for!MENA,!Income!Level!in!2010.!
Source:!Income!(2010)!calculated!from!World!Bank!World!Development!Indicators,!Polity!IV!from!Polity!IV!projects,!Author’s!Calculations.! !!
In!the!previous!quadratic!regression!series!based!on!growth,!neither!the!All!
nor!the!MENA!sample!completely!explained!the!Middle!Institutions!Trap.!Their!
quadratic!regression!line!did!not!fit!the!slopes!of!the!intersecting!linear!regression!
lines.!Again!when!regressing!for!income!at!the!level,!neither!MENA!nor!All!
completely!explain!the!trend.!What!does!the!graph!look!like!for!OPEC!countries!
using!income!at!the!level!of!2010?!

! ! Schneider!52!
Figure!18:!“The!Middle!Institutions!Trap”!for!OPEC!and!All!Restricted,!Qfit!for!OPEC,!Income!Level!in!2010.!
Source:!Income!(2010)!calculated!from!World!Bank!World!Development!Indicators,!Polity!IV!from!Polity!IV!projects,!Author’s!Calculations.! !!! This!graph!further!proves!that!OPEC!does!the!best!job!at!explaining!the!
Middle!Institutions!Trap.!Using!income!at!the!level,!the!quadratic!regression!line!fit!
for!OPEC!perfectly!mirrors!the!downwardVsloping!OPEC!linear!regression!line!and!
the!linear!upwardVsloping!All!regression!line.!It!appears!to!have!a!minimum!at!
exactly!the!intersection!point!of!the!two!linear!regressions!lines!at!the!institutional!
quality!of!Iraq!(+3).!Because!this!quadratic!OPEC!regression!line!conforms!so!closely!
to!the!linear!trend!presented!in!both!this!graph!(Figure!18)!and!in!Figure!15,!we!can!
conclude!that!OPEC!(and!oil)!are!drivers!of!the!Middle!Institutions!Trap.!Table!7!
confirms!this.!

! ! Schneider!53!
The$Arab$Spring$As$Evidence$of$the$Middle$Institutions$Trap$$
This!theory!on!a!Middle!Institutions!Trap!is!confirmed!by!the!Arab!Spring!
Revolutions.!OPEC!countries!with!the!worst!institutions,!such!as!Qatar!(V10),!Saudi!
Arabia!(V10),!and!the!United!Arab!Emirates!(V8)!were!by!and!large!unaffected!by!the!
revolutions!that!took!place!in!2011!(the!year!after!the!one!from!which!this!data!is!
taken),!while!countries!with!the!middle!institutions!in!2010!such!as!Libya!(V6),!
Tunisia!!(V4),!and!Iraq!(4)!were!rocked!by!revolution!(even!though!Tunisia!is!not!an!
OPEC!member,!it!has!significant!oil!reserves).!!On!the!other!end!of!the!spectrum,!
countries!in!the!All!sample!with!inclusive!institutions!that!also!have!significant!
amounts!of!oil,!such!as!Israel!(10)!and!Norway!(10),!have!experienced!no!social!
unrest!either!from!the!Arab!Spring,!nor!do!they!exhibit!a!history!of!instability.!
Ultimately,!this!theory!suggests!that!in!the!presence!of!oil!reserves,!countries!with!
some!level!of!political!leeway!allow!dissent!to!breed.!In!these!cases,!this!can!lead!to!
uprising!and!social!unrest.!
The$Transition$
! Oil!is!a!finite!resource.!Eventually,!these!natural!resource!economies!will!
have!to!transition!away!from!“black!gold”!and!diversify!their!economies.!Almost!all!
of!the!Arab!oilVrich!countries!have!begun!planning!for!this!inevitable!transition.!
Effectiveness!in!diversification!and!transition!will!define!the!success!of!these!
countries!in!the!coming!years.!This!transition!will!be!a!very!delicate!process.!To!
harness!longVterm!growth,!these!extractive!oilVproducing!countries!need!to!move!to!
inclusive!institutions.!To!get!there!they!may!have!to!move!through!The!Middle!

! ! Schneider!54!
Institutions!Trap,!which!may!make!the!state!(and!the!regime)!particularly!
vulnerable!to!revolution,!civil!war,!and!infighting.!If!growth!and!income!levels!go!
down,!dissent!may!emerge.!This!dissent!will!be!further!exacerbated!by!the!fact!that!
with!neutral!institutional!quality,!these!formally!extractive!regimes!will!have!less!of!
a!security!apparatus!to!crackdown.!This!provides!a!very!precarious!roadmap!to!
development.!!
!
The$Fate$of$Extractive$Institutions$
In!Why3Nations3Fail,!Acemoglu!and!Robinson!cite!numerous!examples,!in!
which!they!show!that!even!countries!with!extractive!institutions!grew!strongly!for!a!
period.!They!assert!that!always,!despite!strong!initial!growth,!these!countries!fail!
(2012).!The!most!vivid!example!is!their!case!study!of!the!formerVUSSR:!“The!Soviet!
Union!is!an!even!more!noteworthy!example,!growing!rapidly!between!1930!and!
1970,!but!subsequently!experiencing!rapid!collapse”!(2012).!Is!this!the!fate!of!OPEC!
countries!that!are!dependent!on!oil!rents!and!extractive!economic!institutions?!!
Analyzing!the!span!of!history,!these!scientists!formulated!their!theory!on!
economic!growth!without!a!counterVexample.!Ranging!from!the!Roman!Empire!to!
the!Soviet!Union,!nations!fail!when!their!institutions!become!extractive!and!no!
longer!support!broadVbased!growth.!OPEC!countries!too!will!fail!in!the!long!run!if!
they!cannot!transition!their!political!and!economic!institutions!to!inclusiveness.!
However,!the!roadmap!to!getting!from!extractive!to!inclusive!institutions!is!
dangerous!because!of!the!Middle!Institutions!Trap.!!

! ! Schneider!55!
Acemoglu!and!Robinson!assert!that!in!the!long!run!it!is!inclusive!institutions!
that!allow!countries!to!succeed.!I!assert!that!it!is!the!Middle!Institutions!Trap!that!
makes!oilVrich!countries!fail.!Stability!is!critical!to!growth.!Countries!with!the!most!
inclusive!institutions!inherently!provide!this!stability.!Paradoxically,!extractive!oilV
rich!countries!also!provide!this!stability.!Ultimately!as!my!research!demonstrates,!a!
oneVsizeVfitsVall!prescription!for!institutional!development!to!inclusive!institutions!
needs!to!be!caveated!with!a!realization!that!stability!is!also!a!necessary!component!
to!economic!development,!and!a!move!from!extractive!to!inclusive!institutional!
quality!may!induce!lower!growth!and!therefore!less!stability.!!
!
$!!!!!!!!!!!!!!!!!!!!!!!!

! ! Schneider!56!
Works$Cited$
Acemoglu,!Daron,!and!James!Robinson.!Why3Nations3Fail.!New!York:!Crown!
Publishers,!2012.!
Acemoglu,!Daron,!Simon!Johnson,!and!James!A.!Robinson.!“An!African!Success!Story:!
Botswana.”!Working3Paper!(Massachusetts!Institute!of!Technology),!2001.!
—.!“Reversal!of!Fortune:!Geography!and!Institutions!in!the!Making!of!the!Modern!
World!Income.”!The3Quarterly3Journal3of3Economics!(Oxford!University!Press)!
117,!no.!4!(Nov!2002):!1231V1294.!
—.!“The!Colonial!Origins!of!Comparative!Development:!An!Empirical!Investigation.”!
The3American3Economic3Review!91,!no.!5!(Dee!2001):!1369V1401.!
Acemolgu,!Daron,!Simon!Johnson,!James!Robinson,!and!Yunyong!Thaicharoen.!
“Institutional!Causes,!Macroeconomic!Symptoms:!Volatility,!Crises!and!
Growth.”!Journal3of3Monetary3Economics,!2003:!49V123.!
Arezki,!Rabah,!and!Frederick!van!der!Ploeg.!"Do!Natural!Resources!Depress!Income!
Per!Capita?"!Review3of3Development3Economics!15,!no.!3!(2011):!504V521.!
Boom,!David!E.,!Jeffrey!D.!Sachs,!Paul!Collier,!and!Christopher!Udry.!"Geography,!
Demography,!and!Economic!Growth!in!Africa."!Brookings3Papers3on3Economic3
Activity!(Brookings!Institution!Press)!1998,!no.!2!(1998):!207V295.!
Boschini,!Anne!D.,!Jan!Petterson,!and!Jasper!Roine.!"Resource!Curse!Or!Not:!A!
Question!of!Appropriability."!SSE/EFI3Working3Paper3in3Economics3and3
Finance,!2003:!1V38.!
Bureau!of!Democracy,!Human!Rights!and!Labor.!20103Human3Rights3Report:3Oman.!
U.S.!Department!of!State,!2011.!

! ! Schneider!57!
Easterly,!William,!and!Ross!Levine.!"Tropics,!Germs,!and!Crops:!How!Endowments!
Influence!Economic!Development."!Journal3of3Monetary3Economics!50!(2003):!
3V39.!
ESRI.!"Arcworld!Supplement!Data!Reference!and!User's!Guide."!Redlands,!CA,!1996.!
Gylfason,!Thorvaldur.!"Natural!Resources,!Education,!And!Economic!Development."!
International3Macroeconomics!(Center!for!Economic!Policy!Research),!2000:!
1V21.!
Hall,!Robert!E.,!and!Charles!I.!Jones.!"Why!Do!Some!Countries!Produce!So!Much!
More!Output!Per!Worker!Than!Others?"!NBER3Working3Paper3Series!
(National!Bureau!of!Economic!Research),!May!1998.!
Humphreys,!Macartan,!Jeffrey!Sachs,!and!Joseph!Stiglitz.!"Chapter!1:!Introduction:!
What!Is!The!Problem!with!Natural!Resources!Wealth?"!In!Escaping3the3
Resource3Curse,!by!Macartan!Humphreys,!Jeffrey!Sachs!and!Joseph!Stiglitz,!1V
29.!New!York:!Columbia!University!Press,!2007.!
Marshall,!Monty!G.,!Ted!Rober!Gurr,!and!Keith!Jaggers.!Polity3IV3Project3Dataset3
Users'3Manual:3Political3Regime3Characteristics3and3Transitions,31800\2013.!
Center!for!Systemic!Peace,!2014.!
North,!Douglass!C.!Institutions,3Institutional3Change3And3Economic3Performance.!
Cambridge:!Cambridge!University!Press,!1990.!
Sachs,!Jeffrey!D.,!and!Andrew!M.!Warner.!Natural3Resource3Abundance3and3Economic3
Growth.!Cambridge,!MA:!Harvard,!1997.!
—.!“Natural!Resources!and!Economic!Development:!The!Curse!of!Natural!Resources.”!
European3Economic3Review!45!(2001):!827V838.!

! ! Schneider!58!
—.!Natural3Resources3and3Economic3Development:3The3Curse3of3Natural3Resources.!
Cambridge:!Harvard!University,!2001.!
—.!"Economic!Reform!and!the!Process!of!Global!Integration."!Brookings3Papers3on3
Economic3Activity,!1995.!
Tsui,!Kevin!K.!“More!Oil,!Less!Democracy:!Evidence!From!Worldwide!Crude!Oil!
Discoveries.”!The3Economic3Journal!121!(March!2010):!89V115.!
van!der!Ploeg,!Frederick.!"Natural!Resources:!Curse!or!Blessing?"!Journal3of3
Economic3Literature!49,!no.!2!(June!2011):!366V420.!
!
!!!
$
$
$!!!!!!!!!
$!

! ! Schneider!59!
Appendix:$Definitions$and$Descriptive$Statistics$!
Table!1A:!Countries!In!the!Sample!Afghanistan' East'Timor' Kyrgyzstan' Russia'Albania' Ecuador' Laos' Rwanda'Algeria' Egypt' Latvia' Saudi'Arabia'Angola' El'Salvador' Lebanon' Senegal'Argentina' Equatorial'Guinea' Lesotho' Serbia'Armenia' Eritrea' Liberia' Sierra'Leone'Australia' Estonia' Libya' Singapore'Austria' Ethiopia' Lithuania' Slovak'Republic'Azerbaijan' Fiji' Luxembourg' Slovenia'Bahrain' Finland' Macedonia' Solomon'Islands'Bangladesh' France' Madagascar' Somalia'Belarus' Gabon' Malawi' South'Africa'Belgium' Gambia' Malaysia' Spain'Benin' Georgia' Mali' Sri'Lanka'Bhutan' Germany' Mauritania' Sudan'Bolivia' Germany,'East' Mauritius' Suriname'Bosnia' Ghana' Mexico' Swaziland'Botswana' Greece' Moldova' Sweden'Brazil' Guatemala' Mongolia' Switzerland'Bulgaria' Guinea' Montenegro' Syria'Burkina'Faso' Guinea=Bissau' Morocco' Taiwan'Burundi' Guyana' Mozambique' Tajikistan'Cambodia' Haiti' Myanmar'(Burma)' Tanzania'Cameroon' Honduras' Namibia' Thailand'Canada' Hungary' Nepal' Togo'Cape'Verde' India' Netherlands' Trinidad'and'Tobago'Central'African'Republic' Indonesia' New'Zealand' Tunisia'Chad' Iran' Nicaragua' Turkey'Czechoslovakia' Iraq' Niger' Turkmenistan'Chile' Ireland' Nigeria' UAE'China' Israel' Norway' Uganda'Colombia' Italy' Oman' Ukraine'Comoros' Ivory'Coast' Pakistan' United'Kingdom'Congo'Brazzaville' Jamaica' Panama' United'States'Congo'Kinshasa' Japan' Papua'New'Guinea' Uruguay'Costa'Rica' Jordan' Paraguay' USSR'Croatia' Kazakhstan' Peru' Uzbekistan'Cuba' Kenya' Philippines' Venezuela'Cyprus' Korea'North' Poland' Vietnam'

! ! Schneider!60!
Czech'Republic' Korea'South' Portugal' Yemen'Denmark' Kosovo' Qatar' Zambia'Djibouti' Kuwait' Romania' Zimbabwe'Dominican'Rep'
' ' 'Countries!are!primarily!measure!from!1990!–!2010,!although!growth!is!also!calculated!for!the!period!from!1980!–!1990.!!
Table!1B:!Countries!In!Dummy!Variables!MENA' MENA'Restricted'' OPEC''Algeria' Algeria' Algeria'Bahrain' Bahrain' Angola'Egypt' Egypt' Ecuador'Iran' Iran' Iran'Iraq' Iraq' Iraq'Israel' Jordan' Kuwait'Jordan' Kuwait' Libya'Kuwait' Yemen' Nigeria'Lebanon' United'Arab'Emirates' Qatar'Yemen' Libya' Saudi'Arabia'United'Arab'Emirates' Morocco' United'Arab'Emirates'Libya' Oman' Venezuela'Morocco' Palestine'
'Oman' Qatar''Palestine' Saudi'Arabia'
Qatar' Syria''Saudi'Arabia' Tunisia''Syria' Somalia''Tunisia'
' 'Somalia'' '!
!!
!!!!!!!!!!!!

! ! Schneider!61!
!Table!2A:!Summary!Statistics!for!Regression!Series!1!
!Variable' Obs' Mean' Std.'Dev.' Min' Max'Log'GDP'per'Capita'2010' 187' 8.17' 1.57' 5.02' 11.293'Polity'IV'2010' 160' 3.94' 6.31' =10' 10'Durability'2010' 166' 27.55' 31.35' 0' 201'Regulations'on'the'Executive'2010' 160' 2.55' 0.55' 1' 3'Executive'Competitiveness'2010' 160' 2.1' 1.06' 0' 3'Executive'Openness'2010' 160' 3.41' 1.33' 0' 4'Constraints'on'the'Executive'2010' 160' 5.04' 2.00' 1' 7'
!!
Table!2B:!Summary!Statistics!for!Regression!Series!2!!
Variable' Obs' Mean' Std.'Dev.' Min' Max'Growth' 3990' 4.25' 2.14' =1.82' 15.79'Average'Polity'IV' 3490' 2.88' 6.24' =10' 10'Average'Investment' 3990' 3.02' 0.43' 1.15' 4.15'Average'Openness' 3990' 4.31' 0.55' 0.83' 5.89'Initial'Growth' 990' 4.78' 3.25' =5.86' 13.18'Average'Education' 7498' 58.36' 27.2' 7.35' 142.89'Oil'Production' 3229' 18.28' 301.85' =1549.67' 7386.19'
!!
Table!2C:!Summary!Statistics!for!Instrumental!Variable!Regression!Series!!
Variable' Obs' Mean' Std.'Dev.' Min' Max'Tropics' 4994' 0.485' 0.476' 0' 1'
!!!!!!!!
!!!
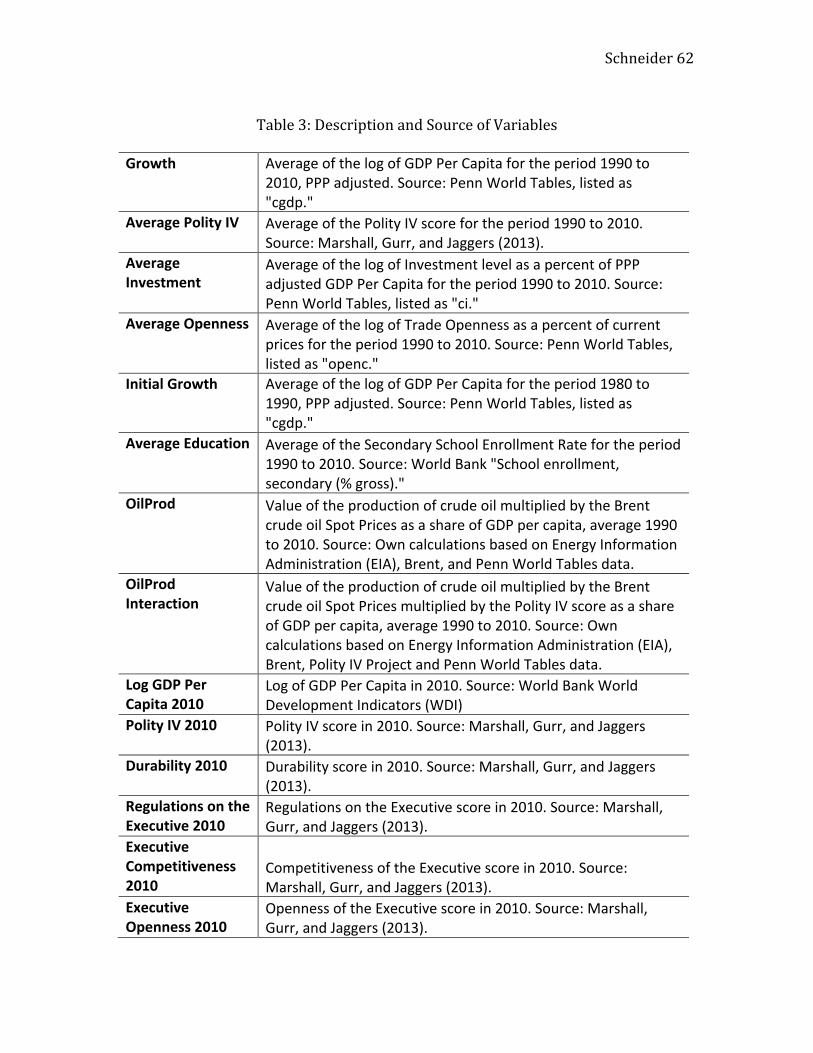
! ! Schneider!62!
!Table!3:!Description!and!Source!of!Variables!
!Growth' Average'of'the'log'of'GDP'Per'Capita'for'the'period'1990'to'
2010,'PPP'adjusted.'Source:'Penn'World'Tables,'listed'as'"cgdp."'
Average'Polity'IV' Average'of'the'Polity'IV'score'for'the'period'1990'to'2010.'Source:'Marshall,'Gurr,'and'Jaggers'(2013).'
Average'Investment'
Average'of'the'log'of'Investment'level'as'a'percent'of'PPP'adjusted'GDP'Per'Capita'for'the'period'1990'to'2010.'Source:'Penn'World'Tables,'listed'as'"ci."'
Average'Openness' Average'of'the'log'of'Trade'Openness'as'a'percent'of'current'prices'for'the'period'1990'to'2010.'Source:'Penn'World'Tables,'listed'as'"openc."'
Initial'Growth' Average'of'the'log'of'GDP'Per'Capita'for'the'period'1980'to'1990,'PPP'adjusted.'Source:'Penn'World'Tables,'listed'as'"cgdp."'
Average'Education' Average'of'the'Secondary'School'Enrollment'Rate'for'the'period'1990'to'2010.'Source:'World'Bank'"School'enrollment,'secondary'(%'gross)."'
OilProd' Value'of'the'production'of'crude'oil'multiplied'by'the'Brent'crude'oil'Spot'Prices'as'a'share'of'GDP'per'capita,'average'1990'to'2010.'Source:'Own'calculations'based'on'Energy'Information'Administration'(EIA),'Brent,'and'Penn'World'Tables'data.''
OilProd'Interaction'
Value'of'the'production'of'crude'oil'multiplied'by'the'Brent'crude'oil'Spot'Prices'multiplied'by'the'Polity'IV'score'as'a'share'of'GDP'per'capita,'average'1990'to'2010.'Source:'Own'calculations'based'on'Energy'Information'Administration'(EIA),'Brent,'Polity'IV'Project'and'Penn'World'Tables'data.''
Log'GDP'Per'Capita'2010'
Log'of'GDP'Per'Capita'in'2010.'Source:'World'Bank'World'Development'Indicators'(WDI)'
Polity'IV'2010' Polity'IV'score'in'2010.'Source:'Marshall,'Gurr,'and'Jaggers'(2013).'
Durability'2010' Durability'score'in'2010.'Source:'Marshall,'Gurr,'and'Jaggers'(2013).'
Regulations'on'the'Executive'2010'
Regulations'on'the'Executive'score'in'2010.'Source:'Marshall,'Gurr,'and'Jaggers'(2013).'
Executive'Competitiveness'2010'
Competitiveness'of'the'Executive'score'in'2010.'Source:'Marshall,'Gurr,'and'Jaggers'(2013).'
Executive'Openness'2010'
Openness'of'the'Executive'score'in'2010.'Source:'Marshall,'Gurr,'and'Jaggers'(2013).'

! ! Schneider!63!
Constraints'on'the'Executive'2010'
Constraints'on'the'Executive'score'in'2010.'Source:'Marshall,'Gurr,'and'Jaggers'(2013).'
Tropics' Percent'of'land'area'in'the'geographical'tropics.'Source:'ESRI'"Arcworld'Supplement'Data'Reference'and'User's'Guide,"'reproduced'by'Portland'State'University'Department'of'Economics.''
All' Dummy'variable'for'the'sub=set'of'169'countries'of'the'world'(see'Appendix'1A).'
All'Restricted' Dummy'variable'for'the'sub=set'of'160'countries'of'the'world'(see'Table'4'for'countries'redacted'from'All).'
MENA' Dummy'variable'for'the'sub=set'of'20'countries'in'the'Middle'East'and'North'Africa'Region'(see'Appendix'1B).'
MENA'Restricted' Dummy'variable'for'the'sub=set'of'22'countries'in'the'Middle'East'and'North'Africa'Region'(see'Appendix'1B).'
OPEC' Dummy'variable'for'the'sub=set'of'12'countries'in'the'Organization'of'Petroleum'Exporting'Countries'(see'Appendix'1B).'
!!**Notes!on!Methodology:!If!future!iterations!of!this!project!in!order!to!correct!for!some!internal!errors,!I!plan!to!create!an!interaction!variable!between!OPEC!and!institutional!quality!to!test!this!inverse!trend.!