the microrna mir-124 controls gene expression in the ...shahamlab.rockefeller.edu/pdf/clark.pdf ·...
TRANSCRIPT
The microRNA miR-124 controls gene expressionin the sensory nervous system of CaenorhabditiselegansAlejandra M. Clark1,2, Leonard D. Goldstein3,4,5, Maya Tevlin6, Simon Tavare3,4,5,
Shai Shaham6,* and Eric A. Miska1,2,*
1Wellcome Trust Cancer Research UK Gurdon Institute, University of Cambridge, The Henry Wellcome Buildingof Cancer and Developmental Biology, Tennis Court Rd, Cambridge CB2 1QN, 2Department of Biochemistry,University of Cambridge, Tennis Court Rd, Cambridge CB2 1GA, 3Department of Oncology, University ofCambridge, Hills Rd, Cambridge CB2 2XZ, 4Cancer Research UK, Cambridge Research Institute, Li Ka ShingCentre, Robinson Way, Cambridge CB2 0RE, 5Department of Applied Mathematics and Theoretical Physics,University of Cambridge, Centre for Mathematical Sciences, Wilberforce Rd, Cambridge CB3 0WA, UKand 6Laboratory of Developmental Genetics, 1033 Weiss Research Building, The Rockefeller University,1230 York Avenue, New York, NY 10065, USA
Received November 6, 2009; Revised and Accepted January 28, 2010
ABSTRACT
miR-124 is a highly conserved microRNA (miRNA)whose in vivo function is poorly understood. Here,we identify miR-124 targets based on the analysis ofthe first mir-124 mutant in any organism. We findthat miR-124 is expressed in many sensoryneurons in Caenorhabditis elegans and onset ofexpression coincides with neuronal morphogenesis.We analyzed the transcriptome of miR-124expressing and nonexpressing cells from wild-typeand mir-124 mutants. We observe that many targetsare co-expressed with and actively repressed bymiR-124. These targets are expressed at reducedrelative levels in sensory neurons compared to therest of the animal. Our data from mir-124 mutantanimals show that this effect is due to a largeextent to the activity of miR-124. Genes withnonconserved target sites show reduced absoluteexpression levels in sensory neurons. In contrast,absolute expression levels of genes with conservedsites are comparable to control genes, suggesting atuning function for many of these targets. Weconclude that miR-124 contributes to definingcell-type-specific gene activity by repressing adiverse set of co-expressed genes.
INTRODUCTION
Gene regulation plays a key role in development. Whilethe significance of transcriptional regulation has long beenrecognized, the potential of post-transcriptional gene reg-ulation mediated by various classes of noncoding smallRNAs is beginning to be unravelled (1). microRNAs(miRNAs) are a widespread class of noncoding �22 ntendogenous RNAs found in animals, plants and algae(2–8). These RNAs modulate gene expression byblocking translation and/or destabilizing target mRNAs(6). The first miRNAs described, lin-4 and let-7, were dis-covered as entities, mutations in which alterdevelopmental timing in the nematode Caenorhabditiselegans (9–11). Since then, a number of approaches,including reverse and forward genetics, have identifiedfunctions for miRNAs in animal and plant development,homeostasis and disease (12–20).Although new sequencing technologies have resulted in
a dramatic increase in the number of known miRNAs(21,22), the functions of the majority of miRNAs remainunknown. One approach to get at miRNA function is toidentify direct targets. While in plants this task has beenfacilitated by the high level of complementarity betweenmiRNAs and their targets (23), identification of physio-logical targets in animals has remained a computationalchallenge. Animal 30UTRs often contain short sequencemotifs that are complementary to the 50-region of the
*To whom correspondence should be addressed. Tel: +44 1223 767 220; Fax: +44 1223 334 089; Email: [email protected]
The authors wish it to be known that, in their opinion, the first three authors should be regarded as joint First Authors.
Correspondence may also be addressed to Shai Shaham. Fax: +1 212 327 7129; Email: [email protected]
Nucleic Acids Research, 2010, 1–14doi:10.1093/nar/gkq083
� The Author(s) 2010. Published by Oxford University Press.This is an Open Access article distributed under the terms of the Creative Commons Attribution Non-Commercial License (http://creativecommons.org/licenses/by-nc/2.5), which permits unrestricted non-commercial use, distribution, and reproduction in any medium, provided the original work is properly cited.
Nucleic Acids Research Advance Access published February 21, 2010 at R
ockefeller University Library on June 2, 2010
http://nar.oxfordjournals.orgD
ownloaded from
miRNA, termed the seed sequence (nucleotides 2–7),which is thought to be the main determinant of miRNAtarget specificity. These sequence motifs have beenconserved during evolution at higher rates than expectedby chance (24–27). A 30UTR match to the miRNA seedsequence can be sufficient for miRNA-mediated repres-sion (24,28). The vast majority of in vivo validatedmiRNA interaction sites are also found in the 30UTR(9,11,12,29,30). Hence, most existing computationalmethods for miRNA target prediction are based on theidentification of conserved 30UTR seed matches.Computational studies suggest that single miRNAs
may bind hundreds of targets. Indeed, more than half ofall human mRNAs may be under positive selection tomaintain miRNA target sites (31). Early experimentalconfirmation of these hypotheses came from miRNAoverexpression studies in cell lines, which demonstratedthat hundreds of mRNAs were subtly downregulated inresponse to ectopic miRNA expression (32). Although ini-tially miRNAs were thought to act predominantly at thetranslational level, recent proteomics studies suggest thatchanges in the abundance of transcript and protein arehighly correlated and of comparable magnitude (33,34).Beyond the question of which mRNAs are biologically
relevant miRNA targets, general questions about themode of miRNA function, such as the extent of co-expression of a miRNA and its targets, have remainedunanswered. Knowing whether miRNA and target expres-sion is overlapping or not can be useful in elucidating thefunction of miRNA-dependent target regulation. At thetwo extremes, overlapping and mutually exclusive expres-sion suggest a tuning and switch-like role for the miRNA,respectively. A study in Drosophila, based on mRNA insitu data, suggested mutually exclusive expression ofmiRNAs and their targets (35). In contrast, microarraystudies of mRNA expression across different human andmouse tissues demonstrated that miRNA targets are oftenco-expressed with the miRNA, but at reduced relativelevels compared to tissues or developmental time pointswhere the miRNA is absent (36,37). A furthercomputational study concluded that miRNAs and theirtargets are often positively or negatively co-regulated(38). Together, these studies suggested that miRNAs con-tribute to tissue-specific mRNA expression. It remainedunclear however whether reduced relative expression ofmiRNA targets in the presence of the miRNA is due todirect miRNA-mediated repression or other regulatorymechanisms acting in concert with the miRNA. Morerecently, Shkumatava et al. (39) and Mishima et al. (40)addressed this issue by analyzing mRNA expression insorted cell populations from wild-type and MZdicermutant zebrafish.The miRNA miR-124 provides an excellent opportunity
for investigating the mode of action of miRNAs: it ishighly conserved and tissue specific, and found in thenervous system of all animals studied to date (41–47).Although several studies have aimed to understand thefunction of miR-124 in neuronal development, experi-ments have largely relied on knockdown or overexpressionof miR-124 in cell culture. Overexpression of miR-124 inHeLa cells shifts the gene expression profile towards a
brain-like pattern (32) and overexpression of miR-124 inneuroblastoma cell lines and embryonic stem cells can leadto induction of neuronal differentiation (48,49). miR-124in vivo knockdown experiments in the developing chickspinal cord led either to no effect (50) or modest effectson neuronal differentiation (51). In mice, miR-124 knock-down experiments resulted in defects in adult neurogenesis(52).
Here, we examine the mode of action of C. elegansmiR-124 by studying the impact of miR-124 deletion onthe transcriptome of cells expressing the miRNA, whichwe identify as a subset of sensory neurons. We show thatgenes upregulated in mir-124 mutant sensory neurons areenriched for likely direct miR-124 targets. We observe thattargets are expressed at reduced relative levels in wild-typesensory neurons compared to the rest of the animal, andthat these differences are largely due to direct miRNA-mediated repression. These results suggest that miR-124contributes to defining gene expression in sensory neuronsby regulating a large number of co-expressed genes.
MATERIALS AND METHODS
Strains
Caenorhabditis elegans strains were cultured usingstandard methods (53) at 20� C. The following strains,CX3716, CX3695, PY2417, CX3553, BZ555, CX3465,DA1262 were provided by the Caenorhabditis GeneticsCenter, which is funded by the NIH National Center forResearch Resources (NCRR). For a full list of all strainsused in this study see Supplementary Table S1.
Plasmid constructs
Oligos 50-CGTTAGATTGCTTCTTC-30 and 50-GGAGAAGAGAGCACTTGAAG-30 were used to amplify �2 kbof genomic sequence upstream of mir-124. GFP wasamplified from pPD95.75 and mir-124 promoter::GFP(pmir-124::GFP) generated by PCR fusion (54). mir-124promoter::mCherry (pmir-124::mCherry) was generatedby PCR fusion using the same oligos for mir-124promoter indicated above.
Transgenic strains
Germline transformations were carried out as describedin ref. (55). pmir-124::GFP (5 ng/ml) was coinjectedwith pEM27 (plin-15 rescue) into lin-15 (n765) worms,and pmir-124::mcherry (5 ng/ml) was injected into N2.Extrachromosomal transgenes [pmir-124::GFP+lin-15(+)] were integrated by X-ray irradiation andsubsequently outcrossed twice into N2 background.
Cell dissociation and cell culture
Embryos were obtained from synchronized populations ofSX620 and SX621 worms and dissociated as previouslydescribed (56–58). Briefly, 500 000 gravid adults (grownat 20�C in 5� 15 cm plates) were lysed in hypochloritesolution to release embryos. Embryos were washed inegg buffer containing 118mM NaCl, 48mM KCl, 2mMCaCl2, 2mM MgCl2 and 25mM HEPES (pH 7.3) and
2 Nucleic Acids Research, 2010
at Rockefeller U
niversity Library on June 2, 2010 http://nar.oxfordjournals.org
Dow
nloaded from

subsequently treated with Chitinase 1U/ml (SigmaC-7809) for 45min to digest egg shells. Embryo pelletswere washed in egg buffer and incubated in Trypsin(GIBCO) for 20 mins prior to pipetting several times tofacilitate cell dissociation. Dissociated cells were purifiedby passage through 5mm filters (Durapore) using a 10mlsyringe and resuspended in L-15 medium (GIBCO)supplemented with 10% FBS (HYCLONE), 50 U/mlpenicillin and 50 mg/ml streptomycin, plus sucrose forosmolarity. Embryonic cells were plated on poly-L-Lysine (0.01%, Sigma) coated culture dishes at 107 cells/ml and cultured for 24 h.
Fluorescence activated cell sorting
Sorting experiments were carried out as previouslydescribed in ref. (56) with the following modifications:A BD FACSAriaII (BD Biosciences) equipped with a50mw 488 nm laser was used to sort 500 000 cells foreach sample directly into extraction buffer (AbsolutelyRNA microprep kit, Stratagene). Purity of the sortedcells as assessed by resorting GFP+ and GFP� cellsafter first sort was 74.4% and 91.4%, respectively.
Isolation and amplification of mRNA
mRNA was extracted from 500 000 cells by using theAbsolutely RNA microprep kit (Stratagene), yielding�15 ng mRNA that was subsequently amplified atGeneCore Facility (EMBL). qRT–PCR for miRNAswas carried out as previously described (59,60). For alloligos used, see Supplementary Table 3.
Array hybridization
mRNA isolated and amplified from three biological exper-iments was hybridized to the Affymetrix GeneChip forC. elegans. In total, 12 samples were hybridized: three bio-logical replicates of GFP+ and GFP� cells from bothwild-type and mir-124 mutant animals. Arrays werescanned on an Affymetrix 3000 7G scanner.
Microarray data analysis
Affymetrix CEL files were read into the statistical pro-gramming environment R (61). Array quality controlwas performed using packages available fromBioconductor (62). Arrays were processed using theRMA function (63), performing background correction,quantile normalization and probe set summary, andfurther analyzed using the limma package (64). Since thequality of arrays varied, array quality weights wereobtained and used in the linear model fit (65). Probe setswere mapped to Entrez genes using the celegans.dbpackage available from Bioconductor. When we usedexpression values for individual genes, these wereobtained from the linear model fit. In the case ofmultiple probe sets mapping to the same gene, valueswere summarized by the arithmetic mean (on the log2scale). Array data were submitted to the GeneExpression Omnibus (GEO, http://www.ncbi.nlm.nih.gov/geo/) under accession number GSE16050.
30UTR sequences
A 6-way multiple genome alignment between C. elegans,C. briggsae, C. remanei, C. brenneri, C. japanico andPristionchus pacificus based on C. elegans genomeassembly ce6 was downloaded from the UCSC GenomeBrowser website (http://genome.ucsc.edu/) (66,67).Multiple alignments of 30UTR sequences were extractedbased on coordinates in the refGene table (68). In the caseof multiple entries for the same RefSeq identifier, the entrywith longest sequence was chosen (if there were multipleentries with maximal length, one was chosen at random).
Target prediction
Caenorhabditis elegans 30UTR sequences were scanned forperfect matches against the miR-124 seed sequence(nucleotides 2–7), and the identity of one upstream andone downstream flanking nucleotide was retained for eachseed match. A seed match was considered a putative targetsite if it was flanked by an adenosine opposite miRNAnucleotide 1 (position t1) or flanked by a perfect matchto miRNA nucleotide 8 (position t8), or both. Whenassessing the expression of miR-124 targets as a class,only those transcripts with a 30UTR seed match flankedby a t8 match were included in the analysis. Target sites(defined as a seed match and flanking positions t1, t8) wereconsidered conserved if they overlapped target sites in thealigned sequences of C. briggsae, C. remanei andC. brenneri by one or more nucleotides. Predictions arelisted in Supplementary Table 4.
Gene annotation
Analysis of the gene expression data was based on Entrezgenes. An Entrez gene was considered a (conserved) targetif at least one of the associated RefSeq genes contained a(conserved) 30UTR seed match. For the seed match typeanalysis in Figure 4J, an Entrez gene was considered torepresent a given seed match type if all associated RefSeqgenes with available 30UTR contained a single 30UTR seedmatch of that type. For the Sylamer analysis and compu-tation of probabilities for random site occurrences, eachEntrez gene was assigned a representative RefSeq gene bychoosing the gene with longest annotated 30UTR.
Sylamer analysis
For each comparison, genes were ranked from mostincreased to most decreased based on the B-statistic. Inthe case of multiple probe sets for the same gene, the generank was determined by the probe set with largestB-statistic. 30UTR sequences were purged with defaultsettings as described in ref. (69). Biases in the nucleotidecomposition of 30UTR sequences were accounted forusing a third-order Markov model. Significance thresholdswere adjusted for multiple testing using the Bonferronicorrection.
GO analysis
We considered genes represented on the array andwith available GO biological process annotation (70).We identified genes with increased expression in
Nucleic Acids Research, 2010 3
at Rockefeller U
niversity Library on June 2, 2010 http://nar.oxfordjournals.org
Dow
nloaded from
wild-type GFP+ compared to GFP� cells as those withat least one probe set with Benjamini–Hochberg correctedP< 0.05 (moderated t-test) and fold-change >2.Enrichment and depletion of GO terms was assessed bya two-sided Fisher’s exact test. P-values were corrected formultiple testing using the Benjamini–Hochberg method.
Differential expression of miR-124 targets
To assess the differential expression of conserved andnonconserved miR-124 targets, we compared the meanexpression level of targets to mean expression levels of10 000 cohorts of control genes. We computed one-sidedP-values for reduced expression as the fraction of cohortswith mean expression levels smaller than or equal to themean expression level of targets. These P-values weresubsequently converted to two-sided P-values. Controlgenes were chosen to have 30UTR features comparableto the targets under consideration. More specifically, fora set of targets represented on the array, control geneswere obtained by drawing an identical number of genesout of the pool of all genes with available 30UTR andexpression data. The likelihood of a gene being chosenwas proportional to the probability of its 30UTR contain-ing relevant target sites. For an individual gene, wemodeled 30UTR site occurrences as a Poisson processwith expected value Np, where p was set to the probabilityof a given 7-mer in the 30UTR matching miR-124nucleotides 2–8 under a second-order Markov model.For conserved and nonconserved sites, N was chosen tobe the number of conserved 7-mers (Nc) and nonconserved7-mers (Nn), respectively. The probability of a gene con-taining one or more conserved target sites was thenestimated as 1 – exp(�Nc p). The probability of a genecontaining no conserved target sites and one or morenonconserved target sites was estimated as exp(�Nc p)(1 – exp(�Nn p)), respectively.
RESULTS
C. elegans miR-124 is expressed in a subsetof sensory neurons
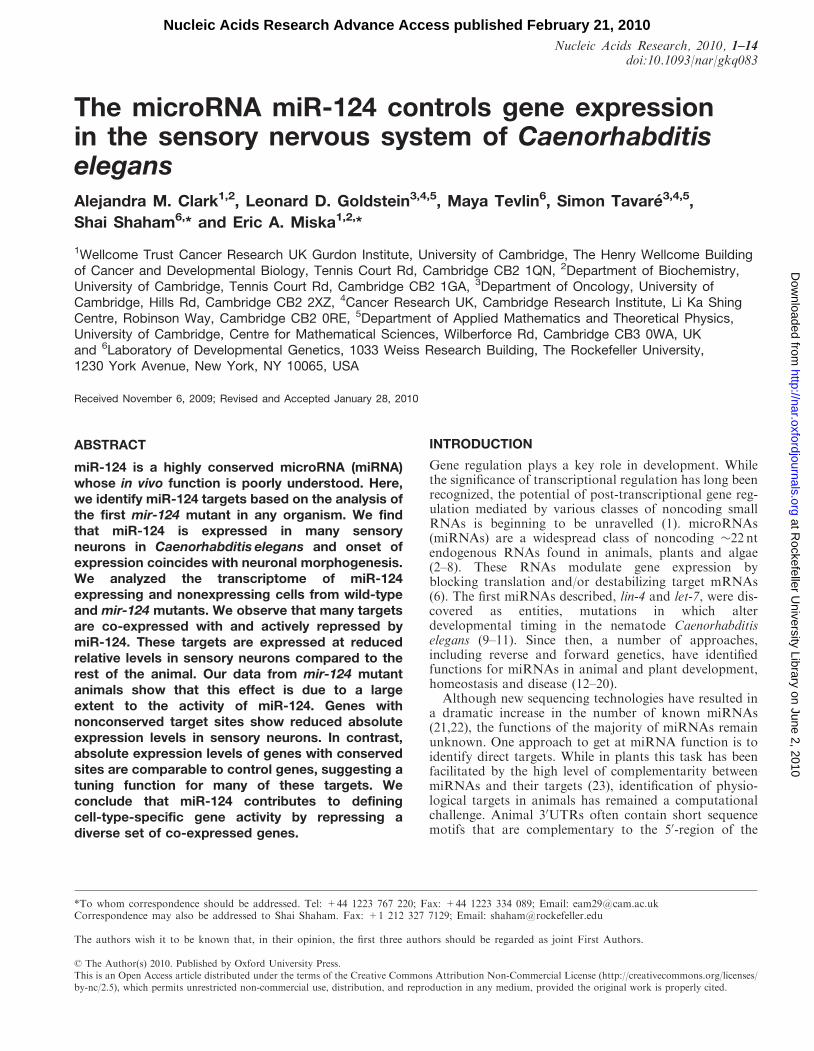
miR-124 is a highly conserved miRNA, presentin deuterosomes, ecdysozoa and lophotrochozoa(Figure 1A) (Fay Christodoulou and Detlev Arendt,personal communication) (41,71–74). While manymiRNAs typically show cross-species sequence conserva-tion in the 50-region, known as the miRNA seed(nucleotides 2–7, Figure 1A), miR-124 is one of threemiRNAs that is conserved throughout its length fromC. elegans to humans. Unlike vertebrate genomes, theC. elegans genome encodes only a single copy of themir-124 gene and no other miRNA gene with identicalseed sequence. To determine the expression pattern ofC. elegans miR-124, we generated animals carrying agenomically integrated mir-124 promoter::gfp transgene.mir-124 promoter::gfp transgenic animals show GFPexpression in a subset of neurons, detectable frommid-embryogenesis (�350min post-fertilization), whenneuronal differentiation begins, throughout developmentand in adults (Figure 1B–E). These data are consistent
pmir-124::mCherry
osm-9::GFP
MERGE
F
G
H
seed
B C
D E
AP. schmidtea miR-124c UAAGGCACGCGGUGAAUGCCAP. dumerilii miR-124 UAAGGCACGCGGUGAAUGCCAC. elegans miR-124 UAAGGCACGCGGUGAAUGCCAD. melanogaster miR-124 UAAGGCACGCGGUGAAUGCCAAGD. rerio miR-124 UAAGGCACGCGGUGAAUGCCAAM. musculus miR-124 UAAGGCACGCGGUGAAUGCCH. sapiens miR-124 UAAGGCACGCGGUGAAUGCC
Figure 1. Caenorhabditis elegans miR-124 is expressed in ciliatedsensory neurons (A) miR-124 primary sequence is highly conservedfrom C. elegans to Homo sapiens. Topology of phylogenetic tree isbased on ref. (86). (B–E) mir-124 promoter::gfp is expressed inC. elegans sensory neurons at different developmental stages. (B andD) Embryos at mid- (350min post-fertilization) and late- (�600minpost-fertilization) embryogenesis, respectively, (C and E) at earlylarval stages L2, L1, respectively. This expression persists throughadulthood. (E) Arrow indicates mir-124 promoter::gfp expression inthe phasmid sensory neurons. (B and C) Dorsal and (D and E)lateral views. (B–E) Anterior is left, (E) ventral is down. (F–H)mir-124 is expressed in a subset of ciliated neurons as indicated by itsoverlap with osm-9::gfp expression pattern. (F) An adult animalexpressing mir-124 promoter::mCherry. Arrowhead and arrow indicateI6 (not ciliated) and ADE neurons, respectively, not overlapping withosm-9. (G) osm-9::gfp, arrowhead and arrow indicate IL2s and OLQsnot overlapping with mir-124 expression pattern. (H) Merge of mir-124promoter::mCherry and osm-9::gfp shows colocalization in amphidsensory neurons. This colocalization is evident from embryogenesis(data not shown) and persists through adulthood.
4 Nucleic Acids Research, 2010
at Rockefeller U
niversity Library on June 2, 2010 http://nar.oxfordjournals.org
Dow
nloaded from
with previous analyses of the temporal pattern of miR-124expression in C. elegans using northern blotting (71) andhigh-throughput sequencing of small RNA libraries (75).We detected mir-124 promoter::gfp expression in �40 ofthe 302 neurons in C. elegans. Using direct observationand crosses to strains containing specific neuronalmarkers (see ‘Materials and Methods’ section), weidentified some of these as sensory neurons most ofwhich are ciliated [AWC, AWA, AWB, ASH, ASI,ASK, PVQ (not ciliated), ASE, PHA, PHB, PVD (notciliated), IL1, ADE, PDE] (Supplementary Table 2). Theextensive overlap between osm-9::gfp, a reporter expressedin a subset of ciliated neurons (76), and mir-124 pro-moter::mcherry confirmed that mir-124 is mainlyexpressed in ciliated neurons (Figure 1F–H).
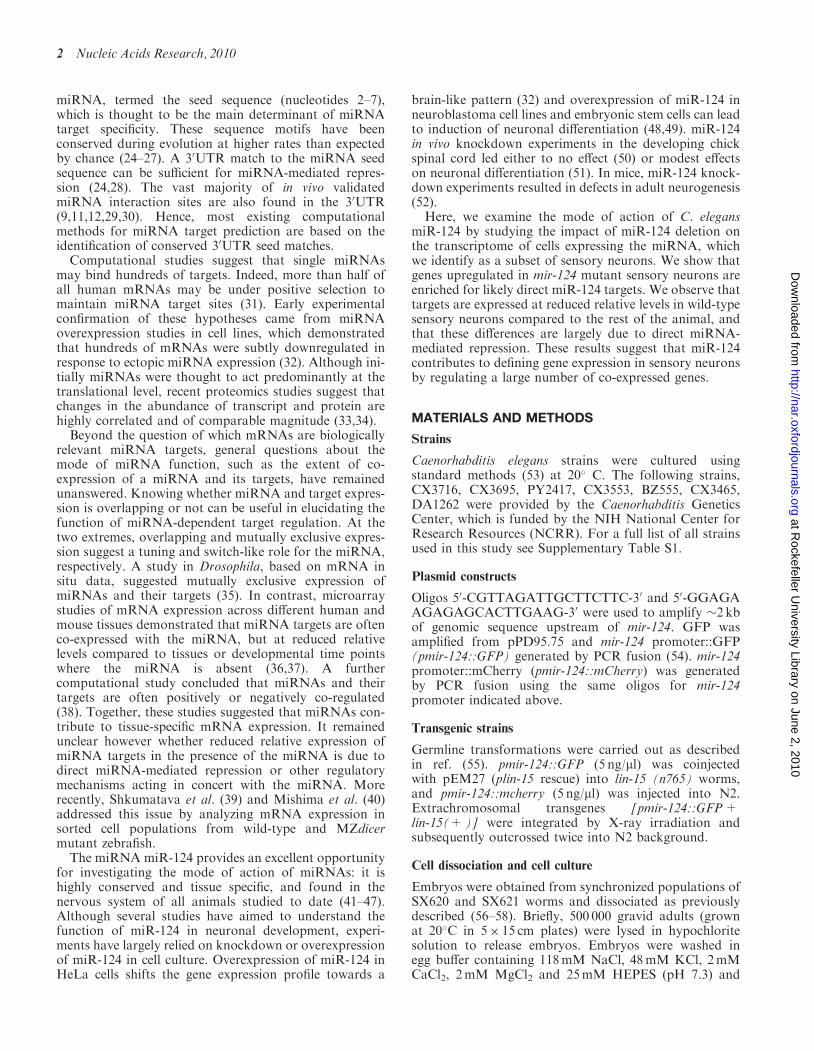
To investigate the in vivo function of mir-124, wecharacterized a mutant strain carrying a deletion allele,n4255 (77), that completely abrogates miR-124 expression(Figure 2A and B). As previously described, mir-124mutants are viable with no gross abnormalities (77). Todetermine whether C. elegans miR-124 is required forsensory neuron differentiation, we studied the morphologyof mir-124 expressing neurons in wild-type and mutantanimals using a number of neuronal cell fate markers.We did not observe any obvious defects in number ordifferentiation of sensory neurons (Supplementary TableS2 and data not shown).
Isolation of miR-124 expressing cells reveals a distinctsensory expression profile
We took advantage of the fact that mutation of mir-124did not cause any gross abnormalities of development ofthe nervous system. We reasoned that we would be able todetect the direct effect of the miRNA on the transcriptomeof sensory neurons. Although, based on our reportertransgene, miR-124 is highly expressed, only �4% of thecells of the entire animal express the miRNA. Therefore,to study the transcriptional profile of specifically miR-124
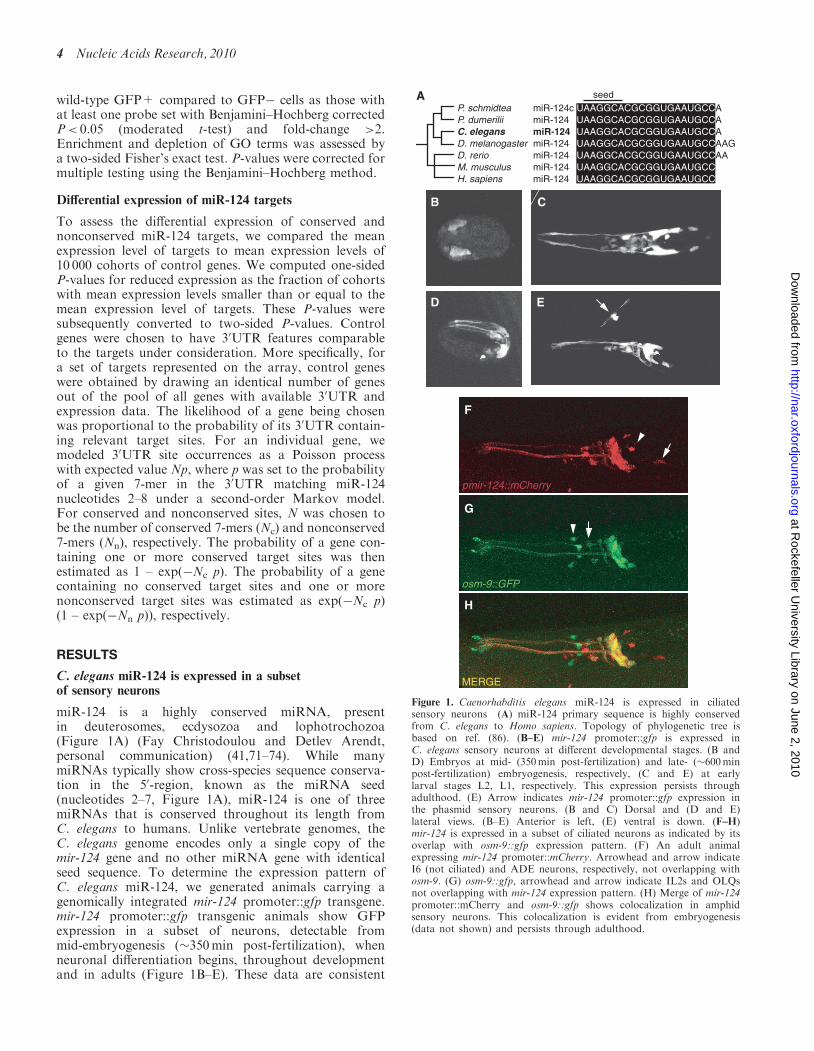
expressing cells, we used fluorescence-activated cell sorting(FACS) to isolate mir-124 promoter::gfp labeled embry-onic cells. We generated four different cell populations:GFP+ (miR-124 expressing) and GFP� cells from bothwild-type and mutant animals (Figure 3A–E), and theRNA obtained from these cell populations was subjectedto microarray analysis (39,40,56–58).To assess the purity of the sorted cell populations, we
measured the levels of GFP mRNA in GFP+ and GFP�cells by qRT–PCR. As expected, we failed to detect GFPmRNA in GFP� cells (Supplementary Figure S2). To testwhether the regulatory regions of the mir-124 pro-moter::gfp reporter capture the expression domain ofendogenous miR-124, we examined the levels of maturemiR-124 from GFP+ and GFP� cells by qRT–PCR. Ourresults show �5-fold enrichment of miR-124 in GFP+cells (Supplementary Figure S3), confirming that mir-124promoter::gfp recapitulates the endogenous miR-124expression pattern.Next, we compared the transcriptional profile of
miR-124 expressing (GFP+) and nonexpressing (GFP�)cells from wild-type animals. Among genes with increasedexpression in GFP+ cells, we found an enrichment ofgenes assigned the GO terms cilium biogenesis andchemotaxis (Table 1). These results are consistent withthose of previous studies that examined the profile ofciliated neurons (78–80), thus validating our experimentalapproach, and confirming our GFP reporter studies sug-gesting that most miR-124 expressing cells are ciliatedsensory neurons.
miR-124 loss of function results in derepressionof direct targets
To investigate gene expression changes upon mir-124deletion, we first compared mir-124 mutant versuswild-type GFP+ cells. We ranked genes from most
wild-typemir-124 A
B
C
D
E
Figure 3. Isolation and expression analysis of miR-124 expressingcells from wild-type and mir-124 mutants. (A) Embryo isolation,(B) cell dissociation by chitinase and trypsin treatment, (C) embryoniccell culture, (D) enrichment of GFP+ and GFP- cell by FACS,(E) analysis of mRNA expression by Affymetrix arrays.
mir-124
n4255
trpa-1
miR-52
miR-124
wt n4255
A
B
1kb
Figure 2. Genomic location of mir-124 and mutant allele. (A) mir-124lies within a �6-kb intron of host gene trpa-1. The n4255 allele is a212-bp deletion that spans the entire mature sequence of miR-124. Thisdeletion does not abrogate trpa-1 expression (see Supplementary FigureS1). (B) Northern blot shows expression of mature miR-124 inwild-type (wt) and absence in n4255 mutant, miR-52 was used asloading control.
Nucleic Acids Research, 2010 5
at Rockefeller U
niversity Library on June 2, 2010 http://nar.oxfordjournals.org
Dow
nloaded from
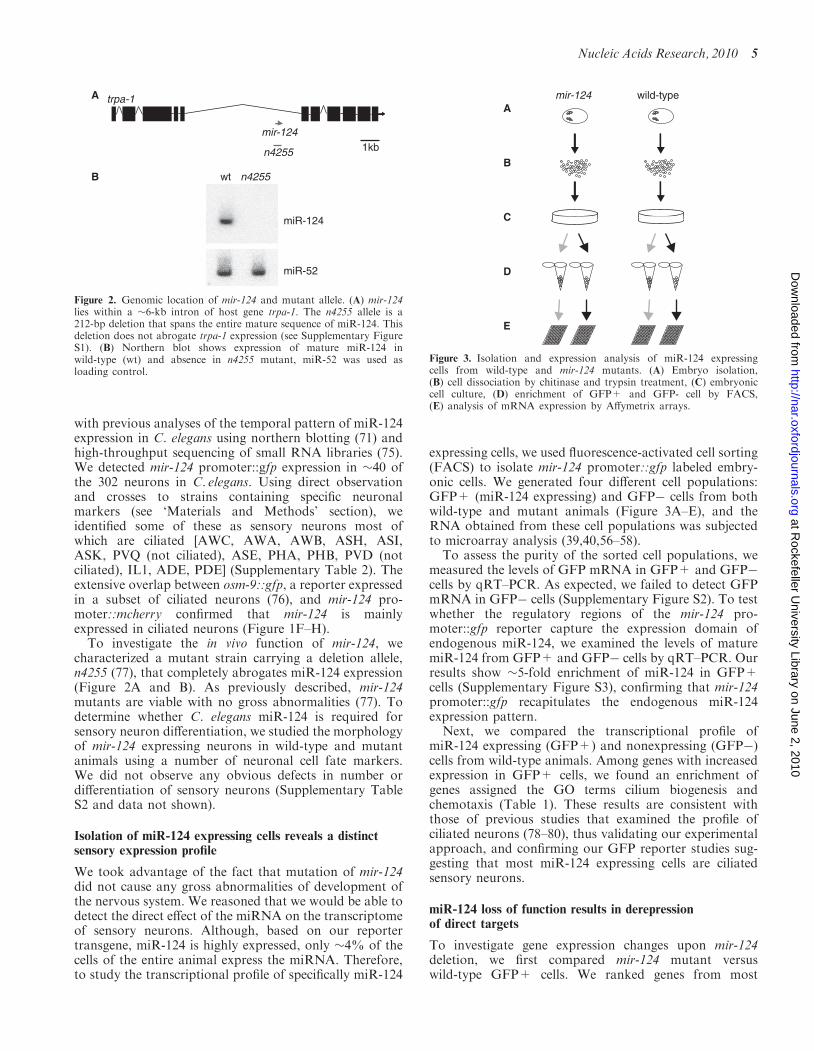
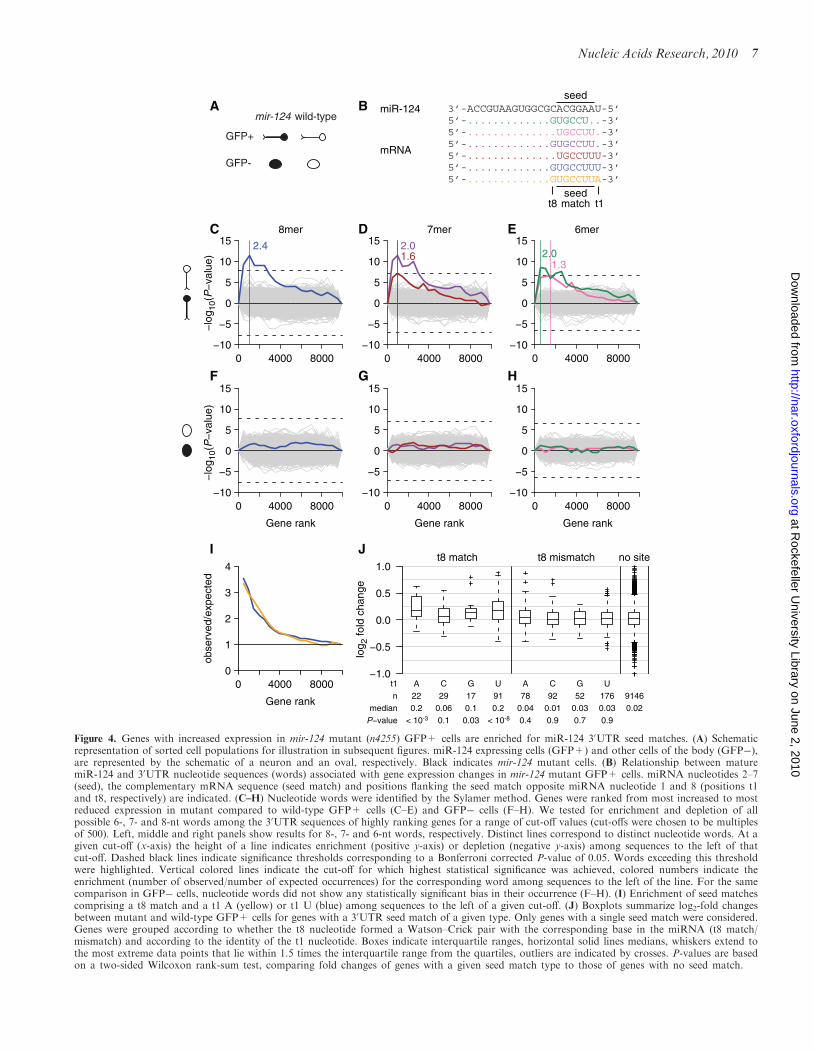
increased to most decreased expression and used theSylamer method (69) to identify nucleotide sequences(words) that are enriched or depleted in the 30UTRsequences of high-ranking compared to low-rankinggenes (Figure 4). Out of all possible 6-, 7- and 8-ntwords, the five words with strongest bias in their occur-rence (Sylamer P< 0.05 after Bonferroni correction) wereoverrepresented in 30UTRs of genes with increased expres-sion in mutant GFP+ cells (Figure 4C–E). All of thesewords matched the seed sequence of mature miR-124(Figure 4B). Two 6-mers and one 7-mer covered thereverse complement of miR-124 nucleotides 2–8, whileone 7-mer and one 8-mer showed perfect Watson–Crickpairing to miR-124 nucleotides 2–7 and a uracil oppositethe first nucleotide of the miRNA (position t1 in themRNA transcript, see Figure 4B). The three wordsincluding a match to miRNA nucleotide 8 showed 2-foldor greater enrichment among the 30UTRs of the mostupregulated genes (Figure 4C–E). To test whether this sig-nature was specific to miR-124, we searched for depletionor enrichment of 6-, 7- and 8-nt words in the 30UTRs ofgenes with altered expression in cells that do not expressmiR-124 (GFP� cells, Figure 4F–H). We did not detectany words with biased occurrence in this analysis, con-firming that the previously identified signature representsan enrichment of most likely direct miR-124 targetsamong upregulated genes. We also did not detect anybias in the occurrence of miR-124 associated wordswhen considering the sequences of 50UTRs or codingsequences (data not shown), consistent with most func-tional miRNA target sites residing in the 30UTRs ofprotein-coding genes (81).
Two of the identified words comprised a perfect seedmatch flanked by a uracil at position t1. Previous studiesin vertebrates suggested that an adenosine at t1 is mostbeneficial for target repression, irrespective of the identityof the first nucleotide of the miRNA (26). Indeed, whenconsidering the enrichment of seed matches with a t8match and a t1 A or t1 U, we observed a comparableenrichment in the 30UTRs of highly ranked genes(Figure 4I). However, the total number of identified seedmatches with a t8 match and t1 U (n=145) was almostfour times as high as the number of correspondingmatches flanked by a t1 A (n=38), explaining thegreater statistical significance of the enrichment ofmatches with a t1 U (Figure 4C). We note that inannotated C. elegans 30UTRs (see ‘Materials andMethods’ section), the trinucleotide UUU occurs overthree times more frequently than the trinucleotide UUA.Therefore, the observed t1 bias can be explained, at leastin part, by overall 30UTR nucleotide composition. Sincethe increased efficacy in target repression due to a t1 Amight be specific to vertebrates, or individual miRNAfamilies only, we repeated the analysis in (26) for individ-ual miRNA families (Supplementary Figures S4 and S5).We confirmed the preferential conservation of anadenosine immediately downstream of conserved 30UTRseed matches for most miRNA families in vertebrates. Innematodes, however, in most cases the number ofidentified conserved 30UTR seed matches for individualmiRNA families was too small to conclusively assessbiases in nucleotide identity at the t1 position.
To further investigate the effectiveness of distinct seedmatch types in conferring repression at the mRNA
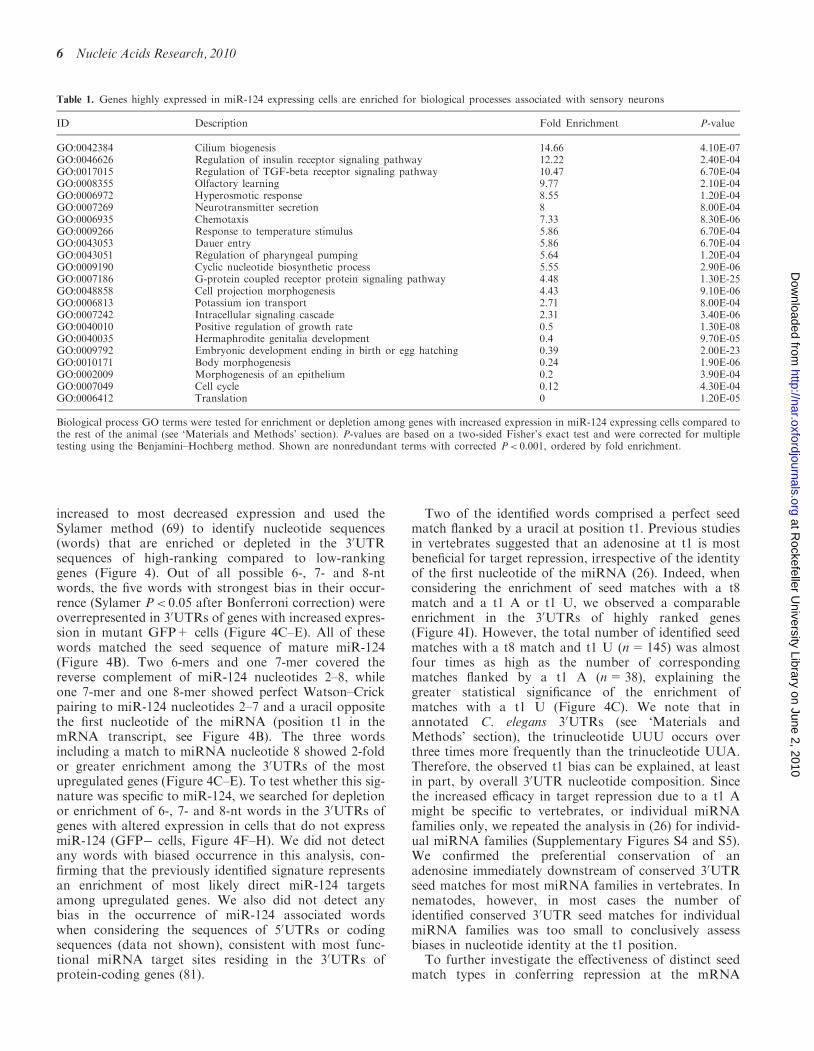
Table 1. Genes highly expressed in miR-124 expressing cells are enriched for biological processes associated with sensory neurons
ID Description Fold Enrichment P-value
GO:0042384 Cilium biogenesis 14.66 4.10E-07GO:0046626 Regulation of insulin receptor signaling pathway 12.22 2.40E-04GO:0017015 Regulation of TGF-beta receptor signaling pathway 10.47 6.70E-04GO:0008355 Olfactory learning 9.77 2.10E-04GO:0006972 Hyperosmotic response 8.55 1.20E-04GO:0007269 Neurotransmitter secretion 8 8.00E-04GO:0006935 Chemotaxis 7.33 8.30E-06GO:0009266 Response to temperature stimulus 5.86 6.70E-04GO:0043053 Dauer entry 5.86 6.70E-04GO:0043051 Regulation of pharyngeal pumping 5.64 1.20E-04GO:0009190 Cyclic nucleotide biosynthetic process 5.55 2.90E-06GO:0007186 G-protein coupled receptor protein signaling pathway 4.48 1.30E-25GO:0048858 Cell projection morphogenesis 4.43 9.10E-06GO:0006813 Potassium ion transport 2.71 8.00E-04GO:0007242 Intracellular signaling cascade 2.31 3.40E-06GO:0040010 Positive regulation of growth rate 0.5 1.30E-08GO:0040035 Hermaphrodite genitalia development 0.4 9.70E-05GO:0009792 Embryonic development ending in birth or egg hatching 0.39 2.00E-23GO:0010171 Body morphogenesis 0.24 1.90E-06GO:0002009 Morphogenesis of an epithelium 0.2 3.90E-04GO:0007049 Cell cycle 0.12 4.30E-04GO:0006412 Translation 0 1.20E-05
Biological process GO terms were tested for enrichment or depletion among genes with increased expression in miR-124 expressing cells compared tothe rest of the animal (see ‘Materials and Methods’ section). P-values are based on a two-sided Fisher’s exact test and were corrected for multipletesting using the Benjamini–Hochberg method. Shown are nonredundant terms with corrected P< 0.001, ordered by fold enrichment.
6 Nucleic Acids Research, 2010
at Rockefeller U
niversity Library on June 2, 2010 http://nar.oxfordjournals.org
Dow
nloaded from
B
DC
A
H
6mer7mer8mer
I
3’-ACCGUAAGUGGCGCACGGAAU-5’5’-.............GUGCCU..-3’5’-..............UGCCUU.-3’
5’-..............UGCCUUU-3’5’-.............GUGCCUUU-3’
miR-124
mRNA
5’-.............GUGCCUUA-3’
seedmatch
seed
t1t8
5’-.............GUGCCUU.-3’
E
GF0 4000 8000
−10
−5
0
5
10
15
1.32.0
0 4000 8000−10
−5
0
5
10
15 2.01.6
−lo
g 10(
P−
valu
e)−
log 1
0(P
−va
lue)
0 4000 8000−10
−5
0
5
10
15 2.4
Gene rank
0 4000 8000−10
−5
0
5
10
15
Gene rank
0 4000 8000−10
−5
0
5
10
15
Gene rank
0 4000 8000−10
−5
0
5
10
15
0 4000 80000
1
2
3
4
Gene rank
obse
rved
/exp
ecte
d
wild-typemir-124
GFP+
GFP-
J
log 2
fold
cha
nge
−1.0
−0.5
0.0
0.5
1.0t8 match t8 mismatch no site
t1n
medianP−value
A C G U A C G U91460.02
220.2
< 10-3
290.060.1
170.1
0.03
910.2
< 10-8
780.040.4
920.010.9
520.030.7
1760.030.9
Figure 4. Genes with increased expression in mir-124 mutant (n4255) GFP+ cells are enriched for miR-124 30UTR seed matches. (A) Schematicrepresentation of sorted cell populations for illustration in subsequent figures. miR-124 expressing cells (GFP+) and other cells of the body (GFP�),are represented by the schematic of a neuron and an oval, respectively. Black indicates mir-124 mutant cells. (B) Relationship between maturemiR-124 and 30UTR nucleotide sequences (words) associated with gene expression changes in mir-124 mutant GFP+ cells. miRNA nucleotides 2–7(seed), the complementary mRNA sequence (seed match) and positions flanking the seed match opposite miRNA nucleotide 1 and 8 (positions t1and t8, respectively) are indicated. (C–H) Nucleotide words were identified by the Sylamer method. Genes were ranked from most increased to mostreduced expression in mutant compared to wild-type GFP+ cells (C–E) and GFP� cells (F–H). We tested for enrichment and depletion of allpossible 6-, 7- and 8-nt words among the 30UTR sequences of highly ranking genes for a range of cut-off values (cut-offs were chosen to be multiplesof 500). Left, middle and right panels show results for 8-, 7- and 6-nt words, respectively. Distinct lines correspond to distinct nucleotide words. At agiven cut-off (x-axis) the height of a line indicates enrichment (positive y-axis) or depletion (negative y-axis) among sequences to the left of thatcut-off. Dashed black lines indicate significance thresholds corresponding to a Bonferroni corrected P-value of 0.05. Words exceeding this thresholdwere highlighted. Vertical colored lines indicate the cut-off for which highest statistical significance was achieved, colored numbers indicate theenrichment (number of observed/number of expected occurrences) for the corresponding word among sequences to the left of the line. For the samecomparison in GFP� cells, nucleotide words did not show any statistically significant bias in their occurrence (F–H). (I) Enrichment of seed matchescomprising a t8 match and a t1 A (yellow) or t1 U (blue) among sequences to the left of a given cut-off. (J) Boxplots summarize log2-fold changesbetween mutant and wild-type GFP+ cells for genes with a 30UTR seed match of a given type. Only genes with a single seed match were considered.Genes were grouped according to whether the t8 nucleotide formed a Watson–Crick pair with the corresponding base in the miRNA (t8 match/mismatch) and according to the identity of the t1 nucleotide. Boxes indicate interquartile ranges, horizontal solid lines medians, whiskers extend tothe most extreme data points that lie within 1.5 times the interquartile range from the quartiles, outliers are indicated by crosses. P-values are basedon a two-sided Wilcoxon rank-sum test, comparing fold changes of genes with a given seed match type to those of genes with no seed match.
Nucleic Acids Research, 2010 7
at Rockefeller U
niversity Library on June 2, 2010 http://nar.oxfordjournals.org
Dow
nloaded from

level, we considered changes in expression of genes with asingle 30UTR seed match (Figure 4J). Changes weremodest, with the expression of all but one gene increasing<2-fold in mutant GFP+ cells. Genes harboring a singleseed match with a Watson–Crick pair at flanking positiont8, augmented by a t1 A or U, showed greatest increasein expression compared to genes with no seed match(P< 10�3, P< 10�8, respectively, two-sided Wilcoxonrank-sum test). Changes in the expression of genes witha seed match flanked by a t8 mismatch did not achievestatistical significance for any t1 nucleotide. However,we observed a trend for increased expression of seedmatch harboring transcripts with a t8 mismatch andt1 adenosine.Taken together, these observations are consistent with
miRNA-mediated repression of mRNA targets throughperfect matches to the miRNA seed sequence in their30UTRs. We also confirmed the hierarchy in the effective-ness of distinct seed match types previously describedbased on studies in vertebrates (82). For the remainderof the study, we therefore focussed on transcripts with aperfect 30UTR match to the miR-124 seed sequence(nucleotides 2–7) flanked by a t8 match to the miRNAor with a t1 adenosine (or both). For brevity, wereferred to these below as miR-124 targets, and to thecorresponding seed matches as target sites, althoughthese are at present only candidate target genes and sites.
miR-124 represses conserved and nonconserved targets insensory neurons
Different roles have been suggested for genes withconserved and nonconserved miRNA binding sites intheir 30UTR. While conservation is usually interpretedas an indication of biological function, nonconservedtargets may constitute biologically important species-specific targets, or non-functional or inconsequentialtargets. To characterize differences in the behavior of thetwo target classes, we identified conserved targets byrequiring the conservation of at least one 30UTR site inC. briggsae, C. remanei and C. brenneri (see ‘Materials andMethods’ section). When assessing the expression ofmiR-124 targets as a class, we only considered those tran-scripts with a 30UTR seed match flanked by a t8 match.We first considered the comparison described in theprevious section, analyzing changes in the expression ofmiR-124 targets upon loss of miR-124. When consideringGFP+ cells (Figure 5A), we observed a strong derepres-sion of both conserved and nonconserved targets ascompared to control genes (P< 10�4, P< 10�4, see‘Materials and Methods’ section). Approximately 73%and 65% of conserved and nonconserved targets showedincreased expression (fold change >1) in the absence ofmiR-124, respectively (compared to 55% of genes with nosite). When considering targets with an increase in expres-sion of at least 20%, the proportions of conserved andnonconserved targets were 38% and 25%, respectively(compared to 11% of genes with no site). Thus, overallconserved targets underwent greater changes in expressionupon loss of miR-124 than nonconserved targets. Thissuggested that site conservation is indeed indicative of
functional or highly effective sites or that a greater pro-portion of conserved targets may be co-expressed with themiRNA. In contrast, in GFP� cells the observedfold changes of targets were similar to control genes(Figure 5B), indicating high fidelity of the mir-124 pro-moter::gfp reporter and purity of the FACS sorted cellpopulations.
Reduced relative expression of miR-124 targets in sensoryneurons is largely due to miR-124-mediated repression
Previous studies reported reduced relative expression ofmiRNA targets in tissues where the miRNA is expressed(35-37). However, the mechanisms underlying this phe-nomenon observed for many tissue-specific miRNAscould only be addressed indirectly, by examining theexpression profile of wild-type cells. This observationcould be explained by either direct miRNA-mediatedrepression or a tendency towards mutually exclusiveexpression of the miRNA and its targets. Our analysiscomparing mutant and wild-type GFP+ cells establishedthat the effect could be explained, in part, by direct repres-sion. To further investigate this question, we examinedrelative expression levels (GFP+/GFP�) in wild-
A B
C D
−1 0 1
0.0
0.2
0.4
0.6
0.8
1.0
P < 10-4P < 10-4
−1 0 1
0.0
0.2
0.4
0.6
0.8
1.0
P = 0.57P = 0.39
−3 0 3
0.0
0.2
0.4
0.6
0.8
1.0
P < 10-4P < 0.01
−3 0 3
0.0
0.2
0.4
0.6
0.8
1.0
P < 0.01P = 0.29
Cum
ulat
ive
frac
tion
Cum
ulat
ive
frac
tion
log2 fold difference log2 fold difference
MT vs WT (GFP+) MT vs WT (GFP-)
GFP+ vs GFP- (WT) GFP+ vs GFP- (MT)
Figure 5. Differential expression of conserved and nonconservedmiR-124 targets. Shown are the cumulative distributions of log2-folddifferences in the expression of genes with 30UTRs harboring at leastone conserved target site (light grey), exclusively nonconserved targetsites (dark grey) or no seed match (black). Only seed matches with a t8match were considered target sites. Two-sided empirical P-values wereobtained by comparing the mean expression level of targets to the meanexpression levels of 10 000 cohorts of control genes (see ‘Materials andMethods’ section). Shown are data for the comparison between mir-124mutant and wild-type GFP+ (A) and GFP� (B) cells. Observedchanges in expression for conserved and nonconserved targets differedfrom those for control genes in GFP+ cells but not in GFP� cells. (Cand D) Shown are the cumulative distributions of log2 fold differencesbetween GFP+ and GFP� cells in wild-type (C) and mutant animals(D), otherwise as in previous panels.
8 Nucleic Acids Research, 2010
at Rockefeller U
niversity Library on June 2, 2010 http://nar.oxfordjournals.org
Dow
nloaded from

type and mir-124 mutant animals (Figure 5C and D).As expected, we observed reduced relative expression ofboth conserved and nonconserved miR-124 targets inwild-type animals (P< 0.01, P< 10�4, see ‘Materials andMethods’ section) (Figure 5C). In the absence of miR-124,this effect was greatly reduced but persisted fornonconserved targets (P=0.29, P< 0.01, see ‘Materialsand Methods’ section) (Figure 5D). This suggested thatthe overall differences in relative expression betweenGFP+ and GFP� cells observed in wild-type were to alarge extent due to direct miRNA-mediated repression.However, in the case of nonconserved targets differencesalso appeared to be due to other mechanisms.
Conserved and nonconserved targets of miR-124 differ intheir absolute expression levels in sensory neurons
To investigate absolute expression levels of miR-124targets, we compared the mean probe-set intensity oftarget genes to the mean probe-set intensities of sets ofcontrol genes in the same biological sample (see‘Materials and Methods’ section). In Figure 6, meanintensities of control gene sets are plotted as histograms,and observed mean intensities of targets are indicated byvertical colored lines. Conserved targets showed meanexpression levels similar to control genes in all four cellpopulations, with a trend for reduced expression inwild-type miR-124 expressing cells (Figure 6A–D). Incontrast, absolute expression levels of nonconservedtargets were reduced in wild-type GFP+ cells (P< 0.01,see Materials and Methods, Figure 6E and F). A trend forreduced expression of nonconserved targets persisted inmir-124 mutant GFP+ cells, consistent with site avoid-ance of genes that are highly expressed in sensory neuronsand accumulation of nonconserved sites in genes that arehighly expressed in other cells of the animal. Nevertheless,we observed a derepression of nonconserved targets uponmiR-124 deletion (Figures 5A, 6E and F), suggesting thatmany nonconserved targets are indeed co-expressed withthe miRNA.
Unlike nonconserved targets, conserved targets did notshow reduced absolute expression levels in mir-124 mutantGFP+ cells compared to control genes. Although it is notpossible to assess absolute gene expression levels con-clusively based on a microarray experiment, these resultssuggest high expression of many conserved miR-124targets in cells that express the miRNA.
miR-124 targets show diverse patterns of spatialexpression
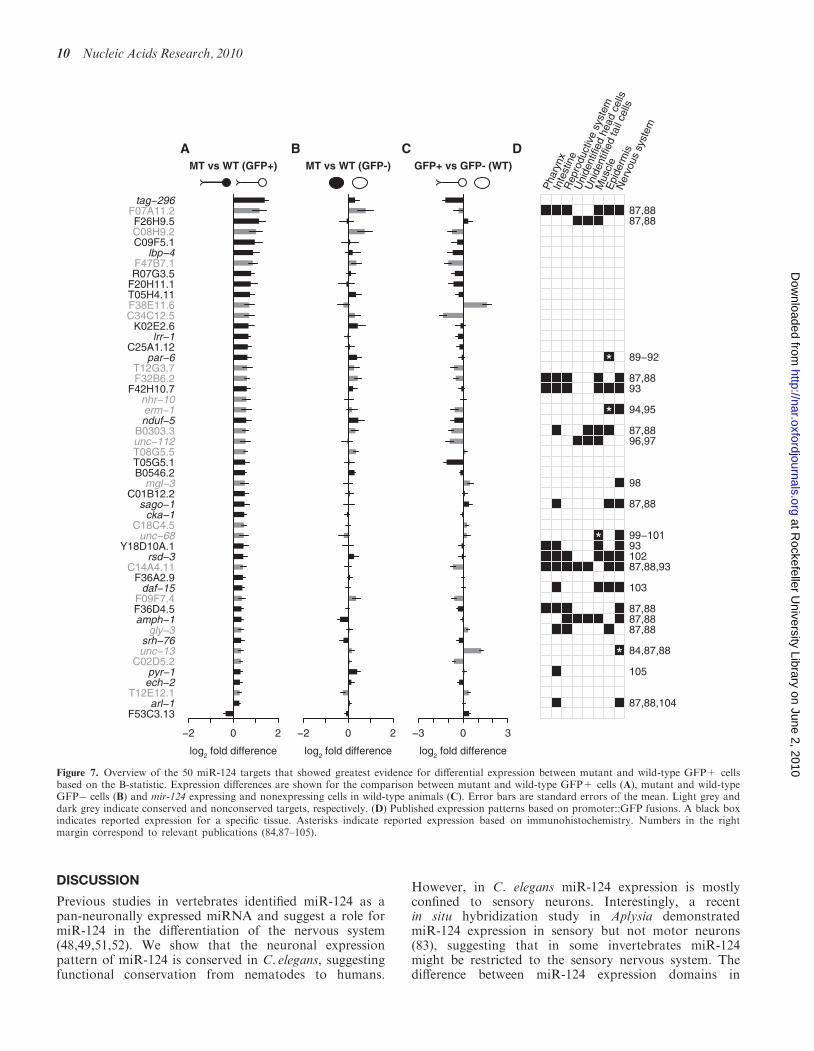
To further characterize individual target genes, we selectedthe 50 genes with one or more 30UTR target sites thatshowed greatest evidence for differential expressionbetween mir-124 mutant and wild-type sensory neuronsbased on the B-statistic (see Materials and Methods).We examined fold-changes between mir-124 mutant andwild-type GFP+ and GFP� cells (Figure 7A and B).Forty-nine out of the 50 genes showed increased expres-sion in mir-124 mutant sensory neurons (Figure 7A).Changes between mir-124 mutant and wild-type GFP-cells were small and less biased towards increased
expression as compared to GFP+ cells (Figure 7B), sug-gesting that these genes are direct targets of miR-124. Inwild-type animals, the relative expression levels of thesegenes were biased towards reduced expression in GFP+compared to GFP� cells, as expected. However, someindividual genes showed high relative expression insensory neurons (Figure 7C). In many cases, these wereconsistent with published expression patterns based onpromoter::GFP fusions and immunohistochemistry(Figure 7D).
A B
C D
E F
G H
6 7 8
0.0
0.1
0.2
0.3
0.4
6 7 8
0.0
0.1
0.2
0.3
0.4
6 7 8
0.0
0.1
0.2
0.3
0.4
6 7 8
0.0
0.1
0.2
0.3
0.4
6 7 8
0.0
0.1
0.2
0.3
0.4
6 7 8
0.0
0.1
0.2
0.3
0.4
6 7 8
0.0
0.1
0.2
0.3
0.4
6 7 8
0.0
0.1
0.2
0.3
0.4
log2 intensity log2 intensity
Den
sity
Den
sity
Den
sity
Den
sity
P = 0.68P = 0.18
P = 1.0 P = 0.91
P = 0.008 P = 0.063
P = 0.62 P = 0.69
TMTW
GF
P+
GF
P-
GF
P+
GF
P-
Figure 6. Absolute expression levels of conserved and nonconservedmiR-124 targets. Differential expression was assessed by comparingthe mean log2 intensities of targets to the mean log2 intensities of10 000 cohorts of control genes (see ‘Materials and Methods’ section).Mean log2 intensities for the control sets were plotted as histograms.Vertical light grey and dark grey lines indicate the mean log2 intensityof conserved (A–D) and nonconserved targets (E–H), respectively.
Nucleic Acids Research, 2010 9
at Rockefeller U
niversity Library on June 2, 2010 http://nar.oxfordjournals.org
Dow
nloaded from
DISCUSSION
Previous studies in vertebrates identified miR-124 as apan-neuronally expressed miRNA and suggest a role formiR-124 in the differentiation of the nervous system(48,49,51,52). We show that the neuronal expressionpattern of miR-124 is conserved in C. elegans, suggestingfunctional conservation from nematodes to humans.
However, in C. elegans miR-124 expression is mostlyconfined to sensory neurons. Interestingly, a recentin situ hybridization study in Aplysia demonstratedmiR-124 expression in sensory but not motor neurons(83), suggesting that in some invertebrates miR-124might be restricted to the sensory nervous system. Thedifference between miR-124 expression domains in
F53C3.13arl−1
T12E12.1ech−2pyr−1
C02D5.2unc−13srh−76
gly−3amph−1F36D4.5F09F7.4
daf−15F36A2.9
C14A4.11rsd−3
Y18D10A.1unc−68
C18C4.5cka−1
sago−1C01B12.2
mgl−3B0546.2T05G5.1T08G5.5unc−112B0303.3
nduf−5erm−1nhr−10
F42H10.7F32B6.2T12G3.7
par−6C25A1.12
lrr−1K02E2.6
C34C12.5F38E11.6T05H4.11F20H11.1R07G3.5F47B7.1
lbp−4C09F5.1C08H9.2F26H9.5
F07A11.2tag−296
−2 0 2
log2 fold difference
−2 0 2
log2 fold difference
−3 0 3
log2 fold difference
A B C D
*
*
*
*
Pha
rynx
Inte
stin
eR
epro
duct
ive
syst
em
Uni
dent
ified
hea
d ce
lls
Uni
dent
ified
tail
cells
Mus
cle
Epi
derm
isN
ervo
us s
yste
m
87,88,104
105
84,87,88
87,8887,8887,88
103
87,88,931029399−101
87,88
98
96,9787,88
94,95
9387,88
89−92
87,8887,88
MT vs WT (GFP+) MT vs WT (GFP-) GFP+ vs GFP- (WT)
Figure 7. Overview of the 50 miR-124 targets that showed greatest evidence for differential expression between mutant and wild-type GFP+ cellsbased on the B-statistic. Expression differences are shown for the comparison between mutant and wild-type GFP+ cells (A), mutant and wild-typeGFP� cells (B) and mir-124 expressing and nonexpressing cells in wild-type animals (C). Error bars are standard errors of the mean. Light grey anddark grey indicate conserved and nonconserved targets, respectively. (D) Published expression patterns based on promoter::GFP fusions. A black boxindicates reported expression for a specific tissue. Asterisks indicate reported expression based on immunohistochemistry. Numbers in the rightmargin correspond to relevant publications (84,87–105).
10 Nucleic Acids Research, 2010
at Rockefeller U
niversity Library on June 2, 2010 http://nar.oxfordjournals.org
Dow
nloaded from
vertebrates and invertebrates suggests that miR-124 mighthave evolved to have different functions and/or targets.
Here, we describe the analysis of the first mir-124mutant in any organism. Our characterization of mir-124mutant animals did not reveal any obvious defects in thedifferentiation of the sensory nervous system understandard laboratory conditions. Therefore, we wereunable to confirm the observations made for miR-124in vertebrate systems in C. elegans in vivo. As suggestedpreviously, this could be due to differences in miR-124function among animal species or differences in experi-mental approaches, as other studies relied on miR-124overexpression or knockdown by anti-sense probes, insome instances in cell culture.
We investigated the mode of action of C. elegansmiR-124 by studying its impact on the transcriptome inboth miR-124 expressing and nonexpressing cells. Amongthe genes with increased expression in mir-124 mutantsensory neurons, we found an enrichment of likely directmiR-124 targets, suggesting that many targets areco-expressed with and actively repressed by miR-124.These data confirm recent studies of mRNA expressionin miR-124 expressing cells of wild-type and MZdicermutant zebrafish, which lack the function of allmiRNAs (39).
The significance of post-transcriptional regulation bymiR-124 was supported by our analysis of absoluteexpression levels. Expression data from animals lackingmiR-124 suggested that many conserved targets wereexpressed in both sensory neurons and the rest of theanimal. In the miR-124 expressing sensory neurons ofwild-type animals, we observed a trend for reducedabsolute expression compared to control genes, presum-ably due to direct miRNA-mediated repression. Takentogether, these results suggest that miR-124 tunes theexpression of many of these genes, rather than actingexclusively as a fail-safe mechanism against spurioustranscription.
We observed reduced relative expression of miRNAtargets in cells where the miRNA is expressed, a phenom-enon that has been described for many tissue-specificmiRNAs (35–37). However, it was previously unclearwhether this observation could be explained bytranscriptional regulation or whether it was due tomiRNA-mediated mRNA degradation. Here, we showthat for C. elegans miR-124 the phenomenon is largelydue to a direct effect of the miRNA. However, in thecase of nonconserved targets, reduced relative expressionin sensory neurons persisted in the absence of the miRNA.This observation is consistent with site avoidance forgenes highly expressed in sensory neurons, and accumula-tion of sites for genes expressed in cells where the miRNAis absent. Similar observations were made in zebrafish formiR-124 (39) and the muscle-specific miRNAs miR-1 andmiR-133 (39,40) when analyzing miRNA-expressing cellsfrom wild-type and MZdicer animals.
While the biological significance of actively repressednonconserved targets remains unclear, conserved targetslikely represent those key to understanding the function ofmiR-124. Since miR-124 is expressed from embryogenesisthroughout adulthood it is conceivable that various
processes, from development of the nervous system toneuronal function, could be regulated. For example, reg-ulation of the conserved target unc-13, a neurotransmitterrelease regulator localized to most or all synapses (84),might be important for modulating neurotransmission.However, the class of genes with conserved 30UTR seedmatches to miR-124 as a whole, and the subset we foundto respond during embryonic development, were notenriched for any particular biological function (notshown), and it remains open why this particular set ofgenes is experiencing evolutionary pressure to be underpost-transcriptional regulation in sensory neurons. Thedata presented here suggest that miR-124 contributes tothe control of numerous biological processes. Thephenotypic outcome of this control, however, remains tobe elucidated and may only become apparent under moreextreme conditions, as recently suggested by a study ofmiR-7 in Drosophila (85).
SUPPLEMENTARY DATA
Supplementary Data are available at NAR Online.
ACKNOWLEDGEMENTS
We thank Svetlana Mazel and Christopher Bare for theirhelp with flow cytometry, Vladimir Benes and TomiIvacevic at EMBL for performing the array experiments,Partha Das for help with northern blotting, theCaenorhabditis Genetics Center for strains. We thankmembers of the Miska lab for comments on the article.
FUNDING
Cancer Research UK Programme Grant (C13474 toE.A.M.); core funding to the Wellcome Trust/CancerResearch UK Gurdon Institute provided by theWellcome Trust (UK); Cancer Research UK; NationalInstitutes of Health (NS064273 to S.S.) in part; EPSRCfellowship (UK); Cancer Research UK (to L.D.G.);Cancer Research UK Programme (C14303 to S.T.);Hutchison Whampoa Limited (to L.D.G., S.T.).Funding for open access charge: Cancer Research UK.
Conflict of interest statement. None declared.
REFERENCES
1. Sharp,P.A. (2009) The centrality of RNA. Cell, 136, 577–580.2. Arazi,T., Talmor-Neiman,M., Stav,R., Riese,M., Huijser,P. and
Baulcombe,D.C. (2005) Cloning and characterization ofmicro-RNAs from moss. Plant J., 43, 837–848.
3. Lagos-Quintana,M., Rauhut,R., Lendeckel,W. and Tuschl,T.(2001) Identification of novel genes coding for small expressedRNAs. Science, 294, 853–858.
4. Lau,N.C., Lim,L.P., Weinstein,E.G. and Bartel,D.P. (2001) Anabundant class of tiny RNAs with probable regulatory roles inCaenorhabditis elegans. Science, 294, 858–862.
5. Lee,R.C. and Ambros,V. (2001) An extensive class of smallRNAs in Caenorhabditis elegans. Science, 294, 862–864.
6. Bartel,D.P. (2004) MicroRNAs: genomics, biogenesis, mechanism,and function. Cell, 116, 281–297.
Nucleic Acids Research, 2010 11
at Rockefeller U
niversity Library on June 2, 2010 http://nar.oxfordjournals.org
Dow
nloaded from

7. Lim,L.P., Glasner,M.E., Yekta,S., Burge,C.B. and Bartel,D.P.(2003) Vertebrate microRNA genes. Science, 299, 1540.
8. Grimson,A., Srivastava,M., Fahey,B., Woodcroft,B.J.,Chiang,H.R., King,N., Degnan,B.M., Rokhsar,D.S. andBartel,D.P. (2008) Early origins and evolution of microRNAs andPiwi-interacting RNAs in animals. Nature, 455, 1193–1197.
9. Wightman,B., Ha,I. and Ruvkun,G. (1993) Posttranscriptionalregulation of the heterochronic gene lin-14 by lin-4 mediatestemporal pattern formation in C. elegans. Cell, 75, 855–862.
10. Reinhart,B.J., Slack,F.J., Basson,M., Pasquinelli,A.E.,Bettinger,J.C., Rougvie,A.E., Horvitz,H.R. and Ruvkun,G. (2000)The 21-nucleotide let-7 RNA regulates developmental timing inCaenorhabditis elegans. Nature, 403, 901–906.
11. Lee,R.C., Feinbaum,R.L. and Ambros,V. (1993) The C. elegansheterochronic gene lin-4 encodes small RNAs with antisensecomplementarity to lin-14. Cell, 75, 843–854.
12. Johnston,R.J. and Hobert,O. (2003) A microRNA controllingleft/right neuronal asymmetry in Caenorhabditis elegans. Nature,426, 845–849.
13. Brennecke,J., Hipfner,D.R., Stark,A., Russell,R.B. andCohen,S.M. (2003) bantam encodes a developmentally regulatedmicroRNA that controls cell proliferation and regulates theproapoptotic gene hid in Drosophila. Cell, 113, 25–36.
14. Giraldez,A.J., Cinalli,R.M., Glasner,M.E., Enright,A.J.,Thomson,J.M., Baskerville,S., Hammond,S.M., Bartel,D.P. andSchier,A.F. (2005) MicroRNAs regulate brain morphogenesis inzebrafish. Science, 308, 833–838.
15. Rodriguez,A., Vigorito,E., Clare,S., Warren,M.V., Couttet,P.,Soond,D.R., van Dongen,S., Grocock,R.J., Das,P.P., Miska,E.A.et al. (2007) Requirement of bic/microRNA-155 for normalimmune function. Science, 316, 608–611.
16. Sokol,N.S. and Ambros,V. (2005) Mesodermally expressedDrosophila microRNA-1 is regulated by Twist and is required inmuscles during larval growth. Genes Dev., 19, 2343–2354.
17. Juarez,M.T., Kui,J.S., Thomas,J., Heller,B.A. andTimmermans,M.C. (2004) microRNA-mediated repression ofrolled leaf1 specifies maize leaf polarity. Nature, 428, 84–88.
18. Palatnik,J.F., Allen,E., Wu,X., Schommer,C., Schwab,R.,Carrington,J.C. and Weigel,D. (2003) Control of leafmorphogenesis by microRNAs. Nature, 425, 257–263.
19. Lu,J., Getz,G., Miska,E.A., Alvarez-Saavedra,E., Lamb,J.,Peck,D., Sweet-Cordero,A., Ebert,B.L., Mak,R.H., Ferrando,A.A.et al. (2005) MicroRNA expression profiles classify humancancers. Nature, 435, 834–838.
20. Teleman,A.A., Maitra,S. and Cohen,S.M. (2006) Drosophilalacking microRNA miR-278 are defective in energy homeostasis.Genes Dev., 20, 417–422.
21. Griffiths-Jones,S. (2004) The microRNA Registry. Nucleic AcidsRes., 32, D109–D111.
22. Griffiths-Jones,S., Grocock,R.J., van Dongen,S., Bateman,A. andEnright,A.J. (2006) miRBase: microRNA sequences, targets andgene nomenclature. Nucleic Acids Res., 34, D140–D144.
23. Rhoades,M.W., Reinhart,B.J., Lim,L.P., Burge,C.B., Bartel,B. andBartel,D.P. (2002) Prediction of plant microRNA targets. Cell,110, 513–520.
24. Brennecke,J., Stark,A., Russell,R.B. and Cohen,S.M. (2005)Principles of microRNA-target recognition. PLoS Biol., 3, e85.
25. Krek,A., Grun,D., Poy,M.N., Wolf,R., Rosenberg,L.,Epstein,E.J., MacMenamin,P., da Piedade,I., Gunsalus,K.C.,Stoffel,M. et al. (2005) Combinatorial microRNA targetpredictions. Nat. Genet., 37, 495–500.
26. Lewis,B.P., Burge,C.B. and Bartel,D.P. (2005) Conserved seedpairing, often flanked by adenosines, indicates that thousands ofhuman genes are microRNA targets. Cell, 120, 15–20.
27. Xie,X., Lu,J., Kulbokas,E.J., Golub,T.R., Mootha,V.,Lindblad-Toh,K., Lander,E.S. and Kellis,M. (2005) Systematicdiscovery of regulatory motifs in human promoters and 30 UTRsby comparison of several mammals. Nature, 434, 338–345.
28. Doench,J.G. and Sharp,P.A. (2004) Specificity of microRNAtarget selection in translational repression. Genes Dev., 18,504–511.
29. Abrahante,J.E., Daul,A.L., Li,M., Volk,M.L., Tennessen,J.M.,Miller,E.A. and Rougvie,A.E. (2003) The Caenorhabditis elegans
hunchback-like gene lin-57/hbl-1 controls developmental time andis regulated by microRNAs. Dev. Cell, 4, 625–637.
30. Lin,S.Y., Johnson,S.M., Abraham,M., Vella,M.C., Pasquinelli,A.,Gamberi,C., Gottlieb,E. and Slack,F.J. (2003) The C. eleganshunchback homolog, hbl-1, controls temporal patterning and is aprobable microRNA target. Dev. Cell, 4, 639–650.
31. Friedman,R.C., Farh,K.K., Burge,C.B. and Bartel,D.P. (2009)Most mammalian mRNAs are conserved targets of microRNAs.Genome Res., 19, 92–105.
32. Lim,L.P., Lau,N.C., Garrett-Engele,P., Grimson,A., Schelter,J.M.,Castle,J., Bartel,D.P., Linsley,P.S. and Johnson,J.M. (2005)Microarray analysis shows that some microRNAs downregulatelarge numbers of target mRNAs. Nature, 433, 769–773.
33. Baek,D., Villen,J., Shin,C., Camargo,F.D., Gygi,S.P. andBartel,D.P. (2008) The impact of microRNAs on protein output.Nature, 455, 64–71.
34. Selbach,M., Schwanhausser,B., Thierfelder,N., Fang,Z., Khanin,R.and Rajewsky,N. (2008) Widespread changes in protein synthesisinduced by microRNAs. Nature, 455, 58–63.
35. Stark,A., Brennecke,J., Bushati,N., Russell,R.B. and Cohen,S.M.(2005) Animal MicroRNAs confer robustness to gene expressionand have a significant impact on 30UTR evolution. Cell, 123,1133–1146.
36. Farh,K.K., Grimson,A., Jan,C., Lewis,B.P., Johnston,W.K.,Lim,L.P., Burge,C.B. and Bartel,D.P. (2005) The widespreadimpact of mammalian MicroRNAs on mRNA repression andevolution. Science, 310, 1817–1821.
37. Sood,P., Krek,A., Zavolan,M., Macino,G. and Rajewsky,N.(2006) Cell-type-specific signatures of microRNAs on targetmRNA expression. Proc. Natl Acad. Sci. USA, 103, 2746–2751.
38. Tsang,J., Zhu,J. and van Oudenaarden,A. (2007)MicroRNA-mediated feedback and feedforward loops arerecurrent network motifs in mammals. Mol. Cell, 26, 753–767.
39. Shkumatava,A., Stark,A., Sive,H. and Bartel,D.P. (2009)Coherent but overlapping expression of microRNAs and theirtargets during vertebrate development. Genes Dev., 23, 466–481.
40. Mishima,Y., Abreu-Goodger,C., Staton,A.A., Stahlhut,C.,Shou,C., Cheng,C., Gerstein,M., Enright,A.J. and Giraldez,A.J.(2009) Zebrafish miR-1 and miR-133 shape muscle geneexpression and regulate sarcomeric actin organization. Genes Dev.,23, 619–632.
41. Lagos-Quintana,M., Rauhut,R., Yalcin,A., Meyer,J.,Lendeckel,W. and Tuschl,T. (2002) Identification of tissue-specificmicroRNAs from mouse. Curr. Biol., 12, 735–739.
42. Nelson,P.T., Baldwin,D.A., Kloosterman,W.P., Kauppinen,S.,Plasterk,R.H. and Mourelatos,Z. (2006) RAKE and LNA-ISHreveal microRNA expression and localization in archival humanbrain. RNA, 12, 187–191.
43. Miska,E.A., Alvarez-Saavedra,E., Townsend,M., Yoshii,A.,Sestan,N., Rakic,P., Constantine-Paton,M. and Horvitz,H.R.(2004) Microarray analysis of microRNA expression in thedeveloping mammalian brain. Genome Biol., 5, R68.
44. Sempere,L.F., Freemantle,S., Pitha-Rowe,I., Moss,E.,Dmitrovsky,E. and Ambros,V. (2004) Expression profiling ofmammalian microRNAs uncovers a subset of brain-expressedmicroRNAs with possible roles in murine and human neuronaldifferentiation. Genome Biol., 5, R13.
45. Deo,M., Yu,J.Y., Chung,K.H., Tippens,M. and Turner,D.L.(2006) Detection of mammalian microRNA expression by in situhybridization with RNA oligonucleotides. Dev. Dyn., 235,2538–2548.
46. Wienholds,E., Kloosterman,W.P., Miska,E., Alvarez-Saavedra,E.,Berezikov,E., de Bruijn,E., Horvitz,H.R., Kauppinen,S. andPlasterk,R.H. (2005) MicroRNA expression in zebrafishembryonic development. Science, 309, 310–311.
47. Aboobaker,A.A., Tomancak,P., Patel,N., Rubin,G.M. andLai,E.C. (2005) Drosophila microRNAs exhibit diverse spatialexpression patterns during embryonic development. Proc. NatlAcad. Sci. USA, 102, 18017–18022.
48. Krichevsky,A.M., Sonntag,K.C., Isacson,O. and Kosik,K.S.(2006) Specific microRNAs modulate embryonic stem cell-derivedneurogenesis. Stem Cells, 24, 857–864.
49. Makeyev,E.V., Zhang,J., Carrasco,M.A. and Maniatis,T. (2007)The MicroRNA miR-124 promotes neuronal differentiation by
12 Nucleic Acids Research, 2010
at Rockefeller U
niversity Library on June 2, 2010 http://nar.oxfordjournals.org
Dow
nloaded from
triggering brain-specific alternative pre-mRNA splicing. Mol. Cell,27, 435–448.
50. Cao,X., Pfaff,S.L. and Gage,F.H. (2007) A functional study ofmiR-124 in the developing neural tube. Genes Dev., 21, 531–536.
51. Visvanathan,J., Lee,S., Lee,B., Lee,J.W. and Lee,S.K. (2007) ThemicroRNA miR-124 antagonizes the anti-neural REST/SCP1pathway during embryonic CNS development. Genes Dev., 21,744–749.
52. Cheng,L.C., Pastrana,E., Tavazoie,M. and Doetsch,F. (2009)miR-124 regulates adult neurogenesis in the subventricular zonestem cell niche. Nat. Neurosci., 12, 399–408.
53. Brenner,S. (1974) The genetics of Caenorhabditis elegans.Genetics, 77, 71–94.
54. Hobert,O. (2002) PCR fusion-based approach to create reportergene constructs for expression analysis in transgenic C. elegans.Biotechniques, 32, 728–730.
55. Mello,C. and Fire,A. (1995) DNA transformation. Methods CellBiol., 48, 451–482.
56. Bacaj,T., Tevlin,M., Lu,Y. and Shaham,S. (2008) Glia areessential for sensory organ function in C. elegans. Science, 322,744–747.
57. Fox,R.M., Von Stetina,S.E., Barlow,S.J., Shaffer,C.,Olszewski,K.L., Moore,J.H., Dupuy,D., Vidal,M. andMiller,D.M. III (2005) A gene expression fingerprint of C. elegansembryonic motor neurons. BMC Genomics, 6, 42.
58. Christensen,M., Estevez,A., Yin,X., Fox,R., Morrison,R.,McDonnell,M., Gleason,C., Miller,D.M. III and Strange,K.(2002) A primary culture system for functional analysis ofC. elegans neurons and muscle cells. Neuron, 33, 503–514.
59. Chen,C., Ridzon,D.A., Broomer,A.J., Zhou,Z., Lee,D.H.,Nguyen,J.T., Barbisin,M., Xu,N.L., Mahuvakar,V.R.,Andersen,M.R. et al. (2005) Real-time quantification ofmicroRNAs by stem-loop RT-PCR. Nucleic Acids Res., 33, e179.
60. Das,P.P., Bagijn,M.P., Goldstein,L.D., Woolford,J.R.,Lehrbach,N.J., Sapetschnig,A., Buhecha,H.R., Gilchrist,M.J.,Howe,K.L., Stark,R. et al. (2008) Piwi and piRNAs act upstreamof an endogenous siRNA pathway to suppress Tc3 transposonmobility in the Caenorhabditis elegans germline. Mol. Cell, 31,79–90.
61. Team,R.D.C. (2009) R: A Language and Environment forStatistical Computing. R Foundation for Statistical Computing,Vienna, Austria.
62. Gentleman,R., Carey,V., Huber,W., Irizarry,R.A. and Dudoit,S.(2005) Bioinformatics and Computational Biology Solutions UsingR and Bioconductor. Springer, New York.
63. Irizarry,R.A., Bolstad,B.M., Collin,F., Cope,L.M., Hobbs,B. andSpeed,T.P. (2003) Summaries of Affymetrix GeneChip probe leveldata. Nucleic Acids Res., 31, e15.
64. Smyth,G.K. (2004) Linear models and empirical bayes methodsfor assessing differential expression in microarray experiments.Stat. Appl. Genet. Mol. Biol., 3, Article 3.
65. Ritchie,M.E., Diyagama,D., Neilson,J., van Laar,R., Dobrovic,A.,Holloway,A. and Smyth,G.K. (2006) Empirical array qualityweights in the analysis of microarray data. BMC Bioinformatics,7, 261.
66. Kent,W.J., Sugnet,C.W., Furey,T.S., Roskin,K.M., Pringle,T.H.,Zahler,A.M. and Haussler,D. (2002) The human genome browserat UCSC. Genome Res., 12, 996–1006.
67. Karolchik,D., Kuhn,R.M., Baertsch,R., Barber,G.P., Clawson,H.,Diekhans,M., Giardine,B., Harte,R.A., Hinrichs,A.S., Hsu,F.et al. (2008) The UCSC Genome Browser Database: 2008 update.Nucleic Acids Res., 36, D773–D779.
68. Pruitt,K.D., Tatusova,T. and Maglott,D.R. (2005) NCBIReference Sequence (RefSeq): a curated non-redundant sequencedatabase of genomes, transcripts and proteins. Nucleic Acids Res.,33, D501–D504.
69. van Dongen,S., Abreu-Goodger,C. and Enright,A.J. (2008)Detecting microRNA binding and siRNA off-target effects fromexpression data. Nat. Methods, 5, 1023–1025.
70. Ashburner,M., Ball,C.A., Blake,J.A., Botstein,D., Butler,H.,Cherry,J.M., Davis,A.P., Dolinski,K., Dwight,S.S., Eppig,J.T.et al. (2000) Gene ontology: tool for the unification of biology.The Gene Ontology Consortium. Nat. Genet., 25, 25–29.
71. Lim,L.P., Lau,N.C., Weinstein,E.G., Abdelhakim,A., Yekta,S.,Rhoades,M.W., Burge,C.B. and Bartel,D.P. (2003) ThemicroRNAs of Caenorhabditis elegans. Genes Dev., 17, 991–1008.
72. Palakodeti,D., Smielewska,M. and Graveley,B.R. (2006)MicroRNAs from the Planarian Schmidtea mediterranea: a modelsystem for stem cell biology. RNA, 12, 1640–1649.
73. Aravin,A.A., Lagos-Quintana,M., Yalcin,A., Zavolan,M.,Marks,D., Snyder,B., Gaasterland,T., Meyer,J. and Tuschl,T.(2003) The small RNA profile during Drosophila melanogasterdevelopment. Dev. Cell, 5, 337–350.
74. Chen,P.Y., Manninga,H., Slanchev,K., Chien,M., Russo,J.J.,Ju,J., Sheridan,R., John,B., Marks,D.S., Gaidatzis,D. et al. (2005)The developmental miRNA profiles of zebrafish as determined bysmall RNA cloning. Genes Dev., 19, 1288–1293.
75. Batista,P.J., Ruby,J.G., Claycomb,J.M., Chiang,R., Fahlgren,N.,Kasschau,K.D., Chaves,D.A., Gu,W., Vasale,J.J., Duan,S. et al.(2008) PRG-1 and 21U-RNAs interact to form the piRNAcomplex required for fertility in C. elegans. Mol. Cell, 31, 67–78.
76. Colbert,H.A., Smith,T.L. and Bargmann,C.I. (1997) OSM-9, anovel protein with structural similarity to channels, is required forolfaction, mechanosensation, and olfactory adaptation inCaenorhabditis elegans. J. Neurosci., 17, 8259–8269.
77. Miska,E.A., Alvarez-Saavedra,E., Abbott,A.L., Lau,N.C.,Hellman,A.B., McGonagle,S.M., Bartel,D.P., Ambros,V.R. andHorvitz,H.R. (2007) Most Caenorhabditis elegans microRNAsare individually not essential for development or viability.PLoS Genet., 3, e215.
78. Blacque,O.E., Perens,E.A., Boroevich,K.A., Inglis,P.N., Li,C.,Warner,A., Khattra,J., Holt,R.A., Ou,G., Mah,A.K. et al. (2005)Functional genomics of the cilium, a sensory organelle.Curr. Biol., 15, 935–941.
79. Colosimo,M.E., Brown,A., Mukhopadhyay,S., Gabel,C.,Lanjuin,A.E., Samuel,A.D. and Sengupta,P. (2004) Identification ofthermosensory and olfactory neuron-specific genes via expressionprofiling of single neuron types. Curr. Biol., 14, 2245–2251.
80. Kunitomo,H., Uesugi,H., Kohara,Y. and Iino,Y. (2005)Identification of ciliated sensory neuron-expressed genes inCaenorhabditis elegans using targeted pull-down of poly(A) tails.Genome Biol., 6, R17.
81. Grimson,A., Farh,K.K., Johnston,W.K., Garrett-Engele,P.,Lim,L.P. and Bartel,D.P. (2007) MicroRNA targeting specificityin mammals: determinants beyond seed pairing. Mol. Cell, 27,91–105.
82. Bartel,D.P. (2009) MicroRNAs: target recognition and regulatoryfunctions. Cell, 136, 215–233.
83. Rajasethupathy,P., Fiumara,F., Sheridan,R., Betel,D.,Puthanveettil,S.V., Russo,J.J., Sander,C., Tuschl,T. and Kandel,E.(2009) Characterization of small RNAs in aplysia reveals a rolefor miR-124 in constraining synaptic plasticity through CREB.Neuron, 63, 803–817.
84. Kohn,R.E., Duerr,J.S., McManus,J.R., Duke,A., Rakow,T.L.,Maruyama,H., Moulder,G., Maruyama,I.N., Barstead,R.J. andRand,J.B. (2000) Expression of multiple UNC-13 proteins in theCaenorhabditis elegans nervous system. Mol. Biol. Cell, 11,3441–3452.
85. Li,X., Cassidy,J.J., Reinke,C.A., Fischboeck,S. and Carthew,R.W.(2009) A microRNA imparts robustness against environmentalfluctuation during development. Cell, 137, 273–282.
86. Dunn,C.W., Hejnol,A., Matus,D.Q., Pang,K., Browne,W.E.,Smith,S.A., Seaver,E., Rouse,G.W., Obst,M., Edgecombe,G.D.et al. (2008) Broad phylogenomic sampling improves resolution ofthe animal tree of life. Nature, 452, 745–749.
87. Hunt-Newbury,R., Viveiros,R., Johnsen,R., Mah,A., Anastas,D.,Fang,L., Halfnight,E., Lee,D., Lin,J., Lorch,A. et al. (2007)High-throughput in vivo analysis of gene expression inCaenorhabditis elegans. PLoS Biol., 5, e237.
88. McKay,S.J., Johnsen,R., Khattra,J., Asano,J., Baillie,D.L.,Chan,S., Dube,N., Fang,L., Goszczynski,B., Ha,E. et al. (2004)Gene expression profiling of cells, tissues and developmentalstages of the nematode C. elegans. Cold Spring Harb. Symp.Quant. Biol., 68, 159–169.
89. Totong,R., Achilleos,A. and Nance,J. (2007) PAR-6 is requiredfor junction formation but not apicobasal polarization in C.elegans embryonic epithelial cells. Development, 134, 1259–1268.
Nucleic Acids Research, 2010 13
at Rockefeller U
niversity Library on June 2, 2010 http://nar.oxfordjournals.org
Dow
nloaded from
90. Munro,E., Nance,J. and Priess,J.R. (2004) Cortical flows poweredby asymmetrical contraction transport PAR proteins to establishand maintain anterior-posterior polarity in the early C. elegansembryo. Dev. Cell, 7, 413–424.
91. Cuenca,A.A., Schetter,A., Aceto,D., Kemphues,K. andSeydoux,G. (2003) Polarization of the C. elegans zygoteproceeds via distinct establishment and maintenance phases.Development, 130, 1255–1265.
92. Nance,J. and Priess,J.R. (2002) Cell polarity and gastrulation inC. elegans. Development, 129, 387–397.
93. Reece-Hoyes,J.S., Shingles,J., Dupuy,D., Grove,C.A.,Walhout,A.J., Vidal,M. and Hope,I.A. (2007) Insight intotranscription factor gene duplication from Caenorhabditiselegans Promoterome-driven expression patterns. BMCGenomics, 8, 27.
94. Gobel,V., Barrett,P.L., Hall,D.H. and Fleming,J.T. (2004)Lumen morphogenesis in C. elegans requires themembrane-cytoskeleton linker erm-1. Dev. Cell, 6, 865–873.
95. Van Furden,D., Johnson,K., Segbert,C. and Bossinger,O. (2004)The C. elegans ezrin-radixin-moesin protein ERM-1 is necessaryfor apical junction remodelling and tubulogenesis in theintestine. Dev. Biol., 272, 262–276.
96. Rogalski,T.M., Mullen,G.P., Gilbert,M.M., Williams,B.D. andMoerman,D.G. (2000) The UNC-112 gene in Caenorhabditiselegans encodes a novel component of cell-matrix adhesionstructures required for integrin localization in the muscle cellmembrane. J. Cell Biol., 150, 253–264.
97. Hikita,T., Qadota,H., Tsuboi,D., Taya,S., Moerman,D.G. andKaibuchi,K. (2005) Identification of a novel Cdc42 GEF that islocalized to the PAT-3-mediated adhesive structure. Biochem.Biophys. Res. Commun., 335, 139–145.
98. Greer,E.R., Perez,C.L., Van Gilst,M.R., Lee,B.H. and Ashrafi,K.(2008) Neural and molecular dissection of a C. elegans sensorycircuit that regulates fat and feeding. Cell Metab., 8, 118–131.
99. Maryon,E.B., Saari,B. and Anderson,P. (1998) Muscle-specificfunctions of ryanodine receptor channels in Caenorhabditiselegans. J. Cell Sci., 111 (Pt 19), 2885–2895.
100. Sakube,Y., Ando,H. and Kagawa,H. (1997) An abnormalketamine response in mutants defective in the ryanodine receptorgene ryr-1 (unc-68) of Caenorhabditis elegans. J. Mol. Biol., 267,849–864.
101. Hamada,T., Sakube,Y., Ahnn,J., Kim,D.H. and Kagawa,H.(2002) Molecular dissection, tissue localization and Ca2+binding of the ryanodine receptor of Caenorhabditis elegans.J. Mol. Biol., 324, 123–135.
102. Tijsterman,M., May,R.C., Simmer,F., Okihara,K.L. andPlasterk,R.H. (2004) Genes required for systemic RNAinterference in Caenorhabditis elegans. Curr. Biol., 14, 111–116.
103. Jia,K., Chen,D. and Riddle,D.L. (2004) The TOR pathwayinteracts with the insulin signaling pathway to regulate C.elegans larval development, metabolism and life span.Development, 131, 3897–3906.
104. Li,Y., Kelly,W.G., Logsdon,J.M. Jr, Schurko,A.M., Harfe,B.D.,Hill-Harfe,K.L. and Kahn,R.A. (2004) Functional genomicanalysis of the ADP-ribosylation factor family of GTPases:phylogeny among diverse eukaryotes and function in C. elegans.FASEB J., 18, 1834–1850.
105. Franks,D.M., Izumikawa,T., Kitagawa,H., Sugahara,K. andOkkema,P.G. (2006) C. elegans pharyngeal morphogenesisrequires both de novo synthesis of pyrimidines andsynthesis of heparan sulfate proteoglycans. Dev. Biol., 296,409–420.
14 Nucleic Acids Research, 2010
at Rockefeller U
niversity Library on June 2, 2010 http://nar.oxfordjournals.org
Dow
nloaded from