the michael price student investment fundpages.stern.nyu.edu/~sternfin/mpsif/docs/reports/semi...the...
TRANSCRIPT

The Michael Price Student Investment Fund
The Leonard N. Stern School of Business – New York University
Semi‐Annual Report
28 February, 2009
Student Investment FundThe Michael Price


NYU Stern’s Michael Price Student Investment Fund
A Family of Funds Managed by
NYU Stern School of Business MBA Students
What is the Michael Price Student Investment Fund?
With nearly $1.4 million currently under management, the Michael Price Student
Investment Fund (“MPSIF” or “the Funds”) is a family of funds managed directly by NYU
Stern MBA students. The Funds, part of the overall NYU endowment, were established in
1999 through a generous gift from Michael Price, Managing Partner, MFP Investors, LLC
and former Chairman of Franklin Mutual Series Funds.
What is unique about MPSIF?
The Michael Price Student Investment Fund provides Stern MBA students with hands on
experience managing real Funds with significant assets. In addition, the Funds are required
to pay an annual 5% dividend to the University Of Oklahoma Price School Of Business, Mr.
Price’s undergraduate alma mater. This dividend pays students’ tuition so they can attend
summer classes at Stern. Additionally, MPSIF maintains between two and three times the
membership relative to other student investment funds at our peer institutions.
What is the portfolio composition?
For diversification purposes, MPSIF is divided into three equity Funds ‐ Growth, Value and
Small Cap ‐ and one Fixed Income Fund. While each sub‐Fund has its own performance
benchmark (Russell 1000 Growth Index, Russell 1000 Value Index, Russell 2000 and the
Vanguard Total Bond Index, respectively), MPSIF’s primary goal is to deliver overall
positive returns.
What role do Stern MBA students play in managing the Funds?
Students must go through a competitive process to become a portfolio manager or analyst
with the Funds, which is the basis of Stern’s “Managing Investment Funds” course. Stern
MBAs must apply to this course, and demand has always exceeded available spots. About
45 students enroll each year and are then responsible for all Fund activities—screening and
evaluating stocks, preparing and presenting pitches for buy and sell recommendations and
strategizing on broader portfolio issues as they relate to sectors allocation. For the Fixed
Income Fund the primary role of analysts is to make tactical allocation recommendations
and decisions based on market outlook and economic analyses among various product
sectors.

Executive Committee – Spring 2009 President Helvecio Borges Guimaraes
Co‐Portfolio Manager, Fixed Income Fund Nilesh Mandhare
Co‐Portfolio Manager, Fixed Income Fund Lester Lie
Portfolio Manager, Growth Fund Steve Katchur
Co‐Portfolio Manager, Small Cap Fund Aditi Chandarana
Co‐Portfolio Manager, Small Cap Fund Joseph Longobardi
Co‐Portfolio Manager, Value Fund Benjamin Canet
Co‐Portfolio Manager, Value Fund Joon Kim
Faculty Advisor Professor Richard Levich
Executive Committee – Fall 2008 President Michael Glickstein
COO Cindy Chan
Treasurer Joshua Michaels
Co‐Portfolio Manager, Fixed Income Fund Christopher Bolton
Co‐Portfolio Manager, Fixed Income Fund Luiz Caselli
Co‐Portfolio Manager, Growth Fund Derek Apfel
Co‐Portfolio Manager, Growth Fund David Paz
Co‐Portfolio Manager, Small Cap Fund Jaspal Singh
Co‐Portfolio Manager, Small Cap Fund Jorge Trujillo
Co‐Portfolio Manager, Value Fund Ward Jones
Co‐Portfolio Manager, Value Fund Amy Klug
Faculty Advisor Professor Richard Levich
Internal Leadership – Spring 2009 Vice President, Business Development Annamalai Veerapan
Vice President, External Affairs Ameet Parbhu Salgaonker
Vice President, Economic Strategy Carlos Amaya
Vice President, Portfolio Analytics Nilesh Mandhare
Vice President, Sector Strategy Arjun Mehra
Vice President, Political Strategy Marina Rokhman
Vice President, Annual Report Diego Parra
Management Advisory Council Nomi Ghez, Co‐founder of Circle Financial Group, retired Partner and Managing Director, Goldman Sachs
Randall Haase, Portfolio Manager, Baron Fifth Avenue Growth Fund
Christopher Long, Director of the North American Financing Desk, Tudor Investment Corporation
Ray Pullaro, Managing Director, Blackstone Alternative Asset Management
Board of Advisors Dean Thomas Cooley, Stern School of Business, New York University
Duane R. Stock, Professor of Finance, Price College of Business, University of Oklahoma
Michael F. Price, Benefactor
Paul Affuso, Associate Dean, Stern School of Business
Martin Gruber, Professor of Finance, Stern School of Business
Richard Levich, Professor of Finance, Stern School of Business
Arthur Zeikel, Adjunct Professor of Finance, Stern School of Business
Resource Faculty Aswath Damodaran, Professor of Finance, Stern School of Business
Martin Gruber, Professor of Finance, Stern School of Business
Edward Kerschner, Adjunct Professor of Finance, Stern School of Business
Fred Renwick, Emeritus Professor of Finance, Stern School of Business
Matthew Richardson, Professor of Finance, Stern School of Business

LETTER FROM THE FACULTY ADVISOR ........................................................................5 LETTER FROM THE PRESIDENT ......................................................................................6 THE MICHAEL PRICE STUDENT INVESTMENT FUND ....................................................7
REVIEW OF OPERATIONS....................................................................................... 7 ASSETS UNDER MANAGEMENT AND CUMULATIVE DISTRIBUTIONS ...................... 8 BENCHMARK INDEX DESCRIPTION ...................................................................... 11 VALUATION, STYLE AND CAPITALIZATION ......................................................... 11 ASSET ALLOCATION............................................................................................ 13 FUND TURNOVER ................................................................................................ 14 MACROECONOMIC AND MARKET REVIEW .......................................................... 15
THE GROWTH FUND ....................................................................................................17 MESSAGE FROM THE PORTFOLIO MANAGER ....................................................... 17 DISCUSSION OF PERFORMANCE ........................................................................... 18 ASSET ALLOCATION............................................................................................ 20 HOLDINGS PROFILE............................................................................................. 21 INVESTMENT STYLE AND STRATEGY................................................................... 22
THE SMALL CAP FUND ................................................................................................23 MESSAGE FROM THE PORTFOLIO MANAGERS ..................................................... 23 DISCUSSION OF PERFORMANCE ........................................................................... 24 ASSET ALLOCATION............................................................................................ 25 HOLDINGS PROFILE............................................................................................. 26 INVESTMENT STYLE AND STRATEGY................................................................... 27
THE VALUE FUND........................................................................................................28 MESSAGE FROM THE PORTFOLIO MANAGERS...................................................... 28 DISCUSSION OF PERFORMANCE ........................................................................... 29 ASSET ALLOCATION............................................................................................ 29 HOLDINGS PROFILE............................................................................................. 32 INVESTMENT STYLE AND STRATEGY................................................................... 33
THE FIXED INCOME FUND ...........................................................................................34 MESSAGE FROM THE PORTFOLIO MANAGERS...................................................... 34 DISCUSSION OF PERFORMANCE ........................................................................... 35 ASSET ALLOCATION............................................................................................ 37 HOLDINGS PROFILE............................................................................................. 37 INVESTMENT STYLE & STRATEGY ...................................................................... 38 SECTOR REVIEW & OUTLOOK ............................................................................. 39
THE FUND MANAGEMENT ...........................................................................................41 THE EXECUTIVE COMMITTEE.............................................................................. 41 THE GROWTH FUND ............................................................................................ 42 THE SMALL CAP FUND........................................................................................ 44 THE VALUE FUND ............................................................................................... 46 THE FIXED INCOME FUND ................................................................................... 48
FINANCIAL STATEMENTS .............................................................................................49
TABLE OF CONTENTS


The Michael Price Student Investment Fund
5
LETTER FROM THE FACULTY ADVISOR
On behalf of the students who participate in the
Michael Price Student Investment Fund, I am
pleased to introduce the semi‐annual report for
the six‐month period ending February 28, 2009.
This was a turbulent period for stock markets in
the United States and around the world, and
hence a difficult period for investment managers.
Real economic activity continued its downward
slide putting further pressure on banks and other
financial institutions. While policymakers have
responded, in many cases on a scope and scale not
seen in decades, the imbalances facing certain
sectors (e.g. housing) and industries (e.g.
automobiles) continue to hold a firm grip, creating
considerable uncertainty for large parts of the
global economy. With financial capital in tight
supply and consumer sentiment and demand still
drifting down, nearly all market segments have
been impacted.
Against this backdrop, MPSIF has performed well
relative to our benchmarks, but like most equity
funds with a long‐only mandate, our absolute
performance has suffered. Over the six‐month
period, MPSIF lost 22.1% compared to a loss of
34.3% in our benchmark. This outperformance is
bitter‐sweet as our assets under management now
stand at only $1.36 million, the lowest figure in
our nine‐year history. All of our equity funds beat
their benchmarks by substantial double digit
amounts, aided in large part by unusually high
cash balances. Our fixed income fund was the lone
underperformer as corporate and sovereign
holdings lost ground relative to the safe haven of
U.S. Treasuries.
Despite the harsh economic climate, overall
interest in MPSIF remains high. Applications for
MPSIF in the spring semester were twice the
available slots. Our student’s stock analysis and
market commentary have become regular features
in Opportunity, the Stern student newspaper. In
the last few months, both the New York Times and
the Financial Times ran feature stories on MPSIF
emphasizing our collective decision making
process and outperformance relative to the
market.
Without question, this has been a difficult year.
However, markets as well as our students, are
always forward looking. Spring is a natural time
for optimism and reawakening and some
economists have begun talking about “green
shoots.” Our students have been given a unique
opportunity to see how they themselves, as well as
markets, managers and policymakers, react as the
crisis evolves. Our goal is to have both MPSIF
students and our funds well‐positioned for the
economic recovery.
Richard M. Levich
Professor of Finance
Deputy Chairman, Department of Finance
March 24, 2009

The Michael Price Student Investment Fund
6
LETTER FROM THE PRESIDENT
As tumbling stock markets and dire economic
outlooks continued to prevail, we at the Michael
Price Student Investment Fund worked hard to
identify great investment opportunities in the
middle of such a blood bath. The frustration from
seeing investment ideas being accepted and lately
floundering as stock prices kept nose‐diving has
made us as MPSIF analysts conscious about
defensive investment strategies and the power of
discussion and thorough analysis.
The work initiated last semester to enforce stop‐
loss measures has been followed by a careful
approach to putting cash to work. MPSIF analysts
have learned that with volatility levels seen only
in major recessions, good investments must not
only be sound but also provide for adequate
returns vis‐à‐vis those volatility levels. To support
our stock‐picking and analytical exercise, the
sector strategy, political and economic outlook
groups did a superb job in shedding light on the
best paths moving forward.
The result, while far from the desirable returns we
all worked for, has not been bad. MPSIF in the
past 6 months beat its blended benchmark and
overall generated a relative return, net of fees, of
12.6%. This shows the commitment to the class as
a real world learning experience and the talent
and dedication of our group.
This semester we focused on getting in‐house
advice on how to better thrive in the current
economic conditions. MPSIF’s Management
Advisory Council members Chris Long, Nomi
Ghez, Randall Haase and Ray Pullaro came to
NYU Stern to share their views on recent market
moves, both in equities and fixed income. Also, to
get insights from an experienced endowment
manager, we were pleased to host Ms. Linda
Strumpf, who has been the Chief Investment
Officer for the Ford Foundation since 1992,
overseeing $11 billion.
In order to move MPSIF forward, we kept our
work on developing the fund and studying new
opportunities. Researching other student
investment funds around the country, we were
able to understand possible avenues for growth
and which best practices we can approach in order
to increase assets under management. We also
promoted the strength of the MPSIF network
through organizing our fourth alumni reunion,
which happened in the beginning of April and
attracted more than 40 participants.
There is no doubt MPSIF analysts are likely going
through the most difficult times their investment
careers have seen so far. While this will not be the
only and last crisis we’ll go through, it is likely to
be one of major lessons and unique investment
experiences. From this point of view, our return
on investment is certainly positive.
Helvecio Borges Guimaraes
MPSIF President
April 5, 2009

The Michael Price Student Investment Fund
7
THE MICHAEL PRICE STUDENT INVESTMENT FUND
Review of Operations
Four autonomous sub‐funds form the Michael Price
Student Investment Fund: the Fixed Income Fund,
the Growth Fund, the Small Cap Fund and the Value
Fund. While diligent, thorough analyses and
disciplined investment and diversification strategies
are at the heart of all four funds, portfolio managers
act independently.
In the 6 months ending February 28, 2009, we kept
working on achieving the milestones the preceding
Executive Committee set for the fund:
The equity funds adopted the stock pitch
feedback form revised in the previous
semester, allowing analysts to get more
candid feedback on stock updates and
pitches
The transition process to the Fidelity
account continues and is expected to be
completed by the end of the current
semester
Stop‐loss procedures have been revised in
the wake of massive volatility in equity
markets
Analysts have been engaged in timely
updates via email once news breaks and
markets react
Internal and external public relations
continue to develop
Some of the actions taken towards that continuous
improvement include:
We have continued to stress the importance of
discussions and feedback among analysts to identify
great investment opportunities and enhance the
learning experience of the group. Analysts have
been encouraged to explore the circumstances of any
investment idea and vote based on fundamentals
and perspectives, not market behaviors.
Our move from Merrill Lynch to Fidelity continues
and we expect to complete the process by the end of
the semester. We have worked continuously on the
move to obtain all the necessary clearances from
NYU officials.
After hosting conversations with several legendary
investment managers last semester, we are looking
inwards this semester for closer advice on our
investment practices and analytical approaches in
the middle of a downward market. Members of our
Management Advisory Council visited us and
shared important views on our holdings and the
market moving forward. Also, close to our
endowment structure, we were pleased to host Ms.
Linda Strumpf, Chief Investment Officer at the Ford
Foundation.
We kept the practice of using sector, economic and
political teams to provide detailed reviews of
current market behaviors and give guidance on
likely opportunities in the near future. Special
attention was given to the Federal economic
stimulus package by then recently approved.
The practice of ‘live’ updates, usually happening via
email, has continued and been of great benefit.
Analysts engage in email discussions once profit‐
taking or loss‐stopping circumstances appear, with
decisions taken rapidly on the best course to follow.
Similar procedures are followed once a change in
fundamentals occur and undermines the investment
thesis. This update practice is now engrained.
Significant events in the life of stock holdings are
closely monitored and communicated.
Our internal and external relations groups have
continued to develop and give visibility to the fund
and its practices. In January the Financial Times
published an article about MPSIF and some of the
strategies followed to avoid the market downfalls.
This semester, MPSIF is scheduled to appear in a
FOX Business program, also helping leverage our

The Michael Price Student Investment Fund
8
brand. We have continued to work closely with the
Stern Opportunity, NYU Stern’s MBA students’
newspaper, to publish analysts’ views on industry
sectors, the economy and particular stocks. Finally,
with the support from Stern Development and
Alumni Affairs, we have been able to strengthen our
network and connect to past MPSIF alumni at our
Alumni reunion meeting.
Assets Under Management and
Cumulative Distributions
The Funds were initially endowed with $1.8 million
as we began operations on Mach 1, 2000. As of
February 28, 2009, our assets under management
stood at $1.36 million. Total distributions to the
Michael Price School at the University of Oklahoma
over the nine years are now nearly $757,000.
$0
$500
$1,000
$1,500
$2,000
$2,500
Feb 00 Feb 01 Feb 02 Feb 03 Feb 04 Feb 05 Feb 06 Feb 07 Feb 08 Feb 09
Assets Under Management
Cumulative Distributions

The Michael Price Student Investment Fund
9
Michael Price Total Fund vs. Blended Benchmark
18.4%
‐40%
‐20%
0%
20%
40%
60%
80%
Feb‐00 Feb‐01 Feb‐02 Feb‐03 Feb‐04 Feb‐05 Feb‐06 Feb‐07 Feb‐08 Feb‐09
MPSIF Total Fund Blended Benchmark
‐12.1%

The Michael Price Student Investment Fund
10
For the half‐year period ending February 28, 2009
The Michael Price Student Investment Fund lost
22.18% net of fees. This half‐year period has proven
to be the most challenging operating environment
for MPSIF since the Fund’s inception in March 2000.
The deepening financial crisis over the summer of
2008 led to the failure of Lehman Brothers, among
numerous other financial institutions, as well as the
conservatorship of Fannie May, Freddie Mac, and
AIG. The crisis in the financial stocks led to a
broader economic recession that sparked the deepest
bear market since the 1930s.
While operating in an extremely difficult market
environment, MPSIF managed to outperform the
blended benchmark index, which was down 34.29%,
by over 1200 basis points during the six‐month
period ending February 28, 2009. The Value fund,
which outperformed its benchmark by 17.26%, was
the top‐performing segment, followed by the
Growth and Small Cap funds, which had net out‐
performances of 14.42% and 13.59% over their
respective benchmarks. The Fixed Income fund,
which lost 2.23% over the period, was the only fund
to underperform finishing 4.29% below the
Vanguard Total Bond Fund’s returns.
Since inception, MPSIF has earned a cumulative, net
annual return of 1.36%, outpacing the blended
benchmark by 2.78%.

The Michael Price Student Investment Fund
11
Benchmark Index Description
The purpose of benchmarking is to track the Funds’
performance relative to the index that most closely
resembles the investment mandate of each portfolio.
It is important to note that while the Funds are
measured against the market, our more critical and
overarching goal is to provide an absolute rate of
return that exceeds our annual distribution mandate
to the University of Oklahoma plus the rate of
inflation in a given year. Therefore, although we
consider the aforementioned indices our benchmark,
we are also keenly focused on risk management in
the construction of each sub‐Fund.
Each of the four sub‐Funds, Fixed Income, Growth,
Small Cap, and Value, are benchmarked to a leading
index in order to measure relative performance. The
benchmarks are as follows:
Fixed Income: Vanguard Total Return Bond
Index Fund
Growth: Russell 1000 Growth Index
Small Cap: Russell 2000 Index
Value: Russell 1000 Value Index
Vanguard Total Return Bond Index Fund measures
the performance of fixed income securities. The
benchmark has the following characteristics:
Invests in U.S. Treasury, investment‐grade
corporate, mortgage‐backed, and asset‐
backed securities
Seeks to track the performance of the
Lehman Brothers Aggregate Bond Index
Broadly diversified exposure to investment‐
grade U.S. bond market
Passively managed using index sampling
Intermediate‐duration portfolio
Provides moderate current income with
high credit quality
The Russell 1000® Growth Index measures the
performance of those Russell 1000 companies with
higher price‐to‐book ratios and higher forecasted
growth values.
The Russell 2000® Index measures the performance
of the 2,000 smallest companies in the Russell 3000
Index, representing approximately 10% of the total
market capitalization of the Russell 3000 Index.
The Russell 1000® Value Index measures the
performance of those Russell 1000 companies with
lower price‐to‐book ratios and lower forecasted
growth values.

The Michael Price Student Investment Fund
12
Valuation, Style and Capitalization
The matrix below shows the relative positions of the
MPSIF strategies and their benchmarks for both
style and average market capitalization. Our stock
selection process is based upon security
fundamentals and the stated strategy for each
portfolio, thus there are no hard restrictions
regarding what a particular fund may own. The
smaller average market cap of our value and growth
strategies is indicative of our total return approach.
Source: Wilshire Analytics
*The Quantum Growth/Value Style Score is created from a weighted average of a
standardized book/price and forward looking earnings/price (standardized against the Dow
Jones Wilshire U.S. 2500 Index, 75% book/price and 25% forward earnings/price).
Source: Wilshire Analytics
P/E ROE P/BV Div. Yield
MPSIF Growth 15.2 14.7% 3.1 1.7%
Russell 1000 Growth 11.7 33.2% 2.2 2.2%
Relative 1.3x 0.4x 1.4x 0.8x
MPSIF Value 12.7 29.1% 2.6 2.5%
Russell 1000 Value 16.7 16.0% 1.0 2.2%
Relative 0.8x 1.8x 2.5x 1.1x
MPSIF Small Cap 11.4 19.7% 1.6 1.8%
Russell 2000 10.8 17.4% 1.0 4.3%
Relative 1.1x 1.1x 1.6x 0.4x
Equity Valuation Characteristics

The Michael Price Student Investment Fund
13
Asset Allocation
Much of the strength behind MPSIF’s performance
rested in our cash allocations and sector selection
throughout this difficult market period. During the
months of September, October, and November
MPSIF held cash of 34%, 44%, and 39%, which were
historically high levels of cash reserves for the Fund.
The investment discipline that the Fund showed in
the fall is a major reason for MPSIF’s market
outperformance. September, October, and
November saw swift declines in the S&P 500 of ‐9%,
‐12%, and ‐6% for a cumulative three‐month loss of
over 30%. Because of MPSIF’s large cash reserve,
the fund only lost 17.9% over this three‐month span.
The Michael Price Student Investment Fund has not
only shown discipline in its cash allocation during
the 2008 year, but has also displayed astute sector
selection. As of August 2008 MPSIF had zero
exposure to the financial services industry. While no
industry was spared during the market crash of
September and October of 2008, our lack of exposure
to financials cushioned the impact of the market
crash to our portfolio. As of February 2009 the Fund
has crept back into financials as global governments
have instituted financial and legislative policies to
bailout the financial services industry. MPSIF’s
financial allocation (approximately 6% of
investments), however, remains cautiously below
our benchmark’s financial sector allocation of over
17%. From August 2008 to February 2009 we shifted
MPSIF’s allocation heavily into the Information
Technology and Consumer Staples sectors, which
have outperformed the overall market by 13% and
16% respectively over the last twelve months.

The Michael Price Student Investment Fund
14
Fund Turnover
The Growth Fund and Small Cap Fund have been the most active in turning throughout their portfolios
throughout the last year, followed by the Value Fund and the Fixed Income Fund.

The Michael Price Student Investment Fund
15
Macroeconomic and Market Review
The script for the financial markets during
September 2008 through February 2009 could not
have been imagined by the most sadistic Hollywood
screenwriter. The Dow Jones, S&P 500 and Nasdaq
collapsed dramatically, posting losses of 39%, 42%
and 41%, respectively, during the period. September
started ominously with the federal takeover of
beleaguered government agencies Fannie Mae and
Freddie Mac. A week later, Merrill Lynch was sold
to Bank of America, and in the worst calamity of the
financial crisis, Lehman Brothers filed for the largest
bankruptcy in US history. By the end of the month,
AIG had received $85 billion in government aid
amidst fears of insolvency related to risky
derivatives. Concluding September, the month’s
bloodbath culminated with the FDIC‐inspired sale of
Washington Mutual to J.P. Morgan and the
proposed acquisition of Wachovia by Citigroup
(though Wachovia was ultimately taken over by
Wells Fargo after an acquisition battle).
In March 2008, Treasury Secretary Henry Paulson
expressed “great confidence in our financial
market.” By November the tone had dramatically
changed. Investors witnessed a painful deleveraging
of the private sector which was facilitated through
an equally magnificent leveraging of the US
Government. While the details of the bailout remain
fluid to this day, hundreds of billions of dollars were
doled out to the most prestigious institutions in the
form of asset guarantees and capital infusions. This
resulted in Goldman Sachs and Morgan Stanley
transforming to bank holding companies along with
a partial nationalization of Citigroup.
A collapse in the real economy matched the collapse
in the markets. In the third and fourth quarter of the
year, GDP collapsed (‐0.5% and ‐6.2%, respectively)
as private consumption plummeted (‐3.8% and
‐4.3%, respectively). Consumers had finally given up
on severe wealth shocks (equities and homes prices)
and tighter credit conditions. By early March
analysts were predicting a severe economic
contraction with GDP falling more than 3% in the
first and second quarter improving to more modest
growth declines in H2 2009 due to the impact of the
massive fiscal stimulus.
The collapse of financial markets and institutions
and the real economy during this period was met
with unprecedented government action. On the
monetary policy side, the Federal Reserve
dramatically increased its balance sheet helping
capitalize financial institutions and providing much
needed liquidity to the economy. In December, the
FOMC cut the Fed funds rate to 0‐0.25% and
engaged in aggressive quantitative easing. Specific
focus was given to the housing industry so that the
securitized mortgage investments that are weighing
on the entire industry may get a backstop in prices.
Over half a billion dollars have been committed to
the purchase of Fannie and Freddie paper with the
intention of bringing long‐term mortgage rates
down to around 4.50%, therefore making the
housing market attractive again. With the supply of
houses in the market looming at above average
levels, prices continue to fall as the buyers remain on
the sidelines.
On the fiscal policy side, the Treasury, in
coordination with the Fed and the FDIC, intervened
strongly for financial institutions in order to prevent
collapse. By late September, the first financial rescue
plans were drafted. After intense discussion, in
February President Obama signed the American
Recovery and Reinvestment Act of 2009. This
controversial $787 billion “stimulus bill” offers a
combination of tax breaks and federal spending
initiatives with a primary goal of creating and
saving a total of 3.5 million American jobs. Nearly
$282 billion of the bill is dedicated to individual and
business tax cuts. On the spending side, some of the
many widespread initiatives include $112 billion in
energy and infrastructure upgrades, $71.2 billion in
labor, health services and education, $57.3 billion in
unemployment benefits and $25.1 billion in health
insurance assistance. The effectiveness of the bill
will depend on how fast the spending initiatives can
be executed and to what extent tax cuts will be
saved.

The Michael Price Student Investment Fund
16
Looking ahead, the investment environment
continues to remain unclear. In our view, the
macroeconomic fundamentals will remain weak and
will not support a recovery by the middle of 2009.
Fiscal policy will play a key a role in smoothing the
economic cycle, particularly in the second half of
2009 and throughout 2010.
The U.S. economy also suffers from severe weakness
of its primary trading partners. The Eurozone and
U.K. fell into recession in the middle of 2008 and are
not expected to post positive growth until early
2010. The U.K. has been more proactive with its
policy response, with the Bank of England slashing
rates to record lows, essentially nationalizing major
financial institutions, and recently agreeing to
purchase non‐performing assets. The Eurozone has
been slower to cut interest rates and many Western
European countries’ banks are at risk from default
from loans to Eastern Europe. Japan’s economic
output has plunged due to a dramatic drop‐off in
demand for Japanese exports. Japan’s GDP growth
tumbled more than ‐12% annualized in Q4 2008 and
is poised to drop over ‐10% in the current quarter.
Signs of a recovery in the near term look bleak.
Emerging markets are struggling as decoupling has
proved to be too good to be true. There has been a
sharp slowdown in China and India due to very
weak export demand from developed markets.
Governments in both countries have launched large
stimulus measures, focusing on infrastructure and
assistance to rural workers.
The rest of Emerging Asia will remain soft in
response to weak export demand from the U.S.,
Europe and Japan. Emerging European economies at
or near recession in 2009 experienced plunging
currencies and weak commodity prices due to weak
export demand from Eurozone. Further, Latvia and
Ukraine have required IMF bailouts due to large
exposure foreign currency loans combined with
deep currency depreciation. Latin America is also
suffering from weak U.S. demand for exports.
Commodities need to recover to get growth back on
track.
It is in this challenging economic environment that
MPSIF operates, endeavoring to select prudent
investments which will maximize long‐term value.

The Growth Fund
17
THE GROWTH FUND
Message from the Portfolio Manager
For the six‐month period ending February 28, 2009,
our fund generated gross returns of ‐25.25%, easily
our worst six‐month return since inception. The
benchmark Russell Growth 1000 Index returned
‐39.89% for the same period. Our 1,464 basis points
of outperformance gives us no satisfaction. We are
unhappy with this performance and have taken bold
steps toward improving our stock selection process
and have developed a strategy for the deployment
of cash.
Because we have a mandate for growth stocks, we
are not as concerned with perceived value as we are
with realistic projections for top‐line expansion into
the future. We recognize that sell‐side analysts have
yet to revise their 2009 valuations for many
companies. To neutralize these stale expectations,
we entered conservative assumptions into our
models. Our goal is to be well positioned to take
advantage of economic growth by building
moderate positions in attractive sectors that can be
added to as investment catalysts come to fruition.
A large percentage of our assets are held in cash.
This is no accident. Our investment team has held
little enthusiasm for the near‐term prospects of even
our favorite names. That said, we have built small
positions in companies we expect to emerge first
from this recession. Moreover, we are unconvinced
that bottom‐up research alone works well in this
market. We have chosen a blended approach of
identifying promising sectors, (including healthcare
and consumer discretionary) and implemented a
bottom‐up process for selecting names in these
areas.
In light of the continued and unrelenting market
turmoil, I recognize my responsibility to be prudent
with our holdings and chose to enforce our stop‐loss
policy throughout the spring semester. Ideally, this
capital preservation measure will help prevent
outsized losses resulting from churning markets.
Our policy has been to set stop prices at levels that
take into consideration the increased volatility that
even the most staid of names have experienced.
Once a position has reached this price, the covering
analyst updates our investment team with the next
steps in our relationship with the company. In some
cases, we found that even appealing investment
theses have quickly turned downbeat. We then
move the company to our watch list and step back
from the investment. The rationale here is to
separate our passion for great stories from the
irrational nature of this bear cycle. We tracked the
performance of 21 positions that we exited during
the previous six months and found, with few
exceptions, extreme losses, including three with
50%‐plus downside moves from where we sold
them. We are proud of the discipline we used in this
area.
Looking ahead, I believe this challenging economic
period will have shaped the way we operate as
investors for the remainder of our lives. When the
dust finally settles on the current recession, I am
confident each member of this team will have added
a more developed method of critical thinking to
their analytical arsenal.
Stephen G. Katchur
Portfolio Manager, Growth Fund
The Growth Fund
18
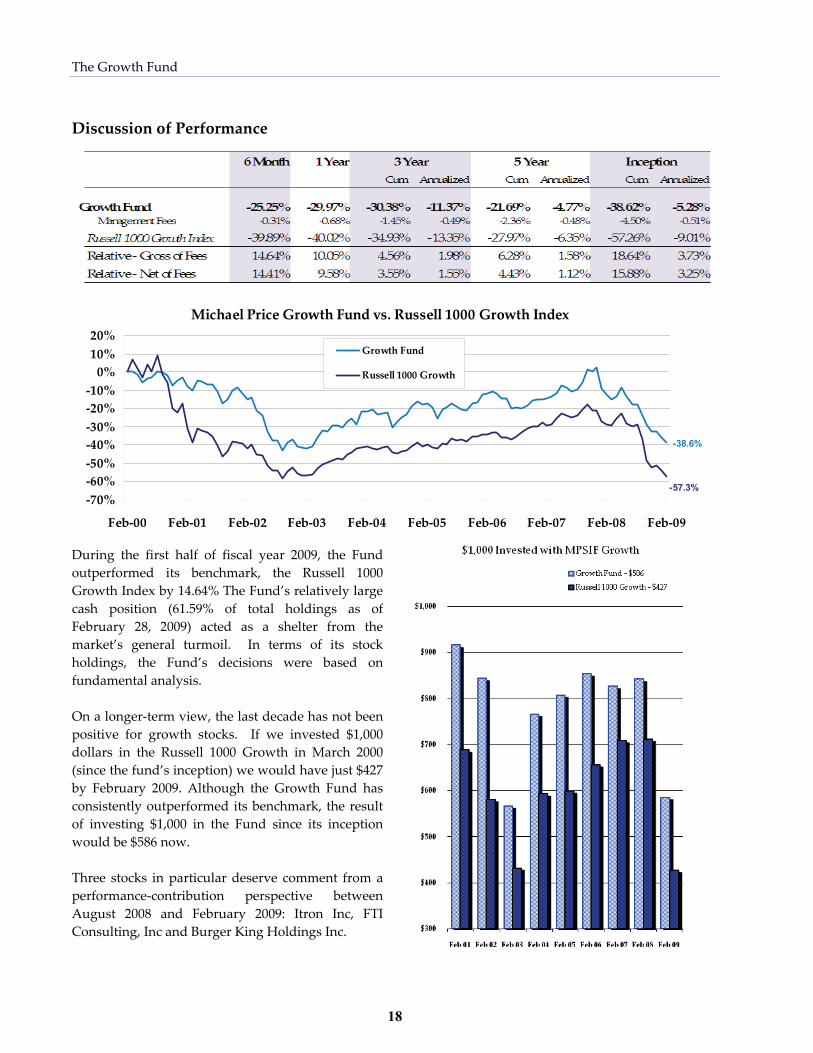
Discussion of Performance
Michael Price Growth Fund vs. Russell 1000 Growth Index
-38.6%
-57.3%
‐70%
‐60%
‐50%
‐40%
‐30%
‐20%
‐10%
0%
10%
20%
Feb‐00 Feb‐01 Feb‐02 Feb‐03 Feb‐04 Feb‐05 Feb‐06 Feb‐07 Feb‐08 Feb‐09
Growth Fund
Russell 1000 Growth
During the first half of fiscal year 2009, the Fund
outperformed its benchmark, the Russell 1000
Growth Index by 14.64% The Fund’s relatively large
cash position (61.59% of total holdings as of
February 28, 2009) acted as a shelter from the
market’s general turmoil. In terms of its stock
holdings, the Fund’s decisions were based on
fundamental analysis.
On a longer‐term view, the last decade has not been
positive for growth stocks. If we invested $1,000
dollars in the Russell 1000 Growth in March 2000
(since the fund’s inception) we would have just $427
by February 2009. Although the Growth Fund has
consistently outperformed its benchmark, the result
of investing $1,000 in the Fund since its inception
would be $586 now.
Three stocks in particular deserve comment from a
performance‐contribution perspective between
August 2008 and February 2009: Itron Inc, FTI
Consulting, Inc and Burger King Holdings Inc.

The Growth Fund
19
Itron (ITRI), a company that provides products and
services to utilities for the energy and water markets
worldwide gained 41.94% during our holding
period and realized a gain of $5,992 for the Fund.
Itron significantly outperformed other shares in the
technology sector and was a significant contributor
to the overall’s fund performance.
Research in Motion (RIMM), a company that
designs, manufactures and markets wireless
solutions for the mobile communications markets
worldwide, including Blackberry Smartphones,
gained 14.66% during our holding period and
realized a gain of $2,884 for the Fund.
Shares in Burger King (BKC) had a return of 4.50%
and realized a gain of $362 for the Fund. BKC
significantly outperformed the rest of the Restaurant
industry and was a positive contributor to the fund’s
comparative performance.
It is important to point out that during the last fall
we set a Stop Loss Policy based on analysis of
intraday volatility and technical support levels, in
order to cover breaks. The policy was refined in the
spring to cover the entire semester. We recognized
that extreme volatility across our portfolio made it
important to protect ourselves from any rapid sell‐
off beyond a pre‐determined price. According to
this policy, the decisions to sell many names
prevented a large capital loss estimated at nearly
$27,000. During the spring we also actively decided
that we did not want to rush into buying companies
that had not revised 2009 estimates for fear of
revisions or downgrades.
On the other hand, some holdings were very
disappointing. For example, based on the strength
of the commodity markets through much of the
second half of fiscal 2008, we held Cia Vale Rio Doce
(RIO), a diverse Brazilian mining company.
However, the stock did not rise commensurately
with commodity prices and then fell sharply after
the commodities peak in July 2008. The Fund
decided to keep the position for a while and then
liquidated RIO in December 2008, at depressed
levels. For this reason, the stock was a drag in the
Fund’s performance with a negative return of
–53.71% and a monetary loss of $16,157.
FTI Consulting Inc. (SPWR.A), a business advisory
company worldwide, had a large negative return of
–44.65%, and a loss of $8,955. Similarly, Adobe
Systems (ADBE) fell –46.83% during our holding
period, and had a loss of $7,025.

The Growth Fund
20
Asset Allocation
As of February 28, 2009, the sectors with the most
significant weight in the Growth Fund are:
• Consumer discretionary: this sector’s weight
in the Growth Fund is 47.9%, a significant
overweight from the Russell 1000 Growth
(11.4%).
• Information technology: with a 25.6% in the
Growth Fund, IT is a neutral weight
compared to the Russell 1000 Growth.
• Telecomm services: has a 17.4% share in the
Growth Fund, a significant overweight from
the Russell 1000 Growth (0.7%).
This year we have focused on a blended approach of
identifying promising sectors which could prove to
be resilient amid the current recession (including
healthcare and some consumer services) and
implemented a bottom‐up process for selecting best
of breed in these areas. The bottom‐up alone could
be insufficient in the current market.
The Growth Fund
21
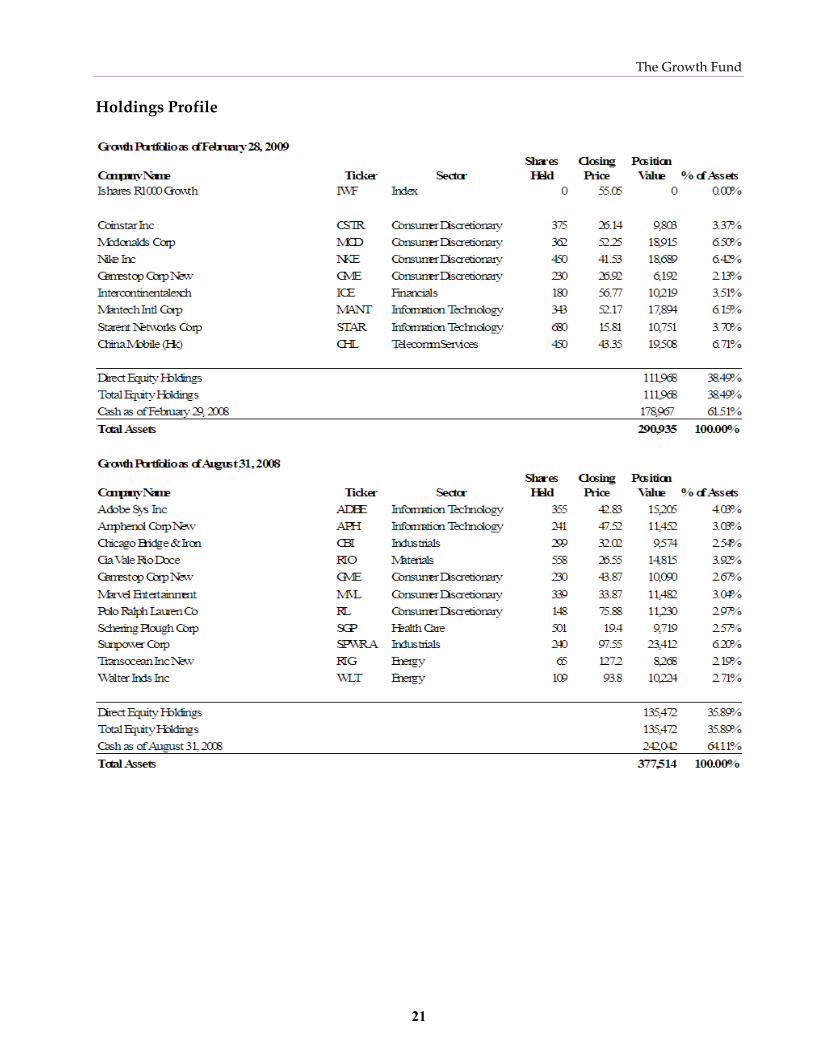
Holdings Profile

The Growth Fund
22
Investment Style and Strategy
Our goals: The goal of the Growth Fund is to
identify and capitalize on investments that have
significant growth potential. The companies we
invest in may source their growth from a unique
business model or a strong competitive position in a
rapidly growing industry. We believe that
companies with these characteristics can achieve
more than 15% annual EPS growth over the next five
years and in turn experience substantial stock price
appreciation. These growth opportunities can be
uncovered by identifying companies that are
pioneering a new product or service that will see
significant future demand. Other companies may be
altering pre‐established norms in a static industry
and gaining significant market share. Additionally,
these companies could be applying their business
model to new regions or they could simply be a
leader in an industry that is experiencing high levels
of growth. Our analysts use comparable and
intrinsic valuation techniques to determine if these
growth opportunities are available at attractive
prices.
Our objective: Outperform the benchmark on a
total return basis by investing in securities that
provide superior returns on a risk/return basis
through capital appreciation and dividends.
Investment Process: Amid the selected sectors, our
analysts look for firms with clear growth catalysts.
Then the analyst considers whether the company’s
business model will succeed. A valuation analysis
follows, which begins with balance sheet analysis as
well as revenue and earnings trends. The analyst
examines relative valuations and then finally
performs a fundamental analysis of the company.
The analyst then writes a research report and pitches
the stock to the class. The class engages in a debate
to challenge the investment rationale. After this
rigorous process, the group votes whether or not to
purchase the stock.
Sell Discipline: In 2006, the Fund added stop‐loss
orders to provide more self discipline. In 2009 we
updated the policy and began taking into
consideration the analysis of intraday volatility and
technical support levels, in order to cover breaks.
The stop‐loss price is determined by the analyst and
is related to the stock’s volatility and downside risk.
The Fund’s consensus model also helps determine
stop‐loss orders. Additionally, the stop‐loss policy
is regularly evaluated to ensure that these risk
controls stay relevant. This includes actively
reducing our exposure to a specific stock when our
investment thesis no longer sees room for upside.
Some of the factors that would change our
investment thesis are:
The issuerʹs growth rate deteriorates or its
performance otherwise disappoints.
The price of the security attains our price
target or otherwise appears relatively high to
our fundʹs analysts.
The company publishes negative earnings
announcements that could affect the long‐term
outlook and industry attractiveness.
Unfavorable changes in management.
Why Growth Stocks? Growth companies have
above average earnings growth, which we believe
will translate into above average price appreciation.
Thus, we believe investing in growing companies
that are not currently overpriced should lead to
realization of potentially superior investment
returns over the long term.

The Small Cap Fund
23
THE SMALL CAP FUND
Message From the Portfolio Managers
The break between fall and spring semesters is a
time of transition for the Small Cap Fund. This year
had the additional impact of a slowing economy and
unprecedented financial unrest. In response, this led
to a Fund‐wide decision to tighten the stop loss
orders, to better manage the risk associated with
market volatility. As the markets dipped, stop‐losses
were triggered resulting in the liquidation of two
positions in January, leaving the Fund with twenty
positions.
During February, we reassessed our holdings and
consequently sold eight positions. Additionally, we
were stopped out of three positions. As a result, we
effectively minimized our downside risk. We have
decided to continue to hold a large amount of cash
while commencing research on new positions to add
prudently as opportunities arise.
Eleven holdings from 2008 remain in our portfolio.
Some of these positions have been extremely
resilient through the past few months and are in
areas that could continue to weather the economic
slowdown. A few examples of our current positions
include Sohu.com (SOHU), which provides a range
of online services from online gaming to search
engines in the Peoples Republic of China. It is a high
growth, high margin company that is well
positioned to capture market share in a market with
significant barriers to entry and has near term
catalysts in new product offerings. EPIQ Systems
Inc. (EPIQ), a legal software services company
whose primary business segments are electronic
discovery, bankruptcy, and settlement
administration. EPIQ should benefit as the economic
turmoil will likely lead to increases in bankruptcy
and class action activity. McCormick & Company
Incorporated (MKC) is a recognized global leader in
the manufacture, marketing and distribution of
spice, flavor and other specialty food products. It is
a defensive, low beta stock which has held up well
during the ongoing economic downturn.
Though the Small Cap Fund has significantly
outperformed the benchmark, our absolute
performance has not been stellar. The volatility and
uncertainty in the financial markets over the last few
months has made this extremely challenging,
however it has also led to a greater emphasis on
thorough research and analysis. In order to improve
the performance of the Fund, we have continued to
encourage analysts to keep up to date with their
stock selections throughout the semester, by adding
additional update presentations on earnings calls
and significant events to complement the traditional
update at the beginning of the semester. We have
also revisited the stop loss prices for all the stocks in
our portfolio. In addition, we have increased
awareness of the Fund’s sector allocation through
discussions of the portfolio weightings. We hope to
improve the Fund’s diversification and performance
under all market conditions.
Managing a portfolio in this turbulent environment
has been a unique and invaluable educational
experience for us. However we believe that this
uncertainty will present significant opportunities,
from which we hope to benefit.
Aditi Chandarana and Joseph Longobardi
Portfolio Managers, Small Cap Fund

The Small Cap Fund
24
Discussion of Performance
Michael Price Small Cap Fund vs. Russell 2000 Index
35.9%
-24.4%
‐50%
0%
50%
100%
150%
200%
Feb‐00 Feb‐01 Feb‐02 Feb‐03 Feb‐04 Feb‐05 Feb‐06 Feb‐07 Feb‐08 Feb‐09
Small Cap Fund
Russell 2000
Throughout the period we have been faced with the
global economic crisis which has caused significant
volatility and overall downward pressure across the
broader market. Over the 6‐month period ending
February 28, 2009, the Small Cap Fund
outperformed the Russell 2000 by 13.76%.
The sectors which contributed the most to the six‐
month outperformance were Consumer Staples and
Information Technology. The best performing stock
in the portfolio was Epiq Systems Inc. (EPIQ), which
jumped 49.4% during the period on strong earnings
and the expectation that the financial crisis would
result in a significant increase in Chapter 11 filings
driving revenue growth. Other top performers
include ICF International Inc. (ICFI), McCormick &
Co. (MKC) and Sohu.com Inc. (SOHU) which gained
29.9%, 6.1% and 4.4% respectively.
Over the period the Russell 2000 index was down
(46.9%) as the global financial crisis has hit the small
cap sector especially hard. The Small Cap Fund re‐
evaluated the original thesis of each position and
exited several positions in advance of further
deterioration in the market. These positions include:
Regency Energy Partners LP (RGNC), Blackboard
Inc. (BBBB), Knoll Inc. (KNL), Boyd Gaming Corp.
(BYD) and Brunswick Corp (BC). While many of
these positions were sold at a loss, our proactive
approach to the changing market conditions allowed
us to avoid incremental losses. The Fund realized a
9.6% gain on the sale of half of its position in
McCormick & Co (MKC) during the period. As a
result of these sales, the Small Cap Fund has a large
cash position which we are looking to put to work to
drive improved performance.

The Small Cap Fund
25
Asset Allocation
While the Fund primarily employs a bottom‐up
approach to analyzing potential investments,
optimal sector allocations are taken into
consideration for any additions to the portfolio. In
addition, the Fund’s use of price targets and lack of
bias towards either growth or value contributes to
turnover, which in turn leads to significant changes
in sector allocation. The Fund seeks to be fully
invested as opportunities avail themselves but due
to the committee structure, the extent of equity
participation may vary significantly, especially
during the winter and summer school recess when
liquidations may occur because of stop‐losses
without the benefit of having new stock pitches to
take the original position’s place. This situation was
the case during the winter of 2008. The Fund’s small
number of holdings means that diversification is
difficult to maintain across sectors and within the
sector. For the current period, the Fund has an over‐
exposure to information technology, utilities,
consumer discretionary, healthcare, and
telecommunications but is underweight financials,
industrials, energy, materials, and consumer staples.
Below is the asset allocation at the midpoint of FY 08
and beginning of FY 09. Please note that the Fund
does not maintain mandatory guidelines regarding
asset allocation among sectors.

The Small Cap Fund
26
Holdings Profile

The Small Cap Fund
27
Investment Style and Strategy
Objectives. The objectives of the Small Cap Fund
are to achieve total returns in excess of the Russell
2000 Index and to achieve an absolute return in
accordance with the Fund’s role as a part of the
university endowment.
Style. The Small Cap Fund combines a bottom‐up
approach for security selection and portfolio
construction with consideration of the Fund’s
current sector weightings for any new additions to
the portfolio. The Fund invests primarily in
domestic equities with market capitalizations of less
than $4 billion and benchmarks its returns against
the Russell 2000 Index. The portfolio does not have a
value or growth bias or primarily utilize a top‐down
methodology. Rather, individual company analysis
is conducted in conjunction with economic and
sector outlooks provided by the MPSIF Economic
team and evaluated in the context of the consensus
economic opinion of the Fund. Various criteria may
be reviewed to determine the attractiveness of an
investment, including, but not limited to, the
company’s earnings outlook, valuation, M&A
activity, management team, and/or other specific
catalysts or events.
Strategy. The Small Cap Fund targets a relatively
concentrated portfolio comprised of 20 to 25
investments. Depending on both market and
security‐specific conditions, the turnover of the
Fund may vary. Throughout the semester, Fund
analysts provide both updates on existing positions
and pitches for new investments. With regard to
existing allocations, each semester the analyst
assigned to a particular stock provides updates to
the Small Cap Fund throughout the course of the
semester. At that time, the entire Fund votes on the
analyst’s recommended course of action. Options
include selling all or half of the position, holding the
position, or accumulating more of the position,
subject to portfolio size constraints. New pitches are
also presented to the Fund throughout the semester.
During new investment deliberations, the Fund
analyzes investment highlights and weighs them
against any potential macro or company‐specific
risks. Furthermore, the analyst and the Fund review
the expected timing of the investment as well as all
upside price targets and downside stop‐losses if
applicable. When implementing a stop‐loss order,
the Fund tries to differentiate between firm specific
negative events and a general market downturn.
When considering a new position, the Fund may
vote for a full (approximately $20,000), half, or zero
allocation or wait and watch the position until there
is a more attractive entry point. Additionally, while
there are neither specific sector guidelines nor sector
concentration limits, the Portfolio Managers
continually monitor and assess the Fund’s sector
weightings on an absolute basis and relative to the
benchmark.
Why Small Cap Stocks? Small cap stocks are
defined by the Fund as stocks that have market
capitalization of less than $4 billion. They have
proven to offer the greatest returns to investors over
time based on historical data. However, these stocks
may take longer to be recognized and valued by the
market and tend to plunge upon negative earnings
announcements.
Risk Management. As stated earlier, stop‐loss prices
are implemented during the winter and summer
breaks. Stop‐loss prices are established using
various techniques, including the stock’s trading
volatility, technical analysis, or fundamental
analysis by modeling downside scenarios. When
class is in session, all members continuously monitor
the selected stock, particularly during earnings
season. Considering the volatility of Small Cap
stocks, it is very important to take action
immediately against price movement and market
sentiment. Every position is assigned to a particular
analyst. In order to maintain continuity between
semesters, stocks assigned to outgoing analysts are
temporarily assigned to second‐semester Small Cap
analysts (over the recess periods) until new analysts
join the Fund and the stock coverage may be re‐
assigned.

The Value Fund
28
THE VALUE FUND
Message from the Portfolio Managers
For the fiscal year ending February 28, 2009, the
Value Fund (“the Fund”) marked a loss of 27.28%
(gross of fees) on an absolute basis, yet
outperformed our benchmark Russell 1000 Value
Index by 1,743 bps. While it is difficult to feel
celebratory about such a loss, we are encouraged
that we outperformed the benchmark.
The Fund began the year with a cash position of
31%. With the market in free fall and uncertainty
abounding, our main objective at the start of the
Spring semester was to quickly evaluate each of our
stock holdings and their unique risk/reward profiles
in this challenging environment. In addition to
selling some holdings usually due to their high risk
profile, we stopped out of numerous positions as
markets continued on an unrelenting decline at the
start of the New Year.
With significant cash on hand and feeling
comfortable with our current holdings, our focus
turned to locating undervalued stocks. As a group,
we first discussed certain qualities that we wanted
to focus on during these uncertain times (e.g., solid
balance sheets, positive cash flow, strong brand, top‐
notch management teams, and sustainable dividend
yields). The majority of our early acquisitions have
been defensive‐oriented names that are likely to
outperform during a prolonged recession. This may
be a common theme going forward, but there has
been an increasing interest in searching for more
cyclical stocks that have been oversold despite their
strong fundamentals. Overall, we believe there are
significant opportunities to find great values in the
current market.
On operational issues, we have decided to
implement new trading procedures and processes.
On setting the stop loss, we as a group decided to be
much more systematic on how these levels were set.
We also eliminated the ease by which an analyst
could reset these stop loss levels, limiting the
potential of taking a significant loss on a single
holding. On stock purchases, we added the option to
acquire shares in stages. This dollar cost averaging
approach could potentially reduce risk versus
making a single large purchase in a volatile market.
However, the fund may choose to take a full
position immediately if there is a near‐term catalyst
or limited near‐term risks.
Over the six‐month period through February 28,
2009, the fund earned $3,039 in dividends and $792
in interest income from our holdings. The Fund’s
cash balance ended at $150,055. Since inception, the
Value Fund has gained 32.7% (gross of fees), or 3.2%
(gross of fees) on an annualized basis.
Benjamin Canet and Joon Kim
Portfolio Managers, Value Fund

The Value Fund
29
Discussion of Performance
32.7%
‐8.7%
‐20.0%
0.0%
20.0%
40.0%
60.0%
80.0%
100.0%
120.0%
Feb‐00 Feb‐01 Feb‐02 Feb‐03 Feb‐04 Feb‐05 Feb‐06 Feb‐07 Feb‐08 Feb‐09
Value Fund
Russell 1000 Value
Michael Price Value Fund vs Russell 1000 Value
The sectors that contributed most to the six‐month
outperformance are Utilities, Technology and
Services. These sectors returned respectively ‐8.6%,
‐10.7% and ‐16.4%. The (only) gainer in the portfolio
was Fiserv, which increased by 3.01% during the six
month period. Other outperforming stocks included
Colgate Palmolive (‐2.97%), Medtronic (‐7.23%),
Exelon (‐8.59%), Exxon Mobil (‐9.53%) and Cisco
Systems (‐9.94%). Due to exits triggered by votes or
our stricter stop loss limit policy, our increasing
allocation to cash (41.48% as of 2/27/09 vs. 34.97% as
of 8/31/08) helped our Fund’s outperformance.
Obviously, we cannot be satisfied by a ‐27.28%
performance.
Over the six month period, we made some very
good and some very bad decisions. For instance: We
voted to sell General Electric on 9/22/08 for $26.62
(vs. $19.32 on 2/27/09) and purchased Fiserv on
12/8/08 and returned 3.01%. Eleven of our 13
purchase decisions outperformed our benchmark.
But we sold RIO at close to historic lows and should
have sold our historically losing Freeport position
(‐69.58%) in November and cut our losses. More
generally, taking into account the Freeport
experience as well as the falling market, we decided
to enforce a stricter stop‐loss policy.
That allowed the fund to exit 7 positions, including
Halliburton on 10/2/08 at $29.91 (vs. $16.31 on
2/27/09). These exits explain our higher allocation to
cash and now give us now more resources to invest
in attractive stocks.
Asset Allocation
Value Fund analysts take a bottom‐up approach to
stock selection. While we discuss sector weightings
relative to the Russell 1000 Value benchmark, we do

The Value Fund
30
not make active sector bets. Instead, we look at all
stocks within the range of our investment policy.
Over the last six months, especially in November
and December, we took the opportunity to increase
our exposure to consumer staples and healthcare.
We significantly decreased our exposure to Basic
Materials (from 9.26% to 1.27%) and Industrial
Goods (from 15.41% to 6.05%). We sold half of our
position in Freeport‐McMoRan Copper & Gold
(FCX) in November 2008 at prices significantly
higher than today in an effort to harvest gains and
reposition the portfolio.
On the other hand, we added names in Consumer
Staples and Healthcare, taking our relative
weighting in those sectors to 3.5x and 1.9x the
benchmark, respectively. We also added one
Utilities stock, Exelon.
These sectors are typically more resistant during
times of economic recession and we are seeking to
evaluate the relative merits on a stock‐by‐stock
basis.
The Value Fund
31

The Value Fund
32
Holdings Profile

The Value Fund
33
Investment Style and Strategy
Fund Objective: Outperform the benchmark on a
total return basis by investing in securities that
provide superior returns on a risk/return basis
through capital appreciation and dividends.
Benchmark: Russell 1000 Value Index
Fund Strategy: The Value Fund utilizes a bottom‐up
fundamental approach. Our analysts go through a
rigorous screening process to select deep value
positions. The team pursues this strategy by
investing primarily in large capitalization companies
with consistent year over year earnings that are
trading at a discount relative to their peer group. We
estimate the value of our securities primarily
through an intrinsic value methodology.
Additionally, we examine each security’s valuation
relative to its peer group. For the purposes of this
analysis we utilize many of the following metrics:
price‐to‐earnings, price‐to‐book, dividend yield, and
various free‐cash‐flow ratios. There is, however, no
specific country or region quota. Analysts discuss
the Fund’s overall sector allocation compared to our
benchmark to monitor our exposure, though we do
not make actual sector bets. The Fund seeks absolute
returns in order to fulfill our distribution
requirements and monitors our performance against
the Russell 1000 Value index.
Why Value Stocks? Value stocks are stocks that
tend to be out of favor. A value stock is one that is
underpriced by the market for reasons that may
have nothing to do with the business itself. They are
undervalued relative to their comparables on
various metrics used to value comparable
companies. Stocks that are undervalued on metrics
compared to the index may not be Value stocks
because sectors trade differently. Historical trading
multiples are often a good indicator of whether a
sector has a favorable perception.
Number of Holdings: An objective of 30 positions,
3.3% of assets under management per new position.
Cash: The goal of the Fund is to be invested in the
best value opportunities in the marketplace. To the
extent we have uninvested cash, we will search for
opportunities to employ that capital that fits our
strategy. We do not have a maximum cash balance
and only utilize ETFs to reduce our cash exposure
on a short‐term basis. These ETFs are focused in
sectors that we are underweight and are sold off
when investment ideas are added to the portfolio.

The Fixed Income Fund
34
THE FIXED INCOME FUND
Message from the Portfolio Managers
In the current unsettling times, a sensible allocation
plan can help preserve capital and drive returns.
We continue to see volatility in the fixed income
markets primarily due to the turmoil outsized only
by the Great Depression. Strong evidence of
impending economic weakness, both domestically
and abroad, and a freeze in credit liquidity amongst
financial institutions have resulted in widening
credit spreads as the market continually re‐prices
risk. In response, the Federal Reserve Board, in
concert with other developed countries’ central
banks, has implemented a variety of responses to
cope with the crisis ‐ the impact of which remain to
be seen. While the fund anticipated and was able to
profit from some of these developments, other
factors detracted from the fund’s profitability in the
most recent period.
During the period from 8/29/08 through 2/27/09, the
fund maintained an overweight position in the front
end of the treasury yield curve in anticipation of
further steepening as a result of the Fed’s continued
attempts to stimulate the economy and relieve
tension in the overnight lending markets. While the
spread between 2 and 10‐year treasury notes, a
reflection of the steepness of the curve, was volatile,
we believe our positioning remains appropriate
given our outlook. More recently, our positioning in
the 1‐3 year duration has allowed us to take
advantage of the latest round of yield curve
steepening implemented by the Fed and other
central banks, ultimately benefiting the fund’s
returns. We believe going forward investors will
continue to find favor in the front end of the yield
curve due to rising inflation expectations due to
drastic rate cuts by the Fed.
Most recently, credit market volatility caused us to
liquidate our position in our investment grade
corporate bonds at a loss. We originated this
investment to take advantage of widening spreads
in high‐quality securities with strong fundamentals
that had been unfairly beaten down by market
turmoil.
Going forward we believe the crisis in the credit and
financial markets will continue to cause developed
economies to operate well below potential for some
time. Further, we believe select emerging economies
will continue to experience partial decoupling with
respect to growth though as they struggle to
credibly battle inflation in their respective
economies. However, in the short run, most
emerging markets are impacted adversely either due
to sentiments or exposure to global credit markets.
Taking this into consideration, we reduced our
emerging markets exposure by 1/3. In addition we
have increased our position in a Global Bond Fund,
to protect against the falling U.S. dollar and to hedge
against potential increase in U.S. inflation and
inflation expectations.
Regarding fund structure, we remain at 10 active
members with sector specific coverage
responsibilities, although have added commodities
sector coverage primarily to supplement our views
on global inflation, currencies, and trade balances.
Lester Lie and Nilesh Mandhare
Portfolio Managers, Fixed Income Fund

The Fixed Income Fund
35
Discussion of Performance
Over the past 6 and 12 months, the Fund has
earned ‐1.98% and ‐1.45% returns, respectively.
These numbers indicate a decline in the relative
return over the most recent 6‐month period as
compared to the full 12‐month period. During the
most recent 6‐month period, the Fund fell 4.04%
short of the benchmark Vanguard Total Bond
Fund. For the full 12 months timeframe, the fund
return was 3.41% below the benchmark.
$1,000 Invested with MPSIF Fixed Income
$600
$700
$800
$900
$1,000
$1,100
$1,200
$1,300
$1,400
Feb 03 Feb 04 Feb 05 Feb 06 Feb 07 Feb 08 Feb 09
Fixed Income Fund - $1,281
Vanguard Total Bond Fund - $1,375
During the past 6 months, we have made two
changes in the portfolio. We eliminated our
position in the corporate bond fund and replaced
it with an inflation protected treasury security
(TIPS). This movement was to reduce our
exposure to the highly volatile corporate bond
markets and take advantage of a long‐term high
inflation outlook. At these very low prices, TIPS
look attractive.
In October 2008 we adjusted our treasury yield
curve exposure to reduce our exposure to
anticipated reduction in long‐term yields and take
advantage of an anticipated increase in yield in the
middle of the curve. To implement this, we cut
our entire position in the iShares Lehman 20+ Year
Treasury Bond Fund. At the same time, due to
our outlook on inflation and attractiveness of
price,, we entered into a TIPS position by buying
iShares Trust Barclays Treasury Inflation Bond
Fund. In addition, we reduced our exposure to
the highly volatile and inflated corporate bond
fund by selling our position in iShares GS $ Invest
Grade Corp Bond Fund. These positional changes
have been driven by our continued investment
approach in which we take a top‐down macro
view of the economy and position the fund to
benefit from anticipated developments. Factors
driving our positional changes in the most recent
period have included an anticipated recession,
rising inflation expectations, and continued credit
scarcity amongst financial and non‐financial
corporate names. We believe the interest rate cuts
by the FED will ultimately raise inflation
expectations, impacting the yield curve in middle
durations.

The Fixed Income Fund
36
Michael Price Fixed Income Fund vs. Vanguard Total Bond Index
37.5%
31.4%
0%
5%
10%
15%
20%
25%
30%
35%
40%
45%
Feb‐02 Feb‐03 Feb‐04 Feb‐05 Feb‐06 Feb‐07 Feb‐08 Feb‐09
Vanguard Total Bond Index
Fixed Income Fund
The Fixed Income Fund
37
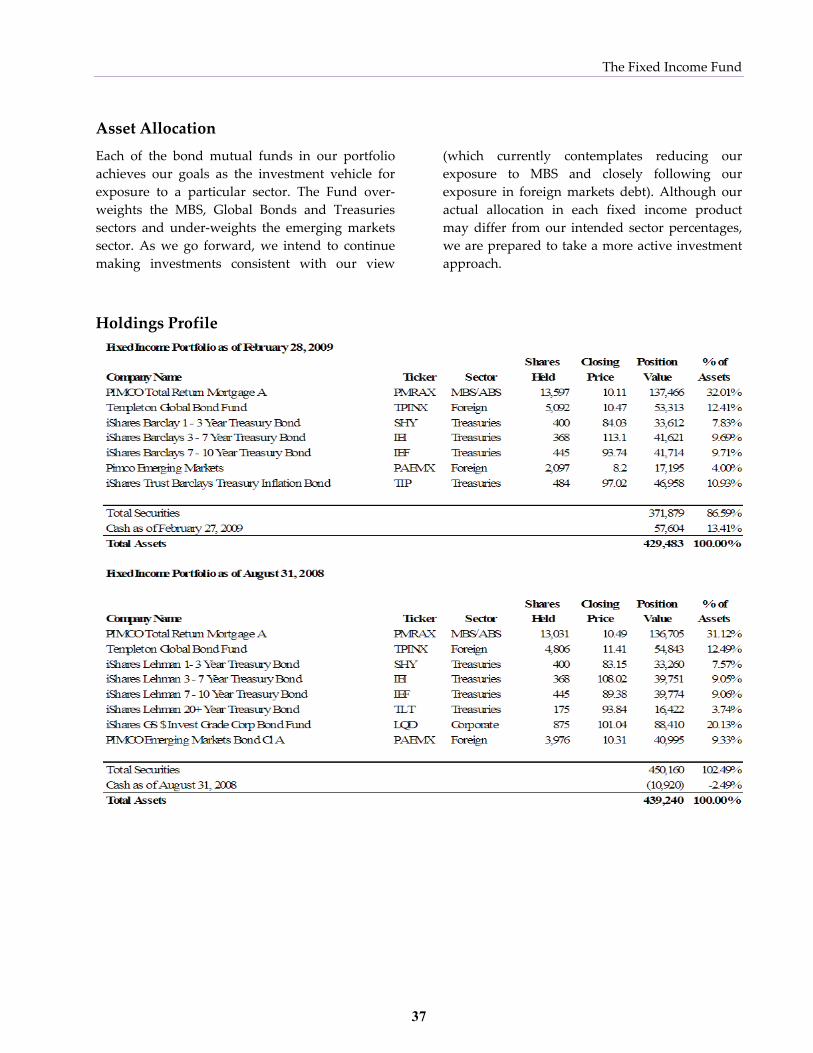
Asset Allocation
Each of the bond mutual funds in our portfolio
achieves our goals as the investment vehicle for
exposure to a particular sector. The Fund over‐
weights the MBS, Global Bonds and Treasuries
sectors and under‐weights the emerging markets
sector. As we go forward, we intend to continue
making investments consistent with our view
(which currently contemplates reducing our
exposure to MBS and closely following our
exposure in foreign markets debt). Although our
actual allocation in each fixed income product
may differ from our intended sector percentages,
we are prepared to take a more active investment
approach.
Holdings Profile

The Fixed Income Fund
38
Investment Style & Strategy
The Fund seeks to outperform its benchmark, the
Vanguard Total Bond Fund (VBMFX). The Fund
implements its views through a top‐down
allocation approach to the three main sub‐sectors of
the US Fixed Income investment grade market,
namely – US Treasuries, Corporate bonds,
Mortgage‐backed/Asset‐backed securities and
Foreign investment grade bonds (Emerging
Markets and Developed Markets). Due to its tax‐
exempt status, the fund does not invest in any
Municipal bonds. Also, the Fund does not engage
in shorting, derivatives trading, or other non‐linear
investment strategies. Currently, the Fund does not
buy individual securities, due to the limited size of
our trades and market spreads associated with
buying individual securities. Instead the Fund
invests in other publicly traded funds to implement
its sector allocation. However, given the current
market opportunities, we are working on a strategy
to incorporate individual securities which provide
superior returns with limited risk.
Due to Fund’s inability to take positions in specific
bond issues (limited dollar resources, the need to
maintain a diversified fixed income portfolio and
the limitations of our trading account), we use the
Vanguard Total Bond Fund as our benchmark, as
opposed to the more widely used Lehman Brothers
Aggregate Bond Index. Instead, we make sector
allocation decisions and invest through established
mutual fund management fees, and thus
benchmark to an index whose performance is also
adversely impacted by mutual fund management
fees. We feel it most appropriate to benchmark to
the bond mutual fund index with the least tracking
error to the Lehman Aggregate Bond Index, and
thus chose the Vanguard Fund. Going forward,
when the Fund gains the capability to choose
individual bond issues, a shift of our benchmark
will be considered.

The Fixed Income Fund
39
Sector Review & Outlook
US Treasuries: As we had anticipated, the Federal
Open Market Committee cut the Federal Funds
target rate in an effort to spur lending and aid
banks in rebuilding their balance sheets. At
historically low Federal Funds Target Rates, we
are now worried about inflation in the longer
term. This is consistent with our portfolio
positioning where we are reducing our exposure
to long term treasuries.
Near zero yields in the shortest tenor (1‐12 month)
of the yield curve make it clear that upside
potential for treasuries in this range is limited. In
contrast, we believe that Treasuries in the 1‐3 year
tenor on the curve still provides a short term yield
that will continue to attract increasingly risk
averse investors seeking generate some returns by
rolling down the curve.
We believe the market’s 3‐5 year inflation
expectations, as evidenced by the yield differential
between TIPs and constant maturity treasuries
(CMTs), is unrealistically low. While a
recessionary environment certainly will restrain
inflation in the year ahead, we do not believe that
inflation will be completely absent from the
domestic economy in the five years ahead. Based
on historical inflationary averages and our
skepticism that the country is entering a long
recession, we believe TIPs are currently
undervalued and the 5‐10 year duration of the
yield curve is overvalued.
Corporate Bonds: Spreads on corporate bonds
remain at high levels, however, the spreads are seen
tightening a bit and some activity has started in the
corporate bond market. We continue to believe that
certain high quality corporate names represent an
attractive investment opportunity for investors with
credit expertise and an ability to take a position in
select names that have been unfairly beaten down
by recent market turmoil. We anticipate the
corporate default rate to continue to climb from
4.6% in December 2008. In fact, Moody’s and Stern
Professor Edward Altman predict that the default
rate will exceed 13% in 2009 uncovering
opportunities in high yield bond funds. However,
we believe the opportunity to earn close to 8% on a
high quality AAA rated corporate bond remains an
attractive investment.
Mortgage‐Backed/Asset‐Backed Securities: Similar
to our views on high quality corporate names, we
continue to believe that certain mortgage assets
represent appealing investment opportunities as
high quality assets that have been unreasonably
penalized by broad market turmoil. Further,
although mortgage rates have lowered,
unavailability of credit, stricter lending policies and
declined asset values have reduced refinancing
possibility for the foreseeable future adding to the
attractiveness of these securities. We anticipate that
as the stigma of mortgage related securities recedes,
these positions will appreciate strongly. Therefore,
we continue to hold footprint in this asset class.

The Fixed Income Fund
40
Foreign Investment Grade: The credit crisis has
caused developed countries to produce below
potential for the medium term. Moreover, we
believe that the recent dislocation in the global
financial markets is a reflection of market
capitulation and investment opportunities are
beginning to reflect this. We also believe that
organic growth in certain areas of the global
economy is sufficient to allow certain emerging
economies to maintain higher growth rates, albeit at
a slower pace than the recent past.
We believe that interest rates will remain low in
developed countries, particularly the EU and UK, in
response to policy action by these countries’ central
banks. Given the outlook of continued low interest
rates, we believe exposure to short term rates in
these areas is a continuation of our U.S. Treasury
outlook. Moreover, we believe exposure to the EU
with its Central Banks singular inflation‐targeting
mandate, will provide an added vehicle by which to
benefit from an increase in domestic inflation.
Emerging Market Credit: We believe growth in
certain emerging markets will remain moderate and
may not provide the returns we expect. Therefore,
although we hold the Pimco Emerging Market Bond
Fund, our analysts are reevaluating the position.
Having said that, we continue to believe that once
global economic recovery comes back on track,
emerging markets will provide significant
investment opportunities, therefore, we will
continue to monitor emerging countries with good
credit standing and may decide to enter this asset
class at an opportune time.

Fund Management
41
FUND MANAGEMENT
The Executive Committee
Back Row: Nilesh Mandhare, Benjamin Canet, Stephen G. Katchur, Richard M. Levich
Front Row: Joon Kim, Joseph Longobardi, Helvecio Borges Guimaraes, Lester Lie, Aditi Chandarana
Professor Richard Levich – Faculty Advisor
Helvecio Borges Guimaraes – President
Stephen G. Katchur – Portfolio Manager, Growth Fund
Aditi Chandarana – Co‐Portfolio Manager, Small Cap Fund
Joseph Longobardi – Co‐Portfolio Manager, Small Cap Fund
Benjamin Canet – Co‐Portfolio Manager, Value Fund
Joon Kim – Co‐Portfolio Manager, Value Fund
Lester Lie – Co‐Portfolio Manager, Fixed Income Fund
Nilesh Mandhare – Co‐Portfolio Manager, Fixed Income Fund
Bios for Executive Committee team members are listed under their respective Equity Fund

Fund Management
42
The Growth Fund
Back Row: Leonid Buzik, Seth Weiss, Nilesh Mandhare, Marina Rokhman, Lester Lie, Arjun Mehra
Middle Row:Kuan‐Jei Wu, Carlos Amaya, Benjamin Leblanc, Richard Tseng
Front Row: Sobby Arora, Marcela Giraldo, Elena Maximova, Roger (Liang) Zhang, Stephen Katchur
Carlos A. Amaya has a Bachelor and a Master of Arts in Economics from Universidad de los Andes in
Colombia.
Sobby Arora has a BA from Colgate University, where he majored in Computer Science and minored in
Economics. He is also a CFA Charterholder since September 2007.
Lenny Buzik has a Bachelor of Arts in Economics from NYU.
Marcela Giraldo has a Bachelor of Arts in Economics from Universidad de los Andes in Colombia and holds
a certificate in finance from the same university.
Stephen G. Katchur has a B.S. in Finance from the University of Central Florida.
Benjamin LeBlanc has B.A. degrees in Economics and Political Science from Louisiana State University.
Nilesh Mandhare has a Bachelors and Masters degrees in Computer Science and Engineering.

Fund Management
43
Elena Maximova has a Bachelor of Computer Science and minor in Mathematics from NYU.
Arjun Mehra has a BA degree in Math and Computer Science from Colgate University. He is currently an
Associate in the US Equity Research division at Bank of America ‐ Merrill Lynch.
Marina Rokhman has a bachelor of computer science from Boston University.
Richard Tseng graduated from Cornell University with a B.A. in Economics and he has completed all three
levels of the CFA program.
Seth Weiss is a graduate from the University of Michigan where he received a Bachelorʹs of Business
Administration in April of 2002.
Kuan Wu holds a Bachelor of Science in Biology from the Massachusetts Institute of Technology.
Roger (Liang) Zhang has a Bachelor of Economics from Shanghai University of Finance and Economics.
Roger (Liang) Zhang is a CFA charter holder.

Fund Management
44
The Small Cap Fund
Back Row: Ruplu Bhattacharya, Annamalai Veerappan, Jessica Gerberi, Alan Fleming, Julie Heckman, Chris Hoon Cho Middle Row: Seamus Ryan, Christopher Weng, Steven Chuang, Charles Macon
Front Row: Ameet Prabhu‐Salgaonker, Joseph Longobardi, Helvecio Borges Guimaraes, Aditi Chandarana, John Brouillard
Not pictured: Satyadeep Jain
Ruplu Bhattacharya has a BS in Electrical Engineering, a BS in Computer Science, and an MS in Electrical
Engineering all from the University of Maryland, College Park.
John Brouillard is a graduate of Colgate University where he received a Bachelor of Arts in Economics. He
is a CFA charterholder.
Aditi Chandarana has over 5 years of work experience in the financial services sector where she has worked
as both an auditor and private banker. She holds a Masters degree in Commerce and is a Chartered
Accountant (India) as well as a CPA (US).
Chris Hoon Cho has a Bachelors of Arts in Business Economics and Mathematics from Brown University. He
was previously an associate in the investment banking department of Susquehanna Financial Group.
Steven Chuang graduated in 2004 from Princeton University with a degree in Electrical Engineering. Prior to
Stern, he was working as a Municipal Bond Analyst at Susquehanna International Group. He is a CFA
charterholder.

Fund Management
45
Alan Fleming has a B.S. in Finance from the Pennsylvania State University. Alan previously worked at
PricewaterhouseCoopers, specializing in Forensic Accounting Investigations.
Jessica Gerberi will be completing her MBA at NYU Stern in 2010, specializing in Accounting and
Economics. A native Chicagoan, Jessica earned her BA from Northwestern University and has prior work
experience at OppenheimerFunds and Goldman Sachs Asset Management.
Helvecio Borges Guimaraes has a bachelor degree of chemical engineering from UNICAMP in Brazil and has
a Masters of Science in environmental engineering from KTH in Sweden.
Julie Heckman graduated from Cornell University in 2005 with a BA in English and History. Prior to Stern,
she spent three years working in sell‐side equity research at a NY‐based boutique investment bank.
Satyadeep Jain received his bachelor’s degree in management from University of Delhi. Prior to attending
Stern, Satyadeep was an Equity Research Analyst at SMC Global Securities in India where he covered Metals
and Mining stocks.
Joseph Longobardi holds a B.S. in Finance from Siena College. Prior to attending Stern, Joseph spent six
years at JPMorgan Chase most recently as an Associate in Corporate Banking.
Charles Macon has a Bachelor of Arts degree with a concentration in Architecture from Colgate University.
He worked as a Real Estate Analyst for T.A. Associates Realty before coming to Stern.
Ameet Prabhu‐Salgaonker has a Bachelors in Telecommunication Engineering from Goa University in India
and worked in Portfolio Analytics in the Investment Management division of Lehman Brothers.
Seamus Ryan graduated from Harvard University with a degree in Environmental Science, Public Policy and
Economics. Most recently, he was an analyst at Financial Engines.
Annamalai Veerappan has a bachelor degree in electrical engineering from Annamalai University in India.
He is an active investor and is the president of Optimize Alpha ‐ an investment club.
Christopher Weng graduated from Brandeis University in 2002 with a Bachelor of Arts degree in Economics
and a minor in Art History. Prior to Stern, he worked for three years in the investment consulting industry
advising ultra high‐net worth individuals.

Fund Management
46
The Value Fund
Back Row: KristinHeitmann, Matthias Rusinski, Christopher Moneypenny, Diego Parra, Tim Fisher
Middle Row: Robert Cohen, Gayathri Sundaram, Roy Carp, Stephan Reinhard
Front Row: Oliver Brassard, Benjamin Canet, Joon Kim, Pakhi Eder
Not pictured: Lorenzo Garza, Robert Sands
Oliver Brassard has a Bachelor of Arts in Mathematical Economics from Colgate University. Prior to Stern he
worked as an Economist at Prudential International Investments.
Benjamin Canet has a Bachelor degree in Economics from the Political Science Institute of Paris (“Sciences
Po”) and a Master’s in finance from ESSEC Paris. Prior to Stern, he worked for five years as an M&A analyst
and associate for Calyon Securities in New York. Over the summer, Benjamin worked at UBS Equities in the
Sales & Trading rotational program.
Roy Carp has a Bachelor degree (cum laude) in Accounting, Business and Economics from Tel Aviv
University. He worked in Equity Research and Corporate Finance Advisory for BDO, was a Lieutenant at the
Israeli army and is a CPA (Isr).
Robert Cohen has a Bachelors degree in economics from Cornell University. He previously worked as an
analyst in the equity research department at Merrill Lynch.

Fund Management
47
Pakhi Eder, CFA, was a Vice President in JPMorgan’s equity research department prior to attending Stern.
She graduated magna cum laude from Union College, majoring in Economics and Political Science.
Tim Fisher has a Bachelors of Science in English from the United States Military Academy at West Point and
has spent the last six years as an officer in the US Army.
Lorenzo Garza has a Bachelors degree from the University of Texas‐San Antonio, a Masters degree from
Syracuse, and was a Fulbright Scholar in Mexico. He has worked at Scotiabank, the Federal Reserve Board,
and Goldman Sachs.
Kristin Heitmann has an undergraduate degree from Brown University in political science and a Masterʹs
degree from the University of California ‐ Berkeley in political science. Prior to returning to school to
complete her M.B.A, Kristin worked at Viacom in Corporate Communications.
Joon Kim started a retail apparel business in 2007 after working in Equity Research for 10 years at numerous
investment firms including Lehman Brothers, Goldman Sachs, and RBC Capital Markets. Joon holds a B.S. in
Finance and International Business from the NYU Stern School of Business.
Christopher Moneypenny has a bachelors degree from Colgate University. Prior to business school he was
an investment banker at Credit Suisse.
Diego Parra has a Bachelors degree in Mechanical Engineering and in Industrial Engineering from the
Universidad de Los Andes, Colombia, and is a CFA charter holder. He has worked for the Central Bank of
Colombia and Standard & Poorʹs.
Stephan Reinhard has a Diploma in International Business from the University of Bamberg, Germany. Prior
to Stern, he worked for UBS as Portfolio Manager in Luxembourg.
Matthias Rusinski interned and currently works as a fixed income investment analyst at Promark Global
Advisors, and will continue this role after completing his MBA. Prior to Stern, he worked on trading systems
at Deutsche Bank and Merrill Lynch. Matt holds MS in Computer Science from Columbia University.
Robert Sands has a B.S. in Accounting from Bucknell University and is a CPA. He worked in public
accounting with Deloitte & Touche and in finance with Bank of America.
Gayathri Sundaram worked as a buy‐side equity research analyst, covering technology stocks, at Neuberger
Berman over the summer. Prior to attending NYU Stern, she was a software engineer at Microsoft
Corporation for four years, working on Windows Vista and XBOX products. Gayathri holds a Masters in
Chemistry and a bachelors in Computer Science from Birla Institute of Technology and Sciences in India.

Fund Management
48
The Fixed Income Fund
Back Row: Steven Chuang, Ameet Prabhu‐Salgaonker, Oliver Brassard, Roger (Liang) Zhang, Nilesh Mandhare
Front Row: Benjamin LeBlanc, Elena Maximova, Lester Lie, Richard Tseng
Bios for Fixed Income team members are listed under their respective Equity Fund

49
THE MICHAEL PRICE STUDENT INVESTMENT FUND GROWTH COMPOSITE
ANNUAL DISCLOSURE PRESENTATION
Composite Assets Annual Performance Results
Year Total Firm USD Number of Composite Composite Russell Composite
End* Assets Accounts Gross Net 1000
Growth Dispersion
2008 1,742,492 378,066 Five or fewer (9.26%) (9.75%) (6.77%) N.A.
2007 1,954,881 440,277 Five or fewer 12.44% 12.00% 17.70% N.A.
2006 1,883,262 413,191 Five or fewer (0.50%) (0.93%) 3.68% N.A.
2005 1,871,781 439,393 Five or fewer 11.25% 10.78% 12.14% N.A.
2004 1,752,150 241,295 Five or fewer 2.34% 1.77% 5.36% N.A.
2003 1,716,188 249,986 Five or fewer 13.41% 12.72% 14.08% N.A.
2002 1,619,555 232,233 Five or fewer (29.82%) (30.18%) (22.17%) N.A.
2001 1,895,782 506,110 Five or fewer (11.04%) (11.49%) (45.32%) N.A.
2000** 1,898,439 600,230 Five or fewer 0.33% 0.04% 8.96% N.A.
N.A. - Information is not statistically meaningful due to an insufficient number of portfolios in the composite for the entire year.
*The above data is shown as of Fiscal Year End at August 31.
** Results shown for the year 2000 represent partial period performance from February 29, 2000 through August 31, 2000
Growth Composite contains fully discretionary growth accounts and for comparison purposes is measured
against the Russell 1000 Growth index. The Growth Composite was created on February 28, 2009.
The Michael Price Student Investment Fund has prepared and presented this report in compliance with the
Global Investment Performance Standards (GIPS®).
The Michael Price Student Investment Fund (“MPSIF” or “the Funds”) is a family of funds managed directly
by NYU Stern MBA students. The Funds, part of the overall NYU endowment, were established in 1999
through a generous gift from Michael Price, Managing Partner, MFP Investors, LLC and former Chairman of
Franklin Mutual Series Funds. MPSIF maintains a complete list and description of composites, which is
available upon request.
Results are based on fully discretionary accounts under management, including those accounts no longer
with the firm. Past performance is not indicative of future results.
The U.S. Dollar is the currency used to express performance. Returns are presented gross and net of
management fees and include the reinvestment of all income. Net of fee performance was calculated using
actual management fees. Additional information regarding the policies for calculating and reporting returns
is available upon request.
The investment management fee schedule for the composite is 0.75%.
Carve‐outs are included in this composite and performance reflects required total segment plus cash returns.
Cash is allocated to segment performance based on an average of the percent of cash held in the non‐balanced
accounts included in this composite.

50
THE MICHAEL PRICE STUDENT INVESTMENT FUND SMALL CAP COMPOSITE
ANNUAL DISCLOSURE PRESENTATION
Composite Assets Annual Performance Results
Year Total Firm USD Number of Composite Composite Russell Composite
End* Assets Accounts Gross Net 2000 Dispersion
2008 1,742,492 427,104 Five or fewer (16.78%) (17.23%) (5.48%) N.A.
2007 1,954,881 542,253 Five or fewer 6.27% 5.69% 11.36% N.A.
2006 1,883,262 540,061 Five or fewer 13.41% 12.68% 9.36% N.A.
2005 1,871,781 505,249 Five or fewer 29.01% 28.12% 23.10% N.A.
2004 1,752,150 553,733 Five or fewer 15.61% 14.82% 11.35% N.A.
2003 1,716,188 507,563 Five or fewer 19.53% 18.71% 29.08% N.A.
2002 1,619,555 447,970 Five or fewer (1.71%) (2.29%) (15.44%) N.A.
2001 1,895,782 657,209 Five or fewer 8.73% 8.26% (11.63%) N.A.
2000** 1,898,439 636,985 Five or fewer 6.36% 6.16% (6.38%) N.A.
N.A. - Information is not statistically meaningful due to an insufficient number of portfolios in the composite for the entire year.
*The above data is shown as of Fiscal Year End at August 31.
** Results shown for the year 2000 represent partial period performance from February 29, 2000 through August 31, 2000
Small Cap Composite contains fully discretionary small cap accounts and for comparison purposes is
measured against the Russell 2000 Index. The Small Cap Composite was created on February 28, 2009.
The Michael Price Student Investment Fund has prepared and presented this report in compliance with the
Global Investment Performance Standards (GIPS®).
The Michael Price Student Investment Fund (“MPSIF” or “the Funds”) is a family of funds managed directly
by NYU Stern MBA students. The Funds, part of the overall NYU endowment, were established in 1999
through a generous gift from Michael Price, Managing Partner, MFP Investors, LLC and former Chairman of
Franklin Mutual Series Funds. MPSIF maintains a complete list and description of composites, which is
available upon request.
Results are based on fully discretionary accounts under management, including those accounts no longer
with the firm. Past performance is not indicative of future results.
The U.S. Dollar is the currency used to express performance. Returns are presented gross and net of
management fees and include the reinvestment of all income. Net of fee performance was calculated using
actual management fees. Additional information regarding the policies for calculating and reporting returns
is available upon request.
The investment management fee schedule for the composite is 0.75%.

51
THE MICHAEL PRICE STUDENT INVESTMENT FUND VALUE COMPOSITE
ANNUAL DISCLOSURE PRESENTATION
Composite Assets Annual Performance Results
Year Total Firm USD Number of Composite Composite Russell Composite
End* Assets Accounts Gross Net 1000
Value Dispersion
2008 1,742,492 498,634 Five or fewer (0.51%) (1.12%) (14.66%) N.A.
2007 1,954,881 530,739 Five or fewer 15.04% 14.30% 12.85% N.A.
2006 1,883,262 487,904 Five or fewer 10.90% 10.16% 13.96% N.A.
2005 1,871,781 465,239 Five or fewer 12.53% 11.78% 16.86% N.A.
2004 1,752,150 438,420 Five or fewer 4.38% 3.68% 17.52% N.A.
2003 1,716,188 445,939 Five or fewer 9.82% 9.05% 11.63% N.A.
2002 1,619,555 428,443 Five or fewer (13.73%) (14.25%) (13.13%) N.A.
2001 1,895,782 732,464 Five or fewer 16.90% 16.26% (1.12%) N.A.
2000** 1,898,439 661,224 Five or fewer 10.53% 10.20% 14.31% N.A.
N.A. - Information is not statistically meaningful due to an insufficient number of portfolios in the composite for the entire year.
*The above data is shown as of Fiscal Year End at August 31.
** Results shown for the year 2000 represent partial period performance from February 29, 2000 through August 31, 2000
Value Composite contains fully discretionary value accounts and for comparison purposes is measured
against the Russell 1000 Value Index. The Value Composite was created on February 28, 2009.
The Michael Price Student Investment Fund has prepared and presented this report in compliance with the
Global Investment Performance Standards (GIPS®).
The Michael Price Student Investment Fund (“MPSIF” or “the Funds”) is a family of funds managed directly
by NYU Stern MBA students. The Funds, part of the overall NYU endowment, were established in 1999
through a generous gift from Michael Price, Managing Partner, MFP Investors, LLC and former Chairman of
Franklin Mutual Series Funds. MPSIF maintains a complete list and description of composites, which is
available upon request.
Results are based on fully discretionary accounts under management, including those accounts no longer
with the firm. Past performance is not indicative of future results.
The U.S. Dollar is the currency used to express performance. Returns are presented gross and net of
management fees and include the reinvestment of all income. Net of fee performance was calculated using
actual management fees. Additional information regarding the policies for calculating and reporting returns
is available upon request.
The investment management fee schedule for the composite is 0.75%.

52
THE MICHAEL PRICE STUDENT INVESTMENT FUND FIXED INCOME COMPOSITE
ANNUAL DISCLOSURE PRESENTATION
Composite Assets Annual Performance Results
Year Total Firm USD Number of Composite Composite VBMFX Composite
End* Assets Accounts Gross Net Dispersion
2008 1,742,492 438,687 Five or fewer 5.34% 4.80% 5.79% N.A.
2007 1,954,881 441,612 Five or fewer 5.44% 5.03% 5.53% N.A.
2006 1,883,262 442,107 Five or fewer 1.19% 0.76% 1.55% N.A.
2005 1,871,781 461,900 Five or fewer 2.33% 1.97% 4.00% N.A.
2004 1,752,150 518,702 Five or fewer 6.94% 6.65% 5.93% N.A.
2003 1,716,188 512,700 Five or fewer 5.79% 5.52% 4.40% N.A.
2002** 1,619,555 510,909 Five or fewer 1.82% 1.75% 2.48% N.A.
N.A. - Information is not statistically meaningful due to an insufficient number of portfolios in the composite for the entire year.
*The above data is shown as of Fiscal Year End at August 31.
** Results shown for the year 2002 represent partial period performance from May 31, 2002 through August 31, 2002
Fixed Income Composite contains fully discretionary fixed income accounts and for comparison purposes is
measured against Vanguard Total Return Bond Index Fund. The Fixed Income Composite was created on
February 28, 2009.
The Michael Price Student Investment Fund has prepared and presented this report in compliance with the
Global Investment Performance Standards (GIPS®).
The Michael Price Student Investment Fund (“MPSIF” or “the Funds”) is a family of funds managed directly
by NYU Stern MBA students. The Funds, part of the overall NYU endowment, were established in 1999
through a generous gift from Michael Price, Managing Partner, MFP Investors, LLC and former Chairman of
Franklin Mutual Series Funds. MPSIF maintains a complete list and description of composites, which is
available upon request.
Results are based on fully discretionary accounts under management, including those accounts no longer
with the firm. Past performance is not indicative of future results.
The U.S. Dollar is the currency used to express performance. Returns are presented gross and net of
management fees and include the reinvestment of all income. Net of fee performance was calculated using
actual management fees. Additional information regarding the policies for calculating and reporting returns
is available upon request.
The investment management fee schedule for the composite is 0.75%.
Carve‐outs are included in this composite and performance reflects required total segment plus cash returns.
Cash is allocated to segment performance based on an average of the percent of cash held in the non‐balanced
accounts included in this composite.
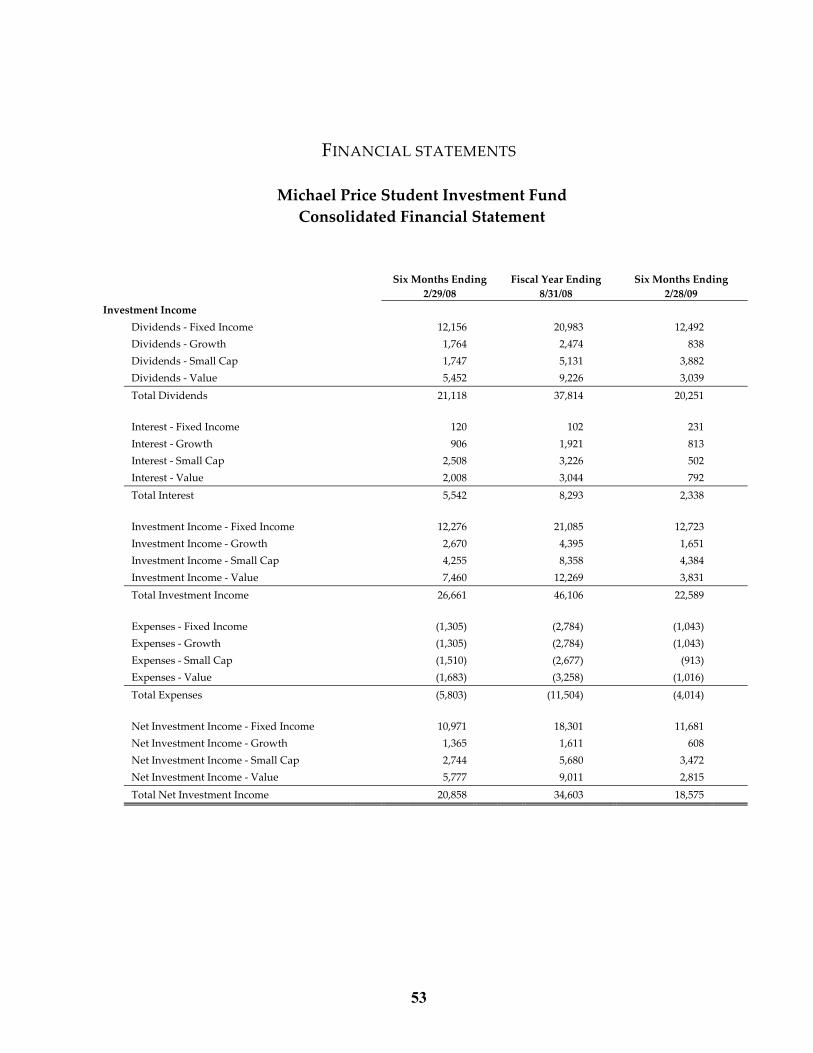
53
FINANCIAL STATEMENTS
Michael Price Student Investment Fund
Consolidated Financial Statement
Six Months Ending
2/29/08
Fiscal Year Ending
8/31/08
Six Months Ending
2/28/09
Investment Income
Dividends ‐ Fixed Income 12,156 20,983 12,492
Dividends ‐ Growth 1,764 2,474 838
Dividends ‐ Small Cap 1,747 5,131 3,882
Dividends ‐ Value 5,452 9,226 3,039
Total Dividends 21,118 37,814 20,251
Interest ‐ Fixed Income 120 102 231
Interest ‐ Growth 906 1,921 813
Interest ‐ Small Cap 2,508 3,226 502
Interest ‐ Value 2,008 3,044 792
Total Interest 5,542 8,293 2,338
Investment Income ‐ Fixed Income 12,276 21,085 12,723
Investment Income ‐ Growth 2,670 4,395 1,651
Investment Income ‐ Small Cap 4,255 8,358 4,384
Investment Income ‐ Value 7,460 12,269 3,831
Total Investment Income 26,661 46,106 22,589
Expenses ‐ Fixed Income (1,305) (2,784) (1,043)
Expenses ‐ Growth (1,305) (2,784) (1,043)
Expenses ‐ Small Cap (1,510) (2,677) (913)
Expenses ‐ Value (1,683) (3,258) (1,016)
Total Expenses (5,803) (11,504) (4,014)
Net Investment Income ‐ Fixed Income 10,971 18,301 11,681
Net Investment Income ‐ Growth 1,365 1,611 608
Net Investment Income ‐ Small Cap 2,744 5,680 3,472
Net Investment Income ‐ Value 5,777 9,011 2,815
Total Net Investment Income 20,858 34,603 18,575

54
Cash Flow from Operations
Cash Balance, beginning of period ‐ Fixed
Income 3,429 3,429 (10,920)
Cash Balance, beginning of period ‐ Growth 132,325 132,325 242,595
Cash Balance, beginning of period ‐ Small
Cap 68,954 68,954 190,479
Cash Balance, beginning of period ‐ Value 49,922 49,922 169,768
Total Cash Balance, beginning of period 254,629 254,629 591,921
Annual 5% Distribution ‐ Fixed Income 0 (23,754) 0
Annual 5% Distribution ‐ Growth 0 (21,089) 0
Annual 5% Distribution ‐ Small Cap 0 (23,442) 0
Annual 5% Distribution ‐ Value 0 (25,063) 0
Total Annual 5% Distribution 0 (93,348) 0
Sales of Securities ‐ Fixed Income 53,800 138,061 111,876
Sales of Securities ‐ Growth 307,146 714,285 335,433
Sales of Securities ‐ Small Cap 599,080 990,417 201,024
Sales of Securities ‐ Value 241,966 484,773 129,449
Total Sales of Securities 1,201,992 2,327,536 777,782
Purchases of Securities ‐ Fixed Income (52,778) (137,143) (45,068)
Purchases of Securities ‐ Growth (355,940) (595,791) (399,084)
Purchases of Securities ‐ Small Cap (422,615) (851,131) (292,628)
Purchases of Securities ‐ Value (213,241) (348,825) (151,932)
Total Purchases of Securities (1,044,574) (1,932,890) (888,711)
Net Other Adjustments ‐ Fixed Income (6,843) (9,813) (9,967)
Net Other Adjustments ‐ Growth 10,718 10,701 (30)
Net Other Adjustments ‐ Small Cap 0 0 0
Net Other Adjustments ‐ Value (10) (50) (45)
Total Net Other Adjustments * 3,865 838 (10,041)
Net Change in Cash ‐ Fixed Income 5,150 (14,349) 68,523
Net Change in Cash ‐ Growth (36,710) 109,717 (63,074)
Net Change in Cash ‐ Small Cap 179,209 121,525 (88,132)
Net Change in Cash ‐ Value 34,492 119,846 (19,713)
Total Net Change in Cash 182,140 336,739 (102,395)
Cash Balance, end of period ‐ Fixed Income 8,578 (10,920) 57,602
Cash Balance, end of period ‐ Growth 95,614 242,042 179,521
Cash Balance, end of period ‐ Small Cap 248,163 190,479 102,347
Cash Balance, end of period ‐ Value 84,414 169,768 150,055
Total Cash Balance, end of period 436,769 591,368 489,526
* Taxes owed on foreign securitiesʹ dividends, reinvestment of dividends on bond funds.

55

56
Value Fund Financial Statements
Investment IncomeDividends 6,569 3,641 8,147 5,452 9,226 3,039Interest 1,302 2,084 2,905 2,008 3,044 792Total Investment Income 7,871 5,724 11,053 7,460 12,269 3,831
Expenses (3,155) (1,534) (3,266) (1,683) (3,258) (1,016)
Net Investment Income 4,716 4,190 7,787 5,777 9,011 2,815
Cash Flow from OperationsCash Balance, beginning of period 50,622 50,399 50,399 49,922 49,922 169,768Net Investment Income 4,716 4,190 7,787 5,777 9,011 2,815Annual 5% Distribution (24,895) 0 (26,515) 0 (25,063) 0Transfer for MPSIF-Wide Rebalancing 0 0 0 0 0 0Sales of Securities 598,661 241,782 427,677 241,966 484,773 129,449Purchases of Securities (578,906) (192,070) (410,085) (213,241) (348,825) (151,932)Net Other Adjustments * 201 447 658 (10) (50) (45)Net Change in Cash (223) 54,349 (477) 34,492 119,846 (19,713)
Cash Balance, end of period 50,399 104,748 49,922 84,414 169,768 150,055
* Taxes owed on foreign securities' dividends.
Twelve Months Ended 8/31/06
Six Months Ended 2/28/07
Twelve Months Ended 8/31/07
Six Months Ended 2/29/08
Twelve Months Ended 8/31/08
Six Months Ended 2/28/09
Fixed Income Fund Financial Statements
Investment IncomeDividends 18,771 10,546 20,519 12,156 20,983 12,492Interest 231 209 383 120 102 232Total Investment Income 19,002 10,756 20,902 12,276 21,085 12,725
Expenses (1,948) (759) (1,740) (1,305) (2,784) (1,043)
Net Investment Income 17,054 9,997 19,162 10,971 18,301 11,682
Cash Flow from OperationsCash Balance, beginning of period 4,695 7,332 7,332 3,429 3,429 (10,920)Net Investment Income 17,054 9,997 19,162 10,971 18,301 11,682Annual 5% Distribution (23,459) 0 (23,805) 0 (23,754) 0Transfer for MPSIF-Wide Rebalancing 0 0 0 0 0 0Sales of Securities 161,254 0 81,492 53,800 138,061 111,876Purchases of Securities (142,733) 0 (70,987) (52,778) (137,143) (45,068)Net Other Adjustments * (9,479) (5,447) (9,765) (6,843) (9,813) (9,967)Net Change in Cash 2,637 4,550 (3,903) 5,150 (14,349) 68,524
Cash Balance, end of period 7,332 11,882 3,429 8,578 (10,920) 57,604
* Reinvestment of dividends on bond funds.
Twelve Months Ended 8/31/06
Six Months Ended 2/28/07
Twelve Months Ended 8/31/07
Six Months Ended 2/29/08
Twelve Months Ended 8/31/08
Six Months Ended 2/28/09


THE MICHAEL PRICE
STUDENT INVESTMENT FUND
44 WEST FOURTH STREET
NEW YORK, N.Y. 10012http://pages.stern.nyu.edu/~mpsif