the metrohealth system - cuyahoga county councilcouncil.cuyahogacounty.us/pdf_council/en-us/misc....
TRANSCRIPT
The MetroHealth SystemCampus Transformation
March 2017

Founded in 1837 as “City Hospital” in response to
Cholera Epidemic
Affiliated with Case Western
Reserve University
since 1914 – all MetroHealth doctors are
CWRU faculty
In 1892, 28 physicians
and surgeons formed the
first medical staff
Opened in 2004, the Critical Care Pavilion is one of the nation’s
most advanced centers for emergency medicine, trauma, and
surgical care
The Senior Health & Wellness Center at
South Campus opened in October of 2007, awarded
Pilot Status in 2008 as a first Patient Centered
Medical Home in Ohio
In 1958 becomes part of Cuyahoga
County - major tax levies were
passed for modernization of
facilities
In 1989, the Cuyahoga County Hospital System
became The MetroHealth
System
In 2013, the operational,
organizational and economical transformation
begins
The MetroHealth System’s Timeline
The MetroHealth System is a High-Quality, Vertically Integrated Academic Medical Center
The Critical Care Pavilion Expansion
Completed. MetroHealth offers
care thru over 30 sites of care.
By 1937, it’s the country's sixth largest hospital, with 1,650 beds
By 1955 becomes the third largest
polio center in the country. Dr.
Frederick Robbins wins Nobel Prize for isolating Polio
virus
1

The County’s Only Verified Level I Adult Trauma Center and Adult/Pediatric Burn Center
Essential health system for Cuyahoga County in Northeast Ohio
Primary teaching hospital for Case Western Reserve Medical School
Designated by CDC as the only Ebola Treatment Center in Ohio
Founding member of the Northern Ohio Trauma System, NOTS, a partnership with the Cleveland Clinic, surrounding hospitals, and local governments
Key operating statistics: Over 1 million patient visits annually 2012-
2016 120,000 Emergency Department visits in 2016 7,388 employees School Health provides a doctor for care of
students at 13 CMSD schools Medical Home for Children in Foster Care saw
2,571 visits in 2016
The MetroHealth System is an integrated health care system providing a broad range of services including inpatient and outpatient care, emergency services, long-term nursing
care, rehabilitation, and primary care and specialty care services delivered among 28
locations throughout northeast Ohio.
2
3
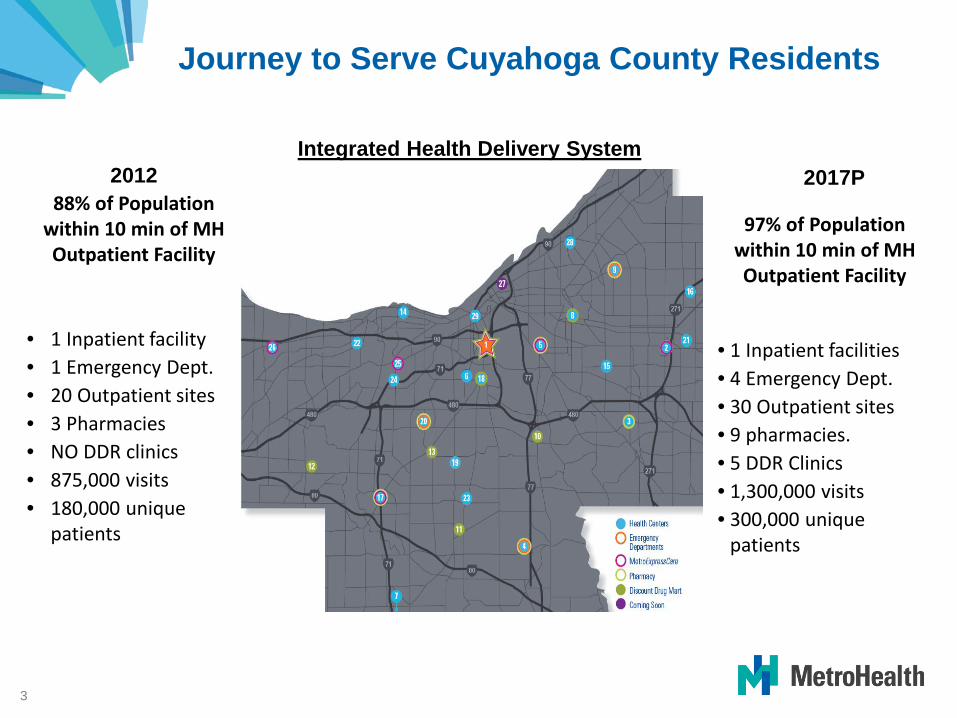
Journey to Serve Cuyahoga County Residents
201288% of Population
within 10 min of MH Outpatient Facility
• 1 Inpatient facility• 1 Emergency Dept.• 20 Outpatient sites• 3 Pharmacies• NO DDR clinics• 875,000 visits• 180,000 unique
patients
Integrated Health Delivery System2017P
97% of Population within 10 min of MH Outpatient Facility
• 1 Inpatient facilities• 4 Emergency Dept.• 30 Outpatient sites• 9 pharmacies.• 5 DDR Clinics• 1,300,000 visits• 300,000 unique
patients

1,270 1,265 1,260 1,255 1,250
1000
1100
1200
1300
2012 2013 2014 2015 2016
201 208229 238
284
150
200
250
300
2012 2013 2014 2015 2016
MetroHealth’s Patient Base has Rapidly Grown as a Result of Strategic Investments
(1) Annual population estimated - based on 1.6% decline from 2010 to 2016
Cuyahoga County Population (000s)(1)
Unique Patients (000s)
+7%CAGR
-0.3%CAGR
4
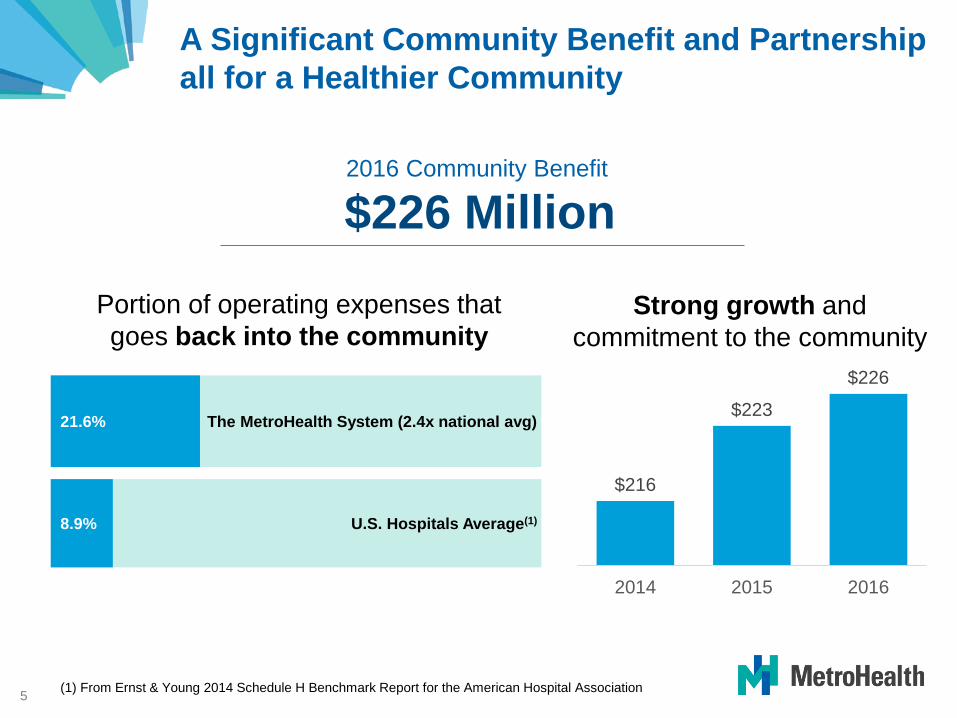
2016 Community Benefit
$226 Million
The MetroHealth System (2.4x national avg)
Portion of operating expenses that goes back into the community
(1) From Ernst & Young 2014 Schedule H Benchmark Report for the American Hospital Association
21.6%
U.S. Hospitals Average(1)8.9%
A Significant Community Benefit and Partnership all for a Healthier Community
Strong growth and commitment to the community
5
$216
$223
$226
2014 2015 2016

MetroHealth Has Invested Heavily in Recent Years Toward the Future of Care Delivery
$314M
$79M
$120M
$82M
$3M
Northcoast/CCP
Ambulatory/ HealthSpanIntegration
Transformation & Planning
TOTALEPIC/EMR/Other I.S.
$4M
Future Care Delivery$314M
All Other$198M
Spent-to-DateAdditional Committed
Total Capital Projects $512M
38%62%
$4M
$5M $17M
Total Capital Spending, 2005 to 2016
6

MetroHealth’s Earned Distinctions & Accreditations
7
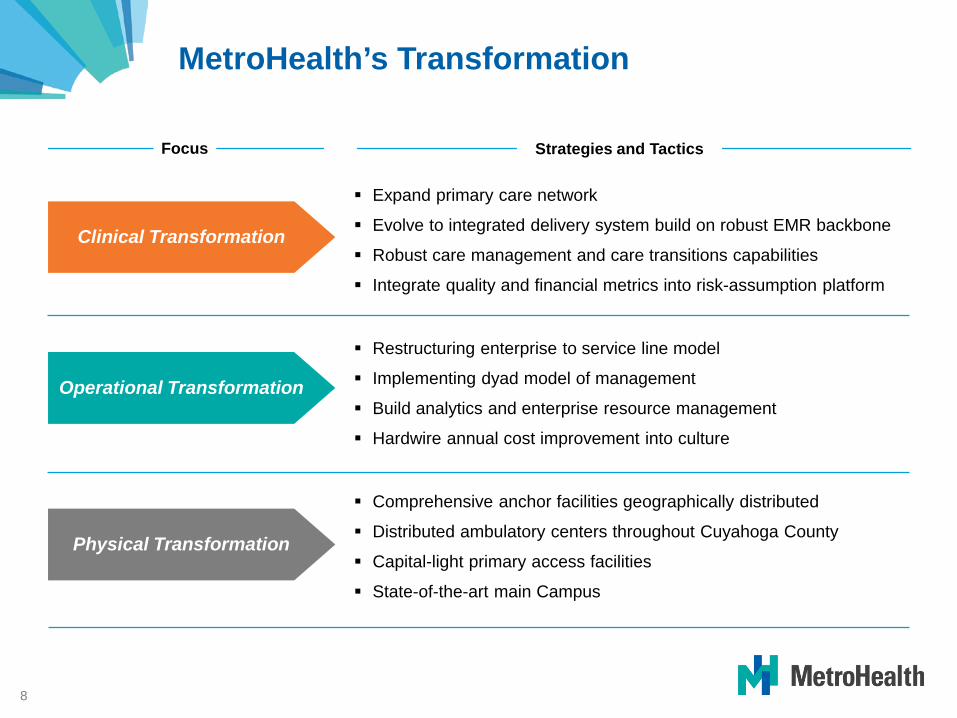
Expand primary care network
Evolve to integrated delivery system build on robust EMR backbone
Robust care management and care transitions capabilities
Integrate quality and financial metrics into risk-assumption platform
Restructuring enterprise to service line model
Implementing dyad model of management
Build analytics and enterprise resource management
Hardwire annual cost improvement into culture
Comprehensive anchor facilities geographically distributed
Distributed ambulatory centers throughout Cuyahoga County
Capital-light primary access facilities
State-of-the-art main Campus
MetroHealth’s Transformation
Focus Strategies and Tactics
8
Clinical Transformation
Operational Transformation
Physical Transformation
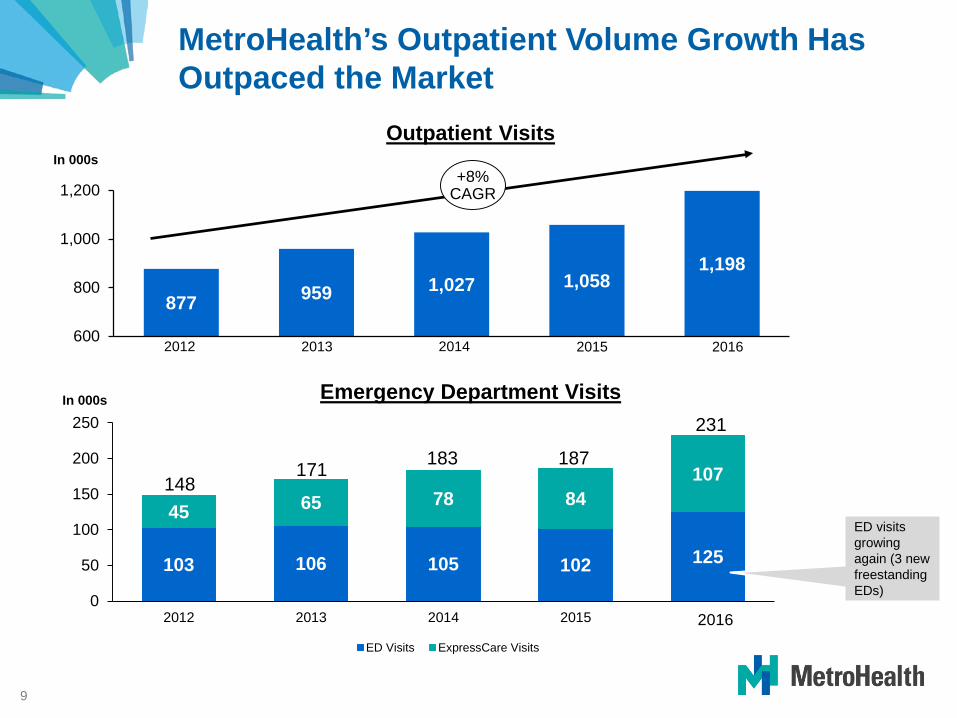
103 106 105 102 125
45 65 78 84107
0
50
100
150
200
250
2012 2013 2014 2015 2016
ED Visits ExpressCare Visits
877 959 1,027 1,0581,198
600
800
1,000
1,200
MetroHealth’s Outpatient Volume Growth Has Outpaced the Market
Emergency Department Visits
In 000s
Outpatient Visits
183 187
In 000s
148
231
171
ED visits growing again (3 new freestanding EDs)
20142012 2013 2015
+8%CAGR
2016
2016
9
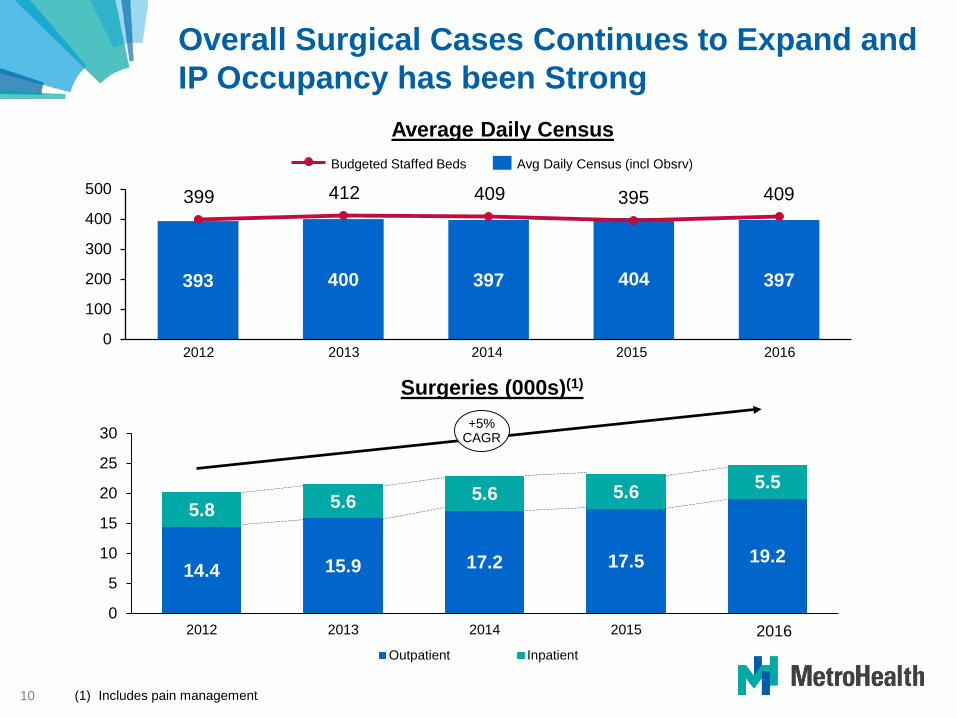
14.4 15.9 17.2 17.5 19.2
5.8 5.6 5.6 5.6 5.5
0
5
10
15
20
25
30
2012 2013 2014 2015 2016
Outpatient Inpatient
Overall Surgical Cases Continues to Expand and IP Occupancy has been Strong
393 400 397 404 397
399 412 409 395 409
0
100
200
300
400
500
20152013 20142012
Average Daily CensusBudgeted Staffed Beds Avg Daily Census (incl Obsrv)
Surgeries (000s)(1)
(1) Includes pain management
+5%CAGR
2016
2016
10

MetroHealth Continues to Grow Market Share, Especially for Patients 65+
Data Source: OHAData definition: Cuyahoga County, includes newborns3Q 2015 YTD compared to 3Q 2016 YTD11
16.6%
15.7%
13.6%
6.8%
11.9%
0.1%
-0.1%
-0.2%
0.8%
0.3%
-5.0% 0.0% 5.0% 10.0% 15.0% 20.0%
0 - 17
18 - 44
45 - 64
65 +
Total
MetroHealth Age Share and Change
2016 3rd Q Change
• MetroHealth saw significant share growth in the 65+ age group, and showed some growth with the 0-17 group as well
• The 18-64 age range showed a slight decline in share
Volume % Change
Age Group
MH Change
Market Change
All Ages -0.8% -3.4%
0-17 -3.0% -3.7%
18-44 -1.7% -0.9%
45-64 -4.5% -3.4%
65+ 8.7% -4.7%
• MetroHealth outperformed the market with the 0-17 and 65+ groups
• The market saw declines across all age groups

65+ Age Group Change by System
12
Data Source: OHAData definition: Cuyahoga County, includes newborns3Q 2015 YTD compared to 3Q 2016 YTD
System Volume % Change Volume Change
Total Market -4.7% -2,484
MetroHealth 8.7% 275CCHS -6.1% -1,568UHHS -4.7% -1,038St. Vincent -9.4% -126Other -3.7% -27
• MetroHealth gained volume in the 65+ age group, while the other systems declined
• CCHS saw the largest volume losses in the 65+ age group. The Lakewood Hospital closure contributed to the losses
• Losses for CCHS and UHHS are also attributed to declines in the Specialty Care and Neuromusculoskeletal markets
MetroHealth grew in a declining 65+ market
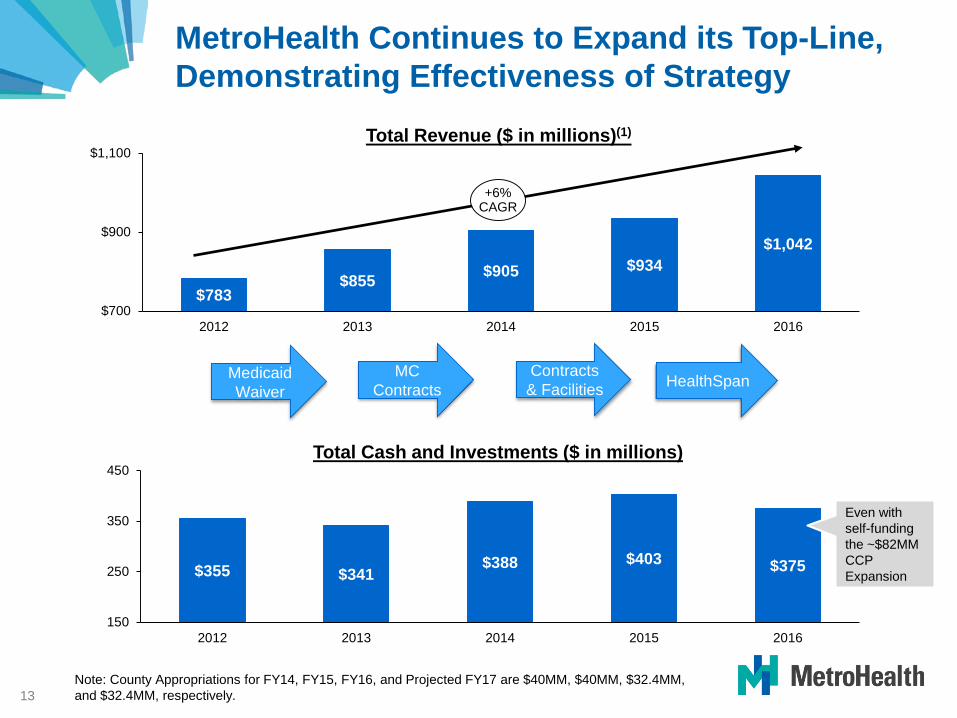
$783$855 $905 $934
$1,042
$700
$900
$1,100
2012 2013 2014 2015 2016
MetroHealth Continues to Expand its Top-Line, Demonstrating Effectiveness of Strategy
+6%CAGR
Total Revenue ($ in millions)(1)
Total Cash and Investments ($ in millions)
MC Contracts
Medicaid Waiver
Contracts & Facilities HealthSpan
13
$355 $341$388 $403 $375
150
250
350
450
2012 2013 2014 2015 2016
Even with self-funding the ~$82MM CCP Expansion
Note: County Appropriations for FY14, FY15, FY16, and Projected FY17 are $40MM, $40MM, $32.4MM, and $32.4MM, respectively.
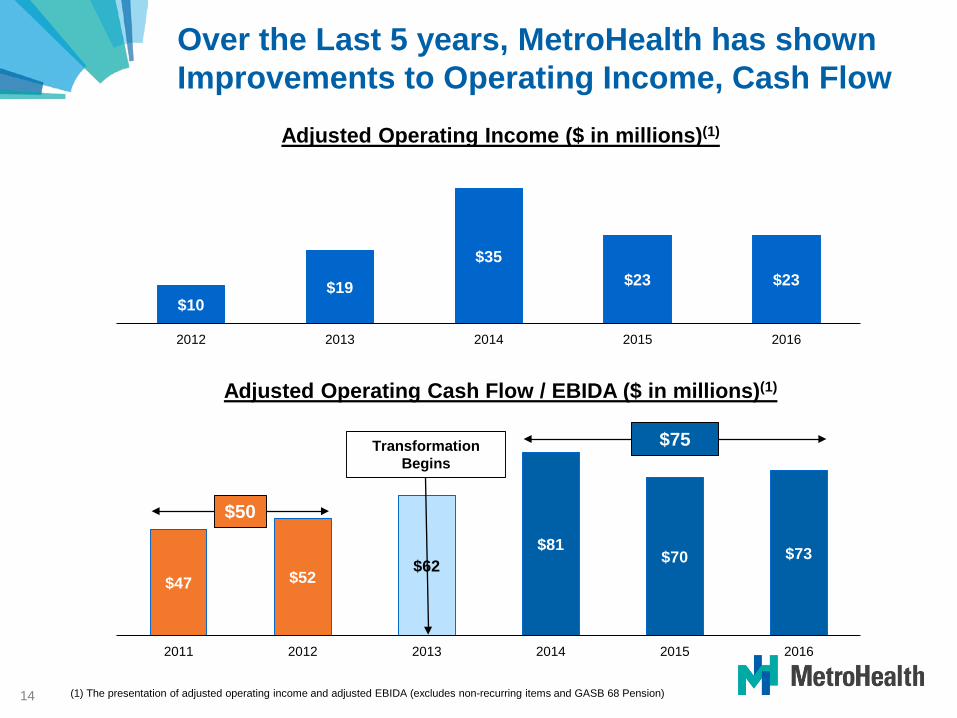
Over the Last 5 years, MetroHealth has shown Improvements to Operating Income, Cash Flow
Adjusted Operating Cash Flow / EBIDA ($ in millions)(1)
Adjusted Operating Income ($ in millions)(1)
(1) The presentation of adjusted operating income and adjusted EBIDA (excludes non-recurring items and GASB 68 Pension)14
$10$19
$35$23 $23
2012 2013 2014 2015 2016
$47 $52$62
$81$70 $73
2011 2012 2013 2014 2015 2016
Transformation Begins
$50
$75
15
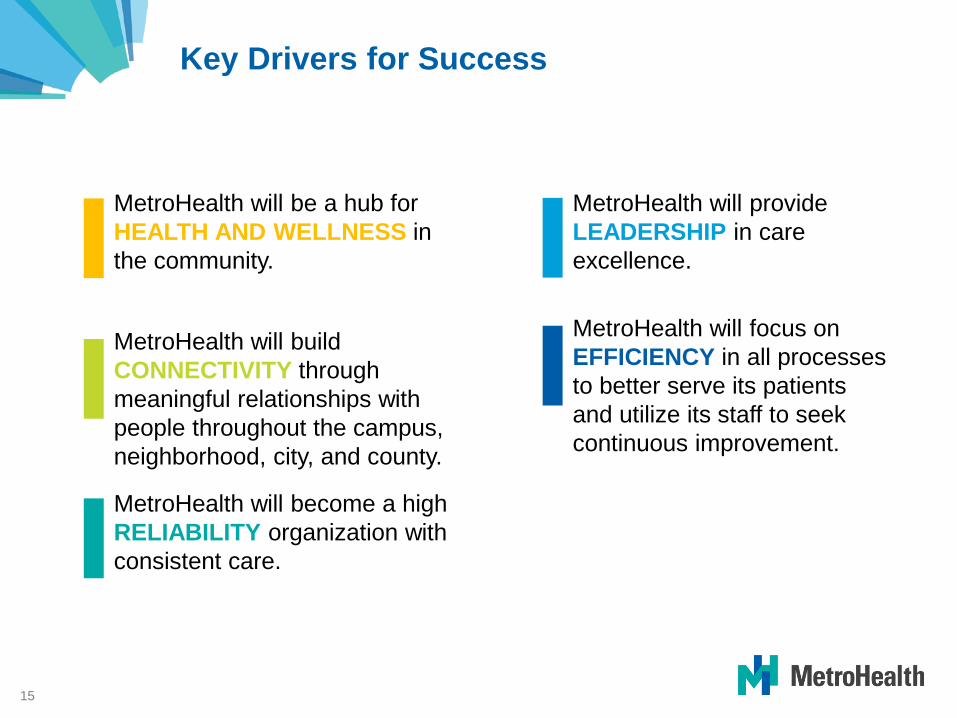
MetroHealth will be a hub for HEALTH AND WELLNESS in the community.
MetroHealth will build CONNECTIVITY through meaningful relationships with people throughout the campus, neighborhood, city, and county.
MetroHealth will become a high RELIABILITY organization with consistent care.
MetroHealth will provide LEADERSHIP in care excellence.
MetroHealth will focus on EFFICIENCY in all processes to better serve its patients and utilize its staff to seek continuous improvement.
Key Drivers for Success

Existing Main Campus
16
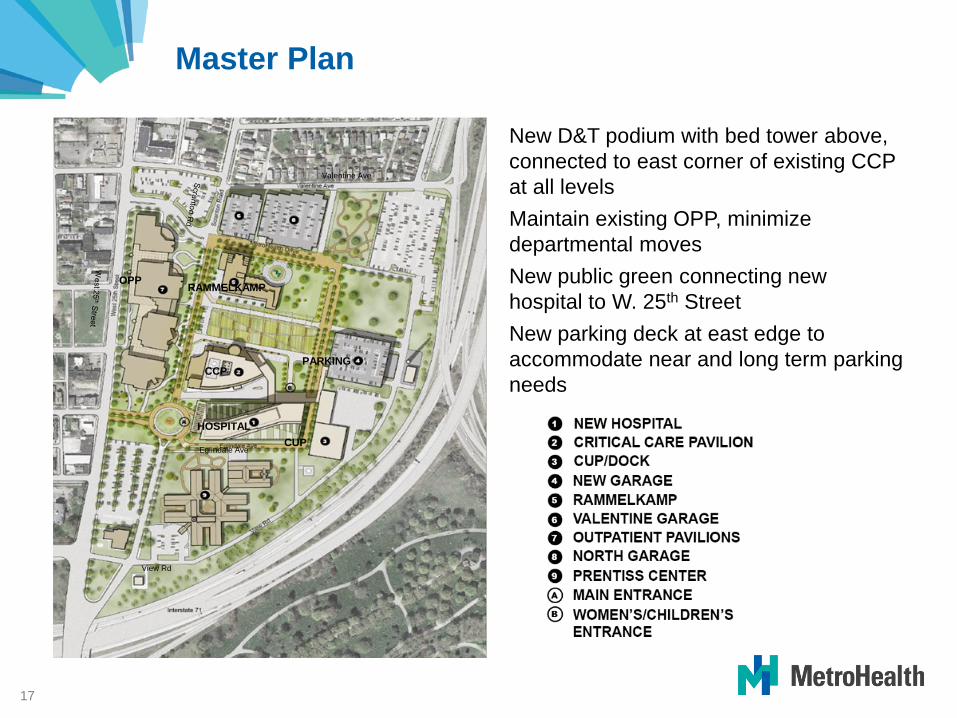
HOSPITALCUP
CCPPARKING
RAMMELKAMPOPP
Eglindale Ave
Valentine Ave
View Rd
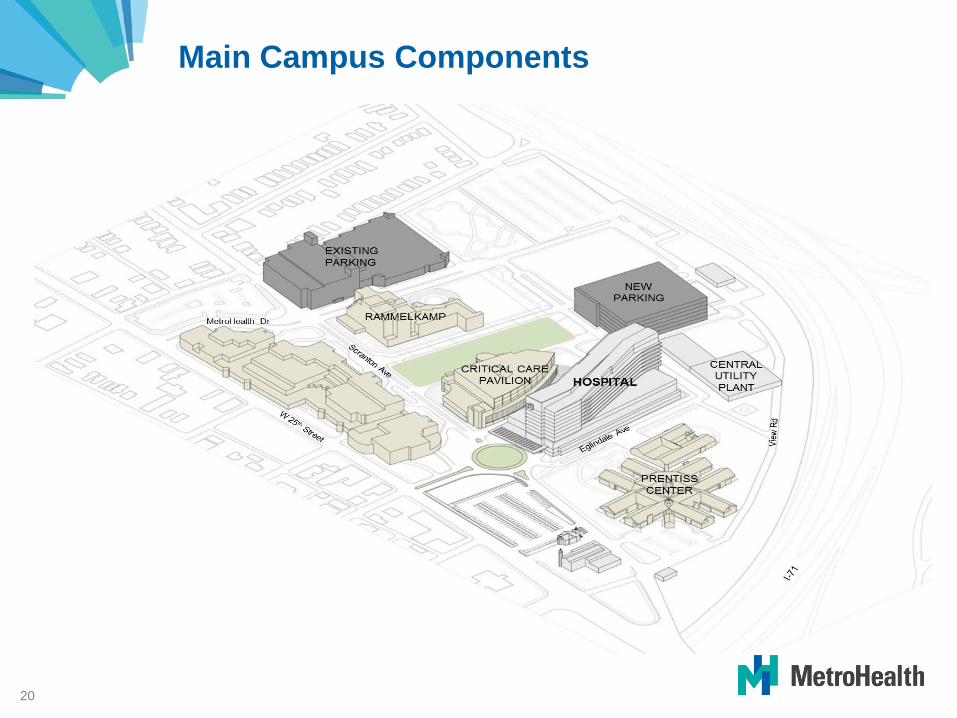
New D&T podium with bed tower above, connected to east corner of existing CCP at all levelsMaintain existing OPP, minimize departmental movesNew public green connecting new hospital to W. 25th StreetNew parking deck at east edge to accommodate near and long term parking needs
Master Plan
17
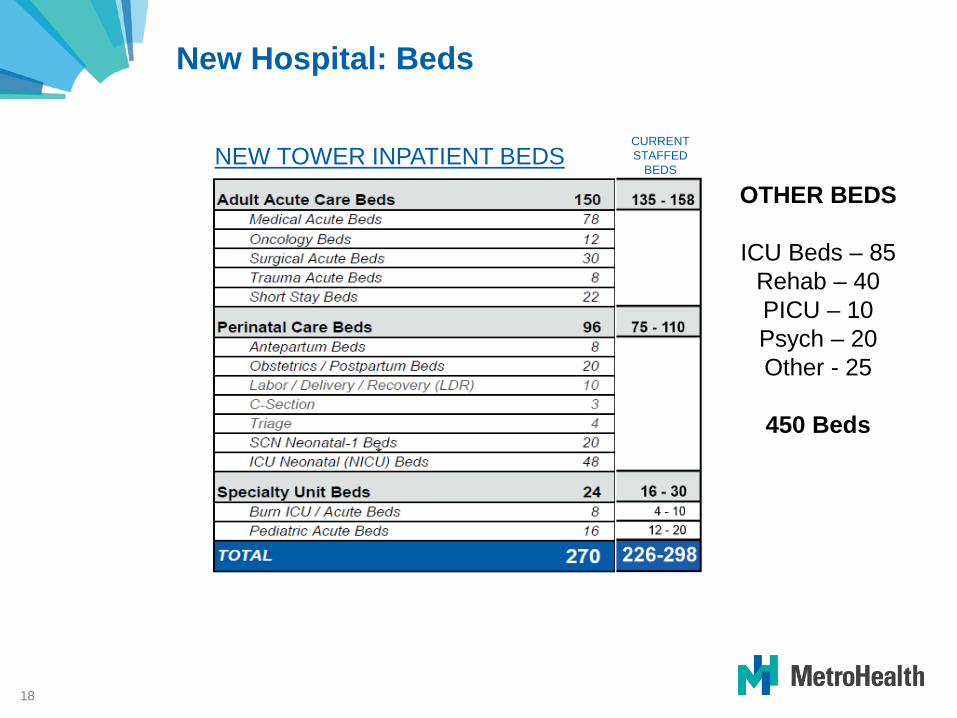
NEW TOWER INPATIENT BEDSCURRENTSTAFFED
BEDS
New Hospital: Beds
OTHER BEDS
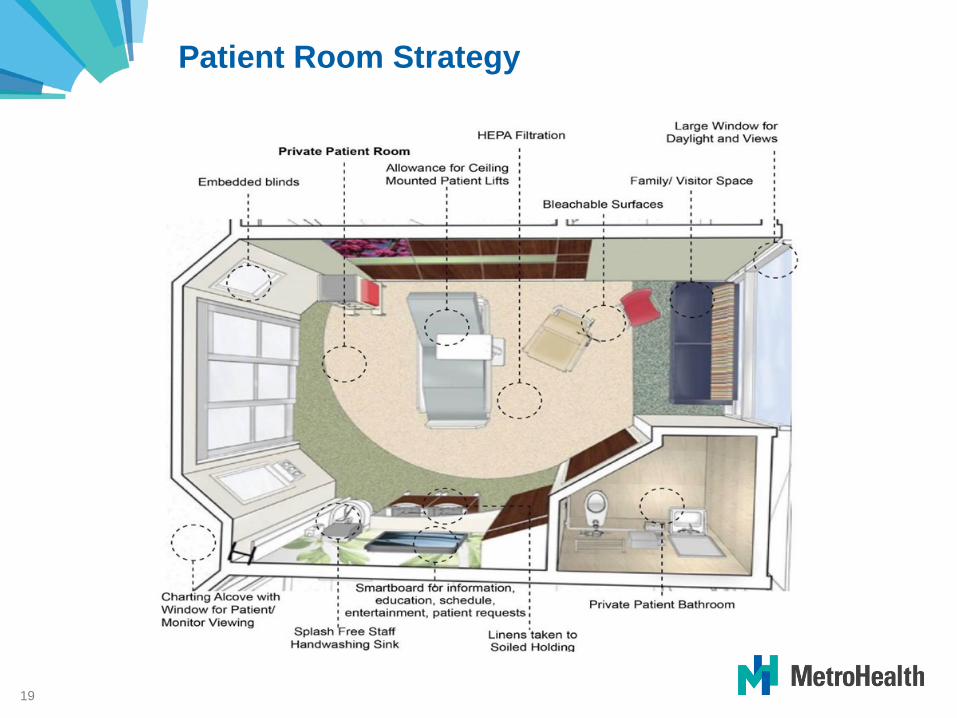
ICU Beds – 85Rehab – 40PICU – 10Psych – 20Other - 25
450 Beds
18
19
Patient Room Strategy
20
Main Campus Components

Step #1: Build New Garage
21

Step #2: Demo South Garage
22
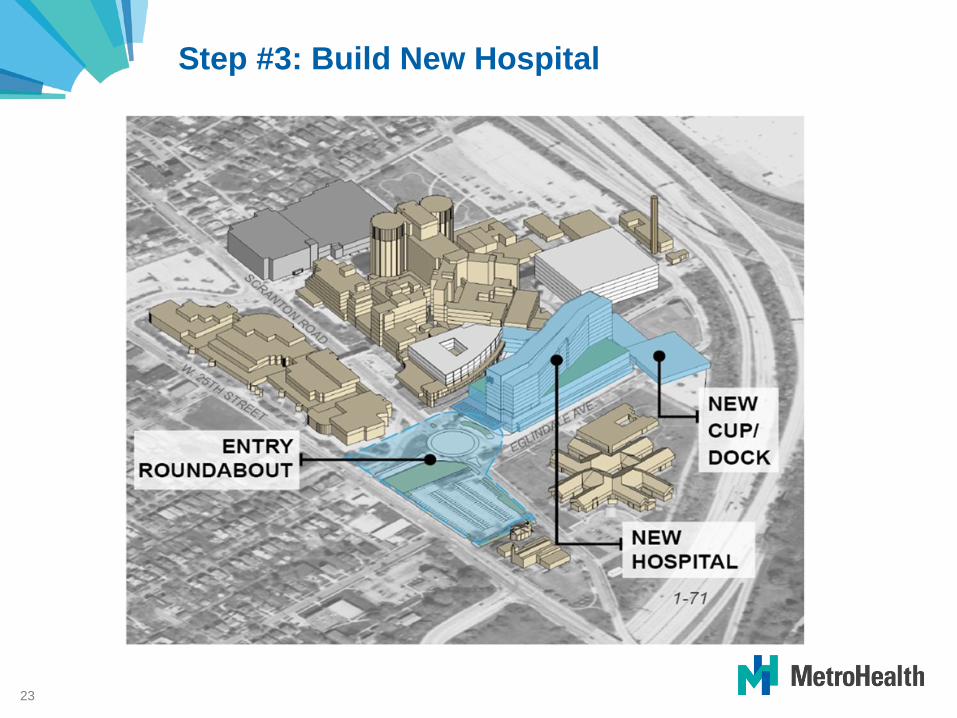
Step #3: Build New Hospital
23
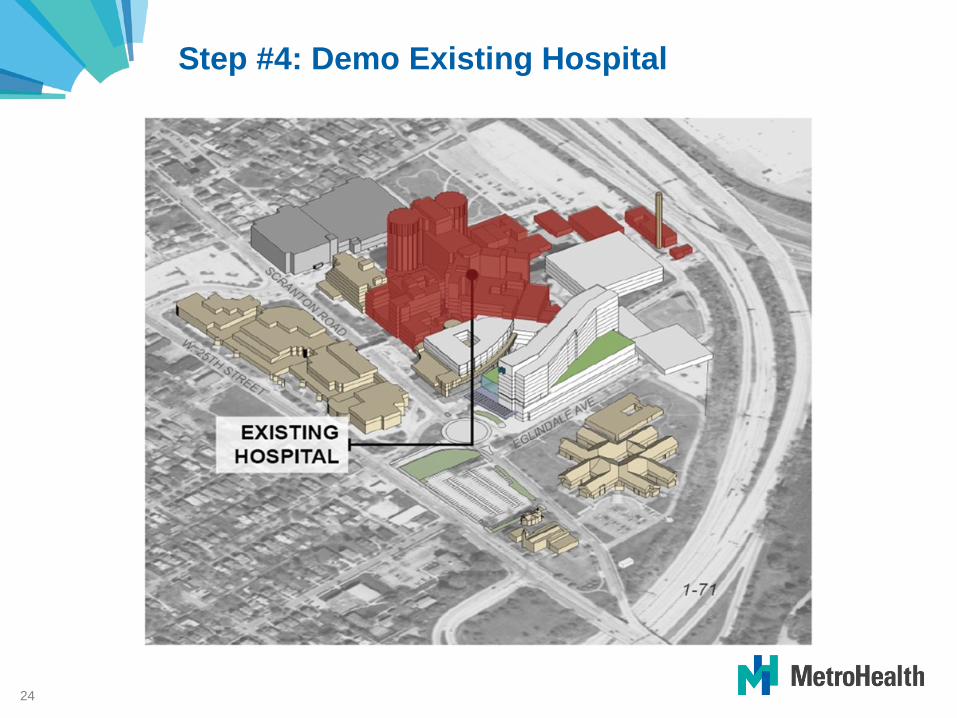
Step #4: Demo Existing Hospital
24
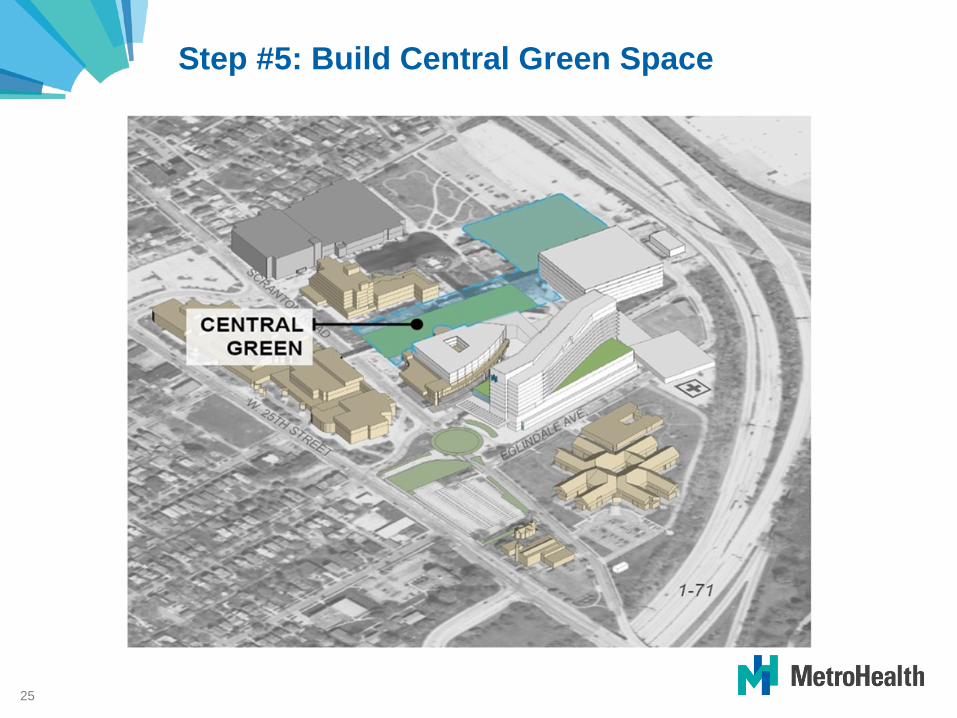
Step #5: Build Central Green Space
25
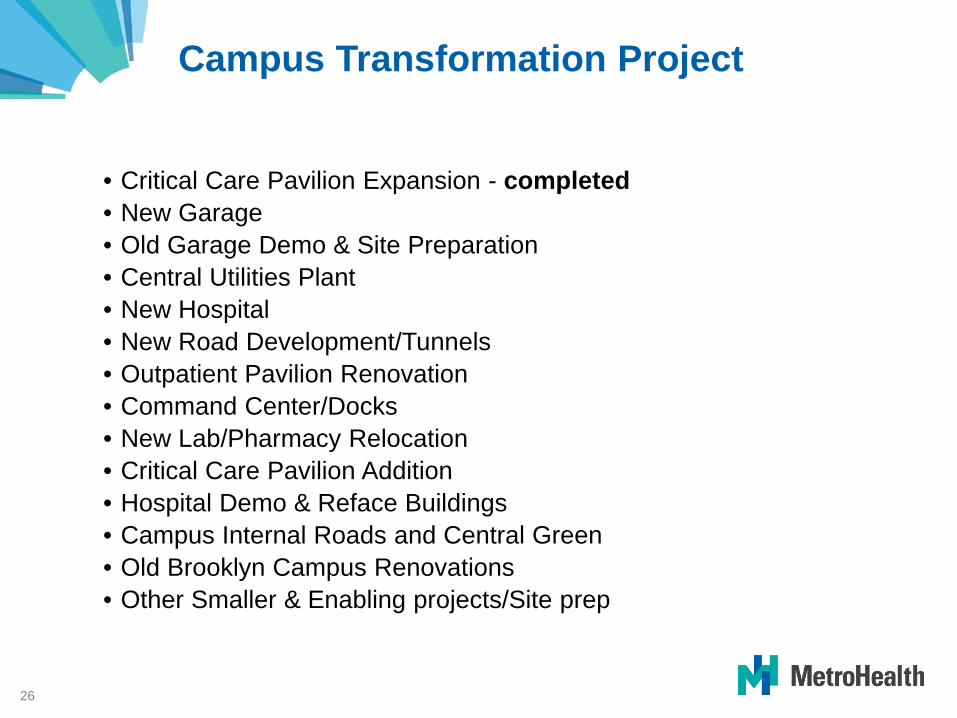
Campus Transformation Project
• Critical Care Pavilion Expansion - completed• New Garage • Old Garage Demo & Site Preparation• Central Utilities Plant• New Hospital • New Road Development/Tunnels• Outpatient Pavilion Renovation• Command Center/Docks• New Lab/Pharmacy Relocation• Critical Care Pavilion Addition• Hospital Demo & Reface Buildings• Campus Internal Roads and Central Green• Old Brooklyn Campus Renovations• Other Smaller & Enabling projects/Site prep
26
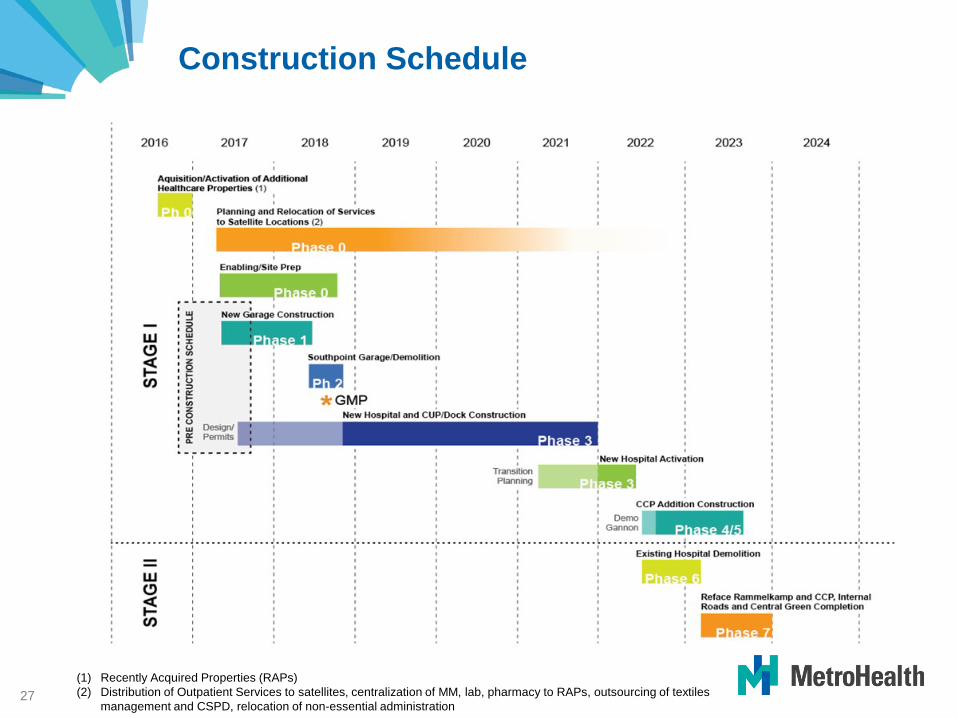
Construction Schedule
27(1) Recently Acquired Properties (RAPs)(2) Distribution of Outpatient Services to satellites, centralization of MM, lab, pharmacy to RAPs, outsourcing of textiles
management and CSPD, relocation of non-essential administration
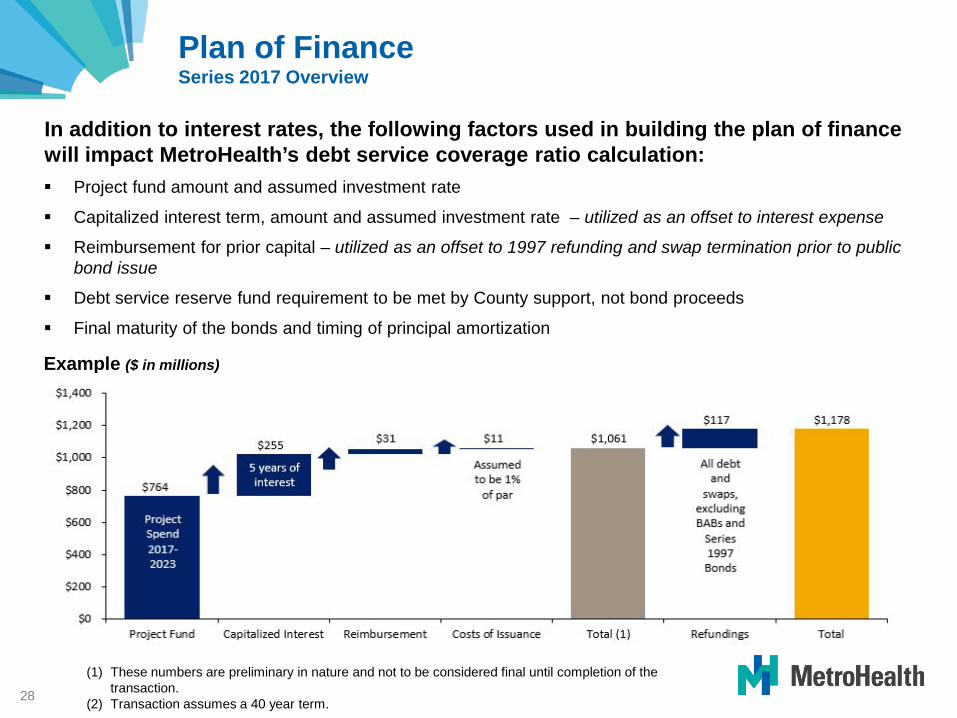
Plan of FinanceSeries 2017 Overview
In addition to interest rates, the following factors used in building the plan of finance will impact MetroHealth’s debt service coverage ratio calculation: Project fund amount and assumed investment rate
Capitalized interest term, amount and assumed investment rate – utilized as an offset to interest expense
Reimbursement for prior capital – utilized as an offset to 1997 refunding and swap termination prior to public bond issue
Debt service reserve fund requirement to be met by County support, not bond proceeds
Final maturity of the bonds and timing of principal amortization
Example ($ in millions)
(1) These numbers are preliminary in nature and not to be considered final until completion of the transaction.
(2) Transaction assumes a 40 year term.28
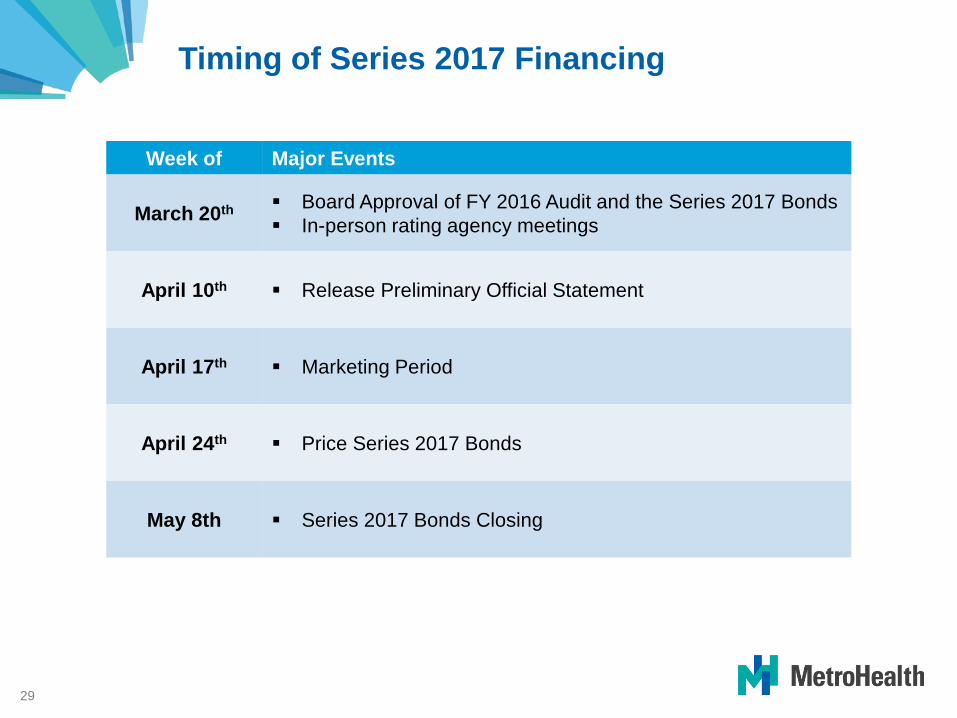
Timing of Series 2017 Financing
Week of Major Events
March 20th Board Approval of FY 2016 Audit and the Series 2017 Bonds In-person rating agency meetings
April 10th Release Preliminary Official Statement
April 17th Marketing Period
April 24th Price Series 2017 Bonds
May 8th Series 2017 Bonds Closing
29

Commitment to Diversity
30

Economic Impact of Campus Transformation
• Labors Hours 4.4 – 5.0 Million • Labor Salaries & Expenses $352 - $396 Million• City Income Tax Revenues $7.0 - $8.0 Million• Cuyahoga County Sales Tax $9.0 - $13.0 Million• Materials & Goods $477 - $521 Million
31
• Project Labor Agreement between Construction Manager & Local Trade Unions