the metrics of project management performance and pmbok
TRANSCRIPT

The Performance Metrics Applied to the PMBOK
MEL SCHNAPPER, PH. D.CHIEF METRICS GURU
MEL SCHNAPPER [email protected]
PMI Reston VA Luncheon, July 20, 2016
Will be mailed to you.

Participants’ Expectations
What are your major issues regarding measuring project management performance?

Introduction
Founder and past Chair of the Metrics Specific Interest Group (SIG) of PMI
Quality Manager for Oracle Corporation’s, Global Project Management Service Line and Oracle’s Change Management Consulting Services
International consulting activity has been in 26 countries bringing his metrics approach to democratization, government reform and institutional capacity building
Mel Schnapper, Ph.D

Purpose & Objectives
Purpose: To learn how to create; effective (and accurate) qualitative and quantitative performance metrics for ANY PMBOK area.
Objectives: As a result of this presentation, you will be able to:
1. Describe the steps of 3Ms approach:
Measure
Manage
Magnify
2. Identify your own potential/actual performance Key Value Areas (KVA).
3. Measure the proportionate value of these areas
4. Create at least one performance objective that describes the results that delivers the value of the KVA.

Universal
Everything is measurable
Measure = Qualitative AND Quantitative
Qualitative measures can be as rigorous as the
quantitative
Core Principles of the 3Ms
Approach

Qualitative Metrics
7

Project Management Service Line
Describe the elements of measurement in qualitative and quantitative terms.
Identify the key metrics and support systems of project management as listed below:

Global Project Management
Service Line (GPMSL) Chapter 9
a. Baseline metrics,
b. Current competency levels,
c. Number of Projects
d. Managers/Level/Role
e. Delivery experience size,
complexity,
f. Success rating (red to
green)
g. Continuity for duration
h.
Recruiting/attrition/retention,
i. Number of peer reviews
j. Projects/project end
reports,
k. Health check statistics,
l. Customer satisfaction
results,
m. Proposed PM/Delivered PM,
n. PM level of training,
o.…and more

Measure
Determine in qualitative and quantitative terms, units, key performance indicators what a successful task or project will achieve.
Quantitative = money, # of completed products, # of accidents, hires, settled legal cases, etc.
Qualitative = customer satisfaction, corporate culture, background of new hires, etc.
Measure

Manage
(Identify and change the) Systems that will help or hinder accomplishment
personnel, technical, operations, information, reward, performance review, etc.
Methodologies and programs
diversity, organization development, training, etc.
Manage

Magnify
Upgrade your standards of performance from year to year or “raise the bar” (for your results targets) .
”Satisfactory”
“Very good”
“Excellent”Magnify
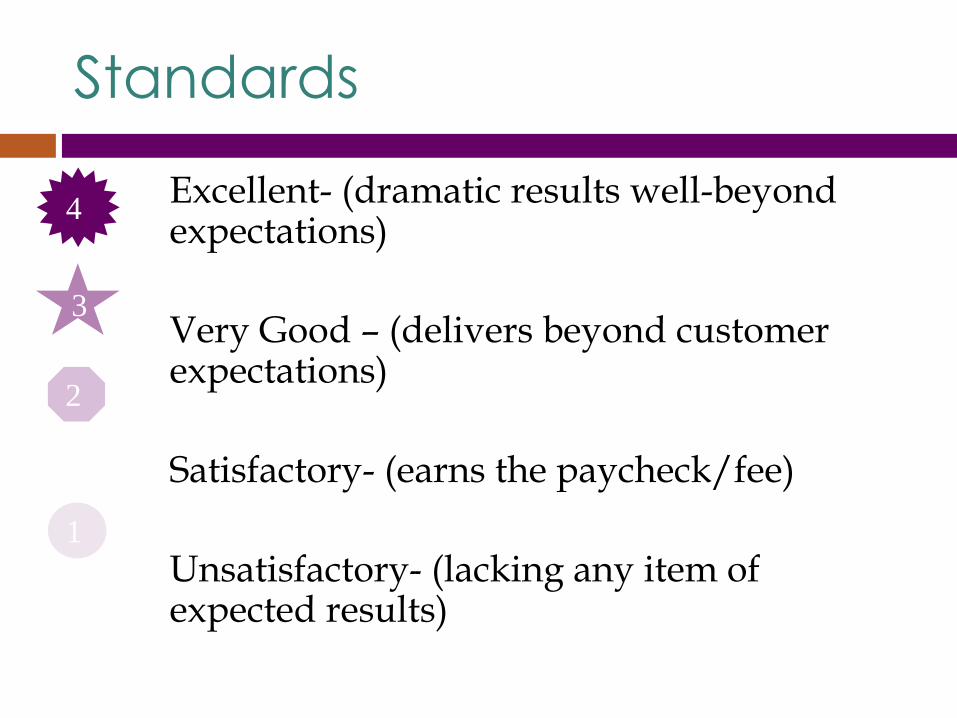
Standards
Excellent- (dramatic results well-beyond expectations)
Very Good – (delivers beyond customer expectations)
Satisfactory- (earns the paycheck/fee)
Unsatisfactory- (lacking any item of expected results)
1
2
3
4

3Ms Performance Formula
WeightingPerformance
StandardCreated
ValueX =
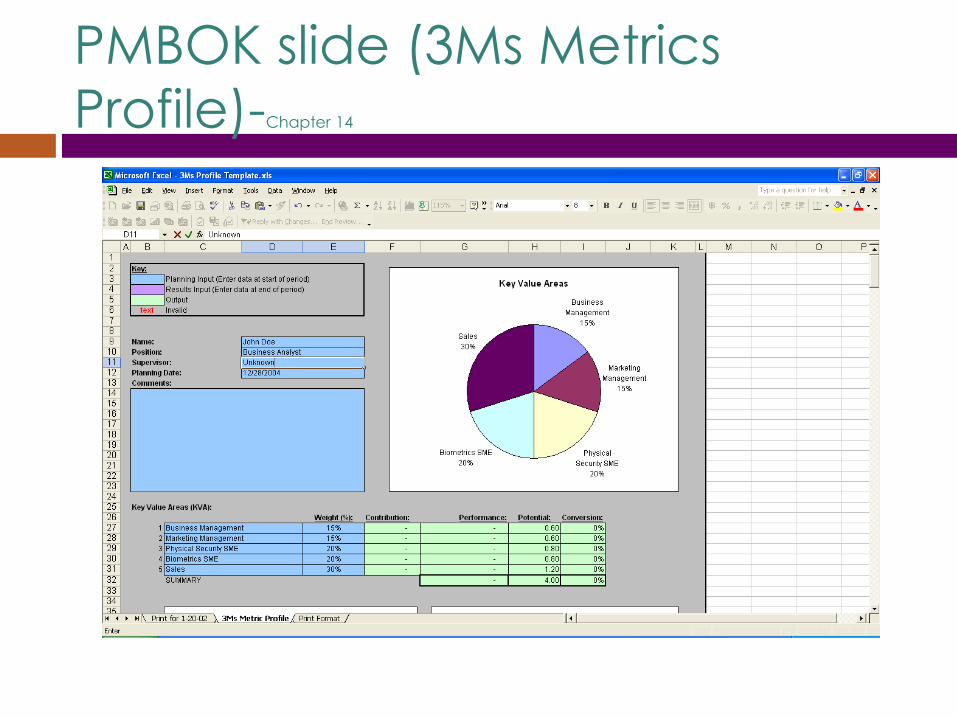
PMBOK slide (3Ms Metrics
Profile)-Chapter 14

Performance expectations
Don’t lower your expectations to meet your performance. Raise your level of performance to meet your expectations. Expect the best of yourself, and then do what is necessary to make it a reality.
-Ralph Marston

Here’s a real-life application of the 3Ms Performance Methodology
Case Study

Scenario
You are a project manager at Orizon company.
The VP of the PMO is asking you to plan a Customer Service training program
Customer complaint #’sare climbing due to “late” resolutions from 5/month to 10/month
Need to be <5/month.
Training

Measure –Customer Service
Measure
(Anticipated) results of customer service training, at a performance standard of:
Satisfactory -customer complaints will be addressed within 48 hours
Very Good – Addressed within 24 hours
Excellent – Resolved to customer’s satisfaction
(addressed = registered for resolution; resolved = no longer a customer problem)

Trainer’s KVAs
Training KVA – 60%
Performance Objectives: Customer Service = 20%
Supervisory Skills =20%
Teamwork Skills =20%
Administrative KVA -20%
Coaching KVA-20%

Manage
Verify baseline of customer complaints being addressed within last two years
Verify baseline of complaints resolution within last two years
Determine what skills, reward systems, reporting procedures, etc. exist
Conduct training. Change procedures. Modify reward systems. Create, improve or buy a CRM package.
Manage

Magnify
After a year or two, change the performance standards so that:
Satisfactory, customer complaints will be addressed within 24 hours
Very Good – Addressed within 12 hours
Excellent – Resolved to customer’s satisfaction by customer service function Magnify

Performance Scorecard
Key Value
Area (KVA)
Weighting (W) Performance
Standard (PS)
W X PS =Value Value
Training 60%
Performance Objectives
Customer
Service
60% 3 .2 X 3 = .6 1.8
Administrative 20% 2 .2 x 2 = .4 .4
Coaching 20% 3 .2 x 3 = .6 .6
TOTAL VALUE FOR ALL KVAs 2.8

3Ms Performance Scorecard
KVAs % Objectives with Standards Weight
[A]
Standard
[B]
Value
[A] x [B]
Timeliness 30 4 =10% early
3 = 5% early
2 = due date
30% 3 .9
Budget 30 4 = 10% below budget
3 = 5% below budget
2 = within budget
30% 4 1.2
Customer-
requested
Features
20 4 = >20 additional features
3 = >5 additional features
2 = met customer requirements
20% 3 .6
Quality 20 4 = plus 20%% fewer tasks
3 = improved quality 10%industry standards
2 = all performance meets industry standards
20% 2 .4
TOTAL 100 100% 3.1

Scalability is infinite - time, level, etc.
Goals are different from Objectives. A goal is directional "Improve delivery date";
Objectives are SMART- Specific, Measurable, Achievable, Results Oriented, Time Framed “>90% on-time (specified) deliveries by March 1, 2016”
No ambiguity - no adjectives or adverbs are allowed
Metrics is the easy part
Additional Concepts-1

Value = Money in the business context; other
currencies for non-business context – love,
fun, pleasure, recognition, etc.)
It's all about Value and Value is all about
money
Getting what you expected for the money you
paid
Additional Concepts-2

All objectives have team and/or individual
ownership from the top to the bottom.
Can assign weighted value as a weighted
proportion between individual and team
Rewards are based on results.
Added value is getting more than you
expected for the money you paid.
Additional Concepts-3

Value is weighted as a proportion of what the
project costs, is expected to earn and/or what
you pay or get paid for.
Value is about creating greater results- it's not
time, effort, risk, etc.
Additional Concepts-4

Additional Concepts- 5
Alignment = key element of this process
The interpersonal or managerial relationship is part of the SMART objective
Boss must contribute to your success
Creates multidirectional alignment - hierarchical, horizontal, cross-functional
Aligns four levels of authority - Approve, Decide, Consult, Inform
Does not distinguishes between being accountable or doing the work oneself

Additional Concepts-6
All objectives have team and/or individual ownership
from the top to the bottom.
Rewards are based on results.
Added value is getting more than you expected for the
money you paid.

Online application - transparent to self and
others
A driver of corporate culture and not just
reactive.
Predefined standards of performance
Aggregate - upward; Cumulative – forward
AND you think this way anyway
Additional Concepts-7

Measuring Results-1
"COMMENTS ON THE UTILITY OF MEASURING RESULTS"
"This pattern - adoption of crude performance measures, followed by protest and pressure to improve the measures, followed by the development of more sophisticated measures - is common where performance is measured. It explains why so many ... organizations have discovered that even a poor start is better then no start, and even crude measures are better than no measures. All organizations make mistakes at first. But, over time, they are usually forced to correct them". Page 156, From : Reinventing Government by David Osbourne and Ted Gaebler, Published by Addison-Wesley Publishing Company, Inc. 1993

Measuring Results - 2
"The simple act of defining measures is extremely enlightening to many organizations. Typically, [organizations] are not entirely clear about their goals, or are, in fact, aiming at the wrong goals. When they have to define the outcomes they want and the appropriate benchmarks to measure those outcomes, this confusion is forced into the open. People begin to ask the right questions, to redefine the problem they are trying to solve, and to diagnose that problem anew. When the measurement process starts, people immediately begin to think about the goals of the organization.” (p.147)
From: Reinventing Government by David Osbourne and Ted Gaebler, Published by Addison-Wesley Publishing Company, Inc. 1993