the metabolic building blocks of a minimal cell
TRANSCRIPT
biology
Article
The Metabolic Building Blocks of a Minimal Cell
Mariana Reyes-Prieto 1,2, Rosario Gil 1 , Mercè Llabrés 3, Pere Palmer-Rodríguez 3 and Andrés Moya 1,4,5,*
�����������������
Citation: Reyes-Prieto, M.; Gil, R.;
Llabrés, M.; Palmer-Rodríguez, P.;
Moya, A. The Metabolic Building Blocks
of a Minimal Cell. Biology 2021, 10, 5.
https://dx.doi.org/10.3390/biology-
10010005
Received: 23 November 2020
Accepted: 21 December 2020
Published: 24 December 2020
Publisher’s Note: MDPI stays neu-
tral with regard to jurisdictional claims
in published maps and institutional
affiliations.
Copyright: © 2020 by the authors. Li-
censee MDPI, Basel, Switzerland. This
article is an open access article distributed
under the terms and conditions of the
Creative Commons Attribution (CC BY)
license (https://creativecommons.org/
licenses/by/4.0/).
1 Evolutionary Systems Biology of Symbionts, Institute for Integrative Systems Biology, University of Valenciaand Spanish Research Council, Paterna, 46980 Valencia, Spain; [email protected] (M.R.-P.);[email protected] (R.G.)
2 Sequencing and Bioinformatics Service, Foundation for the Promotion of Sanitary and Biomedical Research ofthe Valencia Region, 46020 Valencia, Spain
3 Department of Mathematics and Computer Science, University of Balearic Islands,07122 Palma de Mallorca, Spain; [email protected] (M.L.); [email protected] (P.P.-R.)
4 Genomic and Health Area, Foundation for the Promotion of Sanitary and Biomedical Research of theValencia Region, 46020 Valencia, Spain
5 Centro de Investigación Biomédica en Red en Epidemiología y Salud Pública, 28029 Madrid, Spain* Correspondence: [email protected]; Tel.: +34-963-543-480
Simple Summary: Manufacturing artificial living cells would open endless research possibilities inbasic and applied sciences. With this motivation, many research groups are developing methodolo-gies to construct a stable minimal cell that is capable of achieving metabolic homeostasis, reproducing,and evolving in a controlled environment. Using as a template the gene set for a minimal cell pro-posed previously by Gil and coworkers, we have put together a network depicting its inferredminimal metabolism needed for life. This network has been further compressed as a metabolicDirected Acyclic Graph (m-DAG) in order to better visualize its topology and to find its essentialreactions (i.e., critical reactions to maintain the network’s connectivity). We have also compared thisminimal m-DAG to those of the smallest natural genome known until now and a synthetic minimalcell created in the laboratory. The modeling of m-DAGs based on minimal metabolisms can be a firstapproach for the synthesis and manipulation of minimal cells.
Abstract: Defining the essential gene components for a system to be considered alive is a crucial steptoward the synthesis of artificial life. Fifteen years ago, Gil and coworkers proposed the core of aputative minimal bacterial genome, which would provide the capability to achieve metabolic home-ostasis, reproduce, and evolve to a bacterium in an ideally controlled environment. They alsoproposed a simplified metabolic chart capable of providing energy and basic components for a mini-mal living cell. For this work, we have identified the components of the minimal metabolic networkbased on the aforementioned studies, associated them to the KEGG database and, by applying theMetaDAG methodology, determined its Metabolic Building Blocks (MBB) and reconstructed itsmetabolic Directed Acyclic Graph (m-DAG). The reaction graph of this metabolic network consistsof 80 compounds and 98 reactions, while its m-DAG has 36 MBBs. Additionally, we identified 12essential reactions in the m-DAG that are critical for maintaining the connectivity of this network.In a similar manner, we reconstructed the m-DAG of JCVI-syn3.0, which is an artificially designedand manufactured viable cell whose genome arose by minimizing the one from Mycoplasma mycoidesJCVI-syn1.0, and of “Candidatus Nasuia deltocephalinicola”, the bacteria with the smallest naturalgenome known to date. The comparison of the m-DAGs derived from a theoretical, an artificial, and anatural genome denote slightly different lifestyles, with a consistent core metabolism. The MetaDAGmethodology we employ uses homogeneous descriptors and identifiers from the KEGG database,so that comparisons between bacterial strains are not only easy but also suitable for many researchfields. The modeling of m-DAGs based on minimal metabolisms can be the first step for the synthesisand manipulation of minimal cells.
Keywords: metabolic networks; minimal gene set machinery; directed acyclic graphs; minimal cells
Biology 2021, 10, 5. https://dx.doi.org/10.3390/biology10010005 https://www.mdpi.com/journal/biology

Biology 2021, 10, 5 2 of 18
1. Introduction
One of the most ambitious aspirations of modern biology is to synthesize artificialliving cells. Manufacturing a cell opens endless research possibilities, both in basic andadvanced sciences, and it would be critical and a turning point in fields from medicineto evolutionary biology. To reduce the levels of difficulty on this task, most efforts arefocused on the synthesis of minimal cells. On the one hand, they will help by increasing ourunderstanding of living systems; on the other hand, they can be used as capsules for theintroduction of genetic material to customize cells for applied purposes [1]. Several com-plementary paths have been followed in search of the proper technology and methods todesign this fabricated cell. The most commonly used are the bottom–up and top–downapproaches [2–4].
The bottom–up approach consists of the assembly, piece by piece, of each non-livingbiological component (i.e., a self-replicating nucleic acid, a metabolic machinery, and anencapsulating structure; [5]) in order to get a system that could be considered alive. The re-sulting products of this approach are called “protocells” [6,7]. No comparable system hasbeen successfully constructed yet, but there have been developments on this front, with thedesigning of more refined cell-like compartments [8].
The top–down approach consists of deconstructing living cells [4,9]. Taking moderncells with reduced genomes as a starting point, it aims at further simplifying them byremoving dispensable genetic material. Experimental (genome-wide analyses by massivetransposon mutagenesis, antisense RNA, and systematic gene knockout) and computa-tional approaches (including comparative genomics, comparative proteomics and in silicocell modeling) have been used to characterize a set of essential and sufficient genes tocompose a living cell, that is, the core of a minimal bacterial genome [10]. Experimen-tally, genes are considered to be essential based on indirect evidence from systematic andgenome-wide inactivation or the inhibition of each individual gene present in a genome(compiled in http://www.essentialgene.org/ [11]). Comparative genomics has also beenbroadly used, assuming that genes that are common between distant organisms are proneto be essential [12]. In addition, naturally reduced genomes from bacteria with a host-associated lifestyle have been used for comparisons regarding gene content, because theymust be approaching a minimal genome [13,14]. The merging of these studies demon-strated the relevance of considering that essential functions can be performed by alternativeand unrelated (non-orthologous) gene products. Comparative studies only retrieve genesinvolved in functions for which there is no alternative in nature (e.g., the complex trans-lational machinery), while a minimal genome must also include all genes essential tomaintain metabolic homeostasis [15].
There is a third approach for the construction of a minimal genome that searches forthe biochemical and modular description of well-defined pathways needed to perform allessential functions [16]. Despite some major challenges needing to be addressed, this ap-proach allows a function-by-function debugging to reach self-replication, and it suggests agood starting point for the ultimate synthesizing of a minimal genome able to sustain anartificial minimal cell. The potentiality of chemically synthesizing genomic segments orcomplete genomes and confining them into pre-existing cells has revolutionized the studyof minimal cells [17]. The design of a truly minimal genome and its metabolic network canalso benefit from computational whole-genome sequence rewriting and a design-build-testin silico approach, preceding the chemical synthesis of a customized genome [18].
A cohesive metabolic network proposal can lead the path to the synthesis of mini-mal cells. A minimal cell would depend on a minimal set of anabolic pathways to convertand assemble its biomolecule building blocks with the use of the energy and nutrients avail-able in the environment, to reach metabolic homeostasis, and to achieve cellular growthand reproduction. Nevertheless, there is scientific consensus regarding the existence of avariety of minimal metabolic schemes that are ecologically dependent and able to sustain auniversal genetic machinery [19]. The simplest cell should be chemoorganoheterotrophic(i.e., an organism using organic compounds as carbon and energy sources), living in
Biology 2021, 10, 5 3 of 18
a nutrient-rich medium, in which the major metabolites (glucose, fatty acids, nitroge-nous bases, amino acids, and vitamins) must be available without limitation, since thiscell would not be able to synthesize them. Nevertheless, considering the adaptabilityof bacterial heterotrophic metabolisms, different metabolic schemes can be envisaged.The metabolic chart proposed by Gil and coworkers in 2004 [15] using a top–downapproach, by performing a comprehensive analysis of all previous computational andexperimental attempts to define a minimal genome, was based on the metabolic func-tions that were preserved in highly reduced genomes completely sequenced at that time,from endosymbiotic mutualistic or parasitic bacteria. The proposed core of the minimalgenome encoded the costless pathways that would allow the cell to perform the selectedmetabolic functions. In order to maintain a coherent metabolic functionality, some path-ways that were not present in some of the reduced genomes used in the aforementionedstudy were also incorporated, because their lack reflected a high dependence of their hosts.Likewise, the group of Craig Venter also explored this area and presented their list ofessential genes for a minimal bacterium in 2006 [20]. Both sets of genes and the coherenceof this metabolic network were further explored by Gabaldón et al. (2007) [19].
Metabolic networks determine the physiology and biochemistry of a cell. They aremade of three components: the metabolic pathways, the chemical reactions involved inthe metabolism, and the regulatory interactions of these reactions. Metabolic networkstend to be highly complex, even for simple organisms. For example, if we consider themetabolism of porphyrin and chlorophyll which is present in some animals, plants, fungi,bacteria, and archaea, we get a metabolic pathway map of 135 nodes and 181 edges in thereference pathway in the KEGG database (pathway: map00860). A pathway map withso many components is very difficult to visualize, especially when we are interested inthe pathway topology. To this extent, it is highly advantageous to suitably reduce thenumber of nodes in order to visualize the network more precisely. Alberich and coworkers(2017) designed a methodology called MetaDAG [21], which consists of the contractioninto a single node of those reactions that are strongly connected in the genome-widereaction graphs. In this way, the resulting graph is a Directed Acyclic Graph (DAG),called a metabolic DAG (m-DAG), that preserves the network topology (i.e., the originalrelations between reactions) while it allows easy human exploration and visualization.One advantage of directed acyclic graphs is that they do not have cycles repeatedly produc-ing and consuming the same metabolite. This methodology also creates reaction graphsand m-DAGs from multiple genomes, which can be used to calculate the core- and pan-metabolisms of a group of bacteria of interest as well as compare genomes by their m-DAGsin a novel manner. The MetaDAG methodology can also be of importance for large in silicoanalyses. By compressing metabolic networks and making them “simpler”, algorithms andcomputer analyses could also be less time consuming. Just as important, less computationalresources would be needed, making it easier for researchers to work with a large numberof genome wide m-DAGs, bacterial consortia m-DAGs, multiple symbiosis analyses, oreven environmental metabolomics.
For the current work, we constructed the minimal metabolic network from the the-oretical minimal gene set machinery revised in Gabaldón and coworkers (2007) [19],and compared it to the smallest genome of a live organism known to date [22], and tothe genome of a semisynthetic bacteria produced by Craig Venter’s group in 2016 [17].Despite the great efforts being done to homogenize gene and enzyme names in databases,due to how they have been discovered and described throughout history, some of theirnames are still associated with taxonomically related organisms. For this reason, to avoidany remaining biases toward any group of organisms and any need for synonym lists,we propose a minimal metabolic network defined by reactions and compounds insteadof genes. Moreover, another of the advantages of our methodology is that it is essen-tially universal, since it uses homogenous identifiers and descriptors, so that researcherscan easily associate the involved reactions and compounds to genes of bacterial genomeswith different phylogenetic backgrounds, even to synthetic genomes as proven in this study.

Biology 2021, 10, 5 4 of 18
Finally, it can also be applied to bacterial consortia in order to detect the metabolic interac-tions between partners and communities.
2. Materials and Methods2.1. Inference of Minimal Metabolic Networks
The metabolic networks for this study were inferred from the reviewed version ofthe theoretical minimal genome described by Gabaldón et al. (2007) [19], the genome of“Ca. Nasuia deltocephalinicola” str. NAS-ALF [22] (which is also publicly available inthe new version of the SymGenDB [23]), and the genome of JCVI-syn3.0, which is anartificial viable cell created by Hutchison and coworkers [17]. We first searched for allprotein-coding genes in each genome for which an enzymatic activity has been assignedand then searched for the corresponding reactions in KEGG.
2.2. Reconstruction of the Directed Acyclic Graph of Metabolic Networks
Using the above obtained information, which is a set of reactions for each metabolicnetwork, we generated the corresponding reaction graph that models the relationship be-tween reactions in terms of shared metabolites. A reaction graph, denoted by RG = (R, ER),is a directed graph with a set of nodes R that are reactions and whose edges are de-fined as follows: there is an edge pointing from reaction Ri to reaction Rj if, and only if,a metabolite produced by reaction Ri is a substrate in reaction Rj. The fact that it is a directedgraph establishes a natural production/consumption order between two reactions—thatis, what is produced by Ri is then consumed by Rj. Before generating the directed graph,we manually curated it to remove redundancies (enzymes encoded by orthologous genes).
In order to analyze the reaction graph in a visually friendly manner, we used theMetaDAG methodology [21]. In a reaction graph, two reactions Ri, Rj are said to bebiconnected if there is a path in each direction between them. A strongly connectedcomponent of a reaction graph is a subgraph such that every pair of reactions in itare biconnected. These strongly connected components are contracted in a single node.The reactions that are not biconnected to any other reaction become a node by themselves.Each node is called a Metabolic Building Block (MBB for short), and the MetaDAG softwareautomatically assigns an ID to each MBB. When each MMB is contracted to a single vertex,the resulting quotient graph is a metabolic Directed Acyclic Graph (m-DAG for short).Thus, the m-DAG is defined as follows: its nodes are the MBBs obtained from the reactiongraph, and there is an edge between two MBBs, MBB1 and MBB2, if there is an edge inthe reaction graph from a reaction in MBB1 to a reaction in MBB2. We denote by Gm them-DAG, thus Gm = (N, E) where N is the set of MBBs and E is the edges between themsuch that
(MBB1, MBB2) ∈ E ⇔ ∃ Ri ∈ MBB1 ∧ ∃ Rj ∈ MBB2 | (Ri, Rj) ∈ ER
MBBs contracting only one reaction and whose removal disconnects the reaction graph areconsidered essential reactions because they are crucial to maintain the network’s connectivity.
3. Results and Discussion3.1. Theoretical Minimal Metabolic Network
The first step toward the creation of the minimal metabolic network was to extrapolatethe list of genes and enzymes belonging to the set presented by Gabaldón and coworkers(2007) [19] (Figure 1 and Table S1) to obtain KEGG reaction identifiers (IDs). We usedthe complete reaction, compound, and enzyme database from KEGG and created thereaction graph by joining the reactions where metabolites were shared (see Section 2.2 forthe complete explanation). The idea behind using the complete KEGG catalog is to avoidbiases toward a specific phylogenetic group of bacteria.

Biology 2021, 10, 5 5 of 18Biology 2020, 9, x 8 of 17
Figure 1. Interaction graph of the proposed theoretical minimal metabolic network adapted from Gabaldón et al. (2007)
[19]. Line colors denote metabolic categories: yellow, glycolysis; orange, pentose phosphate pathway; pink, phospholipid
metabolism; green, nucleotide metabolism; blue, coenzyme metabolism. The two glycolytic steps in which ATP is produced
by substrate‐level phosphorylation are depicted with thicker red arrows, and correspond to reactions R01512 and R00200 in
Table 1. The reaction graph of this same network is presented in Figure 2 for comparison.
Figure 1. Interaction graph of the proposed theoretical minimal metabolic network adapted from Gabaldón et al.(2007) [19]. Line colors denote metabolic categories: yellow, glycolysis; orange, pentose phosphate pathway; pink, phospho-lipid metabolism; green, nucleotide metabolism; blue, coenzyme metabolism. The two glycolytic steps in which ATP isproduced by substrate-level phosphorylation are depicted with thicker red arrows, and correspond to reactions R01512 andR00200 in Table 1. The reaction graph of this same network is presented in Figure 2 for comparison.

Biology 2021, 10, 5 6 of 18
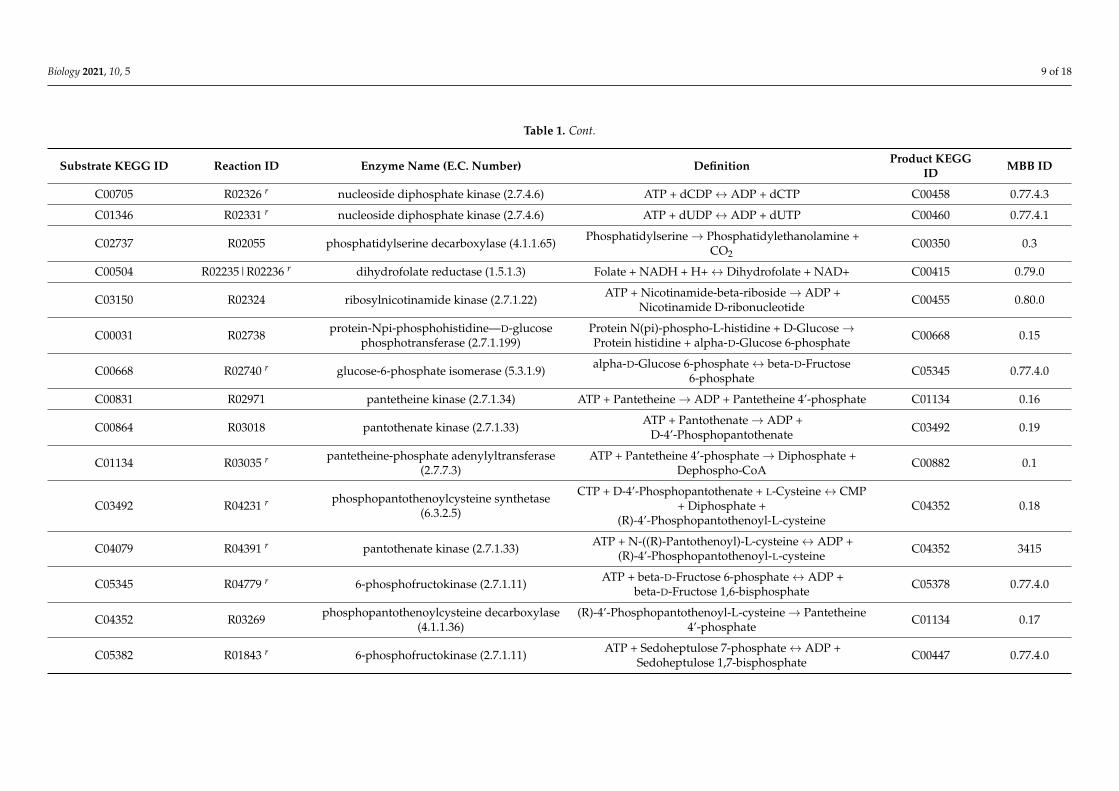
Table 1. Reactions, enzymes, and compounds of the minimal metabolic network presented in Figure 2. Reversible reactions are denoted by the superscript r. MBB IDs are the identificationnumbers of the metabolic building blocks to which each reaction is contracted into, according to the MetaDAG analysis (Figure 3).
Substrate KEGG ID Reaction ID Enzyme Name (E.C. Number) Definition Product KEGGID MBB ID
C00020 R00127 r adenylate kinase (2.7.4.3) ATP + AMP ↔ 2 ADP C00008 0.15
C00882 R00130 dephospho-CoA kinase (2.7.1.24) ATP + Dephospho-CoA → ADP + CoA C00010 0.2
C00455 R00137 r nicotinamide-nucleotide adenylyltransferase(2.7.7.1)
Diphosphate + NAD+ ↔ ATP + NicotinamideD-ribonucleotide C00003 0.80.1.0
C00015 R00156 r nucleoside-diphosphate kinase (2.7.4.6) ATP + UDP ↔ ADP + UTP C00075 0.77.4.0
C00105 R00158 r UMP/CMP kinase (2.7.4.14) ATP + UMP ↔ ADP + UDP C00015 0.77.4.0
C00061 R00161 FAD synthase (2.7.7.2) ATP + FMN → Diphosphate + FAD C00016 0.10
C00018 R00173 pyridoxal phosphatase (3.1.3.74) Pyridoxal phosphate + H2O → Pyridoxal +Orthophosphate C00250 0.11
C00073 R00177 methionine adenosyltransferase (2.5.1.6) ATP + L-Methionine + H2O → Orthophosphate +Diphosphate + S-Adenosyl-L-methionine C00019 0.12
C00020 + C0013 R00190 r adenine phosphoribosyltransferase (2.4.2.7) AMP + Diphosphate ↔ Adenine +5-Phospho-alpha-D-ribose 1-diphosphate C00147 + C00119 0.78.1.0
C00074 + C00008 R00200 pyruvate kinase (2.7.1.40) ADP + Phosphoenolpyruvate → ATP + Pyruvate C00022 0.9
C00144 R00332 r guanylate kinase (2.7.4.8) ATP + GMP ↔ ADP + GDP C00035 0.77.4.0
C00044 R00430 r pyruvate kinase (2.7.1.40) GTP + Pyruvate ↔ GDP + Phosphoenolpyruvate C00035 0.77.4.0
C00055 R00512 r (d)CMP kinase (2.7.4.25) ATP + CMP ↔ ADP + CDP C00112 0.77.4.2
C00255 R00549 riboflavin kinase (2.7.1.26) ATP + Riboflavin → ADP + FMN C00061 0.13
C00112 R00570 r nucleoside diphosphate kinase (2.7.4.6) ATP + CDP ↔ ADP + CTP C00063 0.77.4.2
C00075 R00571, R00573 CTP synthase (6.3.4.2) ATP + UTP + Ammonia → ADP + Orthophosphate+ CTP C00063 0.77.4.6
C00378 R00619 thiamine diphosphokinase (2.7.6.2) ATP + Thiamine → AMP + Thiamin diphosphate C00068 0.14
C00631 R00658 r enolase (4.2.1.11) 2-Phospho-D-glycerate ↔ Phosphoenolpyruvate + H2O C00074 0.77.4.0

Biology 2021, 10, 5 7 of 18
Table 1. Cont.
Substrate KEGG ID Reaction ID Enzyme Name (E.C. Number) Definition Product KEGGID MBB ID
C00186 R00703 r lactate dehydrogenase (1.1.1.27) (S)-Lactate + NAD+ ↔ Pyruvate + NADH + H+ C00022 0.0
C00093 R00842|R00844 r sn-glycerol-3-phosphate dehydrogenase(1.1.1.94)
sn-Glycerol 3-phosphate + NAD+ ↔ Glyceronephosphate + NADH + H+ C00111 0.77.4.0
C00093 + C00040 R00851 arylamine N-acetyltransferase (2.3.1.15) sn-Glycerol 3-phosphate + Acyl-CoA →1-Acyl-sn-glycerol 3-phosphate + CoA C00681 0.8
C00415 R00936|R00939 r dihydrofolate reductase (1.5.1.3) Dihydrofolate + NADH + H+ ↔ Tetrahydrofolate +NAD + C00101 0.79.0
C00037 + C00143 R00945 r glycine hydroxymethyltransferase (2.1.2.1) 5,10-Methylenetetrahydrofolate + Glycine + H2O ↔Tetrahydrofolate + L-Serine C00065 + C00101 0.79.0
C00105 R00966 r uracil phosphoribosyltransferase (2.4.2.9) UMP + Diphosphate ↔ Uracil +5-Phospho-alpha-D-ribose 1-diphosphate C00106 + C00119 0.77.4.0
C00117 R01049 r phosphoribosylpyrophosphate synthetase(2.7.6.1)
ATP + D-Ribose 5-phosphate ↔ AMP +5-Phospho-alpha-D-ribose 1-diphosphate C00119 0.77.4.0
C00117 R01056 r ribose-5-phosphate isomerase (5.3.1.6) D-Ribose 5-phosphate ↔ D-Ribulose 5-phosphate C00199 0.77.4.0
C00118 R01061 r glyceraldehyde-3-phosphate dehydrogenase(1.2.1.12)
D-Glyceraldehyde 3-phosphate + Orthophosphate +NAD+ ↔ 3-Phospho-D-glyceroyl phosphate + NADH +
H+C00236 0.77.4.0
C05378 R01070 r fructose-1,6-bisphosphate aldolase (4.1.2.13) beta-D-Fructose 1,6-bisphosphate ↔ Glyceronephosphate + D-Glyceraldehyde 3-phosphate C00111 + C00118 0.77.4.0
C00131 R01138 r pyruvate kinase (2.7.1.40) dATP + Pyruvate ↔ dADP + Phosphoenolpyruvate C00206 0.78.1.1
C00119 + C00242 R01229 r hypoxanthine phosphoribosyltransferase(2.4.2.8)
Guanine + 5-Phospho-alpha-D-ribose 1-diphosphate ↔GMP + Diphosphate C00144 0.77.4.0
C00361 R01858 pyruvate kinase (2.7.1.40) dGDP + Phosphoenolpyruvate → dGTP + Pyruvate C00286 0.6
C00008 R02017 ribonucleoside diphosphate reductase(1.17.4.1)
Thioredoxin + ADP → dADP + Thioredoxin disulfide +H2O C00206 0.78.1.2
C00035 R02019 ribonucleoside diphosphate reductase(1.17.4.1)
GDP + Thioredoxin → dGDP + Thioredoxin disulfide +H2O C00361 0.77.4.7.0

Biology 2021, 10, 5 8 of 18
Table 1. Cont.
Substrate KEGG ID Reaction ID Enzyme Name (E.C. Number) Definition Product KEGGID MBB ID
C00112 R02024 ribonucleoside diphosphate reductase(1.17.4.1)
Thioredoxin + CDP → dCDP + Thioredoxin disulfide +H2O C00705 0.77.4.5
C00197 R01512 r phosphoglycerate kinase (2.7.2.3) ATP + 3-Phospho-D-glycerate ↔ ADP +3-Phospho-D-glyceroyl phosphate C00236 0.77.4.0
C00631 R01518 rphosphoglycerate mutase
(2,3-diphosphoglycerate-independent)(5.4.2.12)
2-Phospho-D-glycerate ↔ 3-Phospho-D-glycerate C00197 0.77.4.0
C00199 R01529 r ribulose-phosphate 3-epimerase (5.1.3.1) D-Ribulose 5-phosphate ↔ D-Xylulose 5-phosphate C00231 0.77.4.0
C00118 + C05382 R01641 r transketolase (2.2.1.1)Sedoheptulose 7-phosphate + D-Glyceraldehyde
3-phosphate ↔ D-Ribose 5-phosphate + D-Xylulose5-phosphate
C00117 + C00231 0.77.4.0
C00063 + C00416 R01799 r phosphatidate cytidyltransferase (2.7.7.41) CTP + Phosphatidate → Diphosphate +CDP-diacylglycerol C00269 0.5
C00065 + C00269 R01800 phosphatidylserine synthase (2.7.8.8) -diacylglycerol + L-Serine → CMP +Phosphatidylserine C00055 + C02737 0.4
C00279 + C00111 R01829 fructose-1,6-bisphosphate aldolase (4.1.2.13) Glycerone phosphate + D-Erythrose 4-phosphate →Sedoheptulose 1,7-bisphosphate C00447 0.77.4.0
C00118 + C05345 R01830 r transketolase (2.2.1.1)beta-D-Fructose 6-phosphate + D-Glyceraldehyde
3-phosphate → D-Erythrose 4-phosphate + D-Xylulose5-phosphate
C00231 + C00279 0.77.4.0
C00363 R02093 r nucleoside diphosphate kinase (2.7.4.6) ATP + dTDP ↔ ADP + dTTP C00459 0.81.0
C00364 R02094 r thymidine monophosphate kinase (2.7.4.9) ATP + dTMP ↔ ADP + dTDP C00363 0.81.0
C00365 R02098 r thymidine monophosphate kinase (2.7.4.9) ATP + dUMP ↔ ADP + dUDP C01346 0.77.4.1
C00143 + C00365 R02101 thymidylate synthase (2.1.1.45) dUMP + 5,10-Methylenetetrahydrofolate →Dihydrofolate + dTMP C00364 + C00415 0.79.0
C00040 + C00681 R02241 1-acyl-sn-glycerol-3-phosphate acyltransferase(2.3.1.51)
1-Acyl-sn-glycerol 3-phosphate + Acyl-CoA →Phosphatidate + CoA C00416 0.7
C00458 R02325 dCTP deaminase (3.5.4.13) dCTP + H2O → dUTP + Ammonia C00460 0.77.4.4
Biology 2021, 10, 5 9 of 18
Table 1. Cont.
Substrate KEGG ID Reaction ID Enzyme Name (E.C. Number) Definition Product KEGGID MBB ID
C00705 R02326 r nucleoside diphosphate kinase (2.7.4.6) ATP + dCDP ↔ ADP + dCTP C00458 0.77.4.3
C01346 R02331 r nucleoside diphosphate kinase (2.7.4.6) ATP + dUDP ↔ ADP + dUTP C00460 0.77.4.1
C02737 R02055 phosphatidylserine decarboxylase (4.1.1.65) Phosphatidylserine → Phosphatidylethanolamine +CO2
C00350 0.3
C00504 R02235|R02236 r dihydrofolate reductase (1.5.1.3) Folate + NADH + H+ ↔ Dihydrofolate + NAD+ C00415 0.79.0
C03150 R02324 ribosylnicotinamide kinase (2.7.1.22) ATP + Nicotinamide-beta-riboside → ADP +Nicotinamide D-ribonucleotide C00455 0.80.0
C00031 R02738 protein-Npi-phosphohistidine—D-glucosephosphotransferase (2.7.1.199)
Protein N(pi)-phospho-L-histidine + D-Glucose →Protein histidine + alpha-D-Glucose 6-phosphate C00668 0.15
C00668 R02740 r glucose-6-phosphate isomerase (5.3.1.9) alpha-D-Glucose 6-phosphate ↔ beta-D-Fructose6-phosphate C05345 0.77.4.0
C00831 R02971 pantetheine kinase (2.7.1.34) ATP + Pantetheine → ADP + Pantetheine 4’-phosphate C01134 0.16
C00864 R03018 pantothenate kinase (2.7.1.33) ATP + Pantothenate → ADP +D-4’-Phosphopantothenate C03492 0.19
C01134 R03035 r pantetheine-phosphate adenylyltransferase(2.7.7.3)
ATP + Pantetheine 4’-phosphate → Diphosphate +Dephospho-CoA C00882 0.1
C03492 R04231 r phosphopantothenoylcysteine synthetase(6.3.2.5)
CTP + D-4’-Phosphopantothenate + L-Cysteine ↔ CMP+ Diphosphate +
(R)-4’-Phosphopantothenoyl-L-cysteineC04352 0.18
C04079 R04391 r pantothenate kinase (2.7.1.33) ATP + N-((R)-Pantothenoyl)-L-cysteine ↔ ADP +(R)-4’-Phosphopantothenoyl-L-cysteine C04352 3415
C05345 R04779 r 6-phosphofructokinase (2.7.1.11) ATP + beta-D-Fructose 6-phosphate ↔ ADP +beta-D-Fructose 1,6-bisphosphate C05378 0.77.4.0
C04352 R03269 phosphopantothenoylcysteine decarboxylase(4.1.1.36)
(R)-4’-Phosphopantothenoyl-L-cysteine → Pantetheine4’-phosphate C01134 0.17
C05382 R01843 r 6-phosphofructokinase (2.7.1.11) ATP + Sedoheptulose 7-phosphate ↔ ADP +Sedoheptulose 1,7-bisphosphate C00447 0.77.4.0

Biology 2021, 10, 5 10 of 18
Figure 2. The reaction graph of the proposed theoretical minimal metabolic network represented in Figure 1, obtained us-ing data from the KEGG database. The yellow filled circles are the reactions with their KEGG ID and E.C. numbers,and the purple filled circles are the reverse reaction of the yellow filled circles, when appropriate. Line colors denotemetabolic categories. A full-size representation can be seen as Figure S1.

Biology 2021, 10, 5 11 of 18
Biology 2020, 9, x 11 of 17
Figure 3. m‐DAG of the metabolism of a theoretical minimal bacterial cell. Single reactions appear in yellow, contracted
MBBs in grey, and the essential reactions as hexagons with double lines. Line colors denote metabolic categories. MBB
0.79.0 is zoomed in as an example of how a strongly connected component, which is a cyclic subgraph formed by 7 reac‐
tions and 7 compounds, is reduced to one node in our m‐DAG.
Table 2. Essential reactions of the m‐DAG constructed from the theoretical minimal gene set ma‐
chinery needed for life.
Reaction ID Metabolic Pathway
R02019 Purine metabolism
R02017
R00571/R00573
Pyrimidine metabolism R02024
R02325
R00851 Glycerolipid metabolism, Glycerophospholipid
metabolism R02241
R01799 Glycerophospholipid metabolism
R01800
Figure 3. m-DAG of the metabolism of a theoretical minimal bacterial cell. Single reactions appear in yellow, contractedMBBs in grey, and the essential reactions as hexagons with double lines. Line colors denote metabolic categories. MBB 0.79.0is zoomed in as an example of how a strongly connected component, which is a cyclic subgraph formed by 7 reactions and7 compounds, is reduced to one node in our m-DAG.
This methodology gave us a resulting reaction graph with some redundancies(i.e., different enzymes encoded by orthologous genes participating in the same metabolic path-ways), so we manually curated this graph to include only one copy of each reaction andtheir corresponding metabolites needed for a functional cell. The reaction graph obtained iscomposed of 98 reactions and 80 metabolites (Figure 2). The fact that our model replicatesalmost entirely the figure of Gabaldón et al. (2007) [19] (Figure 1), validates our methodol-ogy. Table 1 presents the complete list of reactions, substrate, and product compounds aswell as their KEGG identifiers used to reconstruct the minimal metabolic network.

Biology 2021, 10, 5 12 of 18
3.2. The MetaDAG Methodology: Analysis of the Composition and Connectivity of a Network ata Glance
Despite the fact that the reaction graph of the theoretical minimal organism constructedin this work has only 98 reactions and 80 metabolites, it is difficult to visualize the detailedrelationships between the reactions that make up the network’s connectivity (Figure 2).To solve this problem, we used the MetaDAG methodology [21] to generate an m-DAG ofthe manually curated reaction graph. An m-DAG is a suitable reduction of a metabolic net-work. Namely, the reactions that are connected by multiple paths, which are the stronglyconnected components of the metabolic network, are contracted into one single MBB,which can be considered a robust subgraph in the reaction graph. Moreover, those MBBsthat only represent a reaction that is not biconnected to any other reaction are essentialto maintain the network connectivity. In this sense, the m-DAG provides a modularityof the reaction graph that keeps the information of robustness and connectivity of themetabolic network.
The m-DAG we obtained from the minimal metabolic reaction graph (Table 1, Figure 3)has a total of 36 nodes, 25 of them corresponding to single reactions (yellow nodes) and11 to contracted MBBs (gray nodes). Clearly, there are seven connected components inthis network, the biggest one covering the central metabolism of the hypothetical minimalorganism, while the rest are the reactions that synthesize the essential cofactors needed forthe proper functionality of the complete cell.
In addition, essential reactions (i.e., those whose removal reduces the network’sconnectivity increasing the number of connected components) can be easily identifiedusing this approach (hexagons with double lines in Figure 3). Table 2 is a list of the12 essential reactions we found in the minimal metabolic network under study and themetabolic pathways where they participate. They are involved in purine and pyrimidinemetabolism, glycerophospholipid metabolism, glycolysis and pantothenate, and CoAbiosynthesis. Purines and pyrimidines are the most abundant metabolic substrates forall living organisms. They are essential components for the synthesis of DNA and RNA,and they also participate in the biosynthesis of energy nucleotides and are vital cofactorsfor cell survival and reproduction. Hence, purines and their by-products widely participatein biological processes. Glycerophospholipids are pivotal structural components of thecell membranes, but they are also precursors of many essential biological molecules andparticipate in cell signaling and other cellular processes [24]. Glycolysis is the first stepin the breakdown of glucose to extract energy for cellular metabolism by creating high-energy molecules. It is considered an ancient metabolic pathway [25], and its prevalence inorganisms is nearly ubiquitous.
Table 2. Essential reactions of the m-DAG constructed from the theoretical minimal gene set machin-ery needed for life.
Reaction ID Metabolic Pathway
R02019Purine metabolismR02017
R00571/R00573Pyrimidine metabolismR02024
R02325
R00851 Glycerolipid metabolism, Glycerophospholipid metabolismR02241
R01799 Glycerophospholipid metabolismR01800
R00200 Glycolysis, part of the pyruvate metabolism
R04231 Pantothenate and CoA biosynthesisR03269

Biology 2021, 10, 5 13 of 18
We consider that what we call “essential reactions”, easily highlighted by theMetaDAG methodology, can be of crucial importance in many fields of research. Proba-bly, the most logical and of vital importance is the idea that these reactions can help chooseenzymes as potential drug targets, since the removal of these reactions breaks metabolicpathways, which can lead to the unviability of a cell. Considering that m-DAGs take intoaccount complete genomes, and even complementary genomes (they can be calculated fortwo or more genomes together, to simulate complementary metabolic pathways withinconsortia), the resulting essential reactions are trustworthy in a sense that researchers mightoverlook an enzyme doing the same job as the one highlighted and, if they find it, it wouldbe a new discovery not previously described for a specific metabolic pathway.
3.3. The m-DAG of “Candidatus Nasuia Deltocephalinicola”
In the case of a minimal metabolic network, each item included in the list of reactionsand compounds is hypothetically essential for survival. When we extrapolate these re-sults to living organisms possessing natural minimized genomes, such as pathogens ormutualist endosymbiotic bacteria, we should consider that their metabolism is a patch-work dependent on the host and, in many cases, also dependent on other bacteria withwhich they live in consortia. Therefore, the study of their networks’ connectivity has thepotential of pointing out genes encoding critical steps that connect the different partners ina given pathway. Subsequently, the genes that encode those reactions can become targetsfor genetic engineering, and/or for mechanisms intended to regulate the cell metabolism;additionally, they might also have the potential to destroy the stability of the relationship,even killing the undesired organism in a parasitic relationship.
In order to compare the in silico minimal m-DAG with the m-DAG from a livingorganism with a naturally reduced genome, we constructed the m-DAG of “Ca. Na-suia deltocephalinicola” str. NAS-ALF (from now on referred to as Nasuia for simplic-ity; Supplementary Figure S2), one of the obligate endosymbiotic bacteria of the asterleafhopper Macrosteles quadrilineatus [22]. This endosymbiont possesses the smallest nat-ural genome known so far, comprising 112,091 bp and only 138 protein-coding genesidentified. The metabolic data needed to generate this m-DAG, including the completelist of its enzymes, reactions, and compoundswere also obtained from the KEGG database(Table S2). Nasuia’s m-DAG comprises 29 nodes included in 12 connected components,with 7 MBBs and 22 single reactions. Regarding the single reactions, five are essential(summarized in Table 3).
Table 3. Essential reactions of the m-DAG of “Ca. Nasuia deltocephalinicola” str. NAS-ALF.
Reaction ID Metabolic Pathway
R09372 Selenocompound metabolismR00443 Purine metabolism, Glycerophospholipid metabolismR03012 Histidine metabolismR01163 Histidine metabolismR01288 Cysteine and methionine metabolism, Sulfur metabolism
It has been estimated that more than 60% of insects possess symbiotic bacteria insidetheir body tissues, and/or very often in a specialized cell type called bacteriocyte [26].When these bacteria become endosymbionts, they lose their ability to interact with otherorganisms. Additionally, they become dependent on their respective hosts, and theirgenome is significantly reduced by the deletion of genes that become redundant or that arenot needed in a rich environment such as the one they encounter within their hosts [15,27].In addition, even though the niche is significantly rich for them, the insect host generallyhas a very incomplete diet by feeding on plant sap or seeds, or blood from mammals,so the bacteria become their helpers for the production of essential amino acids, fattyacids, or vitamins [28,29]. The essential reactions of Nasuia’s m-DAG reveal exactly that.This organism works as a factory of the vitamins and amino acids that M. quadrilineatus
Biology 2021, 10, 5 14 of 18
needs to survive. Moreover, this bacterium is part of a consortium with “Candidatus Sulciamuelleri” str. ALF [22]. It is widely accepted that the endosymbiotic relationship betweeninsects and bacteria, dating from 10 to several hundred millions of years, allowed theproliferation of insects and their diversification in almost any ecological niche [30,31].Obviously, if the reactions that link the metabolic routes disappear (either naturally or dueto targeted modification of those genes), this association would be affected to the point ofthe possible death of the host.
A direct comparison between the reactions and compounds that make up the in silicom-DAGs of the theoretical minimal cell and Nasuia would not be significant due to theirdissimilar lifestyles. What we can easily assess is the topology of the networks. At firstglance, it is striking that the smallest genome found in nature has fewer nodes than the insilico m-DAG. The dependence of this endosymbiotic bacteria to its host and to its secondco-obligate endosymbiont explains this phenomenon.
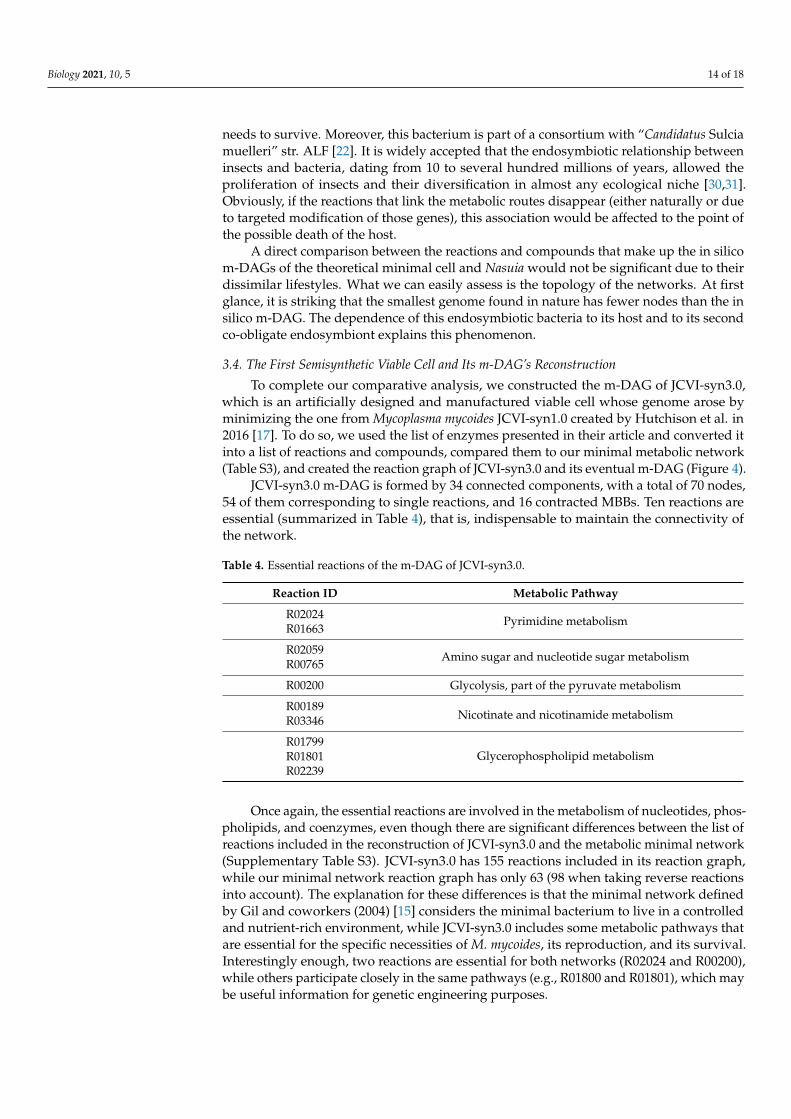
3.4. The First Semisynthetic Viable Cell and Its m-DAG’s Reconstruction
To complete our comparative analysis, we constructed the m-DAG of JCVI-syn3.0,which is an artificially designed and manufactured viable cell whose genome arose byminimizing the one from Mycoplasma mycoides JCVI-syn1.0 created by Hutchison et al. in2016 [17]. To do so, we used the list of enzymes presented in their article and converted itinto a list of reactions and compounds, compared them to our minimal metabolic network(Table S3), and created the reaction graph of JCVI-syn3.0 and its eventual m-DAG (Figure 4).
JCVI-syn3.0 m-DAG is formed by 34 connected components, with a total of 70 nodes,54 of them corresponding to single reactions, and 16 contracted MBBs. Ten reactions areessential (summarized in Table 4), that is, indispensable to maintain the connectivity ofthe network.
Table 4. Essential reactions of the m-DAG of JCVI-syn3.0.
Reaction ID Metabolic Pathway
R02024 Pyrimidine metabolismR01663
R02059 Amino sugar and nucleotide sugar metabolismR00765
R00200 Glycolysis, part of the pyruvate metabolism
R00189Nicotinate and nicotinamide metabolismR03346
R01799Glycerophospholipid metabolismR01801
R02239
Once again, the essential reactions are involved in the metabolism of nucleotides, phos-pholipids, and coenzymes, even though there are significant differences between the list ofreactions included in the reconstruction of JCVI-syn3.0 and the metabolic minimal network(Supplementary Table S3). JCVI-syn3.0 has 155 reactions included in its reaction graph,while our minimal network reaction graph has only 63 (98 when taking reverse reactionsinto account). The explanation for these differences is that the minimal network definedby Gil and coworkers (2004) [15] considers the minimal bacterium to live in a controlledand nutrient-rich environment, while JCVI-syn3.0 includes some metabolic pathways thatare essential for the specific necessities of M. mycoides, its reproduction, and its survival.Interestingly enough, two reactions are essential for both networks (R02024 and R00200),while others participate closely in the same pathways (e.g., R01800 and R01801), which maybe useful information for genetic engineering purposes.

Biology 2021, 10, 5 15 of 18
Biology 2020, 9, x 14 of 17
Figure 4. m‐DAG of the metabolism of JCVI‐syn3.0. Single reactions appear in yellow, contracted MBBs in grey, and the
essential reactions as hexagons with double lines.
Once again, the essential reactions are involved in the metabolism of nucleotides,
phospholipids, and coenzymes, even though there are significant differences between the
list of reactions included in the reconstruction of JCVI‐syn3.0 and the metabolic minimal
network (Supplementary Table S3). JCVI‐syn3.0 has 155 reactions included in its reaction
graph, while our minimal network reaction graph has only 63 (98 when taking reverse
reactions into account). The explanation for these differences is that the minimal network
defined by Gil and coworkers (2004) [15] considers the minimal bacterium to live in a
controlled and nutrient‐rich environment, while JCVI‐syn3.0 includes some metabolic
pathways that are essential for the specific necessities of M. mycoides, its reproduction, and
its survival. Interestingly enough, two reactions are essential for both networks (R02024
and R00200), while others participate closely in the same pathways (e.g., R01800 and
R01801), which may be useful information for genetic engineering purposes.
3.5. Resemblance of the MBBs of the Minimal m‐DAGs
In order to contrast the MBBs of the three m‐DAGs constructed in this study, Table 5
shows the correspondence among them. The list of enzymes and the definition of each
reaction is presented in Supplementary Table S4.
Figure 4. m-DAG of the metabolism of JCVI-syn3.0. Single reactions appear in yellow, contracted MBBs in grey, and theessential reactions as hexagons with double lines.
3.5. Resemblance of the MBBs of the Minimal m-DAGs
In order to contrast the MBBs of the three m-DAGs constructed in this study, Table 5shows the correspondence among them. The list of enzymes and the definition of eachreaction is presented in Supplementary Table S4.

Biology 2021, 10, 5 16 of 18
Table 5. Comparison of the MBBs of the three networks under study. Every row lists the reactions belonging to thecorresponding MBB and the enzymes involved in those reactions. The list includes only MBBs composed of at least threereactions (reverse included) or with fewer reactions but that are shared by at least two of the networks under study.
Model Cell MBB ID # Reactions Reaction ID
Minimal cell
0.77.4.0 21
R00156 (2.7.4.6) r, R00158 (2.7.4.22) r, R00332 (2.7.4.8) r, R00430 (2.7.1.40) r,R00658 (4.2.1.11) r, R00842|R00844 (1.1.1.94) r, R00966 (2.4.2.9) r, R01049
(2.7.6.1) r, R01056 (5.3.1.6) r, R01061 (1.2.1.12) r, R01070 (4.1.2.13) r, R01229(2.4.2.8) r, R01512 (2.7.2.3) r, R01518 (5.4.2.12) r, R01529 (5.1.3.1) r, R01641(2.2.1.1) r, R01829 (4.1.2.13), R01830 (2.2.1.1) r, R01843 (2.7.1.11) r, R02740
(5.3.1.9) r, R04779 (2.7.1.11)
0.77.4.1 2 R02098(2.7.4.9) r, R02331 (2.7.4.6) r
0.77.4.2 2 R00512(2.7.4.25) r, R00570 (2.7.4.6) r
0.77.4.7.0 1 R02019 (1.17.4.1)
0.78.1.0 2 R00127 (2.7.4.3) r, R00190 (2.4.2.7) r
0.78.1.1 1 R01138(2.7.1.40) r
0.78.1.2 1 R02017 (1.17.4.1)
0.79.0 4 R00936|R00939 (1.5.1.3) r, R00945 (2.1.2.1) r, R02101 (2.1.1.45),R02235|R02236 (1.5.1.3) r
0.80.1.0 1 R00137 (2.7.7.18) r
0.81.0 2 R02093 (2.7.4.6) r, R02094 (2.7.4.9) r
JCVI-syn 3.0
0.39 6 R00014 (1.2.4.1), R00230 (2.3.1.8) r, R00315 (2.7.2.1) r, R02569 (2.3.1.12) r,R03270 (1.2.4.1), R07618 (1.8.1.4) r
0.40 3 R01126 (3.1.3.5), R01132 (2.4.2.8) r, R01863 (2.4.2.1) r
0.41 3 R02142 (2.4.2.8) r, R02297 (2.4.2.1) r, R02719 (3.1.3.5)
0.42 2 R00921 (2.3.1.8) r, R01353 (2.7.2.1) r
0.77.4.2.0 1 R00512 (2.7.4.25) r
0.77.4.7 49
R00158 (2.7.4.22) r, R00289 (2.7.7.9) r, R00291 (5.1.3.2) r,R00332 (2.7.4.8)r,R00430 (2.7.1.40) r, R00505 (5.4.99.9) r,R00658 (4.2.1.11) r, R00959 (5.4.2.5)
r,R00966 (2.4.2.9) r, R01015 (5.3.1.1) r,R01049 (2.7.6.1) r,R01056 (5.3.1.6) r,R01057 (5.4.2.7) r, R01058 (1.2.1.9), R01061 (1.2.1.12) r, R01066 (4.1.2.4) r,R01067 (2.2.1.1), R01068 (4.1.2.13) r,R01070 (4.1.2.13) r, R01227 (3.1.3.5),R01229 (2.4.2.7)r, R01229 (2.4.2.8) r,R01512 (2.7.2.3) r,R01518 (5.4.2.12)
r,R01529 (5.1.3.1) r,R01641 (2.2.1.1) r, R01819 (5.3.1.8) r, R01827 (2.2.1.2) r,R01829 (4.1.2.13),R01830 (2.2.1.1) r,R01843 (2.7.1.11) r, R01967 (2.7.1.113) r,
R01968 (3.1.3.5)r, R01969 (2.4.2.1) r, R02018 (1.17.4.1),R02019 (1.17.4.1),R02090 (2.7.4.8) r, R02098 (2.7.4.9) r, R02099 (2.7.1.21), R02102 (3.1.3.5),
R02102 (3.1.3.89), R02147 (2.4.2.1) r, R02484 (2.4.2.1), R02568 (4.1.2.13) r,R02739 (5.3.1.9) r,R02740 (5.3.1.9) r, R02749 (5.4.2.7) r, R03321 (5.3.1.9) r,
R04779 (2.7.1.11)
0.77.4.8 5 R01664 (3.1.3.5), R01664 (3.1.3.89), R01665 (2.7.4.25) r, R01666 (2.7.1.74),R01667 (3.6.1.12)
0.78.1 12R00127 (2.7.4.3) r, R00183 (3.1.3.5), R00185 (2.7.1.74) r, R00190 (2.4.2.7) r,
R01138 (2.7.1.40) r, R01547 (2.7.4.11) r, R01547 (2.7.4.3) r, R01561 (2.4.2.1) r,R02017 (1.17.4.1), R02088 (3.1.3.5) r, R02089 (2.7.1.76), R02557 (2.4.2.1) r
0.79.1 6 R00942 (6.3.2.17) r, R00945 (2.1.2.1) r, R01220 (1.5.1.5) r, R01655 (3.5.4.9) r,R03940 (2.1.2.9), R04241 (6.3.2.17) r
0.80.1 4 R00137 (2.7.7.18) r, R01271 (2.4.2.12) r, R02294 (2.4.2.1) r, R02323 (3.1.3.5)
0.81.1 4 R01567 (2.7.1.21), R01569 (3.1.3.5), R01569 (3.1.3.89), R02094 (2.7.4.9) r
Nasuia0.77.0 2 R00435 (2.7.7.6) r, R00441 (2.7.7.6) r
0.78.0 2 R00375 (2.7.7.7) r, R00376 (2.7.7.7) r
Reversible reactions are denoted by the superscript r. Reactions depicted in blue are shared by the minimal and the synthetic (JCVI-syn3.0)metabolic networks. #: number of.
Biology 2021, 10, 5 17 of 18
4. Conclusions
The construction of the minimal metabolic reaction graph and its consequent m-DAGpresented in this work can be of great use in the field of synthetic biology. The compositionof compounds and reactions that we present can easily be extrapolated to any phylogeneti-cally diverse bacteria of interest considering that we did not focus specifically on genes.Chemistry and molecular biology technologies are also thriving. Thus, the in silico designof bacteria with the small number of metabolic genes described in this paper may be morefeasible than previously thought.
Supplementary Materials: The following are available online at https://www.mdpi.com/2079-7737/10/1/5/s1, Figure S1: Full size representation of the reaction graph of the proposed theoreticalminimal metabolic network represented in Figure 2; Figure S2: The m-DAG of “Ca. Nasuia delto-cephalinicola” str. NAS-ALF; Table S1: List of enzymes and reactions modified from Gabaldón et al.(2007) [19]; Table S2: Reactions and compounds that make up the m-DAG of “Ca. Nasuia delto-cephalinicola” str. NAS-ALF; Table S3: Reactions included in the reconstruction of the JCVI-syn3.0reaction graph and the minimal organism constructed for this work and the pathways in which eachreaction (can) participates. Table S4: Names of the enzymes and definition of each reaction involvedin the comparison of the MBBs of the three networks under study.
Author Contributions: Conceptualization, all authors; methodology, M.R.-P., R.G., M.L. and P.P.-R.;software, M.R.-P., M.L. and P.P.-R.; validation, M.R.-P., M.L. and R.G.; formal analysis, all authors;data curation, M.R.-P., R.G., M.L., and P.P.-R.; writing-original draft preparation, M.R.-P., R.G.and M.L.; writing—review and editing, all authors; supervision and project administration, A.M.;funding acquisition, R.G., M.L. and A.M. All authors have read and agreed to the published versionof the manuscript.
Funding: This research was funded by the Spanish Ministry of Science, Innovation and Universities(MICINN/AEI, projects DPI2015-67082-P and PGC2018-096956-B-C43) the Spanish Ministry ofEconomy and Competitiveness (projects SAF2015-65878-R and PGC2018-099344-B-I00), GeneralitatValenciana (project Prometeo/2018/A133), and co-financed by the European Regional DevelopmentFund (ERDF). M.R.-P. is a recipient of a grant from the National Board of Science and Technology ofMéxico (CONACYT) [grant number 538243]. The funders had no role in study design, data collection,and analysis, decision to publish, or preparation of any of the work.
Data Availability Statement: All data is contained within this article or its own supplementary ma-terial.
Conflicts of Interest: The authors declare no conflict of interest.
References1. Moya, A.; Gil, R.; Latorre, A.; Peretó, J.; Garcillán-Barcia, M.P.; De La Cruz, F. Toward minimal bacterial cells: Evolution vs.
design. FEMS Microbiol. Rev. 2009, 33, 225–235. [CrossRef] [PubMed]2. Luisi, P.L. Toward the engineering of minimal living cells. Anat. Rec. Adv. Integr. Anat. Evol. Biol. 2002, 268, 208–214. [CrossRef]
[PubMed]3. Luisi, P.L.; Ferri, F.; Stano, P. Approaches to semi-synthetic minimal cells: A review. Naturwissenschaften 2005, 93, 1–13. [CrossRef]
[PubMed]4. Xavier, J.C.; Patil, K.R.; Rocha, I. Systems Biology Perspectives on Minimal and Simpler Cells. Microbiol. Mol. Biol. Rev. 2014,
78, 487–509. [CrossRef]5. Stano, P.; Luisi, P.L. On the Construction of Minimal Cell Models in Synthetic Biology and Origins of Life Studies. In Design and
Analysis of Biomolecular Circuits; Springer Science and Business Media LLC: Berlin/Heidelberg, Germany, 2011; pp. 337–368.6. Bedau, M.A.; Parke, E.C.; Tangen, U.; Hantsche-Tangen, B. Social and ethical checkpoints for bottom-up synthetic biology,
or protocells. Syst. Synth. Biol. 2009, 3, 65–75. [CrossRef]7. Mantri, S.; Sapra, K.T. Evolving protocells to prototissues: Rational design of a missing link. Biochem. Soc. Trans. 2013,
41, 1159–1165. [CrossRef]8. Stano, P. Is Research on Synthetic Cells. Moving to the Next Level? Life 2018, 9, 3. [CrossRef]9. Glass, J.I.; Merryman, C.; Wise, K.S.; Hutchison, C.A.; Smith, H.O. Minimal Cells—Real and Imagined. Cold Spring Harb. Perspect. Biol.
2017, 9, a023861. [CrossRef]10. Gil, R. The Minimal Gene-Set Machinery. In Encyclopedia of Molecular Cell Biology and Molecular Medicine; Wiley: Hoboken, NJ, USA,
2014; pp. 1–36.
Biology 2021, 10, 5 18 of 18
11. Luo, H.; Lin, Y.; Gao, F.; Zhang, Z.; Zhang, R. DEG 10, an update of the database of essential genes that includes both protein-coding genes and noncoding genomic elements: Table 1. Nucleic Acids Res. 2014, 42, D574–D580. [CrossRef]
12. Acevedo-Rocha, C.G.; Fang, G.; Schmidt, M.; Ussery, D.W.; Danchin, A. From essential to persistent genes: A functional approachto constructing synthetic life. Trends Genet. 2013, 29, 273–279. [CrossRef]
13. Gil, R.; Silva, F.J.; Zientz, E.; Delmotte, F.; González-Candelas, F.; Latorre, A.; Rausell, C.; Kamerbeek, J.; Gadau, J.; Höll-dobler, B.; et al. The genome sequence of Blochmannia floridanus: Comparative analysis of reduced genomes. Proc. Natl. Acad.Sci. USA 2003, 100, 9388–9393. [CrossRef] [PubMed]
14. Mushegian, A.; Koonin, E.V. A minimal gene set for cellular life derived by comparison of complete bacterial genomes. Proc. Natl.Acad. Sci. USA 1996, 93, 10268–10273. [CrossRef] [PubMed]
15. Gil, R.; Silva, F.J.; Peretó, J.; Moya, A. Determination of the Core of a Minimal Bacterial Gene Set. Microbiol. Mol. Biol. Rev. 2004,68, 518–537. [CrossRef] [PubMed]
16. Jewett, M.C.; Forster, A.C. Update on designing and building minimal cells. Curr. Opin. Biotechnol. 2010, 21, 697–703. [CrossRef][PubMed]
17. A Hutchison, C.; Chuang, R.-Y.; Noskov, V.N.; Assad-Garcia, N.; Deerinck, T.J.; Ellisman, M.H.; Gill, J.; Kannan, K.; Karas, B.J.;Ma, L.; et al. Design and synthesis of a minimal bacterial genome. Science 2016, 351, aad6253. [CrossRef] [PubMed]
18. Venetz, J.E.; Del Medico, L.; Wölfle, A.; Schächle, P.; Bucher, Y.; Appert, D.; Tschan, F.; Flores-Tinoco, C.E.; Van Kooten, M.;Guennoun, R.; et al. Chemical synthesis rewriting of a bacterial genome to achieve design flexibility and biological functionality.Proc. Natl. Acad. Sci. USA 2019, 116, 8070–8079. [CrossRef]
19. Gabaldón, T.; Peretó, J.; Montero, F.; Gil, R.; Latorre, A.; Moya, A. Structural analyses of a hypothetical minimal metabolism.Philos. Trans. R. Soc. B Biol. Sci. 2007, 362, 1751–1762. [CrossRef]
20. Glass, J.I.; Assad-Garcia, N.; Alperovich, N.; Yooseph, S.; Lewis, M.R.; Maruf, M.; Iii, C.A.H.; Smith, H.O.; Venter, J.C. Essentialgenes of a minimal bacterium. Proc. Natl. Acad. Sci. USA 2006, 103, 425–430. [CrossRef]
21. Alberich, R.; Castro, J.A.; Llabrés, M.; Rodríguez, P.P. Metabolomics analysis: Finding out metabolic building blocks. PLoS ONE2017, 12, e0177031. [CrossRef]
22. Bennett, G.M.; Moran, N.A. Small, Smaller, Smallest: The Origins and Evolution of Ancient Dual Symbioses in a Phloem-Feeding Insect. Genome Biol. Evol. 2013, 5, 1675–1688. [CrossRef]
23. Reyes-Prieto, M.; Vargas-Chávez, C.; Llabrés, M.; Palmer, P.; Latorre, A.; Moya, A. An update on the Symbiotic GenomesDatabase (SymGenDB): A collection of metadata, genomic, genetic and protein sequences, orthologs and metabolic networks ofsymbiotic organisms. Database 2020, 2020. [CrossRef] [PubMed]
24. Alvarez, A.F.; Georgellis, D. Bacterial Lipid Domains and Their Role in Cell Processes. In Biogenesis of Fatty Acids, Lipids andMembranes; Springer Science and Business Media LLC: Berlin/Heidelberg, Germany, 2019; pp. 575–592.
25. Romano, A.; Conway, T. Evolution of carbohydrate metabolic pathways. Res. Microbiol. 1996, 147, 448–455. [CrossRef]26. Weinert, L.A.; Araujo-Jnr, E.V.; Ahmed, M.Z.; Welch, J.J. The incidence of bacterial endosymbionts in terrestrial arthropods.
Proc. R. Soc. B Boil. Sci. 2015, 282, 20150249. [CrossRef] [PubMed]27. Toft, C.; Andersson, S.G.E. Evolutionary microbial genomics: Insights into bacterial host adaptation. Nat. Rev. Genet. 2010,
11, 465–475. [CrossRef] [PubMed]28. Douglas, A.E. The microbial dimension in insect nutritional ecology. Funct. Ecol. 2009, 23, 38–47. [CrossRef]29. Vigneron, A.; Masson, F.; Vallier, A.; Balmand, S.; Rey, M.; Vincent-Monégat, C.; Aksoy, E.; Aubailly-Giraud, E.; Zaidman-Rémy, A.;
Heddi, A. Insects Recycle Endosymbionts when the Benefit is Over. Curr. Biol. 2014, 24, 2267–2273. [CrossRef]30. Tamas, I. 50 Million Years of Genomic Stasis in Endosymbiotic Bacteria. Science 2002, 296, 2376–2379. [CrossRef]31. McCutcheon, J.P.; McDonald, B.R.; Moran, N.A. Convergent evolution of metabolic roles in bacterial co-symbionts of insects.
Proc. Natl. Acad. Sci. USA 2009, 106, 15394–15399. [CrossRef]