the merits of a global equity income approach · investments and/or higher-yielding assets may...
TRANSCRIPT

The Merits of a Global Equity Income Approach
Ramona PersaudPortfolio Manager
Naveed RahmanInstitutional Portfolio Manager
Srinivas VemparalaQuantitative Analyst
key takeaways
• Inefficient global equity markets present ample opportunities for diversified alpha generation.
• A global equity income approach is a conservative means of capturing this alpha, with lower volatil-ity income prioritized over higher volatility capital appreciation in total returns. Income compounding drives the conservative nature of the approach.
• A global equity income approach can offer higher dividend yields, breadth in sector and regional income sources, and higher risk-adjusted returns relative to U.S. equity income, while also potentially providing traditional equity income characteristics, such as lower than market volatility, risk diversification, infla-tion protection, and relative downside protection.
• Effective global equity income approaches focus on companies with competitive advantages that drive above-average returns and reliable cash flow generation, which, when combined with prudent capital allocation, greatly support current and future dividend payments.
April 2012
two major U.s. bear markets during the past decade and a significant increase in volatility during the past five years have created new challenges for many investors. Historically low U.s. investment-grade bond yields now cause many U.s. investors to seek higher income outside of traditional fixed-income sources. accelerating central bank money printing in the developed world may also cause many U.s. investors to be wary of inflation, driving a search for income that can grow in real terms, especially rela-tive to their fixed income alternatives. against this backdrop, U.s. investors seeking lower-volatility equity investments and/or higher-yielding assets may consider the merits of a global equity income approach.
why invest in global equities?Global markets are inefficientGlobalization seems to be making the world less U.S. centric and more balanced through the blurring of national boundaries, especially as it relates to economic activity. This “re-balancing” is evidenced by a steady decline of U.S. share of global economic output and global equity market capitalization (see Exhibit 1, below).1
But, even though both of these metrics suggest a wider range of contributors to global economic output today versus the past, global equity markets have yet to reflect the full extent of the trend toward a less
leadership series | market research
U.S. ShARE of globAl gdP ANd globAl EqUIty mARkEt cAPItAlIzAtIoN
ExhIbIt 1: the world is becoming less U.S. centric and more balanced, but global markets are still
inefficient, as seen from the U.S. representing less than 20% of global economic output but still close
to 50% of global equity markets.
Period referenced: 1 A.D. to Dec. 30, 2008. U.S. Share of Global Equity Market: U.S. share of Morgan Stanley Capital International (MSCI) World Index. *See page 7 for index definition. GDP: Gross domestic product. Source: Angus Maddison, University of Groningen - The World Economy: Historical Statistics, 1990 Intn’l GK$.**
0
10
20
30
40
50
60
1 1952 1964 1976 2000
U.S. Share of Global GDP (%)U.S. Share of Global Equity Market (%)
70
0
10
20
30
40
50
60
70
1988
2
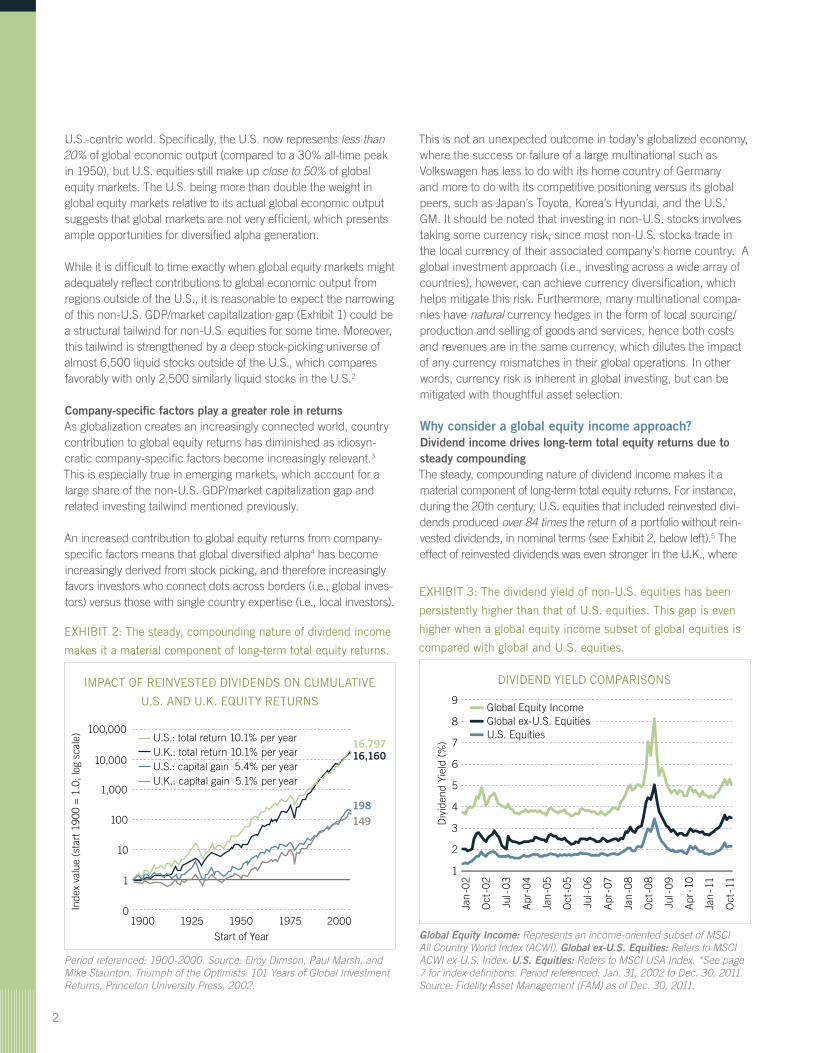
ExhIbIt 2: the steady, compounding nature of dividend income
makes it a material component of long-term total equity returns.
Period referenced: 1900-2000. Source: Elroy Dimson, Paul Marsh, and Mike Staunton, Triumph of the Optimists: 101 Years of Global Investment Returns, Princeton University Press, 2002.
ImPAct of REINVEStEd dIVIdENdS oN cUmUlAtIVE
U.S. ANd U.k. EqUIty REtURNS
U.S.-centric world. Specifically, the U.S. now represents less than 20% of global economic output (compared to a 30% all-time peak in 1950), but U.S. equities still make up close to 50% of global equity markets. The U.S. being more than double the weight in global equity markets relative to its actual global economic output suggests that global markets are not very efficient, which presents ample opportunities for diversified alpha generation.
While it is difficult to time exactly when global equity markets might adequately reflect contributions to global economic output from regions outside of the U.S., it is reasonable to expect the narrowing of this non-U.S. GDP/market capitalization gap (Exhibit 1) could be a structural tailwind for non-U.S. equities for some time. Moreover, this tailwind is strengthened by a deep stock-picking universe of almost 6,500 liquid stocks outside of the U.S., which compares favorably with only 2,500 similarly liquid stocks in the U.S.2
Company-specific factors play a greater role in returnsAs globalization creates an increasingly connected world, country contribution to global equity returns has diminished as idiosyn-cratic company-specific factors become increasingly relevant.3 This is especially true in emerging markets, which account for a large share of the non-U.S. GDP/market capitalization gap and related investing tailwind mentioned previously.
An increased contribution to global equity returns from company-specific factors means that global diversified alpha4 has become increasingly derived from stock picking, and therefore increasingly favors investors who connect dots across borders (i.e., global inves-tors) versus those with single country expertise (i.e., local investors).
This is not an unexpected outcome in today’s globalized economy, where the success or failure of a large multinational such as Volkswagen has less to do with its home country of Germany and more to do with its competitive positioning versus its global peers, such as Japan’s Toyota, Korea’s Hyundai, and the U.S.’ GM. It should be noted that investing in non-U.S. stocks involves taking some currency risk, since most non-U.S. stocks trade in the local currency of their associated company’s home country. A global investment approach (i.e., investing across a wide array of countries), however, can achieve currency diversification, which helps mitigate this risk. Furthermore, many multinational compa-nies have natural currency hedges in the form of local sourcing/production and selling of goods and services, hence both costs and revenues are in the same currency, which dilutes the impact of any currency mismatches in their global operations. In other words, currency risk is inherent in global investing, but can be mitigated with thoughtful asset selection.
why consider a global equity income approach?Dividend income drives long-term total equity returns due to steady compoundingThe steady, compounding nature of dividend income makes it a material component of long-term total equity returns. For instance, during the 20th century, U.S. equities that included reinvested divi-dends produced over 84 times the return of a portfolio without rein-vested dividends, in nominal terms (see Exhibit 2, below left).5 The effect of reinvested dividends was even stronger in the U.K., where
ExhIbIt 3: the dividend yield of non-U.S. equities has been
persistently higher than that of U.S. equities. this gap is even
higher when a global equity income subset of global equities is
compared with global and U.S. equities.
Global Equity Income: Represents an income-oriented subset of MSCI All Country World Index (ACWI). Global ex-U.S. Equities: Refers to MSCI ACWI ex-U.S. Index. U.S. Equities: Refers to MSCI USA Index. *See page 7 for index definitions. Period referenced: Jan. 31, 2002 to Dec. 30, 2011. Source: Fidelity Asset Management (FAM) as of Dec. 30, 2011.
dIVIdENd yIEld comPARISoNS
100,000
10,000
1,000
100
10
1
0
16,79716,160
198149
1900 20001925 1950 1975
Start of Year
Inde
x va
lue
(sta
rt 1
900
= 1
.0; l
og s
cale
) U.S.: total return 10.1% per yearU.K.: total return 10.1% per yearU.S.: capital gain 5.4% per yearU.K.: capital gain 5.1% per year
1
2
3
4
5
6
7
8
9
Jan
-02
Oct
-02
Jul-
03
Apr
-04
Jan
-05
Oct
-05
Jul-
06
Apr
-07
Jan
-08
Oct
-08
Jul-
09
Apr
-10
Jan
-11
Oct
-11
Global Equity IncomeGlobal ex-U.S. EquitiesU.S. Equities
Div
iden
d Yi
eld
(%)
3
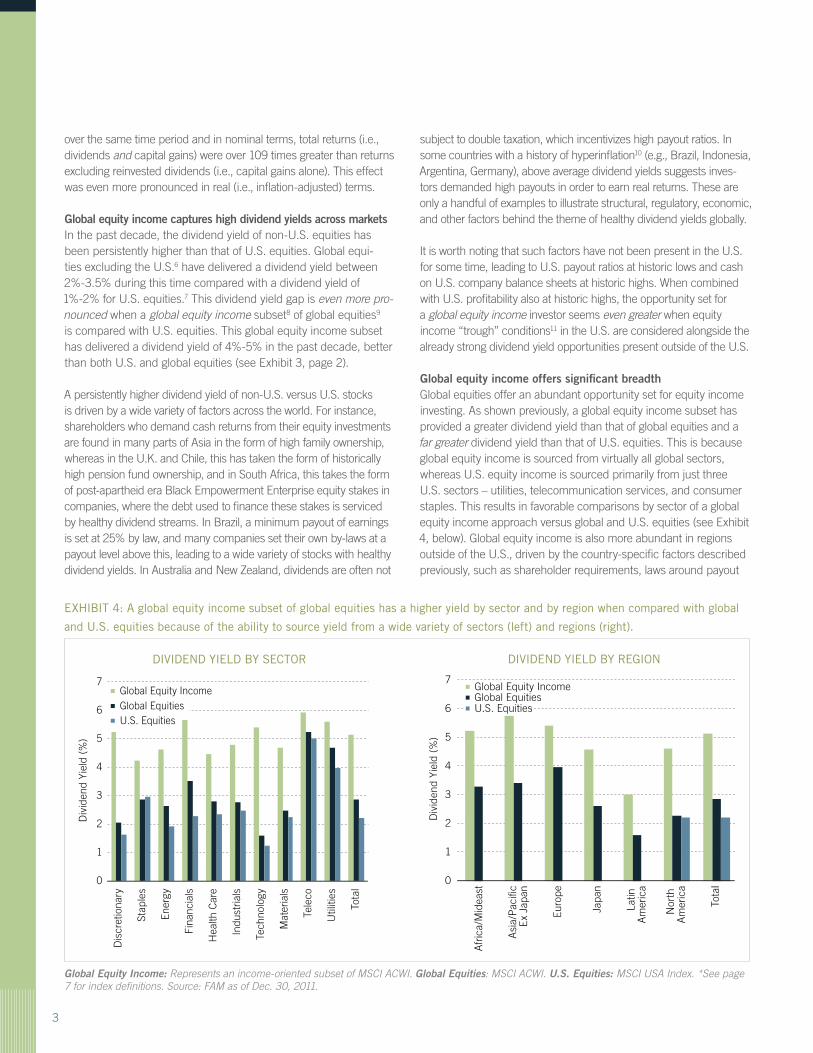
ExhIbIt 4: A global equity income subset of global equities has a higher yield by sector and by region when compared with global
and U.S. equities because of the ability to source yield from a wide variety of sectors (left) and regions (right).
Global Equity Income: Represents an income-oriented subset of MSCI ACWI. Global Equities: MSCI ACWI. U.S. Equities: MSCI USA Index. *See page 7 for index definitions. Source: FAM as of Dec. 30, 2011.
dIVIdENd yIEld by SEctoR
over the same time period and in nominal terms, total returns (i.e., dividends and capital gains) were over 109 times greater than returns excluding reinvested dividends (i.e., capital gains alone). This effect was even more pronounced in real (i.e., inflation-adjusted) terms.
Global equity income captures high dividend yields across marketsIn the past decade, the dividend yield of non-U.S. equities has been persistently higher than that of U.S. equities. Global equi-ties excluding the U.S.6 have delivered a dividend yield between 2%-3.5% during this time compared with a dividend yield of 1%-2% for U.S. equities.7 This dividend yield gap is even more pro-nounced when a global equity income subset8 of global equities9 is compared with U.S. equities. This global equity income subset has delivered a dividend yield of 4%-5% in the past decade, better than both U.S. and global equities (see Exhibit 3, page 2).
A persistently higher dividend yield of non-U.S. versus U.S. stocks is driven by a wide variety of factors across the world. For instance, shareholders who demand cash returns from their equity investments are found in many parts of Asia in the form of high family ownership, whereas in the U.K. and Chile, this has taken the form of historically high pension fund ownership, and in South Africa, this takes the form of post-apartheid era Black Empowerment Enterprise equity stakes in companies, where the debt used to finance these stakes is serviced by healthy dividend streams. In Brazil, a minimum payout of earnings is set at 25% by law, and many companies set their own by-laws at a payout level above this, leading to a wide variety of stocks with healthy dividend yields. In Australia and New Zealand, dividends are often not
subject to double taxation, which incentivizes high payout ratios. In some countries with a history of hyperinflation10 (e.g., Brazil, Indonesia, Argentina, Germany), above average dividend yields suggests inves-tors demanded high payouts in order to earn real returns. These are only a handful of examples to illustrate structural, regulatory, economic, and other factors behind the theme of healthy dividend yields globally.
It is worth noting that such factors have not been present in the U.S. for some time, leading to U.S. payout ratios at historic lows and cash on U.S. company balance sheets at historic highs. When combined with U.S. profitability also at historic highs, the opportunity set for a global equity income investor seems even greater when equity income “trough” conditions11 in the U.S. are considered alongside the already strong dividend yield opportunities present outside of the U.S.
Global equity income offers significant breadth Global equities offer an abundant opportunity set for equity income investing. As shown previously, a global equity income subset has provided a greater dividend yield than that of global equities and a far greater dividend yield than that of U.S. equities. This is because global equity income is sourced from virtually all global sectors, whereas U.S. equity income is sourced primarily from just three U.S. sectors – utilities, telecommunication services, and consumer staples. This results in favorable comparisons by sector of a global equity income approach versus global and U.S. equities (see Exhibit 4, below). Global equity income is also more abundant in regions outside of the U.S., driven by the country-specific factors described previously, such as shareholder requirements, laws around payout
dIVIdENd yIEld by REgIoN
0
1
2
3
4
5
6
7
Dis
cret
iona
ry
Stap
les
Ener
gy
Fina
ncia
ls
Hea
lth C
are
Indu
stria
ls
Tech
nolo
gy
Mat
eria
ls
Tele
co
Util
ities
Tota
l
Div
iden
d Yi
eld
(%)
Global Equity IncomeGlobal EquitiesU.S. Equities
0
1
2
3
4
5
6
7
Afr
ica/
Mid
east
Asi
a/P
acifi
cE
x Ja
pan
Euro
pe
Japa
n
Latin
A
mer
ica
Nor
th
Am
eric
a
Tota
l
Div
iden
d Yi
eld
(%)
Global Equity IncomeGlobal EquitiesU.S. Equities

4
ExhIbIt 6: during the 1970s era of high inflation, a global
equity income approach produced positive real returns and
outperformed bonds, U.S. equities, and global equities.
Stocks and bonds represented by S&P 500 Index, MSCI World Index, and IA SBBI U.S. Intermediate-Term Government Bond Index, respectively, for the 10-year period ending Dec. 30, 1980. Annualized performance data. *See page 7 for index definitions. Source: Morningstar EnCorr and FAM.
PERfoRmANcE dURINg 1970s INflAtIoN PERIod
ExhIbIt 5: Risk-adjusted returns over the past decade show
that a global equity income approach delivered both a better
Sharpe Ratio and dividend yield compared with a variety of
standard capitalization-weighted equity indices.
Sharpe Ratio: Measures risk-adjusted performance by subtracting the risk-free rate from the rate of return and dividing the result by the standard deviation of returns. Period referenced: 10-year term ending Dec. 30, 2011. *See page 7 for index definitions. Source: FAM.
dIVIdENd yIEld ANd ShARPE RAtIo
ratios, tax policy, historic hyperinflation, etc. This, too, results in favorable comparisons by region of a global equity income approach versus global and U.S. equities (see Exhibit 4, page 3).
Less volatile equity exposureA global equity income approach tends to be less correlated with global risk appetite. This is driven by income investing’s tendency toward lower volatility stocks, as income-oriented companies tend to have steady and predictable cash flows, which often results in lower stock price volatility. In other words, global equity income investing (much like traditional U.S. equity income investing) may provide risk diversification, as seen by income portfolio betas12 usually lower than 1.
attractive risk-adjusted returnsRisk-adjusted returns over the past decade show that a global equity income approach delivered both better returns per unit of risk (Sharpe Ratio) as well as a higher dividend yield when com-pared with a variety of standard capitalization-weighted equity indices (see Exhibit 5, above left). Said differently, over a decade replete with significant equity market corrections, a global equity income approach proved both conservative and rewarding.
Inflation protectionA global equity income approach may also offer inflation protection versus other asset classes. This is because companies often can pass through rising input costs, such as raw materials and labor, in the form of higher prices on final products and services. For better-managed companies, this is often an opportunity to drive real
pricing power (i.e., price increases above inflation), and therefore real profit growth as price drops straight to the bottom line. Income-oriented companies thus have the potential to generate inflation-pro-tected growth via dividend payments, which are paid out of profits.
An example of this phenomenon was during the 1970s era of high inflation, where global and U.S. equity income subsets13 were unique in producing material positive real total returns of 13.38% and 1.83%, respectively.14
In real terms, global and U.S. equity income outperformed infla-tion (8.04%), bonds (-2.31%), U.S. stocks (0.40%), and global stocks (0.19%), with global equity income’s outperformance being significant. Of note, dividends were a material driver of the real total return experienced by income stocks during this inflationary period (see Exhibit 6, above right).
Identifying effective global equity income approachesWinning global equity income approaches focus on companies with competitive advantages that drive above-average returns and reliable cash flow generation, which, when combined with prudent capital allocation, greatly support current and future dividend payments. A thorough global equity income research process should include traditional analysis focused on fundamentals and valuation metrics, as well as credit analysis that assesses balance sheets and dividend paying capacity of potential investments. An emphasis on future free cash flow generation can help evaluate the safety of current dividends as well as the potential to grow future
5.73 8.04 8.44
9.87 8.23
21.42
-5
0
5
10
15
20
25
Bonds Inflation S&P 500 S&P 500 HDY
MSCI World
MSCI World HDY
Income Return (%)Price Return (%)Total Return (%)
Global Equities
S&P 500
MSCI World
MSCI EAFE
MSCI World HDY
1
2
3
4
5
0.1 0.2 0.3 0.4
Div
iden
d Yi
eld
(%)
Sharpe Ratio (Annualized)
MSCI EAFE HDY
Global Equity Income

5
0%
200%
400%
600%
800%
1000%
1200%
1400%
Dec
-95
-97
Dec
-99
Dec
-01
Dec
-03
-05
-07
-09
Dec
-11
Cum
ulat
ive
Ret
urn
Zero DYLow DY Low POLow DY High PO
High DY Low POHigh DY Med POHigh DY High POGlobal Equities
0%200%400%600%800%
1000%1200%1400%1600%
Cum
ulat
ive
Ret
urn
Zero DYLow DY Low DG
High DY Low DGHigh DY Med DGHigh DY High DGGlobal Equities
-5.5
-3.5
-1.5
0.5
2.5
4.5
6.5
-7
-5
-3
-1
1
3
5
Dec
Dec
Dec
Dec Dec
-95
-97
Dec
-99
Dec
-01
Dec
-03
-05
-07
-09
Dec
-11
Dec
Dec
Dec
Dec
Rel
ativ
e R
etur
n (%
)
Rel
ativ
e R
etur
n (%
)
Dec
-95
-97
Dec
-99
Dec
-01
Dec
-03
-05
-07
-09
Dec
-11
Dec
Dec
Dec
Dec
Dec
-95
-97
Dec
-99
-01
Dec
-03
-05
-07
-09
Dec
-11
Dec
Dec
Dec
Dec
Dec
ExhIbIt 7: An effective global equity income approach tends
to have better valuations, dividend yields, balance sheets, and
profitability when compared with global equities.
GEI: Global Equity Income data as of Dec. 30, 2011. Global Equities data referenced by MSCI ACWI as of Dec. 30, 2011. *See page 7 for index definitions. Source: FAM.
Characteristics of a Global equity Income approachGeI Global equities
VALUATION
Price to Cash Flow 8.7 11.2 Price to Earnings, FY1 11.5 15.7 Price to Earnings, FY2 10.7 13.0 Price/Earnings, Trailing 10.8 12.0 Price/Sales 2.7 6.0 Dividend Yield 5.2 2.9
BALANCE SHEET Total Debt / Total Capital 13 25
PROFITABILITY
Operating Margin 21 17 ROE 1 Year, Trailing 24 23 ROE 5 Year, Average 23 20 ROE, FY1 25 22 ROE, FY2 26 22
dividends. Such approaches would tend to lead to stocks with better valuations, dividend yields, balance sheets, and profitability when compared with global equities (see Exhibit 7, left).
Such approaches would also tend to maintain a balance of equi-ties with dividend yield, dividend payout, and dividend growth characteristics. For instance, portfolios that held a combination of high dividend yield and reasonable dividend payout stocks and/or high dividend yield and high dividend growth stocks produced better cumulative returns relative to global equities and relative to other portfolio combinations of yield, payout, and growth, and with a high degree of consistency for more than a decade (see Exhibit 8, below).
Potential for downside protectionAn effective global equity income approach may also provide relative downside protection. This is shown in downside capture
ExhIbIt 8: An effective global equity income approach tends to balance between dividend yield, dividend payout, and dividend growth.
cUmUlAtIVE PERfoRmANcE of dIVIdENd yIEld ANd
dIVIdENd PAyoUt
cUmUlAtIVE PERfoRmANcE of dIVIdENd yIEld ANd
dIVIdENd gRowth
hIgh dIVIdENd yIEld/mEdIUm PAyoUt
(RElAtIVE to globAl EqUItIES)
hIgh dIVIdENd yIEld/hIgh dIVIdENd gRowth
(RElAtIVE to globAl EqUItIES)
Relative performance on lower chart is calculated on rolling monthly basis. DY: Dividend Yield. DG: Dividend Growth. PO: Payout Ratio. Global Equities: MSCI ACWI. All stocks in MSCI ACWI were sorted into terciles on a monthly basis based on dividend yield, with high dividend yield stocks being those in the top tercile while low dividend yield stocks were those in the bottom tercile. Analogous approaches were taken with respect to DG (Dividend Growth) and PO (Payout Ratio). A total of nine groups of were created by combining the top, medium, and bottom tercile dividend yield stocks with that of top, medium, and bottom tercile payout ratio stocks, respectively. The 10th group contained stocks that do not pay dividends. All these groups were rebalanced monthly and the forward one-month performance was calculated for each of them. A series of such one-month forward performance numbers were chain linked (compounded) to arrive at the cumulative performance numbers that are shown on the charts. A similar approach was taken for dividend yield and dividend growth combination of stocks. Period referenced: Jan. 1, 1996 to Dec. 31, 2011. *See page 7 for index definitions. Source: FAM.
0%
200%
400%
600%
800%
1000%
1200%
1400%
Dec
-95
-97
Dec
-99
Dec
-01
Dec
-03
-05
-07
-09
Dec
-11
Cum
ulat
ive
Ret
urn
Zero DYLow DY Low POLow DY High PO
High DY Low POHigh DY Med POHigh DY High POGlobal Equities
0%200%400%600%800%
1000%1200%1400%1600%
Cum
ulat
ive
Ret
urn
Zero DYLow DY Low DG
High DY Low DGHigh DY Med DGHigh DY High DGGlobal Equities
-5.5
-3.5
-1.5
0.5
2.5
4.5
6.5
-7
-5
-3
-1
1
3
5
Dec
Dec
Dec
Dec Dec
-95
-97
Dec
-99
Dec
-01
Dec
-03
-05
-07
-09
Dec
-11
Dec
Dec
Dec
Dec
Rel
ativ
e R
etur
n (%
)
Rel
ativ
e R
etur
n (%
)
Dec
-95
-97
Dec
-99
Dec
-01
Dec
-03
-05
-07
-09
Dec
-11
Dec
Dec
Dec
Dec
Dec
-95
-97
Dec
-99
-01
Dec
-03
-05
-07
-09
Dec
-11
Dec
Dec
Dec
Dec
Dec

6
ExhIbIt 9: An effective global equity income approach can
provide relative downside protection in down markets as well as
reasonable upside participation in up markets.
Global equity Income (GeI) vs. Global equities (Ge)
Up Down total
GeI Ge GeI Ge GeI Ge
Annualized Return (%) 28 29 -18 -19 6 4
No. of Periods 74 74 53 53 127 127
Annualized Spread (bps) (105) 168 131
Capture Ratio (%) 96 91
U.s. equity Income (UseI) vs. U.s. equities (Us)
Up Down total
UseI Us UseI Us UseI Us
Annualized Return (%) 21 27 -14 -19 4 3
No. of Periods 76 76 51 51 127 127
Annualized Spread (bps) (565) 515 163
Capture Ratio (%) 79 73
Performance is calculated on a rolling monthly basis. Up capture is cal-culated for periods of positive index performance, whereas down capture is calculated for periods of negative index performance. Annualized performance is calculated over the entire period (June 30, 2001 through Dec. 30, 2011). Global Equity Income: Represents an income-oriented subset of MSCI ACWI. Global Equities: MSCI ACWI. U.S. Equity Income: Represents an income-oriented subset of MSCI USA Index. U.S. Equi-ties: MSCI USA Index. *See page 7 for index definitions. Source: FAM.
AuthorsRamona PersaudPortfolio Manager
Ramona Persaud is a portfolio manager for Fidelity Asset Management. She is a co-portfolio manager of the global equity income subportfolio of Fidelity Equity-Income Fund, which she began co-man-aging in October 2011.
Naveed RahmanInstitutional Portfolio Manager
Naveed Rahman is an institutional portfolio manager for Fidelity Asset Management. He assumed his current position in the equity division in December 2011, and is responsible for representing value and equity income strategies to institutional clients, prospects, and consultants.
Srinivas VemparalaQuantitative Analyst
Srinivas Vemparala is a senior quantita-tive research analyst for Fidelity Asset Management. He currently is part of the Equity Quantitative Research division and is a member of the global equity income research team. He is involved in risk model and portfolio construction research.
tax considerationsInvesting in non-U.S. dividend-paying equities can have different tax implications versus investing in U.S. dividend-paying equities, depending on an investor’s tax status. taxable investors should generally be indifferent, on an after-tax basis, between investing in non-U.S. or U.S. dividend-paying equities due to foreign tax credits available to U.S. investors. tax-deferred investors, however, will generally incur a marginally higher tax cost when investing in non-U.S. dividend-paying equities in many foreign countries as a result of dividend withholding taxes imposed by the foreign country, but this cost is often offset by the greater yield provided by foreign dividends. taxable investors should also be aware that the favorable rates applicable to “qualified dividends” are due to expire in december 2012. because tax considerations can be investor-specific and subject to policy change, please consult a tax advisor for more details.
ratios15 below 100% for equity income approaches in both global and U.S. markets (i.e., income investors have experienced less downside than their respective broader markets) – see Exhibit 9, above. An added benefit of a global equity income approach, however, is that it has also shown attractive upside capture histori-
cally, a result of its participation in a wide array of sectors and regions globally. In other words, a global equity income approach adds value more from alpha than beta sources.
Investment implicationsA global equity income approach may address the needs of conservative equity investors seeking lower volatility, higher risk-adjusted returns, risk diversification, inflation protection, downside protection, as well as may provide better and more wide-sourced income generation from dividends in an era of historically low U.S. fixed income yields.

7
endnotes1 The large dip in the 1980s of U.S. share of global equity market capital-ization is a result of the Japan asset bubble during that period. U.S. share of global equity market capitalization recovered in the 1990s, but not back to its prior peak. Global equity market capitalization refers to MSCI World Index, a free-float-adjusted, market-capitalization-weighted index designed to measure the equity market performance of developed mar-kets. Global economic output or GDP (gross domestic product), refers to the market value of all officially recognized final goods and services produced in developed and emerging countries around the world. 2 MSCI as of Jan. 31, 2012.3 Fidelity Asset Management Anova methodology on MSCI World total re-turns, 1988-2011. Idiosyncratic risk: risk associated with unique circum-stances related to a specific asset, as opposed to the broader market. 4 Alpha: the excess return over a benchmark, taking into account the risk taken to obtain that return.5 Elroy Dimson, Paul Marsh, and Mike Staunton, Triumph of the Op-timists: 101 Years of Global Investment Returns, Princeton University Press, 2002, Chapter 11. 6 Proxied by MSCI’s All Country World Index ex-U.S.7 Proxied by MSCI USA Index.8 Global equity income represents a subset of MSCI All Country World Index containing securities with greater than average dividend yields and reasonable dividend per share growth and dividend payouts. This is consistent with a number of public indices, including MSCI USA High Dividend Yield Index and MSCI World High Dividend Yield Index.9 Proxied by MSCI All Country World Index.10 Hyperinflation: inflation that is very rapid or out of control.11 Trough conditions: The minimum point of a complete cycle of a periodic function, such as the low point in a time series of performance for an asset. 12 Portfolio beta: A measure of the volatility, or systematic risk, of a security or a portfolio in comparison to the market as a whole. A beta of 1 indicates that the security’s price will move with the market. A beta of less than 1 means that the security’s price will be less volatile than the market. A beta of greater than 1 indicates that the security’s price will be more volatile than the market. See Exhibit 9 for reference data.13 MSCI All Country World Index did not yet exist. MSCI World is its predecessor and contained the largest economies during the time period analyzed, out of which an equity income subset was derived, consistent with MSCI’s methodology of HDY indices. Similarly, MSCI USA Index did not yet exist, so S&P 500 Index is used as a proxy for U.S. equities, out of which an equity income subset was derived, consistent with MSCI’s methodology of HDY indices. 14 Real global equity income total return: 21.42% (nominal) - 8.04% (inflation) = 13.38% (real). Real U.S. equity income total return: 9.87% (nominal) - 8.04% (inflation) = 1.83% (real).15 Downside capture ratio is analogous to a portfolio’s beta during down markets; a downside capture ratio less than 100% is ideal. Upside cap-ture ratio is analogous to a portfolio’s beta during up markets; an upside capture ratio greater than 100% is ideal.
*Global equity Income: an income-oriented subset of Morgan Stanley Capital International (MSCI) All Country World Index containing securities with greater than average dividend yields and reasonable dividend per share growth and dividend payouts. This is consistent with a number of public indices, including MSCI USA HDY Index and MSCI World HDY Index.
**GK$: Geary-Khamis dollar, more commonly known as the international dollar, is a hypothetical unit of currency that has the same purchasing power that the U.S. dollar had in the United States at a given point in time.
MsCI all Country world Index: a free-float-adjusted, market-capitaliza-tion-weighted index designed to measure the equity market performance of developed and emerging markets.
MsCI all Country world (aCwI) ex-U.s. Index: a free-float-adjusted, market-capitalization-weighted index designed to measure the equity market performance of developed and emerging markets outside of the United States.
MsCI Usa Index: a free-float-adjusted, market-capitalization-weighted index designed to measure the equity market performance of the United States.
U.s. equity Income (MsCI Usa HDy): an income-oriented subset of MSCI USA Index containing securities with greater than average dividend yields and reasonable dividend per share growth and dividend payouts.
MsCI world Index: a free-float-adjusted, market-capitalization-weighted index designed to measure the equity market performance of developed markets.
MsCI world HDy: an income-oriented subset of MSCI World Index con-taining securities with greater than average dividend yields and reason-able dividend per share growth and dividend payouts.
s&P 500 Index: a market-capitalization-weighted index of common stocks, is a registered service mark of the McGraw-Hill Companies, Inc., and has been licensed for use by Fidelity Distributors Corporation.
MsCI europe, australasia, Far east Index (eaFe): a free-float-adjusted, market-capitalization-weighted index designed to measure the equity market performance of developed markets outside of the United States and Canada.
MsCI eaFe HDy: an income-oriented subset of the MSCI EAFE Index containing securities with greater than average dividend yields and rea-sonable dividend per share growth and dividend payouts.
Ibbotson associates® (Ia) sBBI U.s. Intermediate-term Government Bond Index: a one-bond portfolio that is the shortest non-callable bond with a maturity between five and six years, and it is held for the calendar year. U.S. government-issued Treasury bonds were chosen because they experienced no defaults and were generally presumed to offer little credit risk, which provides a focused illustration of the impact of interest rate movements. MsCI’s methodology of HDy indices: each MSCI High Divi-dend Yield Index is composed of those securities in the parent index that have higher-than-average dividend yield, a track record of consistent divi-dend payments, and the capacity to sustain future dividend payments.
Other Important InformationIt is not possible to invest directly in an index. All indices are unmanaged.
Before investing, consider the funds’ investment objectives, risks, charges, and expenses. Contact Fidelity for a prospectus or, if available, a summary prospectus containing this informa-tion. Read it carefully. Past performance is no guarantee of future results.
Views expressed are as of the date indicated, based on the informa-tion available at that time, and may change based on market and other conditions. Unless otherwise noted, the opinions provided are those of the authors and not necessarily those of Fidelity Investments. Fidelity does not assume any duty to update any of the information.
Foreign securities are subject to interest-rate, currency-exchange-rate, economic, and political risks, all of which may be magnified in emerging markets. These risks are particularly significant for funds that focus on a single country or region.
Stock markets are volatile and can decline significantly in response to adverse issuer, political, regulatory, market, or economic developments.
Investment decisions should be based on an individual’s own goals, time horizon, and tolerance for risk.

8
Investing involves risk, including risk of loss.
Diversification does not ensure a profit or guarantee against loss.
Products and services provided through Fidelity Personal & Workplace In-vesting (PWI) to investors and plan sponsors by Fidelity Brokerage Services LLC, Member NYSE, SIPC., 900 Salem Street Smithfield, RI 02917
Products and services provided through Fidelity Financial Advisor Solutions (FFAS) to investment professionals, plan sponsors, and institutional investors by Fidelity Investments Institutional Services Company, Ic., 100 Salem Street, Smithfield, RI 02917
615089.1.0
© 2012 FMR LLC. All rights reserved.