the mechanism of waste treatment at low temperature part …
TRANSCRIPT
t
THE MECHANISM OF WASTETREATMENT AT LOW TEMPERATURE
PART A: MICROBIOLOGYBy
S. M. Morrison, Gary C. Newton,George D. Boone, and Kirke L. Martin
August 1972
Colorado State University
Fort Collins, Colorado
Completion Report SeriesNo. 33
t
THE MECHANISM OF WASTETREATMENT AT LOW TEMPERATURE
PART A: MICROBIOLOGYBy
S. M. Morrison, Gary C. Newton,George D. Boone, and Kirke L. Martin
August 1972
Colorado State University
Fort Collins, Colorado
Completion Report SeriesNo. 33

THE MECHANISM OF WASTE TREATMENTAT LOW TEMPERATURE
PART A: MICROBILOGY
Partial Completion Report
OWRR Project No. A-007-COLO
by
S. M. MorrisonGary C. NewtonGeorge D. BooneKirke L. Martin
Department of MicrobiologyColorado State University
submitted to
Office of Water Resources ResearchU. S. Department of Interior
Washington, D.C. 20240
August, 1972
The work upon which this report is based was supported (in part)by funds provided by the United States Department of the Interior,Office of Water Resources Research, as authorized by the WaterResources Research Act of 1964, and pursuant to Grant AgreementNo. 14-31-0001-3006, 14-31-0001-3206, 14-31-0001-3506.
Colorado Water Resources Research InstituteColorado State UniversityFort Collins, Colorado
Norman A. Evans, Director

Part B: Engineering of this report is published
separately by J. C. Ward, John S. Hunter, and
Richard P. Johansen, Department of Civil Engineering.
ACKNOWLEDGEMENT
The authors wish to acknowledge the financial
support provided the graduate students by the
Office of Water Programs, Environmental Protection
Agency, Training Grants 5Tl WPl27 and P3 WP295,
S. M. Morrison, Director.
ii

TABLE OF CONTENTS
Section
Introduction . . • . • • • • •. 1
Literature Review. • • • •. 3
Materials and Methods. . • 17
Results. . . • • • . 29
Discussion . • 74
Summary and Conclusions. . • • • •. •• • 88
Literature Cited •... ..••••• 92
Appendix 1 • • • • • . • •100
iii
TABLE OF CONTENTS
Section
Introduction . . • . • • • • •. 1
Literature Review. • • • •. 3
Materials and Methods. . • 17
Results. . . • • • . 29
Discussion . • 74
Summary and Conclusions. . • • • •. •• • 88
Literature Cited •... ..••••• 92
Appendix 1 • • • • • . • •100
iii

LIST OF TABLES
Table
1
2
3
4
5
6
7
8
9
10
11
12
Sampling locations and identification ofcolonies which became visible within a weekon peA at refrigerator temperature • • • • • • •
Percertt BOD removal data, from heat sterilizedsewage, for different age and size of fourinocula at 5, 10, 15 and 20 c .
Four-way analysis of variance of percent BODremoval data for different age and size offour inocula at 5, 10, 15 and 20 C .....
Percent BOD removals from sterilized sewageby the psychrophile and mixed, mesophileinocula averaged over the other treatments .
Percent BOD removals from sterilized sewage atdifferent temperatures averaged over theother treatments . • . . • . • • . . . . • .
Percent BOD removals from sterilized sewageby large and small quantities of inoculaaveraged over the other treatments • . . • .
Percent BOD removals from sterilized sewageby 1 and 7-day old cultures of the inoculaaveraged over the other treatments . . .
Average percent BOD removals by the fourinocula at different temperatures • • • •
Average percent BOD removals by large andsmail quantities of the four inocula . . • •
Average percent BOD removals by 1 and 7-dayold cultures of the four inocula • • • • •
Average percent BOD removals of large andsmall quantities of inocula at differenttemperatures . . . • . • • • . . . • . . • .
Average percent BOD removals by 1 and 7-dayold cultures of inocula at different temperatures
19
33-34
35
36
36
36
37
37
37
38
38
38
13 Average percent BOD removals by large and smallquantities of 1 and 7-day old cultures of
. inocula. . . . . . . . . . . . . . . . .. . . .. 39
iv

14
15
16
17
18
19
20
21
22
23
Average percent BOD removals by large andsmall quantities of 24 hour and 7 day oldcultures of inocula at different temperatures. •
Percent BOD removal data, from heat sterilizedsewage for different aged combinations ofinocula at 5, 10, 15 and 20 C•••....•••
three-way artalysis of variance of the percentBOD removal data for different aged combinationsof inocula at 5, 10, 15 and 20 C ••••
Percent BOD removals by two culture ages ofsingle and combined culture inocula averagedover all temperatures. . • . • • . . • . . .
Initial BOD, chang~ in BOD, and percent BODremoved for the raw sewage control (no inoculum)at 5, 10, 15 and 20 C. • . . • • . . .
Percent BOD removals from raw sewage at 2 Cusing no inoculum, a mixed (mesophilic)inoculation, and a psychrophilic inoculum. •
Analysis of variance for the effect that apsychrophilic, a mesophilic, and no inoculumhave on BOD removals from raw sewage within5 hr at 2 C. . . . • . . . . • . • • . • . •
Initial and final BOD concentrations (mg/l)raw sewage with and without inocula • • • •
Analysis of treated sewage effluents .
Oxygen uptake at 10 C for XVI-4 culturedfor 1 and 7 days in sterilized sewagesupplemented with 1/5 m-PCB. • • . . . .
v
39
41
42
43
47
48
49
50
60
67

Figure
I
2
3
4
5
6
7
8
9
10
11
12
LIST OF FIGURES
Average percent BOD removals by tIle fourinocula at different temperatures • .
Average percent BOD removals by large andsmall quantities of 1 and 7 day old culturesof inocula at different temperatures•.•.
A plot of BOD in .treated and untreated rawsettled sewage at 5 C expressed as a functionof· time. .. . . . . . . . . . . . . .
A plot of percent BOD reductions in treatedand untreated raw settled sewage at 5 Cexpressed as a function of time . • . . • •
A plot of BOD in treated and untreated rawsettled sewage at 5 C expressed as afunction of time • • . • • .
A plot of percent BOD reductions in treatedand untreated raw sewage at 5 C expressed asa function of time. • . . • . . • . • • , • • .
A plot of BOD in treated and untreated rawsettled sewage at 5 C expressed as a functionof time . • . •• ..•.••••••
A plot of percent BOD reductions in treatedand untreated raw settled sewage at 5 Cexpressed as a function of time •• .•
Viable psychrophilic cell number in treatedand untreated raw settled sewage at 5 Cexpressed as a function of time • • •. •
Viable psychrophilic cell number in treatedand untreated raw settled sewage at 5 Cexpressed as a function of time • • . • •
Viable psychrophilic cell number in treatedand untreated raw settled sewage at 5 Cexpressed as a function of time . . • • • •
The effects of inoculated microorganisms onthe BOD of concentrated synthetic sewageat 5 C expressed as a function of time
vi
31
32
44
44
45
45
46
46
52
52
53
54

Figure
13
14
15
16
17
18
19
20-
The effects of inoculated microorganismson percent BOD reductions in concentratedsynthetic sewage at 5 C expressed as afunction of time • • . . . • . • • . . • • •
Viable psychrophilic cell number in treatedand untreated concentrated synthetic sewageat 5 C expressed as a function of time •
The effects of inoculated and indigenouspsychrophiles on sugar concentration inraw settled sewage at 5 C expressed as afunction of time • • . . • • . • • • • .
The effects of inoculated and indigenouspsychrophiles on sugar concentration inraw settled sewage at 5 C expressed as afunction of time . • . . . . • . • • . .
Arrhenius plots of growth rates (generations/hour) in sterilized sewage versus the inverseof absolute temperature for the threepsychrophilic isolates . . • • • . . • • • . • •
Arrhenius plot of oxygen uptake rates insterilized sewage versus the inverse of absolutetemperature for the three psychrophilicisolates grown for 1 day in sterilized sewagesupplemented with 1/5 m-PCB (Difco) .••.
Oxygen uptake at 5 and 20 C in sterilizedsewage by the psychrophilic isolates grownfor 1 day in ~ m-PCB (Difco) . . • • • • •
Oxygen uptake at 5 and 20 C in sterilized sewageby the psychrophilic isolates grown for 1 dayin sterilized sewage supplemented with 1/5m-PCB (Difco) •••.•..•.••.•••••.
55
56
59
59
62
63
65
66
21 Variation observed in B-6 cell growthindicated by a change in Klett opticaldensity (approximately equal to 500 x standardoptical density (50» in sewage samples supplementedwith yeast extract in 3 days at 5 C expressedas a function of pH. . • • • • • • • • • . . .• 69
22 Variation observed in methylene blue reductionby B-6 in sewage samples supplemented withyeast extract in 3 days at 5 C expressedas a function of pH. • • • • • . . • • . .
vii
69

Figure
23
24
25
26
Variation observed in B-39 cell growthindicated by a change in Klett opticaldensity in raw se~age samples supplementedwith yeast extract in 3 days at 5 Cexpressed as a function of pH •
Variation observed in methylene bluereduction by B-39 in raw sewage samplessupplemented with yeast extract in 3 daysat 5 C expressed as a function of pH. • •
Variation observed in C cell growth indicatedby a change in Klett optical density in rawsewage supplemented with yeast extract in3 days at 5 C expressed as a function of pH
Variation observed in methylene bluereduction by C in raw sewage samplessupplemented with yeast extract in 3 daysat 5 C expressed as a function of pH. • •
viii
71
71
73
73

ABSTRACT
THE MECHANISM OF WASTE TREATMENT
AT LOW TEMPERATURE
PART A. MICROBIOLOGY
Low temperatures adversely affect wastewater treatment efficiency~
partly by decreasing rates of biological oxidation. Because of the
importance of adequate treatment efficiency~ the feasibility of inocu
lating psychrbphiles into a wastewater treatment system to increase
biological oxidation rates at low temperatures was investigated.
Three psychrophiles capable of relatively rapid growth or oxygen
uptake in sterilized sewage were selected from water and soil isolates
collected in the Fort Collins vicinity. Of 97 Alaskanpsychrophiles
screened for maximum activity as indicated by growth rate and rate of
reduction of methylene blue thiocyanate t three were selected for use
in the waste stabilization experiments.
In studies with heat sterilized sewage t the effects of number of
cells inoculated and culture age of the three psychrophiles (local) on
percent BOD removals at different temperatures were analyzed. The
effects of temperature and number of cells inoculated were the most
significant. Percent BOD removals decreased as temperature decreased,
and the large inoculum (1010 cells/200 ml) removed more BOD than the
small inoculum (108 cells/200 ml).
The effects of organisms used as inocula and of culture age of
inocula were also significant. At 15 and 20 Ct the psychrophile inocula
removed less BOD than the inocula of mesophiles~ but at 5 and 10 C, the
psychrophiles were more efficient than the mesophiles. The I-day old
cells generally removed more percent BOD than 7-day cells, except when
108 cells were inoculated at 5 C. When the small inoculum was used at
5 C, the 7-day cultures were more efficient than the I-day cultures. It
was thought that this phenomenon was the result of cold shock that
affects physiologically young cells, but not stationary growth phase cells.
Using raw settled sewage as substrate at 5 C, the Alaskan psychro
philes removed substantially more BOD within a 72 hr detention period
ix

than untreated controls; however, within a 120 hr period, BOD removals
never averaged greater than 31.3%. In raw sewage studies at 2 C, it
was found that the sewage inoculated with locally isolated psychrophiles
had 19% BOD removals within 5 hr, but the mesophile inoculated .and non
inoculated raw sewage had 15% and 14% removals, respectively. Although
this difference was statistically significant, it was observed that a
bacterial inoculum appreciably added to the initial BOD of the raw
sewage, resulting in a higher final BOD concentration after 5 hr despite
the psychrophi1es ability to more rapidly oxidize wastewater nutrients.
These observations add to our knowledge concerning biological
treatment as a method of wastewater stabilization; however, the system
investigated appears to be too inefficient for practical use, even
though it showed a statistically significant advantage over untreated
or mesophilic inoculated controls.
x

•
INTRODUCTION
Modern sanitary engineering technology is largely responsible for
the development of biological wastewater treatment processes capable of
efficient operation in temperate regions. Although these treatment
facilities have been adequately designed for efficient waste removal in
temperate regions, their efficiency at low temperatures is usually not
sufficient to meet current demands of pollution control agencies. In
regions where very low temperatures are encountered for extended periods
of time, such as the high mountain communities of Colorado or the far
north, wastewater treatment presents a series of unique problems which
must be resolved before waste removal criteria can be met.
Unequal loading presents a problem in communities and resort areas
where weekends and holidays can introduce large increases in population
and resulting waste to be treated. The principal prob"lem encountered
in low temperature wastewater treatment is decreased biological activity
in the system. The secondary process of most conventional waste treat
ment systems is largely based on physiocochemical floculation and set
tling and bio-oxidation of the organic materials in the waste. The
organisms responsible for the biochemical activity are usually meso
philic, having temperature optima between 20 and 40 C and, by definition,
exhibiting very little activity below 10 C.
Methods of improving low temperature waste water stabilization may
be approached by modifying the engineering design or improving biologi
cal activity. The engineer might design new facilities which minimize
the adverse effect of low temperatures or find inexpensive methods of
modifying present facilities to work more efficiently at low temperatures.
However, since sewage degradation is primarily a biological phenomenon,
the biologist may be able to alter the biota and enhance the biological
rate of waste stabilization at low temperatures.
The approach of the study undertaken at Colorado State University
was to isolate psychrophilic bacteria and evaluate their potential as
inocula into sewage to increase the efficiency of waste stabilization
at low temperatures. This approach could be used in already existing
facilities or incorporated into the operation of newly designed.
facilities.
1

2
The specific objectives of this study were:
1) Isolation, identification and selection of psychrophilic
bacteria capable of relatively high activity at low tempera
tures.
2) To determine if mutant strains with increased growth rates at
low temperatures could be developed.
3) To analyze the effect of combined and pure culture inocula of
different size and age on BOD and COD removals in sterile
sewage at temperatures between 5 and 20 C.
4) A determination of BOD removal in raw settled sewage by the
treatment organisms at low temperatures.
5) To compare the exponential growth rates of the psychrophiles
with oxygen uptake rates at 5, 10, 15, and 20 C.
6) To investigate other factors which could conceivably increase
the efficiency of BOD removals at low temperatures.

LITERATURE REVIEW
The prolonged persistence of organic pollution and of disease
producing organisms in cold regions (1) necessitates adequate treatment
of domestic wastewaters. Present treatment facilities, designed for
use in temperate regions, are inefficient at low temperatures and must
be improved.
The adverse effect of cold temperature on plant efficiency differs
among treatment processes. Decreased temperature exerts a more adverse
effect on anaerobic processes than on aerobic ones (1): thus, aerobic
treatment seems better suited to cold wastewaters. Of the aerobic
processes, activated sludge is less seriously affected by low temper
ature than is the trickling filter (39, 23, 1). Waste stabilization
ponds are also adversely affected by low temperature, as winter BOD
removals from ponds in Canada range from 0 to 55% compared to 65 to 90%
in the summer (27). Aerated lagoons also cannot be depended upon to
produce high quality effluents during winter unless provisions for pro
cess modifications Wllicll enhance efficiency are taken (7). Although
aerated lagoon efficiency can be improved by having a number of lagoons
in series to minimize short circuiting (99), the effects of temperature
on the biological activity of the system remain. Although it has been
suggested that it is possible to isolate and culture psychrophiles
capable of degrading waste if inoculated into the wastewater, there is
little information concerned with the design of such systems and no
literature identifying capable species (1). Therefore, only literature
indirectly related to the problem can be reviewed. The main topics of
this review, then, are: 1) the effect of temperature on biological
degradation of wastewater, 2) the properties of psychrophilic micro
organisms, and 3) the feasibility of using selected strains of psychro
philic microorganisms to improve cold temperature treatment efficiency.
I. The effect of temperature on biological degradation of wastewater.
A. Biochemical reaction rates
Degradation of sewage is primarily biological, thus, inher
ently biochemical. Because rates of biochemical reactions vary with
temperature according to the van't Hoff-Arrhenius relationship, rates
of waste degradation would be expected to follow the equation

d(ln K)/dT
4
equation 1
in which E is the activation energy for the reaction (cal/mole),a
K is the reaction rate constant, R is the universal gas constant
(1.99 callmole • oK), and T is the temperature (oK). Integrating
this equation yields a more useful form,
In K • -E IRT + Ca
or
equation 2
-E
Ra (lIT - lIT )
2 1equation 3
which shows that a decrease in temperature decreases reaction rate.
The integrated form also shows that a plot of the logarithm of
the reaction rate versus the inverse of absolute temperature yields a
curve with a slope of -E IR. If the activation energy is constant,a
the curve would be linear; but the curve would not be linear if
the activation energy is also a function of temperature. Inorganic
chemical reactions generally have activation energies which are
changed only slightly by changes in temperature, and their Arrhenius
plots are essentially linear. The effect of temperature on
activation energies for biochemical reactions are more complex.
Ware and Jex (99) found that the activation energy for the
reduction of manure's BOD by a mixed microbial population was a linear
function of temperature (oC); thus, an Arrhenius plot would not be
linear. Sawyer and Rohlich, however, cited numerous investigators who
found that the temperature coefficient of reaction rates did not remain
constant, but showed breaks at transition temperatures. Between tran
sition temperatures,however, the coeficients were constant. Arrhenius
plots of growth rates of a psychrophilic Vibrio grown in a mineral
salts-glucose medium showed a temperature range where the curve was
clearly linear, but at temperatures outside this linear range,
the rate of growth decreased drastically (37).
The apparent discrepancy between the findings of Ward and Jex
(99) and the findings reported by Sawyer and Rohlich (80) and Hanus
and Morita (37) might be explained on the basis of an inherent

5
difference in their investigations. Ward and Jex investigated the
effect of temperature on a mixed microbial population metabolizing
a heterogeneous source of nutrients; whereas, the other investigators
studied only single species. It is possible that the gradually changing
slope (E not constant) of an Arrhenius plot of the rate of a complexa
biological reaction brought about by a heterogenous microbial popu-
lation is due to 1) a change in the E of specific reactions as thea
relative abundances of the various species of the mixed population
shift as temperature changes, and 2) a change in nutrient substrates
being utilized as the population shifts with changes in temperature.
Although a biologist would expect an Arrhenius plot to
have a temperature range where the curve is linear, a non-linear
van't Hoff-Arrhenius relationship probably depicts the expected
effect of temperature on biological removal of BOD from wastewater
more accurately~ Research has variously shown that process
efficiency is: 1) independent of temperature, 2) dependent on
temperature, or 3) relatively independent of temperature with
temperature changes resulting in a shift of the relative importance
of biological and physical processes (51). The discrepancies
reported could be because the effect of temperature on treatment
efficiency varies among treatment processes.
Hawkes (39) stated that seasonal temperature fluctuations have
little effect on activated sludge efficiency. Keefer (48) compiled
data over a twenty year period from an activated sludge plant in
Baltimore and compared percent BOD and suspended solids removal
to temperature. When the average flow was between 18.0 and 22.0
mgd, the average BOD removal was 86.5% at 54 F (11.7 C) and 91.4% at
79 F (26 C), but, when the flow was between 12.0 and 14.0 mgd,
the average BOD removal was 89.5% at 54 F (12.2 C) and 91.5% at
76 F (24.3 C). ·The effect of temperature on suspended solids
removal when the flow was between 18 and 22 mgd was similar to
the temperature effect on BOD removal. At 53 F (11.7 C) the
suspended solids removed was 80.0% and at 79 F (26 C) the removal
was 92.5%.
Hunter, Genetelli, and Gilwood (40) studied the effects of
temperature on BOD and suspended matter removals in a batch operated

6
activated sludge system with a 16 hour retention time. The results
of their research are tabulated as follows:
oTemperature ( C)
42028354555
%BOD removed
79.192.390.191.193.783.6
% suspendedmatter removed
81.591.883.686.693.381.3
Sawyer (78) studied the effect of temperature and sludge
concentration on BOD removal in a batch operated laboratory
activated sludge. He used wide mouth two-gallon jars filled with
sewage and 1,000 mg/l activated sludge. The jars were placed
in constant temperature baths ranging from 10 to 25 C, aerated
with diffused air for ten hours and settled for one hour. The
supernatant was siphoned off (the effluent) and replaced with fine
screened sewage~ The average percent BOD removed was 90.5, 94.3,
94.5, and 94.6 at 10, 15, 20, and 25 C, respectively. The percent
BOD removal varied with sludge concentration. At 800, 1600, 2400,
and 3200 ppm sludge, the BOD removals at 10 C were 84.0, 95.9,
97.2, and 96.8%, respectively.
It appears that the effect of temperature on activated sludge
efficiency does not always truly follow the van't Hoff-Arrhenius
relationship, because BOD removals often showed only a slight
or no relation to temperature. The data of Keefer (48) showed
only a 5% increase in BOD removal by activated sludge when the
temperature increased from 12 to 26 C, and when the flow was
relatively low, there was only 2% increase in BOD removal when
the temperature increased from 12 to 24 C. The BOD and suspended
solids removal data for activated sludge of Hunter et al. (40)
showed no relation to temperature in the range of 20 to 45 C,
although outside this range there was a definite temperature
effect. Sawyer's (78) data also indicated no temperature effect
on BOD removals by activated sludge between 15 and 25 c.

7
B. Temperature effects
Low temperatures affect equilibrium constants and saturation
values of various solids and gases which may be dissolved in sewage
(1) and cause a general reduction in the rates of almost all
biological, chemical, and physical reactions (1, 16). Different
parameters are affected by low temperatures to different degrees
in each treatm~ system, but the~overall effect is~formly
undesirable.
Conventional methods of waste disposal in the soil, including
the use of leaching pits, septic tank disposal fields, the pit
privy, etc., are useless in very cold regions, since decomposition
and assimilation do not occur, and accumulation rather than disposal
results. This problem is particularly acute in far north perma
frost regions where the soil remains frozen year round (20).
When waste disposal in the soil is ineffective, one alternative
is disposal into rivers and streams. However, before this can be
considered feasible, adequate secondary treatment of the wastewater
will be necessary. The secondary treatment process of most conven
tional wastewater treatment systems is a biological treatment in
which organic material present in the primary effluent is micro-
bially oxidized and removed (69) after being adsorbed on a biological
floc or slime. According to Hawkes, the organisms actively responsible
for this oxidation are mesophilic, having optima between 20 C and
40 C depending upon the species (39), and this is the primary
reason that many conventional wastewater treatment processes are
unable to do an adequate job of waste stabilization at low temper
atures.
Secondary treatment in the activated sludge system is composed
of physical adsorption onto the biological floc followed by aerobic
degradation of the adsorbed organic materials and ana,erobic digestion
of the excess sludge formed by the settled floc and removed in the
secondary sedimentation basin. The aerobic portion of ,the activated
sludge process has been described as being slightly, but signi
ficantly, affected by low temperatures (11, 39, 48, 51, 101).
Actual oxygen demand removals drop from the ninety percentile range

8
at 25 C to 30 C into the eighty percentile range at 5 C to 10 C,
a difference in efficiency of 5 to 10 percent (11, 51, 52). Although
little mention is usually made of detention times in activated
sludge systems, a decrease in operating temperature is almost certain
to require extended detention.
Pipes (72) pointed out that there are three essential bio
logical requirements for the activated sludge process:
1) A mixed population of aerobic microorganisms must be
capable of degrading the noxious components of the waste.
2) The required population must be able to grow in the
aeration tank.
3) The organisms must grow in a form that will settle out
in the secondary clarifier.
In describing these microorganisms as mesophiles, Hawkes indirectly
provides a reason for one to suspect that Pipes' first two requirements
would not be met at low temperatures. Ludzack's findings that
low temperatures generally resulted in an inferior floc formation
(51) indicates that the last of Pipes' biological requirements
may be inadequate at low temperatures. Part of the effects of the
depressed biological activity in the activated sludge process
are offset by extending the detention time in the aerator to
increase oxygen demand removals (11).
Fair, Geyer, and Okun describe anaerobic digestion as a process
occurring from mesophilic and thermophilic activity, with the
greatest efficiency occurring at approximately 55 C by the thermo
philic microorganisms and very slow digestion occurring below 20 C
(23). According to Warren (100), thermophilic digestion at temper
atures of 43 to 54 C can digest volumes within days that would
normally require months at temperatures below 15 C. At low
temperatures little digestion is going to be accomplished. After
a study of wastewater disposal facilities at DEW line radar stations
in Greenland, Reed and Tobiason concluded that without some form
of artificial stimulation, low temperature anaerobic systems appear
to serve as little more than storage devices (73).
The trickling filter is much more adversely affected by
temperature than other aerobic biological wastewater treatment

(
9
systems. This is probably due to the fact that the trickling filter
relies upon a microbial film for its activity, and this layer's
efficiency of organic removal generally increases with an increase
in temperature and decreases with a decrease in temperature (10,
58). This Same effect is reflected in the statements that trickling
filters mature in a few weeks in the summer~ but only in several
months in the winter (23) and that winter recirculation of wastes
(which results in cooling) may cause an efficiency drop up to
20 percent compared to summer (10).
The trickling filter process requires the exposure of the
wastewater to a large surface area rendering the system more
susceptible to freezing. In severely cold areas, both the rotating
distributors and the beds of trickling filters have been known to
freeze solid, reducing the effectiveness of the plant to that of a
primary settling basin (10).
The viscosity of the influent also results in a lengthening
of the necessary detention time in a trickling filter. The detention
time has been described mathematically by the formula
where t dh
1 ~"'3" 3
td
= ch Y A/Vg Q
detention time, seconds
filter depth, feet
equation 4
c = a dimensionless constant that reflects film buildup (23).l
v
g
Q
A/V
2kinematic viscosity of the wastewater, ft /sec
acceleration of gravity, 32.2 ft/sec2
volume/(unit area) (unit time), ft/sec-1
surface area/unit volume of bed, ft
equation 5
According to Lof, Ward and Hao (50) it can be shown that
1-3
c = Kk
where K the fraction of the pore volume occupied by the liquid,
dimensionlessk = dimensionless coefficient = 5

10
Furthermore, equation 4 strictly applies at an air flow rate of
zero. Air flowing countercurrent to the downward liquid flow would
increase the detention time in the filter. Designating this increase
in detention time as!:l t, the total detention time, t, could be rep
resented by the formula
equation 6
1They also showed that, for a GIL ratio of less than about 0.4,
!:It = 400 (GIL) equation 7
equation 8
where GIL = weight ratio of air-water.
Accordingly, the total detention time in a trickling may be expressed
by the semi-empirical formula
1 1. ~-- 3 3
t = Kk3h V Alv + 400 (GIL)
g Q
If all other parameters in equation 8 remain constant, an increase
in viscosity would result in an increase in detention time. This is
important because water viscosity increases as temperature decreases so
that water is twice as viscous at 0 C than at 25 C (77). If increased
viscosity due to low temperatures results in a sufficiently extended
detention time, problems could conceivably arise in loading, especially
in high-rate trickling filters which recirculate secondary effluents.
Although several different types of sewage lagoons exist, the
aerobic lagoon is undoubtedly the most common type found in cold
regions. These systems have a relatively high dissolved oxygen
content throughout their entire volume, due usually to mechanical
aeration. The oxidation of organics is done biochemically by the
microbial flora present in the lagoon.
According to Dawson and Grainge, short retention lagoons with de
tention times of two to four days characteristically produce 70 percent
BOD removals in the summer, but only remove 30 percent of the BOD in
the winter (17), consistent with removals obtained by primary settling
(57, 69). Halvorson described a similar lagoon located in Winnipeg,
Canada, which yielded an 87 percent BOD removal during the summer, but
removed only 24 percent during the winter (35).

i
11
If contact times are extended for sufficiently long periods, BOD
removals of 68 to 90 percent can be obtained (33, 59, 74). The time
necessary to obtain any given BOD removal varies with the temperature
of the wastewater being treated. Reduction of BOD as high as 88 percent
at a temperature of 3 C, with a 9.3 day detention, have been reported in
an aerated lagoon by McKinney and Edde (59). In contrast, an aerated
lagoon operating in a high altitude Colorado ski area has been described
as requiring a 32 day detention at 0.25 C to obtain a BOD removal of
only 65.6 percent (see report Section B). Apparently, contact times in
excess of 20 days for low temperature aerated lagoons are not unusual
(17, 75).
In spite of the long detentions inherent in the low temperature
sewage lagoon, it is considered to be a promising system for wastewater
treatment in cold climates, and some Alaskan areas as well as mountain
communities are presently making use of it (13, report Section B). The
sewage lagoon is an attractive treatment system because it is inexpensive
(4) and because fairly high BOD removals can be obtained as long as
loading rates are low enough or enough lagoons are utilized in series to
allow sufficient detention.
II. The properties of psychrophilic microorganisms
The word "psychrophile" is the result of a combination of the two
Greek roots "psychros", meaning cold, and "philos", meaning to love.
Taken together the word is somewhat of a misnomer, as pointed out by
Ingraham and Stokes (45), since the bulk of psychrophilic organisms do
not "love" cold as much as they endure or adapt to it.
Biological activity at near 0 C temperatures, characteristic of
high altitude or polar region wastewater, is restricted to psychrophilic
organisms. Although there is no precise definition of "psychrophile",
it usually refers to a microorganism capable of forming macroscopically
visible colonies within one week on solid media at 0 C (87). However,
other definitions are in the literature (45, 61, 25, 26).
According to Ingraham and Stokes (45), most psychrophilic bacteria
belong to the genus Pseudomonas and, to a lesser extent, Achromobacter,
Flavobacterium, Alcaligenes, and Micrococcus. Many other genera of
psychrophiles, however, have been isolated. These include Vibrio (63),

•
12
Serratia (34), and Cytophaga (56). Most psychrophiles are aerobic, but
some anaerobic strains have been isolated (83, 96).
Differences between psychrophiles and mesophiles reportedly
include range of growth temperature, temperature characteristic of
growth, temperature coeficient, and endogenous respiration (90).
Psychrophiles usually have an optimum growth range of 20 to 30 C
with a maximum between 30 to 40 C, while mesophiles generally grow opti
mally at 30 to 40 C with a maximum of about 50 C and a minimum of about
10 C (88). Obligate psychrophiles have an optimum growth temperature
below 20 C (87). The majority of obligate psychrophiles show rapid
thermal death at temperatures greater than 20 C (38), and exposure to
melted agar is sufficient to render certain obligate psychrophiles non
viable (62). Psychrophiles also have a shorter lag period over the
temperature range in which growth of both groups occurs (15).
A plot of generation time versus temperature is similar for meso
philes and psychrophiles. The major difference is that the psychrophile
has a generation time minimum at a temperature lower than that of the
mesophiles (41). Greater differences are seen when Arrhenius plots,
logarithm of growth rates vs. inverse temperature, are compared. The
maximum growth rate for the psychrophile occurs at a lower temperature
than the maximum for the mesophile, and the slope of the linear region
is less negative for the psychrophile than for the mesophile (42).
The slope of the linear region is the negative temperature characteris
tic (~) for growth; thus, on the basis of an Arrhenius plot of Ingraham's
data, the psychrophile can be distinguished from a mesophile because of
it's characteristic of low temperature growth. This comparison between
psychrophiles and mesophiles is best when the temperature
characteristic is determined between 15 and 25 C (6).
Hanus and Morita (37), however, reported that psychrophiles could
not be distinguished from mesophiles on the basis of the temperature
characteristic as they found that reported values of ~ showed no
consistant differences between mesophiles and psychrophiles. These dis
crepancies reported by Hanus and Morita may by due to species variation
rather than to basic differences between psychrophiles and mesophiles,
since ~ for a mesophilic mutant of a psychrophile Micrococcus cryophilus,
was higher than ~ for the parent psychrophile (91).
[
13
Psychrophiles reportedly can also be distinguished from mesophiles
on the basis of their temperature coefficient of glucose oxidation
(temperature coefficient = Q10
= (K2
/K1)10/dT wIlere K is the rate of
reaction and dT is the change in temperature, C). Psychrophiles exhibit
a lower temperature coefficient of glucose oxidation, with rates being
based on oxygen uptake in a glucose substrate (15,44). The tempera-
ture coefficient for acetate and formate oxidation was also less for psy
chrophiles than for mesophiles (44). Temperature coefficients, however,
differed when reference temperatures are changed, and the groups were
best distinguished from one another only when reference temperatures
were set at 10 and 30 C.(91).
Baxter and Gibbons (8) reported that a psychrophilic yeast, Candida,
had a greater endogenous respiration rate than a mesophile up to 30 C.
Endogenous respiration comparisons of a psychrophilic bacterium, Micro
coccus cryophilus and its mesophilic mutant gave greater rates for the
mesophile (91), indicating that differences in endogenous respiration were
not attributable to the ability to grow at low temperatures.
Comparisons between psychrophiles and mesophiles on the basis of
temperature characteristic, temperature coefficient (Q10) , and rates of
endogenous respiration are unreliable in distinguishing the two groups.
By definition the groups can be distinguished on the basis of temperature
range of growth; psychrophiles are able to function at low temperature,
but mesophiles cannot. Rose (76) believed that low temperatures have
two effects on the physiology of microorganisms: 1) on lipid content,
and 2) on the regulation of metabolism. As temperature is lowered, the
proportion of unsaturated fatty acids in the lipids of the cytoplasmic
membrane of Escherichia coli increases (54). These changes in the
fatty acids of the cytoplasmic membrane may change the architectural
nature of the membrane and prevent permease action (25). Psychrophiles,
presumably,resist structural changes as temperature decreases.
The fatty acid composition of a psychrophilic Candida remained
nearly constant during growth, but that of a mesophile, Candida lypolytica
changed during growth (47). Although this change was not conclusive evi
dence as to why mesophiles cease to grow at low temperature, it did show
there was a difference in lipid metabolism between psychrophiles and
mesophiles.

,
14
In addition to affecting lipid content and cell structure, low
temperatures may alter metabolism. There are numerous reports of temp
erature changing the metabolic end products (76). Usually, only a pro
portional decrease in the end products occurred with decreased tempera
ture, but occasionally the ratio of metabolic products changed or even
new products could be formed (68). There was often an increase in poly
saccharide synthesis at low temperature (76). Psychrophiles are capable
of a wide range of metabolic activity at low temperatures, exhibiting
proteolytic, lipolytic and saccharolytic abilities to varying extents
(32, 35, 65, 70, 86). Most psychrophiles appear to be able to hydrolyze
urea extremely well and at very high rates (35, 86). In testing 437
psychrophilic strains, Stefaniak found that 86.5 percent were capahle of
urea decomposition, 69.8 percent could ammonify peptones, 62 percent were
capable of nitrate reduction, 23.1 percent were capable of degrading
starch, and 19 percent were able to hydrolyze gelatin. It is interesting
to note that, although psychrophilic nitrate reduction has been observed
(12,86), the process seems to stop short of actual dentrification.
Also, in spite of highly aerobic environments, low temperatures appear
to inhibit nitrification (14, 33, 60, 78).
Many enzymes and enzyme forming systems of psychrophiles are ab
normally sensitive to heat (88), and this sensitivity could explain the
adverse effect of temperatures above the optimum for growth (61). Formic
hydrogenlyase of a psychrophilic, gram-negative, rod shaped bacterium
was not synthesized above 20 C, and, once formed, is inactivated at 45 C.
A mesophile, Escherichia £2!!, however, synthesized the enzyme at 45 C,
and this enzyme is not denatured until 70 C (97).
The L-serine dehydrase of a psychrophilic Pseudomonas aeruginosa is
less affected by temperatures below 15 C than is the same enzyme of a
mesophilic Escherichia coli (85). Psychrophiles are apparently endowed
with enzyme systems that are more temperature sensitive than those of
mesophiles, accounting for the psychrophile's inability to function at
relatively moderate temperatures. These enzymes function better at lower
temperatures enabling them to grow at relatively low temperatures.
Other effects of temperature on enzymes exist: effects on feedback
inhibition (43), induction and repression of enzyme synthesis (76), and
changes in catalytic activity due to shifts in the conformation of the
enzymes (93) caused by increased intra- and inter-molecular hydrogen
bonding at lower temperatures (9, 53).

15
Psychrophily is the result of a cell structure and metabolism
which allows the transport and breakdown of an exogenous nutrient supply
to obtain energy for growth at 0 C. Although both cell structure and
metabolism account for psychrophily, cell structure is the primary
factor enabling growth at low temperature. Brown (9) and Ingraham
and Bailey (44) showed that glucose oxidation rates differ between meso
philes and psychrophiles only when whole cell suspensions were used.
With sonicated suspensions, the rates of glucose oxidation of the two
groups were similar. These findings do suggest that cell structure
determines the ability of an organism to grow at low temperature.
III. The feasibility of using selected strains of psychrophilic micro
organisms to improve cold temperature treatment efficiency.
The inoculation of psychrophiles into a wastewater treatment system
to improve efficiency at low temperature has been suggested, but there
is little information found in the literature pertaining directly to
such an approach (1). Although Boyd and Boyd (13) suggested that
"starter" cultures could be developed and added to the sewage to
increase mineralization at low temperatures, they did not attempt to
isolate or test strains of bacteria capable of relatively high degradative
ability at low temperature. The feasibility is interesting and open
to conjecture. The biological degradation of wastes involves a myriad
of ecological relationships; consequently, considerations for improving
the biological removal of wastes at low temperature should follow an
ecological approach. The objectives of an ecological study of waste
are to determine what organisms are beneficial to the system and to
determine how to design and operate the process so growth of the
beneficial organisms is encouraged (72). The organisms most useful
in stabilizing waste's organic matter, however, are not really known.
Dias and Bhat (19) felt that the most abundant organisms in their
study, Zoogloea and Comamonas, were the most important, although they
recognized that it was doubtful that a single bacterial species could
utilize all the organic substances that occur in sewage and bring about
its complete stabilization. Unz and Dondero (95), on the other hand,
felt that the heterogeneous bacteria associated with nondescript flocs
and zoogloeas were most important in waste stabilization, and the roles

16
played by branched zoogloeas and possibly Zoog16ea ~. were relatively
minor. The predominant genera of bacteria reported present in activated
sludge varies among authors, but Pipes (72) assimilated the findings
of different investigators and determined that Achromobacter, Alcaligenes,
Flavobacterium ,Pseudomonas , and Bacillus were tIle most common. The
enteric bacteria present in domestic wastes were generally ignored by
the various workers.
Any bacterial strain capable of increasing waste treatment efficiency
at low temperature should be·able to: 1) utilize the· organic matter
of the waste at low temperature and 2) for trickling filter or activated
sludge, form an adsorptive slime or settleable adsorptive floc.
A microorganism able to utilize waste at low temperatures would
likely be psychrophilic and would probably be a strain representative
of the genera commonly found in sewage. Pseudomonas, Achromobacter,
Alcaligenes and Flavobacterium, genera common to wastewater, have psy
chrophilic representatives (45). It is, thus, likely that bacteria
exist that can utilize waste at low temperatures.
Because a sludge with good settling qualities is necessary for
an activated sludge process to be effective, organisms capable of forming
floes are important to the treatment system. The significant bacteria
in activated sludge must be able to flocculate by themselves, be
flocculated by other organisms, or be able to attach themselves to larger
particles which do settle out (72). Although the specific organisms
most capable of forming floc are not known (30), many genera are
evidently capable of flocculation. Zoogloea was once considered the
most important floc former, but many other genera, including some
strains of Escherichia, Alcaligenes, Bacillus, and Pseudomonas, have
been isolated that readily flocculate in pure cultures (72). Unz and
Dondero (95) isolated 20 strains of gram negative bacteria that were
capable of forming floes when grown in a nutrient broth. It is, thus,
possible that psychrophilic bacteria are also capable of flocculation.
Because bacteria probably exist that are capable of utilizing waste
at low temperatures and also capable of settling as floes, improvement
of treatment efficiency at low temperatures by using inocula of selected
bacteria appears feasible. The only other alternative to biological
treatment in cold environments seems to be housing and lleating the entire
treatment system (16).
VII.
VIII.
IX.
II.
III.
IV.
V.
MATERIALS AND METHODS
The methods and materials used in this study will be presented
under the following headings:
I. Isolation and selection of psychrophilic organisms
A. Local isolates
B. Alaskan Isolates
Ultraviolet irradiation of sewage and selected local isolates
Biochemical oxygen demand determinations
Psychrophilic treatment of sterile sewage with local isolates
Psychrophilic treatment of raw settled sewage
A. Local isolates
B. Alaskan isolates
VI. Psychrophilic treatment of concentrated sYnthetic sewage
with Alaskan isolates
Analysis of raw settled sewage effluent
Growth rate determinations on local isolates
Oxygen uptake studies on local isolates
I. Isolation and selection of psychrophilic organisms
A. Local isolates
Water and soil samples were taken from the Fort Collins,
Colorado, vicinity; the sampling locations are identified in Table
1. Either l-ml or O.l·-ml aliquots of the water samples were spread
with a glass rod on regrigerated Bacto Plate Count Agar (Difco, PCA)
plates, and, for soil samples, 1 g of the soil was suspended in a
9-ml sterile buffer blank, shaken thoroughly, and either I or
O.l-ml aliquots were spread on regrigerated PCA plates. All plates
were kep at near 4 C. Colonies which became visible within a
week were picked and assigned a Roman numberal (designating the
sampling location) and an Arabic number (designating the colony
picked from the plate) (Table 1).
The isolates that were obtained from soil, water, irradiated
sewage, and from the irradiation of previously selected isolates
were inoculated into 9 m1 of m-PCB. contained in screw-cap tubes
and placed in a test tube rack fixed at an angle of approximately
17

18
450 on a gyrotory shaker. The shaker was placed in a walk-in
refrigerator (near 0 C), and the cultures were shaken at 150 rpm
for 3 days. Twenty isolates, visually demonstrating the most dense
growth, were transferred to and maintained on refrigerated PCA
slants.
The number of isolates to be maintained was further decreased
by selecting 5 isolates that grew best in heat sterilized sewage
at near 0 C. Two loopfuls each, of the twenty isolates, were
inoculated into 10 ml of heat sterilized sewage and incubated for
24 hr in the walk-in refrigerator with shaking. Serial dilutions
were then made and spread on PCA plates which were incubated at
20 C for 48 hr. Although there were 20 cultures, only five were
tested at a time, and the 1 or 2 isolates from each group yielding
the highest colony counts were maintained.
Each of these five isolates was inoculated into respective
10-ml aliquots of filter sterilized sewage and incubated in a
household refrigerator (4 C) for 48 hr. The density of each of
the five cultures was adjusted to a percent transmittance of 80
at wavelength of 450 nm with a Spectronic 20 spectrophotometer.
Because the percent transmittance of all five cultures was
less than 80, adjustment with sterile deionized water to 80% was
made. One ml of each adjusted suspension was inoculated into
respective 100-ml aliquots of heat sterilized sewage contained
in 2S0-ml erlenmeyer flasks, and incubated on the gyrotory shaker
(150 rpm) for 24 hr in the walk-in refrigerator. Serial dilutions
were plated on PCA and incubated for 48 hr at 20 C. The three
isolates (XVI-4, XXII-I, XXIV-I) yielding the greatest number of
colonies were maintained by monthly transer on refrigerated PCA
slants. Cultures XIV-4 and XXIV-l were selected for use in the
experimental studies; the third isolate (T28B) used was from
soil and was selected on the basis of its rapid oxygen uptake at
10 C.

19
Table 1. Sampling locations and identification of colonies whicllbecame visible within a week on PCA at refrigeratortemperature.
Sample Number
IV
V
VI
VII
VIII
XVI
XVII
XVIII
XX
XXI
XXII
XXIII
XXIV
XXV
Site Number ofColonies Picked
Sugar beet waste I
Sugar beet waste 2
Effluent-Fort Collins Trickling 3Filter Plant
Effluent-Fort Collins Trickling 3Filter Plant
Effluent-Fort Collins Trickling IFilter Plant
Poudre River-Mountain Park 4
Poudre River-Mountain Park 8
Poudre River-Mountain Park 6
Poudre River-Watson Lake 10
Watson Lake 7
Watson Lake 5
Raw sewage-Fort Collins Trickling 3Filter Plant
Raw sewage irradiated 5 sec 2
Raw sewage irradiated 10 sec 4
B. Alaskan isolates
A total of 97 psychrophilic isolates taken from the Chena,
a subarctic Alaskan river, were obtained from Ronald C. Gordon, Ph.D.,
of the Environmental Protection Agency, College, Alaska. Each was
subcultured into 5 Inl quantities of half strength Bacto m-Plate
Count Broth (~m-PC$ in screw-cap tubes upon arrival at the laboratory
and were incubated stationary at I C for 5 days. At the end of
this five-day incubation, the culture tubes were each shaken
vigorously on a Vortex mixer and 0.1 ml of the resulting cell
suspension from each tube was spread plated on PCA. All plates
were incubated at 1 C for 5 days and were inspected daily for signs
of growth. The ten cultures exhibiting the fastest growth during
this incubation period were set aside for further screening.

20
Gram stain indicated that the most rapidly growing organisms
were gram negative rods of approximately the same size, so organism
RW-25 was arbitrarily chosen as the "standard" for preparing a
turbidimetric cell determination curve. A 200 ml volume of ~-m PCB
was placed in a 500 ml erlenmeyer flask and autoclaved for 15
minutes at 124 C. After cooling, tilis medium was inoculated witn
organism RW-25 from the broth culture described above and incubated
for 24 hours at 20 C with shaking at 113 rpm. The culture was
then centrifuged in a refrigerated centrifuge at 9750 x g for 20
minutes. The supernatant was discarded and the cell pack resuspended
in deionized water. Various dilutions of this cell suspension were
made, each microscopically counted for total cell number per ml in
an Improved Neubauer Levy Ultra Plane counting chamber and turbidity
was read in a Klett Summerson Photoelectric Colorimeter using a
blue No. 42 Klett filter (400-450 nm). The standard curve was a
plot of the turbidity against cell numbers.
Fresh raw sewage was obtained from the Fort Collins #1
trickling filter plant immediately following grit clarification,
was supplemented with 0.5 gram per liter Bacto Yeast Extract
and autoclaved. After cooling, this sterile supplemented sewage
was centrifuged for 20 minutes at 12,100 x g and the supernatant
vacuum filtered simultaneously through a double thickness of fiber
glass prefilters and a 0.45 membrane filter. The filtrate was again
autoclaved and refrigerated at 5 C.
A methylene blue thiocyanate solution was prepared by dissolving
an 8.23 mg tablet of the dye in 50 ml boiling deionized water and
brought to a volume of 200 ml by adding cool deionized water. The
solution was refrigerated at 5 C in a foil covered flask.
The ten cultures obtained from the primary screening procedure
were inoculated into 10 ml quantities of sterile supplemented sewage
in sterile screw-cap test tubes. All tubes were incubated at 5 C
for 4 days after which they were vigorously shaken on a Vortex mixer
and each cell suspension adjusted to a total cell concentration of
1.5 x 10⁸ cells per ml (Klett value of 10) by adding deionized water.
The final screening step involved the use of two incubation
systems. The first was composed of eleven test tubes to each of which

21
had been added 8 ml of the sterile supplemented sewage, 2 ml of
cell suspension and 1 ml of the methylene blue thiocyanate. The
last tube (control) contained no psychrophilic cell suspension. The
second system was identical to the first except that 8 ml of raw
sewage which had been allowed to settle in the 1 C incubator for
one hour was used as substrate instead of the sterile supplemented
sewage. Both systems were incubated at 5 C for 5 days after which
methylene blue reduction was determined visually from no reduction
(++++) to complete methylene blue reduction (0). Both systems
were compared and the three psychrophiles demonstrating greatest
methylene blue reduction in both systems were selected as treat
ment organisms. These, designated B-6, B-39, and C, were main
tained, from this point on, in sterile supplemented sewage as
stock cultures.
Determination of pH effects on treatment organisms was done
using an acetate buffer at pH values of 4 and 5 according to the
method of Walpole (98), a tris-maleate buffer and pH values of 6, 7
and 8 according to the method of Gomori (31), and a carbonate
bicarbonate buffer at pH values of 9.2, 10, and 10.7 according to
the method of Delory and King (18). One ml of buffer at each pH
value was placed individually into three sterile screw-cap test
tubes. Sterile supplemented sewage in 8 ml quantities was then
added to all tubes. The three tubes buffered at each pH value
were inoculated with 1 ml of the stock culture cell suspensions of
each treatment organism, one organism to a tube. This was done
so that at each pH value, three tubes would be represented, eacll
tube containing a different treatment organism. Klett turbidity
and pH measurements were made on all mixtures at the beginning
and at the end of a three day 5 C incubation. Initial and final
pH values were averaged together and recorded along with the
difference between initial and final Klett turbidity measurements.
The data presented graphically gave expression of the effect of pH
on growth.
The effect of pH on substrate oxidation was experimentally
determined using the same experimental design with the exception

22
that to each tube was added and thoroughly mixed, 1 ml of the
methylene blue thiocyanate solution described above. At the end
of the incubation period, all tubes were compared to a set of visual
standards made by using 0.0041, 0.0033, 0.0025, 0.0016, 0.0008,
0.0004 and 0 mg per 1 of methylene blue thiocyanate in deionized
water. Amount of methylene blue reduction (substrate oxidation)
was recorded in mg per I methylene blue which compared most closely
to the appropriate standard. Percent reduction was calculated and
used for plotting.
II. Ultraviolet irradiation of sewage and selected local isolates
Approximately 20 ml of either raw sewage or broth cultures of
the locally isolated psychrophiles were placed in clean glass petri dishes
and irradiated from a distance of 37.5 em with a 15 watt General Electric
ultraviolet light source (2537 Rwavelength). The raw sewage samples
were irradiated for 2, 5, or 10 seconds, and the isolates for 1 min.
One millileter of the irradiated sample was then spread with a glass
rod on PCA plates and incubated near 0 C in the walk-in refrigerator.
Colonies which became visible within 4 days were isolated for possible
use as inocula in the experimental studies.
III. Biochemical oxygen demand determinations
All standard 5-day, 20 C biochemical oxygen demands (BOD) were
determined by the azide modification of the iodometric Winkler method
described in Standard Methods for the Examination of Water and Wastewater
(2). All dilutions were made directly in 300-ml BOD bottles by adding
a known volume of sewage plus a 0.3 ml (equivalent to 0.1%) raw sewage
seed into the BOD bottle and then siphoning aerated dilution water into
the bottle until filled. The concentration of sewage added was deter
mined by dividing the volume of sewage added by 300 mI. Only 5-day, 20 C
BODs were determined.
IV. Psychrophilic treatment of sterile sewage with local isolates
Either 10 ml (large inoculum) or 0.1 mi (small inoculum) of the
24-hr or 7-day old culture suspension was inoculated into a 1000-ml
flask containing 600 ml of sterilized sewage. A known volume (usually
3-6 ml) was aseptically withdrawn and placed into a 300-rol BOD bottle

23
for determination of the initial 5-day, 20 C, BOD. This inoculated
sewage was decanted equally into three sterile 500-ml erlenmeyer flasks
and incubated at the appropriate temperature (5, 10, 15, or 20 C)
for 23 hr in an incubator shaker with aeration accomplished by shaking
(60 rpm). After the 23-hr aeration period, the sewage was decanted
jqto sterile 250-ml flasks and allowed to settle for I hr at the same
temperature used when aerated. From this settled sewage, the final
BODs were determined. The percent BOD removed was used as the parameter
of treatment efficiency, and the data was analyzed by a four-factor analysis
of variance. It was necessary to modify the three-factor analysis described
in Snedecor and Cochran (84) to fit four treatments.
With combined culture inocula the experimental method was essentially
the same as described for single cultures. Here, however, only large
inocula (10 ml), each consisting of one of the four possible combinations
of the three isolates, cultured and harvested as described previously,
were used. These combinations were: 1) 5 ml XVI-4 + 5 ml T28B,
2) 5 ml XVI-4 + 5 ml XXIV-I, 3) 5 ml XXIV-l + 5 ml T28B, and 4) 3.3 ml
XVI-4 + 3.3 ml XXIV-l + 3.4 ml T28B. The incubation conditions and BOD
determinations were the same as described previously. The data were
analyzed together with the large inocula data of the single culture ex
periment using a three-factor analysis of variance described by Snedecor
and Cochran (84).
Two mixed, mesophilic populations were employed in this study as
controls. The first control consisted of an inoculum obtained from a
raw sewage culture and the method was the same as that used in single
culture inocula studies. The data from this control were analyzed to
gether with the data from the single culture inocula studies. The
second control consisted of the raw sewage with no added inoculum.
Approximately 200 ml of the freshly collected raw sewage was added to
a clean 500-ml flask and the initial BOD was determined as described
earlier, except seeding was not necessary. The sewage was incubated
concurrently with the single and combined culture inoculated sewage
and the final BOD was determined. The percent BOD removed was calculated,
but the data was not analyzed statistically with the other data. This
control was also used as the seed material for determining BOD&. on the
heat sterilized sewage.

24
v. Psychrophilic treatment of raw sewage
A. Local isolates
A loopful of each of the three psychrophilic isolates, or 1
ml of raw sewage, was inoculated into a 250-ml erlenmeyer flask
containing 100 ml of heat sterilized sewage supplemented with 1/5
strength m-PCB t and incubated at room temperature (20-25 C) on a
gyrotory shaker at 150 rpm for 1 day (18-24 hr) or for 7 days.
The cultures were centrifuged in a refrigerated centrifuge and the
cell pellet was suspended in sterile deionized water so that a 1:50
dilution gave a reading of 50 Klett units as measured by a Klett
Summerson photoelectric colorimeter using the blue filter (400-450 nm).
This cell suspension contained approximately 1.2 x 10¹⁰ cells/ml
(Appendix 1).
Freshly collected raw sewage was decanted as lOOO-ml aliquots
into each of three 2000-ml flasks and placed into a constant
temperature bath at 2 C. After the sewages equilibrated with the
temperature of the bath (approximately 2 hr), one was inoculated
with 5 ml of a suspension containing equal amounts of the three
psychrophiles. The second flask was inoculated with 5 ml of a
mixed, mesophilic population suspension, and the third flask was
not inoculated. A volume of 7.5 ml was withdrawn from each flask
for determining iuitial BOD concentrations (no seed was required).
Each of the three sewages was aerated by bubbling compressed air,
first into a flask containing water equilibrated with the temperature
of the bath to filter and cool the incoming air and then into each
of the three sewages. After a 4-hr aeration period, three 250-ml
flasks were filled with each of the three sewages and allowed to
settle for lhr before two 9-ml volumes from each flask were with
drawn for duplicate determinations of BOD. Percent BOD removed
was calculated as the parameter of treatment efficiency and the
data were analyzed statistically by a two-way analysis of variance
(14).
B. Alaskan isolates
One hundred ml of sterile supplemented sewage was placed in
each of three sterile 250 ml erlenmeyer flasks, inoculated with
25
each of the treatment organisms and incubated in a shaker at 5 C
for 2-3 days, silliking at 92 rpm. When relatively heavy growth
became visually apparent, turbidity was determined and converted
to total cell number per mI. A sufficient amount of inoculum was
placed in 50 ml centrifuge tubes to yield approximately 3 x 10¹⁰
total cells. These suspensions were centrifuged at 12,000 x g
for 20 minutes, the supernatant discarded and the cell packs resus
pended in 10 ml deionized water by vigorous shaking. This wash
cycle was repeated once and the 10 ml suspensions were ready for
use as inocula.
Several liters of raw sewage were obtained immediately
following grit clarification and allowed to settle for one flour at
1 C, after which the supernatant was drawn off and 300 ml quantities
placed in one-liter flasks. These were inoculated with a 10 ml
cell suspension described above and 5 ml of centrifuge wash water
were added; the control contained 15 ml of deionized water. The
inoculation of treatment organisms gave a total psychrophilic cell
count of approximately 1 x 10⁸ cells per mI. All treatment flasks
were incubated in the temperature controlled shaker at 5 C for 5
days at 92 rpm.
Treatment flasks were sampled initially and at 24 hour intervals
for 5 days for BOD determinations (3). Dl
and D2
values for the
HOD were determined in duplicate for each treatment and averaged
to yield a single HOD value at each sampling period.
Initially and at 24 hour intervals for 5 days appropriate
dilutions of samples from each of the psychrophilic treatment
systems as well as of the control system were made, using sterile
buffered water blanks. Each dilution was spread plated in 0.1
ml amounts in duplicate on PCA. All plates were incubated for
2 weeks at 1 C in the walk-in cold incubator and plates showing
30 to 300 colonies were counted and duplicates averaged.
VI. Psychrophilic treatment of concentrated synthetic sewage with
Alaskan isolates
Psychrophilic inoculum preparation in this experiment was identical
to that described earlier for Alaskan isolates. A fecal coliform
which failed to exhibit visual evidence of growth for 2 weeks at 5 C

26
was used as a mesophilic control. This organism was inoculated into a
100 ml volume of sterile supplemented sewage, incubated for 24 hours at
37 C without shaking, harvested and used in the same manner as the
psychrophilic inocula.
The synthetic sewage of Pipes (71) with the modification that boron
was not added as one of the constituents was used. This synthetic
material was made in triple strength and used in the same manner as the
raw settled sewage described earlier with one modification, tris-maleate
was used to buffer the flasks, containing organisms B-6, B-39 and control
at pH 7.0 to 7.2 and the treatment flask containing organism C to a
pH of 7.4 to 7.6. Dow Corning Antifoam A was used periodically to
control excessive foaming.
BOD determinations were identical to those previously described
and the procedure for psychrophilic counts was the same as described
earlier with the following exceptions: 1) dilutions of 10-2 of the
fecal coliform control were made and O~l ml plated in duplicate and
2) psychrophilic treatment plates were incubated at 15 C for 60 hours.
VII. Analysis of the raw settled sewage effluent
Inoculum preparation was identical to that described earlier in
this paper for Alaskan isolates, except that the inoculum was adjusted
to yield a cell count of 6 x 10⁸ cells for each treatment organism.
Substrate preparation was also identical to that described earlier,
with the exception that 2 liter flasks were used to contain 600 ml of
the raw settled sewage. Initially and at 24 hour intervals, 90 ml
quantities were removed from each flask, vacuum filtered simultaneously
through a double thickness of prefilters and a 0.45 ~ membrane filter.
Aliquots of the filtrate from each treatment were used for analysis.
A. Analysis for nitrate-nitrite nitrogen
Aliquots of 20 ml from each treatment filtrate were color
imetrically analyzed for nitrate-nitrite nitrogen by the method
of Schall and Hatcher (81), with the modification that the protein
precipi~ationwas not carried out. All colorimetric tests in the
effluent analyses were read for optical density in a Spectronic
20 spectrophotometer.
B. Analysis for sugar
One ml aliquots from each treatment filtrate were colorimetri
cally analyzed for sugar by the method of Morris (64).

27
C. Analysis for orthophosphate
Aliquots of 35 ml from each treatment filtrate were colori
metrically analyzed for orthophosphate by the Vanado-Molybdate methods
as described in Standard Methods for the Examination of Water and---- --Wastewater (3).
D. Analysis of viscosity
Viscosity measurements of all treatment filtrates were made
using a Gilmont V-2100 falling ball viscosimeter.
VIII. Growth rate determinations
Each of the three selected local isolates were inoculated into
respective 200 ml portions of heat sterilized sewage contained in 500 ml
erlenmeyer flasks, incubated in a shaker at 25, 20, 15, 10, or 5 C,
and shaken at 100 rpm. Standard plate count determinations were made
in triplicate for each culture four times, either once hourly, when
incubated at 25 C, or once every other hour, when incubated at lower
temperatures, while the cultures were in exponential growth (16-24 hr
after inoculation). Growth rates were determined using the equation:
log. NT - log NT10 10
~.301 1 X -T-=:T-- = generations/unit time
2 1 equati.on 9
where:
NT = number of colonies counted at time T2N 2 = number of colonies counted at time T
1T0.301 = log102
IX. Oxygen uptake studies on local isolates
The determination of oxygen uptake was performed in a Precision
Warburg Apparatus as developed by Unbreit, Burris, and Stauffer (94).
The main compartment of each Warburg vessel received 2 ml of heat
sterilized sewage and the side arm received 0.5 ml of a cell suspension
(prepared as described previously for local isolates). The center well
contained 0.2 ml of a 20% KOH solution and a fluted piece of filter
paper (approximately 1 cm2) to absorb CO2
.
28
The flasks were equilibrated to bath temperature before they were
tipped and the cells mixed with the sewage. Readings were recorded at
l5-min intervals for the first half-hour and then at 30 min intervals
for the duration of the 6 hr incubation period. Uptakes were determined
at 25, 20, 15, 10 and 5 C for each of the three isolates cultured in
either ~ strength m-PCB or sterilized sewage supplemented with 1/5
strength m-PCB for less than 24 hr or for 7 days. Since all suspensions
did not contain the same number of cells, all readings were corrected
to a standard cell concentration (1.2 x 10⁹ cells/ml) using the relation
ship of cell number to Klett reading (Appendix 1). It was assumed that
the rate of oxygen utilization was proportional to the concentration
of cells present in the reaction vessel.

RESULTS
Three locally isolated psycllrophiles, two from aquatic environments
and the other from soil, were selected as test organisms for experiments
in raw and sterilized sewage. Improved growth rates at low temperatures
of these and other isolates were not accomplished by ultraviolet irrad
iation. Of the Alaskan isolates, three were selected for use as inocula
in raw sewage and concentrated synthetic sewage to determine the potential
of psychrophiles used to increase wastewater stabilization at 5 C.
The results obtained in this study will be presented under the
following headings:
I. Analysis of the effect that single and combined local culture
inocula of different size and of different age have on BOD
removals in sterilized sewage at temperatures ranging from 5
to 20 C.
II. Comparison of the BOD removal ability of psychrophiles inoculated
into raw sewage to the removal ability of raw sewage's indigenous
flora.
A. With local isolates.
B. With Alaskan isolates.
III. Comparison of the ability of Alaskan psychrophilic isolates to
stabilize a concentrated synthetic sewage, measured by BOD
and percent BOD reduction, with the stabilization ability of
a known mesophile (fecal coliform) in the same substrate.
IV. Comparison of the effects of inoculated Alaskan psychroplliles
on the chemical and physical composition of the wastewater
substrate with effects exhibited by the raw sewage's indigenous
flora.
V. Comparison between growth rates and oxygen uptake rates of
the three local psychrophilic isolates in heat sterilized sewage.
VI. The effect of pH on the growth and oxidative ability of the
Alaskan isolates in sterile sewage supplemented with 0.05
percent yeast extract.
29

30
I. Analysis of the effect that single and combined local culture
inocula of different size and of different age have on BOD removals in
sterilized sewage at temperatures ranging from 5to 20 c.The first experimental design involved determining what effect
age and size of inocula of the three local psychrophilic isolates and
of a mesophilic population had on percent BOD re~dvgls from sterilized
sewage at temperatures ranging from 5 to 20 C. The composite results
obtained with the four treatments are presented in Table 2 and the
analysis of variance, shown in Table 3, revealed that the effects of
all four treatments and their interactions were significant at the 0.5%
level.
The most significant two-way interactions were size-age, temperature
age, and organism-temperature; the other two-way interactions were not
as significant. The only three-way interactions significant at the 0.5%
level were temperature-size-age and organism-temperature-age.
The results of BOD removals obtained by the single treatment variables
are shown in Tables 4 through 7. The data in these tables were derived
from Table 2 by averaging the percent removal values of the separate
variables of each single treatment over all other identical variables.
The BOD removal for the significant interactions, obtained similarly to
the single treatment variables, are shown in Table 8 through 14 and
Figures 1 and 2.
Table 4 reveals that the pe~cent BOD removed varied among isolates.
The difference among isolates was relatively slight although statistically
significant (Table 3).
The differences in percent removals among temperatures (Table 5)
were greater than differences among organisms; thus, the effect of
temperature was greater than the effect of organism used as the inoculum,
a fact shown by the larger F value for the temperature treatment. There
was little difference between removals at 5 and 10 C, although the
differences between successively higher test temperatures were large.
Table 6 shows that a large inoculum (1010 cells) removed more BOD
than a small inoculum (108 cells). As seen by the large difference
between the two size variables and by the F value from Table 3 for the
size treatment, this treatment had the greatest effect on BOD removals.

31
80 ., T2saX XVI-4
0 XXIV -1
• Mixed
70
60~~
~~~~ 50~0~
~
Z~l) 40~~~
30
L ...I '""""'- ..LI ....J,
o 5 10 15 20
TEMPERATURE (oe)
Figure 1. Average percent BOD removals by the four inocula at
different temperatures.
31
80 ., T2saX XVI-4
0 XXIV -1
• Mixed
70
60~~
~~~~ 50~0~
~
Z~l) 40~~~
30
L ...I '""""'- ..LI ....J,
o 5 10 15 20
TEMPERATURE (oe)
Figure 1. Average percent BOD removals by the four inocula at
different temperatures.

32
80100 1 day, 10 cells
0 1 day, 10 8 cells
A 7 day, 810 cells __________0
6. 7 day, 0 10 "I1 eel :; 070
6004l:>0~4lp:; 50Cl0~
~
Z~U 40 -p:;WP-t
30
o 5 10 15
TEMPERATURE (oC)
20
Figure 2. Average percent BOD removals by large and small
quantities of 1 and 7 day old cultures of inocula at
different temperatures.
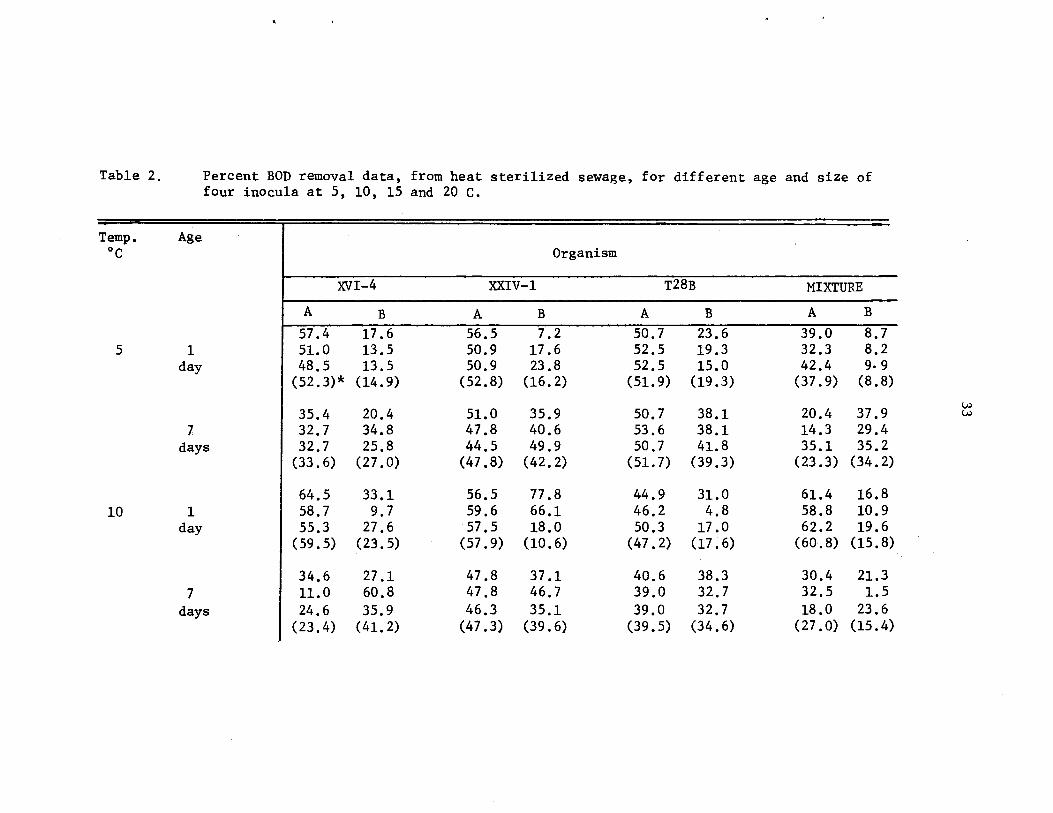
Table 2. Percent BOD removal data~ from heat sterilized sewage~ for different age and size offour inocula at 5~ 10~ 15 and 20 C.
Temp. Age°c Organism
XVI-4 XXIV-1 T28B MIXTURE
A B A B A B A B
57.4 17.6 56.5 7.2 50.7 23.6 39.0 8.75 1 51.0 13.5 50.9 17.6 52.5 19.3 32.3 8.2
day 48.5 13.5 50.9 23.8 52.5 15.0 42.4 9. 9(52.3)* (14.9) (52.8) (16.2) (51.9) (19.3) (37.9) (8.8)
35.4 20.4 51.0 35.9 50.7 38.1 20.4 37.91 32.7 34.8 47.8 40.6 53.6 38.1 14.3 29.4
days 32.7 25.8 44.5 49.9 50.7 41.8 35.1 35.2(33.6) (27.0) (47.8) (42.2) (51.7) (39.3) (23.3) (34.2)
64.5 33.1 56.5 77.8 44.9 31.0 61.4 16.810 1 58.7 9.7 59.6 66.1 46.2 4.8 58.8 10.9
day 55.3 27.6 57.5 18.0 50.3 17.0 62.2 19.6(59.5) (23.5) (57.9) (10.6) (47.2) (17 .6) (60.8) (15.8)
34.6 27.1 47.8 37.1 40.6 38.3 30.4 21.37 11.0 60.8 47.8 46.7 39.0 32.7 32.5 1.5
days 24.6 35.9 46.3 35.1 39.0 32.7 18.0 23.6(23.4) (41.2) (47.3) (39.6) (39.5) (34.6) (27 . 0) (15 •4)
VJVJ
Table 2. Percent BOD removal data t from heat sterilized sewage t for different age and size offour inocula at 5, 10, 15 and 20 C.
..
Temp. Age°c Organism
XVI-4 XXIV-1 T28B MIXTURE
A B A B A B A B
57.4 17.6 56.5 7.2 50.7 23.6 39.0 8.75 1 51.0 13.5 50.9 17.6 52.5 19.3 32.3 8.2
day 48.5 13.5 50.9 23.8 52.5 15.0 42.4 9· 9(52.3)* (14.9) (52.8) (16.2) (51.9) (19.3) (37.9) (8.8)
35.4 20.4 51.0 35.9 50.7 38.1 20.4 37.97 32.7 34.8 47.8 40.6 53.6 38.1 14.3 29.4
days 32.7 25.8 44.5 49.9 50.7 41.8 35.1 35.2(33.6) (27.0) (47.8) (42.2) (51.7) (39.3) (23.3) (34.2)
64.5 33.1 56.5 77.8 44.9 31.0 61.4 16.810 1 58.7 9.7 59.6 66.1 46.2 4.8 58.8 10.9
day 55.3 27.6 57.5 18.0 50.3 17.0 62.2 19.6(59.5) (23.5) (57.9) (10.6) (47.2) (17 ~ 6) (60.8) (15.8)
34.6 27.1 47.8 37.1 40.6 38.3 30.4 21.37 11.0 60.8 47.8 46.7 39.0 32.7 32.5 1.5
days 24.6 35.9 46.3 35.1 39.0 32.7 18.0 23.6(23.4) (41.2) (47.3) (39.6) (39.5) (34.6) (27 .0) (15.4)

Table 2. Percent BOD removal data. from heat sterilized sewage. for different age and size offour inocula at 5. 10. 15 and 20 c.
Temp. Age Organism°c
XVI-4 XXIV-1 T28B MIXTURE
A B A B A B A B
83.3 46.8 79.5 47.7 66.0 39.8 77.1 64.815 1 47.4 53.2 78.7 51.0 60.9 38.6 86.0 63.6
day 49.2 38.2 85.1 69.3 56.9 46.2 80.5 63.6(60.0) (46.1) (81.1) (56.0) (61.3) (41.5) (81.2) (64.0)
58.5 48.5 62.5 43.9 33.9 26.4 41.6 35.27 57.8 49.4 69.5 39.5 29.0 27.1 51.5 36.1
days 57.4 49.4 62.5 34.1 31.9 28.1 43.8 35.2(57.8) (49.1) (64.8) (39.2) (31.6) (27.• 1) (45.6) (35.5)
69.9 72.4 76.0 79.4 62.8 55.9 85.2 52.920 1 70.5 69.6 73.7 76.5 59.8 54.5 86.6 52.2
day 71.0 63.2 76.9 78.9 61.0 55.3 86.6 55.5(70.4) (68.4) (75.3) (78.3) (61.2) (55.2) (86. 2) ( 53 •2)
63.3 45.3 70.8 67.7 57.6 45.6 84.4 79.07 55.5 43.8 71.4 62.4 65.7 46.3 87.1 84.5
days 52.6 44.5 74.8 27.7 67.2 44.0 85.5 79.6(57.1) (44.6) (72.3) . (52.6) (63.5) (45.3) (85.6) (81.0)
7A - Initial inoculum of approximately 2 x 10 ce1ls/m1
5B - Initial inoculum of approximately 2 x 10 ce11s/ml
* - (Average value)
W.I::'-
Table 2. Percent BOD removal data, from heat sterilized sewage, for different age and size offour inocula at 5, 10, 15 and 20 c.
Temp. Age Organism°c
XVI-4 XXIV-1 T28B MIXTURE
A B A B A B A B
83.3 46.8 79.5 47.7 66.0 39.8 77.1 64.815 1 47.4 53.2 78.7 51.0 60.9 38.6 86.0 63.6
day 49.2 38.2 85.1 69.3 56.9 46.2 80.5 63.6(60.0) (46.1) (81.1) (56.0) (61.3) (41.5) (81.2) (64.0)
58.5 48.5 62.5 43.9 33.9 26.4 41.6 35.27 57.8 49.4 69.5 39.5 29.0 27.1 51.5 36.1
days 57.4 49.4 62.5 34.1 31.9 28.1 43.8 35.2(57.8) (49.1) (64.8) (39.2) (31.6) (27.,.1) (45.6) (35.5)
69.9 72.4 76.0 79.4 62.8 55.9 85.2 52.920 1 70.5 69.6 73.7 76.5 59.8 54.5 86.6 52.2
day 71.0 63.2 76.9 78.9 61.0 55.3 86.6 55.5(70.4) (68.4) (75.3) (78.3) (61.2) (55.2) (86.2) (53.2)
63.3 45.3 70.8 67.7 57.6 45.6 84.4 79.07 55.5 43.8 71.4 62.4 65.7 46.3 87.1 84.5
days 52.6 44.5 74.8 27.7 67.2 44.0 85.5 79.6(57.1) (44.6) (72.3) (52.6) (63.5) (45.3) (85.6) (81.0)
7A - Initial inoculum of approximately 2 x 10 ce11s/ml
5B - Initial inoculum of approximately 2 x 10 cel1s/rn1
* - (Average value)

35
Table 3. Four-way analysis of variance of percent BOD removaldata for different age and size of four inocula at 5,10, 15, and 20 c.
SOURCE d.f. Sum Squares Mean FSquare
Total 191 80,531.79
Treatments 63 73,506.17
Organisms (0) 3 2,133.40 711.13 12.96***
Temperature (T) 3 32,509.43 10,836.48 197.42***
Size (S) 1 13,227.71 13,227.71 240.99***
Age (A) 1 1,302.13 1,302.13 23.72***
Interactions
o · T 9 5,867.90 651.99 11.88***
o · S 3 411.78 137.28 2.50
0 ·A 3 274.94 91.65 1.67
T • S 3 547.51 182.50 3.32**
T • A 3 3,291.58 1,097.19 19.98***
s • A 1 3,763.11 3,763.11 68.55***
0 • T • S 9 1,327.98 147.55 2.69**
0 · T • A 9 4,916.83 546.31 9.95***
o · s • A 3 499.74 166.58 3.03*
T • S • A 3 3,539.71 1,179.90 21.05***
0 T S .A 9 1,194.55 132.73 2.42*
Residual 128 7,025.62 54.89
Significance levels: * 5.0%
** 2.5%
*** 0.5%
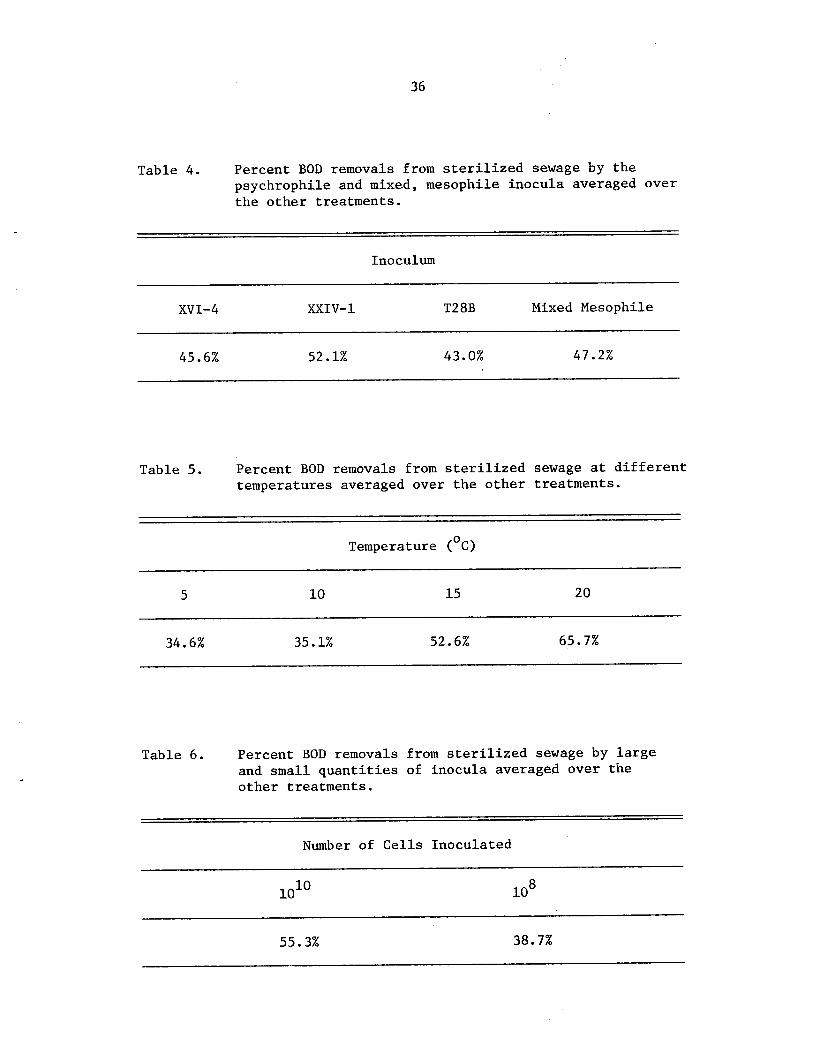
Table 4.
36
Percent BOD removals from sterilized sewage by thepsychrophile and mixed, mesophile inocula averaged overthe other treatments.
Inoculum
XVI-4
45.6%
XXIV-l
52.1%
T28B
43.0%
Mixed Mesophile
47.2%
Table 5. Percent BOD removals from sterilized sewage at differenttemperatures averaged over the other. treatments.
oTemperature ( C)
5
34.6%
10
35.1%
15
52.6%
20
65.7%
Table 6. Percent BOD removals from sterilized sewage by largeand small quantities of inocula averaged over theother treatments.
Number of Cells Inoculated
55.3% 38.7%
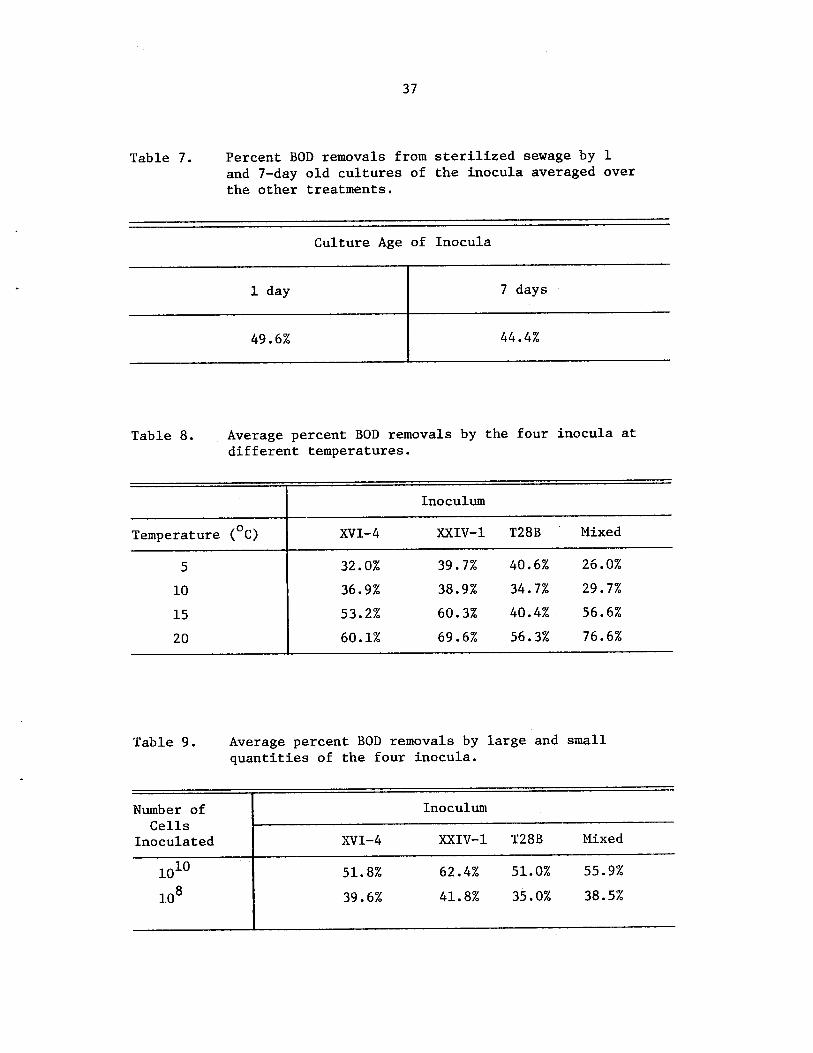
Table 7.
37
Percent BOD removals from sterilized sewage by 1and 7-day old cultures of the inocula averaged overthe other treatments.
Culture Age of Inocula
1 day
49.6%
7 days
44.4%
Table 8. Average percent BOD removals by the four inocula atdifferent temperatures.
Inoculum
Temperature (oC) XVI-4 XXIV-l T28B Mixed
5 32.0% 39.7% 40.6% 26.0%
10 36.9% 38.9% 34.7% 29.7%
15 53.2% 60.3% 40.4% . 56.6%
20 60.1% 69.6% 56.3% 76.6%
Table 9. Average percent BOD removals by large and smallquantities of the four inocula.
Number of InoculumCells
Inoculated XVI-4 XXIV-l T28B Mixed
1010 51.8% 62.4% 51.0% 55.9%
l08 39.6% 41.8% 35.0% 38.5%

Table 10.
38
Average percent BOD removals by 1 and 7-day oldcultures of the four inocula.
Culture InoculumAge
XVI-4 XXIV-l T28B Mixed
1 day 49.4% 53.5% 44.4% 51.0%
7 days 41.7% 50.7% 41.6% 43.5%
Table 11. Average percent BOD removals of large and smallquantities of inocula at different temperatures.
Number of Temperature (oC)Cells
Inoculated' 5 10 15 20
1010 43.9% 45.3% 60.4% 71.5%
108 25.2% 24.8% 44.8% 59.9%
Table 12. Average percent BOD removals by I and 7-day oldcultures of inocula at different temperatures.
Culture Temperature (oC)
Age5 10 15 20
I day 31.8% 36.6% 61.4% 68.6%
7 days 37.4% 33.5% 43.8% 62.8%

Table 13.
39
Average percent BOD removals by large and smallquantities of 1 and 7-day old cultures of inocula.
Number of Culture Age of InoculaCells
Inoculated 1 day 7 days
1010 62.3% 48.2%
108 36.9% 40.5%
Table 14. Average percent BOD removals by large and smallquantities of 24 hour and 7 day old cultures of inoculaat different temperatures.
Number of Temperature (oC)Culture Cells
Age Inoculated 5 10 15 20
1 day 1010 48.7% 56.3% 70.9% 73.3%
108 14.8% 16.9% 51.9% 63.9%
7 days 1010 39.1% 34.3% 50.0% 69.7%
108 35.7% 32.7% 37.7% 55.9%
The effect of culture age (Table 7) was relatively slight compared
to the temperature and size treatments, but was still significant
(Table 3).
The organism-temperature interaction data (Table 8, Figure 1)
revealed that changes in temperature affected each organism's ability
to remove BOD differently, with the mixed, mesophilic inoculum being
affected the most and T28B the least. Although T28B removed the

40
least percent BOD over the entire temperature range studied, it removed
the greatest percent at 5 C.
As seen in Table 9, showing the average percent BOD removed by two
sizes each of four inocula, a smaller inoculum removed less BOD than
a larger inoculum - a fact consistent with the data from Table 6. The
effect of a smaller inoculum on BOD removed was similar for each
organism, indicating that no organism-size interaction existed (a small,
insignificant F value).
The data, presented in Table 12, for the temperature-age interaction
showed that 7-day cultures removed more BOD at 5 C than did I-day cultures,
although, at 10, 15, and 20 C, 7-day cultures removed less than 24 hour
cultures. The significance of this difference at 5 C was confirmed by
the F value given for this interaction.
The size-age interaction disclosed that a small inoculum of 7-day
old cultures removed more BOD than I-day old culture~, but a large
inoculum of 7-day old cultures removed much less percent BOD than old
cultures. The significance of these findings, which opposed the general
tendency of lower removals by 7-day cultures, could also be seen by
the large F value.
The average percent BOD removed by two ages of two inoculum sizes
at different temperatures, the temperature-size-age interaction, are
shown in Table 14 and Figure 2. At 5 and 10 C, I-day cultures of small
inocula removed less BOD than corresponding 7-day cultures; however,
at 15 and 20 C, I-day e.ultures of small inocula removed more BOD.
Relationships found in the two-way interactions (Table 11-13) could
also be verified as shown in Table 14.
Table 15 shows percent BOD removals by 1 and 7-day old inocula
of combinations of the three isolates at 5, 10, 15, and 20 C. Because
only the large inoculum (1010 cells) was used, the data of Table 15
and the data for the large inoculum of Table 2 were statistically analy
zed together. The results of the analysis (Table 16) disclosed that
all treatments and their interactions were statistically significant.
Table 17 shows that there was little detectable difference in percent
removals between single and combined culture inocula.
The effect of temperature on percent BOD removals by the indigenous
flora of raw sewage is given in Table 18. Low temperature (5 C) had

41
Table 15. Percent BOD removal data, from heat sterilized sewage fordifferent aged combinations of inocula at 5, 10, 15, and20 c.
Temp. Age Organisms.
(Oc) (days)A B C D
50.4 11.2 34.2 68.55 1 52.3 12.6 33.2 66.5
51.4 9.7 31.1 63.6(51.4)* (11.2) (32.8) (66.2)
18.7 31.3 22.4 41.37 21.5 27.8 16.7 36.2
25.6 25.5 31.9 56.4(21.9) (28.2) (23.7) (44.6)
58.7 58.7 73.3 70.810 1 40.6 61.6 72.0 68.2
46.3 57.8 89.2 68.9(48.5) (59.3) (78.2) (69.3)
45.6 47.3 34.2 36.17 55.5 49.1 36.2 26.0
50.0 46.4 34.2 30.5(50.4) (47 .5) (34.8) (30.9)
52.5 62.8 60.9 61.015 1 49.1 61.0 59.3 50.0
46.9 60.1 60.1 64.6(49.5) (61.3) (60.1) (58.6)
54.7 54.8 66.8 68.07 54.1 55.7 62.4 65.0
56.1 55.7 65.0 66.5(55.0) (55.4) (64.7) (66.5)
54.9 61.7 71.8 70.620 1 58.8 66.6 72.4 70.0
83.6 63.0 73.0 71.6(65.8) (63.8) . (62.4) (70. 7)
67.4 76.1 74.6 73.97 69.1 76.6 72.9 70.0
70.2 76.6 74.6 71.6(68.9) (76.4) (74.0) (71.8)
A - XVI-4 & T28B, B - XVI-4 & XXIV-I, C - T28B & XXIV-I,D - XVI-4 & T28B & XXIV-I.* - (average value)
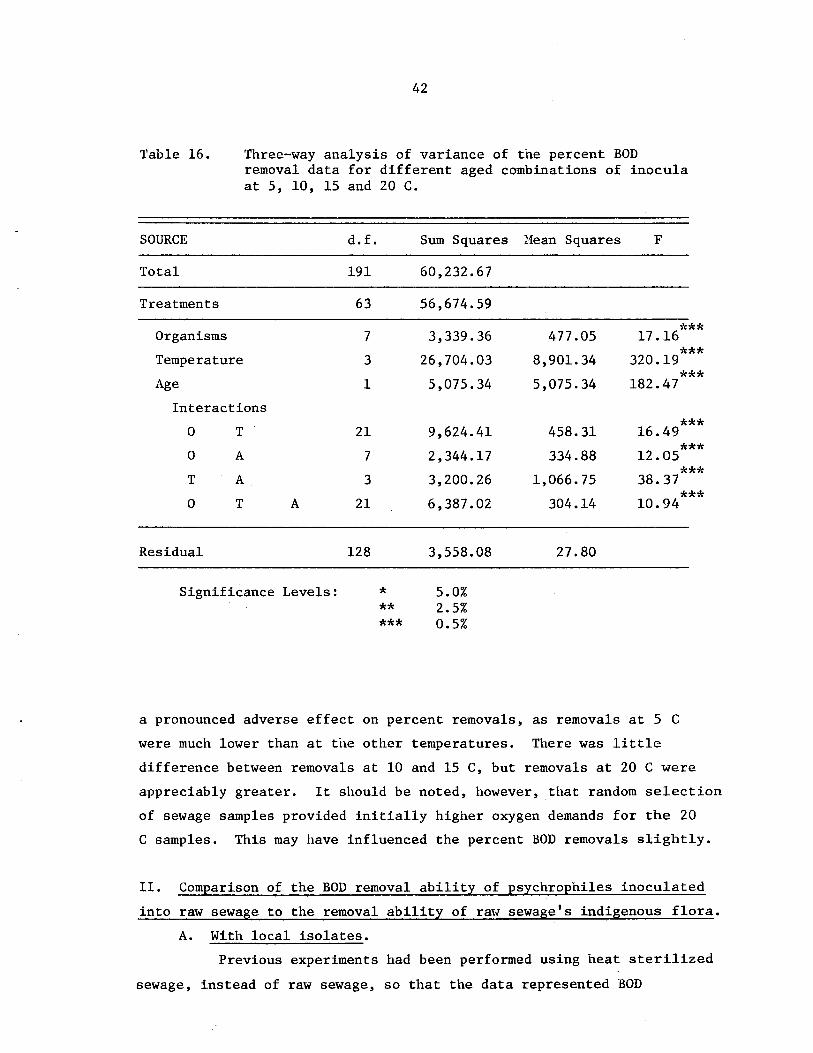
Table 16.
42
Three-way analysis of variance of the percent BODremoval data for different aged combinations of inoculaat 5, 10, 15 and 20 C.
SOURCE d.f. Sum Squares Hean Squares F
Total 191 60,232.67
Treatments 63 56,674.59
***Organisms 7 3,339.36 477.05 17.16***Temperature 3 26,704.03 8,901.34 320.19***Age 1 5,075.34 5,075.34 182.47
Interactions***0 T 21 9,624.41 458.31 16.49***0 A 7 2,344.17 334.88 12.05***T A 3 3,200.26 1,066.75 38.37***0 T A 21 6,387.02 304.14 10.94
Residual 128 3,558.08 27.80
Significance Levels: * 5.0%** 2.5%*** 0.5%
a pronounced adverse effect on percent removals, as removals at 5 C
were much lower than at the other temperatures. There was little
difference between removals at 10 and 15 C, but removals at 20 C were
appreciably greater. It should be noted, however, that random selection
of sewage samples provided initially higher oxygen demands for the 20
C samples. This may have influenced the percent BOD removals slightly.
II. Comparison of the BOD removal ability of psychrophiles inoculated
into raw sewage to the removal ability of raw sewage's indigenous flora.
A. With local isolates.
Previous experiments had been performed using heat sterilized
sewage, instead of raw sewage, so that the data represented BOD
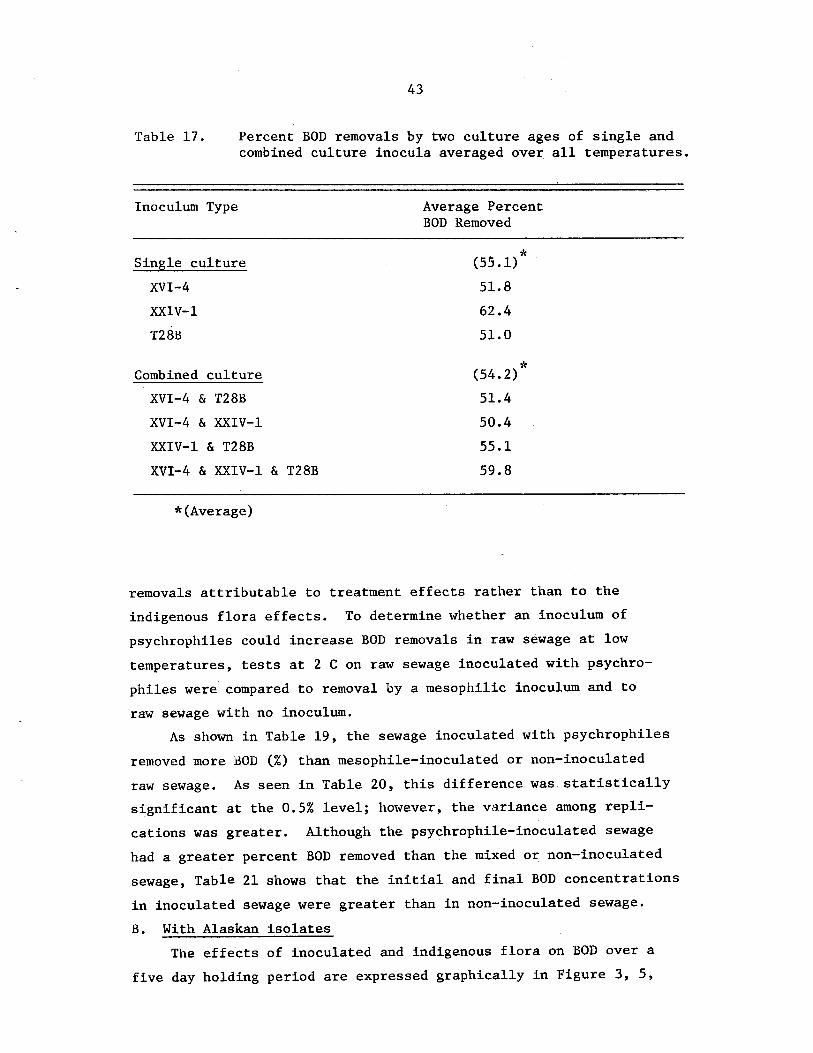
43
Table 17. Percent BOD removals by two culture ages of single andcombined culture inocula averaged over all temperatures.
Inoculum Type Average PercentBOD Removed
Single culture
XVI-4
XXIV-l
T28B
Combined culture
XVI-4 & T28B
XVI-4 & XXIV-l
XXIV-l & T28B
XVI-4 & XXIV-l & T28B
*(Average)
*(55.1)
51.8
62.4
51.0
*(54.2)
51.4
50.4
55.1
59.8
removals attributable to treatment effects rather than to the
indigenous flora effects. To determine whether an inoculum of
psychrophiles could increase BOD removals in raw sewage at low
temperatures, tests at 2 C on raw sewage inoculated with psychro
philes were compared to removal by a mesophilic inoculum and to
raw sewage with no inoculum.
As shown in Table 19, the sewage inoculated with psychrophiles
removed more tiOD (%) than mesophile-inoculated or non-inoculated
raw sewage. As seen in Table 20, this difference was statistically
significant at the 0.5% level; however, the variance among repli
cations was greater. Although the psychrophile-inoculated sewage
had a greater percent BOD removed than the mixed or non-inoculated
sewage, Table 21 shows that the initial and final BOD concentrations
in inoculated sewage were greater than in non-inoculated sewage.
B. With Alaskan isolates
The effects of inoculated and indigenous flora on BOD over a
five day holding period are expressed graphically in Figure 3, 5,

44
rJ
120 a uninoculated control
C B-6 i.noeulUfi1
r-...
100 J[] c 0
r-I •-- DbOS •,." 80t=l •0~
60
0 1 2 3 4 5Detention Time (Days)
Figure 3. A plot of BOD in treated and untreated raw settled
se'\"age at 5 C expressed as a function of time.
l~J
a uninoculated control
[J B-6 inoculum(J) 30~ CQ
-..-I"-JU~ •"t:laJ
20$-t
~0P1
~
r.:C C4])
u 10lo-lI1J
P-l •O. I
0 1 2 3 4 5Detention Time (Days)
Figure 4. A plot of percent BOD reductions in treated and untreated
raw settled sewage at 5 C expressed as a function of time.

45
no} E!1 uninoculated contro!'
e B-39 inoculum
90I D r.Jill
:! 0
-, I cro'! •......... 70o.c
1..
f:"J'-'
t=10P=l
500 1 2 3 4 5
Detention Time (Days)
Figure 5. A plot of BOD in treated and untreated raw settled
sewage at 5 C expressed as a function of time.
40
" uninoculated control
C B·-39 inoculum30
[J)
s::II0
D-rI.LJc.J:;j
C"'t:l 20<!J~
Q C0 CP=l •~_I •s:: 10(1)
CJ~ •(j)
Pol
0 II I i0 1 2 3 4 .5
Detention Time (Days)
:Figure6. A plot of percent BOD reductions in treated and untreated
raw settled sewage at 5 C expressed as a function of time.
45
no} E!1 uninoculated control
e B-39 inoculum
90I D r.Jill
:! 0
-, I cro'! •......... 70o.c
1..
f:"J'-'
t=10P=l
500 1 2 3 4 5
Detention Time (Days)
Figure 5. A plot of BOD in treated and untreated raw settled
sewage at 5 C expressed as a function of time.
40
" uninoculated control
C B·-39 inoculum30
[J)
s::II0
D-rI.LJc.J:;j
C"'t:l 20<!J~
Q C0 CP=l •~_I •s:: 10(1)
CJ~ •(j)
Pol
0 II I i0 1 2 3 4 .5
Detention Time (Days)
:Figure6. A plot of percent BOD reductions in treated and untreated
raw settled sewage at 5 C expressed as a function of time.

46
111Jl..·
f'"
il
~j uninoc'.l:La ted c.ontrol
o C :i noculum
lUiJ o
~
0 0 rJa c_.
/',
.--l-bfJ~
'-' 80-1PI-~J
~·1
6oL----'-"i------r.------r-.--'------rl-----,.-o 1 234
Detention Time (Days)
Figure 7. A plot of BOD in treated and untreated raw settled
sewage at 5 C expre:3:;eu as a func tion of time.
I
.5
rJ
I4
oo
o
I
1
c
3 uninoculated control
l1 C i nOCU1UItl
, I2 3
Detention Ti~e (DdyS)
Figure 8. A plot of percent ROD redl~ctions in treated and ttntreat:.~d
[I)
~0
.,.-i.1-1c.J:-1
"'CJ(])
$-I 20~0r:t~
.w~~
(J
10HQ)
Ip...
Io .~~
0
rU1:./ sett.led se:"age at 5 C expressed as a functior. or: t.i.m"_'.

Table 18.
47
Initial BOD, change in BOD, and percent BOD removedfor the raw sewage control (no inoculum) at 5, 10, 15,and 20 c.
5
10
15
20
*(Average)
Initial BOD
125.0 190.0140.0 240.0
. 180.0 155.0240.0 185.0165.0 164.0115.0 222.9
(176.8)*
-195.0 130.0175.0 205.0175.0 175.0165.0 190.0175.0 265.0190.0 195.0
(194.6)
150.0 200.070.0 205.0
170.0 140.0210.0 227.5160.0 275.0
(180.8)
350.0 330.0300.0 230.0579.0 260.0186.8 145.0180.0 165.0210.0 235.0
(264.2)
Change in BOD
62.5 62.032.5 136.098.0 39.0
124.0 65.049.0 92.043.0 134.9
(78.2)
101.0 94.095.0 165.0
141.0 121.0105.0 150.0147.0 189.0148.0 205.0
(138.4)
104.0 104.028.0 161.0
122.0 115.0143.3 169.2106.0 213.0
(131.0)
298.0 301.7272.0 174.0561.0 216.0154.8 115.0142.0 115.0158.0 171.0
(223.2)
PercentBOD removed
50.0 32.623.2 56.854.4 25.151.7 35.129.7 56.137.4 60.5
(42.7)
51.8 72.354.3 80.580.6 69.163.6 79.084.0 71.377.9 69.5
(71.2)
69.3 74.040.0 78.571.8 82.168.2 74.466.2 77.4
(70.2)
85.1 91.490.7 75.696.7 83.187.7 79.478.9 69.775.1 72.8
(81.8)
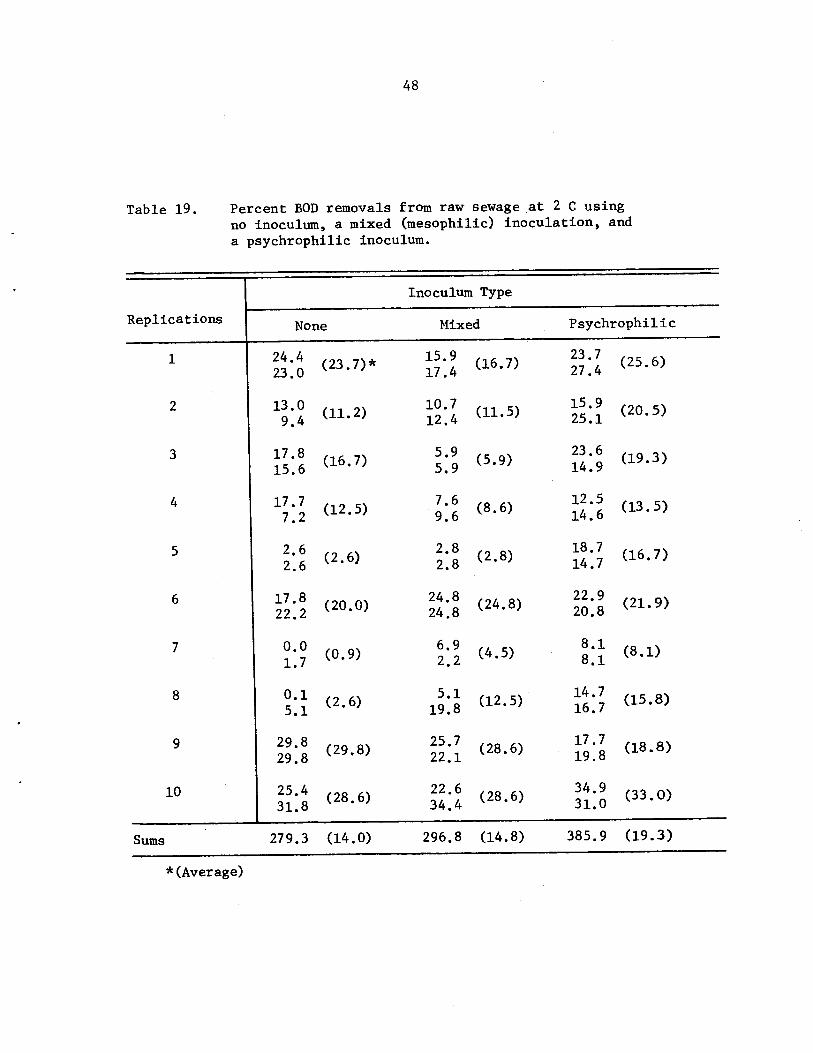
48
Table 19. Percent BOD removals from raw sewage at 2 C usingno inoculum, a mixed (mesophilic) inoculation, anda psychrophi1ic inoculum.
Inoculum Type
Replications None Mixed Psychrophilic
1 24.4(23.7) * 15.9 (16.7) 23.7 (25.6)23.0 17.4 27.4
2 13.0 (11.2) 10.7 (11.5) 15.9 (20.5)9.4 12.4 25.1
3 17.8 (16.7) 5.9 (5.9) 23.6 (19.3)15.6 5.9 14.9
4 17.7 (12.5) 7.6 (8.6) 12.5 (13.5)7.2 9.6 14.6
5 2.6 (2.6) 2.8 (2.8) 18.7 (16.7)2.6 2.8 14.7
6 17.8 (20.0) 24.8 (24.8) 22.9 (21.9)22.2 24.8 20.8
7 0.0 (0.9) 6.9 (4.5) 8.1 (8.1)1.7 2.2 8.1
8 0.1 (2.6) 5.1 (12.5) 14.7 (15.8)5.1 19.8 16.7
9 29.8 (29.8) 25.7 (28.6) 17.7 (18.8)29.8 22.1 19.8
10 25.4 (28.6) 22.6 (28.6) 34.9 (33.0)31.8 34.4 31.0
Sums 279.3 (14.0) 296.8 (14.8) 385.9 (19.3)
*(Average)

Table 20.
49
Analysis of variance for the effect that a psychrophilic,a mesophilic, and no inoculum have on BOD removals fromraw sewage within 5 hr at 2 c.
Source df Sum Squares Mean Squares F
Total 59 5,145.98***Treatments 2 327.12 163.56 6.55
(Inoculum)***Replications 9 3,625.19 402.80 16.12
Residual 48 1,193.67 24.87
Significance levels: * 5.0%** 2.5%*** 0.5%
and 7. Each point on the graph was the arithmetic average of
three experimental determinations. The trend exhibited by both
inoculated psychrophiles and indigenous flora present in the
uninoculated raw sewage was generally that of a gradual decline.
The exception to this can be seen in Figure 3 where the BOD
decreased up through the first three days of incubation then increa
sed for the remaining two days. Differences between the BODs of
inoculated and uninoculated systems were slight.
Percent BOD reductions represented in Figures 4, 6, and 8
indicate a trend toward increasing removals with increasing periods
of detention. However, at no time during the five day incubation
did any of the systems examined approach reductions to the 80
percent level, the minimum usually required. Differences between
percent BOD reductions of inoculated and uninoculated systems were
also slight as could be expected in view of the fact that differences
between their BOD values were small.
Psychrophilic cell growth in the raw settled sewage substrate
is described in Figures 9 through 11 for both inoculated micro
organisms and those naturally present in the uninoculated sewage.
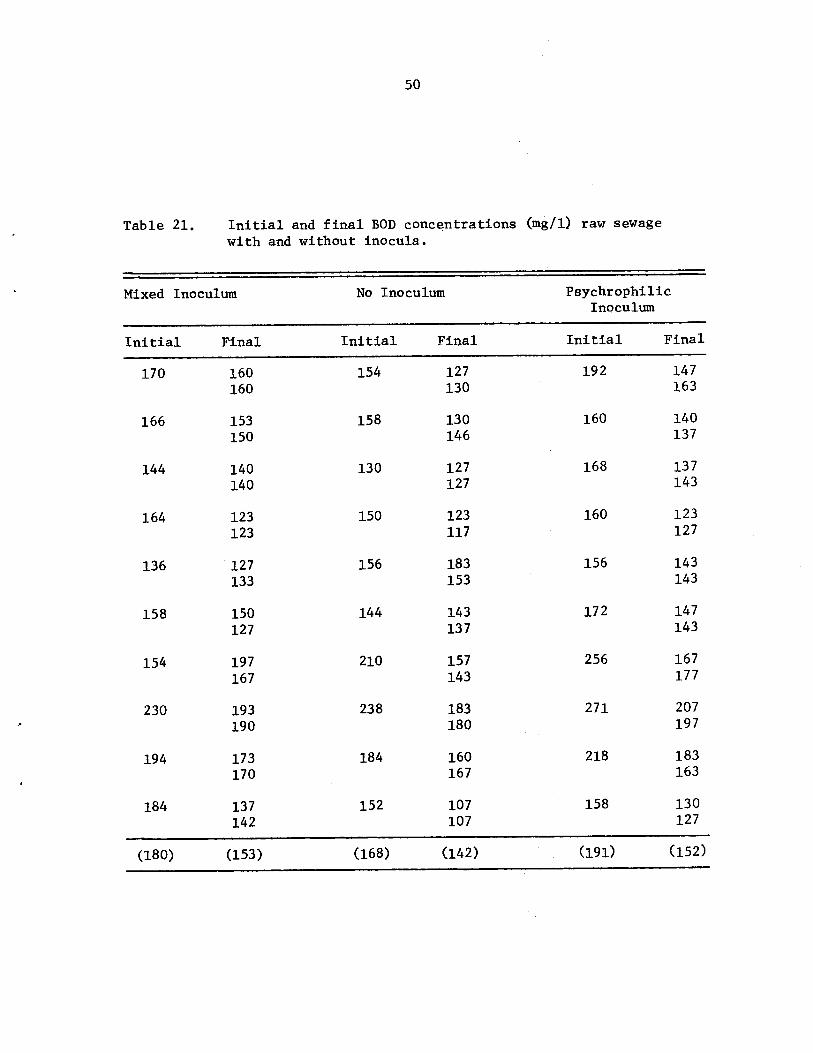
Table 21.
so
Initial and final BOD conc~ntrations (mg/1) raw sewagewith and without inocula.
Mixed Inoculum No Inoculum Psychrophi1icInoculum
Initial Final Initial Final Initial Final
170 160 154 127 192 147160 130 163
166 153 158 130 160 140150 146 137
144 140 130 127 168 137140 127 143
164 123 150 123 160 123123 117 127
136 127 156 183 156 143133 153 143
158 150 144 143 172 147127 137 143
154 197 210 157 256 167167 143 177
230 193 238 183 271 207190 180 197
194 173 184 160 218 183170 167 163
184 137 152 107 158 130142 107 127
(180) (153) (168) (142) (191) (152)

Figure 9
Viable psychrophilic cell number in
treated and untreated raw settled
sewage at 5 C expressed as a function
of time.
Figure 10
Viable psychrophilic cell number in
treated and untreated raw settled
sewage at 5 C expressed as a function
of time.
Figure 9
Viable psychrophilic cell number in
treated and untreated raw settled
sewage at 5 C expressed as a function
of time.
Figure 10
Viable psychrophilic cell number in
treated and untreated raw settled
sewage at 5 C expressed as a function
of time.
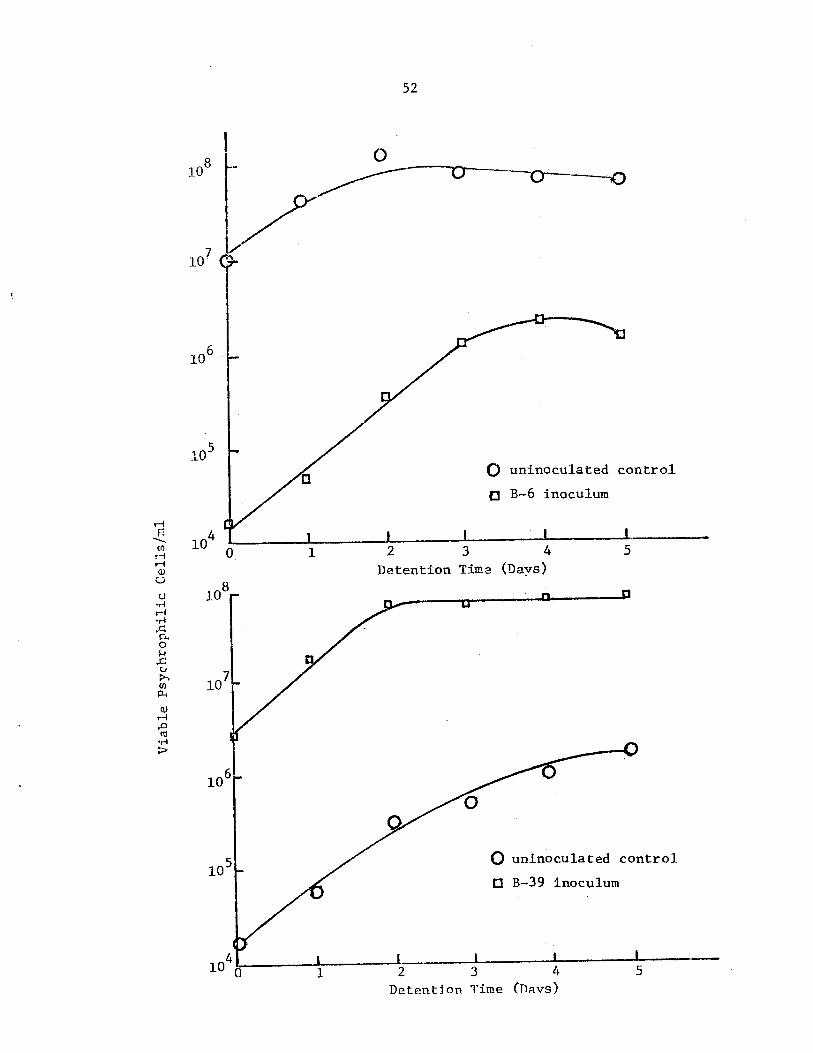
52
o
~o
5
() uninoculated control
C B-6 inoculum
() uninoculated control
C B-39 inoculum
2 3 4Detention Tima (Days)
1
104!- ~ -~I::----___:~I------.JI~---..JI~---o 1 234 5
Detention Time (Davs)
52
o
~o
5
() uninoculated control
C B-6 inoculum
() uninoculated control
C B-39 inoculum
2 3 4Detention Tima (Days)
1
104!- ~ -~I::----___:~I------.JI~---..JI~---o 1 234 5
Detention Time (Davs)
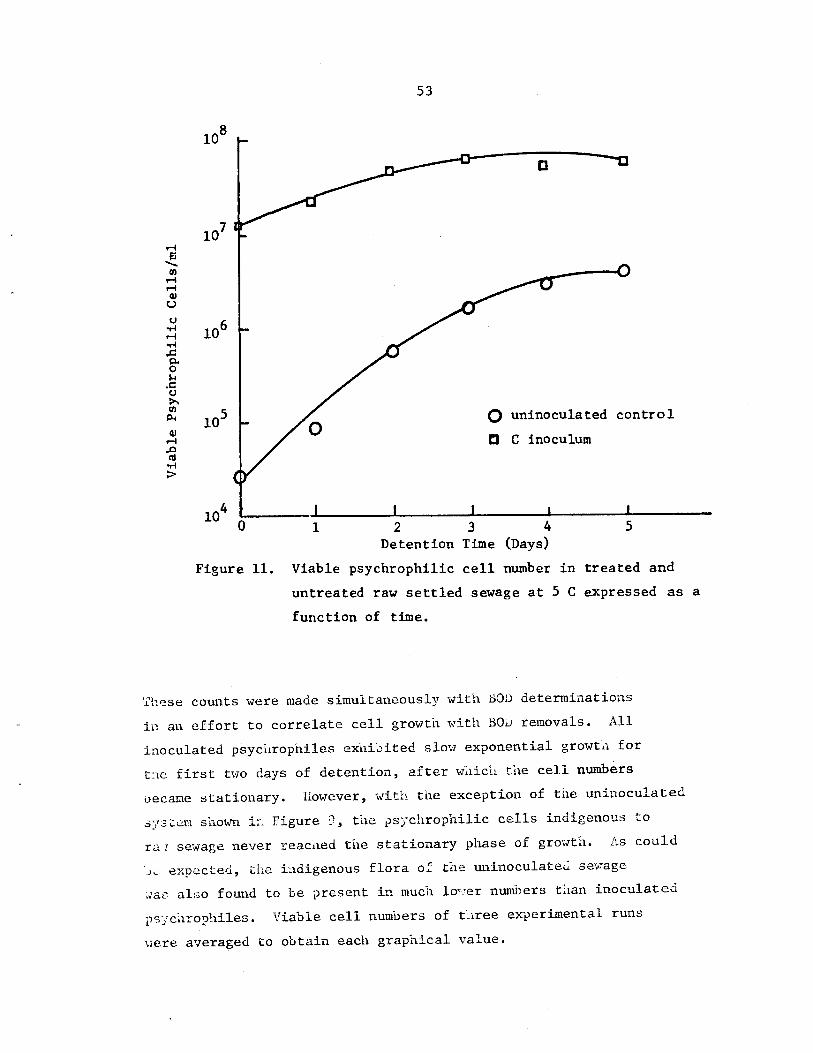
53
D
() uninoculated control
tI C inoculum
104 I I I I I0 1 2 3 4 5
Detention Time (Days)
Figure 11. Viable psychrophilic cell number in treated and
untreated raw settled sewage at 5 C expressed as a
function of time.
lh~se counts were made simultaneously with BOD determinations
i~ au effort to correlate cell growth with BOD removals. All
inoculated psycllrophiles exhibited 81m·] exponential growt·l.l for
t:1C first t'\'l0 days of detention, after \vllich tile cell numbers
iJecame stationary. However, '\vitl1- the exception of the uninocula ted
';:,Tst:2.m shown iT: Figure 0, the psychrophilic cells indigenous to
raT se·",age never reaclled the stationary phase of growth. As could
.J";. expected, the iadigenous flora of the ullinoculateJ se",~age
\'Jas also found to be present in much lm"'er numbers than inoculated
psycilrophiles. Viable cell numbers of t·~l.ree experimental runs
\lere averaged to obtain each graphical value.

510
510
470
450
,-..r-I-.t·t 430~
'-"
c-~0~
410
390
370
350
54
¢ fecal coliform control
o B- 6 i.noculum
C B-39 inoculum
A C inoculum
330 o 1 2 3J
4 5Detention Time (Days)
Figure 12. The effects of inoculated microorganisms on the BOD
of concentrated synthetic sewage at 5 C expressed as
a function of time.
510
510
470
450
,-..r-I-.t·t 430~
'-"
c-~0~
410
390
370
350
54
¢ fecal coliform control
o B- 6 i.noculum
C B-39 inoculum
A C inoculum
330 o 1 2 3J
4 5Detention Time (Days)
Figure 12. The effects of inoculated microorganisms on the BOD
of concentrated synthetic sewage at 5 C expressed as
a function of time.

(
55
30 o fecal coliform control
UI o B-6 inoculum~0 C B-39 inoculum~
~ 20(J A C inoculum::3"t1
GJ~
~0~ 10~
~,
GJ.(J~GJ
p.. 01 3 4 5
Detention Time (Days)
Figure 13. The effects of inoculated microorganisms on percent BOD
reductions in concentrated synthetic sewage at 5 C
expressed as a function of time.
ill. Comparison of the ability o~ Alaskaa psychrophilic isolates to
stabilize a concentrated synthetic sel.vage, measured by BOD and percent
.dOD reduction, vlitll the stabilization ability of a known mesophilE:
(fecal coliform) in the SaT:le substrate.
The effects of inoculated psychrophiles on tile BuD of a concen
trated synthetic sewage as compared to effects exerted by a fecal
coliform inoculated in liLe manner as a me~,ophilic control are presented
in figure 12.
Systems inoculated \Jith organisms 11-3) and C Slim; trends tOFard
d\~creasing BOD values. 'fhe system inoculated \vithorganism ~~-6 exlli"Dited
a relatively rapid reduction of BOD within the first two days of holding
after which very little appears to have been removed. The fecal coliform
system demonstrated rather extreme increaC:.2s in BOD at the second and
third days of detention; hmlever, after t~le third day of dete:1tion tne
BOD dropped back to sliglitly helm; initial values. As expected, the
trend exhibited by the fecal coliform did not appear to be one of a
decreasing bOD.

56
o B-6 inoculum
o B-39 inoculum
b C inoculum
105 I I I _. I .L--____
0 1 2 3 4 5
Detention Time (D.'lys)
Figure 14. V:Lable psychrophil ic cell nt.;mbf:>.r in trea ted arld
untreated concentrated Aynthetic sewage at 5 C
expressed as a function of ti:me.
Figure 13 gives percent BOD reduction in tue psychrophilic and
mesophilic systems. Data contained in this Figure indicates that
proportionacely less reductions in ~DD were obtained in the conccntrat2d
syntrletic se"'lag2 by each psychrophile than i:1 the ra~" settled seT/.Tage
substrate previously described, although more aDsolute BOD was removed
by each organism in the synthetic system as shm~rn in Figure 12. ?ercent
~OD reductions in the mesophilic fecal coliform systcn were very Ie,;
grade, never exceeding J percent.
ViaiJle psychrophilic cell numbers in th(; concentrated t>ubstrate
are given in Figure 14. These curves resemble t~le curves produced
!.ly each psycLlrophile in the raH settled se'4Jage in that cell numbers
increased only slightly more than one log unit over the five day
56
o B-6 inoculum
o B-39 inoculum
b C inoculum
105 I I I _. I .L--____
0 1 2 3 4 5
Detention Time (D.'lys)
Figure 14. V:Lable psychrophil ic cell nt.;mbf:>.r in trea ted arld
untreated concentrated Aynthetic sewage at 5 C
expressed as a function of ti.'ille.
Figure 13 gives percent BOD reduction in tue psychrophilic and
mesophilic systems. Data contained in this Figure indicates that
proportionacely less reductions in ~DD were obtained in the conccntrat2d
syntrletic se"'lag2 by each psychropnile than i:1 the ra~" settled seT/.Tage
substrate previously described, although more aDsolute BOD was removed
by each organism in the synthetic system as shm~rn in Figure 12. ?ercent
~OD reductions in the mesophilic fecal coliform systcn were very Ie,:
grade, never exceeding J percent.
ViaiJle psychrophilic cell numbers in th(; concentrated t>ubstrate
are given in Figure 14. These curves resemble t~le curves proQuced
!.ly each psycLlrophile in the raH settled se'4Jage in that cell numbers
increased only slightly more than one log unit over the five day

57
period of incubation and cell growth was very slow. However, organisms
B-39 and C were still increasing in number at the end of the five day
period as contrasted to their growth in raw settled sewage where they
reached the stationary phase of growth in two days. Organism B-6
reached the stationary phase of growth in three days in the concentrated
synthetic sewage as compared to two days required to attain the same
stage of growth in the raw settled sewage. Since the fecal coliform
was mesophilic in nature, no growth was obtained in the flasks containing
this organism due to the low incubation temperature and for this reason
Figure 14 contains no data for this organism.
IV. Comparison of the effects of inoculated Alaskan psychrophiles
on the chemical and physical composition of the wastewater substrate
with effects exhibited by the raw sewage's indigenous flora.
In order to determine what effects were being exerted upon the
chemical and physical composition of the wastewater by inoculated
psychrophilic microbes and psychrophiles naturally present in the raw
sewage, analyses for carbohydrates in the form of sugar, nitrate-nitrite
nitrogen, and orthophosphate were done in the incubation milieu at daily
intervals over a five day period. Viscosity determinations were also
made initially and at the end of the five day detention.
Uptake of sugar by psychrophilic organisms is indicated in Figures
15 and 16. These figures indicate that sugars are rapidly removed from
the raw sewage by both inoculated and indigenous psychrophiles. Ino
culated psychrophiles seem to remove the sugar faster than the natural
psychrophilic flora of the raw sewage within the first one to two days
detention; after that differences between inoculated and uninoculated
systems become insignificant. The results expressed in these figures
are averaged data from three separate analyses, as were the numerical
values obtained in the nitrate-nitrite nitrogen analysis, the analysis
for orthophosphate and viscosity determinations.
Table 22-A lists the results of the analysis for nitrate-nitrite
nitrogen. The data indicates that very little variation occurred in
each system over the five day detention period. Neither inoculated
psychrophiles nor indigenous psychrophiles appear to have exerted


59
.... --, 1} '=It(\d conUl. __-!"nClt J .. _.o UULL"
6 . noc:uhUll[1 B- 1
12
10
8
--tTi:ne= (Days)Detention
L_-l----'~--5._-- 4
t- d control. oeula ,_e.o unUl
3 9' inoculum[J R- ,
A c inoel~lllm
-----.L~_._.1---__, _. 43
2 . _', Tirr~e (Days)D.::.!t.e.nt .LOL .
-l--.1
14\-
59
.... --, 1} '=It(\d conUl. __-!"nClt J .. _.o UULL"
6 . noc:uhUll[1 B- 1
12
10
8
--tTi:ne= (Days)Detention
L_-l----'~--5._-- 4
t- d control. oeula ,_e.o unUl
3 9' inoculum[J R- ,
A c inoel~lllm
-----.L~_._.1---__, _. 43
2 . _', Tirr~e (Days)D.::.!t.e.nt .LOL .
-l--.1
14\-

Table 22.
60
Analysis of treated sewage effluents
A. Nitrate & Nitrite Nitrogen (mg/l)
Detention Time Treatment(days)
B-6 B-39 C Raw Sewage Control
0 0.86 0.85 0.82 0.881 0.85 0.79 0.90 0.842 0.92 0.78 0.87 0.833 0.86 0.78 0.85 0.904 0.87 0.85 0.87 0.795 0.82 0.81 0.85 0.86
B. Orthophosphate (mg/l)
Detention Time . Treatment(days)
B-6 B-39 C Raw Sewage Control
0 4.0 4.0 4.0 4.11 3.6 3.9 3.7 4.42 2.9 3.0 2.9 3.73 3.5 3.2 3.3 3.74 3.1 3.7 3.3 3.55 3.8 3.6 3.4 3.5
C. Viscosity (centipoise*)
Detention Time Treatment(days)
B-6 B-39 C Raw Sewage Control
o 0.98 1.005 1.02 1.01
*centipoise = lO-z (gram mass)/(cm) (sec)
1.001.02
0.991.02

61
any effect upon the concentration of the nitrate-nitrite nitrogen
present in the waste~ater.
. Concentrations of orthophosphate found in the systems treated by
psychrophilic inoculation and in the uninoculated raw sewage control
over a five day period are given in Table 22-B. There appears to be
a slight uptake of orthophosphate by inoculated psychrophiles in tIle
first two days of holding, but after the second day orthophosphate levels
in the filtered effluent began to increase on the whole, over the given
five day contact time, a substantial alteration of orthophosphate
concentration apparently did not occur. Slight losses of orthophosphate
in the uninoculated raw sewage were suggestive of a very low grade uptake
by the sewage's natural flora, but once again the reduction in ortho
phosphate concentration was so small that it cannot be considered sig
nificant.
Changes in viscosity of the wastewater substrate are tabulated in
Table 22-C. Slight increases in viscosity were observed in all systems
studied. The viscosity in all systems studied, including sewage
inoculated with treatment psychrophiles and uninoculated sewage maintained
as a control, fell within the ± one percent error inherent in the
instrument.
V. Comparison between growth rates and oxygen uptake rates of the
three local psychrophilic isolates in heat sterilized sewage.
Figure 17 shows the Arrhenius plots of growth rates in sterilized
sewage versus the inverse of temperature (oK) for the three psychro
philic isolates. Isolates T28B and XVI-4 showed optimum growth rates
between 15 and 25 C, but the optimum rate of growth for XXIV-l could
not be determined as there was no decline in growth rate, within the
range plotted, as temperature increased. The figure shows that T28B
was only slightly affected by decreasing the temperature from 10 to
5 C, but a corresponding temperature drop affected the other isolates
greatly.
The Arrhenius plots of oxygen uptake rates in sterilized sewage
by the three psychrophilic isolates grown in sterilized sewage supple
mented with 1/5 m-PCB for less than 1 day are shown in Figure 18.

62
2.0
XXIV -1
XVI-4
T28B
x. ----
0-·-
0-· ~~J__
1.0
3635.53534.53433.5O. 01 '------,---'--.....,.-.L.---..,..---L._"'1"""'__...L-.........----1_-
Figure 17. Arrhenius plots of growth rates (generations/hour) in
sterilized sewage versus the inverse of absolute tem
perature for the three psychrophilic isolates.

90
80
70
60
50
40
&.4..c:-.N
0
~
:1-30
20
6.3
·-0/' .". .
t \\---)(- \X.....- ........." 0"\
''\ ."\
\.
'\\"
@ -- T28B
x ---- XVI-4
0-·- XXlV-l
~~.
\~,-\\\ .\\. \\
\ .\ 0\\
'"\\\\X
33.5 34 34.5 35 35.5 36
Figure 18. Arrhenius plot of oxygen uptake rates in steri11zed
sewage versus the inverse of absolute temperature for the
three psychrophilic isolates grown for 1 day in steri
lized sewage supplemented with 1/5 m-PCB(Difco).
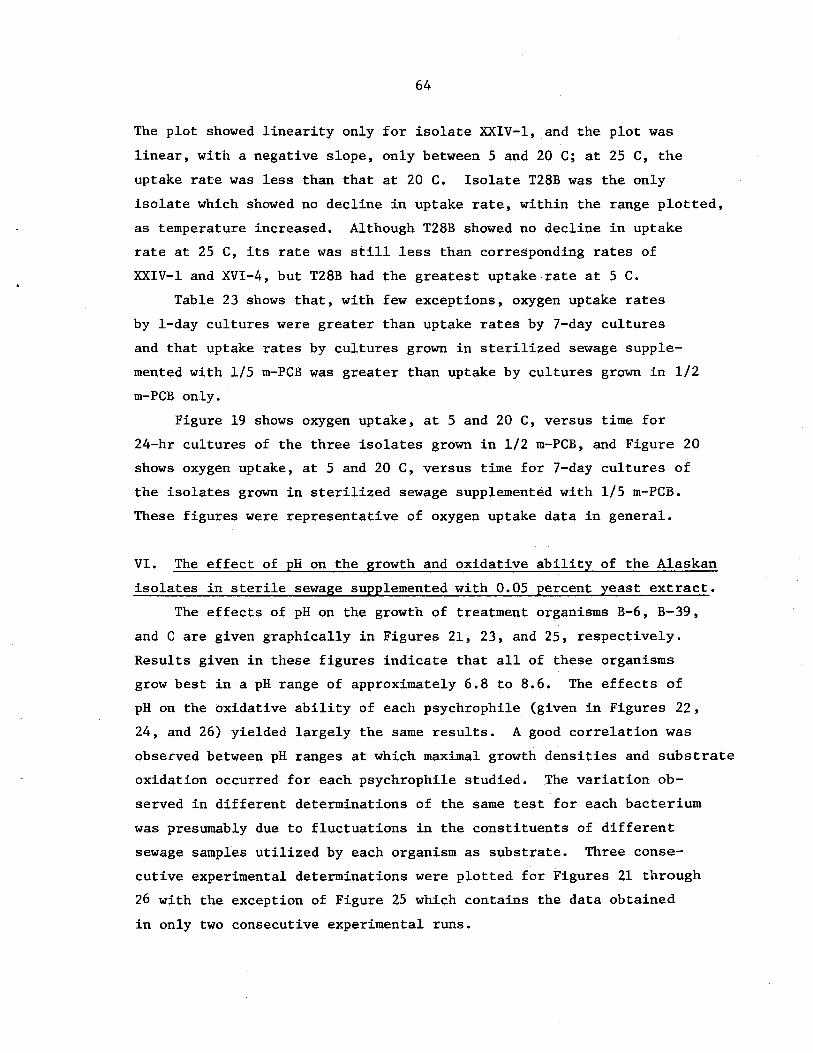
64
The plot showed linearity only for isolate XXIV-I, and the plot was
linear, with a negative slope, only between 5 and 20 C; at 25 C, the
uptake rate was less than that at 20 C. Isolate T28B was the only
isolate which showed no decline in uptake rate, within the range plotted,
as temperature increased. Although T28B showed no decline in uptake
rate at 25 C, its rate was still less than corresponding rates of
XXIV-I and XVI-4, but T28B had the greatest uptake rate at 5 C.
Table 23 shows that, with few exceptions, oxygen uptake rates
by I-day cultures were greater than uptake rates by 7-day cultures
and that uptake rates by cultures grown in sterilized sewage supple
mented with 1/5 m-PCB was greater than uptake by cultures grown in 1/2
m-PCB only.
Figure 19 shows oxygen uptake, at 5 and 20 C, versus time for
24-hr cultures of the three isolates grown in 1/2 m-PCB, and Figure 20
shows oxygen uptake, at 5 and 20 C, versus time for 7-day cultures of
the isolates grown in sterilized sewage supplemented with 1/5 m-PCB.
These figures were representative of oxygen uptake data in general.
VI. The effect of pH on the growth and oxidative ability of the Alaskan
isolates in sterile sewage supplemented with 0.05 percent yeast extract.
The effects of pH on the growth of treatment organisms B-6, B-39,
and C are given graphically in Figures 21, 23, and 25, respectively.
Results given in these figures indicate that all of these organisms
grow best in a pH range of approximately 6.8 to 8.6. The effects of
pH on the oxidative ability of each psychrophile (given in Figures 22,
24, and 26) yielded largely the same results. A good correlation was
observed between pH ranges at which maximal growth densities and substrate
oxidation occurred for each psychrophile studied. The variation ob
served in different determinations of the same test for each bacterium
was presumably due to fluctuations in the constituents of different
sewage samples utilized by each organism as substrate. Three conse
cutive experimental determinations were plotted for Figures 21 through
26 with the exception of Figure 25 which contains the data obtained
in only two consecutive experimental runs.

600 • T28B)(. XVI-40 XXIV ~ 1
--- 5°C- 20°C
500
65
No~
:1.
400
300
200
100
0 1 2 3 4 5 6
TIME (HOURS)Figure 19. Oxygen uptake at 5 and 20 C in sterilized
sewage by the psychrophi1ic isolates grown
for 1 day in ~ m-PCB(Difco).
600 • T28B)(. XVI-40 XXIV ~ 1
--- 5°C- 20°C
500
65
No~
:1.
400
300
200
100
0 1 2 3 4 5 6
TIME (HOURS)Figure 19. Oxygen uptake at 5 and 20 C in sterilized
sewage by the psychrophi1ic isolates grown
for 1 day in ~ m-PCB(Difco).

66
600 • T28B
x XVI-40 XXIV -1
SoC-- 20°C
SOO
6S4321
o
......._-e"'"-,.....
"r,-~- . 0---0
-" --,- 0_--0---0, _...~--o-_-;w..._0 , . ~__)(
." " . ...--,.....,0 _,. _---)t'---)t'"--)f"0- ,." --~--,..
I X_~_v.---)f-
~'" "." ",./~,', /ft, ';/'
X
o
100
300
200
400
No...:I:1.
TIME (HOURS)
Figure 20. Oxygen uptake at 5 and 20 C in sterilized
sewage by the psychrophi1ic isolates grown
for 1 day in sterilized sewage supplemented
with 1/5 m-PCB(Difco).
66
600 • T28B
x XVI-40 XXIV -1
SoC-- 20°C
SOO
6S4321
o
......._-e"'"-,.....
"r,-~- . 0---0
-" --,- 0_--0---0, _...~--o-_-;w..._0 , . ~__)(
." " . ...--,.....,0 _,. _---)t'---)t'"--)f"0- ,." --~--,..
I X_~_v.---)f-
~'" "." ",./~,', /;1, ';/'
X
o
100
300
200
400
No...:I:1.
TIME (HOURS)
Figure 20. Oxygen uptake at 5 and 20 C in sterilized
sewage by the psychrophi1ic isolates grown
for 1 day in sterilized sewage supplemented
with 1/5 m-PCB(Difco).

Table 23.
67
Oxygen uptake at 10 C for XVI-4 cultured for 1 and 7days in sterilized sewage supplemented with 1/5 m-PCB.
Uptake by I-day Uptake by 7-dayCultures Time Cultures(llL 02) (min) . (llL 02)
45.5 30 2.1
75.5 60 2.7
114.2 90 5.5
125.4 120 11.1
152.0 150 14.7
163.3 180 23.5
184.3 210 27.8
196.6 240 -28.5
207.0 270 27.9
219.9 300 37.4
230.0 330 35.0
243.8 360 39.8


.69.69


71
60
50
pH
Q.l
PQ)
~30~-!--'<1J
~ 20.upQ.lc.J~ 10Q.l
P-l
0-----+.:)~--..L..4_l_-....a---- .......--~~~-----4
pH
71
60
50
pH
Q.l
PQ)
~30~-!--'<1J
~ 20.upQ.lc.J~ 10Q.l
P-l
0-----+.:)~--..L..4_l_-....a---- .......--~~~-----4
pH

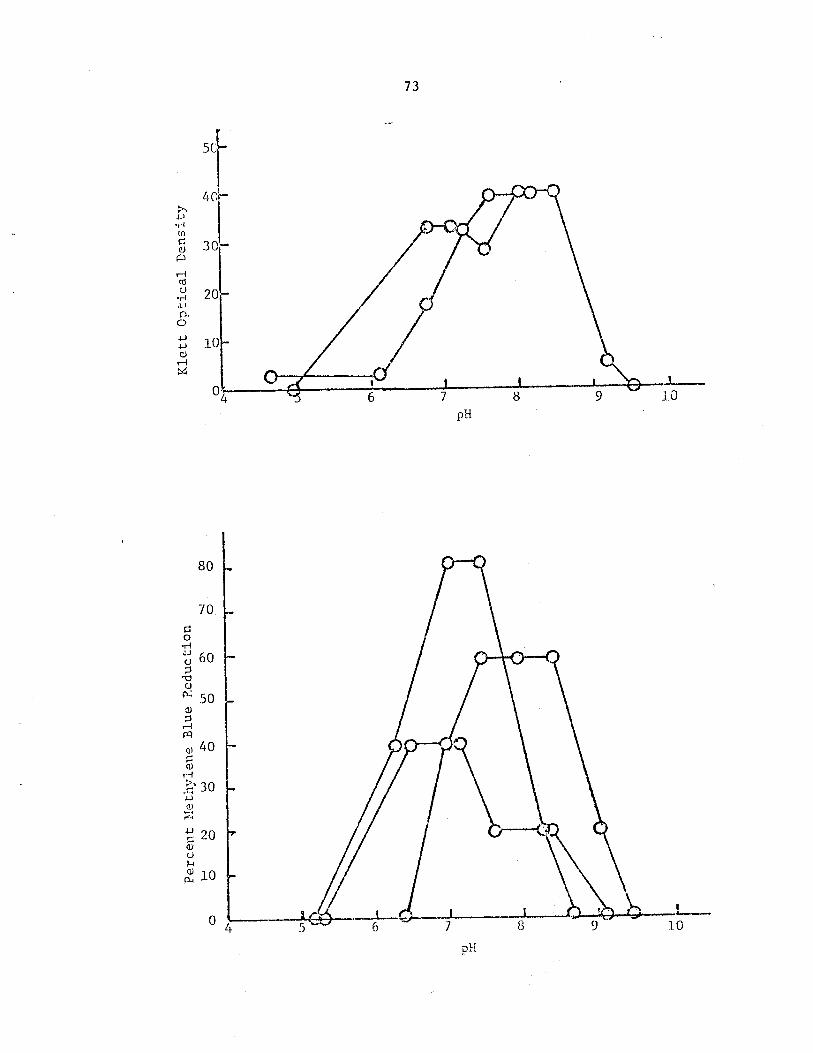
73
!0\..4----=::...,~---+:.----:~--~L---~~--t:j-~l~O~-
SCI
.~ :1f=.J
HcoCJ
°rloWP.o+JoW(l)
H~
pH
80
70~0
OM~J 60 -(J;j
'"d<lJ~ .50
~ 20<lJCJH
~ 10
pH
73
!0\..4----=::...,~---+:.----:~--~L---~~--t:j-~l~O~-
SCI
.~ :1f=.J
HcoCJ
°rloWP.o+JoW(l)
H~
pH
80
70~0
OM~J 60 -(J;j
'"d<lJ~ .50
~ 20<lJCJH
~ 10
pH

DISCUSSION
Many contributions have been made in the field of pollution control,
but one area which has been noticeably lacking in development is that of
low temperature wastewater treatment. If population centers located
in areas which commonly experience long periods of cold weather are
to meet effluent standards imposed by governmental agencies, some
method of adequate sewage treatment at low temperatures will have to
be found. Although several approaches to the solution of this problem
are available, the one investigated in this study was a biological approach,
i.e., the use of inocula of psychrophilic bacteria to degrade raw dom-
estic sewage. If a psychrophilic inoculum could be used to reduce
oxygen demands to practical levels in a relatively short period of time
on a laboratory scale, the potential for adapting similar organisms
for use in conventional treatment systems in cold climates would be
very good.
Although psychrophiles were used to remove BOD from sewage, they
were initially selected on the basis of their relative growth rates
in a nutrient medium rather than in sewage. Since the temperature
characteristic of growth is independent of the growth medium (42),
if all growth requirements were present in sewage, relative growth should
be the same in sewage as it is in a nutrient medium. Isolates with
relatively high growth rates in a nutrient medium should also have
relatively high growth rates in sewage.
Many of the locally collected psychrophilic isolates were irradiated
with UV in an attempt to increase growth rates of mutant strains at low
temperature.. Although conversions from psychrophily to mesophily (90,
91, 92), and from mesophily to psychrophily (5, 67) have been reported,
the basis for such conversions have been changes in optimal or minimal
growth temperatures rather than changes in growth or metabolic rates.
Therefore, reported conversions from mesophily to psychrophily do not,
necessarily, imply an accompanying increased rate of growth at a specific
low temperature.
Whereas shifts in minimal and optimal temperatures of growth may
result from minor changes in cell wall composition or in temperature
sensitivity of an essential enzYme, changes in growth rates within
74

75
the range between growth optimum and minimum likely involve changes
in more than one cellular system. Mutations could cause minor al
terations resulting in shifts in optimal and minimal growth temperatures,
but mutagenic treatment probably would not cause the many beneficial
alterations necessary for increasing growth rates at low temperature
without also causing a lethal mutation. The UV irradiation of the
psychrophilic isolates did not yield any mutants with faster growth
rates at low temperatures, possibly reflecting the difficulty of
creating such a mutant. However, only preliminary efforts were
expended toward obtaining mutants and more intensive work would have
to be done before the phenomenon of increasing growth rates at low
temperature could be definitely supported or refuted.
Following the results, the remaining discussion will be presented
under the following headings:
I. Local isolates in sterilized sewage.
II. Raw sewage degradation.
A. By local isolates.
B. By Alaskan isolates.
III. Alaskan isolates in concentrated synthetic sewage.
IV. Chemical analysis of effluent after treatment with Alaskan
isolates.
I. Local isolates in sterilized sewage.
Of the five local isolates which grew relatively well in sterilized
sewage, two that were isolated from different environments were chosen
to be used in these experiments and studies. A third isolate was chosen
because it was a soil isolate selected for its relatively rapid oxygen
uptake rate at 10 C. These three isolates were then used in the sub
sequent experiments and studies in raw and sterilized sewage.
Because the culture age of the inocula and the number of cells
inoculated would be relatively easy to control and could influence
BOD removals, the effects of these two treatments, as well as the
effects of temperature and specific isolates used as inocula, were
studied. Since each of the variables within the four treatments may
have an influence on other treatments' variables, it was also necessary

76
to study the effects that the treatments had on each other. To min
imize the effects of extraneous variables which were not measurable,
heat sterilized sewage was the medium used in these preliminary experi
ments.
The complexity of determining the effects of treatments on each
other made it necessary to utilize statistics to evaluate the signi
ficance of the treatments and treatment interactions. A treatment or
treatment interaction was considered to influence BOD removals if it
was statistically significant at the 0.5% level.
A significant effect required that the variables within the
treatment, or treatment interaction, gave BOD removals which varied
among the others, and, although the statistical approach defined which
treatments affected BOD removals, it did not disclose why the variables
within treatments differed. The BOD removal data with which the analysis
,~as determined, and not just the analysis of variance, should, thus, be
inspected for biologically explainable phenomena.
In experiments using inocula in heat sterilized sewage, the
single treatment effects of organisms used as inocula, size of inocula,
age of inocula and temperature were statistically significant (Table
3). The reasons for their significance, however, were not discovered
in the analysis and conclusions drawn from the single treatment data
(Tables 4-7) could not be made without also analyzing their interactions
with the other treatments.
On the basis of the organism treatment data alone (Table 4), one
would conclude that organism XXIV-l was the best to use as an inoculum.
A significant organism-temperature interaction (Table 8), however,
indicated that the effect of temperature on BOD removals differed among
organisms, reflecting differences in temperature characteristics of
growth or oxygen uptake among the different organisms. Organism XXIV-I
may have removed the greatest overall percent BOD, but, because changes
in temperature affected each organism differently, T28B removed more
at 5 c.Since the temperature of actual treatment plants does not remain
constant, the selection of an organism to be used as the inoculum should
be made considering the changes in BOD removals as temperature varies,

77
rather than BOD removals at a single low temperature. If more data
were available, empirical equations relating BOD removals to temperature
could be formulated, and such formulas could be used to determine
which inoculum would result in the maximum BOD removals, if reasonable
predictions of the waste's temperatures could be made.
The influence of temperature ort percent BOD removals observed in
these experiments, using single culture inocula, was different than the
reported slight effect on actual treatment plants at temperatures
above 10 C but serious effects below 10 C (39, 48, 79). Because of
the diversity of the waste's natural biota, adaptation to changes in
temperature is possible; thus, in a temperature range in which the biota
can adapt, treatment efficiencies should be similar. In experiments
using single inocula in sterilized sewage, the BOD removals should
parallel the effects of temperature on growth or metabolism. Because
growth and oxygen uptake rates of the isolates decreased as temperature
decreased from 20 C (Figures 1 and 2), percent BOD removals observed
in these experiments also decreased as temperature decreased.
It was also observed (Table 5) that, although removals decreased
as temperature decreased from 20 to 10 C, the removals at 5 C were
nearly the ·same as those at 10 C, despite the fact that Arrhenius plots
of growth and oxygen uptake rates continued to decrease. The reasons
for the unexpectedly high observed percent removals at 5 C are not known.
As expected, the largest difference in BOD removals came from the
size treatment (Table 6). It is well recognized that the rates of
biochemical enzyme reactions are proportional to the enzyme concentration,
if substrate is in excess (21). Although there was a hundredfold dif
ference between the number of cells in the large and small inocula,
rather than a hundredfold difference in BOD removed, there were less
than one and one-half times as much percent BOD removed by the large
than by the small inocula; consequently, percent BOD removals must also
be influenced by factors other than the number of cells inoculated.
The BOD removal data includes both the enzymatic phenomenon as
well as some non-biochemical processes. TIle BOD removed biologically
is related to the concentration of enzymes present. Although there
was a hundredfold difference in initial cell numbers between the two

78
inocula sizes, the relative difference in cell numbers, and presumably
the same relative proportion of active enzymes, after the 24-hr incu
bation may have been considerably less. Since growth rates decrease
as cell concentrations increase, the large inoculum would grow slower
than the small inoculum, resulting in less than a hundredfold difference
between large and small inocula's final bacterial concentration and
an accompanying relative increase in BOD removed by the small inoculum.
A relative increase in BOD removed by small inocula would be even
greater if the large inocula did not grow at all. In the raw sewage
studies, discussed later, it was observed that an inoculum of cells
increased the initial BOD (Table 21). This increase in BOD can only
be accounted for by assuming that cells add to the BOD by dying and
subsequently becoming utilizable nutrients. Normal sewage contains
about 2 X 10⁷ cells per ml (57) and there were about 6 X 10⁶ cells per
ml inoculated into the raw sewage. Assuming McCauhey's estimate to be
correct, the final viable bacterial population in inoculated raw sewage
was probably less than 2.6 X 10⁷ cells per ml, as some of the cells
were contributing to the increased BOD. In experiments with heat
sterilized sewage, when the large inoculum was used, the sterilized
sewage initially was inoculated with 2 X 10⁷ cells per ml; consequently,
growth of the large inoculum would be limited.
The non-biochemical removal of BOD is due to settling, chemical
oxidation, and volatilization. Since flocculation was not observed for
either size of inoculum, the amount of BOD removed by settling should
be constant and independent of inoculum content. The BOD removed by
chemical oxidation and other non-biochemical methods should also be
constant and independent of inocula size. By percentage, the amount
of BOD removed by these non-enzymatic processes would be a larger
portion of the total BOD removed when a small bacterial load was present.
Therefore, it is reasoned that the experimentally unexpected slight
differences in BOD removed between large and small inocula were caused
by: 1) growth of the cells after small numbers inoculation while
the large inoculum's cells only exhibit slight growth and 2) the effects
of non-biochemical forms of BOD removal which have a proportionately
greater influence on the observed percent BOD removed by the small
than on that removed by the large inoculum.

79
The reasons for relatively slight differences in BOD removed by
1 and 7-day old cultures (Table 7) were not disclosed until the tem
perature-age (Table 12) and temperature-size-age (Table 14) interaction
data were inspected. Whereas the removals by the I-day averaged over
all other treatments were slightly greater than removals by the 7-day
old cultures, I-day old cultures removed less BOD at 5 C than did the
7-day (Table 12). It was observed, however, that only the small inocula
of I-day old organisms removed less BOD at 5 C than corresponding 7-day
old cultures; large inocula of I-day old cultures at 5 C and both large
and small inocula of I-day seed at 10, 15, and 20 C removed more BOD
than corresponding 7-day old cultures (Table 14). Since the organisms
were grown at room temperature, the observed influence of temperature
on BOD removals by different culture ages and sizes of inocula might be
explained on the basis of cold shock.
Many authors reported that "physiologically young" cells from late
lag or early exponential phases were sensitive to abrupt temperature
changes (82, 89). Epthimion and Corpse (22) reported, however, that
growth phase susceptibility to cold shock differed among strains. While
some strains were sensitive if cells were old, others were sensitive if
cells were young, and in other cases, cells of any age of growth pllase
were insensitive to cold shock. Although Epthimion and Corpse (22)
reported that cold shock susceptibility could occur in any phase, dep
ending on the organism, small inocula of I-day old cultures of all isolates
removed less BOD than corresponding small inocula of 7-day old cultures
at 5 C (Table 2). It was also observed that the mixed, mesophilic
population was more susceptible to cold shock than any of the three
psychrophilic strains, a finding consistent with Farrel and Rose (24).
Although cold shock would affect cells of both large and small
inocula of I-day old cultures, only the I-day old small inocula were
observed to be adversely affected by cold shock (Table 14). Because
a substantial part of the BOD removed by the small inocula is due to
an increase in cell numbers with an accompanying, though not necessarily
proportional, increase in oxidation rate, any physiological stress,
such as cold shock, which decreases the viability and growth capability
of the inoculated cells would adversely affect the inoculum's degradative

80
abilities. Cold shock, which affects growth of I-day old cells, would
have little influence on the large, non-growing, inoculum's oxidation
of sewage.
Cold shock was not a factor influencing BOD removals when large
inocula were used or when the experimental temperature was greater than
5 C. When cold shock did not influence waste degradation, the 7-day
old cultures removed less BOD than I-day old cultures, possibly because
there were probably fewer viable cells in 7-day cultures and because
the old cells would be partially depleted of necessary enzymes due to
their prolonged starvation.
Averaged over all treatments, the I-day old cultures were more
efficient than 7-day old cultures (Table 7), but, since cultures were
grown at room temperature, small inocula of 7-day old cultures were
less efficient than corresponding I-day old cultures at 5 C (Table 14),
because of the adverse effects of cold shock on growth of the cells
after inoculation. On the basis of these results, if inocula of
psychrophiles were employed to increase treatment efficiency at low
temperatures, stationary phase cultures, rather than exponential growth
phase cultures, should be used as relatively fewer cells are capable
of continued active growth in sewage. This is fortunate, since it
would be more economical to use a small inoculum and easier to harvest
cells not in exponential growth phase, as careful monitoring of the
cultures to determine growth phase of cells would not be practical.
Because microbial interactions, sucil as synergism, competition or
inhibition (30) could influence microbial activities, combinations of
the three psychrophilic isolates were used and their percent BOD removals
were compared to the percent BOD removed by single culture inocula
(Table 17). Although there were no significant experimental differences
found between removal abilities of single cultures and combinations of
cultures, the phenomenon is worth additional study using a larger
selection of organisms.
Since experiments thus far discussed were performed in heat
sterilized sewage, extending the results to raw sewage is questionable,
because sterilization alters the chemical composition of the sewage

81
and destroys it biota. Studies in sterilized sewage were necessary,
however, to minimize the effects of extraneous variables resulting from
the chemical and biological differences among separate raw sewage
samples. Although gamma irradiated (46) or filter-sterilized sewage
would probably be more similar, chemically, to raw sewage, heat ster
ilization was used because irradiation and filtration were not feasible.
To decrease variation caused by fluctuations in the composition of the
sewage samples, raw sewage, sampled and frozen as collected over a period
of approximately 3 months, was pooled at the end of the 3 months, frozen
to preserve its characteristics (28) and heat sterilized as needed.
II. Raw sewage degradation.
A. By local isolates.
Due to limitations involved with using heat sterilized sewage,
it was necessary to perform experiments using inocula of locally
isolated psychrophiles in raw sewage. In such studies 19% of the
BOD was removed within 5 hours at 2 C by the psychrophile-inoculated
sewage, but 15% was removed with no inoculum used. Although the
absolute difference (19% - 15% = 4%) appears rather insignificant,
the relative difference (19% - 15%/15% = 27%) is quite appreciable.
If however, retention times were of sufficient duration to permit
80-90% removals, the absolute difference between BOD by inoculated
or non-inoculated raw sewage would increase, but it is likely
that the relative difference would decrease.
Although the psychrophilic inocula removed more percent BOD
than the mesophilic or non-inoculated sewage, with the 5-hr retention
times used for this study, the final BOD concentrations were greater
for the inoculated sewages than for the non-inoculated ones, because
the inoculation of a cell mass added more BOD to the system than
could be compensated for by the increased removal ability of a
psychrophilic inoculum. If retention times were longer than 8.5
hr and the removal rates were linear with respect to time, the
activities of the psychrophiles at low temperatures would more than
compensate for the added BOD. Even if rates were non-linear,
increasingly longer retention times should result in an increasingly

82
better effluent BOD for the psychrophile-inoculated sewage relative
to the non-inoculated raw sewage. If sufficiently long retention
times were used, the final BOD concentrations for psychrophile
inoculated raw sewage would be appreciably less tllan the final
concentrations in non-inoculated raw sewage, and the "inocula"
method of improving treatment efficiency at low temperature would
appear practical.
Because the selection of the isolates to be used as inocula
could be accomplished on the basis of either growth or oxygen
uptake rates, studies were performed to determine which method of
selection corresponded better with observed BOD removals. A
comparison of Arrhenius plots of growth and oxygen uptake rates
for the three isolates used (Figures 1~2) with the BOD removed
by the isolates at different temperatures (Table 8), revealed
that oxygen uptake rates closely corresponded to BOD removals,
but growth rates corresponded poorly. Although two of the isolates
used in this study were selected because they showed rapid growth
at low temperatures, the evidence from these studies indicate that
it is more valid to select isolates on the basis of oxygen uptake
rather than on growth.
Cells used as inocula for oxygen uptake studies were grown in
either ~ strength m-PCH or in sterilized sewage supplemented with
1/5 strength m-PCB, bee.ause it was thought that cells grown in a
sewage medium would physiologically adapt to its nutrients and
oxidize sewage faster than cells grown in a nutrient medium only.
The sewage medium was supplemented with only 1/5 strength m-PCB
to supply adequate growth factors, with minimal stimulatory additions
of utilizable carbonaceous compounds, to initiate growth and ensure
that the cells would physiologically adapt to sewage nutrients.
Results of this study indicate that adaptation to sewage nutrients
does occur at all temperatures, as cells grown in the sewage medium
nearly always had greater oxygen uptake rates than had cells grown
in the nutrient medium.
B. By Alaskan isolates.
Raw settled sewage inoculated with each of the three selected
Alaskan- ISychrophiles and incubated at 5 C over a five day period

83
indicated that BOD values were being reduced at a very slow rate
(Figures 3, 5 &1); however, there was very little variation between
the BODs in the inoculated sewage and the uninoculated controls.
Percent BOD reductions in Figures 4, 6 and 8 present a mirror image
of the BOD values. All reductions were very low grade never
exceeding approximately 30 percent. Paired t tests used to evaluate
differences between treatments and controls in both BOD and percent
BOD reductions indicated that, statistically, differences did not
exist. Viable psychrophilic cell counts, made concurrently with
BOD determinations (Figures 9, 10 & 11), indicated that a psychro
philic population of approximately 104 cells per ml was present in
uninoculated sewage controls, a concentration equivalent to that
reported to have been found in rivers (32). Flasks seeded with
treatment cell suspensions initially contained about 1000 times
more viable psychrophiles per ml than the uninoculated substrate.
Accordingly, since bottl treatments and their respective controls
contained psychrophilic populations, both would be expected to
reduce BOD, but becausE~ seeded systems contained much denser
populations, a more rapid rate of BOD reduction was expected in
these flasks. This did not prove to be the case within the five
day detention. Dias and Bhat (19) theorized that a single bacterial
species would likely be limited in its ability to utilize organic
substances that occur in sewage. This may be part of the reason
that substantially greater BOD reductions in inoculated sewage
were not observed over the uninoculated controls.
If tIle treatment organisms were able to utilize only a small
portion of the organic constituents present in the sewage, a heavy
inoculum would only result in a relatively rapid depletion of these
materials, leaving most of the remaining carbonaceous compounds
to be degraded by the varied sewage psychrophile population at their
own rate. mIen the compounds utilized as substrate became limiting,
the treatment cell numbers would become stationary, but because
degradation would still be occurring by indigenous cells, the BOD
would be expected to continue to drop. This is largely what was
observed. Inoculated cell numbers became stationary within 2 days;
yet the BOD continued to drop to the end of the five day incubation

84
at approximately the same rate as that observed in the uninocul
ated control. However, with the exception of the B-6 control,
indigenous cell numbers did not become stationary within the same
period. The rapid reduction expected in the growth-limiting
nutrient during the two days that the cells were actively metabolizing
and growing may not have been reflected in the BOD due to the natural
sewage psychrophile population degrading a much wider range of
carbon compounds.
III. Alaskan isolates in concentrated synthetic sewage.
Support for the limited-growth concept comes from a series of
experiments using a synthetic sewage to determine the effects of sub
strate concentration at 5 C. Concentrating the sewage would increase
the amounts of the nutrient components available to the inoculated cell
mass and cell numbers would be expected to either not become stationary
at all or become stationary at a later period. B-6 cell numbers became
stationary one day later than in the raw settled sewage, and B-39
and C cell numbers never became stationary at all in the five day test
period (Figure 14).
It is also interesting to note that bacterial activity in the
concentrate generally resulted in a greater absolute BOD reduction
(Figure 12) than in the natural sewage substrate, but proportionately
less BOD was removed in the synthetic medium (Figure 13). The fecal
coliform inoculum utilized as a control exhibited a behavior quite
different from what was expected. The BOD of the medium containing
the mesophile increased to a rather high level at three days detention,
then rapidly dropped to initial BOD levels. Because fecal coliforms
do not survive low temperatures well, the release of protoplasm into
the medium by cell death and lysis could explain the BOD increase.
However, the most penetrating question to answer is not, "Why did the
BOD increase?",but rather,"Why did the BOD decrease?". There is no
good apparent answer to this question. The reason could not be
metabolic activity, so the only alternative is some unknown physical
phenomenon.
The greatest difficulty in evaluating the results of the concen
trated synthetic sewage experiments lies in the fact that the sewage

85
was artificial, and therefore, bacterial responses are almost certain
to vary from those obtained in raw domestic sewage to which the cells
were originally adapted.
IV. Chemical analysis of effluent after treatment with Alaskan isolates.
The analysis for sugar in the raw settled sewage, depicted in
Figures 15 and 16, also lends support to the limited-growth hypothesis.
This type of carbohydrate was utilized very rapidly by both the Alaskan
psychrophilic isolates and those naturally present in the sewage. The
greatest differences between sugar utilized by inoculated systems and
their uninoculated controls occurred within the first two days of incu
bation at 5 C. Slightly over half of the existing sugar was depleted
in inoculated systems in the first day of detention as compared to a
little over one-third being removed by the uninoculated control. Although
greater amounts of sugar were likewise removed in inoculated flasks
during the second day, differences between treatments and controls were
not as pronounced. Beyond two days of detention, differences between
treatments and control were virtually nil. If the inocula cells became
limited at the end of the two day period due to the lack of availability
of essential nutrients, differences between their respective abilities
to remove sugars and the ability of the uninoculated control to do the
same would be expected to disappear. It is conceivable, but by no means
certain, that the inocula psychrophiles may be capable of degrading
only sugars as a carbon source.
The results of an analysis for nitrate-nitrite nitrogen (Table
22-A) indicate that no significant change or alteration occurred in
amounts present during the five day contact period in the filtered
effluent of either inoculated or control flasks. This conforms to the
findings of earlier workers that psychrophiles are unable to either
denitrify (12) or nitrify (14, 83) at low temperatures. The nitrogen
source utilized by these organisms must obviously be in some form other
than nitrate or nitrite, possibly ammonia.
Table 22-B lists concentrations of orthophosphate observed in the
fluid filtrates of psychrophile inoculated and control flasks. The
data obtained suggested that a low grade phosphate uptake at 5 C was
occurring in the inoculated systems for the first two days of detention
86
but increases occurred in phosphate concentration beyond two days.
The control exhibited what appeared to be a gradual uptake in phosphate
at a much lower rate than observed in the inoculated systems during the
first two days of incubation. The high phosphate value obtained in
the control flask at the second day of detention is likely due to
experimental error. Although the reason that phosphate concentrations
increased in treated systems in the last three days of detention is
uncertain, MacKelvie, Campbell and Gronlund (55) found that carbon
limited Pseudomonas aeruginosa excreted both ammonia and ultraviolet
absorbing materials into incubation medium. It is possible that nutrient
limited cells may also release certain amounts of phosphate as well.
Many psychrophiles are characterized by their ability to produce
storage polYmers which greatly increase the viscosity of the medium
in which the organism is being grown. An increased viscosity in raw
sewage would produce the undesirable effect of holding matter in suspension
and thereby rendering primary settling difficult at best. For this reason,
viscosity measurements of the filtered wastewater in both inoculated
and uninoculated sewage were made to determine whether or not the organ
isms being used would exert such a deleterious effect (Table 22-C).
Initial as well as final values of viscosities in treatments and control
all fell within the ±l percent error of the viscosimeter. Most findings
regarding the psychrophilic production of these viscous polYmers indicate
that the molecule produced is often a polysaccharide such as dextran
(25, 29); if such a substance were being produced it should have been
detected in the analysis for sugar. The fact that increases in sugar
content were-not observed tends to support the finding of the viscosity
data that significant increases did not occur in any of the systems
examined.
The effects of pH on treatment cell growth and substrate oxidation
are given in Figures 21-26. As expected, the data obtained suggests a
definite correlation between oxidation and cell growth. Ranges of pH
which resulted in the greatest amount of oxidation also provided for
maximal rate of growth. All three treatment organisms appeared to function
well at 5 C in the pH range of 7-8, well within values found in the raw
sewage substrate. The variation observed between each of the three
curves obtained for each test can be accounted for as being due to

87
differences in each sewage sample used as a substrate. The chemical
composition of raw sewage varies greatly from sample to sample. Lamanna
and Mallette (49) point out that for any given exzyme an optimal pH
exists for its activity; this optima is not fixed, but changes with
" the nature and concentration of salts present." Undoubtedly,
bacterial enzyme systems undergo the same fluctuation in optima with
changes in surrounding chemical composition that individual enzymes do.

SUMMARY AND CONCLUSIONS
Bacterial isolates capable of growing near 0 C were used as inocula
for experiments in heat sterilized, raw and concentrated synthetic
sewage to determine whether BOD removals could be enhanced at low
temperatures. Growth and oxygen uptake rates in sterilized sewage
of these isolates were also determined as was a chemical analysis of
raw sewage before and after treatment.
The percent BOD removals from heat sterilized sewage at temper
atures ranging from 5 to 20 C by two culture ages (1 and 7 days) and
two quantities of inocula (1010 and 108 cells/200 ml) of the three
psychrophilic isolates and of a mixed mesophilic population were analyzed
by 4 X 4 X 2 X 2 factorial analysis of variance (Table 3). Culture
age, quantity of cells inoculated, organisms inoculated, temperature,
and many of the interactions among single treatments affected BOD
removals.
One-day old cultures generally removed more BOD than 7-day old
cultures (Table 4). Further inspection of the data revealed that 7-day
cultures were more efficient only when the small inoculum was used
(Table 14) or when at 5 C (Table 12). It was thought that these inter
actions of culture age with inoculum size and temperature were caused
by the effects of cold shock on the inoculated cells.
The effect of number of cells inoculated on percent BOD removed
was very significant, as seen by the large F value found in Table 3.
The large (1010 cells) always removed more percent BOD than the small
inoculum (108 cells). Although the number of cells in the large
inoculum was a hundredfold greater than the smaller, they removed
only about one and a half times as much BOD as the small inoculum
(Table 6). This relatively slight, though statistically significant,
difference was thought to be caused by active growth of the cells of
the small inoculum after inoculation while the cells of the large
inoculum did not grow.
The differences in BOD removals among locally isolated organisms
used as inocula were relatively slight, although statistically signi
ficant, probably because the organisms w'ere psychrophi1es having
similar oxidative abilities. The isolates were affected differently
88

89
by changes in temperature (Table 8). As expected, the mesophilic
population was more adversely affected by a decrease in temperature
than the psychrophiles.
A decrease in temperature brought a general decrease in percent
removals. It was observed, however, that the overall removals at 5
C were not much less than those at 10 C, although growth or oxygen uptake
rates were much less at 5 C (Figures 17 and 18). It was suspected
that, at the lower temperatures, non-biological removals of BOD (such
as settling) were more significant than the oxidation of the organic
wastes; thus, the adverse effect of low temperatures on biological
oxidation rates were masked.
A comparison between BOD removed by single inocula and combinations
of the single organisms revealed that combining the isolates did not
increase oxidative abilities. Although this study did not show increased
efficiency by using combinations of organisms as inocula, it is possible
that synergisms and successive substrate utilizations by combinations
of the appropriate bacteria could result in the oxidation of more sub
strate.
Because heat sterilized sewage is distinctly different from raw
sewage, experiments were performed to determine whether inocula of
psychrophiles could also improve BOD removal efficiency in raw sewage
at low temperatures. The experiments showed that sewage inoculated
with pure cultures of psychrophiles had approximately 19% of the BOD
removed within 5 hr at 2 C, whereas the sewage inoculated with a mixed
population of mesophiles had l5%,removed and the raw sewage with no
inoculum had 14% of the BOD removed. Although the inoculated sewages
had the greatest percent BOD removed, they also had a higher final
BOD, because BOD was added with the inoculum. Increased retention
times might allow the more efficient psychrophile inoculated sewage to
remove enough BOD and result in a lower absolute BOD concentration.
Low temperature stabilization of raw domestic wastewater already
containing a heterogenous psychrophilic population is not substantially
affected by the addition of a pure culture psychrophilic inoculum.
Viable psychrophilic cell counts suggest that treatment psychrophiles
became growth limited in two days at 5 C. Since the substrate appar
ently never became limited with respect to either nitrogen or phosphorus,

90
it seems likely that these organisms became carbon limited because
they were only able to degrade a small portion of the non-carbohydrate
organic matter present. Although the BOD itself is a·carbon limited
conceptt its usefulness as a parameter of wastewater treatment efficiency
is dependent upon a microbial population capable of oxidizing a wide
range of organic compounds. Hydrogen ion concentrations apparently
did not present a problem in the growth of the psychrophiles. Future
studies into the psychrophilic degradation of wastewater might prove
more fruitful if emphasis were placed on mixed culture inocula utilizing
psychrophiles screened not only for rapid growth, but growth on a wide
variety of carbon sources.
Oxygen uptakes in heat sterilized sewage were generally higher
when cells were grown in a culture medium containing heat sterilized
sewage rather than in ~ m-PCB. Uptakes by I-day old cultures were
greater than 7-day old cultures. Oxygen uptake rates by I-day old
cultures grown in a medium containing sewage more closely corresponded
to BOD removals than did growth rates.
On the basis of these experiments it was concluded that:
1. Psychrophiles increased BOD removals at low temperatures t
but it was also found that an inoculum increased the initial
BOD. Long retention times will be needed to overcome the
higher initial BOD and result in an acceptable effluent BOD.
2. Cultures in stationary growth phase were not susceptible to
the effects of cold shock. Older cells would t therefore,
probably make a better inoculum when added to a low temper
ature wastewater.
3. Because BOD removals more closely corresponded to oxygen
uptake rates than to growth rates, the selection of psychro
philes to be used as inocula would probably be best if based
on oxygen uptake rates at low temperatures rather than on
growth rates.
4. The stabilization of wastewater by psychrophilic microorganisms
is not effectively enhanced by concentrating the sewage sub
strate.

91
s. Future studies on psychrophilic degradation of domestic
sewage should emphasize mixed culture inocula of organisms
capable of growth on a wide variety of carbon sources.
91
s. Future studies on psychrophilic degradation of domestic
sewage should emphasize mixed culture inocula of organisms
capable of growth on a wide variety of carbon sources.

LITERATURE CITED
1. Alter, A. J. 1969. Sewerage and sewage disposal in cold regions.Cold Regions Science and Engineering Monograph III-C56, ColdRegions Research and Engineering Laboratory.
2. American Public Health Association. 1965. Standard methods forthe examination of water and wastewater including bottomsediments and sludges. 12th Ed. American Public HealthAssociation, Inc., New York. 769 p.
3. American Public Health Association, American Water Works Association,and Water Pollution Control Federation. 1971. StandardmethQds for the examination of water and wastewater, 13th Ed.American Public Health Association, Inc., New York.
4. Anderegg, J. A., et. aleat the Arctic Circle.
1960. "Eskimo" algae makes lagoons workWastes Engineering 31:324-326.
5. Azuma, Y., S. D. Newton, and L. D. Witter. 1962. Production ofpsychrophilic mutants from mesophilic bacteria by ultravioletirradiation. J. Dairy Sci. 45:1529-1530.
6. Baig, I. A., and J. W. Hopton. 1969. Psychrophilic propertiesand the temperature characteristic of growth of bacteria.J. Bacteriol. 100:552-553.
7. Bartsch, E. H., and C. W. Randall.report on the state of the art.Fed. 43:698-708.
1971. Aerated lagoons. AJ. Water Pollution Control
8. Baxter, R. M., and N. E. Gibbons. 1962.siology of psychrophilism in a yeast.8:511-517.
Observations on the phyCan. J. of Hicrobiol.
9. Belehradek, J. 1963. Intermolecular aspects of the structuralstability of protoplasm at the temperature extremes. p. 433443. In A. S. Troshin Ced.) The cell and environmental temperature. Pergamon Press. New York.
10. Benzie, W. J., H. O. Larkin and A. F. Moore. 1963. Effects ofclimactic and loading factors on trickling filter performance.J. Water Pollution Control Fed. 35:445-455.
11. Bloodgood, D. E. 1944. The effect of temperature and organicloading upon activated sludge plant operation. Sewage WorksJ. 16:913-924.
12. Boyd, W. L.Ecology.
1958. Microbiological studies of Arctic soils.39: 332-336.
92
93
13. Boyd, W. L., and J. L. Boyd. 1965. Water supply and sewage disposal developments in the far north. J. Amer. Water WorksAssn. 57:858-868.
14. Boyd, W. L., and J. L. Boyd. 1967. Microbiological studies ofaquatic habitats of the area of Inuvik, Northwest Territories.Arctic. 20:27-41.
15. Brown, A. G. 1957. Some general properties of a psychrophilicpseudomonad: effects of temperature on some of these propertiesand utilization of glucose by this organism and Pseudomonasaeruginosa. J. Gen. Microbiol. 17:640-648.
16. Clark, L. K., A. J. Alter and L. J. Blake. 1962. Sanitary wastedisposal for Navy camps in polar regions. J. Water PollutionControl Fed. 34:1219-1234
17. Dawson, R. N., and J. W. Grainge. 1969. Proposed design criteriafor wastewater lagoons in Arctic and Sub-arctic regions. J.Water Pollution Control Fed. 41:237-246.
18. Delory, G. E., and E. J. King. 1945.buffer for alkaline phosphatases.
A sodium carbonate-bicarbonateBiochem. J. 39:245.
19. Dias, F. F., and J. V. Bhat. 1961.sludge. I. Dominant bacteria.
Microbial ecology of activatedAppl. Microbiol. 12:412-417.
20. Dickens, J. B. 1959. Water supply and sewage disposal in permafrost areas of Northern Canada. Polar Record. 9~42l-432.
21. Dixon, C. Webb. 1964. Enzymes. Academic Press, New York. 950 p.
22. Efthimion, M. H., and W. A. Corpse. 1969. Effect of cold temperature on the viability of Chromobacterium violaceum. Appl.Microbiol. 17:169-175.
23. Fair,G. M., J. C. Geyer and D. A. Okun. 1968. Water purificationand wastewater treatment and disposal. John Wiley and Sons,Inc., New York. 34-17 and 36-42 p.
24. Farrell, J., and A. H. Rose. 1967. Cold shock in a mesophilicand in a psychrophilic pseudomonad. J. Gen.Microbiol. 50:429-439.
25. Farrell, J., and A. H. Rose. 1967. Temperature effects onmicroorganisms. Ann. Rev. of Microbiol. 21:101-120.
26. Farrell, J., and A. H. Rose. 1967.microorganisms. In A. Rose, Ed.Academic Press, New York.
Temperature effects onThermobiology.
94
27. Fisher, C. P., W. R. Dryman, and G. L. Van Fleet. 1968. Wastestabilization pond practices in Canada, p. 435-449. In C. F.Gloyna and W. W. Ecnenfelder Ced.) Advances in water qualityimprovement. I. University of Texas Press, Austin, Texas.
28. Fogarty,William J., and Milton E. Reeder.through frozen storage. Public Works.
1964. BOD data retrieval95:88-90.
29. Foster, E. M. 1961. Summary of symposium on low temperaturemicrobiology, p. 314. In Proc. Low Temp. Microbiol. Symp.Campbell Soup Co., Camden, New Jersey.
30. Gall, L. S. 1970. Significance of microbial interactions incontrol of microbial ecosystems. Biotechnol. and Bioeng.XII:333-340.
31. Gomori, G. 1948. Histochemical demonstration of sites of cholineesterase activity. Proc. Soc. Expt1. BioI. Med. 68:354.
32. Gordon, R. C. 1970. Depletion of oxygen by microorganisms inAlaskan rivers at low temperatures. Working Paper No.4.Fed. Water Qual. Admin. College, Alaska.
33. Grube,G. A., and R. S. ~furphy.
well in Sub-arctic climate.267-271.
1969. Oxidation ditch worksWater and Sewage Works. 116:
34. Haggen, P.O., D. J. Kushner, and N. E. Gibbons. 1964. Temperatureinduced death and lysis in a psychrophilic bacterium. Can.J. Microbial. 10:813-822.
35. Halvorson, H., M. Ishaque and H. Lees. 1968. Physiologicalactivity of bacteria indigenous to lagoon operation as afunction of seasonal change. Can. J. Microbiol. 14:369-376.
36. Halvorson, H., M. Ishaque and H. Lees. 1969. Microbiology ofdomestic wastes, No.2: A comparative study of the seasonalphysiological activity of bacteria indigenous to the sewagelagoon. Can. J. Microbiol. 15:563-570.
37. Hanus, F. J., and R. Y. Morita. 1968. Significance of thetemperature characteristic of growth. J. Bacterial.95:736-737.
38. Harder, W., and H. Veldkamp. 1968. Physiology of an obligate1ypsychrophilic marine Pseudomonas species. J. Appl. Bacterial.31:12-23.
39. Hawkes, H. A. 1963.Press, New York.
The ecology of wastewater treatment.203 p.
Pergamon
40. Hunter, J. V., E. J. Genetelli, and M. E. Gi1wood. 1966.Temperature and retention time relationships in the activatedsludge process. Proc. 21st Ind. Waste Conf. Purdue Univ.,Eng. Ext. Sere 121:953-963.
94
27. Fisher, C. P., W. R. Dryman, and G. L. Van Fleet. 1968. Wastestabilization pond practices in Canada, p. 435-449. In C. F.Gloyna and W. W. Ecnenfelder Ced.) Advances in water qualityimprovement. I. University of Texas Press, Austin, Texas.
28. Fogarty, William J., and Milton E. Reeder.through frozen storage. Public Works.
1964. BOD data retrieval95:88-90.
29. Foster, E. M. 1961. Summary of symposium on low temperaturemicrobiology, p. 314. In Proc. Low Temp. Microbiol. Symp.Campbell Soup Co., Camden, New Jersey.
30. Gall, L. S. 1970. Significance of microbial interactions incontrol of microbial ecosystems. Biotechnol. and Bioeng.XII:333-340.
31. Gomori, G. 1948. Histochemical demonstration of sites of cholineesterase activity. Proc. Soc. Expt1. BioI. Med. 68:354.
32. Gordon, R. C. 1970. Depletion of oxygen by microorganisms inAlaskan rivers at low temperatures. Working Paper No.4.Fed. Water Qual. Admin. College, Alaska.
33. Grube,G. A., and R. S. ~furphy.
well in Sub-arctic climate.267-271.
1969. Oxidation ditch worksWater and Sewage Works. 116:
34. Haggen, P.O., D. J. Kushner, and N. E. Gibbons. 1964. Temperatureinduced death and lysis in a psychrophilic bacterium. Can.J. Microbial. 10:813-822.
35. Halvorson, H., M. Ishaque and H. Lees. 1968. Physiologicalactivity of bacteria indigenous to lagoon operation as afunction of seasonal change. Can. J. Microbiol. 14:369-376.
36. Halvorson, H., M. Ishaque and H. Lees. 1969. Microbiology ofdomestic wastes, No.2: A comparative study of the seasonalphysiological activity of bacteria indigenous to the sewagelagoon. Can. J. Microbiol. 15:563-570.
37. Hanus, F. J., and R. Y. Morita. 1968. Significance of thetemperature characteristic of growth. J. Bacterial.95:736-737.
38. Harder, W., and H. Veldkamp. 1968. Physiology of an obligate1ypsychrophilic marine Pseudomonas species. J. Appl. Bacterial.31:12-23.
39. Hawkes, H. A. 1963.Press, New York.
The ecology of wastewater treatment.203 p.
Pergamon
40. Hunter, J. V., E. J. Genetelli, and M. E. Gi1wood. 1966.Temperature and retention time relationships in the activatedsludge process. Proc. 21st Ind. Waste Conf. Purdue Univ.,Eng. Ext. Sere 121:953-963.

41. Ingraham, J. L.Bacteriol.
95
1958. Growth of psychrophilic bacteria.76:75-80.
J.
42. Ingraham, J. L. 1961. Newer concepts of psychrophilic bacteria,p. 41-56. In proceedings low temperature microbiology symposium.Campbell Soup Company. 1962. Camden, New Jersey.
43. Ingraham, J. L. 1969.at low temperature.
Factors which preclude growth of bacteriaCryobiology. 6:188-193.
44. Ingraham, J. L. and G. F. Bailey. 1959. Comparative study ofthe effect of temperature on metabolism of psychrophilic andmesophilic bacteria. J. Bacteriol. 1l:609~6l3.
45. Ingraham, J. L., and J. L. Stokes. 1959. Psychrophilic bacteria.Bact. Rev. 23:97-108.
46. Jones, P. H., and D. Prasad. 1968. The effect of sterilizationtechniques on wastewater properties. J. Water Pollution ControlFed~ 40:R477-R483.
47. Kates, M., and D. Baxter. 1962. Lipid composition and mesophilicand psychrophilic yeasts as influenced by environmentaltemperature. Can. J. Biochem. Physio1. 40:1213-1227.
48. Keefer, C. E. 1962.sludge process.
Temperature and efficiency of the activatedJ. Water Pollution Control Fed. 34:1184-1196.
49. Lamanna, C., and M. F. Mallette. 1965.Williams and Wilkins Co., Baltimore.
Basic bacteriology.408-421 p.
3rd ed.
50. Lof, G. o. G., J. C. Ward and o. J. Hao. 1971. Combined coolingand bio-treatment of beet sugar factory condenser water effluent.Completion report, OWRR project No. A-088-Colo. EnvironmentalResources Center, Colorado State University, Fort Collins.
51. Ludzack, F. J., et. al. 1961. Temperature and feed as variablesin activated sludge performance. J. Water Pollutiori ControlFed. 33:141-156.
52. Ludzack, F. J. 1965. Observations on bench scale, extendedaeration sewage treatment. J. Water Pollution Control Fed.37:1092-1100.
53. Lumry, R. 1959. Some aspects of the thermodynamics and mechanismsof enzyme catalysis, p. 257-261. In F. D. Boyer, H. Tardy,and K. Myrback (ed.) The enzymes. Volume 1. Academic Press,New York.
54. Marr, A. G., and J. L. Ingraham. 1962. Effect of temperature onthe composition of fatty acids in Escherichia coli. J. Bacteriol.84:1260-1267.

96
55. MacKeluie, R. M., J. J. R. Campbell, and H. F. Gronlund. 1968.Survival and intracellular changes of Pseudomonas aeruginosaduring prolonged starvation. Can. J. Microbiol. 14:639-645.
56. McDonald, I. J., C. Quadling, and A.K. Chambers. 1963. Proteolytic activity of some cold tolerant bacteria from Arctic sediments. Can. J. Microbiol. 9:303-315.
57. McGauhey, P. H. 1968. Engineering management of water quality.McGraw-Hill Book Co., New York, San Francisco, Toronto, London.35 p.
58. McKinney, R. E. 1962. Microbiology for sanitary engineers.McGraw-Hill Book Co., New York, San Francisco, Toronto,London. 248, 206-207 p.
59. HcKinney, R. E., and H. Edde. 1961. Aerated lagoon for suburbansewage disposal. J. Water Pollution Control Fed. 33:1277-1285.
60. Moore, E. W.Works J.
1941. Long time BODs at low temperatures.13:561-577.
Sewage
61. Morita, R. Y. 1966. Marine psychrophilic bacteria. Oceanogr.Marine BioI. Annu. Rev. 4:105-121.
62. Morita, R. Y., and L. J. Albright. 1965. Cell yields of Vibriomarinus, an obligate psychrophile, at low temperature. Can.J. Microbial. 11:221-227.
63. Morita, R. Y., and R. D. Haight. 1964. Temperature effects on thegrowth of an obligate psychrophilic marine bacterium. Limnol.and Oceanogr. 2:303-335.
64. Morris, D. J. 1948. Quantitative determination of carbohydrateswith Dreywood's anthrone reagent. Science. 107:254-255.
65. Nakonishi, T., T. Nakae, and B. S. Rasan. 1967. Psychrotrophicbacteria of raw milk. J. Ag. Res. 18:247-255.
66. Odum, E. P. 1959. Fundamentals of ecology. Saunders, Philadelphia.546 p.
67. Olsen, R. H., and E. S. Metcalf. 1968.topsychrophilic bacteria. Science.
Conversions of mesophilic162:1288-1289.
68. Palumbo, S. H., and L. D. Witter. 1969. The influence of temperatureon the pathways of glucose catabolism in Pseudomonas fluorescens.Can. J. Hicrobiol. 15:995-1000.
69. Pelczar, M. J., and R. D. Reid. 1965. Microbiology. 2nd ed.McGraw-Hill Book Co., New York, San Francisco, Toronto, London.5l3-52l.p.

70.
97
Peterson, A. C., and M. F. Gunderson. 1960.philic bacteria in frozen food spoilage.413-417.
The role of psychroFood Technol. 14:
71. Pipes, W. o. 1962. pH variation and BOD removal in stabilizationponds. J. Water Pollution Control Fed. 34:1143.
72. Pipes, W. o. 1966. The ecological approach to the study ofactivated sludge, p. 185-234. In Wayne Umbreit, ed. Advancesin applied microbiology. Academic Press, New York.
73. Reed, S. C., and W. N. Tobiasson. 1968. Wastewater disposal andmicrobial activity at ice-cap facilities. J. Water PollutionControl Fed. 40:2013-2020.
74. Reid, L. C., Jr. 1965. The aerated lagoon in Arctic Alaska.Presented at the 7th annual convention Western Canada Waterand Sewage Conference, Edmonton, Alberta, Canada. Cited byClark, S. E., H. J. Coutts, and C. Christianson. 1970.Biological waste treatment in the far north. Fed. WaterQual. Admin., Northwest region, Alaska. 6 p.
75. Reid, L. C., Jr. 1966. Operations of an aerated waste stabilizationpond in central Alaska. Water and Sewage Works. 113:310-315.
76. Rose, A. H. 1968. Physiology of microorganisms at low temperatures.J. Appl. Bacteriol. 31:1-11.
77. Ruttner, F. 1970. Fundamentals of limnology.Toronto Press, Toronto and Buffalo, Canada.
University of11 p.
78. Sawyer, C. N. 1939. Activated sludge oxidations. VI. Resultsof feeding experiments to determine the effect of the variablestemperature and sludge concentration. Sewage Works J. 12:244-259.
79. Sawyer, C. N., and M. S. Nichols. 1939. Activated sludge oxidations.I. Effect of sludge concentrations and temperature uponoxygen utilization. Sewage Works J. 11:51-67.
80. Sawyer, C. N., and G. A. Rohlich. 1939. Activated sludge oxidations. IV. The influence of temperature upon the rate ofoxygen utilization by activated sludges. Sewage Works J.11:946-964.
81. Schall, E. D., and D. W. Hatcher. 1968. Colorimetric determinationof nitrates and nitrites in feeds. J. Assoc. of OfficialAnalytical Chemists. 51:763-766.
82. Sherman, J. M. and G. M. Cameron. 1934. Lethal environmentalfactors within the natural range of growth. J. Bacterio1.27:341-348.

98
83. Sinclair, N. A., and J. L. Stokes. 1964. Isolation of obligatelyanaerobic psychrophilic bacteria. J. Bacteriol. 87:562-565.
84. Snedecor, G. W., W. G. Cochran. 1967. Statistical methods. 6thed. Iowa State University Press, Amer. 593 p.
85. Staley, J. T. and W. L. Boyd. 1967. L-serine dehydratse (deaminase)of psychrophiles and mesophiles from polar ~nd temperate habitats.Can. J. Microbiol. 13:1333-1342.
86. Stefaniak,O. 1968. Occurrence and some properties of aerobicpsychrophilic soil bacteria. Plant and Soil. 29:193-204.
87. Stokes, J. L. 1963. General biology and nomenclature of psychrophilic microorganisms, p. 85-102. In Recent progress inMicrobiology. Vol. VIII. University of Toronto Press, Toronto.
88. Stokes, J. L. 1968. Nature of psychrophilic microorganisms,p. 221-223. In John Hawthorn and E. J. Rolfe (ed.) Lowtemperature biology of foodstuffs. Pergamon Press, New York.
89. Strange, R. E. and F. A. Dark. 1962. Effect of chilling onAerobacter aerogenes in aqueous suspension. J. Gen. Microbiol.29:719-730.
90. Tai, P. C. and H. Jackson. 1969a. Apparent transformation of growthtemperature characteristics in Micrococcus cryophilus. Can.J. Microbiol. 15:1118-1120.
91. 1969b. Growth and respiration of a psychrophi1e,Micrococcus cryophi1us, and its mesophilic mutants. Can. J.Microbio1. 15:1151-1155.
92. 1969c. Mesophilic mutants of an obligate psychro-phi1e,Micrococcus cryophi1us. Can. J. Microbio1. 15:1145-1150.
93. Tappel, A. L. 1966. Effects of low temperatures and freezing onenzymes and enzyme systems, p. 163-177. In H. T. Merryman, ed.Cryobiology. Academic Press, New York.
94. Umbreit, W. W., R. H. Burris, and J. F. Stauffer. 1964. Manometrictechniques. 4th ed. Burgess Publishing Company, Minneapolis.305 p.
95. Unz, R. F. and N. C. Dondero. 1970.wastewater zoogloeas. Water Res.
Nonzoog1ea1 bacteria in4:575-579.
96. Upadhyay, J., and J. L. Stokes. 1962. Anaerobic growth of psychrophilic bacteria. J. Bacteriol. 83:270-275.
97. Upadhyay, J., and J. L. Stokes. 1963. Temperature sensitive formichydrogen1yase in a psychrophilic bacterium. J. Bacteriol.85:177-185.

99
98. Walpole, G. S. 1914. Hydrogen potentials of mixtures of aceticacid and sodium acetate. J. Chern. Soc. 105:2501.
99. Ward, J. C. and E. M. Jex. 1969. Characteristics of aqueous solutions of cattle manure. Presented at the Cornell UniversityAgr. Anim. Waste Conf., Syracuse, New York.
100. Warren, C. E. 1971. Biology and water pollution control. W. B.Saunders Co., Philadelphia, London, Toronto. 358 p.
101. Wuhrmann, K. Factors affecting efficiency and solids productionin the activated sludge process. In McCabe and Eckenfelder, ed.Biological treatment of sewage and industrial wastes. ReinholtPublishing Co., New York. Cited by Clark, S. E., H. J. Coutts,and C. Christianson. 1970. Biological waste treatment in farnorth. Fed. Water Qual. Admin., Northwest region, Alaska,11 p.

100
Appendix 1. Relation between number of cells/ml and Klett 1/50reading.
6
y = mX + b
# cells = m(Klett reading) + b
149-692.67m = 60-30 =
122.5 = 2.67 (50) + b
122.5 = 133. 5 + b
b = - 11
# cells = 2.67 (Klett reading) - 11
30 40 50
KLETT 1/50 READING
60
100
Appendix 1. Relation between number of cells/ml and Klett 1/50reading.
6
y = mX + b
# cells = m(Klett reading) + b
149-692.67m = 60-30 =
122.5 = 2.67 (50) + b
122.5 = 133. 5 + b
b = - 11
# cells = 2.67 (Klett reading) - 11
30 40 50
KLETT 1/50 READING
60

THE MECHANISM OF WASTETREATMENT AT LOW TEMPERATURE
PART B: SANITARY ENGINEERING
by
John C. Ward, John s. Hunter,Richard P. Johansen
Completion Report SeriesNo. 34

THE MECHANISM OF WASTE TREATMENTAT LOW TEMPERATURE
PART B: SANITARY ENGINEERING
Partial Completion Report
OWRR Project No. A-007-COLO
John C. WardJohn-S. Hunter
Richard P. Johansen
Environmental Engineering ProgramDepartment of Civil Engineering
Colorado State University
submitted to
Office of Water Resources ResearchU. S. Department of Interior
Washington, D.C. 20240
August, 1972
The work upon which this report is based was supported (in part) byfunds provided by the United States Department of the Interior, Officeof Water Resources Research as authorized by the Water ResourcesResearch Act of 1964, and pursuant to Grant Agreement No. 14-31-0001-3206and 3506.
Colorado Water Resources Research InstituteColorado State University
Fort Collins, Colorado
Norman A. Evans, Director

PREFACE
This report is part B of the overall project entitled, "TheMechanism of Waste Treatment at Low Temperature". Part A of this reportwas published separately by S. M. Morrison (director of the overallproject), G. C. Newton, G. O. Boone, and K. L. Martin, MicrobiologyDepartment.
This report itself is composed of 2 parts: Part 1 entitled, liTheEffects of Water Temperature and Elevation upon Aeration," by John S.Hunter and John C. Ward; Part 2 entitled, "BOD and COD Removal fromWastewater by Aeration with Air and Oxygen," by John C. Ward andRichard P. Johansen.
This report covers the work performed during the period of thispart of the project, namely July 1, 1970, through June 30, 1972 (2years). The total amount of support received from the Office of WaterResources Research was $4,700 per year.
ACKNOWLEDGMENT
The authors wish to acknowledge the financial support providedthe graduate students by the Office of Water Programs, EnvironmentalProtection Agency, Training Grants 5T1WP127 and lP3WP295, S.M. Morrison,Director. During the latter part of the project, Mr. Hunter wassupported by a research fellowship from the Office of Water Programs,Environmental Protection Agency.
i i

PREFACE . . . .
ACKNOWLEDGMENT
LIST OF TABLES
LIST OF FIGURES
SYMBOLS AND ABBREVIATIONS
TABLE OF CONTENTS
i i
. . . . i i
v
vi
vii
PART 1 - THE EFFECTS OF WATER TEMPERATURE AND ELEVATIONUPON AERATION . . . . . . . . . . . . . .
PART 2 - BOD AND COD REMOVAL FROM WASTEWATER BY AERATION WITHAIR AND OXYGEN . . . . . . . . . . . . . . . . . . .
1.II.
I I 1.
1V.
V.
VI.
Introduction .Experiment Design
A. Test Apparatus . .B. Test Procedure
Data Evaluation .....A. Raw Data . . . . . . . . .B. Theoretical Considerations ..C. Data Analysis . . . . . . .
Res u1ts. . . . . . . . . . . . . . . . . . . . . .A. Effect of Water Temperature Upon Power
Requirements . . . . . . . . . . .B. Effect of Water Temperature Upon AerationC. Combined Effect of Elevation and Water
Temperature Upon Aeration . . . . . .Di scuss ion . . . . . . . . . . . . . . . . . . .
A. Arrhenius Equation .B. Linear Versus Exponential Variation in KLa ..
Summary. . . . . . . . . . . . . . . . . . . . .References Cited .Appendi x . . . . . . . . . . . . . . . . . . . .
A. Calibration of Dissolved Oxygen Meter andStrip Chart Recorder .
B. Saturation Dissolved Oxygen Concentrationsin Water . . . . . . . . . . . . . . . . .
C. Adjustment of Air Flow .D. Determination of Sodium Sulfite and Cobalt
Chloride Dosage .E. Derivation of an Equation for Predicting
Atmospheric Pressure as a Function ofElevation and Air Temperature .
1224557 C.9
20
2021
22363638404345
45
4648
49
50
53
iii

TABLE OF CONTENTS (Continued)
Reason for the Aeration StudyExperimental Procedure .Experimental ConditionsExperimental Results. . .Analysis of Experimental Results.Conclusions ...Recommendations
ABSTRACT . . . . . .
iv
Page
53555556566667
70

Number
12
3
4
5
6
7
8
9
10
1 I
1213
1415
1234
567
LIST OF TABLES
PART 1 - THE EFFECTS OF WATER TEMPERATURE AND ELEVATIONUPON AERATION
Title
Raw Data ..Observed Values of Cs and KLa .Statistical Analysis Summary for Both Methodsof Determining KLaSensitivity Analysis - Effect on KLa of0.10 mg/~ Change in Cs .Differences Between Calculated Cs and TrueCs ... . .. . .DO at Saturation for Various Elevations andwater Temperatures .Cs - C (C = 2 mg/l)
KLa ..KLa(Cs - 2)
KLa(T) (Cs - 2)/KLa(20oC' (Cs -2)I sea level
Maximum Possible Relative Efficiencies as aFunction of Water Temperature .Activation Energies .. ... ..Saturation Dissolved Oxygen ConcentrationsUsed ... .Water Vapor Pressures UsedMaximum Water Temperatures for an Errorof 1% •••• •• •
PART 2 - BOD AND COD REMOVAL FROM WASTEWATER BY AERATIONWITH AIR AND OXYGEN
Experimental Conditions .Experimental Results .Analysis of Experimental Results .Time Required for Removal of 50% of theOxygen Demand . . . . . . . . . . . . .Analysis of Experimental ConditionsEfficiency of Oxygen Transfer .Oxygen Demand Removal .
v
611
17
19
20
25262627
28
3339
4647
47
555758
59616167

Number
12
3
4
5
6
7
8
9
10
11
12
12
3
4
5
6
LIST OF FIGURES
PART 1 - THE EFFECTS OF WATER TEMPERATURE AND ELEVATIONUPON AERATION
Ti t1 e Page
Experimental Aeration Vessel Configuration 3Values of KLa Based on Ca1culateQ Cs 12Deviation From Linearity Due to AssumedVa 1ues 0 f Cs . ... . 13
Plots of (Cs - C) Using Calculated and TrueCs Val ues. . 15
Values of KLa Based on True Cs 16
Variation of KLa with Temperature 23
The Combined Effect of Elevation and WaterTemperature Upon Aeration (Operating DO = 2mg/l). . . .. . . ... 29Effect of Elevation on Relative AerationEffi ciency . . ... . 35Effect of Water Temperature on RelativeAerati on Effi ci ency ... . ..... 35Applicability Test for van't Hoff-ArrheniusEquation. . ... 37Correction Factors for KLa from theLiterature, 200C Reference .. .... 41Definition Sketch of Model Atmosphere 50
PART 2 - BOD AND COD REMOVAL FROM WASTEWATER BY AERATIONWITH AIR AND OXYGEN
Elevation Classification for Colorado 54Fraction of Oxygen Demand Remaining Versust/tl / 2 .• . .. ... 60
Average Fraction of Initial Oxygen DemandRemaining .. . .. .. 63Effect of Gas Flow Rate on Fraction of DissolvedOxygen Saturation Concentration . .. 64Dissolved Oxygen Concentration Resulting from aGiven Ratio of Oxygen Supply Rate to OxygenConsumption Rate (by Weight) . . . . . . . . 65Enclosed Contact-Stabilization Activated-SludgeWastewater Treatment Plant Using OxygenInstead of Air for Aeration . . 68
vi

a
atmAcalcmCCl
Cs
°cCoC1 3DDOEEaEq.
6~g
galhphrin.
§KKLKLa
}1,lblnlogmMminmg/l
mlmm HgNa2S03Na2S04
SYMBOLS AND ABBREVIATIONS
PART 1 - THE EFFECTS OF WATER TEMPERATURE AND ELEVATIONUPON AERATION
air-water interfacial surface area per unit volumeof water (i -1 )atmosphere (mi- l t-2)
altitude (}1,) or area (}1,2)caloriecentimeter ell.)00 concentration (mg/£)saturation DO concentration in pure water at abarometric pressure of 1 atm, (mg/i)DO concentration in pure water at stated barometricpressure (mg/ i)degrees centigrade (Celsius)cobalt chloridecoefficient of molecular diffusion (£2t- l )dissolved oxygen concentration (mg/£)efficiencyactivation energy (cal/mole)equationfoot (i)degrees Fahrenheitgram (m) or acceleration of gravity (981 cm/sec 2 )
gallon (i 3 )
horsepower (mi2t-3 )hour (t)inch (i) .-1chemical reactioB rate (t )degrees Kelvin ( C + 273)over-all mass transfer coefficient (£t- l )
over-alllvolumetric mass transfer coefficient, liquid-phasebase (t- )lengthpound (mit-2)natural logarithmcommon logarithmmassMolecular weight of air (29 g/mole)minute (t)milligram per liter (mi-3)
milliliter (£3)millimeter of mercurysodium sulfitesodium sulfate
vii

No.
°2PpsiprpmR
SCFHtT
Vpe
atmBOD&00
°cofDOmgmg/R,00%t
t'/2
t/t l / 2
SYMBOLS AND ABBREVIATIONS (Continued)
numbermolecular oxygenvapor pressure of water at the stated temperature (atm)pounds per square inch (m£-lt-2)atmospheric pressure (mR,-'t-2)revolutions per minuteuniversal gas constant [1.99 cal/(mole)(oK)]standard cubic feet of gas per hour at 700 F and 1 atm (R,3 t -l)timetemperature (oC or oK as specified)volume (R,3)density (mR,-3)temperature correction coefficient for KLa (dimensionless)
PART 2 - BOD AND COD REMOVAL FROM WASTEWATER BY AERATIONWITH AIR AND OXYGEN
atmospheresbiochemical oxygen demandchemical oxygen demanddegreedegrees centigradedegrees Fahrenheitdissolved oxygenmilligrammilligram per literoxygen demandpercenttime in daystime required for removal of 50% of the initial oxygendemand, daysratio of aeration time to time required for removal of50% of the initial oxygen demand
viii

PART 1 - THE EFFECTS OF WATER TEMPERATUREAND ELEVATION UPON AERATION
by
John S. Hunter and John C. Ward
1. Introduction
The central thrust of this project has been the study of wastewatertreatment under conditions of high altitude and low water temperature.Aeration is a fundamental operation used in many wastewater treatmentfacilities designed to function under these conditions. The study ofhow aeration is affected by such conditions, then, has become anintegral part of this project.
Changes in elevation are accompanied by changes in barometricpressure and atmospheric temperature. Changes in barametric pressureaffect aeration directly through changes in the dissolved oxygensaturation concentration because this value determines the availabledriving force for transferring oxygen from the atmosphere into thewater. The dissolved oxygen saturation concentration is directlyproportional to atmospheric pressure in accordance with Henry·s law.Henry's law is valid over a wide temperature range and can be appliedwhenever the proportionality constant for the particular wastewaterbeing considered is known (Eckenfelder, 1966, page 52). The proportionality constant for domestic sewage is approximately 95 percent that ofclean water (Fair, Geyer, and Okun, 1968, page 23-10).
Changes in atmospheric temperature which accompany changes inelevation do not have as direct an effect on aeration as do changesin atmospheric pressure. The degree to which atmospheric temperaturesinfluence wastewater temperatures is a function of each individualwastewater collection and treatment system. In general, however,warmer wastewater temperatures can be expected in warmer climates andcolder wastewater temperatures can be expected in colder climates. Itis found through the examination of atmospheric tables that atmospherictemperatures fall with increasing elevation. Because this project wasoriented about the effects of high altitude it was necessary tocritically examine existing methods for predicting the effects of lowwater temperature upon aeration.
A review of the literature indicates that most studies which havebeen performed to date (for determining oxygen mass transfer rates intowater at various water temperatures) have typically been carried out insystems where the water temperature was varied between 10 and 30oC.Field studies carried out under this project revealed that many wastewater treatment facilities located in the mountainous resions ofColorado aerate wastewaters having temperatures below 10 C duringsignificant portions of the year. A few plante were found to beaerating wastewaters with temperatures below 1 C. Some doubt existsas to the appropriateness of extrapolating existing aeration data down

2
into the 0 to 100C range, especially for the design 06 facilities thatare to treat wastewaters having a temperature below 1 C. As a result,the main emphasis of the aeration studies portion of this project hasbeen placed on finding a reliable method for predicting the effect ofwater temperature upon aeration with Barticular attention being paidto water temperature between 0 and 10 C. Such a ~ethod has been found.It is accurate over the temperature range 0 to 40 C. Henry's law hasbeen incorporated into this method to show in graphical form thecombined effect of elevation and wastewater temperature upon aeration.A range in elevation of -3,000 to 618,000 feet above mean sea leveland a temperature range of 0 to 40 C have been represented.
II. Experiment Design
The laboratory technique used in this research effort to determineoverall oxygen transfer coefficients at various water temperaturesclosely parallels that used in the testing of full-scale aerators. Theunderlying method employed is commonly referred to as the clean water,nonsteady state, test technique. Large samples of distilled water weredeaerated and then each was subjected to the same mixing and submergedair discharge conditions. The temperature of each sample was rigidlycontrolled and the barametric pressure was measured for each test run.The absolute value of the dissolved oxygen (DO) concentration of everysample was continuously monitored during each test run with a dissolvedoxygen probe. This data was logged by a strip chart recorder so thatthe DO values were obtained as a graphical display of DO versus timefor the entire duration of each test.
A. Test Apparatus
The aeration tank and aerator used in these experimentsconsisted of a large Pyrex glass jar and a small turbine. The jar wascylindrical in shape with a nearly flat bottom. It had an insidediameter of 11 7/16 in. (29.05 em) and was 17 5/8 in. (44.77 em) deep.A flat blade impeller with 6 blades was mounted coaxially within thetest cylinder at a distance of 1 7/8 in. (4.76 em) from the bottom.The impeller diameter was 4 in. (10.16 em) and each blade was 1/2 in.(1.27 em) wide. An air sparger was mounted directly under the impeller.It consisted of a small, contoured, plastic, reagent dropper bottlewhich had been placed on one of its flat sides and then glued to a5/16 by 2 in. (0.79 by 5.08 em) brass bar which extended across thefull width of the aeration tank bottom. The bottle had a 1/4 in.(0.64 em) hole which was bored at the center of the flat side facingthe impeller. There was approximately a 1/4 in. (0.64 em) clearancebetween the sparger and the impeller. Air was supplied to the spargerthrough a flexible plastic tube which was positioned along the aerntio~
tank bottom and then up the tank wall immediately behind a baffle withrespect to the liquid flow induced by the impeller. Baffles wereinstalled in the tank to prevent the formation of a vortex therebyproviding better mixing conditions. Four baffles, each 1/8 in. (0.32 em)thick, 1 in. (2.54 cm) wide, and 17 in. (43 cm) long were positioned atequal intervals around the tank. These baffles were mounted perpendicularly with respect to the tank walls and floor. Each baffle was

-." r- I"-----
17 " . 17/8"
3
I/SII
I~19.0 Liters ofDist i lied Wat er
Baffle
Flat Blade TurbineWith Six Blades
1/8"
~II 7/16'-1-----4....
Air Sparger
Fig. I Experimental Aeration Vessel Configuration

4
positioned 1/8 in. (0.32 cm) from the tank floor and walls to preventthe formation of any areas of stagnant flow. The above aeration testapparatus geometry was chosen as it meets the pertinent requirementsof geometric similarity necessary for comparing results of this studywith those of other liquid mixing studies. (Further details on thissubject are available from: Bates, Fondy, and Fenic, 1966, pages 111178; Sterbacek and Tausk, 1965, pages 73-124; and Holland and Chapman,1966, pages 1-18.)
The compressed air supplied to the sparger was first passedthrough a laboratory air filter to remove any foreign materials (suchas oil) that might affect the oxygen mass transfer process. The airwas then passed through bubblers containing distilled water at a temperature approximately that of the water sample in the aeration vessel.This was done to reduce any effects on the data which could arise fromheat or water mass exchange between the air bubbles and the water testsample. The air flow rate was controlled by means of a rotometer.
A Model ELB Experimental Agitator power drive and stand manufacturedby Chemineer, Inc., of Dayton, Ohio, were used to turn the impellershaft and hold the shaft in position. This unit could be controlled toprovide any constant speed desired for the impeller from 0 to 1100 rpm.
One of the most important tasks involved in carrying out thisstudy was the bringing of water samples to the temperatures of interestand then maintaining them at these temperatures within very small~c1-rances throughout the duration of the experiment. This wasaccomplished by supporting the aeration vessel within a slightly largervessel which had a heat exchange fluid constantly circulating throughit from a temperature regulated reservoir. A 7 cubic foot (198 liter)capacity reservoir constructed of stainless steel was used. Coolingwas carried out by means of a Model Number PCC-13A Constant FlowPortable Cooling Unit manufactured by the Blue MElectric Company.Heating was accomplished by means of a hot water jacket built into thewall of the reservoir. Hot water was obtained from a laboratory hotwater tap. Steam was used instead nf h~t water in some instances.Uniform temperature of the sample was maintained by adjusting the flowof heat exchange fluid (water containing methyl alcohol as an antifreeze) between the reservoir and the vessel containing the aerationtank.
Instrumentation included a Cole-Parmer "touchless ll, portable,
solid state, photo-reflective, electronic tachometer which was used formeasuring the turbine shaft rotational speed; a dynamometer used tomeasure power input to the aeration vessel which was supplied byChemineer, Inc., for use with its impeller drive assembly; and a YellowSprings Instrument Company Model 54 DO meter which was connected to aModel SR-15 (S72180-15) Sargent strip chart recorder in order to providecontinuous time referenced DO data.
B. Test Procedure
1. Place 5.02 gallons (19.00 liters) of distilled water inthe aeration tank.

5
2. Turn on the impeller drive assembly and adjust impellerrotational speed to 600 rpm.
3. Turn on the air supply and adjust flow rate to 1.0 SCFH(see Appendix C for procedure).
4. Add the proper amount of cobalt chloride (CoC1 3) solutionto the water sample (see Appendix 0 for dosage calculation).
5. Adjust the water sample temperature to the desired value+ O.loC. It will normally require 1 to 4 hours to attain a stablewater sample temperature. When a stable water sample temperature isattained, make any necessary adjustments to the impeller rotationalvelocity and air flow rate to ensure that they are 600 rpm and 1 SCFH,respectively.
6. Calibrate the dissolved oxygen meter and strip chartrecorder with the probe of the DO meter located within the aerationtank and fixed in its monitoring position (it was found that thesmoothest, most consistent data output could be obtained by positioningthe probe just under the water sample surface on the front side of abaffle with respect to the water flow pattern induced by the impel~er.
The probe membrane surface should be tilted approximately 10 to 15 fromhorizontal to permit constant flow of the test sample water across it).Calibrate the monitoring and recording system to the saturation DOconcentration ;n pure water at the water test sample temperature and theexisting barometric pressure (see Appendix A for calibration procedure).After the system is calibrated, leave it on line -- do not place onstandby or turn if off.
7. Add the proper amount of sodium sulfite (Na2S03) solution(~2e Appendix 0 for dosage calculation).
8. Measure torque being applied to the impeller shaft.9. Continue the test run until the agitated water sample is
nearly saturated with dissolved oxygen (this varies between 15 and 30minutes, depending upon the sample temperature). Constantly monitorand make any necessary adjustments in water sample temperature and airdischarge rate during all test runs.
10. Repeat steps 7, 8, and 9 two times in order to obtain 3test runs at each desired water temperature.
11. Dispose of the water sample.
III. Data Evaluation
A. Raw Data
The above test procedure was followed in obtaining oxygenmass transfer data in water samples maintained at the followingtemperatures: 0.5, 1, 2, 3, 4, 5, 6, 7, 8, 9, 10, 15, 20, 25, 30, 35,and 40 c. A summary of the raw data appears in Table 1. The valuesrecorded in this table are DO concentrations in the samples (Ct ) asread from the continuous curves of data produced during each test run.The values were read at one-minute intervals with an arbitrary zeroreference time chosen such that C, min. occurred within the firstportion of what appeared to be a first order reaction rate responsefor the recovery of DO in the sample. Normally, C, min. occurred

6
TABLE l--RAW DATA
I
~11 "in. 12.lin. 13 lIin. 14 Olin. IS min. 16 "tn. 11 min.
(r.'!I/t) (~il/') (m~/t) ("'!i/') ("'9/.) ("9/1) ("~/ll------- -------_.:.-- --_.-.. _-.====-.--._-.-------
9 .,In. 10 "in.
(r ~!t) (m9/ ,)
81'11n.
("9/')
6 Il'n.
("9/')
~....L.Q.:..-
Tut R1:n \ ,,,In. Z Olin. 31>1n. 4 Illn.
:;0. 1.0. -:...<"'...:.1/_'_)__('..;.'9_1i_I__i~_.9_1'_)__(,_,,_/1)
2.7; C.CO2.51 3.84r.23 C.18
2.61 • 4.022.10 C.022.29 3.14
2.10 3.50I. 30 3.041.61 3.080.5' 2.17
1.23 2.73l.S~ 3.13c.~; 2.S0
r.83 3.873.03 4.063.07 C.152.54 3.432.4. 3.522.55 3.£1
2.78 3.683.01 3.862.84 3.75
2.50 3.4,12.38 ' 3.212.63 3.48
2.52 3.222.21 3.072.SO 3.27
2.57 3.502.27 3.072.43 3.14
C.12 5.283.91 5.09C.OO 5.11
3.19 C.482.81 C.172.10 4.19
3.15 C.SO2.96 C.332.!i3 C.30
2.1!i c.n3.14 C.CO2.95 C.20
3.50 C.872.Se C.l03.08 C.Cl
3.10 C.503.CO 4.733.02 C.JO
3.40 C.eoC.18 5.434.08 5.37
2.5C 3.773.12' 4.232.85 C.Ol
7.0
Ul
2.0
5.0
8.0
'.0
0.5
9.0
3.0
4.0
1.0
35
10
20.0
20
15.0
10.0
'.208.25
9.»!i.20
9.549.569.55
9.629.67t.68
10.0010.0610.02
10.1910.1910.20
10.4010 . .;010.39
10.7710.75\0.80
10.9010.9010.S9
11.3011.l311.25
1I.C511.5011.48
11.40\1.3511.40
8.038.058.00
7.401.397.37
6.626.656.611 .
6.016.086.09
5.435.455.49
4.994.S94.90
8.071.687.37
9.645.679.61
9.089.059.05
4.904.904.90
4.90C.89C.5'1
8.178.208.25
9.309.269.219. J5
9.469.SO9.51
'.52!i.6O!i.U
9.979.999.99
10.1110.1510.13
10.3010.3110.34
10.6510.6810.69
10.7910.3010.78
11.2111.1111.10
11.3J11.31111.34
11.3011.2311.30
7.998.027.96
7.37'7.357.35
6.586.636.65
6.056.076.07
5.425.435.41
4.8S4.BSC.90
7.987.597.27
9.tO9 .6~
9.58
9.019.018.98
4.874.8S4.89
7.881.461.12
9.509.509.52
8.948.938.91
4.904.B'4.3S
7 .9~
7.917.92
7.327.327.30
6.536.626.63
6.026.066.06
5.405.425.45
8.148.188.22
9.22
11.0310.9610.91
!i.23!i.209.149.03
9.379.C29.40
9.429.509.57
9.909.909.S9
10.0110.0410.07
10.7010.2010.22
11.1511.2311.19
11.1211.1311.16
10.5210.5210.56
\0.6810.6510.62
5.J85.405.45
8.08'.138.15
!i.U
C.874.814.88
7.741.326.95
9.C49.459.44
8.868.858.82
4.B84.864.86
9.159.129.058.97
9.269.319.30
9.359.429.46
!i.eo!i.849.76
!i.93!i.'lli9.91
10.0810.0810.08
10.3910.3810.42
10.5010.5010.48
10.8910.7810.80
11.0011.0711.02
10.9911.0011.01
7.817.917.36
7.267.277.25
6.486.536.59
6.006.056.03
7.257,2S7.25
8.028.068.10
9.068.98
9.379.379.37
B.768.738.70
4.864.E54.85
7.207.227.19
6.426.536.55
6.006.0l6.01
5.355.3H5.43
C.e54.854.87
7.627.156.80
!i.059.008.928.85
9.139.209.18'
9.249.309.38
9.689.709.66
9.809.829.81
9.919.899.93
10.2110.2010.25
10.3010,3J10.26
10.7010.5810.60
10.7710.8410.18
\0.S310.B410.87
7.197.857.78
f ~8••7&.56
4.844.B•. 83
9.279.23!i.l'
7.117.l07.20
8. ~-j
9.008.99
9.119.119.24
7.?-31.;0B.O\
0.958.f88.96
8.90B.8/8.800.69
4.6\4.794.M
9.119.0.9.09
7.101.\3T.13
7.P47.817.L,'
8.858.738.8~
8.768.708.578. 50
9.718.888.ac
8.928.029.08
9.329.319.30
'8.428.3£B.31
7.21 7.436.73 6.946.43 6.64
4.80 4.b24,80 4.834.82 4.t:~
10.3; 10.6410. J8 10.6710.40 10.67
1.56 7.697.63 1.7!:'7.57 7.69
1.02 7.137.06 7.157.04 7.12
6.21 6.336.40 . 6.476.42 6.49
5.90 5.965.92 5.~5
5.92 5.9/
5.30 5.335.31 5.355.31 5.40
10.23 10,5110.35 10. ~310.23 10.,.
9.44 9.659.43 9.629.45 9.67
9.47 9.119.39 9.669.46' 9.71
9.73 10.019.70 9.979.77 10.03
9.79 10.099.80 10.099,73 li1.05
10.20 10.4U10.03 lu . .J.~
10.04 10,]4
7. J87.477.42
6.8S6.926.91
6.('36.3i•. n
7.007.027.02
7.697.737.i5
8.21e,148.\4
4.7a4.144.7B
8698.548.t7
8.568.498.358.25
8.54B.64B.5S
8.708.198.68
6.556,0,; .17
8.91B.'O8.85
5.84~.s.:;
5'.85
5.245.<45.32
4.754.75C.Til
9.109.109.09
9.239.209.23
9.189.\09.17
9.429.369.40
9.439.479.37
9.889.679.70
9.839.989.87
10.0710.03\0.11
8.r.48.6,8.62
6.696. i85.90
';.13C.W•• 73
6.656.876.88
7.501.551.58
8.508.318.45
8.328.7\8.107.95
7.9C7.e:.7.aS
8.218.38B.25
8.438.,28.61
e.813.P.-lB.79
f.938.918.95
8.848.148.77
9.0?8.999.02
9.029.07e.96
9.,09.229.<7
9.409.539.40
9.639.759.15
7.147.267.20
6.726.776.75
5.806.11£.18
5.765.765.75
5.175.175.23
4.694.694.72
5.075.085.12
4.624.624.64
6.656.106.72
1.257.307.3b
8.238.048.21
8.007.857.737 .~8
7 .t~
8.021.~;
6.355.835.51
8.318.308.38
7.627.507.52
4.664.594.64
8.108.188.34
8.478.498.44
8.408.328.33
9.588.558.60
8.578.W8.50
9.028.73c.19
8.91 '9.068.90
8.608.55B.60
9.189.329.2b
6.847.016.93
6.486.586.52
5.525.985.98
5.635.655.63
7.8'17.G57.90
1.938.047.eD
C.448.10B.W
6.356.506.48
6.936.997.0S
8.308.;08.30
4.924.914.99
B.048.108.02
8.198.138.17
7.917.717.79
8.067.998.00
41.52C,434.54
5.985.435.22
7.927.9.8.00
7.187.047.08
4.534.454.S~
7.607.447.307.10
7.367.'.Jl7.37
7.707.777.93
8.638.808.78
6.496.686.59
6.196.286.265.175.725.75
5.435.485.45
6.CO6.106.15
7.!.O7.587.46
7.637.597.60
7.307.0d7.13
7.407.3\7.34
6.666.536.52
6.777.036.79
7.217.301.C7
4. J~C.264.~0
7.237.357.14
6.556.606.6~
1.C37.157.4/
7.056.B·;6.786.48
7.151.347.48
7.557.787.5\
7.908.238.14
6.036.266.16
5.835.925.914.935.395.44
5.185.215.23
4.694.674.78
c.nC.284.38
5.524.944.81
7.481.481.00
4.113.984.17
5.605.655.75
6.036.076.17
6.616.536.97
6.4S6 .~2
6.105.110
6.056.326.02
6.636.646.88
6.826.936.79
7.006.886.91
6.536.296.29
6.60~ .476.C7
6.396.546.30
6.98£.436.63
6.736.906.61
7.057.C7J .39
5.435.75S.62
5.325.465.48 .4.514.!i35.00
4.83C."4.88
4.424.374.51
C.084.034.15
4.!i84.454 .3~
6.!i76.927.07
5.975.875.87
5.17S."5.07
5.675.505.49
5.395.555.30
6.005.335.&5
5.655.9B5.57
6.056.53£.47
4.655.074.92
C.684.834.S9~.10
4.334.42
5.005.005.15
S.405.C35.55
6.165.806.2£
5.65!..3J5.n4.10
4.3bC.49C.42
3.993.924.0B
5.905.926.19
6.086.115.S7
3.72>.633.78
4.303.783.71
6.33~.23
6.43
5.085.05~.08
6.226.086.11
'5.615.305.30
5.535.315.65
4.06C.oJC.07
3.232.983.37
C.254,25C.3S
4.514.55C.£8
5.26C.905.50
4.65C.30C. 3~3.93
4.13C."3.!i2
5.0;5.025.25
5.115.1b4.%
3.253.253.30
3.553.493.68
3.853.flC.41
4.634.37
. C.70
2.72•. 192.82
2.462.12•. 71
I.S0U.9S1.,3
1.~';
1.121.43
1.571.43l.72
1.691.C;1.Cl
1.lJ\.75\.70
1.9>1.951.95
2.352.122.27
2.17~ .453.20
2.1C2.482.53
1.60l.'"\.2C
I.LO1.951.60
1.102.L92.59
1.471.741.42
1.73\.U\.82
\.461.151.31
l.521.B31.51
I.C51.101.48
3.573.113.55
1.351.3C1.42
1.420.91I.n
10
17
18
20
II
21
14
16
"
23
12
I.

7
approximately 1 minute after the sample DO started to rise. The DOvalues increased from 10 to 80 percent of saturation within 12 to 17minutes for all test runs. Ka1inske (1969, page 2) reports that themost meaningful data for aerator tests is obtained if the DO in theliquid volume increases over this range somewhere within 10 to 30mi nutes.
B. Theoretical Considerations
In the technique utilized for these experiments, the sodiumsulfite, catalyzed by means of cobalt chloride, reacts with the oxygenpresent in the sample to form sodium sulfate, removing the dissolvedoxygen from the water sample by chemical reaction. Oxygen is constantlybeing added to the water by the aerator so the finite amount of sodiumsulfite added to the sample becomes exhausted with time, and then theDO rises towards its saturation value. An equilibrium DO value ofapproximately 0.5 mg/l was usually noted during the period when thesodium sulfite was present in significant quantity. A point in timewas reached, however, when the quantity of sodium sulfite present wasreduced so much as not to be able to maintain this equilibrium DO valueand, in accordance with Le Chate1ier's principle, the DO level wouldrise. If the oxygen mass transfer process is a diffusion only processwith no chemical reaction involved, the mass transfer of oxygen intothe sample should follow first order kinetics as described by Fick'sfirst law of diffusion. It was noted in these experiments that therewas a short transition period between the time when the DO value firstsl.d.i'ted to increase from its low equilibrium value and the time whenthe reaeration of the sample could be described by first order kinetics.As previously noted, this period was approximately 1 minute in duration.This transition period can be interpreted as being the time necessaryfor the incoming oxygen to eliminate the last fraction of sodium sulfiteremaining in the sample.
Assuming that the reaeration process observed was a diffusion onlyprocess with no chemical reaction involved and that this process can beadequately described by Fick's first law of diffusion (assumptionsmade in all aerator tests), the rate of oxygen mass transfer, am/at,into the water sample is
am dCat = - o(ax) dy dz (1)
where am/at is the rate of mass transfer, mg/hrD is the coefficient of molecular diffusion, cm2/hrdC/ax is the concentration gradient, mg/cm4
and dy dz is the area through which the oxygen molecules pass.Fick's law is written in the form of a partial differential equationbecause the concentration gradient, aC/ax, at any fixed location in theX direction changes with time (Fair, Geyer, and Okun, 1968, page 23-5).For computational convenience the above equation can be reduced to theone-dimensional form
~~ = - DA ~~ ( 2)

(3)
8
where A is the surface area (in cm2 ) normal to the Xaxis across whichthe mass transfer occurs and x is the distance in the X direction.Expressed in terms of the Whitman two-film theory (Lewis and Whitman,1924, pages 1215-1220) Eq. 2 takes the form
dm (Cs-C)dt = DA -x-
L
where Cs is the saturation DO concentration, C is the DO concentration in the water, and xL is the thickness of the water film acrosswhich the oxygen mass transfer takes place. Because there is no way tomeasure the liquid film thickness, xL' directly, it and the diffusivityterm, D, are normally combined into one term designated KL . Bysubstituting KL for D/xL in Eq. 3 and then dividing both sides bythe aeration tank volume, V, in cm 3 , the following expression isobtained:
dm/dt _ dC _ KLA (C _ C) .V - dt - V s (4)
The interfacial area, A, encountered in aeration practice is noteasily measured. To overcome this difficulty, a term representing theinterfacial surface area per unit volume of liquid, a , defined as
a == A/V (5)
is used to form the product KLa. This product has the dimensions ofreciprocal time and is usually expressed in hr- l . KLa is the overallvolumetric mass transfer coefficient, liquid phase base. It is commonlyused to calculate oxygen mass transfer rates for aeration systems throughuse of the following equation which is obtained by combining Eq. 4 andEq. 5:
dC _ )dt - KLa (Cs - C (6)
where Cs and C are normally expressed in terms of mg/l and KLain terms of hr- l .
In addition to the assumptions already mentioned, it is importantto note that certain other assumptions have been made in developing thediscussion presented up to this point. These include:

9
1. Perfect mixing is attained and is maintained throughout theentire test procedure,2. The overall mass transfer coefficient, KLa is constant
regardless of time or DO concentration, and3. The Whitman two-film theory (Lewis and Whitman, 1924, pages1215-1220) describes the oxygen mass transfer process and the resistanceof the gas film to oxygen transfer is negligible compared to theresistance of the liquid film.
Perfect mixing is nearly impossible to attain. Deviations from thiscondition, however, were considered to be slight for the test apparatusused in these experiments. Also, any deviation from perfect conditions,i.e., the development of DO cencentration gradients within the aerationtank, were compensated for, in part, by placing the DO probe in thesame monitoring position for all test runs. The second assumption isapparently correct, but test conditions seem to influence the range ofDO concentrations over which KLa can be observed to be constant duringa test run. According to Landberg, Graulich,and Kipple (1969, page 447),KLa in full-scale surface aerator tests is constant only when thewater sample DO is in the approximate range of 30 to 80% of saturation.Apparently, above 80% of saturation, the errors in the values of Cand Cs are compounded by taking their difference. In addition, thevalue of C is not likely to be precisely the same over the wholeaeration volume. Consequently, test results may depend upon such testconditions as size of the aeration tank and aerator characteristics.For example, in this particular study, KLa appeared to be constantbetween" DO concentrations of approximately 5 to 80 percent of saturation.Discussion by Landberg, Groulich, and Kipple (1969, pages 447-448)indicates that the expansion of this range over which a constant KLaapplies (which was noted in this study) was due, in part, by theattainment of more perfect mixing conditions than those which occur infull-scale aerator tests. The third assumption that the Whitman twofilm theory is applicable, although not necessarily correct in thephysical sense, provides a mathematical model which seems to providevery reasonable results (Rich, 1961, page 172).
C. Data Analysis
Solving Eq. 6 by integration yields
Cs - CoIn(C _ C ) = KLa(t - to) (7)s
where Co is the value of C at time to. Equation 7 can berewritten as
(8)

10
From Eq. 8, it can be seen that a graphical plot of £Og(Cs - C) versust will be a straight line with
slope = -KLa/2.3 (9)
and ordinate intercept at t = 0 of
(10)
Values of (Cs - C) were calculated at l-minute intervals foreach test run and then plotted as described above. The KLa for eachtest run was then determined by calculating the slope of the straightline of best fit using Eq. 7. The KLa values found are listed inTable 2 and are displayed graphically in Figure 2. A linear relationship between KLa and water temperature, T, was apparent from visualinspection. The observation was verified mathematically as the dataproduced a correlation coefficient for a straight line of 0.989 whichshows that the regression explains 97.8 percent of the observedvariance. A least squares analysis produced the following equation ofthe straight line, including 95 percent confidence limits for the slopeand intercepts:
KLa = 10.3812 (~0.2000) + 0.2935 (~0.0110)T (11)
where KLa is expressed in terms of hr- l and T in °C.
A close examination of the semi-log plots of (Cs - Ct ) versustime, t, revealed that several curved away from the straight line ofbest fit. Some of these plots curved up and some curved down withincreasing t. The general shape of these curves was similar to theshape of the curves shown in Figure 3. The curves shown in this figurewere generated by calculating (Cs - Ct ) values from an idealized,hypothetical set of data using Cs values which were equal to Cs )Cs ~ 0.1 mg/l, Cs ~ 0.2 mg/l , and Cs ~ 0.5 mg/l. If the raw datafrom any test run is accurate and is representative of first-orderkinetics, it should plot as a straight line if the proper value ofCs is used in calculating (Cs - C). This case is represented by thestraight line in Figure 3 which lies in the center of the group ofcurves which have been generated. It can be seen from Figure 3 thatif the Cs value used in calculating (Cs - C) is in error, the datawill plot as a curve, not as a straight line as theoretically predicted.More significantly, it can be seen that the slope of the straight lineof best fit is influenced by the assumed value of Cs . The KLa

One)
Ic!er.tification
TABLE 2··0BSERVED VALUES OF C~A~D KLaData
Identification
Kote
\~
Us; n9 \JS I ng~1cuJ.sted Tr"e
Cs Cs(hr- 1) (hr-1)
Cs
(rr.g/t) (l:1g/t)
Cilculited TrueRun
NumberTest
Number
Temp.
(OC)
Note
~a
U-slng UsingC.lculatld Trlle
C~ Cs(hr- 1) (hr~l)
Cs
(:::<;/1) (mg/t)
Calculated TrueRunNum!ler
TutNumbe",
Te::lp.
(oC)
,.
20
15
10
.8
. 6
8
10
11
12
7.52
8.22e.228.22
9.349.349.34
9.579.579.579.58
S.839.83S.B3
Hi.031:l.0310.03
10.3310.3310. j3
10.5310.5310.53
10.E.710.B710.87
11.2411.2411.24
11.4811.481i. ~3
11.7211.7B11.7(.
7.50
B.328.368.38
9.3t9.529.46
9.579.579.579.50
9.839.B39.84
9.919.939.93
10.33le.3510.33
10.5310.571C.53
10.8510.S710.87
11.2411.2511. 31
11.4811.4811 .48
11.8311.8511.85
15.8
14.915.616.0
(16.0)13.314.6
13.313.412.612.3
12.612.913.1
11.412.112.4
11. 712.112.5
11.912.112.2
11.411.511.7
11.211.4· ,11. 7
11.0.10.810.9
10.711.010.6
15.7
14.915.215.3
(16.0)13.113.8
13.313.412.613.0
12.612.913.0
11.912.512.7
12.012.212.5
11.911, 712.2
11.311.611.7
~1.2
11.211.2
11.010.B10.9
10.710.310.8
O.S
15
20
·25
30
35
40
10
10
40
13
14
15
16
17
18
19
20
21
22
23
24
123
123
12.1212.1212.12
11.821\;8211,82
8.238.238.23
7.447.447.44
6.736.736.73
6.e36.08C.08
5.425.425.42
4.904.904.90
9.199.199.19
10.C310.03lC.03
9.359.359.35
4.934.934.93
. 12.1212.1212.12
11.9011.8211.90
8.208.198.13
7.477.467.43
6.716.71
6.C36.036.09
5.415.435.50
4.394.904.83
9.939.939.68
9.309.359.30
4.914.884.89
10.410.610.6
11,511.111.1
14.214.314.5
15.315.715.6
17.41:>.2
19.819.719.5
20.621.222.2
20.822.122.9
11.511.911.8
13.212.712,6
22.121.621.2
10.410.610.6
11.5·11.111.0
14.314.514.9
15.515.916.0
17 .~
17 .7
19.B19.71;.7
21. :;21.120.1
21.222.123.2
12.012.312.3 '
13.512.713. ~
22.422.1,21.9
..........
. :
IiOTES; 1. Con;rol of the sa;;1ple tcmper"ture was lost.
2. This I\a val~e '-Ia; c':,carded as it was 4.7 standard deviations fro;o the estimated KLa based upon all other KLa values ca1cl.:lilted
t.r.ro:;gh t~,e ,"se of Cs
val~es deterr.,ined from j:J:llish£.Q tables and application of Henry's law (referred to in this r~p;)rt as u ca1culati:,J"
C, values) .na 7.0 stan~ar'; deviHicr,s from the esti:c.ated \a b"sed upon all other I\a values ca1cuhted through the use of Cs
v.l.".,s deterT.ied ':Jy • r,e", ~r,,;;r.jca1 procedure de:;cribed l"te" in this report {referred to as "true" Cs vaL.esl.
3. It was notliossible to calcuhte a \a from the data obtained <h.:ring this test rim IS the data did ~t fit a flr5t-order ;;.1ttem .
The raw data tends to indicate' that I zone of stagflation developed 111 the water slClp1e at the DO probe IIleIllbrane.
4. SQi..e probler.. deve10ped with tl'\e instl'\llll8ntc.tiC;1l ~h1eh reslllted in the loss of c:a1ibrUion. Thi$ is apparent frc=l the f.ct that tr.c .
recovery it: DO towards sat~rat1on after an ex~eJ'.ded aeratior. t1el1 was cnly Uout 110 pe"",nt whl1e in all other ten run$ DO ricoverles
of tPi'roxl~Qt~ly 97 foerccnt Wflre atuir.e4 wiU.1n rOllghly the Slll!le t1l1lt period. Values of ~a ulclilated with tile 4ata obu~ne.:1 galle
'results fro.'ll 8 to as man,y as 17 ftan4ard C:tv1lt1ons fl"Olll the upected vallo1e.

N
40
•
35
• Singte Data Point• Two Coincident Data Points
- Line Defined by KLa:: 10.381+0.29T,WhereK~ is in Units per Hourand T is in .C
•••
10 15 20 25 30Temperature (Oe)
Fig.2 Values of KLo Based on Calculated Cs
5
15
14
13
12
II
10 • I , ,o ' ! ! , ,
24. , , , , , , , ·
23
22
21
20
19
18I.~
s:. 17c~ 16

10.0
-........OlE
uI 1.0UJ
u
0.10 2 4 6 8 10 12
Time (min)14 16 18 20
w
Fig. 3 Deviation From Linearity Due to Assumed Value of Cs

14
calculated will be too low if the Cs used in the calculations is abovethe true value for Cs and will be too high if the Cs used in thecalculations is below the true Cs value.
After studying Figure 3, it was decided that the semi-log plotsused to calculate KLa which were not linear may have been caused bythe use of incorrect values of Cs when calculating (Cs - Ct ). Atrial-and-error procedure was applied to each set of curved data plotsto determine if a Cs value could be found which would make the plotof (Cs - Ct ) versus t linear. This proved to be a successfulapproach to the data for, without exception, Cs values were foundwhich could generate linear plots. An example is shown in Figure 4. 1Data from Test Number 2, Run Number 3 is shown using both the calculatedand the true2 value of Cs ' This technique for finding the true valueof Cs is analogous to one suggested by Dobbins (1964, page 60) fordetermining constants in modified versions of the Streeter-Phelps DOsag equation which is used in the analysis of natural stream assimilative capacity.
A tabulation of the true Cs values and respective KLa valuescalculated by means of the above trial-and-error procedure appears inTable 2. A graph of these KLa values versus water temperature, T,appears in Figure 5. A linear relationship between KLa and temperaturewas even more apparent than with the same plot using KLa valuesdetermined through the use of calculated rather than true Cs values.The data produced a correlation coefficient for a straight line of 0.995which demonstrated that the regression explains 99.0 percent of theobserved variance. A least squares analysis yielded the followingequation for this straight line, including 95 percent confidence limitsfor the slope and intercept:
KLa = 10.3878 (~0.1363) + 0.2953 (~0.0075)T (12)
where KLa is expressed in terms of hr-1 and T in °C. A comparisonof the results obtained from the two different methods of determiningKLa appears in Table 3. It can be seen that the straight-line equation
1. Cs values which have been determined from published oxygensaturation concentration tables and the application of Henry's law arereferred to herein as "calculated" Cs values.
2. Cs values which have been determined by means of the trialand-error procedure described above are referred to herein as "true"Cs values.

c..n
2018
o
• • • Data UaLnt True CsCs=8.38mQ/lKLo=f5.3hr-1
<:)--(r--O Data Using Calculated CsCs=8.2Z mg/IKL0=16Dhr-1
Test No.2,RunNo.3T= 15°C .
2 4 6 8 10 12 14 16Time (min)
Fig.4 Plots of (C s- Ct ) Using Calculated and True C. Values
8.0 • iii , , i , , , , , , , i , , , , , •
6.0
4.0
0.4
0.2
2.0
0.10
~
u 1.0I
cf 0.8
0.6
......atE--

0"
4035
• Single Dota Pointe Two Coincident DataFOints@ Three Coincid." Data Points
- Line Defined by KLa =10,388 +0.295T,Where KLo is in Unitsper Hour and Tis inoC
10 15 20 25 30Tempe roture (OC)
Fig.5 Values of KLo Based on True Cs
5
15
/4
13
12
I I
10 ' , , ,o ' I I I ,
24, , , , , • . . .23
22
21
20
19
:::' 18I •~
5. 17c~16

Table 3
Statistical Analysis Summary for Both Methods of Determining KLa
Computational Straight Line Estimate of Intercept 95% Confidence Slope 95% ConfidenceTechni que for Correlation Standard Error (hr-') Interval on (hr-l/oC; Interval onDetenni ni ng Coefficient of Estimate (hr-') Slope
KLa (hr-l ) (hr-l/oC)
KLa fromCalculated Cs 0.989 0.557 10.3812 +0.2000 0.2935 +0.0110
KLa fromTrue Cs 0.995 0.379 10.3878 +0.1363 0.2953 +0.0075
--J
-J

18
describing the variation of KLa with water temperature is essentiallythe same, no matter which method is used for determining KLa butthat, statistically speaking, the method which utilizes the true valueof Cs provides a more precise analysis. This is also apparent froma visual comparison of Figure 2 with Figure 5 as there is less scatterof the data about the line of best fit in Figure 5.
A partial sensitivity analysis was performed to obtain informationabout how critical the assumed value of Cs is in determining KLa.Actual data from 0.5, 20, and 400 C test runs were used to plot (Cs - Ct )on semi-log paper for true Cs ' true Cs + 0.10 , and true Cs - 0.10mg/l. KLa was calculated for each plot. The results appear in Table4. As expected, the KLa determination at higher temperature is moresensitive to the value assumed for Cs . This is due to the greaterrelative effect equal changes in Cs have on (Cs - Ct ) because suchsmall values of Cs are encountered at high water temperatures ascompared to low water temperatures. It is interesting to note that anerror of ~6 percent in the value of KLa can be expected at a watertemperature of 400C if the assumed value of Cs is 0.10 mg/l from the~rUl value. Even at 0.50 C an error of either -4 or +2 percent in KLacan be expected if Cs is either + 0.10 or - 0.10 mg/l, respectively,from the true value.
From Table 2 it can be seen that calculated values of Cs differedfrom the true Cs by as much as + 0.18 to - 0.15 mg/l. A summary ofthe differences appears in Table 5. Approximately 32 percent of thecalculated Cs values were found to be the same as the true Csvalues, 37 percent differed by less than + 0.05 mg/l, 9 percent differedfrom + 0.05 up to + 0.10 mg/l, and 22 percent differed by + 0.10 mg/lor more. The distribution of these differences with respect totemperature appears to be random indicating that the methods used forcalculating Cs were correct but that the test conditions influencedthe Cs values which actually existed. For example, even though Csvalues were calculated for the temperature specified for each test, thewater temperature actuall~ maintained during any experiment could varywithin the range of + 0.1 C according to the tolerances eatablishedfor these investigations. Atoa water temperature of 20.0 C, a variation in temperature of ~ 0.10 C changes the Cs value by 0.02 mg/land at O.OoC the same change in water temperature affects the valueof Cs by 0.04 mg/l. Other assumed "constant" conditions of theexperiments could also have varied slightly. In addition, factors

19
Table 4
Sensitivity Analysis -Effect of KLa of 0.10 mg/1 Change in Cs
T O.SoC T 20°C T 40°CTest No. 13 Test No. 16 Test No. 24Run No. 1 Run No. 2 Run No.2
KLa from 10.4 16.0 22.4True Cs
KLa from 10.0 15.2 21 .0Cs + 0.10Va r; at i on from -0.4 -0.8 -1 .4True KLa%Variation -4 -5 -6from True KLa
KLa from 10.6 16.6 23.7Cs - 0.10Varlation from +0.2 +0.6 +1.3True KLa.%Variation +2 +4 +6from True KLa

20
which were not considered or which were assumed to not have anyeffect on the test results may, in fact, have influenced the data insome unexplained way. The most likely factors involved are the temperature and humidity of the atmosphere in the laboratory which was incontact with the free water surface of the test sample at the top ofthe aeration tank. Although the effects of these factors cannot bepredicted, their influence on the test results can be eliminated inthe data analysis step by the procedure outlined for determining thetrue Cs of the actual test conditions which existed. The number andmagnitude of the differences between calculated and true Cs valuesencountered in this study were great enough to require that the trialand-error procedure presented for identifying the true value of Cs beused if individual KLa values were to be determined in the mostprecise manner. It is important to note, however, that the standard
Table 5
Differences Between Calculated Cs and True Cs
Difference Number Greater Number Less Number Equal(mg/~) than True Cs than True Cs to True Cs
0.000 210.001 - 0.049 8 170.050 - 0.099 6 a0.100 - 0.149 6 6
> 0.150 2 1
approach of calculating Cs from tables and the application of Henry·slaw gave essentially the same result in terms of the relationshipbetween KLa and temperature. The overall conclusions drawn fromthis study, then, are not dependent upon the method utilized to computeCs ' (This further substantiates the interrelated conclusions drawnearlier that variations in the true Cs values encountered were random,these variations were due to unbiased differences between assumed andactual test conditions, and the standard approach to calculating Csis correct.)
IV. Results
A. Effect of Water Temperature Upon Power Requirements
The rotational speed of the experimental aeration vesselimpeller was maintained at 600 rpm in order to ensure consistent andidential mixing conditiol,s throughout all test runs. The torque on the

•
21
impeller shaft was measured during each test run to determine if watertemperature had any effect upon power requirements. The applied torque,a measure of the power input to the aeration vessel, was found to be 8constant 0.308 foot-pounds for all water temperatures tested (0 - 40 C).It was concluded, therefore, that water temperature has no effect uponthe power required to achieve the same degree of mixing in aerationoperations. The power required (3.08 foot-pounds per second) wasapplied to a volume of 0.669 cubic feet, so that the power per unitvolume was 4.61 pounds/(second)(ft2 ). The mean velocity gradient isthe square root of the ratio of the power per unit volume divided bythe absolute viscosity. For the range of water temperatures involvedin this study, the average velocity gradient varied from 351 sec- l atOOC to 581 sec- l at 40°C .
B. Effect of Water Temperature Upon Aeration
The nameplate ratings of asrators are usually referenced toan operating water temperature of 20 C. To find the aeration capac;~y
when the expected operating water temperatures are different from 20 C,it has become standard engineering practice to make corrections byadjusting the overall oxygen mass transfer coefficient, KLa. Thecalculation employed is
KLa(T) = KLa(200C) F (13)
where F is the 20°C reference correction factor which is defined by
F = KLa(T)
KLa(20oC)(14 )
and T is the water temperature in °C. When a temperature, T, isspecified, it has been assumed in the literature that the 20°Creference correction factor, F, is a constant for all aeration configurations. If this assumption is correct, F can be expressed interms of this study's results as
or,
F = 10.3878 + 0.2953 T16.2938
F = 0.6375 + 0.0181 T .
(15)
(16 )
Therefore, the effect of water temperatur'e upon aerati on is gi ven bythe expression
(17 )
22
The 1.81 percent per °c variation in the 200 C reference correctionfactor, F, measured in these experiments agrees reasonably well withvalues found by other investigators. In four sets of experiments,Downing and Truesdale (1955) observed variations of 2.02, 2.38, 1.73,and 2.06 percent per °C. Truesdale ang Vandyke (1958) obtained resultsof 1.8, 1.5,0.8, and 1.8 percent per C. The average of these 8observations is 1.76 percent per °C, a value which differs little fromthe results of this study.
It is more meaningful to reference corrections in KLa to atemperature of DoC because in this way it is possible to show theactual rate of change in KLa with temperature rather than the varia-tion in the 200 C correction factor. The results of this studyreferenced to OOC are expressed as (from equation 12)
= 1 + 0.0284 T (18 )
where KLao is the value of KLa at T = OOC. From Eq. 18 it canbe seen that the actual rate of change in KLa is 2.84 percent per °C.Plots of variations in KLa with water temperature, T, for a crosssection uf correction factors which have been reported inothe literatureare presented in Figure 6. All have been referenced to 0 C. As willbe explained later, .the correction factor has been reported in boththe exponential and linear form. In Figure 6, those correction factorsthat are exponential are denoted by ee and those that are linear aredenoted by et' e being the coefficient which is either raised to theT power or multiplied by T for the exponential and linear forms,respectively. From Figure 6, it appears that the correction factoridentified in this study is approximately the mean of the othercorrection factors which have been reported in the literature, be theyexponential or linear in form.
It can be shown that for the values of e reported and the watertemperatures involved, et ~ ee - 1 , so that values of et and Becan be compared directly.
C. Combined Effect of Elevation and Water Temperature UponAeration
Equation 6 can be used to construct diagrams which show thedependence of aerator capacity upon both elevation and water temperature.A different diagram is required for each operating DO concentration,C , of interest. Only one of these diagrams will be presented herein.The full process of its development will be given as an example of howother such diagrams can be prepared. The operating DO concentration,C , selected for this example was 2.0 mg/l because the use of this

t: I. 4
~ 1.8-
NW
·Key fro. 8 Referen ce1 1.024 WPCFMOP5,19712 1.0192 Bew1ra,et 01., 19703 1.016 Krenkel and Orlob,I962
[
4 0.0214 TnJ8Sdde and Van-dyke 1958
82 5 0,.0396 .Downing and Truesdale,1955
I I I I I I , I 6 , O.Q284,Thrs Study, 1972o 4 8 12 16 20 24 28 32 36 40
Temperature (Ge)
1.0
.-~ - - -. I I T~ T , , 1 . T~~
2.6
2.2
2.4
2.0
0--1
~
O.-J
~ 1.6"
Fig.6 Variation of KLa with Temperature

(19 )
24
value seems to be common practice within the sanitary engineeringprofession. (It is stated in Water Pollution Control Federation MOP 5(1971, page 15) that it is usually necessary to maintain this DO concentration in the aeration tank effluent in order to avoid the development of septic conditions in final settling tanks. In addition,Eckenfelder (1970, page 137) states that this DO concentration shouldbe maintained if nitrification of the wastes being treated is to beachieved.)
The development of a diagram which can be used to determine thedependence of aerator capacity upon both elevation and water temperaturefollows these seven basic steps:
1. Calculate Cs for a wide range of water temperatures ande1evat i on (see Tab1e 6).
2. Calculate (Cs - C) for all the above values of Cs (seeTable 7).
3. Calculate values of KLa for all the water temperatures usingEq. 12 (see Table 8).
4. Multiply the corresponding values of (Cs - e) and KLa(see Table 9).
5. Calculate the value KLa(Cs - C) for water at 200 e locatedat sea level.
6. Calculate values of operating efficiencies relative to thenameplate rating conditions specified in Step 5 for all water temperatuies and elevations by means of the following relationship whichhas been developed from Eq. 6 (see Table 10):
KLa(T) (Cs - C)relative operating eff. ;:: ---'----'---~-----
K a( DC) (c - C)L 20 ssea level
7. Enter all the values of Eq. 19 on a piece of rectilineargraph paper with elevation as ordinate and water temperature asabscissa. Draw isoaeration lines connecting all points of equal relativeaeration efficiencies at desired intervals (see Figure 7).
It can be seen from Figure 7 that an aerator maintaining a constantaeration tank DO of 2.0 mg/l which is located at any combination ofelevation and water temperature represented by the 1.00 isoaerationline will be transferring the same amount of oxygen into the water asthe same aerator could if it was maintaining the same operating DO inthe same aeration tank located at mean sea level and containing waterhaving a temperature of 20 C. Likewise, the same aerator operating inwater with a DO concentration of 2.0 mg/l and located at any combinationof elevation and water temperature represested by the 0.50 isoaerationline can only produce 50 percent of its 20 C, constant 2.0 mg/l DOconcentration, mean sea level output.
Charts for other operating DO concentrations would have the samegeneral configuration as represented in Figure 7 although the isoaeration lines would not be located in idential positions.

Table 6DO at Saturation for Various Elevations and Water Temperatures
Elevation Atmospheric Cs(mg/t) for(ft) Pressure
OoC 5°C 10°C 15°C 20°C 25°C 30°C 35°C 40°C(atm. )
+ 18,000 0.499 7.28 6.35 5.60 4.98 4.48 4.06 3.70 3.35 3.01+ 15,000 0.565 8.24 7. 19 6.33 5.64 5.07 4.60 4.18 3.79 3.40+ 12,000 0.637 9.30 8. 12 7. 15 6.37 5.72 5.19 4.72 4.28 3.84+ 9,000 0.715 10.43 9.12 8.03 7.15 6.43 5.83 5.30 4.81 4.32+ 6,000 0.802 11 .74 10.25 9.04 8.05 7.24 6.56 5.97 5.42 4.85+ 3,000 0.897 13. 11 11 .44 10.08 8.98 8.08 7.32 6.66 6.05 5.42sea level 1.000 14.65 12.79 11 .27 10.03 9.02 8.18 7.44 6.75 6.05- 3,000 1.114 16.33 14.27 12.57 11 . 19 10.06 9.12 8.30 7.53 6.75
N<.T1
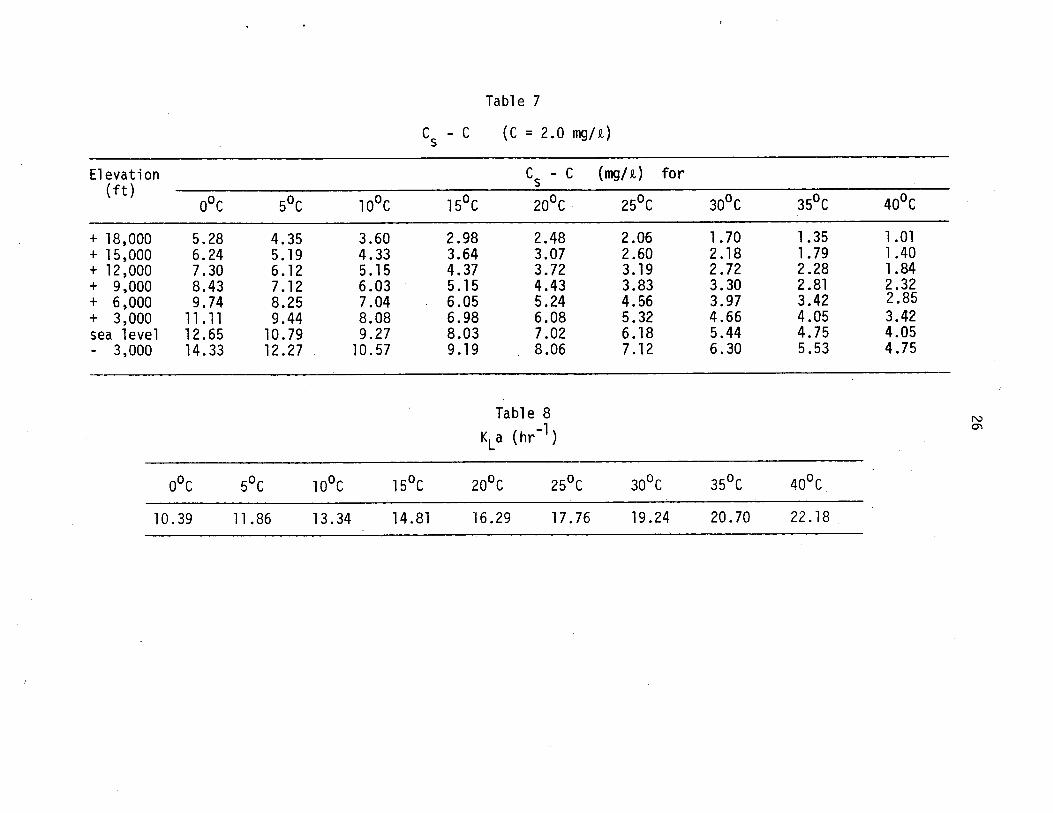
Table 7
C - C (C = 2.0 019/ £)s
Elevation C - C (mg/£) for(ft) s
OOC SoC 10°C 15°C 20°C 25°C 30°C 35°C 40°C
+ 18,000 5.28 4.35 3.60 2.98 2.48 2.06 1.70 1.35 1.01+ 15,000 6.24 5. 19 4.33 3.64 3.07 2.60 2.18 1.79 1.40+12,000 7.30 6.12 S.15 4.37 3.72 3. 19 2.72 2.28 1.84+ 9,000 8.43 7.12 6.03 5.15 4.43 3.83 3.30 2.81 2.32+ 6,000 9.74 8.25 7.04 6.05 5.24 4.56 3.97 3.42 2.85+ 3,000 11 . 11 9.44 8.08 6.98 6.08 5.32 4.66 4.05 3.42sea level 12.65 10.79 9.27 8.03 7.02 6.18 S.44 4.75 4.05- 3,000 14.33 12.27 10.57 9.19 8.06 7.12 6.30 S.53 4.75
Table 8
KLa (hr-l )N0'
oOe
10.39
soc
11 .86
10°C
13.34
15°C
14.81
20°C
·16.29
25°C
17.76
30°C
19.24
3soe
20.70
40°C
22. 18 .

Table 9
KLa (Cs - 2.)
Elevation KLa(Cs - 2.} mg/(£)(hr) for(ft)
OOC 5°C 10°C 15°C 20°C 25°C 300e 35°C 40°C
+ 18,000 54.8 51 .5 48.0 44.2 40.4 36.6 32.7 28.0 22.4+ 15,000 64.8 61 .5 57.8 53.9 50.0 46.2 41.9 37.0 31 .1+ 12,000 75.8 72.5 68.7 64.7 60.6 56.6 52.3 47.2 40.8+ 9,000 87.6 84.4 80.5 76.2 72.2 68.0 63.5 58.2 51 .5+ 6,000 101 .1 97.7 93.9 89.5 85.3 81.0 76.4 70.8 63.2+ 3,000 115.5 111 .8 107.9 103.3 99.0 94.4 89.6 83.8 75.8sea level 131 .4 127.8 123.8 118.9 114.3 109.7 104.7 98.8 89.8- 3,000 149.0 145.3 141 .0 136.0 131.2 126.3 121 .2 114.4 105.2
N........
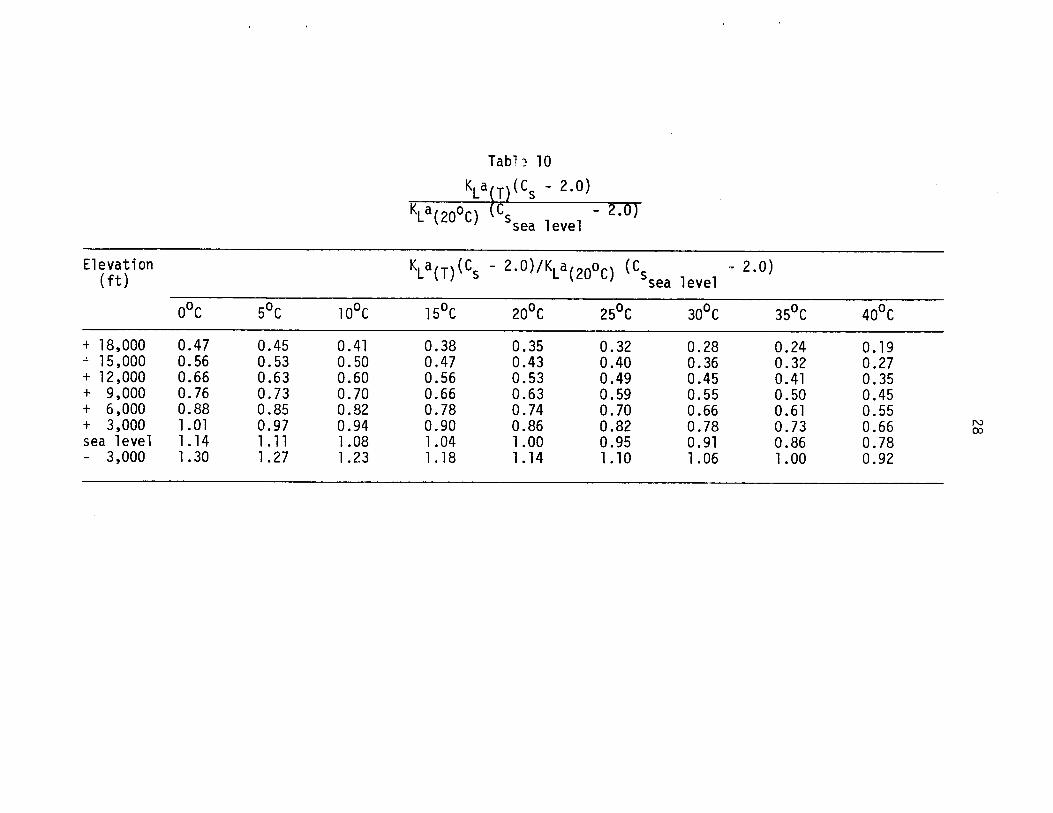
Tab?; 10
KLafT)(CS - 2.0)KLa(20oC)Cs - 2.0)
sea level
Elevation KLa(T)(CS - 2.0)/KLa(20oC) (Cs - 2.0)(ft) sea level
OOC 5°C lODe 15°C 20°C 25°C 30°C 350 e 40°C
+ 18,000 0.47 0.45 0.41 0.38 0.35 0.32 0.28 0.24 o. 19~. 15,000 0.56 0.53 0.50 0.47 0.43 0.40 0.36 0.32 0.27+ 12,000 0.66 0.63 0.60 0.56 0.53 0.49 0.45 0.41 0.35+ 9,000 0.76 0.73 0.70 0.66 0.63 0.59 0.55 0.50 0.45+ 6,000 0.88 0.85 0.82 0.78 0.74 0.70 0.66 0.61 0.55+ 3,000 1.01 0.97 0.94 0.90 0.86 0.82 0.78 0.73 0.66 N
00
sea level 1. 14 1. 11 1.08 1.04 1.00 0.95 0.91 0.86 0.78- 3,000 1.30 1.27 1.23 1. 18 1. 14 1.10 1.06 1.00 0.92

18000
16000
1400°1--~- 12000
•>~ 100000Q)(J) 8000c0Q)
6000~
0-Q) 4000>-0Q)
2000a:::c0.- 0-0>Q)
W -2000~a 4 8 12 16 20 24 28
Water Temperature (OC)
32 36 40
NU)
Fig.7 The Combined Effect of Elevation and Water Temperature Upon Aeration
(Operating 00= 2.0mg/l)
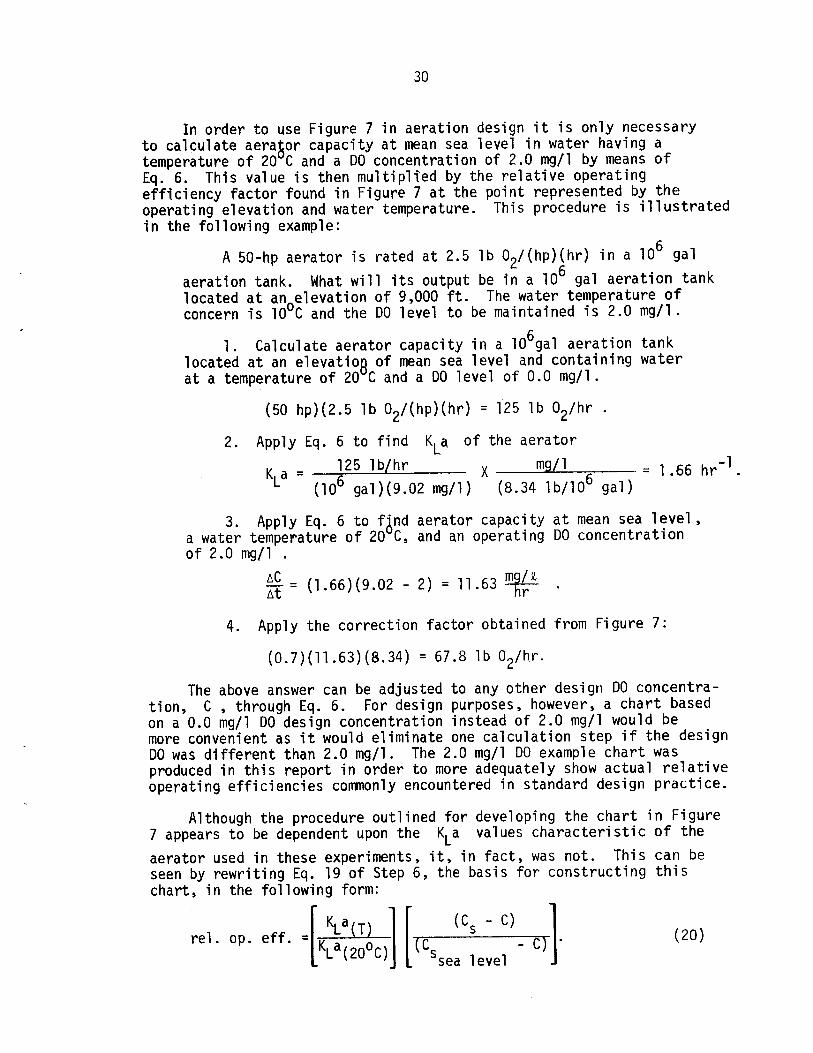
30
In order to use Figure 7 in aeration design it is only necessaryto calculate aeraSor capacity at mean sea level in water having atemperature of 20 C and a DO concentration of 2.0 mg/l by means ofEq. 6. This value is then multiplied by the relative operatingefficiency factor found in Figure 7 at the point represented by theoperating elevation and water temperature. This procedure is illustratedin the following example:
A SO-hp aerator is rated at 2.S lb 02/(hp)(hr) in a 106 galaeration tank. What will its output be in a 106 gal aeration tanklocated at anoe1evation of 9,000 ft. The water temperature ofconcern ;s 10 C and the DO level to be maintained ;s 2.0 mg/l.
1. Calculate aerator capacity ;n a 106ga1 aeration tanklocated at an e1evatioB of mean sea level and containing waterat a temperature of 20 C and a DO level of 0.0 mg/1.
(SO hp)(2.S 1b 02/(hp)(hr) = 125 lb 02/hr .
2. Apply Eq. 6 to find KLa of the aerator
KLa = ~2S lb/hr X mg/l 6 = 1.66 hr-1 .(10 gal)(9.02 mg/l) (8.34lb/10 gal)
3. Apply Eq. 6 to f~nd aerator capacity at mean sea level,a water temperature of 20 C, and an operating DO concentrationof 2.0 mg/1 .
~C _ ()( ) _ mg/i~t - 1.66 9.02 - 2 - 11.63 hr .
4. Apply the correction factor obtained from Figure 7:
(0.7)(11.63)(8.34) = 67.8 1b 02/hr.
The above answer can be adjusted to any other design DO concentration, C, through Eq. 6. For design purposes, however, a chart basedon a 0.0 mg/l DO design concentration instead of 2.0 mg/1 would bemore convenient as it would eliminate one calculation step if the designDO was different than 2.0 mg/l. The 2.0 mg/l DO example chart wasproduced in this report in order to more adequately show actual relativeoperating efficiencies commonly encountered in standard design practice.
Although the procedure outlined for developing the chart in Figure7 appears to be dependent upon the KLa values characteristic of theaerator used in these experiments, it, in fact, was not. This can beseen by rewriting Eq. 19 of Step 6, the basis for constructing thischart, in the following form:
rel. Ope eff. =[KK;a(Tl ] [{C (Cs - C) _Cl]. (20)L (20 C) ssea level

31
The ratio KLa(T)/KLa(200C) , as mentioned earlier, is independent ofthe aerator being considered. So are the terms (Cs - C) and(Cs - C). Figure 7 and any other charts like it which are
sea levelproduced for other operating DO concentrations, therefore, are generalin nature and are applicable for the design or evaluation of anyaeration deVice.
One basic question has been of special interest in this investigation. That question is whether or not the tendency toward decreasedaerator output due to the decreasing Cs and KLa values resultingfrom decreasing atmospheric pressure and water temperature, respectively,which are associated with increasing elevation can be overcome by thetendency toward increased aerator output due to increasing Cs valuesresulting from expected decreases in water temperature with increasingelevation. This question can be answered from the relationships shownin Figure 7. Most of the isoaeration l~nes are very nearly linearwithin the temperature range of 0 to 15 C, a range which includes watertemperatures commonly encountered in domestic wastewater treatmentfacilities located in the mountainous regions of Colorado and, presumably, in many other similar regions of the United States. The slopesof those portions of the isoaeration lines locates in this watertemperature range vary fromoapproximately 140 ftl C for the 1.10isoaeration line to 200 ftl C for the 0.50 isoaeration line. Byvisually matching these values ~ith their respective isoaeration linesin Figure 7 it is seen that a 1 C increase in water temperature isequivalent to an increase in elevation of between 140 and 200 ft as faras aerator performance is concerned, the actual value depending upon theparticular altitude of reference. In order to determine whether thechange in altitude or whether the change in water temperature predominates in influencing aerator performance it isonecessary to findout if the change in elevation associated with ale change in watertemperature in actual wastewater treatment plants falls above or belowthe 140 to 200 ft range. Water temperatures encountered in wastewateraeration units are not solely a function of elevation. Many otherfactors are involved, the most important being detention time andambient air temperature. Two extreme cases are encountered: (1) acompletely housed activated sludge facility and (2) shallow aeratedponds. Intuitively, there are only moderate changes in water temperature with changes in elevation for an enclosed activated sludge plant.There should be little doubt that ~t would require a change in elevationgreater than 200 ft to realize a 1 C change in water temperature. Theremaining critical consideration is whether or not the case on the otherextreme, the shallow aerated pond, would als8 require a change inelevation greater than 200 ft to realize ale change in water temperature. In this case, the water temperature will be strongly influencedby ambient air temperature due to the long detention times involved.According to standard atmospheric tables, for ground elevationsexistiBg in the United States (or in the world for that matter), thereis a 1 C decrease in atmospheric temperature for approximately every

32
500 foot increase in elevation. Even if the change in aeration pondtemperature with elevation was twice that experienced in the atmosphere,it would still mean that a change in elevation greater than 200 ft wouldbe required to experience a 1 C change in the water temperature withinthe aeration pond. Because this is unlikely, it indicates that for alltypes of treatment facilities, ranging from enclosed activated sludgeplants to shallow aeration ponds, those factors associated with
-increasing altitude which tend to reduce aerator output predominateover those factors which tend to enhance aerator output. This sameconclusion can be drawn by examining Figure 7 by itself. There isabsolutely no way to obtain a relative operating efficiency of 1.00at elevations greater than 3,200 ft, no matter what the operatingwater temperature. If the effects of increasing elevation could beovercome by reduced water temperatures, it would be possible to findwater temperatures at any elevation where a relative operating efficiencyof 1.00 or greater could be attained.
It is interesting to derive and examine the mathematical relationship between elevation, water temperature, and efficiency, a specificcase being represented in Figure 7. The saturation DO concentrationsused in this study were calculated from the following empiricalequation (ASCE Committee on Sanitary Engineering Research, 1960, page48)
Cs = 14.652 - 0.41022 T + 7.991 X10⁻³ T2 - 7.7774 X 10⁻⁵ T3
(21)
(24)= EdC/dt(dC/dt)o
where Cs is in mg/i and T is °C. Equation 21 becomes quite inaccurate at water temperatures above 400 C.
From Eq. 6, the value of dC/dt at OOC, zero elevation, and forC = 0 mg/i is
(~~)o = 14.652 KLaO (22)
For an atmospheric pressure P (in atm), Eq. 6 can be writtendCdt = KLa(PCs - C) . (23)
If one divides Eq. 23 by Eq. 22, one obtains
KLa (PCs - C)= (KLaO) 14.652
where E is the relative aeration efficiency. Setting C = 0 mg/iin Eq. 24, gives
PCs14.652 (25)
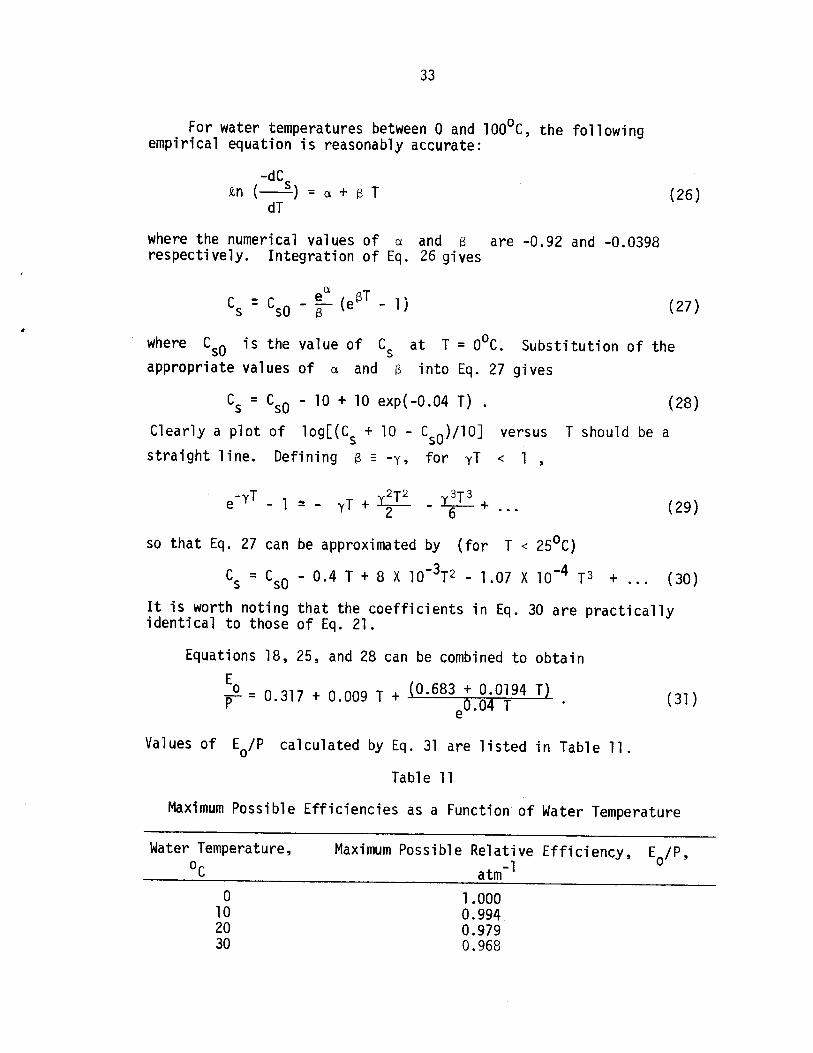
33
For water temperatures between a and 100°C, the followingempirical equation is reasonably accurate:
-dCR.n (__s) = 0. + S T (26)
dT
where the numerical values of ex. and S are -0.92 and -0.0398respectively. Integration of Eq. 26 gives
Cs
= CsO
- f (eST - 1) (27)
where CsO is the value of Cs at T = OOC. Substitution of the
appropriate values of 0. and S into Eq. 27 gives
Cs = CsO - 10 + 10 exp(-0.04 T) . (28)
Clearly a plot of 10g[(Cs + 10 - CsO )/10] versus T should be a
straight line. Defining s:: -y, for yT < 1 ,
y2T2 IT.yT + 2 - 6 + (29)
so that Eq. 27 can be approximated by (for T < 25°C)
Cs = CsO - 0.4 T + 8 X10⁻³T2 - 1.07 X10⁻⁴ T3 + ... (30)
It is worth noting that the coefficients in Eq. 30 are practicallyidentical to those of Eq. 21.
Equations 18, 25, and 28 can be combined to obtain
PEo = 0.317 + 0.009 T + (0.683 + 0.0194 T)
eO.04 T
Values of EolP calculated by Eq. 31 are listed in Table 11.
Table 11
(31 )
Maximum Possible Efficiencies as a Function of Water Temperature
Water Temperature,
°co
102030
Maximum Possible Relative Efficiency, EoIP,atm- l
1.0000.9940.9790.968

34
Table 11 (continued)
Maximum Possible Efficiencies as a Function of Water Temperature
»
Water TemperatureDC
405060708090
100
Maximum Possible Relative 'Efficiency, EoIP,atm-1
0.9720.9911.0251.0721•1281.1941.266
From Table 11, it is clear that Eo/P ~ 1 for the water temperaturerange of 0 to 600 C with a maximum error of only 3.2% (at 3aPC), whichis less than the errob in reported dissolved oxygen saturation concentrations (5% at 30 C).
Equations 24 and 25 can be combined to obtainKLa C
E = Eo - (-KLa-o) -=-=14,.........,.6~5 .
In addition, it is true that
(32)
(33)
Making use of the fact that E ~ P for 0 < T < 60°C , Eq. 32 can beo - -written
(34)
The variation of P with elevation is given by the following equationwhich is derived in Appendix E
P = (1 - 6.87 X 10⁻⁶ A)5.29 (35)
where A is the altitude in feet and P is in atm. Equations 18,34, and 35 can be combined to obtain
E = (1 - 6.87 X 10⁻⁶ A)5.29
- (1 + 0.0284 T)(C/14.65)
Equation 36 is plotted in Figures 8 and 9.
(36)

35
15
Woter Temperature
T = 0 0 C
0 0 3 4 7 9 10 IIDissolved Oxygen Concentration, C, mg/f
Fig. 8 - Effect of Elevation on Relative Aeration Efficiency.
0.1
0.9
1.0 ---......- .......-~--.---....-----,..- ..........---.--..........-...,.....-....-----,..--..-.......- ....
LtJ 0.8
6 0.54:e:. 0.4c»>~ 0.3"i)~
0.2
~g 0.7.~.~::: 0.6w
0.6
1.0 __....,.-~-...,..-~-.,......---,....--,.---r---r--..,......-.,.....---,r---.,.-....,..-....
0.9
w 0.8
~
g 0.7c»'u;;:.....wco 0.5+:ec»<{ 0.4i~ 0.3~
0.2Elevation
0.1 A = 0 feet
0"'----.1-.......- .....- ......._ ...................A.-~ ........----....-.--'------.......- .....- .............o 2 3 4 5 6 7 8 9 10 II 12 13 14 15Dissolved ()::ygen Concentration, C, mg I e
Fig.9 - Effect of Water Temperature on Relative Aeration Efficiency.

36
v. Discussion
A. Arrhenius Equation
The rates of all chemical reactions are influenced bytemperature. The fundamental relationship involved was first set downby Arrhenius. Working from the van't Hoff equation describing thedependence of the chemical equilibrium constant upon temperature heformulated the following equation which is commonly referred to as thevan't Hoff-Arrhenius equation:
d(tn k)dT (37)
waere k is the reaction rate, T is temperature in degrees Kelvin( C + 273), Ea is the activation energy in callmole, and R is theuniversal gas constant, 1.99 cal/(mole)(oK). Arrhenius assumed that theactivation energy, Ea , was independent of temperature. Using thisassumption and solving Eq. 37 by integration yields
(38)
(39)
If Jne defines
Eo B - a + 0 k)l,n = RT )l,n 1
1
then, Eq. 38 can be expressed in the commonly encountered exponentialform of the van't Hoff-Arrhenius equation, i.e., (Andrews, 1970,pages 320-322)
k = B exp(- Ea/RT) . (40)
From Eq. 40 it can be seen that when experimental measurements aremade of the variation in rate constant, k, with temperature, the idealrate theory predicts that a plot of R(R,n k) versus liT shouldproduce a straight line having a slope equal to -Ea. Likewise, asemi-log plot with k on the log ordinate scale and liT on theabscissa should produce a straight line with slope -Ea/2.3R.
It has been suggested by Krenke1 and Orlob (1962, pages 58-59)that it is reasonable to consider the aeration process as an energycontrolled kinetic rate process and, as such, its rate dependence upontemperature should be described by the van't Hoff-Arrhenius equation.They suggest that the activation energy, Ea , should be approximately5 kcal/mole. A semi-log plot of KLa versus liT for the values ofKLa predicted from Eq. 12 is shown in Figure 10. These data plot as

25· , , , , , "
--- Stroitht Line• • Plot of Data
W-.....l
0.0037
Equation 40
2 0.0033 0.0034 0.0035 0.0036lIT (I/°K)
Fig.IO Applicability Test for van'f Hoff-Arrhenius Equation
2019
18
17-T 16~
.s:- 15a..J~ 14
13
12
II
10

(43)
38
a curve indicating that the activation energy, Ea , is not a constantas predicted by the ideal rate theory.
For chemical reactions and some biological processes, it has 3beenfound that the activation energy varies linearly with temperature(Moore, 1962, page 568, and Ward and Jex~ 1969). Activation energieswere calculated over a wide range of temperatures using values of KLapredicted from Eq. 12 in. order to find out if this relationship couldbe used to define the variation in activation energy, Ea , observedin these studies. This was done by starting with Eq. 37 and proceedingto the finite difference form assuming that fa is constant over thetemperature range being considered
d(1n KLa) =~ =6.1 n( KLa)
dT RT2 6T
For R equal to 1.99 cal/(mo1e)(oK), Eq. 43 can be expressed in theform
(44)
where Ea is expressed in cal/mole and T in oK. Results obtainedfro~ Eq. 44 are shown in Table 12. No linear or exponential relationship between temperature and either Ea or changes in Ea could beidentified from plots on either rectangular, semi-log, or log-log graphpaper. This indicates that the van1t Hoff-Arrhenius equation may bevalid for any particular temperature, but it cannot be readily used forpredicting the dependence of KLa values upon water temperature.
B. Linear Versus Exponential Variation in KLa
The effect of water temperature upon KLa is commonlyexpressed in the following form:
_ (T-20)KLa(T) - KLa(200C) 6e (45)
where T is expressed in °c and 6e is the dimensionless temperaturecoefficient. Equation 45 states that KLa changes in a constantly
3. For ordinary chemical reactions in liquid and solid systemsnear atmospheric pressure (Moore, 1962, page 568),
Ea = Eao + RT = (Eao + 544) + (1.99) (oC) (41)
owhere Eao is the value of Ea at 0 K. The rate of change in Ea is
(42)

39
Table 12
Activation Energies
T Ea ~Ea ~Ea/OC
(oC) (cal/mo1e) (cal/mo1e) [ca1/(mo1e)(oC)]
0.0 42212.5 393 78.65.0 38287.5 298 59.6
10.0 353012.5 240 48.015.0 329017.5 192 38.420.0 309822.5 157 31 .425.0 294127.5 133 26.630.0 280832.5 120 24.035 268837.5 91 18.240.0 2597
45.0 156 15.650.0 244155.0 123 12.360.0 231865.0 97 9.770.0 222175.0 69 6.980.0 215285.0 56 5.690.0 209695.0 49 4.9
100.0 2047
proportional (geometric) manner with respect to water temperature. Someinvestigators, however, have reported that KLa varies linearly(arithmetically) with temperature (ASCE Committee on Sanitary EngineeringResearch, 1961, pages 62-63). The linear expression takes the form ofEq . 17, i. e. ,
(46)
where C is a dimensionless constant which is the OOC intercept of theKLa(T)/KLa(200 C) versus T line, 81 is the temperature coefficienthaving units of °C-1 , anu T is water temperature in °c .

40
As pointed out by Fair, Geyer, and Okun (1968, page 28-45), theexponential form of the temperature correction relationship (Eq. 45)is limited in its applicability because 8e is not a constant butvaries with temperature. Use of either the exponential or linearrelationship, however, gives results which are not significantly
. different over a moderate temperature range (Hull and Carbaugh, 1959).Calculations made from values of 8e and 81 reported in theli8erature indicate that this temperature range is approximately 10 to25 C (see Figure 11). It is significant that a review of the literaturerevealed that most studies which have been designed to date forstudying the dependence of aeration upon water temperature have typicallybeen carried out in systems where the water temperature was varied overthe same range, + 5°C in either direction. Therefore, there seems tobe no real basis-available for identifying the variation in KLa iflarge temperature corrections are t8 be made,i .e., if the expectedtemperature is more than about + 10 C from 200 C, the standard referencetemperature used in aeration calculations.
Field studies carried out under this project revealed that manywastewater treatment facilities located in the mountainous regionsoofColorado aerate wastewaters having temperatures which are below 10 Cduring several months of the year. A few plan~s were found to beaerating wastewaters with temperatures below 1 C over the same period.Design of aerators for use in these extreme water temperatures has hadto be based upon extrapolations of the moderate-temperature aerationdata mentioned above. Standard practice has been to use the exponentialrelationship given in Eq. 45 for making these extrapolations (WPCF MOP5,1971, page 19, and Eckenfelder, 1970, page 136). However, Hull andCarbaugh (1959) state: "For large temperature changes, it appears thatthe available evidence favors the use of the linear relationship. II
The results of the study reported herein support Hull and Carbaugh'sconclusion. It has been shown that a linear relationship exists betweenKLa and water temperature over the entire range of 0 to 400 C, a rangealmost twice as great as any tested to date. Besides testing the moregeneral case by including a much greater temperature range, this studyincluded a large number of data points, 68 to be exact, which produceda correlation coefficient for a straight line relationship of 0.995.From Table 3, it can be seen that the deviation of the data from theline of best fit was small [1 standard deviation equalled 2.3 percentof the best estimate of KLa{20oC)]. In short, there seems to be littlereason to question the conclusion that the relationship between KLaand water temperature is linear.
VI • SUITllla ry
A laboratory-scale mechanical aeration system which simulated nearperfect mixing conditions was used to study the ·variation in oxygen masstransfer rates into water with respe6t to changes in water temperature.A water temperature range of a to 40 C was tested. It was found thatthe variation of KLa for aeration systems varies linearly withtemperature and that this variation can be predicted from the expression

~-.0
T""'ond Van dyke,1958,-ingand Truesdale,
This Study, 1972
1.015
tul <D~IN In I
1-1
10%~klt'in KLo
Key No. 8 ~8Aoe
[
I 1.024 WPCF MOP 5, 19718. 2 1.0t92 Bewtra,.t 01.,1970
3 1.016 f(renkelandOrlob,t962
81 [ 4
IIIIIII
01
o I(1)1H ,
~I
IIIII
10% "oriotionIn KLO
1.70 • •• , • • , , • • • • • •
1.60
1.50
1.40
1.30
1.20
1.10
l.oo0.90
<l80
0.70
0.60
0.50 ' " , , , . . . . . , ,o 4 8 12 16 20 24 28 32 36 40
Temperature (OC)
Fig.ll Correction Foetors for ~a from the Literature, 20°C Reference
-~
0..J~
Ii2
0-
~"-..
(47)
42
KLa(T) = KLa(20oC) (0.6375 + 0.0181 T)
where T is the water temperature in °C.
The above equation can be used in conjunction with Eqs. 35 and 28to construct diagrams which show the combined effects that elevationand water temperature have upon aeration. Such diagrams show thatthose factors associated with increasing elevation which tend to reduceaerator output predominate over those factors which tend to enhanceaerator output.
43
References Cited
Andrews, D. H. 1970. Introductory Physical Chemistry.Book Co., New York. (pages 319-329)
McGraw-Hill
ASCE COl1l11ittee on Sanitary Engineering Research. 1960. "S0 1ubilityof Atmospheric Oxygen in Water. 1I Jour. Sanitary EngineeringDivision, Proceedings of ASCE SA4: 41-53. (page 48)
ASCE Committee on Sanitary Engineering Research. 1961. "Effect ofWater Temperature on Stream Reaeration." Jour. SanitaryEngineering Division, Proceedings of ASCE SA6: 59-71. (pages 62-63)
Bates, R. L., P. L. Fondy, and J. G. Fenic. 1966. "Impe11erCharacteristics and Power. 1t Chapter 3 of Mixing Theory andPractice, Vol. I, edited by V. W. Uh1 and J. B. Gray, AcademicPress, New York. (pages 111-178)
Bewtra, J. K., W. R. Nicholas, and L. B. Po1kowski. 1970. "Effect ofTemperature on Oxygen Transfer in Water." Water Research i: 115123. (page 122)
Dobbins, W. E. 1964. IIBOO and Oxygen Relationships in Streams. II Jour.Sanitary Engineering Division, Proceedings of ASCE SA3: 53-78.(page 60)
Downing, A. L., and G. A. Truesdale. 1955. "Some Factors Affectingthe Rate of Solution of Oxygen in Water." Jour. of AppliedChemistry i: 570-581. (Cited by ASCE Committee on SanitaryEngineering Research, 1961, page 62)
Eckenfelder, W. W., Jr. 1966. Industrial Water Pollution Control.McGraw-Hill Book Company, New York. (page 52)
Eckenfelder, W.Engineers.
Fair, G. M., J. C. Geyer, and D. A. Okun. 1968. Water and WastewaterEn ineerin , Vol. 2 - Water Purification and Wastewater Treatmentand Oisposa. John Wiley and Sons, Inc., New York. pages 23-5,23-10, and 28-45)
Holland, F. A., and F. S. Chapman. 1966. Liguid Mixing in StirredTanks. Reinhold Publishing Corp., New York. (pages 1-18)
Hull, C. H., and H. C. Carbaugh. 1959. Report No. VI, Low-FlowAugmentation Project, Department of Sanitary Engineering and WaterResources, The Johns Hopkins University, Baltimore, Maryland.(Cited by ASCE Committee on Sanitary Engineering Research, 1961,page 63)

44
Kalinske, A. A. 1969. "Field Testing of Aerators in Waste TreatmentPlants." Paper presented at the ASME-AIChE Joint Conference onStream Pollution and Abatement, New Brunswick, N. J., June 10-12,1969. (page 2)
Krenke1, P. A., and G. T. Orlob. 1962. "Turbu1ent Diffusion and theReaeration Coefficient. 1I Jour. Sanitary Engineering Division,Proceedings of ASCE SA2: 53-83. (pages 58-59 and 61-62)
Landberg, G. G., B. P. Graulich, and W. H. Kipp1e. 1969. IIExperimenta1Problems Associ ated wi th the Test; ng of Surface Aerati on Equi pment. II
Water Research 3: 445-455. (pages 447-448)
Lewis, W. K., and W. G. Whitman. 1924. "Princip1es of Gas Absorption. IIIndustrial and Engineering Chemistry~: 1215-1220. (pages 12151220)
Moore, W.J. 1962. Physical Chemistry. Prentice-Hall, Inc., EnglewoodCliffs, New Jersey. (page 568)
John
Standard Methods for the Examination of Water and Wastewater. 1971.American Public Health Association, New York. (page 480)
Ste~"bacek, Z., and P. Tausk. 1965. Mixinr in the Chemical Industry.Pergamon Press, New York. (pages 73- 24)
Truesdale, G. A., and K. G. Vandyke. 1958. liThe Effect of Temperatureon the Aeration of Flowing Water. II Water and Waste TreatmentJournal 7: 9-11. (Cited by ASCE Committee on Sanitary EngineeringResearch~ 1961, pages 62-63)
Ward, J. C., and E. M. Jex. 1969. IICharacteristics of AqueousSolutions of Cattle Manure. 1I A paper presented at the CornellUniversity Agricultural Animal Waste Conference, Syracuse, New York,January 13-15, 1969. (pages 310-326)
Water Pollution Control Federation. 1971. Aeration in WastewaterTreatment, WPCF Manual of Practice No.5. Water Pollution ControlFederation, Washington, D.C. (pages 15 and 19)
Weast, Robert C. (Ed). 1970. Handbook of Chemistry and PhfSiCS.Chemical Rubber Company, Cleveland, Ohio. (page D-143
The

45
Appendix A
CALIBRATION OF DISSOLVED OXYGEN METER AND STRIP CHART RECORDER
1. Set the dissolved oxygen meter control to "Red Line" and adjust themeter reading to the red mark.
2. Set the dissolved oxygen meter control to "Zero" and adjust the meterreading to 0.0 ppm.
3. Adjust the dissolved oxygen meter reading to the calculatedsaturated dissolved oxygen value for pure water at the sampletemperature and measured barometric pressure (see Appendix B forcalculating the saturated dissolved oxygen value).
4. Repeat Steps 1 through 3 until no further adjustment is necessary.
5. Set the dissolved oxygen meter control to "Zero" and adjust thezero setting on the strip chart recorder.
6. Set the dissolved oxygen meter control to an appropriate readingscale and adjust the strip chart recorder to record the calculateddissolved oxygen saturation value.
7. Repeat Steps 5 and 6 until no further adjustments need to be madeon the strip chart recorder.

46
Appendix B
SATURATION DISSOLVED OXYGEN CONCENTRATIONS IN WATER
Standard Methods (Standard Methods for the Examination of Water andWastewater~ 1971. American Public Health Association, New York, page480) recommends that the saturated dissolved oxygen concentration forwater at a given barometric pressure be calculated according to thefollowing formula:
(48)
where Cs is the saturation DO concentration (mg/t) in water at thestated barometric pressure, P, which is expressed in atmospheres.C1 is the saturation DO concentration (mg/t) in water at a barometricpressure of 1 atmosphere (mean sea level) and p is the vapor pressureof water in atmospheres at the temperature of the water being considered.Values of C1 can be obtained from the following table (ASCE Committeeon Sani tary Engi neeri n9 Research. 1960. IIS0 1ubi 1i ty of Atmospheri cOxygen ;n Water. II Jour. Sanitary Engineering Division, Proceedings ofASCE SA4: 41-53, page 48) which is based on Eq. 21:
Table 13
Saturation Dissolved Oxygen Concentrations Used
Water Temperature, Cl Water Temperature, ClT, (oC) (mg/l) T, (oC) (mg/l)
0.0 14.65 8.0 11 .840.5 14.45 9.0 11 .551.0 14.25 10.0 11 .272.0 13.86 15.0 10.033.0 13.49 20.0 9.024.0 13.13 25.0 8.185.0 12.79 30.0 7.446.0 12.46 35.0 6.757.0 12. 14 40.0 6.05
Values of p can be obtained from Table 14 (Weast, Robert C. 1970.Handbook of Chemistry and Physics. The Chemical Rubber Co., Cleveland,Ohio, page 0-143):

47
Table 14
Water Vapor Pressures Used
Water Te~perature,
(rTIll of Hg)Water Temserature,
(mm of Hg)T, ( C) T, ( C)
0.0 4.58 8.0 8.040.5 4.75 9.0 8.611.0 4.93 10.0 9.202.0 5.29 15.0 12.793.0 5.69 20.0 17.544.0 6.10 25.0 23.765.0 6.54 30.0 31 .82
.6.0 7.01 35.0 42.187.0 7.51 40.0 55.32
If one is willing to accept an error of 100(1-x)%, then
~ = xP or p = P(l-x)l-p 1-xP
For example, for an acceptable error of 1%,_ O.OlP
P - 1-0.99P
(49)
(50)
Using Eq. 50, one can determine water temperatures (as a function ofelevation) below which Eq. 48 may be ignored with an error of only1%. These values are listed in Table 15.
Table 15
Maximum Water Temperatures for an Error of 1%
Elevation, feeto
1,0002,0003,0004,0005,0006,0007,0008,0009,000
10,00011,00012,00013,0014,00015,000
Maximum Water Temperature for whichEq. 48 can be Ignores with an Error
of 1%, F
212150125111999084787470666360575553

48
Appendix C
ADJUSTMENT OF AIR FLOW
1. With the air flow set at approximately 1 SCFH, determine airpressure above existing atmospheric pressure at the discharge portof the flowmeter, PA , by means of the water manometer connectedto the air line at that point. Convert to pounds per square inch(psi) by means of the following formula:
P =. 0.036 psi X (inches of water)A In. of water . (51 )
2. Determine the existing barometric pressure, PB , by means of amercury barometer. Convert to psi by means of the followingformula
p = 0.0195 psi X (mm of Hg) .B mm of Hg (52)
3. Determine the absolute pressure of the air at the discharge portof the flowmeter, PO' by means of the following formula:
(53)
4. Determine the difference between the absolute pressure of the airat the discharge port of the flowmeter, PO' and standardatmospheric pressure by means of the following formula:
~P = Po - 14.70 psi . (54)
5. Correct the flowmeter reading for the air pressure at the flowmeterdischarge port using ~p from Step 4 and the following equation(valid only for ~P between 0 and -4 psi):
Actual Flow = (1.00 - 0.0375 ~P)(Observed FlowmeterReading) (55)
6. Determine the flowmeter reading under standard conditions for 1SCFH from the flowmeter calibration curve.
7. Adjust the air flow until the flow calculated in Step 5 equals theflowmeter reading determined in Step 6.
49
Appendix 0
DETERMINATION OF SODIUM SULFITE AND COBALT CHLORIDE DOSAGE
Experiments with actual test runs have shown that the use of 20mg/l sodium sulfite (Na2S03) per mg/l of DO contained in the agitatedsample provides good dissolved oxygen annihilation and a short time lagbefore reaeration begins. Colbalt chloride (CoC1 3) was added as acatalyst at a ratio of 1 part CoC1 3 to 50 parts of Na 2S03 by weight.
Prepare a Na2S03 solution with a concentration of 100g Na2S03 perliter in distilled water. Also prepare a CoC1 3 solution of 20g CoC1 3per liter in distilled water. The amounts of these solutions to beadded to a sample under test can be calculated by means of the followingformulas:
ml Na2S03 solution = 0.2 (sample DO)(sample volume) (56)
ml CoC1 3 solution = 0.1 (ml Na2S03 solution used) (57)
where sampl e DO is in mg/l and sampl e vol ume is in 1i ters.-

50
Appendix E
DERIVATION OF AN EQUATION FOR PREDICTING ATMOSPHERIC PRESSUREAS A FUNCTION OF ELEVATION AND AIR TEMPERATURE
p + dp
p
(P = 1 atm) sea level
z + dz
z
z = 0
Figure 12 - Definition Sketch of Model Atmosphere
Letp = atmospheric pressure, dynes/cm2
z = elevation, cm9 = acceleration due to gravity, 981 cm/sec2
p = density of air at elevation z , g/cm 3 •
Then, for a horizontal slice of atmosphere which is dz thick,
dp + pg dz = 0 (58)
and
p(z + dz) = p(z) + dp .
From the ideal gas law,
pV = NRT
(59)
(60)
where V is volume in cm 3 , N is moles of gas, R is the universalgas constant, 8.31 8197 (dyne)(cm)/(mole)(oK), and T is the absoluteair temperature in K( C + 273.1). By definition
p = M~ (61)
where M is the molecular weight of air (29 g/mole). SubstitutingEq. 61 into Eq. 60 gives
p =~ RT • (62)
From Eq. 58,
dp = -pg dz .
Dividing Eq. 58 by Eq. 62 gives
(63)

~ gM dzP ;:; - RT
51
(64)
Ordi nari ly,
T ~ T - (6T) z (65)Z 0 /).z
where /).T/AZ is 6.48 X lO-50K/cm, Tz is the air temperature atelevation z in oK, and To is the corresponding air temperature atmean sea level in oK (for the U.S. standard atmosphere T ;:; 15 + 273 =288 oK). Substituting Eq. 65 into Eq. 64 and integratingObetween theappropriate limits gives
JP ~P;:; - ~R fZ T - (~~/~Z)Zp 0 0o
which yields
or,
(66)
(67)
(68)
Substituting the numerical values of the constants into the exponentof Eqs. 67 and 68 gives
gM ;:; _~(_98_1..L...:) (!-29)t.--_____=__ - 5 29R(/).T/6Z) (8.31 X 10⁷)(6.48 X 10⁻⁵) -. .
For the altitude A in feet,
A ;:; z/30.5 or z;:; 30.5 A . (69)
Substituting Eq. 69 into Eq. 67 along with the values previously givenfor the remaining constants and changing the units of p and Po toatm, one obtains Eq. 35 which gives the correct value of P (in atm)for the U.S. standard atmosphere.
A more precise estimate of barometric pressure can be made withEq. 68 because it takes into account the actual absolute air temperatureTz . Again, substituting Eq. 69 into Eq. 68 along with the values ofthe constants already given, and converting p and p to atm, oneobtains 0
-3P ;:; [1 + 1.98 X 10 AJ-5.29
TA(70)

52
where TA ;s the air temperature in oK at altitude A, where A isin feet.

53
PART 2 - BOD AND COD REMOVAL FROM WASTEWATER BY AERATIONWITH AIR AND OXYGEN
by
John C. Ward and R. P. Johansen
The primary purpose of this study was to determine if the higherDO (dissolved oxygen) concentrations obtainable by using pure oxygen(02) for aeration would increase the removal rate of BOD (biochemicaloxygen demand) and COD (chemical oxygen demand) in settled, municipalwastewater. All experimentation was carried out at an elevation of5,226 feet above sea level where the annual average atmosphericpressure is 0.833 atm (atmospheres). All experimental work was doneatoroomtemperature, and the wastewater temperature was approximately20 C (degrees centigrade). At this temperature and elevation, thesaturation DO concentration is about (9 X 0.833 = ) 7.5 mg/~ (milligramsper liter) when air is used for aeration, and about (7.5 X 100/20.9 =)35.8 mg/1 when oxygen is used for aeration.
REASON FOR THE AERATION STUDY
From Figure 1, it is clear 8hat the annual average air temperaturedecreases at a rate of about 3.6 F (degrees Fahrenheit) per 1 ,000 feetincrease in elevation or per 300 miles toward true north. For example,the following are the approximate latitude equivalents of the corresponding elevations:
Elevation, feet
5,0006,0007,0008,0009,000
10,00011,00012,00013,000
Latitude equivalent
Fort Collins, ColoradoNorthern Wyoming BorderCanadian BorderEdmonton, Alberta, CanadaNorthern Saskatchewan, CanadaAnchorage, AlaskaArtie CirclePo~nt Barrow, Alaska75 North Latitude
When BOD is removed from wastewater by aeration, the rate ofremoval is considerably less at lower wastewater temperatures. Inaddition, while the saturation DO concentration is higher at lowtemperatures, it decreases with elevation in a manner directly proportional to atmospheric pressure. For example, for a wastewater at atemperature that is the same as the air temperature for a given elevation, the saturation DO concentrations would tend to be as follows:

Average annuo I atmospheric pressure, atmospheres
0.52 0.56 0.60 0.64 0.68 0.72 0.76 0.80 0.84 0.88 0.92 0.96
U'1~
vegetation isperiods of drought,
year.
Annual precipitation is greater than PlainsZone precipitation. Yellow pine, shrub
ak (on south facing slopes), Douglas_Er-io.!!-nort~~aci~slopes).__
eaviestsnowfallhere(roughly200inches per year) .-Slow- -!.uH±Y. of !!2isture-!rouAbl....L 20 inc:~8.JeLyBr~Uu..DQ.ffi.._
Annual precipitation is more than double that of thePlains Zone. Short season from spring melt to fall
freeze.
trees. Much of the water from summer rainsand winter snows may drain away quickly or be locked in ice crystals .
Low temperature accompanied by strong winds.
An increase in elevation of 1,000 feet isequivalent to a 300 mile movement North ora drop in air temperature of 3.6°F.
Roughly 15 inches per year of precipitation.restricted to plants that are tolerant to longsuch as Pinyon, Cedar. One inch or less runoff--------------------
3,000 rLOWER SONORAN ZONE
2,000
1,000
0' , , , , , , , , ' , I , , , , , I , , , , I , '?n,.
20 24 28 32 36 40 44 48 52 56 60 64 68
8,000
7,000
6,000
5,000
4,000
9,000
11000, 'SUB-ALPINE ZONE10,000 L... _1.D!!..t!.!!L!~ in~re8 "-.a
13.000
12,000
I 5,000Iii f f i , , , ii' , • .. ... .. .. .. i , , , , , ,
14,000
c::2e
c:
rn
o4»CIt
•>CD
c:o
CD">
)
.Q
C
....•CD~
-c>Q)
w
Average annual air temperature, OF
Figure 1. ELEVATION CLASSI.FICATION FOR COLORADO

Elevation, feet
o1,0002,0003,0004,0005,0006,0007,000
55
Saturation DO concentration correspondingto wastewater temperature equal to meanannual air temperature, mg/~*
10.0. 10. 1
10.210.410.410.710.811 .0
*Air te~peratures used were those of the u.S. standard atmosphere whichare 10 F1ess than those shown in Figure 1.
EXPERIMENTAL PROCEDURE
The wastewater used was the effluent from the primary settlingbasin of the Fort Collins, Colorado, wastewater treatment plant. Eachsample was divided in half volumetrically and each half was placed intoa battery jar. One jar was aerated with air and the other was aeratedwith industrial grade pure oxygen gas.
EXPERIMENTAL CONDITIONS
The experimental conditions for each of 6 separate tests aregiven in Table 1. Detailed conditions for each test follow.
Table 1
Experimental Conditions
Test Initial Evaporation Gas flow rate, DO I TotalNumber volume rate, 1; ters 1i ters per concentration volume
in each per day hour mg/~ lossbattery due
jar, toliters sampling,
1i tersAir Oxygen Air Oxygen Air Oxygen COD BOD
(1 ) (2) (3) (4) (5) (6) (7) (8) (9) (10)1 6.325 0.290 0.290 80 80 6.6 29 0.052 8.045 0.445 0.310 80 80 7.0 30 0.033 7.630 0.170 0.170 80 50 6.9 32 0.054 9.050 0.360 0.430 15 15 7.0 29 0.7855 8.800 0.240 0.240 4 4 5.2 22 0.116 9.230 0.300 0.290 4 4 3.4 19 0.03

56
In tests 1 and 2, aeration was by means of one inch diameterspherical stone diffusers placed at the bottom center of each batteryjar. The samples from run 2 were all filtered before the CODdeterminations. This filtering removed up to 80% of the sample COD,so the data for this test is considered unrepresentative.
In test 3, a circumferential diffusor of plastic tubing perforatedwith small holes was used. This prevented a floc buildup on the jarwalls observed in tests 1 and 2. In tests 1, 2, and 3, the COD wasdetermined colorimetrically using a Hach colorimeter.
The same circumferential diffusob was used again for test 4. TheBOD values are the ultimate BOD at 20 C. Sample volumes for this testwere 0.157 liters each, and the BOD concentration was determinedmanometrically.
For tests 5 and 6, the stone diffusors used in tests 1 and 2were placed at the bottom edge of the circular jars and stirring wasaccomplished by mechanical means. The COD determinations for tests 5and 6 were done potentiometrically using an oxidation-reduction probeand a recording automatic titrator. In test 6, the wastewater in thejars was permitted to settle about 30 minutes before the samples weretaken from the supernatant.
EXPERIMENTAL RESULTS
The experimental results are given in Table 2. Sample volumesfor the COD determination were 0.01 liters each. The evaporation ratesgiven in Table 1 include the volume loss due to sampling except fortest 4. The total volume loss due to sampling was less than 1% ofthe original volume for every test with the exception of tests 4 and5 where it was 9 and 1% respectively.
In test 5 (observation numbers 36 and 37), distilled water wasadded to bring the volume back to the original volume before sampling.In test 6, distilled water was added to bring the volume back to theoriginal volume after taking the sample.
ANALYSIS OF EXPERIMENTAL RESULTS
Table 3 shows the mass (in mg) of oxygen demand remalnlng as afunction of time. These values were obtained by multiplying the mg/£of oxygen demand by the corresponding volume in liters. The oxygendemand remaining is expressed as a fraction of the original mass ofoxygen demand in columns 8 and 9 of Table 3.
Using the data in columns 2, 8, and 9 of Table 3, the timerequired for removal of 1/2 of the initial oxygen demand (tl / 2) indays was determined for each of the 6 tests, and these values arelisted· in Table 4.

57Table 2 - EXPERIMENTAL RESULTS
Time, Oxygen Volume Before ObservationTest Days Demand, Taking Sample, Number
mg/R. 1i ters
Air Oxygen Air Oxygen(1) (2) (3) (4) (5) (6 ) (7)
1 0 250 250 6.325 6.325 11 0.94 220 100 6.052 6.052 21 1.87 100 75 5.783 5.783 31 2.94 175 120 5.473 5.473 41 3.87 60 90 5.203 5.203 51 4.00 75 75 5.165 5.165 61 5.00 50 25 4.875 4.875 7
2 0 100 80 8.045 8.045 82 0.17 35 25 7.969 7.992 92 1.17 30 30 7.524 7.682 102 2.17 30 25 7.080 7.371 112 4.0 30 30 6.265 6.805 12
3 0 180 170 7.630 7.630 133 0.82 120 100 7.491 7.491 143 2.0 55 25 7.290 7.290 153 3.86 25 . 35 6.974 6.974 163 4.93 30 25 6.794 6.794 173 5.94 20 20 6.621 6.621 183 12.2 20 20 5.550 5.550 19
4 0 215 170 9.050 9.050 204 0.98 84 94 8.540 8.472 214 1.95 42 52 8.033 7.897 224 2.99 0 10 7.502 7.292 234 4.03 0 6 6.972 6.690 24
5 0 283 259 8.800 8.800 255 0.35 358 362 8.716 8.716 265 1.04 269 260 8.550 8.550 275 2.06 232 220 8.305 8.305 285 3.33 246 237 8.000 8.000 295 3.92 230 222 7.858 7.858 305 4.02 201 176 7.835 7.835 315 4.83 282 249 7.640 7.640 325 5.81 193 202 7.406 7.406 335 6.85 169 200 7.158 7.158 345 17.85 307 295 4.510 4.510 355 38 127 133 8.800 8.800 365 44 26 29 8.800 8.800 37
6 0 322 329 9.190 9.230 386 0.95 275 282, 8.905 8.955 396 1.88 183 182 8.911 8.960 406 7.08 222 233 7.630 7.720 416 9.08 187 191 -. 8.590 8.650 42 .

58Table 3 - ANALYSIS OF EXPERIMENTAL RESULTS
Time. Oxygen Oxygen tTest Days Demand Dema[ld t 1/ 2Remaining. Remai ni ng. _
. mg Fraction ofOrigi na1
Air Oxygen Air Oxygen(l) (2) (3x5) - (4x6) (8) (9) (10)
1 0 1582 1582 1.000 1.000 01 0.94 1330 605 0.840 0.382 0.4671 1.87 578 434 0.365 0.274 0.9311 2.94 957 657 0.605 0.415 1.4621 3.87 312 468 0.197 0.295 1.9231 4.00 388 388 0.245 0.245 1.9901 5.00 244 122 0.154 0.077 2.49
2 0 805 644 1.000 1.000 02 0.17 279 200 0.347 0.311 0.1592 1.17 225 231 0.280 0.359 1.0932 2.17 213 184 0.265 0.286 2.032 4.0 188 204 -0.233 0.317 3.74
3 0 1373 1296 1.000 1.000 03 0.82 900 749 0.656 0.577 0.3773 2.0 401 182 0.292 0.140 0.9213 3.86 174 244 0.127 0.180 1.7783 4.93 204 170 0.148 0.131 2.273 5.94 132 132 0.096 0.102 2.743 12.2 111 111 0.088 0.086 5.62
4 0 1950 1540 1.000 1.000 04 0.98 717 795 0.368 0.516 0.984 1.95 338 411 0.173 0.267 1.954 2.99 ' 0 73 0.000 0.047 2.994 4.03 0 40 0.000 0.026 4.03
5 0 2490 2280 1.000 1.000 05 0.35 3120 3160 1.252 1.386 0.0165 1.04 2300 2220 0.924 0.974 0.0495 2.06 1928 1828 0.774 0.802 0.0975 3.33 1970 1898 0.792 0.832 0.1565 3.92 1810 1745 0.727 0.765 0.1845 4.02 1573 1378 0.632 0.604 0.1895 4.83 2150 1903 0.864 0.835 0.2265 5.81 1430 -1497 0.575 0.606 0.2725 6.85 1210 1430 0.486 0.627 0.3215 17.85 1383 1330 0.556 0.583 0.8395 38 1118 1170 0.449 0.513 1.783
.;;
5 44 229 255 0.092 0.112 2.06
6 0 2960 3040 1.000 1.000 06 0.95 2450 2520 0.828 0.829- 0.1346 1.88 1630 - 1630 0.551 0.537 0.265 -6 7.08 1695 1800 0.573 0.592 0.9956 9.08 1608 1650 0.544 0.543 1.280
II
-1
,ItI,

59
Table 4
Time Required for Removal of 50% of the Oxygen Demand
Test t l / 2, days t l / 2 (oxygen) Average
t1/ 2 (alr) t 1/2' daysAir Oxygen
(1) (2) (3) (4) (5)
1 2.36 1.67 0.708 2.012 1 .01 1 . 14 1 . 128 1.073 2.28 2.06 0.904 2.174 0.86 1 . 13 1 .314 1.005 19.5 23.2 1 . 190 21 .36 7.1 7. 1 1.000 7.1
Average 1 .040
Clearly, the samples varied considerably in their biodegradability.Regardless, as column 4 of Table 4 shows, no improvement is obtainedby the use of oxygen in place of air as far as rate of removal isconcerned.
Using t to represent the time of aeration in days, the averageval lies of t l / 2 from column 5 of Table 4 along with column 2 of Tcfble3 were used to calculate the ratio t/tl / 2 given in column 10 ofTable 3. The average of columns 8 and 9 of Table 3 is plotted inFigure 2 versus column 10 of Table 3.
Because, from the foregoing discussion, the use of oxygen does notincrease the rate or oxygen demand removal, it would appear that themost beneficial use of oxygen in wastewater treatment is where conventional methods of aeration can maintain minimum DO concentrationonly with great difficulty. In the constact-stablization activatedsludge wastewater treatment plant, there are two possible uses ofoxygen that may compare favorably with conventional methods ofaeration. One application of oxygen would be in the activated-sludgestabilization basin where part of the underflow from the secondarysedimentation basin is aerated separately before being returned tothe activated sludge contact basin. The other application of oxygenwould be in the activated-sludge contact basin itself in order topermit much higher concentrations of mixed-liquor suspended solidsand consequently greater oxygen demand removal. Use of oxygen in theactivated-sludge stabilization basin permits addition of sludge digestersupernatant as a nutrient.
While air is 20.9% oxygen by volume, it is 23% oxygen by weight.As a result, one might expect that in Table 1, division of column 7by the corresponding value in column 8 would yield a constant valueof 0.23. Column 2 of Table 5 shows that this is the case with theexception of test number E.

7
•••
o
o
2 3 4 5 6tIt,
J:
Fio. 2 - Ffaction of Oxygen Demond Remaining versus tIt,. I
0.0 ""'"'-__---L. -'--__--.40 ....A-__--"Io.-__--a.._-A---""
o
0.02
1.0 60
0.8
0.6
0
0.4
0 00
0
20
0.2·Sa..0'0 0c 0.2-8 0..LL..
0.1 0 0-~c 0-5E o.oef!'Cc
0.060ECP0
iiat~ OD4)(
0

61Table 5 • ANALYSIS OF EXPERIMENTAL CONDITIONS
Gas Flow Rate.Test 00 Air Test Durati on. Average 00 Remaining, liters per Hour Fraction of
Nwnber DO Oxygen t/t1/ 2 . grams per Gram 00 Satura t1 on DORema1n1n~ Concentration
., . (Average...Air Oxygen Air Oxygen Air Oxygen
(1) (2) (3) (4 ) (5) (6) (7) (8) (9)
1 0.23 2.49 0.750 0.750 106 106 0.380 0.810
2 0.23 3.74 0.286 0.228 280 350 0.933 0.839
3 0.22 5.62 0.345 0.325 232 145 0.920 0.894
4 0.24 4.03 0.654 0.516 23.0 29.0 0.933 0.810
5 0.24 2.06 1.320 1.210 3.03 3.30 0.693 0.615
6 0.18 1.28 1.953 2.01 .2.04 1.99 0.454 0.531
Table 6 - EFFICIENCY OF OXYGEN TRANSFER
Test Initial Oxygen Oxygen Supply Oxygen Supply Rate ~ Efficiency ofNumber Consumption Rate. Rate. Initial Oxygen Oxygen Transfer,
Grams per Hour Grams per Hour Consumption Rate Percent
Air Oxygen Air Oxygen Air Oxygen Air OXYgen(l) (2) (3) (4) (5) (6) (7) (8) ( )
-1 0.0228 0.0228 16.8 38 738 3860 0.136 0.0259
2 0.0217 0.0174 16.8 88 775 5060 0.129 0.0198..
3 0.0183 0.0146 16.8 55 919 3410 0.109 0.0293
4 0.0565 0.0445 3.15 16.5 56 371 1.785 0.269'-
5 0.0034 0.0031 0.84 4.4 248 1422 0.404 0.0704
6 0.0121 0.0124 0.84 4.4 69 355.
'1.357 0.282

62
For a test of duration t/tl / 2 ' the average oxygen demand (00)remaining expressed as a fraction of the initial oxygen demand is
average oxygen demandinitial oxygen demand
= 1 - 10-0 •3 t/tl / 20.695 t/tll2
(1 )
Equation 1 gives the average fraction of the initial oxygen demandremaining and is plotted in Figure 3. The average oxygen demandremaining (given in columns 4 and 5 of Table 5) ;s the product of theinitial oxygen demand (given in Table 3) times the average fractionof initial oxygen demand remaining (given in Figure 3) correspondingto the t/t
1/2 values given in column 3 of Table 5. The gas flow
rate given n columns 6 and 7 of Table 5 are the values given incolumns 5 and 6 of Table 1 divided by the average oxygen demandremaining given in columns 4 and 5 of Table 5. The fraction ofsaturation dissolved oxygen concentration given in columns 8 and 9of Table 5 are the values given in columns 7 and 8 of Table 1 dividedby 7.5 mg/t and 35.8 mg/2, respectively.
In Figure 4, the fraction of saturation dissolved oxygen concentration achieved (columns 8 and 9 of Table 5) is plotted versusthe gas flow rate (columns 6 and 7 of Table 5). Because the rate ofoxygen demand removal has been shown to be independent of the dissolvedoxygen concentration, one might as well use relatively low dissolvedoxygen concentrations and achieve the same results. In any event,Figure 4 suggests that attempting to maintain dissolved oxygen concentrations greater than about 70% of saturation requires excessivegas flow rates.
Under the test conditions, each liter of air contained 0.21 gramsof oxygen, and each liter of oxygen contained about 5 times this amountor 1.1 grams of oxygen. The rate at which oxygen was being consumedwas
oxygen consumption rate = (0.693)(oxygen demand rema'ining) (2)t l / 2
A special case of Eq. 2 is the following
initial oxygen consumption rate = (0.693)(initial oxygen demand)t 1/ 2 (3)
Equation 3 was used along with the data in Tables 3 and 4 (column 5)to calculate the initial oxygen consumption rates given in columns 2and 3 of Table 6. The data in columns 5 and 6 of Table 1 was used tocalculate the data in columns 4 and 5 of Table 6. Columns 6 and 7 inTable 6 were calculated using the data in columns 2, 3, 4, and 5 ofTable 6. Columns 8 and 9 of Table 6 are the recipricals of columns6 and 7 multiplied by 100%. The data in columns 6 and 7 of Table 6and columns 7 and 8 of Table 1 are plotted in Figure 5.

I I I -,- r- r-'- J J J --- --~
0'\W
50 00106IA. 1.6 1.8 2 2.5 3 4
t /t I'2
Fig.3- Average Fraction of Initial Oxygen Demand Remaining.
1.00
010.90c
c0EQ) 0.80cr:
"'0C0E 0.70a>
0c:::Q)C7I~ 0.60)(
0c..-
0.50c:::'+-0c0 0.40-0c~
I.L
8. 0.30cL-a>
~0.20
0.10
01.11.0 1.2 1.3

1000 64
800
600
400Oxygen--"6-Q)
01Ca..Q)
>0 200-0'C
c::::cEQ)
0::: 100~c
800EQ)
0 60cQ)0'~)(
400....0
E0a..
(!)
~)a..Q) 20Q.L.::30:r:'-Q)a.CJ) 10'-Q)-:J 8..Q)- 6c
a:::~0
i:L 4Cf)
8
2
1'-- .L.- "'"'-- --L- ......1- --.L ---l~______l
0.3 0.4 0.5 0.6 0.7 0.8 0.9Fraction of DO Saturation Concentration
Fig.4- Effect of Gas Flow Rate on Fraction of Dissolved Oxygen SaturationConcentration.

65
2,000
4,000
10,000 --.------_----r-----~---.,.._---_r_-....,..-....,8,000
6,000
- 1,000~
800.c.........C' 600(1)-0
400Q:: 6800c:0-a.E 200~UJC0Uc:Q)
100C'~
80)(
0
.2 60 o BOD-.E
......... 40-~.c
.........C'- 20Q)-0a:~
0. 10Q.:::J
8enc(1) 60'~)(
04
2
I 0 5 10 15 20 25 30 35
Dissolved Oxygen Concentration (mg/ ~ )
Fig.5- Dissolved Oxygen Concentration Resulting from a Given Ratio of OxygenSupply Rate to Oxygen Consumpution Rate (by weight).

66
Figure 5 indicates that the maximum possible efficiency using airis about 20%, while the maximum possible efficiency using oxygenappears to be about 28%. The minimum concentration of dissolvedoxygen ordinarily needed in aeration units is about 1 mg/~. At thisconcentration, the efficiency using air is about 9% (the oxygentransfer efficiency of bubble aeration is usually between 5 and 15%),while the efficiency using oxygen is about 22%.
Most of the plotted points in Figure 5 lie close to the empiricalstraight lines with the exception of the 2 points (labeled BOD) fromtest 4, which was the only test where the oxygen demand was measuredin terms of BOD.
If oxygen is used, the effluent to be discharged could besaturated with dissolved oxygen (the saturation concentration ofdissolved oxygen under the conditions of these 6 tests is about 7.5mg/l) and still have an efficiency of about 5%.
CONCLUSIONS
The first-stage BOD has generally been formulated as a first-orderreaction. The concentration of oxidizable organic material presentis the rate-determining factor, provided that the dissolved oxygen 0concentration is greater than a critical value of about 4 rng/l at 20
0C,
for example. This work has shown that this statement is true (at 20 C)for dissolved oxygen concentrations all the way from 3.4 mg/l up toat least 32 mg/~. The use of oxygen for aeration does not have aneffect on the rate of oxygen demand removal by aeration.
The rate of oxygen demand removal by aeration can vary enormously(by a factor of 27 in this study) for different samples of the samemunicipal effluent. In this study, it was shown ~hat the oxygen demandrate constant could vary from 0.807 pel) day at 20 C (for BOD removal)down to as low as 0.0298 per day at 20 C (for COD removal) for a givenmunicipal wastewater. For this reason, oxygen demand as a functionof time for different samples is best compared as illustrated inFigure 2. The use of the 5-day, 20°C BOD is clearly of little value.Oxygen demands should either be expressed in terms of COD and/or interms of ultimate BOD at a given temperature. Manometric and/orelectrolytic respirometric determination of BOD is clearly preferableto other methods, because both the ultimate BOD and the BOD rateconstant at a given temperature are necessary for stream pollutionwork.
Even when 90% of the oxygen demand is removed by aeration (seeFigure 2), the average oxygen demand during the aeration period isabout 40% of the initial oxygen demand (see Figure 3). Attempting tomaintain a dissolved oxygen concentration greater than about 70% ofsaturation appears to reqHire excessive gas flow rates (see Figure 4).Maintaining 4 mg/l (at 20 C) of dissolved oxygen in a wastewater canbe accomplished with 1% efficiency using air and 11% efficiency usingoxygen (see Figure 5).

67
Even when air is used for aeration, contact-stabilization appearsto be the best type of activated-sludge treatment from the standpointof cost effectiveness. Further, if oxygen can be used advantageouslyin wastewater treatment, the contact-stabilization activated-sludgewastewater treatment plant offers the best possibilities for theadvantageous use of oxygen as shown in Figure 6. In regions whereextended periods of extremely low air temperatures are encountered,small activated-sludge wastewater treatment plants are often entirelyenclosed. The building size necessary to enclose an activated-sludgewastewater treatment plant is smallest when contact-stabilization isthe type of activated-sludge treatment employed. Enclosure of theactivated-sludge contact basin and the activated-sludge stabilizationbasin (see Figure 6) would permit the most economical use of oxygen,because the overlying enclosed atmosphere could be passed through apacked tower countercurrent to potassium hydroxide in order to removethe carbon dioxide produced by microorganism respiration. This gasstream could then be reused for aeration.
In Table 7, the data in columns 2, 3, and 4 were obtained fromTable 3. Column 5 of Table 7 shows that the maximum oxygen demandremoval percent is the same for both air and oxygen. Column 6 ofTable 7 is the average of columns 3 and 4 and indicates that themaximum COD removal by aeration is likely to be roughly 90%.
Tab1e 7
Oxygen Demand Removal
Test Test J Oxygen Removal Ratio, Average 00Number DurQtion, Demand %O2 Removal, %
Days Remova1, %airPercentAir Oxygen
(1 ) (2) (3) \4) (5) (6)
1 5 84.6 92.3 1.091 88.42 4 76.7 68.3 0.891 72.53 12.2 91 .2 91.4 1.002 91 .34 4.03 100 97.4 0.974 98.65 44 90.8 88.8 0.978 89.76 9.08 45.6 45.7 1.002 45.6
Average 0.990
RECOMMENDATIONS
Research should be carried out at the earliest possible time todetermine the economic feasibility of using oxygen in connection withan enclosed contact-stabilization activated-sludge wastewater treatmentplant of the type discussed in the conclusions section above and

68
02+C02 Countercurrent O2 +CO2,.....--------.....-------t Potassium Hydroxide ...-----......~-------....Packed Tower
SanitarySewer
PlainSedimentation ~----1 Primary Sludge
Combined Sanitaryand
Storm Sewer
....---'°2Sludge DigesterSupernatant, etc.
Solids ConcentrationStabilization
Unit Operations
Activated -SludgeStabilization Bosin
GritGrit.....---"""'4 Chamber
Activated - Stud e Return
SludgeSecondary
SecondaryEffluent
SecondarySedimentation
11IO---04 Activated - SludgeContact Basin
Fig.6- Enclosed Contact-Stabilization Activated-Sludge Wastewater TreatmentPlant Using Oxygen Instead of Air for Aeration.

69
illustrated in Figure 6. This research sould be carried out in threephases as follows:
(1) Laboratory scale to determine the technical feasibility ofthe foregoing and to obtain design data for the secondphase of the research which is;
(2) Pilot plant scale to estimate the economic feasibility of theforegoing and to obtain design data for the third phase ofthe research which is;
(3) Full scale plant to demonstrate the economic feasibility ofthe foregoing and to obtain accurate cost-effectivenessinformation.

70SELECTED WATERRESOURCES ABSTRACTSINPUT TRANSACTION FORM
J. Accession No.
w
11. Contract/Grant No. 320614-31-0001-3506
10. Project No.A007 Colorado
The Mechanism of Water Treatment at LowTemperature, Part B, Sanitary Engineering
John C. Ward, John S. Hunter, and Richard P.Johansen
9. Organization
7. Author(s)
4. Title
Environmental Engineering Program, CivilEngineering Department, Colorado StateUniversity, Fort Collins
1..tf" ••t..,ljjlie;~'il~:.,ftce·(}.f'\N.t;~i~so~rces R.'''~tf;:__15. Supplementary Notes Part A by S. M. Morrison, G. C. Newton, G. D. Boone, and
K. L. Martin, Microbiology
16. Abstract
Part 1 (The Effects of Water Temperature and Elevation upon Aeration): A laboratoryscale mechanical aeration system was used to examine the var~ation in oxygen transferrates into water as a function of water temperature (0 to 40 C). The over-allvolumetric mass transfer coefficien5, liquid phase base, increased linearly with watertemperature at a rate of 2.84% per C. The relative aeration efficiency decreases withincreasing elevation, water temperature, and dissolved oxygen concentration. For zerodissolved oxygen and elevation, the rate of oxysen transfer per unit volume and timeis independent of water temperature for 0 to 60 C. Equations were developed relatingsaturation dissolved oxygen concentration to temperature and atmospheric pressure toelevation and air temperature.Part 2 (BOD and COD Removal from Wastewater by Aeration with Air and Oxygen): Both airand oxygen were used under identical conditions to determine the effect (ifoany) ofdissolved oxygen concentration on the rate of oxygen demand removal. At 20 C, the rateof oxygen demand removal was independent of the dissolved oxygen concentration overthe range 3.4 to 32 mg/!. The use of oxygen in an enclosed contact-stabilizationactivated sludge wastewater treatment plant suitable for high altitudes and latitudesis snown.
17a. Descriptors *Aeration, *Water Temperature, *Altitude, *Oxygen, Dissolved Oxygen,Chemical Oxygen Demand, Biochemical Oxygen Demand
17b. Identifiers*Oxygen Transfer, *Low Water Temperature, *High Elevation, *OxygenAeration, *Mechanical Aeration, Atomospheric Pressure, Air Temperature
Send To:I'u. ,,*,~:,,,./
I, '.~' ' -W-A-T-E-R-R-ES-O-U-RC-E-S-S-C-IE-N-TI-F-'c-,N-F-O-R-M-A-T'-O-N-C-EN-T-E-R-1
",12. 1Ar_,le* U,S. DEPARTMENT OF THE INTERIORWASHINGTON. D. C. 20240
Institution CAbstractor John C. Ward
17c. COWRR Field & Group
18. Availability