the mechanical drying of light salted · pdf filethe mechanical drying of light salted...
TRANSCRIPT
c.~ PROJECT REPORT NO.8
Canada [Dept. of] Fisheries. Industrial Development Service PROJECT REPOR·
THE MECHANICAL DRYING OF LIGHT SALTED CODFISH
by
G.R. Peters Memorial University of Newfoundland, St. John's
and
W.D. McDougall Industrial Development Service,
Department of Fisheries of Canada, Ottawa
for
Industrial Development Seryice Department of Fisheries of Cangda, Ottawa
May 1967
THE MECHANICAL DRYING OF LIGHT SALTED CODFISH
Opinions expressed and conclusions reached by the author of this report are not necessarily
endorsed by the sponsors of this project

1
TH~ l~u.:.;GHAi~Ic}~L .tJltYiNG uF 1ICTHT -.->AV.cl~D CU]j1i'l-.->H
Il~Tl-(O J)UCT ruN
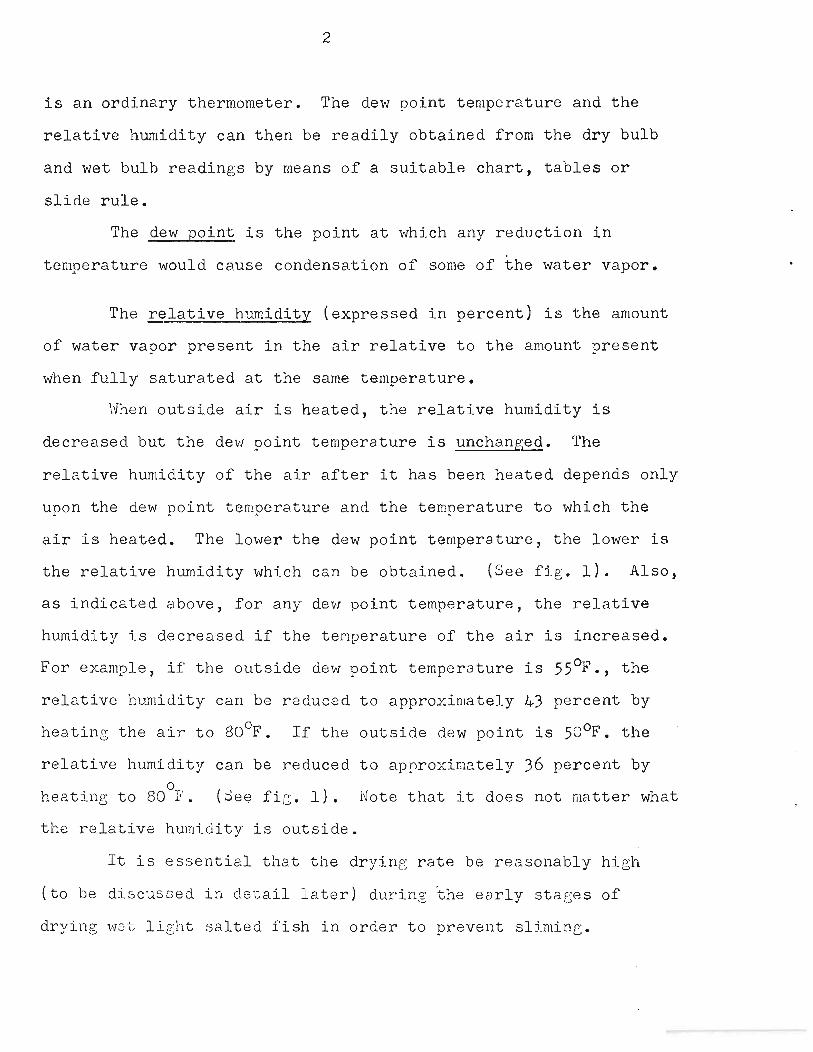
:Memorial Uni versi ty of Newfoundland and the Industrial
Development Service of the Department of Fisheries of Canada have
recently been en~aged in further studies of the mechanical drying
of salted codfish.
This report deals with the mechani.cal drying of liR'ht salted
codfish. A more detailed, technical report covering the mechanical
drying of sal ted codfish in general t will be published at a later date.
The solutions which will be advanced are not entirely
new in concept, but the problems have been studied in considerable
detail and the practical engineering aspects of the application
have been kept in mind.
Jill::) UL'1':-:>
It is essential to remove water rapidly from wet light
salted fish during the first few hours of mechanical drying if
sliming, and consequent downgrading of quality, are to be prevented.
During the summer, the outdoor air conditions may be such as to
impose serious limitations on the drying pot~ntial of the air and
''''hen IIbadtt dryin.?; conditions are experienced, sliming is very
likely to occur.
It is possible to determine ",hether any day is suitable for
drying wet li~ht salted fish by means of a simple instrument called
a "psychrometerTl. It consists of two thermometers mounted on a
frame so that ~ood air circulation is provided over the bulbs,
one of vlhich (the ·wet bulb) is kc;.:,-t wet by a vIick soaked \,lith
v.rater, (this thermometer 1di11 -'~ i ve a lovler reading than the dry
bulb unless the air is saturated); vlhi18 the other (the dry bulb)
2
is an ordinary thermometer. The dew point temperature and the
relative humidity can then be readily obtained from the dry bulb
and wet bulb readings by means of a suitable chart, tables or
slide rule.
The dew point is the point at which any reduction in
temperature 'til/ould cause condensation of some of the water vapor.
The relative humidity (expressed in percent) is the amount
of water vapor present in the air relative to the amount present
when fully saturated at the same temperature.
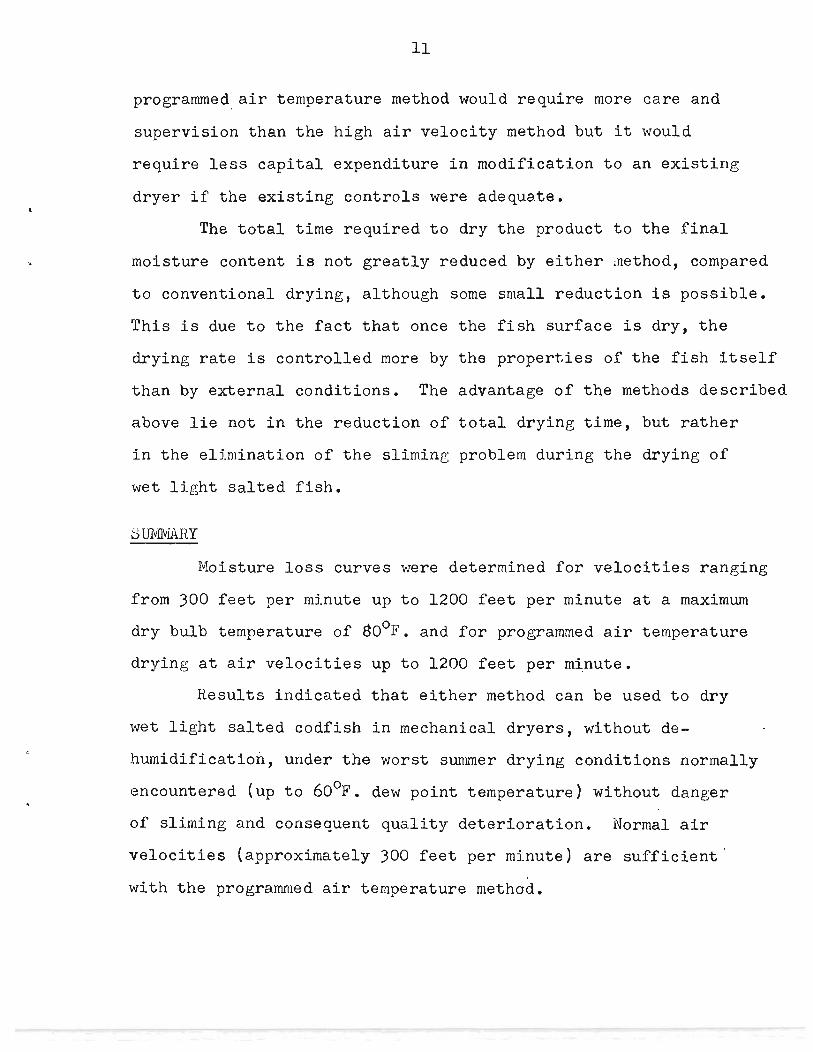
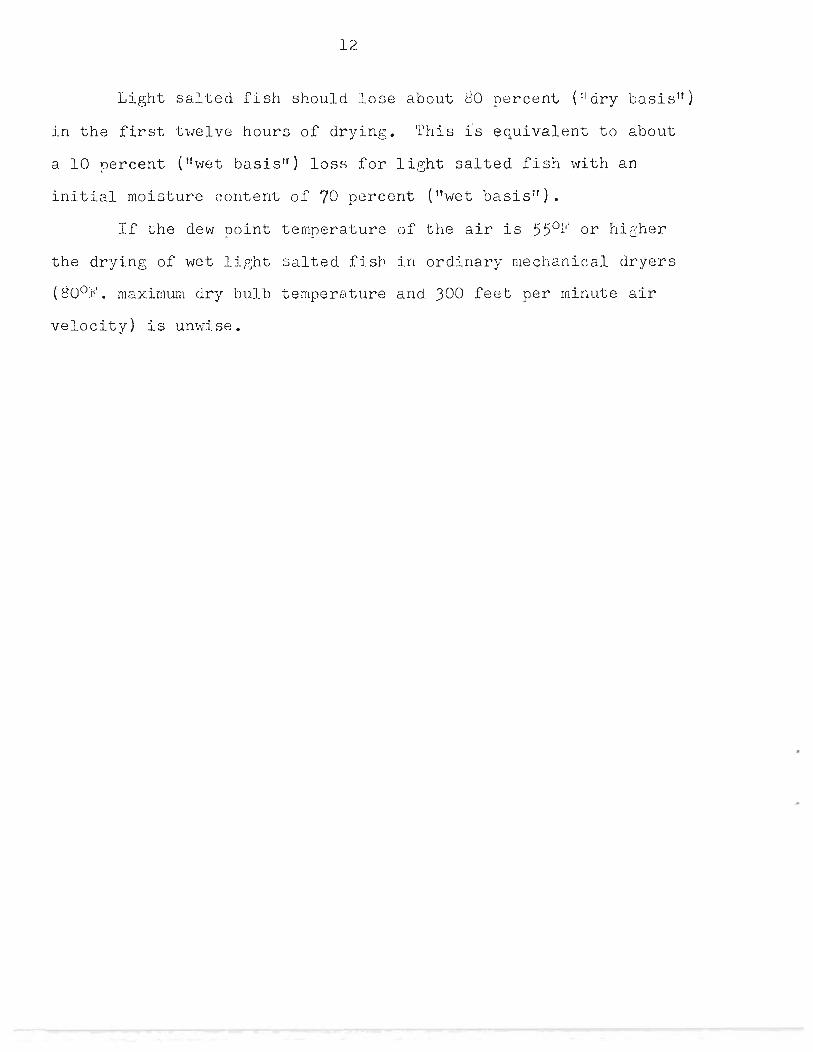
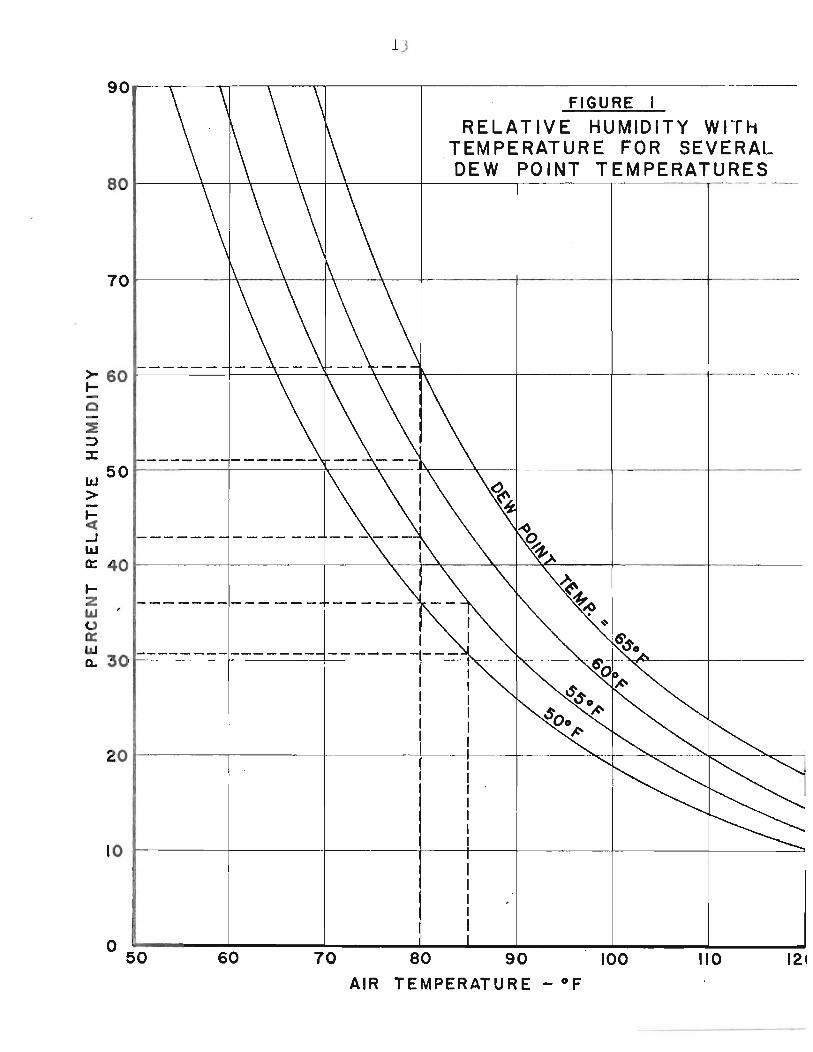
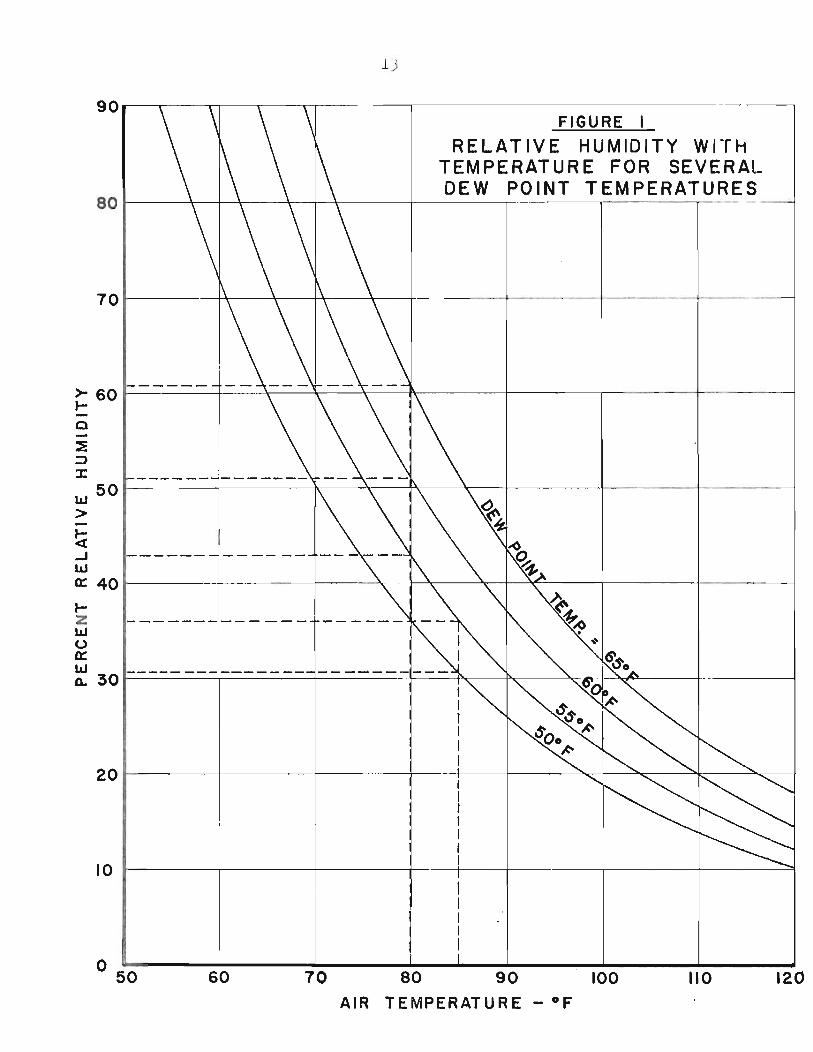
\'Then outside air is heated, the relative humidity is
decreased but the de,,', point temperature is unchan~. l'he
relative humidity of the air after it has been heated depends only
upon the dew point temperature and the temperature to which the
air is heated. The lower the dew point temperature, the lower is
the relative humidity which can be obtained. (See flg. 1). Also,
as indicated above, for any dew point temperature, the relative
humidity is decreased if the temperature of the air is increased.
For example, if the outside de"" point temperature is 55°F., the
relative humidity can be reduced to approximately 43 percent by
heating the air to 80°F. If the outside dew point is 50°F. the
relative humidity can be reduced to approximately 36 percent by o
heating to $0 F. (dee fig. 1). Note that it does not matter what
the relative humidity is outside.
It is essential that the drying rate be reasonably high
(to be discussed in detail later) during ~he early stages of
drying wet light salted fish in order to prevent slimine.
3
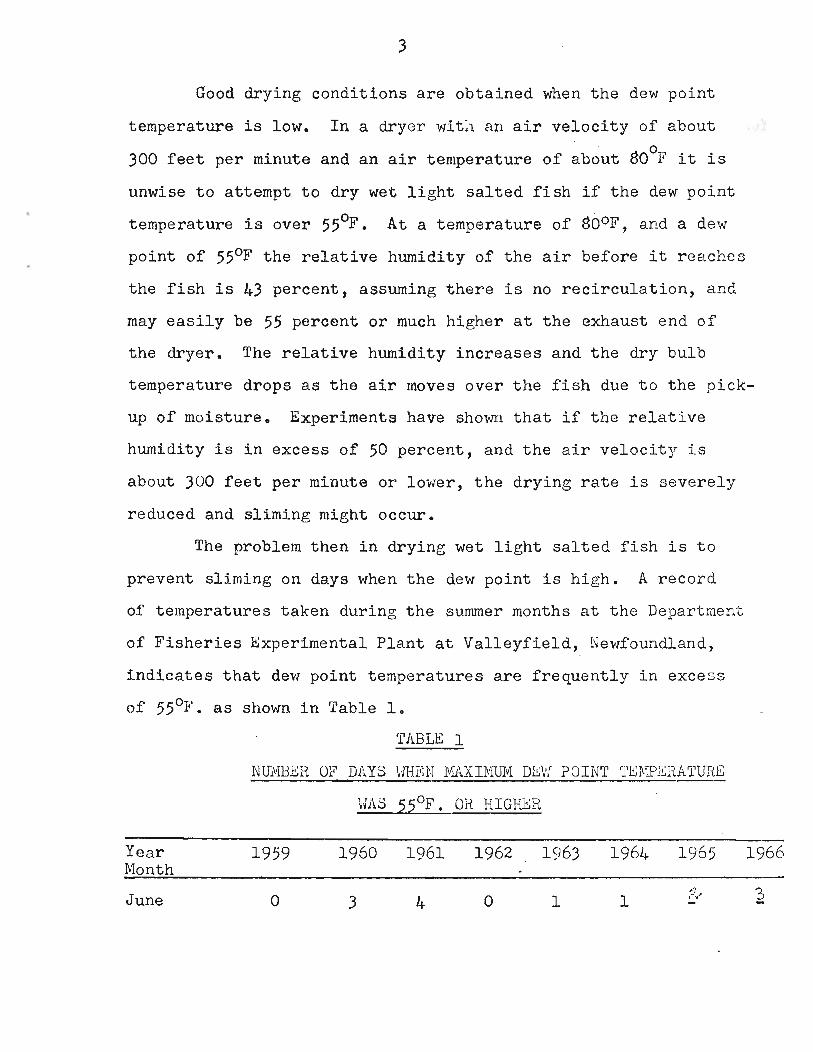
Good drying conditions are obtained when the dew point
temperature is low. In a dryer 'I1Tit~l an air velocity of about
300 feet per minute and an air temperature of about BOoF it is
unwise to attempt to dry wet light salted fish if the dew point
temperature is ov-er 55°F. At a temperature of BOOF, and a dew
point of 550F the relative humidity of the air before it reaches
the fish is 43 percent, assuming there is no recirculation, and
may easily be 55 percent or much higher at the exhaust end of
t.he dryer. The relative humidity increases and the dry bulb
temperature drops as the air moves over the fish due to the pick
up of moisture. Experiments have shown that if the relative
humidity is in excess of 50 percent, and the air velocity is
about 300 feet per minute or lovver, the drying rate is severely
reduced and slimj.ng might occur.
The problem then in drying wet light salted fish is to
prevent sliming on days when the dew point is high. A record
of temperatures taken during the sununer months at the Department
of Fisheries Experimental Plant at Valleyfield, Newfoundland,
indicates that dew point temperatures are frequently in excess
of 55OF. as shown in Table 1.
rfABLE 1
NUlvIHER OF DAYS VmE Nil/SAX IJ.\'iUIvI D1!:V[ POINT TEl'TPERATUfill
\/AS 220F • OR HIGHt:R
Year 1959 1960 1961 1962 1963 1964 1965 1966 Month
,-' ~ June 0 3 4 0 1 1 ,-"",
4
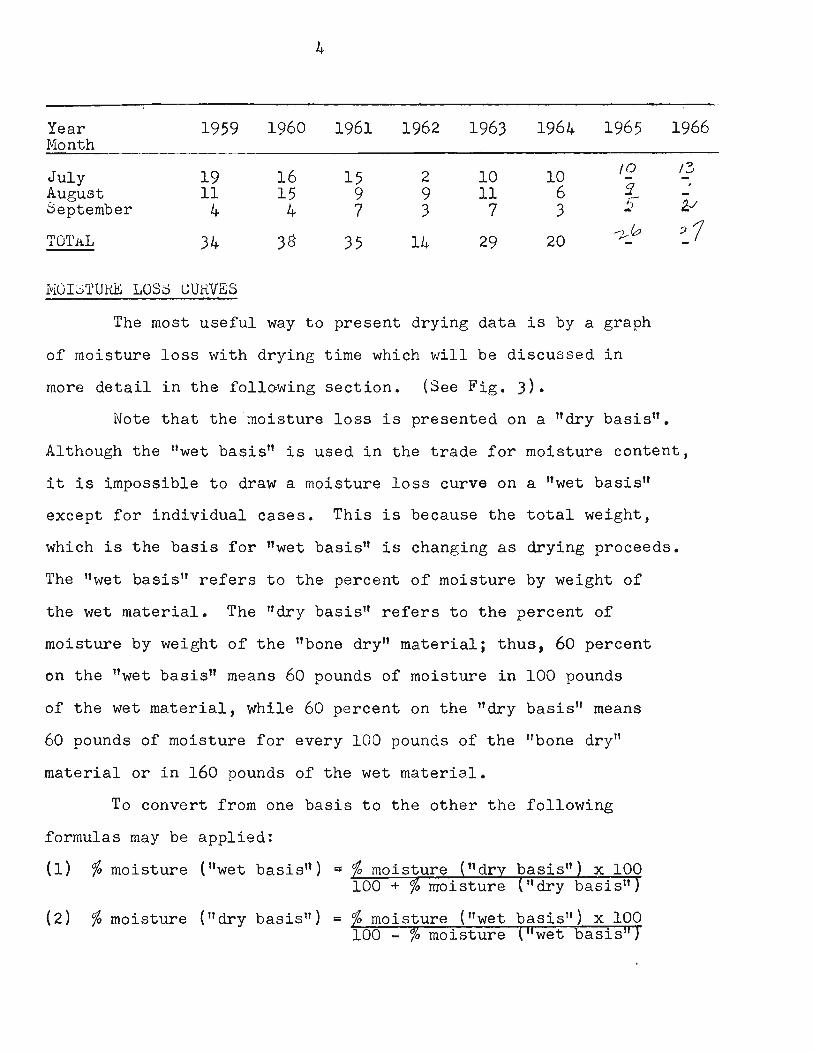
Year 1959 1960 1961 1962 1963 1964 1965 Month
July 19 16 15 2 10 10 10
:l August 11 15 9 9 11 6 September 4 4 7 3 7 3 !F
To'rAL 34 3$ 35 14 29 20 ...-) fL; ,Y'
IvIOI::i'l'Ulill LOS':; GURVES
The most useful way to present drying data is by a graph
of moisture loss with drying time which will be discussed in
more detail in the following section. (See !i'ig. 3).
Note that the "moisture loss is presented on a "dry basislt.
1966
13 -, -lJ
:1
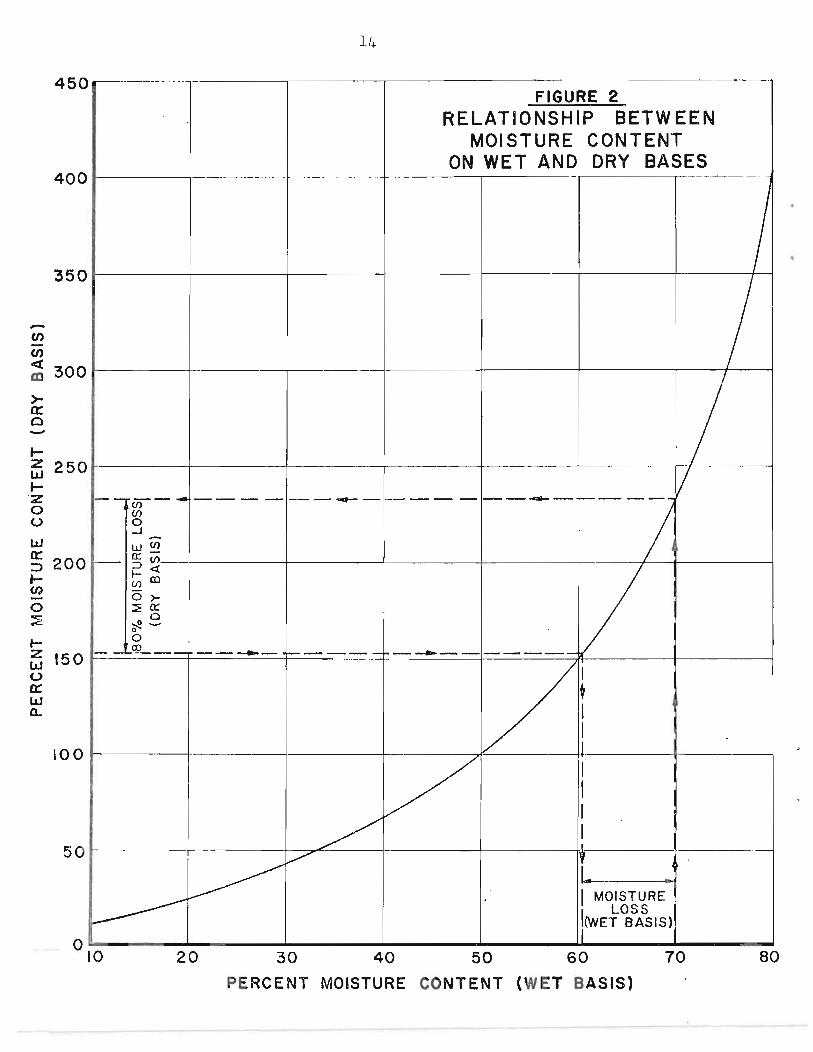
Although the "wet basislt is used in the trade for moisture content,
it is impossible to draw a moisture loss curve on a "wet basislt
except for individual cases. This is because the total weight,
which is the basis for "wet basis lt is changing as drying proceeds.
The Itwet basis" refers to the percent of moisture by weight of
the wet material. The "dry basis" refers to the percent of
moisture by weight of the Itbone dry" material; thus, 60 percent
on the "wet basis" means 60 pounds of moisture "in 100 pounds
of the wet material, while 60 percent on the "dry basis!t means
60 pounds of moisture for every 100 pounds of the !tbone dry"
material or in 160 pounds of the wet materia.l.
To convert from one basis to the other the following
formulas may be applied:
(1) % moisture ("wet basis") ::; ~~~~~~~~~~~~~~~
( 2 ) % mo i st ure (" dry bas is 11) = ~~:..::.=~:::...;:~~~~b~ar..;:s;;.;:i~s:;..II-:t):......;:;x~l:.;:0rT0 wet basis
5
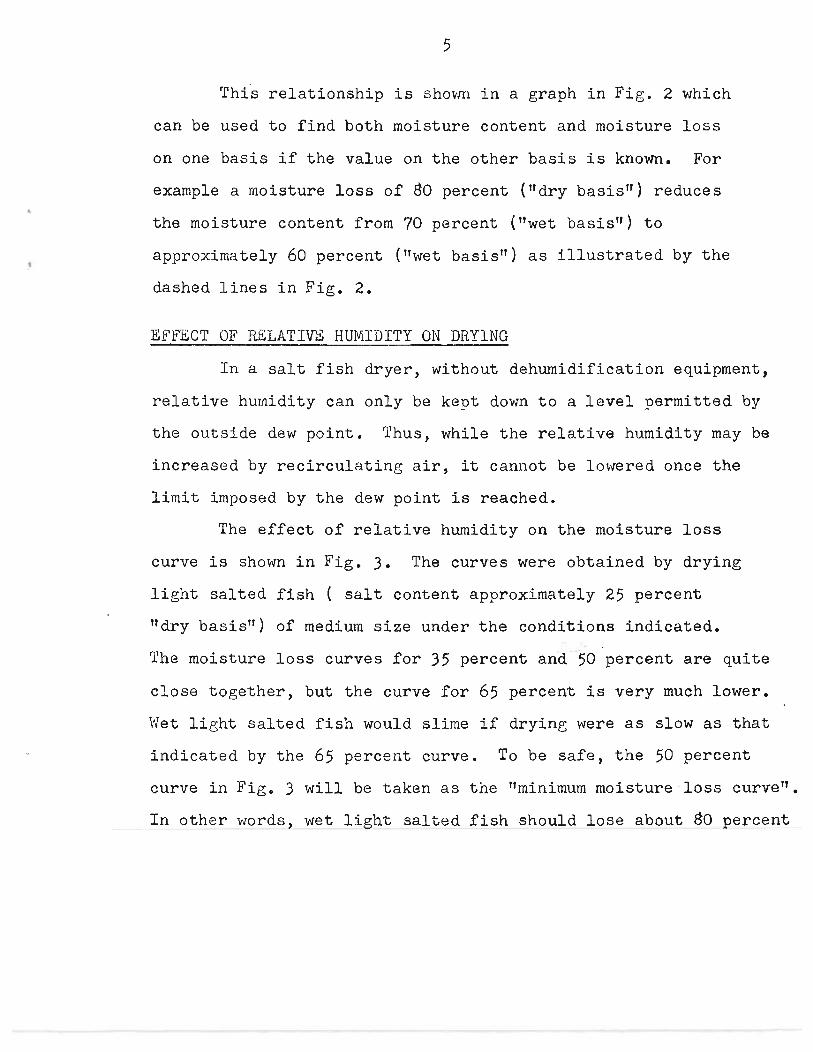
Th{s relationship is shovm in a graph in Fig. 2 which
can be used to find both moisture content and moisture loss
on one basis if the value on the other basis is known. For
example a moisture loss of 80 percent (udry basisTf) reduces
the moisture content from 70 percent (ttwet basis") to
approximately 60 percent ("wet basistf) as illustrated by the
dashed lines in Fig. 2.
EFFECT OF RELATIVE HUMIDITY ON DRY1NG
In a salt fish dryer, without dehumidification equipment,
relative humidity can only be kept down to a level permitted by
the outside dew point. Thus, while the relative humidity may be
increased by recirculating air, it cannot be lO\'1ered once the
limit imposed by the dew point is reached.
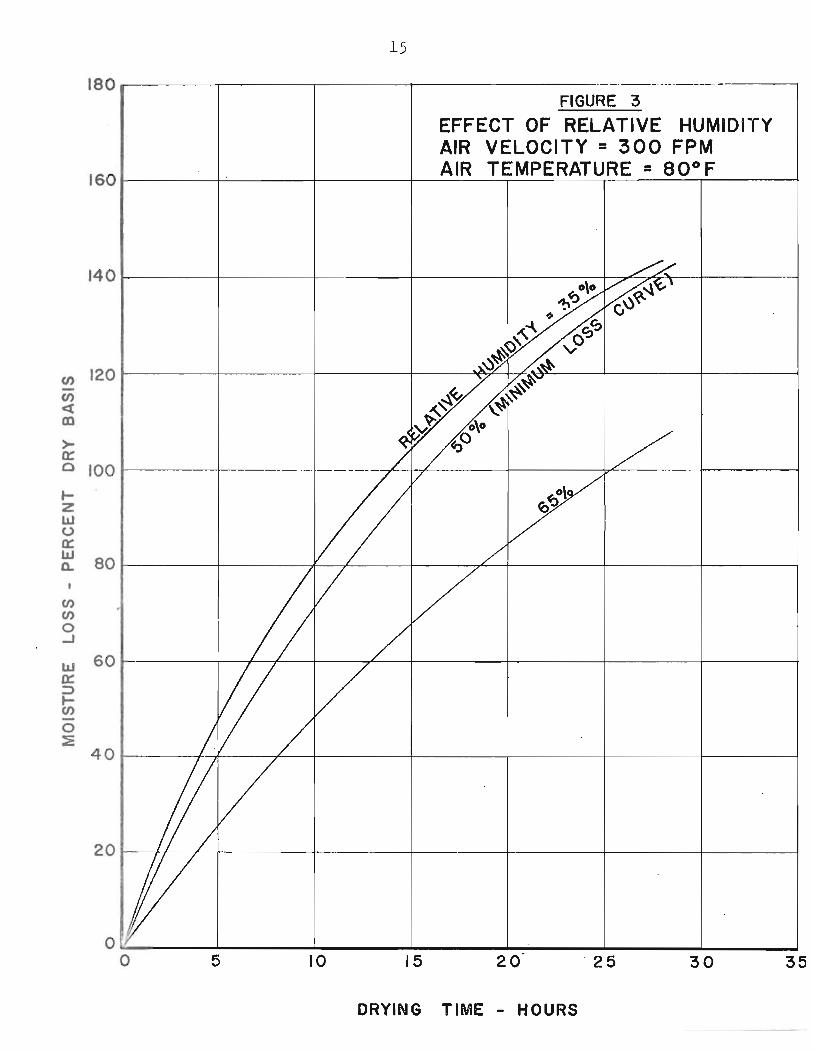
The effect of relative humidity on the moisture loss
curve is shown in Fig. 3. The curves were obtained by drying
light salted fish ( salt content approximately 25 percent
ttdry basis") of medium size under the conditions indicated.
The moisture loss curves for 35 percent and 50 percent are quite
close together, but the curve for 65 percent is very much lower.
VIet lie;ht salted fish would slime if drying were as slow as that
indicated by the 65 percent curve. To be safe, the 50 percent
curve in Fig. 3 will be taken as the "minimum moisture'loss curve".
In other words, wet light salted fish should lose about 80 percent
6
(ndry basisTr) in the first twelve hours of drying. For light
salted fish with an initial moisture content of 70 percent
(ftwet . basislf), this means that it should be dried to about
60 percent ("wet basis") in twelve hours.
As already indicated, the relative humidity of the air
increases as it passes over drying fish, so that it is the fish
in the region of maximum relative humidity (at the exhaust end
of a tunnel type dryer) which must dry at least as fast as that
indicated by the 50 percent curve of Fig. 3.
The rise in relative humidity depends mainly on the amount
of fish being dried. It therefore follows that when drying
conditions are poor, some improvement can be gained by reducing
the dryer load.
The problem of preventing spoilage new reduces to over
coming the effect of high relative humidity so that the moisture
loss curve can be kept above the minimum loss curve of Fig. 3
ONE ~OLUTION - HIGH~R AIR V~LOCITY
\Vhile any part of the fish surface is wet, the drying rate
is influenced by both relative hwnidity and the air velocity.
\Vhen the relative humidity in the dryer is low (that is on days
when the dew point is low) the air velocity is not very important,
since the drying rate will be sufficiently high to prevent sliming.
7
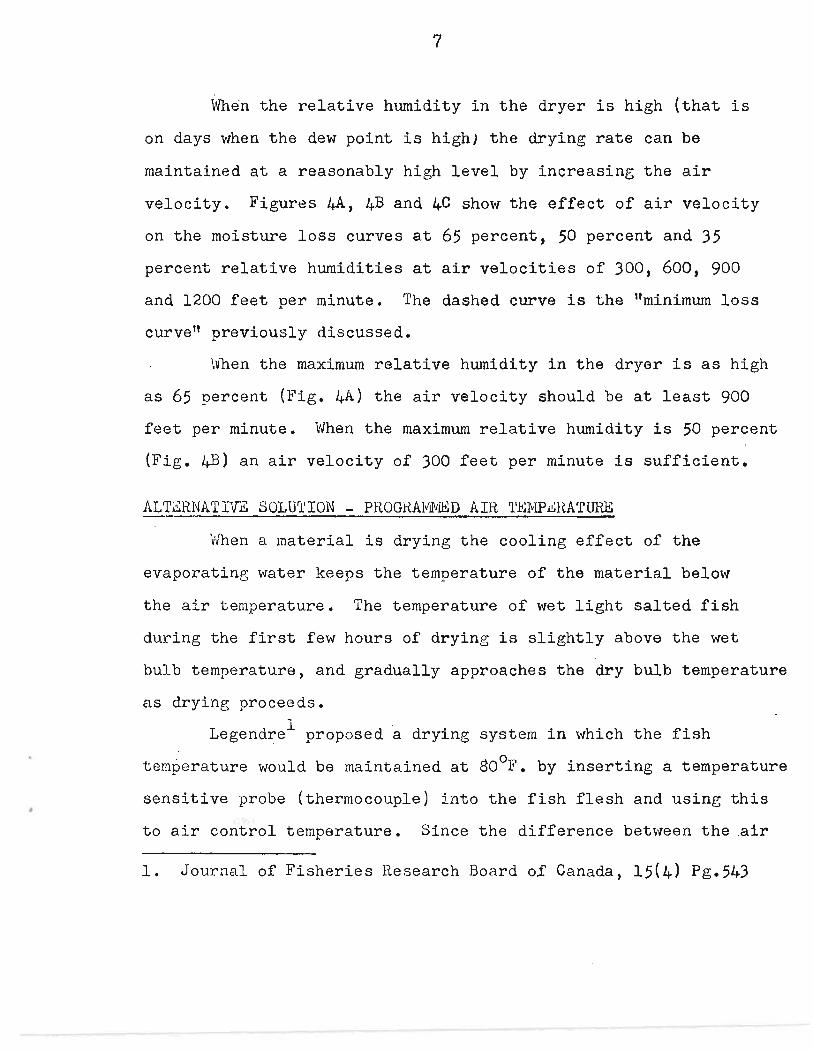
Whe'n the relative humidity in the dryer is high {that is
on days when the dew point is high} the drying rate can be
maintained at a reasonably high level by increasing the air
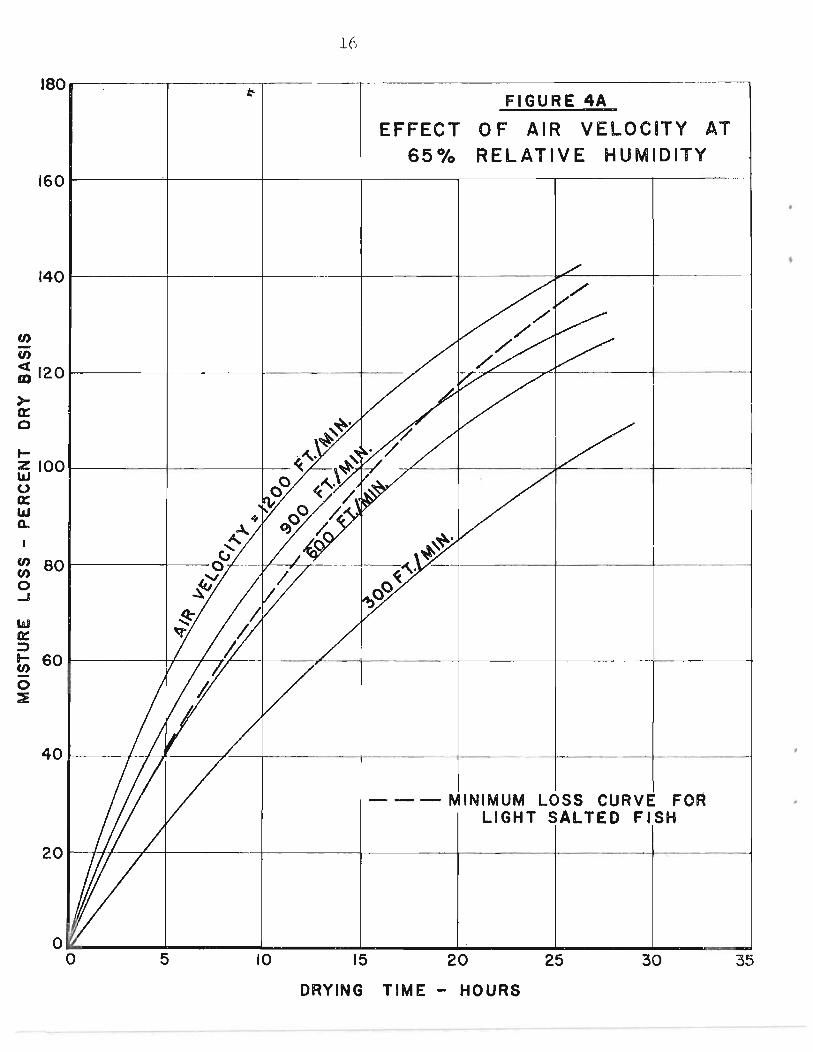
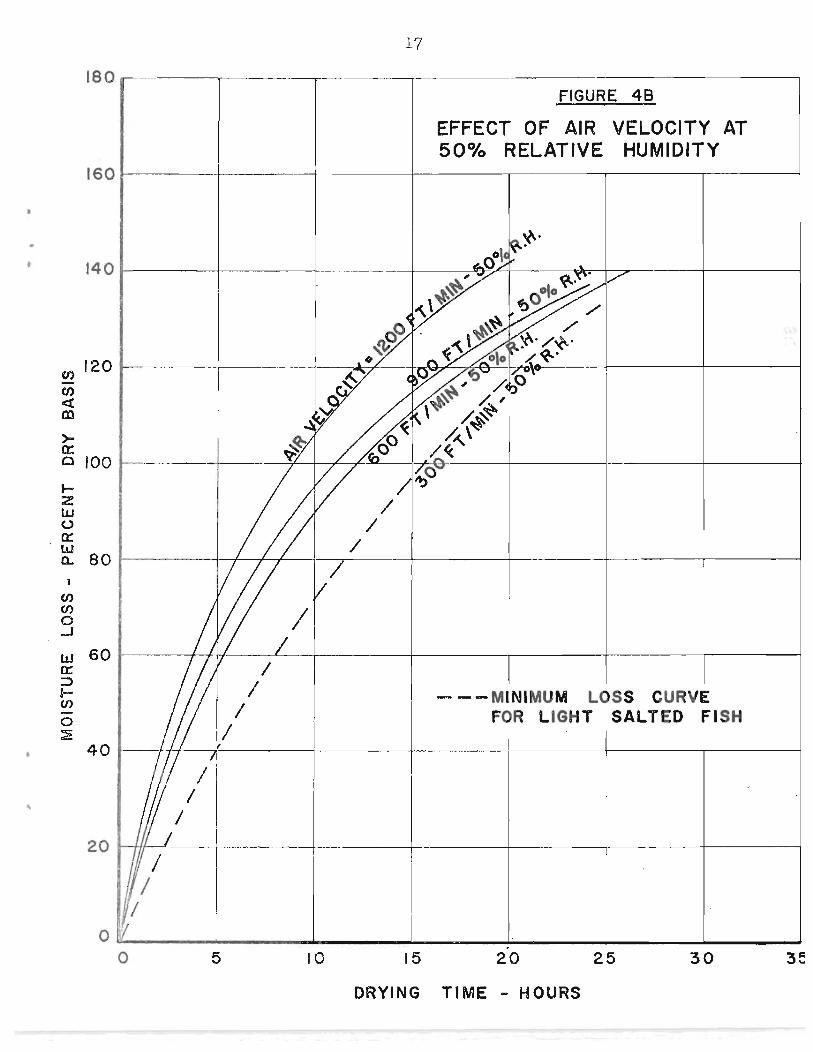
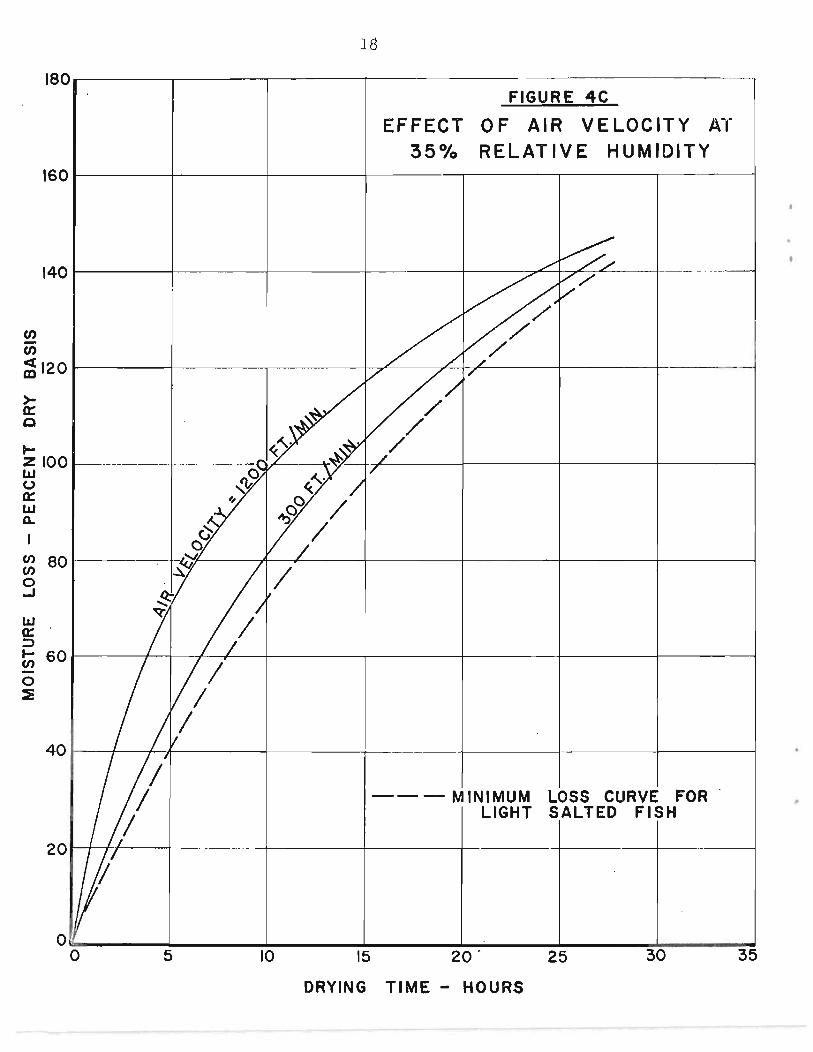
velocity. Figures 4A, 4B and 4C show the effect of air velocity
on the moisture loss curves at 65 percent, 50 percent and 35
percent relative humidities at air velocities of 300, 600, 900
and 1200 feet per minute. The dashed curve is the "minimum loss
curve" previously discussed.
When the maximum relative humidity in the dryer is as high
as 65 percent (Fig. 4A) the air velocity should be at least 900
feet per minute. When the maximum relative humidity is 50 percent
(Fig. 4B) an air velocity of 300 feet per minute is sufficient.
ALTERNATIVE SOLUTION - PROGliAIVj}JiliD AIR 'l'.I!;l~1P~HATURE
When a material is drying the cooling effect of the
evaporating water keeps the temperature of the material below
the air temperature. The temperature of wet light salted fish
during the first few hours of drying is slightly above the wet
bulb temperature, and gradually approaches the dry bulb temperature
as drying proceeds. 1 Legendre proposed a drying system in which the fish
temperature would be maintained at SOoF. by inserting a temperature
sensitive probe (thermocouple) into the fish flesh and using this
to air control temperature. Since the difference between the ,air
1. Journal of Fisheries Research Board o£ Canada, 15(4) Pg.543
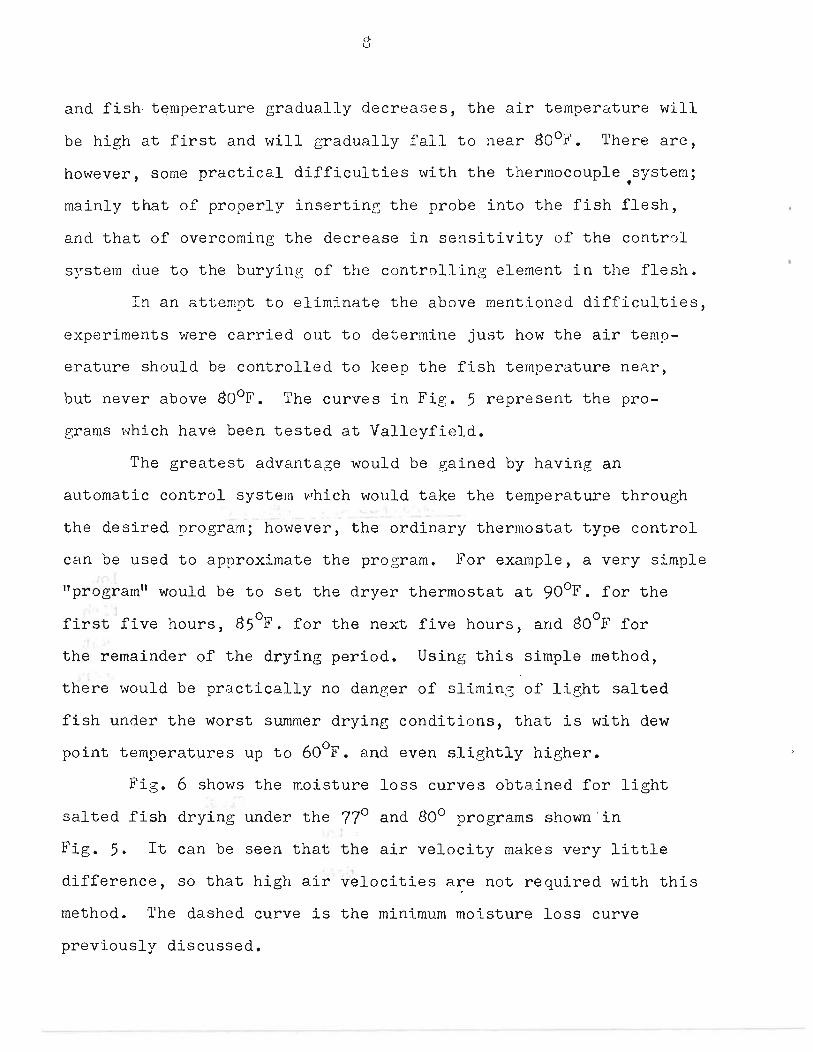
and fish t~mperature gradually decreases, the air temperature will
be high at first and will gradually fall to near gOoF. There are,
however, some practical difficulties with the thermocouple system; f
mainly that of properly insertin~ the probe into the fish flesh,
and that of overcoming the decrease in sensitivity of the control
sJrstem due to the burying of the controll ing element in the flesh.
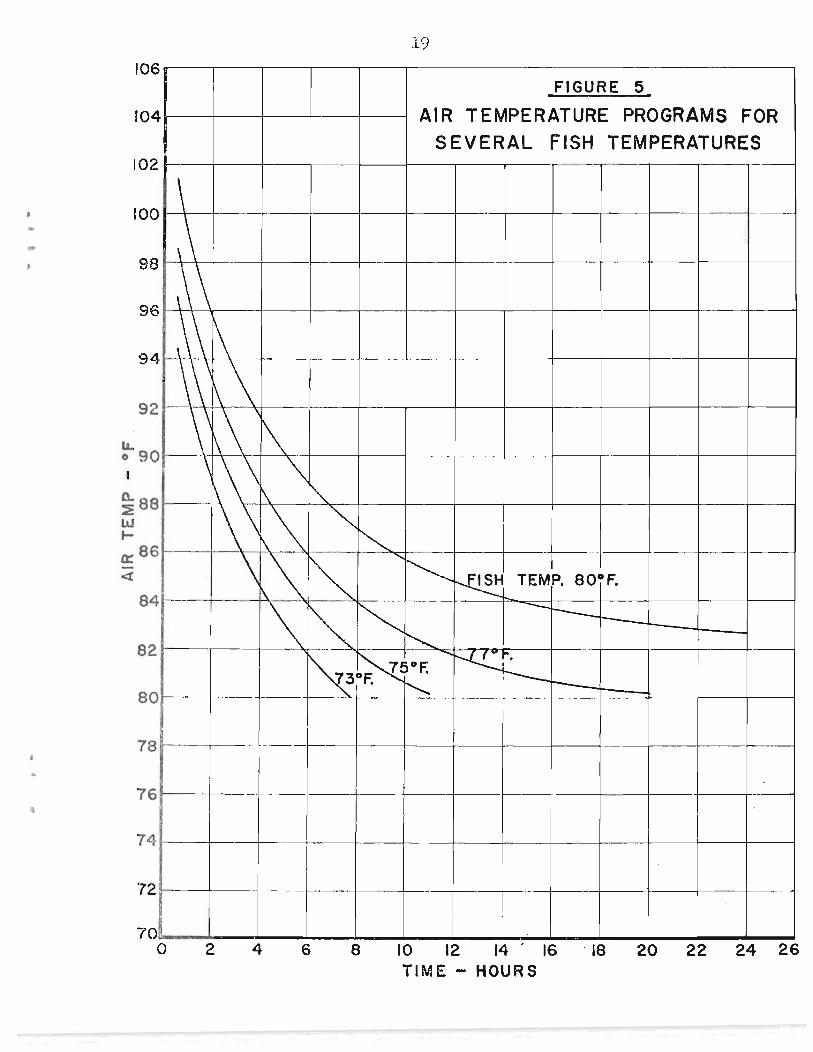
In an attempt to eliminate the above mentioned difficulties,
experiments were carried out to determine just how the air temp-
erature should be controlled to keep the fish temperature near,
but never above gOoF. The curves in Fig. 5 represent the pro
grams which have been tested at Valleyfield.
The greatest advantage would be gained by having an
automatic control system vrhich would take the temperature through
the desired program; however, the ordinary thermostat type control
can be used to approximate the program. For example, a very simple
"programtt would be to set the dryer thermostat at 90oF. for the
first five hours, g5 0 F. for the next five hours, and 80°F for
the remainder of the drying period. Using this simple method,
there would be practically no danger of slimin3 of light salted
fish under the worst summer drying conditions, that is with dew
point temperatures up to 600 F. and even slightly higher.
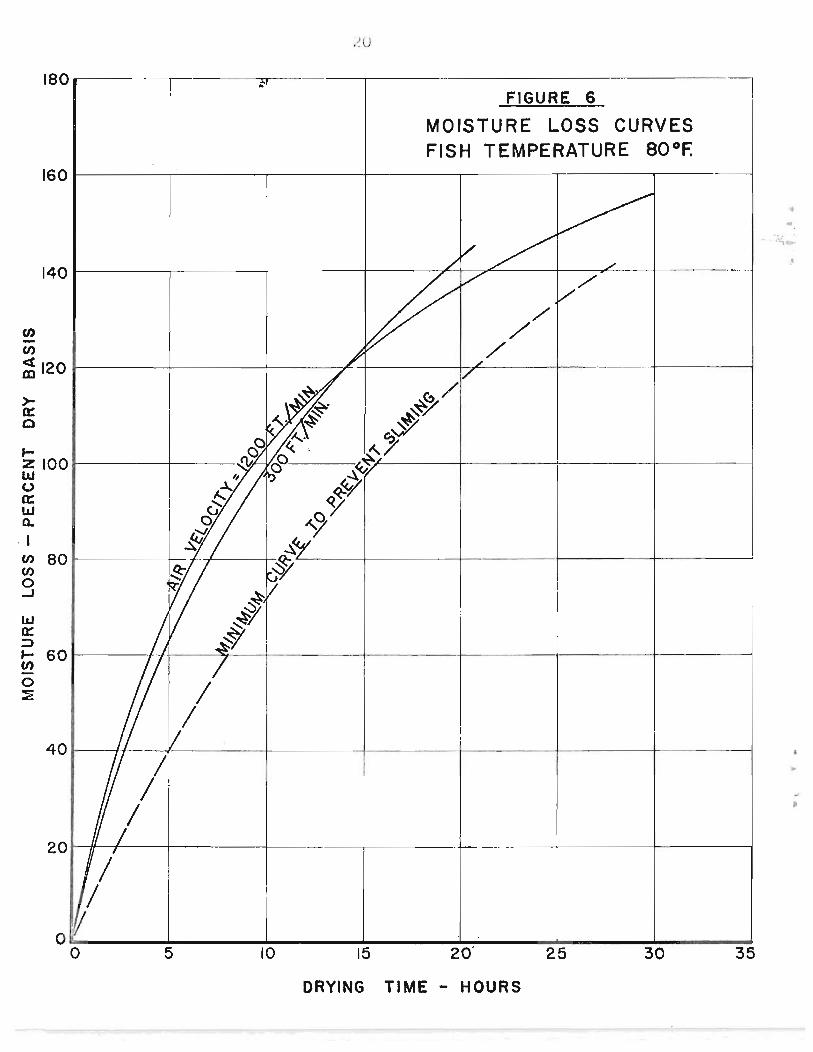
Fig. 6 shows the moisture loss curves obtained for light
salted fish drying under the 77° and 800 programs shown'in
Fig. 5. It can be seen that the air velocity makes very little
difference, so that high air velocities a~e not required with this
method. The dashed curve is the minimum moisture loss curve
previously discussed.
..
9
COi'.'IPAH.ISON 01" THL 'l'i'lO SOLUTION::>
The air velocity in an existing dryer can be increased by
either increasing the size of the fan and motor or decreasing
the cross-sectional area of the dryer. The latter is not al\1<lYs
desirable or practical. If the fan capacity is increased, the
volume of air (cubic feet per minute) moving through the dryer
will be increased and , the heat demand will be increased in
proportion. Thus a new heater might be required. Increasing
fan capacity thus automatically increases electrical power arid
fuel consumption. Power and heat consumption can be kept to
a minimwn by either of the following arranBements.
(I) THE INJ'l'ALLATION OF A VJ..l·nABL~ SPbLD Dl{IV.c; It'vI\ TH~ FAN
A variable speed drive is an arrangement such as a variable
pitch pulley which permits variation of the fan speed and lower
cost operation when high air velocity is not required.
( 2 ) A TV.JO Dli yr:H S YS T~I\II
One of the dryers would be a small capacity, hi~h air
velocity type and the other dryer would be a much larger low air
velocity dryer. The small high velocity dryer could be used for
the complete drying of small lots of fish, in vvhich case the fan
would ooerate a high speed during the early sta'se and at low
speed for the final stage. When the plant was producing to
capacity, the small dryer would be operated entirely as a high
velocity dryer, with the fish being move~ to the large low air
10
velocity dryer after 8 to 12 hours, depending on the type of fish
and drying conditions.
The second solution of overcoming poor drying conditions,
-programmed air temperature- does not require any electrical energy
change since it is not necessary to use high air velocity. The
heater load, however, is proportional to both the amount of air
to be heated and the temperat.ure rise required. Heat consumption
will thus be increased due t.o the increased air telilperature. How
ever, most existing dryers would have a heating system capable of
maintaining; a temperature of 90°F'. during the summer.
This programmed air temperature method can therefore be
applied to a dryer with relj.able temperature and humidity controls
and good air circulation without any new equipment, if the operator
is willing to reset temperature controllers as drying proceeds.
The danger or disadvanta[e of the above method lies in the
risk of overheating and resulting "fish burn". It must be borne
in mind that the use of hi8h temperatures depends upon the cooling
effect of evaporatinE water.
If there is an area of fish ~lere water does not evaporate
from the surface, heat damae;e may result. For example, fish
should not be laid over the tray frame and care should be taken
to avoid "dead spoto;; or areas of little or no air circulB.tion
in the dryer, since heat dalila. f~e is likely to occur in these
regions. These restrictions \'Jill probably JClean a slt?:ht reduction
in the usual dryer load • .:lince the dryer . is beinz nnerated at hi [';h
tempel'o.ture, the control system must be reI i R.ble. In r eneral the
11
programmed, air temperature method would require more care and
supervision than the high air velocity method but it would
require less capital expenditure in modification to an existing
dryer if the existing controls were adeque,te.
The total time required to dry the product to the final
moisture content is not greatly reduced by either .nethod, compared
to conventional drying, although some small reduction is possible.
This is due to the fact that once the fish surface is dry, the
drying rate is controlled more by the properties of the fish itself
than by external conditions. The advantage of the methods described
above lie not in the reduction of total drying time, but rather
in the elimination of the sliming problem during the drying of
wet light salted fish.
Moisture loss curves "lere determined for velocities ranging
from 300 feet per minute up to 1200 feet per minute at a maximum
dry bulb temperature of gOoF. and for programmed air temperature
drying at air velocities up to 1200 feet per m~nute.
Results i'ndicated that either method can be used to dry
wet light salted codfish in mechanical dryers, without de
humidification, under the worst sun~er drying conditions normally
encountered (up to 600 F. dew point temperature) without danger
of sliming and consequent quality deterioration. Normal air
velocities (approximately 300 feet per minute) are sufficient
with the prograrruned air temperature method.
12
Light salted fish should lose about 80 percent (lldry basis")
in the first tV/elve hours of drying. This is equivalent to about
a 10 percent ("wet basistl) loss for 1 ight sal ted fi sh \"li th an
initial moisture content of 70 percent ("wet basislf).
If the dew Doint temperature of the air is 55°1" or hit:her
the drying of wet li~ht salted fish in ordinary mechanical dryers
(80°}'. maximtIDl dry bulb temperature and 300 feet per minute air
velocity) is unwise.
1 )
90--~--~~~--~~----~-------------------------------
FIGURE I
RELATIVE HUMIDITY WITH TEMPERATURE FOR SEVERAL DEW POINT TEMPERATURES
80~---4--~---4~~----~------~------~------~--- - ---
70~----~+---+-~+---+-~------~--------+-------+-------
~60 ~----~--~~-;~~~~~----~-------r-------+... -Q
:e ::> :E:
LtJ 50 > -~ ...I LtJ ~ 40 r-----~r-----~----~~-T--~~~F----+-------+-------
tZ LtJ ' (.) ~ LtJ __ ______________________ _
~ 30r-----~~----~------~--~~~----~
20 r-----~-------1------~---~---+----~~~~--~--~~~
10 ~----~r_----~------_4--_4--_4------_+------_+------~
o 50 60 70 80 90 100 110 12C AIR TEMPERATURE - of
1)
90--~--~~~--~~----~------------------------------~
FIGURE I
RELATIVE HUMIDITY WITH TEMPERATURE FOR SEVERAL DEW POINT TEMPERATURES
80 ~---+~f---\----+___I--+------+---------r--------"---------.----- -
70~----~~--+-~+---+-~-------~--------+-------+------~
~60 ~----~~~~-4~~~~r-----~-------+-------+------~ l-e :e ::> :r: 1LI 50 > ~ ..J ------L&J ~ 40 ~----~---------I----~-1~--~~~~---+-------+------~
IZ 1LI (.)
~ 1LI ________________________ _
~ 30 ~----~~-------I------~--~~~----~
20 ~----~~-------I------~--~--~----~~--~--~--~~-1
10 ~----~~----___I------~--~--~------_+------_+------_4
o 50 60 70 80 90 100 110 120 AIR TEMPERATURE - of
450
400
350
-en en ~ 300
>-a: Q -I-~ 250 I-'z o (.)
w g; 200 I-en -o ::!:
I-z 150 w u 0::: W Q.
100
50
14
FIGURE 2 " RELATIONSHIP BETWEEN
MOISTURE CONTENT ON WET AND DRY BASES
/ --(j)-04 ----------------------I en
0 -I -wen
i--- 0:: (j) :::><{ 1-0) en 0>-~o::
0 ~-0 0
--~-.- --~--- 1----- -------_.-I t I I . II
V I 1
/ I I
~ / + ~ I. ..
~ I MOISTURE 1 LOSS
II(wET BASIS)
20 30 40 50 60 70 80
PERCENT MOISTURE CONTENT (WET BASIS)
CJ)
CJ)
~ al
>-a: 0
t-Z lLJ (.)
a:: lLJ Q.
CJ) CJ)
0 -I
I.LJ 0:: ::> I-en 0 :lE
15
180 --------~----~~----~~------------------------·----~ FIGURE 3
EFFECT OF RELATIVE HUMIDITY AIR VELOCITY = 300 FPM AIR TEMPERATURE = 80° F
160~------~----~~----~~----~------~------~-------4
120
100
80
60
40
20~~--~~------~----~~----~~----~------~------~
o~ ______ ~ ______ ~ ______ ~ ______ ~ ____ ~~ ____ ~~ ____ ~ o 5 10 15 20 "25 30 35
DRYING TIME - HOURS
(/)
U)
16
180--------~----~~------------------------------------
FIGURE 4A
EFFECT 0 F AIR VELOCITY AT 65% RELATIVE HUMIDITY
160~----~~----~~------~------~------~------~----~
140~------r-------~------~------~-------~------~----~
~120~------~------~------~--~--~~~--~~------~----~
>-0:: o
fffiIOOr-------~--------~ u 0:: LIJ Q.
A...~ ..
~ U) 801------+--0 r-----bL--+---':-. ----1--. U)
o ~ ...J ~
IAJ 0:: :)
~ 60~------H-~~--r----~--~------~------~------+--------~ U) -o ~
40~--~7J~--~--~------+-------+-------+-------+-----~
- - - MINIMUM LOSS CURVE FOR LIGHT SALTED FISH
20~~--r-~------~------+-------+-------+-------+-----~
O~ ____ ~~ ______ ~ ______ ~ ______ .. ______ ~ ______ ~ ____ ~ o 5 10 15 20 25 30 35
DRYING TIME - HOURS
t
,
17
180~----~~----~------~----------------------------~ FIGURE 48
EFFECT OF AIR VELOCITY AT 50% RELATIVE HUMIDITY
160~----~~----~-------+-------~------~------~-----~
140~----~------~--------+--~~~--~~-r~----~----~
tn 120 -en « III
)0-n: o 100
~ z w <.> a: IJJ
80 a.. I
en en 0 ...J
LLJ 60 a: :::> 1-CJ)
0 ~
40
10 15
- - - MINIMUM LOSS CURVE FOR LIGHT SALTED FISH
I
20 25 30
DRYING TI ME - HOURS
180
160
140
CJ) -CJ)
<t 120 m
>-0: C
tZIOO L&J o 0: L&J a.. I
~ 80 o ...J
L&J 0::' ::> t- 60 CJ) -o ::E
40
20
o o
/ I
~I
18
FIGURE 4C
EFFECT OF AIR VELOCITY Al 35% RELATIVE HUMIDITY
/" ~
;;::: v/ V
~ // V// " d~
// ,<~. /
,/
I 00 /
G ~ / 0 / , iii
/ if / If 7 / ~/
/ vi I
/ / ---MINIMUM LOSS CURVE FOR ·
LIGHT SALTED FISH
5 10 15 25 30 35
DRYING TIME - HOURS
19 . 106
FIGURE 5
104 AIR TEMPERATURE PROGRAMS FOR SEVERAL FISH TEMPERATURES
102
• 100
-98
96
94
92
l£. o 90
L\. 88 :2: w .... 0: 86 <C
84
82
80
\ \\ \\ ,\ \ 1\ \ \\ 1\\ \\ ,\ ' ~
\ \\ \ '\ _. \ "\.
\\ ~\ ~ ~ - -
\ ~\ ~ .....
~ ~ TEMP. 80°F.
\ ~ ~ --r----" ~~5~-~r-.
r---. r--
78 ,
76
74
72 1--
70 o 2 4 6 8 10 12 14· 16 . 18 20 22 24 26
TIME - HOURS
180
160
140
0 . (J)
~120
>a:: c
fZIOO I.rJ (.)
a:: I.rJ Q.
. I en 80 (J)
o ...J
I.rJ a:: ::> f- 60 (J)
o ~
40
20
o o
/ I'
/
: I FIGURE 6
MOISTURE LOSS CURVES FISH TEMPERATURE 80°F.
// ~
/ ./
'.
/ /' V/
,/ /
/ // /'
~ ~/ ~. ~~7 0.0.
~. e:>.S7 ~ : ~7
~ 00 ~~/ II P 9 ".)...
G Y 0. ~ N.
l} ~y'
~ ~ ,
~ ~'1 ~
~~
II
/ /
/
5 10 15 20 25 30 35
DRYING TIME - HOURS