the math behind (and beyond) digital transformation
TRANSCRIPT

© Copyright 2017 Pivotal Software, Inc. All rights Reserved. Version 1.0
Jon Erickson, VP, Director, TEI, Forrester Consulting, [email protected] Dormain Drewitz, Sr. Director, Product Marketing, Pivotal Software, @dormaindrewitz February 2018
The Math Behind (and Beyond) Digital Transformation
Cover w/ Image
Agenda
■ Defining Transformation
■ Measuring Business Value
■ The Role of Directional Metrics
■ Making Metrics Known
Making the once impossible trivial.
DEFINING TRANSFORMATION
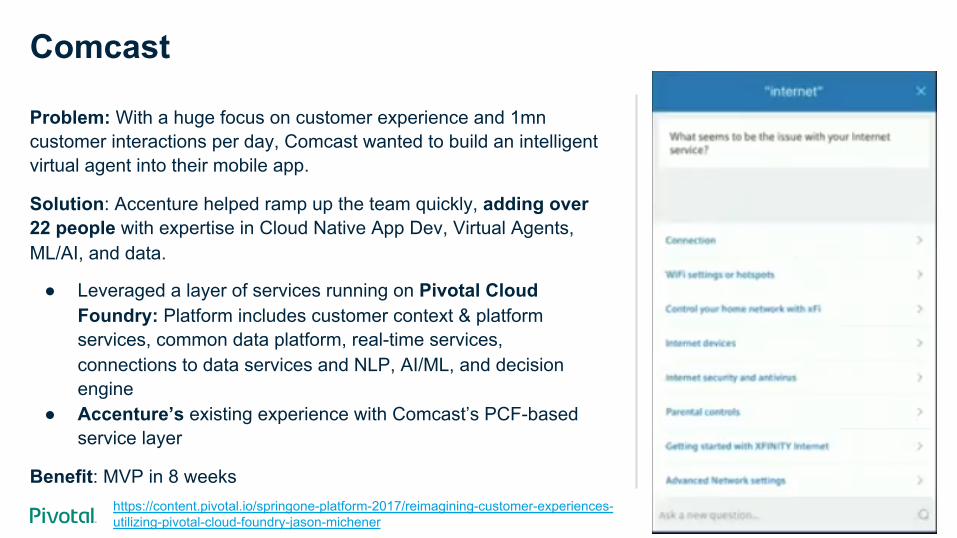
Comcast
Problem: With a huge focus on customer experience and 1mn customer interactions per day, Comcast wanted to build an intelligent virtual agent into their mobile app.
Solution: Accenture helped ramp up the team quickly, adding over 22 people with expertise in Cloud Native App Dev, Virtual Agents, ML/AI, and data.
● Leveraged a layer of services running on Pivotal Cloud Foundry: Platform includes customer context & platform services, common data platform, real-time services, connections to data services and NLP, AI/ML, and decision engine
● Accenture’s existing experience with Comcast’s PCF-based service layer
Benefit: MVP in 8 weeks https://content.pivotal.io/springone-platform-2017/reimagining-customer-experiences-utilizing-pivotal-cloud-foundry-jason-michener
Measuring Business Value
Key Concepts

Value Stream Mapping
● Lean Manufacturing principles ● Builds consensus by engaging multiple stakeholders ● Provides measurable goals for process improvement
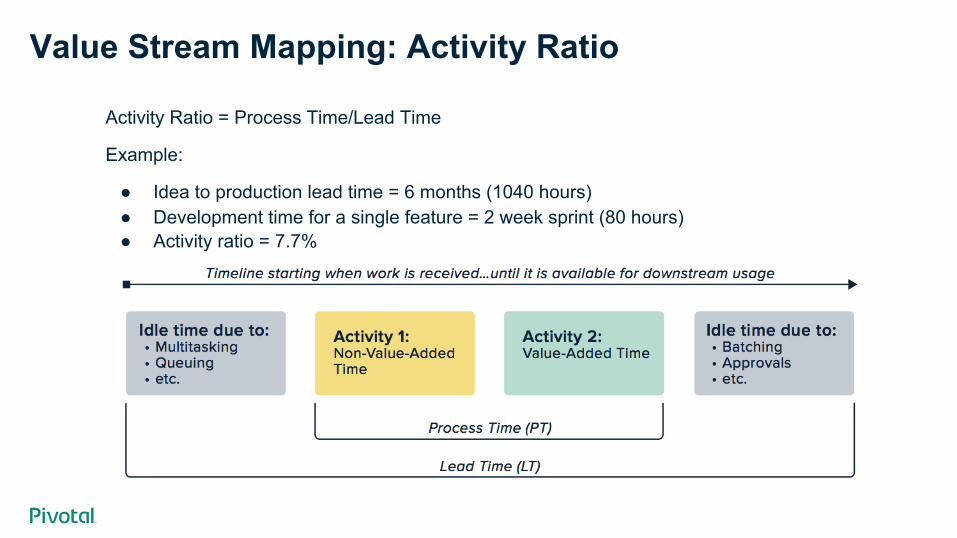
Value Stream Mapping: Activity Ratio
Activity Ratio = Process Time/Lead Time
Example:
● Idea to production lead time = 6 months (1040 hours) ● Development time for a single feature = 2 week sprint (80 hours) ● Activity ratio = 7.7%
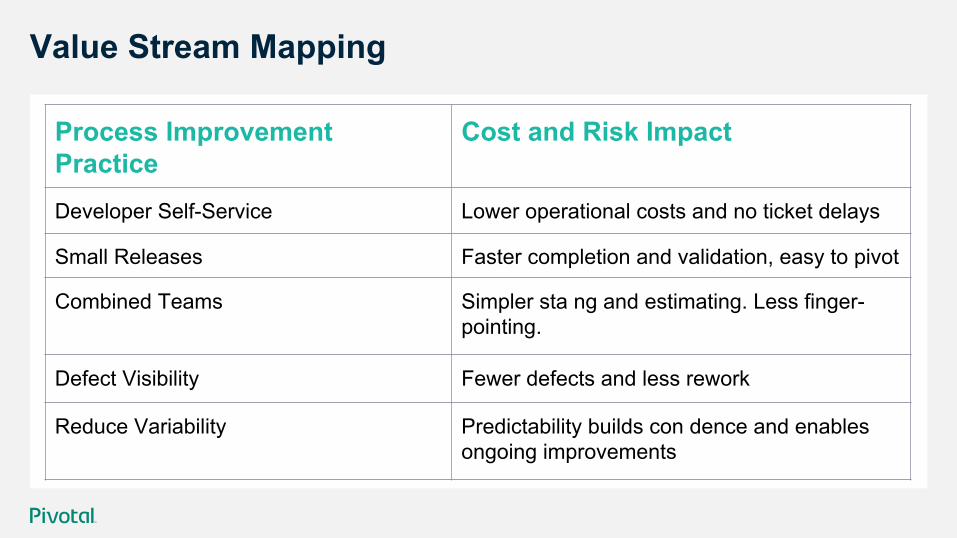
Value Stream Mapping
Process Improvement Practice
Cost and Risk Impact
Developer Self-Service Lower operational costs and no ticket delays
Small Releases Faster completion and validation, easy to pivot
Combined Teams Simpler sta ng and estimating. Less finger-pointing.
Defect Visibility Fewer defects and less rework
Reduce Variability Predictability builds con dence and enables ongoing improvements

Cover w/ Image
E.G.: Developer Self-service ● Shift from “push” to “pull” ● Automate creating environments,
updating network changes, adding capacity
● Developers deploy apps
https://youtu.be/04QFKBt6LCI
“Wait-time for a new environment went from 90 days to 15 minutes”
– Andy Zitney, Allstate
10 © 2018 FORRESTER. REPRODUCTION PROHIBITED.
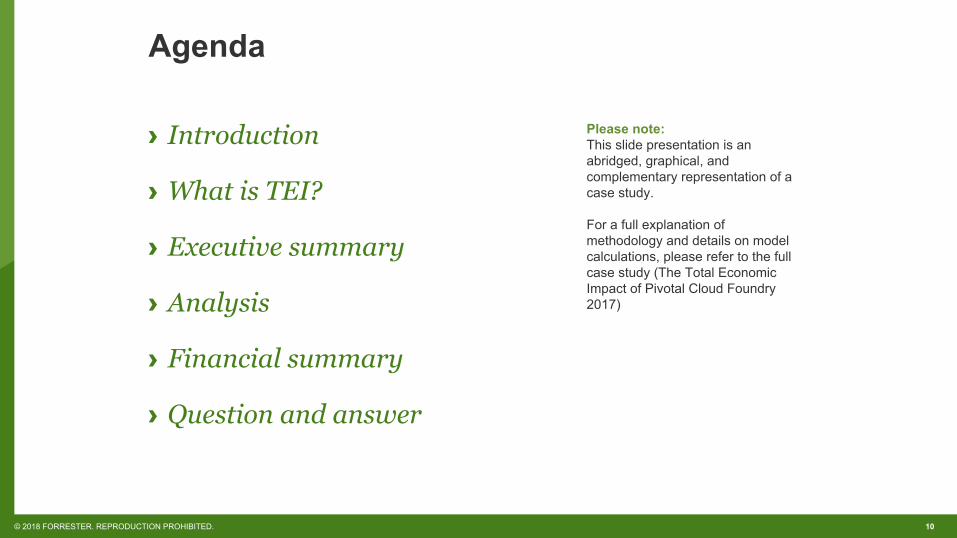
Agenda
› Introduction
› What is TEI?
› Executive summary
› Analysis
› Financial summary
› Question and answer
Please note: This slide presentation is an abridged, graphical, and complementary representation of a case study. For a full explanation of methodology and details on model calculations, please refer to the full case study (The Total Economic Impact of Pivotal Cloud Foundry 2017)
11 © 2018 FORRESTER. REPRODUCTION PROHIBITED.
What is TEI? Background and methodology
12 © 2018 FORRESTER. REPRODUCTION PROHIBITED. Source: The Total Economic Impact Of Pivotal Cloud Foundry, October 2017
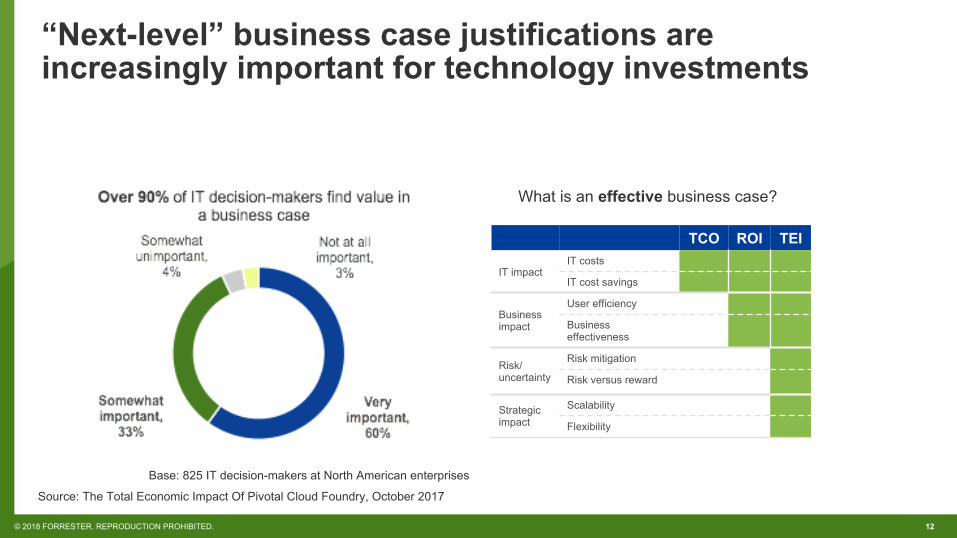
“Next-level” business case justifications are increasingly important for technology investments
TCO ROI TEI
IT impact IT costs IT cost savings
Business impact
User efficiency Business effectiveness
Risk/ uncertainty
Risk mitigation Risk versus reward
Strategic impact
Scalability Flexibility
What is an effective business case?
Base: 825 IT decision-makers at North American enterprises
13 © 2018 FORRESTER. REPRODUCTION PROHIBITED. Source: The Total Economic Impact Of Pivotal Cloud Foundry, October 2017
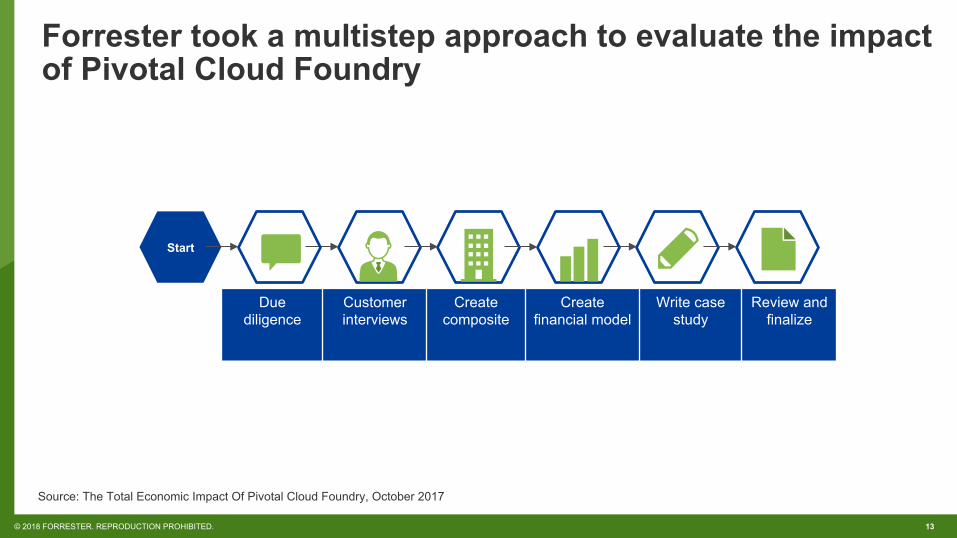
Forrester took a multistep approach to evaluate the impact of Pivotal Cloud Foundry
Start
Due diligence
Customer interviews
Create composite
Create financial model
Write case study
Review and finalize
14 © 2018 FORRESTER. REPRODUCTION PROHIBITED. Source: The Total Economic Impact Of Pivotal Cloud Foundry, October 2017
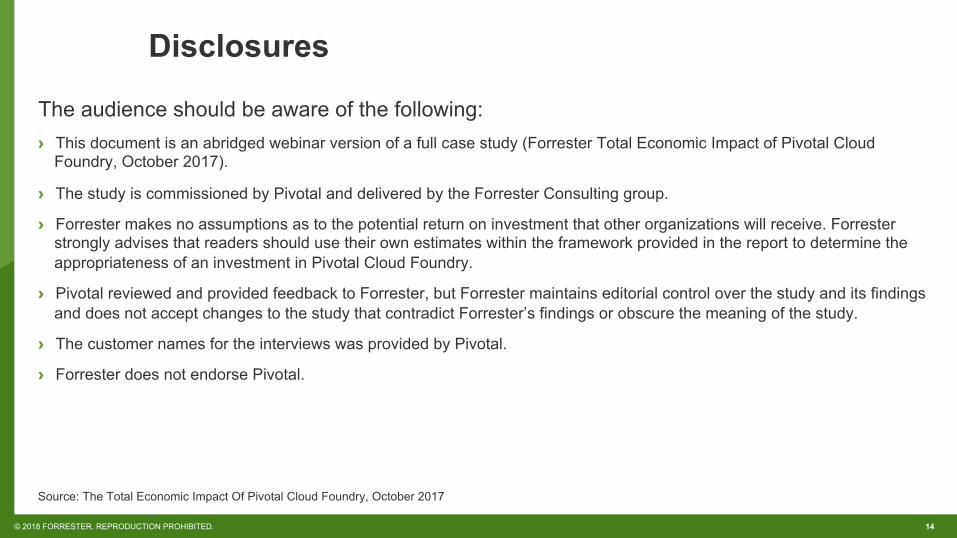
Disclosures The audience should be aware of the following: › This document is an abridged webinar version of a full case study (Forrester Total Economic Impact of Pivotal Cloud
Foundry, October 2017). › The study is commissioned by Pivotal and delivered by the Forrester Consulting group. › Forrester makes no assumptions as to the potential return on investment that other organizations will receive. Forrester
strongly advises that readers should use their own estimates within the framework provided in the report to determine the appropriateness of an investment in Pivotal Cloud Foundry.
› Pivotal reviewed and provided feedback to Forrester, but Forrester maintains editorial control over the study and its findings and does not accept changes to the study that contradict Forrester’s findings or obscure the meaning of the study.
› The customer names for the interviews was provided by Pivotal. › Forrester does not endorse Pivotal.

15 © 2018 FORRESTER. REPRODUCTION PROHIBITED.
Executive summary High-level findings
16 © 2018 FORRESTER. REPRODUCTION PROHIBITED. Source: The Total Economic Impact Of Pivotal Cloud Foundry, October 2017
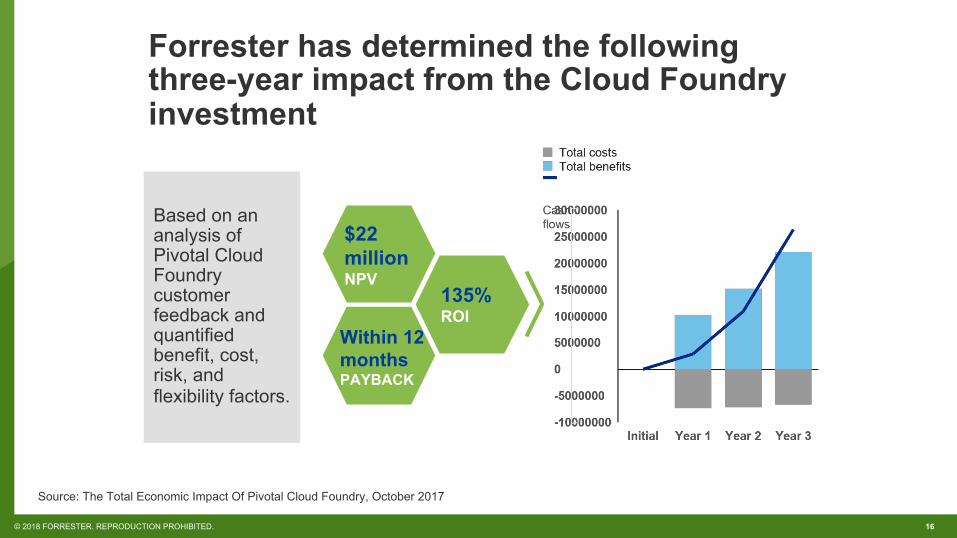
Forrester has determined the following three-year impact from the Cloud Foundry investment
Based on an analysis of Pivotal Cloud Foundry customer feedback and quantified benefit, cost, risk, and flexibility factors.
$22 million NPV
135% ROI
Within 12 months PAYBACK
17 © 2018 FORRESTER. REPRODUCTION PROHIBITED.
Analysis Customer journey and key results

18 © 2018 FORRESTER. REPRODUCTION PROHIBITED. Source: The Total Economic Impact Of Pivotal Cloud Foundry, October 2017
Forrester interviewed 4 Pivotal Cloud Foundry customers
COMPANY #1
COMPANY #2
COMPANY #3 Financial services,
100 developers and 300 applications
COMPANY #4 Wireless communications,
200 developers and 300 applications
Telecommunications, 1,500 developers and 400 applications
Consumer electronics, 350 developers and around 250 major applications
19 © 2018 FORRESTER. REPRODUCTION PROHIBITED. Source: The Total Economic Impact Of Pivotal Cloud Foundry, October 2017
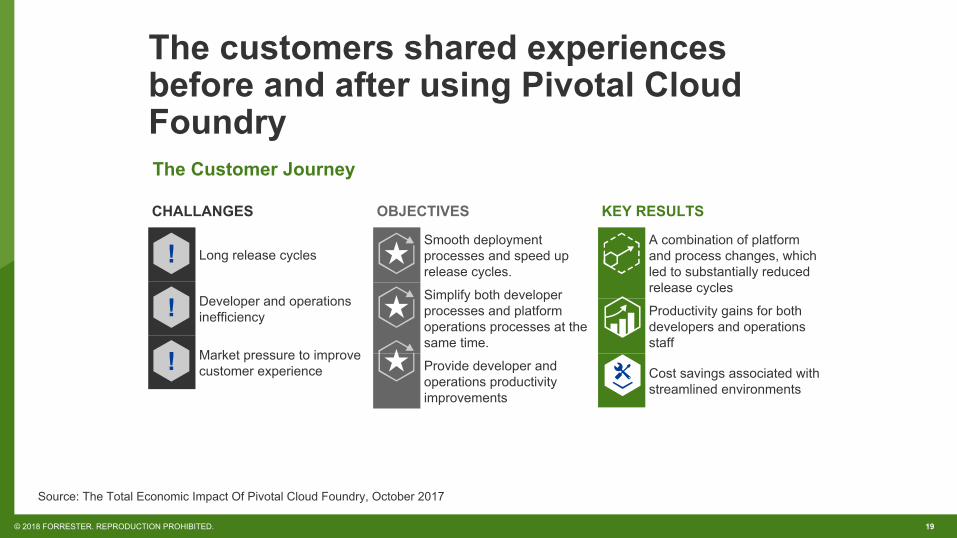
CHALLANGES
Long release cycles
Developer and operations inefficiency
Market pressure to improve customer experience
The customers shared experiences before and after using Pivotal Cloud Foundry
OBJECTIVES Smooth deployment processes and speed up release cycles. Simplify both developer processes and platform operations processes at the same time. Provide developer and operations productivity improvements
KEY RESULTS A combination of platform and process changes, which led to substantially reduced release cycles
Productivity gains for both developers and operations staff
Cost savings associated with streamlined environments
The Customer Journey

20 © 2018 FORRESTER. REPRODUCTION PROHIBITED. Source: The Total Economic Impact Of Pivotal Cloud Foundry, October 2017
Interviewees shared the following key results from the Pivotal Cloud Foundry investment
“Customers care a lot about responsiveness. . . . Roughly $20 to $30 million in revenue was at risk if we didn’t
respond with a new technology.” ~Chief information officer, financial services
“On the operational side, with patching there was always a much higher margin for error
when you’re touching servers. With PCF, we don’t have those type of errors.”
~VP of IT, wireless telecommunications

21 © 2018 FORRESTER. REPRODUCTION PROHIBITED. Source: The Total Economic Impact Of Pivotal Cloud Foundry, October 2017
Forrester created a composite organization representative of customer interviewees
$21 Billion ANNUAL REVENUE
20 million customers
500 Developers
Telecommunications
50 Operations staff
5,000 applications
22 © 2018 FORRESTER. REPRODUCTION PROHIBITED. Source: The Total Economic Impact Of Pivotal Cloud Foundry, October 2017
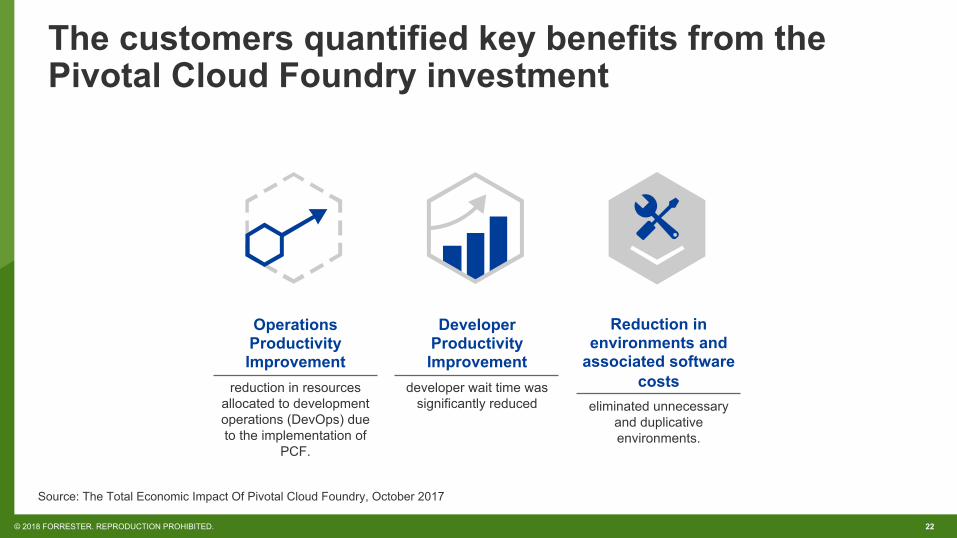
The customers quantified key benefits from the Pivotal Cloud Foundry investment
Operations Productivity Improvement
reduction in resources allocated to development operations (DevOps) due to the implementation of
PCF.
Developer Productivity Improvement
developer wait time was significantly reduced
Reduction in environments and
associated software costs
eliminated unnecessary and duplicative environments.
23 © 2018 FORRESTER. REPRODUCTION PROHIBITED. Source: The Total Economic Impact Of Pivotal Cloud Foundry, October 2017
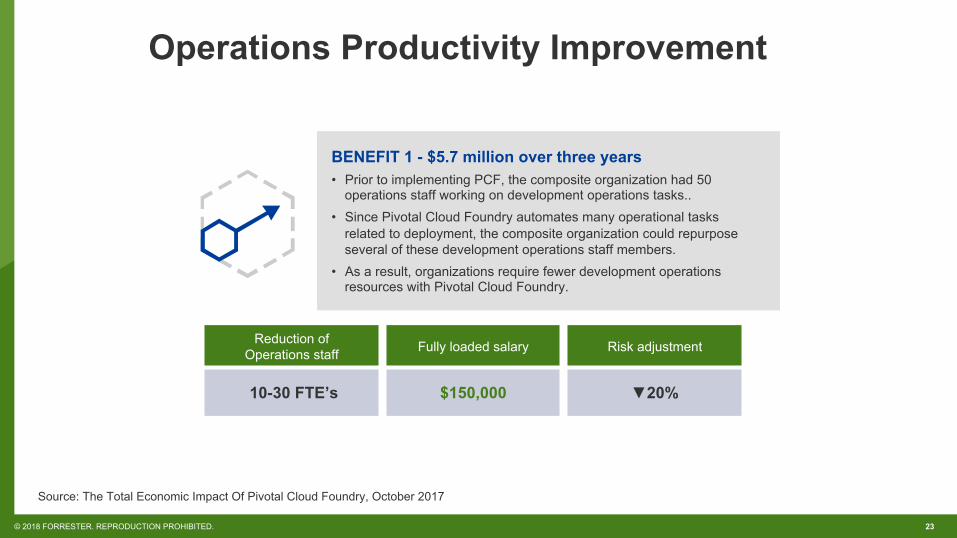
Operations Productivity Improvement
BENEFIT 1 - $5.7 million over three years • Prior to implementing PCF, the composite organization had 50
operations staff working on development operations tasks.. • Since Pivotal Cloud Foundry automates many operational tasks
related to deployment, the composite organization could repurpose several of these development operations staff members.
• As a result, organizations require fewer development operations resources with Pivotal Cloud Foundry.
Reduction of Operations staff Fully loaded salary Risk adjustment
10-30 FTE’s $150,000 ▼20%
24 © 2018 FORRESTER. REPRODUCTION PROHIBITED. Source: The Total Economic Impact Of Pivotal Cloud Foundry, October 2017
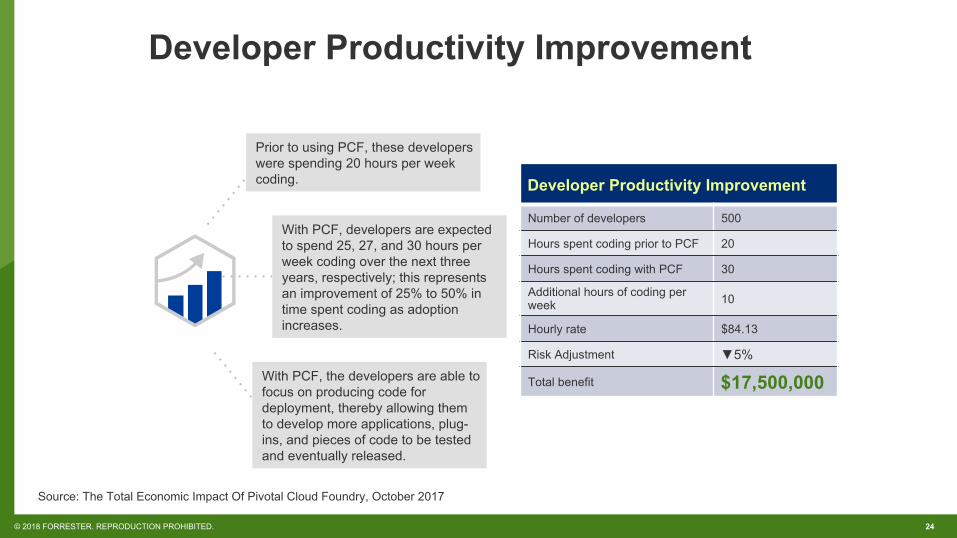
Developer Productivity Improvement
Prior to using PCF, these developers were spending 20 hours per week coding.
With PCF, the developers are able to focus on producing code for deployment, thereby allowing them to develop more applications, plug-ins, and pieces of code to be tested and eventually released.
With PCF, developers are expected to spend 25, 27, and 30 hours per week coding over the next three years, respectively; this represents an improvement of 25% to 50% in time spent coding as adoption increases.
Developer Productivity Improvement Number of developers 500 Hours spent coding prior to PCF 20 Hours spent coding with PCF 30 Additional hours of coding per week 10 Hourly rate $84.13 Risk Adjustment ▼5% Total benefit $17,500,000

25 © 2018 FORRESTER. REPRODUCTION PROHIBITED. Source: The Total Economic Impact Of Pivotal Cloud Foundry, October 2017
Reduction In Environments And Associated Software Costs
.After implementing PCF, the composite organization was able to consolidate its application development cycle by eliminating the need for several nonproduction phases like the test, stage, load, and demo environments. . Therefore, the organization was able to reduce the number of the nonproduction environments and the virtual machines (VMs) associated with these environments
Reduction in Environments: 30% of total benefits
26 © 2018 FORRESTER. REPRODUCTION PROHIBITED. Source: The Total Economic Impact Of Pivotal Cloud Foundry, October 2017
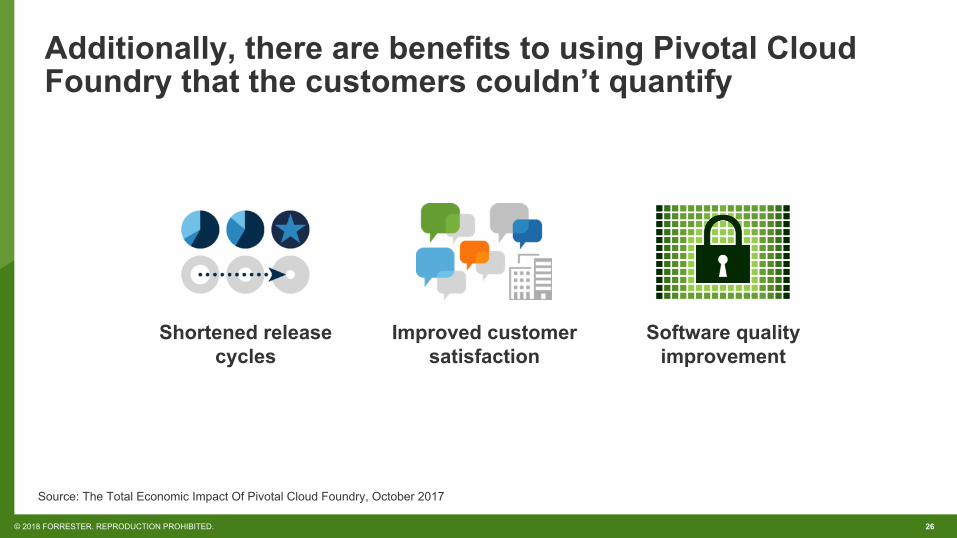
Shortened release cycles
Improved customer satisfaction
Software quality improvement
Additionally, there are benefits to using Pivotal Cloud Foundry that the customers couldn’t quantify
27 © 2018 FORRESTER. REPRODUCTION PROHIBITED. Source: The Total Economic Impact Of Pivotal Cloud Foundry, October 2017
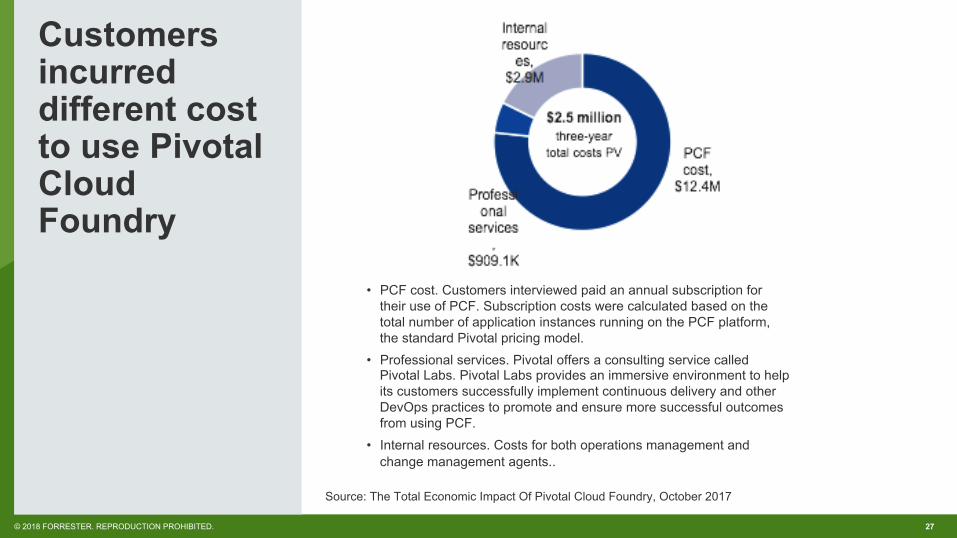
Customers incurred different cost to use Pivotal Cloud Foundry
• PCF cost. Customers interviewed paid an annual subscription for their use of PCF. Subscription costs were calculated based on the total number of application instances running on the PCF platform, the standard Pivotal pricing model.
• Professional services. Pivotal offers a consulting service called Pivotal Labs. Pivotal Labs provides an immersive environment to help its customers successfully implement continuous delivery and other DevOps practices to promote and ensure more successful outcomes from using PCF.
• Internal resources. Costs for both operations management and change management agents..
28 © 2018 FORRESTER. REPRODUCTION PROHIBITED. Source: The Total Economic Impact Of Pivotal Cloud Foundry, October 2017
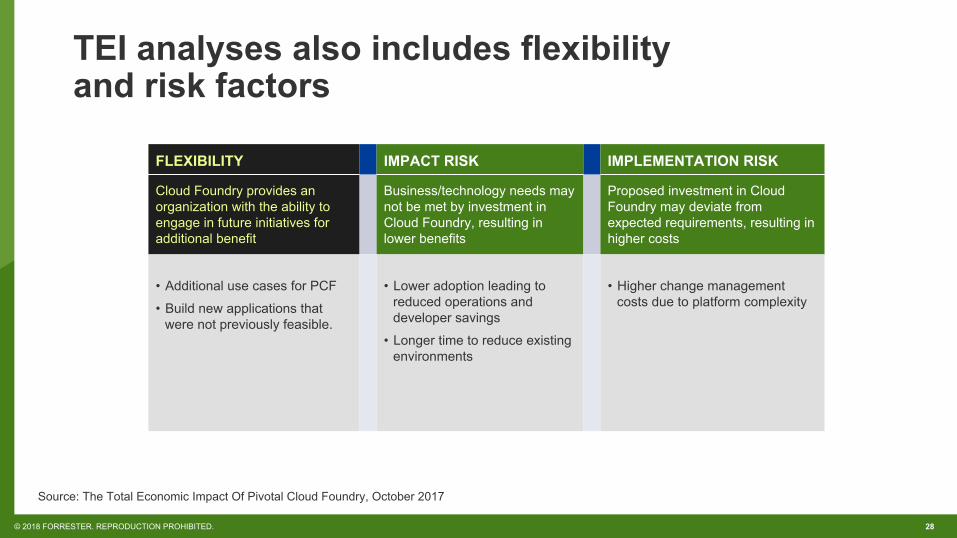
TEI analyses also includes flexibility and risk factors
FLEXIBILITY IMPACT RISK IMPLEMENTATION RISK Cloud Foundry provides an organization with the ability to engage in future initiatives for additional benefit
Business/technology needs may not be met by investment in Cloud Foundry, resulting in lower benefits
Proposed investment in Cloud Foundry may deviate from expected requirements, resulting in higher costs
• Additional use cases for PCF • Build new applications that
were not previously feasible.
• Lower adoption leading to reduced operations and developer savings
• Longer time to reduce existing environments
• Higher change management costs due to platform complexity

29 © 2018 FORRESTER. REPRODUCTION PROHIBITED.
Financial summary Three-year model
30 © 2018 FORRESTER. REPRODUCTION PROHIBITED. Source: The Total Economic Impact Of Pivotal Cloud Foundry, October 2017
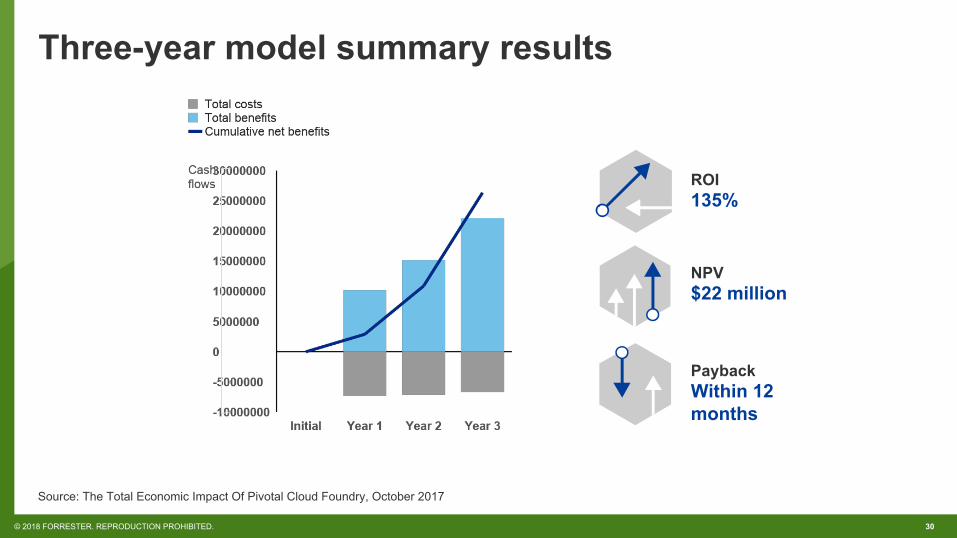
Three-year model summary results
ROI 135%
NPV $22 million
Payback Within 12 months
The Role of Directional Metrics
Key Concepts

© Frank Schulenburg / CC BY-SA 3.0
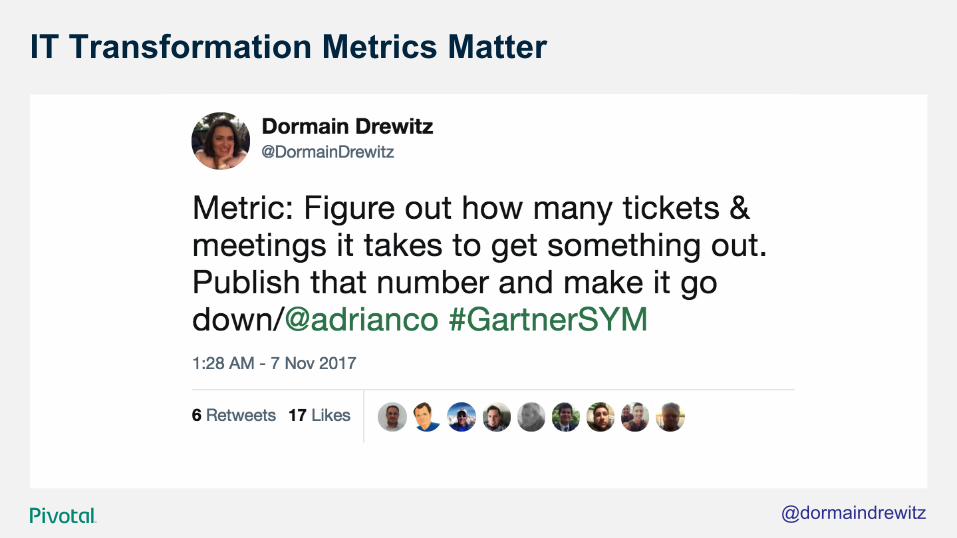
IT Transformation Metrics Matter
@dormaindrewitz
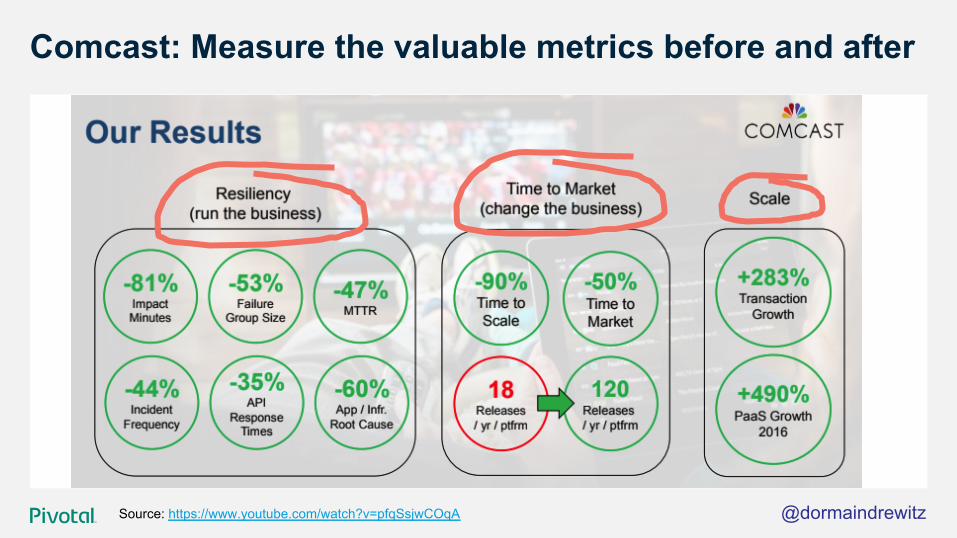
Comcast: Measure the valuable metrics before and after
Source: https://www.youtube.com/watch?v=pfqSsjwCOqA @dormaindrewitz
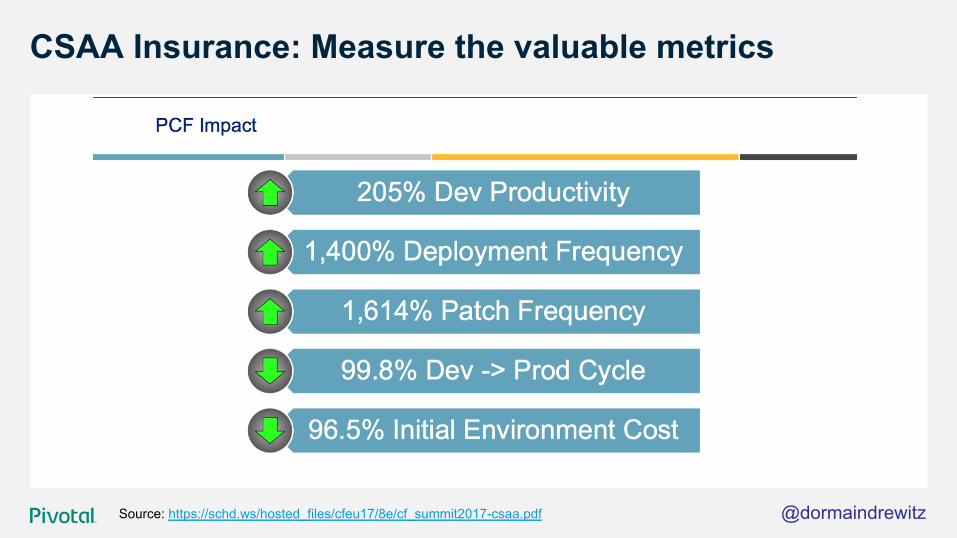
CSAA Insurance: Measure the valuable metrics
Source: https://schd.ws/hosted_files/cfeu17/8e/cf_summit2017-csaa.pdf @dormaindrewitz
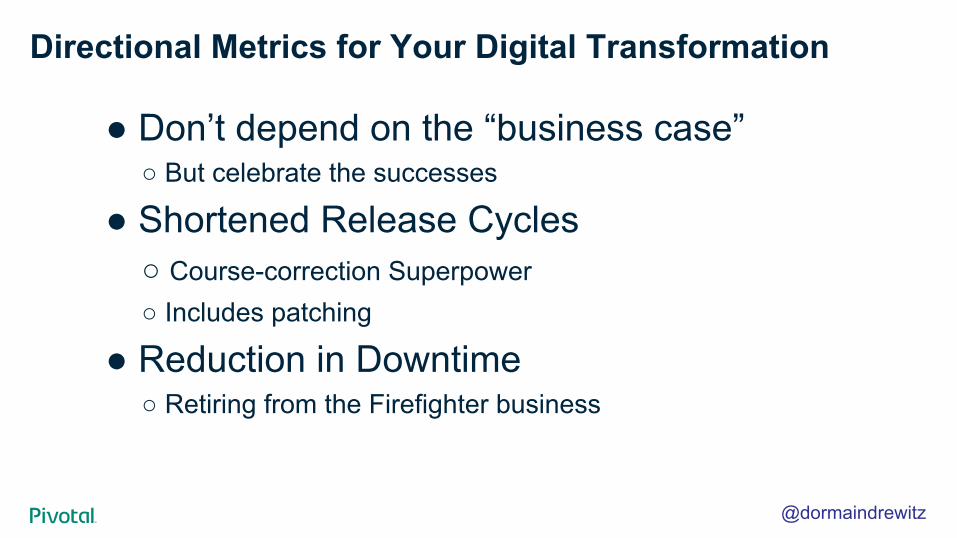
Directional Metrics for Your Digital Transformation
● Don’t depend on the “business case”
○ But celebrate the successes
● Shortened Release Cycles
○ Course-correction Superpower
○ Includes patching
● Reduction in Downtime
○ Retiring from the Firefighter business
@dormaindrewitz
Making Metrics Known
Key Concepts
Cover w/ Image
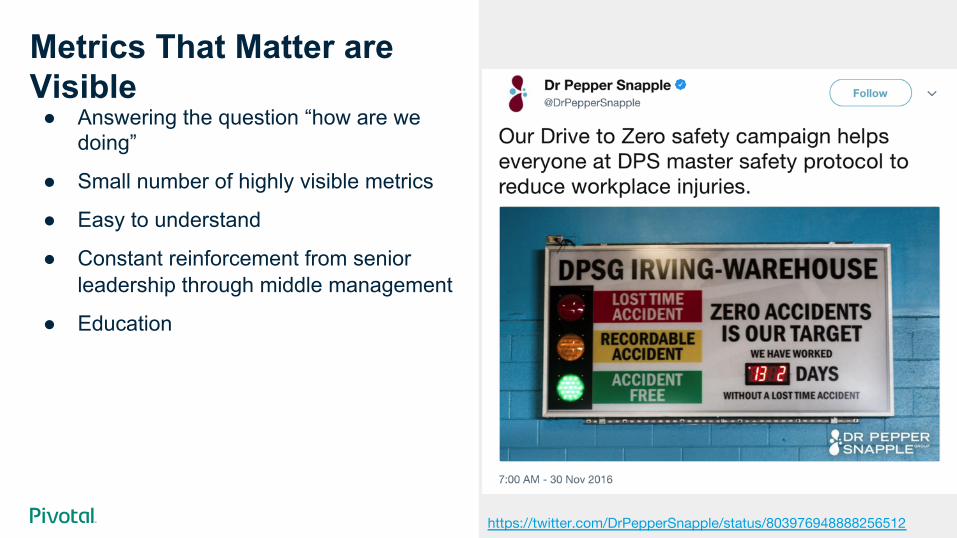
Metrics That Matter are Visible ● Answering the question “how are we
doing”
● Small number of highly visible metrics
● Easy to understand
● Constant reinforcement from senior leadership through middle management
● Education
https://twitter.com/DrPepperSnapple/status/803976948888256512
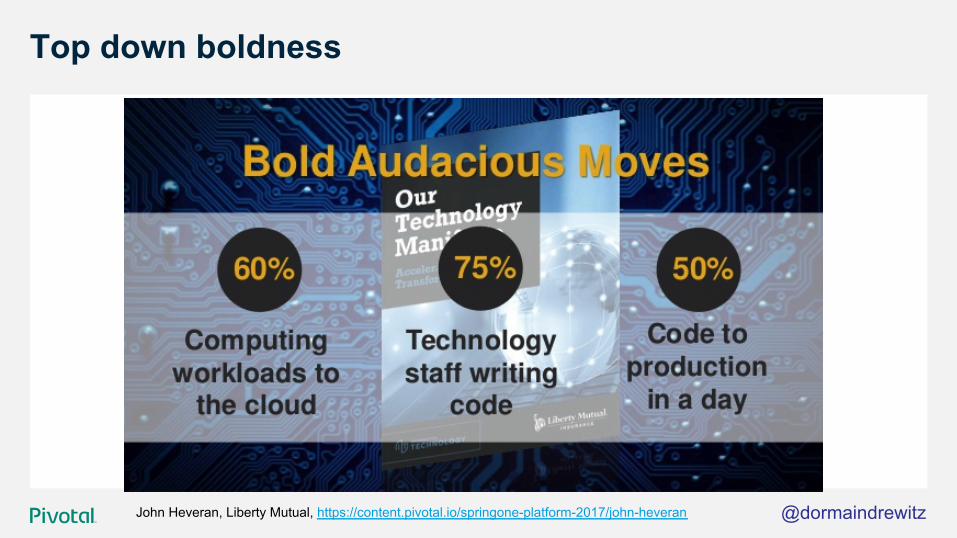
Top down boldness
John Heveran, Liberty Mutual, https://content.pivotal.io/springone-platform-2017/john-heveran @dormaindrewitz

40 © 2018 FORRESTER. REPRODUCTION PROHIBITED.
Question and answer
Transforming How The World Builds Software
© Copyright 2017 Pivotal Software, Inc. All rights Reserved.