the massachusetts undergraduate journal of economics
TRANSCRIPT

The Massachusetts Undergraduate Journal of Economics
Volume 5 | Fall 2019

Massachusetts Undergraduate Journal of Economics Undergraduate Economics Club
University of Massachusetts Amherst
Volume 5
Fall 2019
Massachusetts Undergraduate Journal of Economics 2019
Developing the Developmental State: Nigeria, NEEDS, and National Economic Planning Jon Blum, University of Massachusetts Amherst 3
Depression through Different Lenses: The Schools of Economic Thought Respond to Recession Caroline Greeley, University of Massachusetts Amherst 15
Postal Remittance Services & Regulation As a Policy Tool for Immigration Will Harmer, University of Massachusetts Amherst 22
Did World War II Help the US End the Great Depression? Yizhen (Lucy) Liu, Mount Holyoke College 42
The Federal Reserve System: A Look at Our Country’s Premier Financial Institution Abhay Partap Singla, University of Massachusetts Amherst 50
Decisions in the face of migrant stocks: A disaggregated aid analysis Kimberly Zhang, Smith College 60

About the MUJE
The Massachusetts Undergraduate Journal of Economics is published by the Undergraduate
Economics Club in collaboration with the Department of Economics at the University of
Massachusetts Amherst. Submissions are invited from undergraduate students in the
Massachusetts public higher education system and in the Five Colleges.
2018-2019 Editorial Board
Barkha Bhandari
Jonathan Blum
Amanda Desmond
Allan Desrochers
George Fox
Madeline Griffith
Jacqueline Hayes
Nolan Kimball
Nic Masek
Yuriy Muravia
Ayachi Sharma
Derek Walker
Correspondence & Website
Please address submissions to the MUJE and all correspondence with authors to
More information about the MUJE and current and previous editions may be found at
https://www.umass.edu/economics/undergraduate/opportunities/muje
2

Developing the Developmental State:
Nigeria, NEEDS, and National Economic Planning Jon Blum
University of Massachusetts Amherst
Abstract
Nigeria’s National Economic Empowerment and Development Strategy (NEEDS) was created under the Obasanjo government to propel Nigeria on a path to economic growth and poverty reduction and ran from 2004 to 2007. To assess NEEDS in relation to poverty reduction and growth, I look at the historical context of Nigeria’s previous economic development plans. I then analyze NEEDS and its strategy and capacity to reduce poverty. Examining NEEDS provides insight on the prospects of further economic planning in Nigeria. The impact of NEEDS has further implications to Nigeria’s Vision 2020, the government’s current development strategy. My findings suggest that economic planning has an essential role for the future of Nigeria’s economic development.
Introduction
Nigeria is Africa’s most populous country with nearly 186 million people. Its GDP of $405
billion makes it Africa’s largest economy. Since 2000, life expectancy has increased steadily
from 46 to 53 years, and child mortality fell from 187 per 1000 live births to 104 (The World
Bank, 2019).
Despite these promising statistics, Nigeria’s economic progress has not reached a
substantial amount of the population. In 2018, Nigeria surpassed India as the country with the
most people living under the $1.90-per-day poverty line (Adebayo, 2018). With a Gini coefficient
of .43, Nigeria remains highly unequal (UNDP, 2016).
Proportionally, Nigeria’s economy is led by the service sector, which comprises around
30% of its GDP. Next follows the agriculture sector (24%), the oil industry (18%), and then its
flailing manufacturing sector (9%). Oil makes up 55% of the country’s total export revenues
(Kingsley, 2017).
National politics are dominated by the All Progressives Congress (APC) which in 2015
defeated the previously dominant Peoples’ Democratic Party (PDP). In 2019, Nigeria will hold its
sixth general election since the establishment of the Fourth Republic. Olusegun Obasanjo’s
presidency, from 1999 to 2007, sought to put Nigeria on a path to stable economic development
3

after the turmoil of previous decades. An important aspect of his second term as president was
the rollout of the National Economic Empowerment and Development Strategy (NEEDS).
NEEDS became Nigeria’s guide for its economic policies from 2004 to 2007 and suggested to
the international community that the state was prepared to play a positive role in the economy.
Since such plans require an extensive amount of time and resources it is important to
answer the age-old question: is it worth it?
My findings suggest that even with the shortcomings of past plans, including NEEDS to
reduce poverty and develop the country, Nigeria is better off pursuing development plans that
serve the interest of the country’s poorest. The state should not be afraid to play a larger role in
the economy.
Section II explores the historical context of the role Nigeria’s state has played in creating
national development plans and the lead up to NEEDS. Sections III through V discusses
NEEDS, and its impact with special attention given to its role in poverty reduction and national
development planning. Section VI summarizes Nigeria’s development planning in terms of its
historical context, impact, and legacy.
Historical Context of Nigeria and National Economic Planning
The origin of economic planning in Nigeria begins after the Second World War. Colonial
administrators strived to make the economic environment more attractive for foreign investment.
Thus, in 1946 the government created the Ten-year Development Plan to organize budget
allocations over the following decade. The crux of the plan aimed to increase economic
infrastructure and improve education (Onitiri, 1971). The colonial administration anticipated that
by the end of the plan, transport and communication services would noticeably improve,
increasing the production and export viability of the colony’s cash crops (Ikeanyibe, 2009).
Though infrastructure and education did see some improvements over the course of the
Ten-year Development Plan, it proved to be largely ineffectual at progressing the Nigerian
economy to a more productive phase (Onitiri, 1971).
With the independence movement led by the charismatic Nnamdi Azikiwe on the rise,
the educated political class demanded a national government that would serve the economic
interests of the Nigerian people. In 1960, when the British relinquished their political authority
over the country, a national government made up of Nigerians finally had their chance.
Nigeria’s First National Development Plan lasted from 1962 to 1968. The goal of the plan
was to take the country to a stage where it can self-finance its own development through the
4
accumulation of national savings (Onitiri, 1971). Though foreign experts participated in the
crafting of the First National Development Plan, only a handful of Nigerian administrators were
left to put the plan into action, leading to a lack of proper coordination in properly implementing
desired projects (Ikeanyibe, 2009).
As the 1960s progressed, Nigeria began to run a balance of payments deficit—draining
the much-needed funds for development. On top of that, a military coup in 1966 led to the
outbreak of the Nigerian Civil War (1967-1970), bringing the immediate focus on national
development to a halt (Onitiri, 1971).
From the chaos of the Civil War emerged the Second National Development Plan of
1970-1974 under the regime of Yakubu Gowon, who took power after the coup in 1966. The
Gowon regime sought to have a more aggressive role in developing the economy than did past
governments. The Second National Development laid out five goals (Ikeanyibe, 2009, 201):
1. a united, strong and self-reliant nation; 2. a great and dynamic economy; 3. a just and egalitarian society; 4. a land of bright and full opportunities; and 5. a free and democratic society
Whereas, the creation of the First National Development Plan was closed off to an elite
group of administrators, its successor received input from boards consisting of members of
academia, business, and other parts of civil society (Ikeanyibe, 2009). Issues pertaining to
inequality and promoting the agricultural sector were highlighted much more significantly in the
second plan than the first. Another core component of the second plan was the Nigerianization
of large businesses. Public ownership of financial institutions and insurance companies
increased, and dependence foreign investment was to be limited (Ibietan, et al. 2013).
The oil industry was central to this plan, as about half of Nigeria’s export revenues at the
time came from the exportation of oil (Onitiri, 1971). Yet, the country’s reliance on oil as well as
systemic corruption engendered the lack of needed funds to finance the newly announced
projects from the Second Development Plan.
Nigeria from 1975 to 1980, experienced a series of coups including one by future Fourth
Republic president Olusegun Obasanjo. It was also the period of the country’s Third
Development Plan (Ibietan, et al. 2013). The plan looked to continue the Nigerianization of the
previous plan as well as economic diversification, agriculture investment intensification and
universal primary education. However, even though agriculture was a key component of the
5

plan, little funds ended up going towards the country’s most populated sector. Five percent of
the total funds went toward the agrarian sector, and less than twelve percent was spent on
social welfare measures. It should be no surprise that during this period agricultural output fell
by two percent per year. Thus, though the Third Development Plan saw remarkable advances in
the growth in manufacturing and construction, it overall failed to meet its visionary objectives
(Ibietan, et al. 2013).
Two years after Shehu Shagari was sworn in as the elected president of the Second
Republic in 1979, his government launched Nigeria’s Fourth National Development Plan which
would be Nigeria’s last pre-Fourth Republic grand national planning scheme (Falola et al. 2008).
One of the notable aims of the new plan was export promotion. The total cost of planned public
and private investment at N82 billion signified that this would be the country’s boldest national
economic program. For the first time, local governments were given a key role with the
implementation of various components of the plan. Though there were noticeable improvements
due to increased investments in infrastructure, education and healthcare, many of programs
faltered due to a lack of enough funds, drawing from the collapse of oil prices in the 1980s
(Ibietan, et al. 2013).
Table 1 in the Appendix compares the economic growth rates during the time when each
of the four economic plans were in place. The Second Plan generated the highest annual
growth rate at about 8% per year, while the economy during the First and Third plans grew at
about 5% per year. Meanwhile, the Fourth plan struggled to create any substantial growth with a
yearly rate at a mere 1%.
Additionally, even with the liberalizing of national politics, corruption in Nigeria became
more widespread under the Second Republic. Numerous instances of corruption occurred in
federal administrations such as the National Youth Service Corps, the Nigerian External
Telecommunications, the Federal Mortgage Bank, the Federal Capital Territory Administration,
and the Central Bank of Nigeria (Falola et al. 2008).
In 1983, the Second Republic came to a swift end when another future president under
the Fourth Republic, Muhammadu Buhari, took power via military coup. Buhari was disposed by
Ibrahim Babangida two years later in 1985 (Falola et al. 2008).
Babangida’s regime started a period in Nigeria’s history where the state took a more
hands-off approach to national development. With external debts approaching N22 billon, the
Nigerian government engaged in structural adjustment in 1986 (Ikeanyibe, 2009). The structural
6
adjustment program (SAP) had three core objectives (Ibietan, et al. 2013, 304):
1. To restructure and diversify the productive base of the economy in order to reduce dependence on the oil sector and on imports;
2. to achieve fiscal and balance of payments viability over the period; to lay the basis for a sustainable non-inflationary growth;
3. to reduce the dominance of unproductive investments in the public sector by improving public sector efficiency and enhancing the growth potential of the private sector.
The devaluation of the naira, the removal of subsidies, privatization, and the
deregulation of interest rates were the core policies that were enacted during this era. The
results were not as remarkable as promised. Along with this, interest rates skyrocketed, making
it incredibly difficult for business and individuals to take out loans, the manufacturing sector
crumbled, and rural poverty and unemployment grew.
After the failure of structural adjustment, the Nigerian government resorted back to at
least some form of national economic planning with the creation of Rolling Plans from 1990 to
1998. The Rolling Plans would indicate short term and medium-term budget allocations. The
1996 perspective plan was created under the military government of Sani Abacha which would
set the foundation for Vision 2010. Vision 2010 encompassed short-term, medium-term, and
long-term planning that would be initiated over the following fifteen years. However, after
Abacha died in 1998, the enthusiasm for Vision 2010 was lost (Ikeanyibe, 2009).
With the creation of the Fourth Republic and the initiation of democratic elections in
1999, former dictator and now democratically elected president Olusegun Obasanjo looked to
define a new era for Nigeria’s economic development. The National Economic Empowerment
and Development Strategy (NEEDS) became the central document for the nation’s
development.
The National Economic Empowerment and Development Strategy (NEEDS)
Preceding NEEDS was the National Economic Direction (1999-2003). The measure
combined sweeping privatization and deregulation with increased spending on social welfare
programs. Yet, the enactment of these promised reforms was slow even though the government
was receiving new streams of funds from the liquidation of public enterprises, rising oil prices,
and the repossession of Abacha’s stolen wealth (Ikeanyibe, 2009).
After winning reelection in 2003, Obasanjo and other government officials declared it
7

was time for a newer, bolder plan to guide Nigeria’s development. Thus, came the creation of
the National Economic Empowerment and Development Strategy (NEEDS). According to
President Obasanjo, the stated goal of NEEDS was to: “… mobilize the resources of Nigeria to
make a fundamental break with the failures of the past and bequeath a united and prosperous
nation to generations to come (IMF, 2005, iii).” The four priorities of NEEDS focused on (IMF,
2005, iii):
1. laying a solid foundation for sustainable poverty reduction, 2. employment generation, 3. wealth creation, 4. value reorientation
NEEDS along with its state version, the State Economic Empowerment and
Development Strategy (SEEDS), and localized version, the Local Government Economic
Empowerment and Development Strategy (LEEDS) sought to unify the country on a path of
inclusive development. On paper, NEEDS strived for a five percent decrease in poverty per year
from 2004 to 2007 (IMF, 2005). While NEEDS acknowledged the importance of private sector
growth, it also accepted the critical role of the government in tackling poverty and that it is the
government’s duty to ensure that every Nigerian “has the right to adequate water and sanitation,
nutrition, clothing, shelter, basic education, and health care, as well as physical security and the
means of making a living” (Ugwu, 2012, 26).
Was NEEDS the key to poverty reduction? Could a second-term democratically elected
government finally bring prosperity to country’s most unfortunate?
NEEDS and Poverty Reduction
Figure 1 in the Appendix shows Nigeria’s relative poverty rates from 1980 to 2010. From
1980 to 2004 the rate of poverty doubled from 27% to 54%. Six years after NEEDS, poverty
again increased to 69%. What went wrong with the government’s poverty reduction
strategy—one of the core focuses of NEEDS?
According to Ugwu (2012), the greatest impediment to poverty reduction was NEEDS’
dependence on the private sector. Since the poor are unable to participate in many market
activities, the private sector has little incentive to engage with the country’s worse off. Instead,
8

Ugwu argues for a more active developmental state which plays a more direct role in economic
affairs than what is prescribed through NEEDS. As Ugwu states:
Whether we opt for hard or soft state, the Nigerian state must retain the capacity to choose ―winners and allocate resources preferentially according to an overall plan of development that answers to national priority. And in our situation such a priority is drastic reduction of general poverty and class, gender, and region-specific poverty. (p. 47)
Ugwu also identifies national leadership as a critical component to NEEDS’ failure to
ameliorate poverty. He identifies the lack of credibility of the Obasanjo government, especially
after the “rigged” 2003 election, as the source of the unwillingness of the national government to
properly reduce poverty. He cites the failure of the government to effectively engage with civil
society and Obasanjo’s despotic tendencies as a cause for social and labor unrest against
much of the government’s agenda (For more on labor mobilization during this period see Eze,
2014). Furthermore, Ugwu sees policies such as land reform, progressive taxation, and
providing credit access for the poor as key measures for poverty reduction.
Additionally, Ugoani (2017) indicates that corruption was the most important factor that
limited poverty reduction. He describes how billions of naira meant for development projects
have been siphoned off by government officials. A strategy of good governance must precede
the implementation of pro-poor programs in order to maximize poverty reduction.
Furthermore, Ugoani also presents the shortcomings of the government’s education
program initiated under NEEDS as an indictment of the government’s failure to execute a
long-term poverty reduction strategy. He finds that even after the enactment of compulsory
education, millions of Nigerians are not in schools and eighty-percent of the teachers do not
have the necessary skills. This, along with the failure to supply enough universities for its
post-secondary students, were critical for Nigeria to miss the education targets of the Millennium
Development Goals.
Similarly, Innocent, et al. (2014) presents the problem of poverty reduction in Nigeria as
a problem of poor governance. Just as during NEEDS and past periods, decision making about
how to address poverty is left to an elite few. The people who are the targets of the
government’s new policies are rarely, if ever, consulted. Instead, while ambitious anti-poverty
programs are unveiled every so often, they never receive the proper funding nor administration
to successfully implement these policies.
9

NEEDS and National Development Planning
One of the most influential proponents of national planning for developing countries after
the Second World War was the Polish economist Paul Rosenstein-Rodan. Why should states
engage in economic planning? Rosenstein- Rodan (1963, 123) explains:
The free and unimpeded mechanism of market forces would lead to a maximum national income according to the liberal classical doctrine. Any conscious deliberate active economic policy designed to influence the amount and the composition of investment could not, according to this school, raise national income in the long run. It is our contention that the opposite is true, that an economic policy designed to influence the amount and composition of investment can raise the rate of economic growth and increase national income. In addition, it can also aim at realizing other desirable social objectives which market forces alone—even according to liberal doctrine— could not achieve.
If economic planning provides the answer for developing countries, how come Nigeria
failed to see many of the promised benefits? Is this an indictment of planning itself? Or are the
shortcomings unique to Nigeria’s institutional arrangements?
The latter seems to be a more appropriate answer than the former. As Wade (1989)
describes, economic planning was central to the success of the post-war East Asian economies.
Clear economic objectives matched with a strong state that will go as far as needed to discipline
the private sector is a recipe for grand economic transformation. Also, as Chang (2002) details,
developing countries during the pre-1980s planning era grew much faster than the post-1980s
when developing plans worldwide were abandoned.
Analyzing the Chilean economy under Allende, Rosenstein-Rodan (1974) designates the
poor economic outcomes of the time as a result of the lack of smart, creative planning, not
because of planning itself. (For how the economic elites played a decisive role in destabilizing
the economy during the Allende government see Girardi and Bowels, 2017).
Ikeanyibe (2009) notes though the past development plans were unsuccessful due to a
variety of reasons such as corruption, unpreparedness, and lack of interest, NEEDS failed at
sustained development because it was more interested in promoting a model of development
that satisfied the desires of the international financial institutions and western developed
economies rather than serve the interest of the Nigerian people.
10

As stated in the previous section, Ugwu (2012) recommends that the Nigerian state
should be so committed to national development, that in doing so the state becomes the prime
instigator for inclusive economic prosperity. Yes, development planning is still very much
practical for Nigeria’s future if government officials are willing to apply it in a way that puts
poverty reduction and structural transformation at the forefront. Planning can happen without the
mass corruption and carelessness of the past plans, and without the rigid ideology that confined
foreign imposed policies such as the structural adjustment programs.
Vision 2020, Nigeria’s current development initiative, has the admirable goals of a life
expectancy of seventy years, a 40% contribution of manufacturing to GDP, among other things
(Ibietan, et al. 2013). Is Nigeria currently capable of meeting these goals? Likely not. Though,
sometime in the future, Nigeria may one day have the plan-focused developmental state that its
people deserve.
Conclusion
Nigeria has had a long history with development planning. The four grand economic
planning programs launched in the 1960s, 1970s, and 1980s indicated some level of
enthusiasm for state-empowered development. With the introduction of structural adjustment in
the 1980s, proactive and extensive planning came to a halt. The Obasanjo’s government
initiation of the National Economic Empowerment and Development Strategy (NEEDS) brought
broad government planning back to the forefront of Nigeria’s political economy. However,
NEEDS ultimately failed to deliver many of its promised benefits especially its central
commitment to poverty reduction. This was due to several factors including NEEDS’
conservatism, economic mismanagement, corruption, a lack of communication between the
government and civil society, and not including the voices of the poor in public decision making.
Though Nigeria has struggled with pursuing economic planning in the past, state-led
development planning should still be recognized as a critical aspect of national development for
Nigeria. In fact, the state should be more engaged in economic affairs to meet the needs of its
people, especially its poorest.
11

Works Cited
Adebayo, B. (2018). “Nigeria Overtakes India in Extreme Poverty Ranking” .
https://edition.cnn.com/2018/06/26/africa/nigeria-overtakes-india-extreme-poverty-intl/i
ndex.html
Chang, H. (2002). Kicking Away the Ladder . London: Anthem Press.
Dauda, R. S. (2017). “Poverty and Economic Growth in Nigeria”. Journal of Poverty, 21(1/3),
61-79. Retrieved from http://www.econis.eu/PPNSET?PPN=1018516077
Eze, O. (2014). “National Economic Empowerment Development Strategies (NEEDS) and
Labour in Nigeria, 2003-2007”. Journal of Good Governance and Sustainable
Development in Africa, 2(2), 152-161.
Girardi, D., & Bowles, S. (2017). “Institutional Shocks and Economic Outcomes: Allende’s
Election, Pinochet’s Coup and the Santiago Stock Market”. UMass Amherst
Economics Working Papers.
H. M. A. Onitiri. (1971). “Economic Planning and Policy: The Nigerian Experience”. Africa
Spectrum, 6(3), 5-9. Retrieved from Periodicals Index Online database. Retrieved from
https://www.jstor.org/stable/40173703
Ibietan, J., & Ekhosuehi, O. (2013). “Trends In Development Planning in Nigeria: 1962-2012”.
Journal of Sustainable Development in Africa, 15(4), 297-311.
Innocent, A., Eikojonwa, O., & Enojo, A. (2014). “Poverty Alleviation Strategies and Governance
in Nigeria”. International Journal of Public Administration and Management Research,
2(2), 98-105.
Kingsley, M. (2017). “The Impact on Economic Growth of Nigeria's Oil Dependency”.
International Institute of Social Sciences.
Marcellus, I. O. (2009). Development Planning in Nigeria: Reflections on the National Economic
Empowerment and Development Strategy (NEEDS) 2003-2007”. Journal of Social
Sciences, 20(3), 197-210. doi:10.1080/09718923.2009.11892740
Nigeria: Poverty Reduction Strategy Paper - National Economic Empowerment and
Development Strategy (2005). International Monetary Fund.
12
Robert Wade. (1989). “What can Economics Learn from East Asian Success?”. The Annals of
the American Academy of Political and Social Science, 505(1), 68-79.
doi:10.1177/0002716289505001006
Rosenstein-Rodan, P. (1963). “Planning Within the Nation”. Annals of Public & Co-Operative
Economy, 34(2-3), 193-207. doi:10.1111/j.1467-8292.1963.tb00050.x
Rosenstein-Rodan, P. (1974, May 1,). “Why Allende Failed”. Challenge, 17, 7-13.
The World Bank. (2018). Country Profile: Nigeria.
http://databank.worldbank.org/data/views/reports/reportwidget.aspx?Report_Name=Co
untryProfile&Id=b450fd57&tbar=y&dd=y&inf=n&zm=n&country=NGA
Ugoani, J. (2017). “Examination of the Impact of National Economic Empowerment and
Development Strategy on Poverty Reduction in Nigeria”. International Journal of
Economics and Financial Research, 3(5), 65-75. Retrieved from
http://arpgweb.com/?ic=journal&journal=5&info=aims
Ugwu, O. C. (2012). “National Economic Empowerment Development Strategy (NEEDS) and
the Challenges of Poverty Alleviation in Nigeria, 1999-2011”. University of Nigeria.
UNDP. (2016). 2016 Human Development Report
13

Appendix: Selected Economic Indicators for Nigeria, 1962-2010
Table 1: Growth Rates during the four National Development Plans
National Development Plan GDP AAGR (%) First National Development Plan (1962-1968) 5.1 Second National Development Plan (1970-1974) 8.2 Third National Development Plan (1975-1980) 5.0 Fourth National Development Plan (1981-1985) 1.2 Source: Ikeanyibe, 2009
Figure 1: Relative National, Urban, and Rural Poverty in Nigeria, 1980-2010
Source: Dauda, 2017
14

Depression through Different Lenses: The Schools of Economic Thought Respond to Recession
Caroline Greeley University of Massachusetts Amherst
Abstract
Different schools of economic thought, such as, the classical, neoclassical, Marxist, Keynesian, American Institutionalist, and Modern Money Theory, differently approach the problem of economic depression in capitalism. I illustrate the differences by describing their alternative responses to a scenario of recessionary crisis.
Periodic, systemwide economic downturns — depressions and recessions — are a
regular feature of capitalism, and any explanation or analysis of capitalism has to account for
depressions and recessions and to prescribe a response (or non-response). I discuss how the
different schools of economic thought such as, the classical, neoclassical, Marxist, Keynesian,
American Institutionalist, and Modern Money Theory approach the problem of economic
depression in capitalism. I consider the following scenario: the economy has experienced a
sudden collapse of asset prices, with the stock, real estate, and commodity market experiencing
declines of over 50 percent relative to last year. Data show a loss of nearly 1 million jobs since
last month, which brings to year-to-date loss of jobs to nearly 5 million. And, bank lending has
slowed sharply, and initial data on investment suggests a sharp decline in new projects. The
central bank reports that that bank balance sheets have deteriorated significantly, and it is
contemplating emergency monetary actions. The country's Prime Minister claims to be “on top
of the situation,” but polls suggest her popularity is falling fast as confidence in the government's
economic leadership diminishes. This appears to be the start of a serious recession, with the
rate of decline in production rivaling the rapid declines in 2008 and 2009.
Each economic school of thought would approach this recession phenomenon in a
different way. What models they use and how they use them are the main differences in their
approach to dealing with recessions. The biggest difference between each school’s model is
whether they are static or dynamic. Dynamic approaches show how the real world is changing
and complex, which makes them hard to model. Most models are static, linear representations
of a trend occurring in real life. They often only taking a few variables into account but can be
15

useful because they can be added and have solutions that can give some answers. Another
difference is how they would view equilibrium balance. Do they consider equilibrium to be
stable? Do they think that markets will correct themselves when they fall out of equilibrium or will
the government need to intervene? Do they think that they are moving towards the optimal
outcome or just a circumstantial outcome? These questions are all crucial to understanding how
a school of thought would approach an economic recession. Another way the schools differ in
their thinking is based on how they view the economy in a historical and institutional context.
Some schools will care more about how the economy affects individuals, while some will care
about how the economy impacts society as a whole. Some will think that the economy is a
separate entity from other aspects of life and will not care to look into other fields such as
sociology, psychology, or behavioral sciences to understand what's happening in the economy.
Other schools will argue that it is impossible to make sense of the economy without taking these
subjects into account. How the schools make sense of recessions such as the one described in
the prompt will depend greatly on what they consider important to economic models.
The classical school of economics was divided on how it addressed recessions.
Classical economists were heavily influenced by the work of Adam Smith, who concluded that
recessions could not occur. Smith, and nearly all of other classical economists, thought that
aggregate demand would always rise to meet aggregate supply and that the “invisible hand”
that controls and corrects markets would prevent recessions from happening. The only classical
economist that challenged this was Thomas Malthus, who put forth his theory of gluts. This
theory stated that over-accumulation of capital would lead to a break in the circular flow of
money, causing demand to go down because people could not afford to buy the supply of
commodities. Although Malthus recognized that people needed more money to purchase the
supply, he opposed raising wages, because he saw this as hurting the capitalist class’ profit. His
solution to recessions was for landowners to hire more servants. These servants would be
unproductive, but they would still consume; therefore, they would increase demand without
increasing supply and allow them to meet at equilibrium again. Most classical economists were
members of the landowning class and their theories often were biased in favor of this class. The
classical approach to solving recessions is very limited in addressing the recession
demonstrated in the prompt. The classical all believed in the laissez-faire policies, so they would
not advise the government to take steps to intervene in the economy. The modern financial
system and all of its complexities did not exist in the 1700s, so their solution would be to wait
16

out this recession because the “invisible hand” would eventually reverse this recession and
growth will start again.
The Marxist models aim to be complex and to analyze change over time. They take
history into account and see how capitalism developed over time from feudalism and how the
capitalists are those who benefitted from primitive accumulation. The Marxist school of thought
would see this recession as an unavoidable part of capitalism. They would say that this
recession is an example of why capitalism needs to end. Marxists believe that as capitalism
expands, balanced economic growth is impossible. In their models, the capitalist class over
accumulate wealth so that the circular flow is broken. This point is expressed in the quote:
Capitalism is therefore increasingly prone to crisis. The crisis explodes when production has developed beyond the possibility of profitable realization. This can occur for different reasons, and what matters for the explanation of specific crises is how their underlying cause – the subordination of the production of use values to the production of surplus value – manifests itself through disproportionality, overproduction, under consumption and the falling rate of profit. (Marx’s Capital, 95) Here, it is explained how it is impossible for demand for goods to grow at the same pace
as production of those goods within a capitalist nation’s economy. Because there was not
enough demand for the goods produced, recessions like the ones described in the prompt are
inevitable.
Marxists would hope that this recession would spark a revolution led by workers to
overthrow capitalism. Recessions affect the livelihood of the poor much more than the rich, and
Marxist would hope that the poor living conditions of the proletariat would inspire a communist
revolution to take place. They would want the workers to take control of the means of production
so that capitalists cannot exploit their labor any longer. They would argue that the country’s
prime minister is incapable of saving the economy because she is defending the capitalist
class’s interests. The Marxists point out valid flaws in the capitalist system, but communist
societies do not have a better quality of life than capitalist ones. Communist revolution is a
realistic goal in modern day America, and that trying to fix capitalism is the best chance we have
at a fair and relatively equal society.
The Neoclassical school would view this oncoming recession as the market correcting
itself. The neoclassical models of the economy are stable, self-correcting, and optimal. This
17
means that the economy will naturally rebound from a recession like this, and that the
government should not intervene. Neoclassical economist would urge the government not to
intervene in the economy at a time like this because they would disturb the market from
correcting itself naturally. Neoclassical economics also assumes that the economy is perfectly
competitive and will operate at full employment. Neoclassical economists would advise the
central bank to not interfere in the economy with monetary or fiscal policy. They would also
certainly be against the government bailing out certain industries or banks as they did in 2008.
Because of these beliefs, the neoclassical approach to this recession similar to 2008
would be to not interfere and allow the market to correct itself. An important assumption that
neoclassical economics makes is that “market adjustments would be fast and effective and
should be relied upon completely” (H&L, 270). One of the most famous neoclassical models is
that of the Walrasian auctioneer, which demonstrates how prices reach equilibrium by
establishing prices that consumers react to in order to get perfect equilibrium. In Walras’ model
it was assumed that “each consumer acts so as to maximize his utility, each producer acts so as
to maximize his profit, and perfect competition prevails, in the sense that each producer and
consumer regards the prices paid and received as independent of his own choices”
(Arrow-Debreu, 1). Here, it is explained how Walras arrived at this perfect equilibrium. The main
features of a neoclassical model are that they are linear, partial, and individualist. This means
that their models tend to look at an individual, rather than the society at large. They believe that
everyone acting in their own rational self-interest will create perfect competition. They also look
at the economy as an entity separate from other institutions; their models of supply and demand
do not take historical context and other societal institutions into consideration. While those may
be some of the downsides of neoclassical models, their simplicity allows them to be solvable,
and can show some information about how prices and utility affect supply and demand.
The American Institutionalist approach to solving this recession would be extremely
different from the neoclassical approach. This school of thought was very complex and dynamic,
and viewed the economy as being connected to other societal institutions such as the
government, culture, and fields. Pierre Bourdieu, an influential Institutionalist, broke culture
down into two subcultures: habitus, which is the outward forms of behavior such as dress, body
language, and other things that you do and are associated with, and the doxa, which is the
common belief within the habitus that brings them all together as one subculture. American
Institutionalists believed that our economic system has evolved over time and is a direct result
18

of history. Therefore, they believe that historical and societal context is absolutely necessary to
make sense of and model the economy. In many ways, they incorporate social and behavioral
sciences when studying economics. The founder of American Institutionalism is Thorstein
Veblen, who showed how informal and formal institutions affected the economy. He believed
that firms did not act in a way that is beneficial for communities. In his book, The Theory of
Business Enterprise, he states, “Work that is, on the whole, useless or detrimental to the
community at large may be as gainful to the business man and to the workmen whom he
employs as work that contributes substantially to the aggregate livelihood” (Theory of Business
Enterprise, 20).
For example, businesses often exploit natural resources that everyone relies on in order
to create more profit. Veblen saw the class struggle between workers and capitalists as one of
the biggest problems in a capitalist economy that would lead to depression. He also thought that
depressions were a natural part of the business cycle in capitalism. American Institutionalists
would advise the government to intervene in a recession to help the economy from failing.
However, they believe that the government is doing this in order to help the wealthy capitalist
class, and not the working class who are the most hurt by recession. Veblen saw capitalist
governments as “the enforcers and guarantors of the profits and privileges of the capitalist
class.”
Under their view of the government, the prime minister would probably take action to
save large businesses assets, but the working class would be left to fend for themselves during
the Recession. The Keynesian school of economics would see this recession as a natural part
of the capitalist system. Keynes was not anti-capitalist, he saw flaws in capitalism and wanted to
know how to make the capitalist system work. Keynes witnessed the Great Depression and
realized that the government could intervene to lessen the effects of the periodic recessions that
occurred under the capitalist system. Keynesian economists would advise the central bank to
lower interest rates so that people are more inclined to borrow money and invest. They would
advise the prime minister to increase government spending on things like infrastructure and
investment to stimulate the economy. This approach is diagrammed in the IS-LM model that
shows the relationship between the money market and interest rates in an economy. This model
is shown below.
Using this model, Keynes’ theory that increasing the money supply and government
spending would help to reverse the economic catastrophe of a recession by increasing
aggregate output is shown. Modern Money Theory combines Institutionalist and Keynesian
19

thinking, recognizing the role institutions play in money, the monetary system, and policies. In
MMT, money is not only a physical item that can be printed or felt; it can also be created very
easily with a computer.
They argue that a dollar is nothing, but a liability issued by the US government, which
promises to accept it back in payment of taxes. The dollar in your pocket represents a debt
owed to you by the federal government. Money isn’t a lump of gold but rather an IOU. The
government sets monetary policy; this includes the amount of money in circulation and interest’s
rates. The government and our institutions are critical to our financial systems and the role of
money. Part of the MMT thinking is that because the government can always create the money
it needs, it should not worry about things like deficit spending, and should boost the economy
whenever it needs to in order to help economic growth. In this theory, the United States
government creates the US dollar, therefore, “it can never run out, it can never go broke, and it
can never be forced to miss a payment.” Because of their unique view of money, MMT would
suggest that the central bank take extreme monetary policies to help turn the recession around.
They would advise the central bank to lower interest rates and tell the prime minister to lower
taxes and fund large projects to promote investment by running up a budget deficit.
In a recession the government should take the steps laid out by the Keynesian and the
Modern Money Theory schools. The government should definitely take steps to intervene and
turn the economy around when a massive recession comes. I tend to agree with Keynes that
there are certain problems with the capitalist system that need to be addressed in order to stop
these periodic recessions. Keynes famously said that “in the long run, we’re all dead.” This is a
great way of thinking about how government intervention can help boost the economy in the
short term. Short term fixes may not be ideal, but they can help millions of people avoid poverty.
The financial crisis in 2008 led to many people losing their homes and jobs, the government
should strictly regulate the financial market in order to prevent a crisis like that from happening
again. I agree with Epstein and Montecino (2016) when they wrote that a healthy financial
system “channels finance to productive investment, helps families save for and finance big
expenses such as higher education and retirement, provides products such as insurance to help
reduce risk, creates sufficient amounts of useful liquidity, runs an efficient payments
mechanism, and generates financial innovations to do all these useful things more cheaply and
effectively.” (High Cost of Finance). The United States government should regulate the financial
market so that it is less speculative and hold Wall Street accountable when they make
20

disastrous mistakes that throw the entire economy into recession.
Works Cited
Epstein, G. and Montecino, J.A., 2016. Overcharged: the high cost of high finance. Roosevelt
Institute.
Heilbroner, Robert (1996), Teachings from the Worldly Philosophers, New York: W.W. Norton &
Company, ISBN: 978-0-393-316070.
Hunt, E.K. and Mark Lautzenheiser (2011), History of Economic Thought: A Critical Perspective,
Armonk, NY: M.E. Sharpe, ISBN: 978-0-765-625991
Marx, K., 1976. Capital: A critique of political economy, Volume I. Trans. Ben Fowkes. New
York: Penguin.
Veblen, Thorstein. The Theory of Business Enterprise. Printed by Amazon Fulfillment, 2018.
21

Postal Remittance Services & Regulation
As a Policy Tool for Immigration Will Harmer 1
University of Massachusetts Amherst
Abstract Remittances have grown in recent years to be a major capital flow, with American outflows more than doubling in inflation-adjusted dollars from 1990 to 2009 (CBO 2011, pg. 5). In 2016, they amounted to nearly 140 billion dollars, with even more sent through informal networks which are hard to measure and track (Wormald 2018). Currently, immigrants in America are overcharged by high fees associated with private banking remittance services, facing an average fee of over seven percent (Beaton et al. 2017, pg. 20). The current remittance market offers a variety of policy solutions to immigration policy, two of which are proposed here. The first policy proposed is for the Postal Service to assuage such overcharging by offering low-fee remittance services to documented immigrants. Additionally, placing the transfer of remittances in public hands offers the opportunity of a policy tool for immigration as a whole. The second policy proposed is to create a remittance cap as a percentage of individual immigrant’s income based on local economic factors; the purpose is to regulate remittances to leverage immigration flows to positively affect domestic social welfare.
The topic of immigration has possessed the national mind for years, the economic
effects of which have held a foremost position in public anxieties. Yet, one of the most
distinctive economic activities of immigrants often goes unmentioned and unconsidered:
remittances. Remittances constitute “sending money...[,] making financial investments, or
returning to the home country while retaining bank accounts or claims on other financial assets”
when in their resident country (CBO 2011, pg. 1) Yet, there is some variety in measures of
remittances, such as the World Bank defining remittances largely as the sum of employee’s
compensation and personal transfers. Personal transfers comprise of in-kind transfers, while
employee’s compensation defines labor income to temporary employees as remittances
(“Migration and Remittances Factbook” 2016, pg. xii). The amount sent under the World Bank
definition from the United States alone was 138 billion dollars, a large portion of the 581 billion
1 Acknowledgements to Professor Hendrik van Den Berg, Professor Carol Heim, and Professor Ina Ganguli of the University of Massachusetts Amherst Economics Department and to Professor Ide O'Carroll of the University of Massachusetts Amherst Sociology Department for editing and feedback on drafts of this article. Their advice was invaluable, and this article would not be possible without them.
22

dollars worldwide in 2015 (Wormald 2018). Discussed or not, remittances has swelled to
enormous proportions.
The average immigrant sends ten percent of income to their home country (IDB 2006,
pg. 4); however, despite the magnitude of the flows there exists no distinct regulatory framework
for remittances. This has negative consequences, such as the gouging of immigrants when they
send money back to their home country through formal networks. The drive for profit conflicts
with immigrants’ interests, and this results in a disadvantageous economic equilibrium with high
fees and uncertain services. To bring about a better stasis, the United States should offer
low-fee, remittance services to legal immigrants through an institution such as the Postal
Service. Thereafter, the federal government can use the new service as a policy tool by
regulating the percentage of migrant’s income going to remittance expenditures as a way to
incentivize the most socially beneficial immigration while discouraging the most socially costly
immigration.
Remittance Flows: Trends and History
The average immigrant sends around ten percent of their income through remittances,
yet the lack of good and consistent data about immigrants’ remittances have often proved to be
an impediment for definitive research and results. Both how many individuals remit and how
much of their income is devoted to remittances are unsure, with surveys yielding significantly
different results. On the higher end, one survey estimates sixty percent of immigrants remit,
while on the lower end the National Immigration Survey finds only seventeen percent remit.
Based on a data set from 2006, current remittance habits were shown to vary significantly by
country of origin. That same data set shows that immigrants only remitted about five percent of
their income. The data had a negative skew, with the top quartile of remitters accounting for
three-fourth of total remittances from the United States. Creating an accurate picture of the
current remittance market is difficult, since many data sources rely on unreliable interviews
where a fifth of respondents either don’t know how much is given or refuse to answer outright
(Meckel 2008, pg. 2-15). Additionally, informal networks compose a significant amount of global
remittance flows, complicating estimates even further (Freund & Spatafora 2008, pg. 357).
These confounding factors blur the potential and impact of remittance regulation.
One of the better data sets for remitters in the United States comes from the Census
Bureau in 2008, when a supplemental survey on migration and migration-related matters, such
23

as money transfers, was conducted The survey had a similar nonresponse rate to other Census
surveys, though the nonresponse rate for the money transfers section was higher for foreign-
born households in comparison to native households, possibly skewing the data. Additionally,
interviewers reported a great degree of hesitation among respondents, especially as questions
continued in the amount and frequency of remittances. They surveyed 458 American
households, with 84 percent of those reporting money transfers abroad being foreign-born.
More than a quarter of foreign-born households had remitted in the last year, while 54 percent
reported remitting 1 to 4 times a year. At the higher end, 30 percent reported remitting over 10
times a year. The average family remitts about 6 to 7 times a year, according to their results.
Additionally, 71 percent of foreign-born households reported remitting more than 500 dollars,
and 11 percent reported remitting 5 thousand dollars or more. Importantly, it was concluded that
only about 12 billion dollars were sent in remittances in 2008, even as other third-party
estimates routinely delivered results in the range of 30 to 40 or so billion dollars a year. The
Census report continues by calling for greater research into the topic to make stronger
conclusions (Grieco et al. 2010). Data sources point in a variety of directions, and their
disuniformity underscores the importance of greater research.
The result of an uneven American distribution conforms with other migrant groups
behavior as well. For example, among Filipino rural-urban migrants:
…..the percentage of income remitted varies considerably. Among those reporting income on a monthly basis, the percent of income being remitted ranges from less than 1 percent to over 50 percent. Of the total in this group, 39.6 percent remit less than 10 percent of their income; 28.3 percent remit between 10 and 25 percent of their income; 11 percent remit 26-50 percent of income, and 6 percent remit over 50 percent of their income (Trager 1984, pg. 332).
There are notable differences between American international immigrants and Filipino
internal migrants. That being said, many of those same immigrants were facing similar social
pressures (such as familial obligations, origin-country financial responsibilities, etc), except
without such a drastic change in other facets of life (such as culture, wage-level, or distance to
their family). In previous studies of remittances, such factors as distance from their
home-country and time since migration figure greatly into individuals’ propensity to remit
(Perez-Lopez & Diaz-Briquets 1998, pg. 330). This disclarity underscores the need for greater
measurement of such a large capital flow, especially one which is so rapidly growing.
24
Immigrants of differing countries of origin, gender, age, and income all vary in their
remitting behavior. One recent study found that the group most likely to remit is “a male
immigrant from a rural background who has been in the US for a longer period of time and is
from a higher income group (to some extent.)” Further, the most-intensive remitters have a
“higher English proficiency, living apart from their family, and from a lower income category and
less developed region” (Trombley 2016, pg. 30). Importantly, this profile is the result of a costly
and inconsistent formal remittance service market.
The current remittance service market suffers from unaffordability. Fees for such
transfers averaging out across platforms at 7.62 percent. They range from as low as 3.45
percent through mobile remittance providers to a high of 11.18 percent through banks (Beaton
et al. 2017, pg. 20). These transfers tend to be relatively costless for providers, yet immigrants
are losing significant sums. Further, evidence points to a very elastic relationship between
formal channels’ transaction costs and remitted income--with a single percentage point increase
in fees reducing remittances by 16 percent. Since informal networks often offer lower costs, that
may reflect the degree of substitutability between formal and informal remittance flows (Freund
& Spatafora 2008, pg. 358-361). The informal market is unreliable as a mode of exchange, not
least since transactions don’t have the same level of security as those covered by contracts.
These high fees for the formal market drive a greater share of total remittances through informal
channels, decreasing the financial security of remitters and their families as well as obscuring
the scale of remittances worldwide.
Method of Administration
The Postal Service may seem like an unlikely agency to conduct such financial dealings
as remittances, yet it has both a history of serving immigrants’ financial needs as well as the
ability to do so once again. After an act of Congress, the Postal Service offered basic banking
services through the Postal Savings System for 55 years. In 1915, immigrants held 70 percent
of the bank’s deposits even though they were only 15 percent of the population. Many
immigrants distrusted private banking establishments, and felt more comfortable with a public
bank. Through an aggressive marketing campaign by the Postal Service to immigrant
communities, those communities became natural customers (Baradaran 2014). The issue of
affordable financial services is a familiar one for many Americans--more than a quarter of
American households were either unbanked or underbanked in 2014, with access to affordable
basic financial services beyond reach. As such, this policy change resulted in the proliferation in
25

underserved areas of predatory payday loan lenders. The current arrangement results in nearly
90 billion dollars devoted solely to interest and fees due the usurious interest rates on loans
(Office of the Inspector General 2014, pg. 1). Whether such an open and public venture today
would yield a similar success story is an open question. After all, the financial sector has grown
to be much larger, both in scale and complexity, since the Postal Banking System ended in the
1960s. However, a low-fee remittance service provided through the Postal Service would
provide the government corporation a pilot program of sorts, to see how the dynamics of the
modern financial system could combine with the structure and nature of the modern Postal
Service, as well as the obvious benefit to immigrants of a more consistent and affordable
remittance service.
The choice of the Postal Service rather than another government organization also
comes down to its equitably-spaced network of infrastructure, allowing immigrants to easily
access personnel in order to set up accounts and conduct account maintenance. Investments in
new infrastructure would be minimal in comparison to establishing a brand new government
corporation or running it through a public institution with a less widespread national presence.
With over 31,000 post offices manned by over 500,000 career employees delivering to over 157
million addresses, the Postal Service of today seems capable of replicating the grand
accessibility of the past postal banking system. Another possibility of a vehicle for a remittance
service may be Immigration and Customs Enforcement, which has the advantage of being
situated around immigrant populations. Yet, due to the reputation of the body, many immigrants
will shy away from utilizing its service. If there isn’t buy-in, then the program will be hobbled.
Regardless of who executes the policy, it must be done hand-in-hand with an extensive,
multilingual marketing campaign along the lines of the Postal Service a century ago to build
trust among concerned communities.
Further, the Postal Service will be able to provide remittance services less corruptly and
criminally than the private sector, while also providing a source of consistency for migrant
financial lives. Many banks in recent years have rolled back their remittance services, due to a
government crackdown on possible avenues for criminal activity. For that reason, remittance
fees have become cheaper and cheaper, yet due to the law enforcement initiatives the trend
may reverse (Corkery 2014). In recent years, financial institutions have been cutting ties with
money transfer services in an effort to crack down on money laundering and financial crime--a
process called de-risking. In 2016 alone, 27 percent of banks worldwide reported closing
26

relationships with remittance providing partners, presenting barriers to free entry in the industry
and to the introduction of new innovative advancements (“Migration and Remittances” 2017,
pg. 2, 5-6). Remittance service markets are failing--with fault for both public and private sector
actors--and immigrant communities are on the hook.
Importantly, these concerns are not merely the machinations of an overzealous national
security state, but due to recent bank behavior in regards to international criminal organizations’
financial dealings. This situation occurred in the case of HSBC and its “pervasively polluted”
culture which lead to billions of dollars of terrorist and drug trafficker money being transferred
through the bank, thus undermining the legitimacy of daily, innocent transactions (Jamieson
2012). It goes without saying that the Postal Service has not been implicated in such
wide-ranging scandals as assisting terrorist groups and drug cartels. On the contrary, the worst
criminal behavior associated with the Postal Service tends to involve individual workers
smuggling drugs or stealing mail, only to be later prosecuted.
The benefits of a postal remittance service do not flow solely to immigrant communities
either. The Postal Service’s fiscal health has been significantly hampered since 2006, when
Congress imposed uniquely draconian standards for the government corporation to pre-fund it
pension obligations (Ritholtz 2018). Even modest profits from a postal remittance system would
help bolster its balance-books, and could introduce practices potentially useful in a future postal
banking system as some have proposed. Securing safe and transparent transnational flows,
saving immigrant’s wallets from private sector gouging, improving a vital institutional force, and
providing an opportunity for experimentation in financial markets and transactions are desired
and feasible goals for a postal remittance system.
Such a service would allow for a system of remittance regulation for the maximization of
immigration’s social good while minimizing its socially disruptive and costly effects. By
legislating the work of immigrants’ remittance needs from private banking to the publicly-owned
Postal Service, many stakeholders are benefited. Immigrants benefit through the elimination of
high fees, while the public sector benefits through the diverted revenue. Further, it produces a
transparent, formal market for transactions, rather than a hodge-podge of price-gouging and
informality. Through these characteristics, policy-space is created, offering a set of opportunities
for improvement and efficiency. Postal remittance legislation is a sound policy offering
affordability and security to immigrant communities.
27
Proposal for a Postal Remittance Regulation System
Remittances are counterproductive to the resident country’s economy, which in this case
the United States. A class of workers reserving ten percent or more of their income in order to
enhance the budget of their non-migrating family, later used to fund firms and increase
consumption in the immigrant’s home country rather than in the United States. Income diverted
to foreign consumption and foreign investment has its own costs in the form of reduced
domestic aggregate demand, minus the receivers’ propensity to import American goods and
services. Further, there is evidence to suggest that immigration may lower some Americans’
wage potential, specifically those of high school dropouts, who are some of the more unskilled
workers of the American economy who often directly compete with unskilled immigrant labor.
Thus, immigration does have some costs for some workers, and these costs are possibly
outweighed by the benefits of immigration (innovation for example). Regardless of that calculus,
it brings a set of costs nonetheless.
These costs, of either reduced wages or reduced domestic aggregate expenditure are
localized to the area of the immigrant’s migratory destination, meaning the costs of immigration
are primarily spatially-oriented. For example, an unskilled migrant’s remitting leaves local
economies with less demand to be satiated by domestic workers, while potentially undercutting
the wages of their similarly skilled counterparts--whether native- or foreign-born. There are other
costs as well, like increasing rents; for example, in the period immediately after the Mariel
Boatlift during the 1980s, low-quality rentals in minority neighborhoods saw rent increases
(Greulich et al. 2004, pg. 151). Alternatively, some of immigration’s benefits are regionalized,
such as a surge of immigration helping to compensate for recent population declines in that part
of the country. In short, remittance policy can help ameliorate the spatial effects of immigration.
In 2015 the United Nations adopted a series of sustainable development goals, among
which was to reduce the fees associated with remittances. They recognize the exorbitantly high
fees and the negative effects for the immigrants, their families, and their home countries. By
2030, the UN wishes to see remittance fees reduced to three percent, and all corridors charging
over five percent eliminated (Galatsidas 2015). If the United States were to establish this
postal-remittance service, it could easily effectuate those goals well ahead of schedule in line
with the spirit of American inclusion of immigrant communities. Congress could legislate fee
levels to compensate for program-related costs while still ensuring affordability and accessibility
28

to immigrant communities. Importantly, ceteris paribus, establishing this scheme of
remittance-regulation designed to lead to cheaper and consistent remittance services cultivates
a broader and varied appeal in immigrant communities. That broad appeal increases market
size, with a resultant decrease in domestic aggregate demand commensurate to the growth in
remittance flows. To combat the economic maleffects, it is proposed that a system of regulation
according to local factors is proposed.
Level of Policy Execution
Additionally, this system of remittance regulation should be established through the
federal authority, especially after the landmark 2012 Supreme Court case Arizona v. United
States. The court rebuffed the state’s attempt to establish new legislation regarding illegal
immigrants, finding the laws in violation of the supremacy clause. The clause empowers the
federal authority over state and local ones, and that even “complementary” state legislation
encroached on federal immigration powers. Immigration laws are not simply considered an
extension of domestic policy, since immigrants come bearing other nation’s citizenship. Thus,
immigration laws deal with how the United States treats foreign citizens and entities, not a state
function but within federal foreign policy power (Guttentag 2013, pg. 11-18; Arizona v. United
States, 2012, 567 U.S. 387). A state or another local entity attempting to enact this policy could
face a court challenge in the face of a strong headwind of recent precedent.
As such, a system described would require Congressional legislation directing the Postal
Service to create the remittance service with fee levels as detailed in the United Nations
sustainable development goals, cost providing. Furthermore, Congress should mandate that all
legal immigrants establish an account as part of the immigration process to ensure maximum
participation among immigrant communities. Citizens should also have access to these
remittance accounts, with no cap for anyone not associated with the immigration system.
Complementary legislation could require that all remitting for permanent guest workers,
permanent residents, etc must occur through the postal system until naturalization, and possibly
continuing the mandate for a period of 5 years like the prohibition of public assistance to
recently naturalized immigrants (Singer 2004, pg. 26-27). The goal of ensuring universal buy-in
and the minimization of private remittance services is necessary for a successful and effective
remittance regulation system. To further ensure immigrant community buy-in, any financial
services provided should be held secret and anonymous unless account-holders violate the
standards of its use and face additional fees and fines.
29

Proposed Factors
Specifically, I offer a plan to establish an effective system of remittance regulation
calibrated on a local level according to three separate factors: the unemployment rate among
high school dropouts (for similarly educated immigrants); diversity criterion, with non-white
(white) immigrants encouraged to work in white-majority (minority-majority) areas; and local
capacity utilization (to be defined later in this article). Potential standards for regions are
counties, commuting zones, labor market areas (Tolbert & Sizer 1990 pg. 1-3), or another
variant such as mobility zones (Foote et al. pg. 16-23). The idea behind these measures is to
create separate and distinct mini-metro areas across the United States in order to sort and
categorize local economies more systematically. To consider locally- tuned remittance
regulation as through the proposed postal remittance system is then akin to asking what the
effects of immigration are to net receiving countries like the United States. Its separate factors
then are presented as distinct ways immigration impacts local communities, and further
proposes that remittances are important enough to immigrant’s destination decision as to merit
consideration. A federally-formulated policy according to such local considerations would yield a
more exact and distinctive effect.
Depending upon the status of each of these factors, each region would have a
remittance cap placed upon resident immigrants. Nationwide there would be a baseline
remittance cap, as well as a maximum remittance cap and a minimum remittance cap (covered
later in this article). Such a remittance cap would be a proportion of the migrant’s total income.
Each factor will either raise or lower the remittance cap by region. For example, a place facing
low rental occupancy may have a higher remittance cap in order to encourage immigrants to
move there, even moreso if low-skilled unemployment was relatively low, or if they helped to
diversify the local neighborhoods and workplaces.
Wages of Unskilled Labor
The alleged connection between immigration and native’s wages is much discussed,
with research mostly rejecting the idea of large-scale and broad wage-effects. Many studies of
its effects on wages usually yield negligible effects, if any, and even in some cases the reverse
sign. Yet meta-analysis shows significant effects on low-skilled workers--with those effects most
heartily felt by similarly-skilled recent immigrants--which in the United States often mean those
30
without a high school diploma (Longhi et al. 2010, pg. 827-829). George Borjas claims that
immigrants, due to their vast numbers, redistribute five-hundred billion dollars every year from
the poorest workers in the United States to their employers (Borjas 2016). He also contends
that high school dropouts have lost about four and a half percent in earnings due to immigration
from 1979 to 1997 (Borjas et al. 1997, pg. 65-66). Evidence from the Norwegian construction
sector yields a similar result. Relying upon low- and medium-skilled workers especially, the
relationship between immigration share and wages is inverse; foreign- and native-born workers
seem to behave as substitutes (Bratsberg et al., pg. 1202). Even if for the average wage-earner
in the United States’ immigration has little wage effect, there still seems to be a noteworthy
effect on unskilled labor’s wages.
Lower wages for those with less education and fewer skills is not a positive outcome
from the perspective of public policy. This aspect of the remittance regulation proposal entails
establishing a remittance cap inversely related to a region’s unemployment rate among those
without a high school diploma relative to the national unemployment rate for the same group. An
area with an overabundance of unskilled labor, as measured through the unemployment of the
region relative to the national average, would face lower remittance caps in order to
disincentivize new immigrant labor to enter an area already struggling. Collecting
unemployment rates for those not holding a high school diploma would have to be done on a
regional basis, and then compared with the national average. This factor would only apply to
those immigrants who have less than a high school diploma, with all those higher educated
exempt--barring a new trend of higher-skill immigrants causing unemployment among their
similarly educated peers.
Diversity & Productivity
Further, it is proposed to set the remittance cap based on diversity considerations. There
is a public good gained through more racially and ethnically integrated neighborhoods and
towns, especially in the face of the recent rise in racial residential segregation (Frey 2018). For
example, segregation is presumably at least partially responsible for differences in education,
since schooling in the United States often depends on a local areas’ socioeconomic makeup,
with minority populations such as blacks and hispanics with on average lower household wealth
than their white counterparts, a trend set to continue (Sherman 2017). Furthermore, America is
suffering from a crisis of so-called ‘lost einsteins,’ whereby many children from disadvantaged
31
groups see significantly lower rates of innovative activities (as measured through patent
authoring) than otherwise expected. For example, one study notes that “if women, minorities,
and children from low- income families were to invent at the same rate as white men from
high-income families, the rate of innovation in the economy would quadruple” (Bell et al. 2017,
pg. 16). Research increasingly illustrates the lost potential resulting from racial stratification and
segregation, costs which can potentially be ameliorated through a more targeted immigration
policy.
With demographic trends continuing, the United States will see a lower proportion of the
white population than in our recent history. The immigrant population is of differing ethnic and
racial stock (Suh 2015), and is one of the factors in the gradually decreasing proportion of the
white population. Given the tendency for immigrants to cluster in neighborhoods and specific
areas, the risk of increasing segregation is more so heightened. The fear of ethnic enclaves has
been a recurring paranoia, with some speculating that the unique factors of American history
produced a melting pot of greater assimilatory power to counter the proliferation of enclaves
(Borjas 2006, pg. 65-68). Yet these enclaves also provide immigrants a baseline social network
and support system. The byproducts include helpful links for employment and housing, and
institutional forces like community centers and ethnic churches providing bevies of support
(Tsang 2014, pg. 1182-1187). Hopefully by leveraging diversity considerations into the
remittance system, more individual migrants will take the step of expanding the spread of
foreign-born populations to new places, forming the foundation for the expected future diverse
immigrant cohorts. Aside from the phenomenon of ethnic enclaves and their impact on
immigrants’ social mobility, there are other compelling reasons to promote the further
geographic spread of immigration.
Central to that contention is research concluding that more diverse workplaces tend to
be more productive. One study using city-level data found that every standard deviation
increase in workplace diversity correlates with a six percent wage increase (with wages being
used as a proxy for productivity), even after controlling for a variety of factors advocated
generally by skeptical economists (Sparber 2009, pg. 79). A sociological review found that
increased diversity in a workforce helps in nearly every area that detractors often point to as the
harm of diversity. Even after controlling for a myriad of factors, increased diversity was
significantly correlated with increased sales, profitability, market share, and the number of
customers (Herring 2009, pg. 218). Furthermore, with the trend of low productivity growth in
32
recent years (Blinder 2015), systematic attempts to further innovate labor force combinations
are well justified. A side note: for administrative or bureaucratic purposes, it may be easiest to
use a simplified measure of just non-white to white population--rather than breaking it down by
black, hispanic, asian, pacific islander, etc--with immigrants categorized according to how they
would answer questions on race from the Census Bureau. To limit the negative effects of racial
segregation and to maximize the social good of diverse workplaces, a remittance cap could
serve to ameliorate a rising problem and contribute to creating more productive and innovative
American firms.
Local Resource Utilization
Immigration’s benefits and costs are also related to the capacity utilization of local
economies. This is meant to measure public services utilization, such as high school class size
or local hospital usage rates. It should also include other possible measures. There seems to be
a connection between a higher immigrant population and higher rental prices, although such
relationships are highly complex and require more study” (Saiz 2007, pg. 355). It may be
beneficial to create some gauge of existing housing utilization (for example, the proportion of
unoccupied housing units as a share of total housing), and increase (decrease) the remittance
cap the more unoccupied (occupied) the region is relative to the nation overall. For example, a
town where much housing goes unused, a hospital wing has just shut down, or classrooms are
going empty, would have a higher remittance cap since it has all these facilities, all these
unused resources which an increased population can use. By contrast, a region where
essentially no housing units go unused, the local hospital is overburdened by a high patient
load, and students are sitting on the floor since there aren’t enough seats faces a differing
physical limitation than a depressed region. Their infrastructure will be less equipped to handle
the added stress of additional population. without creating greater overextension and harm.
The basic aim would be to avoid potential overcrowding of public facilities and housing
while encouraging stories like that of Schenectady, New York, where a mayor in the mid-2000s
was able to attract large numbers of Guyanese immigrants to his city and revitalize the
municipality’s economy (Kershaw 2002). By including local capacity in the remittance equation,
the federal government can utilize external immigration to assuage the social maladies
associated with population outflows from a community. Especially in recent years, with the
growing trend of internal migration toward the so-called Sun Belt, such an enterprise could yield
positive localized results to local economies on the downswing and provide a degree of relief to
33

overheating regions. In essence, remittance regulation can help leverage external migration to
outweigh internal migration patterns, providing stability and security.
Determining Remittance Caps
The importance of the baseline remittance cap cannot be underestimated. A cap that’s
too high will lead to fewer immigrants considering it in their work-life decisions and render any
system of regulation ineffective and pointless. Conversely, if the remittance cap is too low, it
could lead to significantly reduced capital flows to many underdeveloped countries. As many
families use remittance income to afford food, education, housing, or healthcare, any
large-scale effort to reduce these flows could have tremendously negative effects on those
already struggling around the world. To accurately assess the most humane yet binding
baseline remittance cap requires a better understanding of individual American immigrants’
decisions about how much to send in remittances.
Remittance cap minimums and maximums should also be established. If there were
areas where immigrants simply weren’t allowed to remit any part of their income, that would be
unnecessarily cruel, as well as a major impediment to immigration to that region. It thus
undercutting the goal of spreading immigrant populations more equally across the country.
Similarly, establishing a remittance maximum is very important, since a high cap will weaken the
system in its task of accomplishing its policy goals.
Remittance regulation baselines, maximums, and minimums are all mutable; they can be
changed through legislative action, executive adjustment, bureaucratic calculation, or any other
method as designated through official policy. But in times of economic recession or depression,
in order to revitalize aggregate demand and return the economy to producing at its full capacity,
the total allowable amount of remittances should be lowered for a period of time. To take such
drastic action, policy deciders would have to weigh the good of the resultant new consumer
spending with the rights and needs of immigrants themselves, especially for those who remit.
For example, remittances tend to be a more consistent source of external financing for many
countries, help smooth aggregate consumption over time, facilitate access to credit, and help
those in the underdeveloped world gain access to education by letting them offset any lost labor
income with remittance income (Beaton et al. 2017, pg. 28-33). Foreign aid flows are often
discussed as an important method of assisting underdeveloped world, yet are dwarfed by
remittance flows; for example, Guatemala received about 300 million dollars in foreign aid
34

allotments from the United States (USAID 2018), while also benefiting from over 6.5 billion
dollars in remittances, nearly 10 percent of the nation’s GDP (Wormald 2018). There is a
greater degree of reliability with a financial flow based on individual, microeconomic decisions
rooted in family connections, rather than a financial flow determined through political forces and
influences unbound by those social factors. All that said, caution must define remittance
regulation given how much is on the line for immigrants and their communities.
Lowering the baseline, the maximum, and the minimum all have separate effects. The
lowering of the maximum could have the effect of further increasing immigrants response to
remittance caps. For example, immigrants who wish to remit the largest amount of their income
would need to become even more attuned to local considerations, and thus even more sharply
maximize social good and minimize social ill in a well-constructed system. Not all immigrants
aim to remit as much, and so its effects could be relatively paltry. A reduction in the minimum
might have little actual effect, since many immigrants living in such low-remit regions may
simply not remit any income, or so little that it does not factor into their work-life decisions.
Lowering the baseline could have large-scale effects on immigrant work-life decisions, and at
least until immigrants responded to such changes, could result in significantly fewer total
remittance flows.
Furthermore, such a system could prioritize any factor proposed, such as placing the
well-being of unskilled laborers first and using that score of the region to determine a great part
of the remittance cap. Alternatively, diversity considerations may also be worthy of the most
interest, or local capacity utilization if many localities are facing major internal migrations. As
aforementioned, to propose a remittance regulation system is akin to asking what immigration’s
impacts and consequences are for the immigrant’s resident country; as such if the phenomenon
is shown to have more negative effects (or positive ones for that matter), more factors could
included. Such a framework allows for a variety of differing policy priorities, and the addition of
other factors would be welcome as long as they assist in the goals of maximizing social good
and minimizing social ill.
The Ethics of Remittance Regulation
At the risk of sounding like an alarmist about my own policy proposal, postal-based
remittance regulation could have enormously detrimental effects on immigrant and foreign
communities if done haphazardly and in an uninformed fashion. The power of politics could
35

intrude even further into the lives of immigrants, with negative consequences for the developing
world as well. One could foresee an immigrant in the United States needing to remit large sums
of money in order for that person’s mother or father to be able to afford medicine or a life-saving
medical procedure. By limiting that immigrant’s remitting ability, the family may suffer
tremendous loss and trauma. An essential part of maximizing social benefit is preventing the
unnecessary burying of innocent people, whether in the United States or overseas. In all of
these discussions, keeping an eye to the humane treatment of immigrants is tantamount to
establishing a humane society, and of fulfilling America’s historical promise of being a
welcoming homeland for the world’s oppressed.
To create a more humane system, the Postal Service should establish a procedure for
the permitting of an unlimited remittance cap for a period of time to individual immigrants so
they can assist family overseas in their struggles. If an immigrant needed to remit a larger sum,
the Postal Service could establish a system in which they would transfer the funds yet forgo
transfers for a certain number of months after. Additionally, if a country such as Mexico or
Indonesia were facing a natural disaster, a waiver to all immigrants from those countries could
be permitted for a period of several months to partially help with recovery.
Further, it is reasonable to question the merit of regulating remittances on both
pragmatic and principled grounds. It could be contended that remittances lack the potential
policy prowess as I propose, with neither the necessary consumer base nor an important
enough factor for individual immigrants to consider. Yet, if a low-fee and accessible public
remittance service were established the market conditions would be drastically different,
especially if accompanied by a legal mandate in the immigration system. As discussed
previously, remittance incomes are vital for developing economies as well as the workers and
families which compose it, including those abroad. Remittances also have an investing angle.
Rather than coming purely out of familial altruism, self-interested financial investments are
another avenue of remittance income (Meckel 2008, pg. 21-22). Thus, regulation which affects
an individual's ability to engage in such an important function would provoke reactions, hopefully
in line with combined interests of concerned stakeholders.
Conclusion
Remittances up until this date have been largely neglected within many discussions of
immigration policy. Within this paper a sketch of a possible structure which, even if rough,
36

exemplifies the scope of this policy, as well as an interesting path forward for immigration policy.
I contend that postal remittance services can improve the well-being of immigrants, their
families, their home countries, as well as a domestic institution in the Postal Service.
Furthermore, remittance regulation as detailed above offers the possibility of maximizing
immigration’s overall effects upon society by correcting its possible negative wage effects,
maximizing its potential to diversify workplaces and hence increase productivity growth, fight
segregation and racial discrimination, and help struggling towns and cities regain population
and a tax base. Immigrants and their families domestic and abroad will benefit from a
consistent, accessible, and affordable remittance service stationed as close as the local post
office. Although bold or outlandish depending on one’s perspective, the task of public policy is to
tackle the public’s problems with every means necessary and proper. If that means rethinking
American immigration and remittance policy, so be it.
References
Arizona v. United States, 567 U.S. 387 (2012).
Baradaran, Mehrsa. A Brief History of the U.S. Postal Banking System. Slate Magazine. (Aug.
2014).
www.slate.com/articles/news_and_politics/history/2014/08/postal_banking_already_work
ed_in_the_usa_and_it_will_work_again.html
Beaton, Kimberly, Svetlana Cerovic, Misael Galdamez, Metodij Hadzi-Vaskov, Franz Loyola,
Zsoka Koczan,
Bogdan Lissovolik, Jan Martijn, Yulia Ustyugova, and Joyce Wong. Migration and Remittances
in Latin America and the Caribbean: Engines of Growth and Macroeconomic Stabilizers?
IMF Working Papers17, no. 144 (2017): 1. doi:10.5089/9781484303641.001.
Bell, Alexander, Raj Chetty, Xavier Jaravel, Neviana Petkova, and John Van Reenen. Who
Becomes an Inventor in America? The Importance of Exposure to Innovation. (2017).
doi:10.3386/w24062.
Blinder, Alan S. The Mystery of Declining Productivity Growth. The Wall Street Journal. (May
2015).
http://www.wsj.com/articles/the-mystery-of-declining-productivity-growth-1431645038
Borjas, George J., Richard B. Freeman, Lawrence F. Katz, John Dinardo, and John M. Abowd.
How Much Do Immigration and Trade Affect Labor Market Outcomes? Brookings Papers
on Economic Activity1997, no. 1 (1997): 1. doi:10.2307/2534701.
37
Borjas, George J. Making It in America: Social Mobility in the Immigrant Population. The Future
of Children 16, no. 2 (2006): 55-71. doi:10.1353/foc.2006.0013.
Borjas, George. Yes, Immigration Hurts American Workers. Politico, (Sept./Oct. 2016),
www.politico.com/magazine/story/2016/09/trump-clinton-immigration-economy-unemploy
ment-jobs-214216.
Bratsberg, Bernt, and Oddbjørn Raaum. Immigration and Wages: Evidence from Construction.
The Economic Journal, vol. 122, no. 565, 2012, pp. 1177–1205.,
doi:10.1111/j.1468-0297.2012.02540.x.
Corkery, Michael. Immigrants From Latin America and Africa Squeezed as Banks Curtail
International Money Transfers. The New York Times. (July 2014).
http://dealbook.nytimes.com/2014/07/06/immigrants-from-latin-america-and-africa-squee
zed-as-banks-curtail-international-money-transfers/
Foote, Andrew, Mark Kutzbach, and Lars Vilhuber. Driving Past Commuting Zones:
Re-examining Local Labor Market Definitions. Center for Economic Studies, Labor
Dynamics Institute, Cornell University. (Dec. 2016).
Frey, William H. Black-white Segregation Edges Downward since 2000, Census Shows.
Brookings Institute. (Dec. 18, 2018).
http://www.brookings.edu/blog/the-avenue/2018/12/17/black-white-segregation-edges-d
ownward-since-2000-census-shows/
Freund, Caroline, and Nikola Spatafora. Remittances, Transaction Costs, and Informality.
Journal of Development Economics 86, no. 2 (06 2008): 356-66.
doi:10.1016/j.jdeveco.2007.09.002.
Galatsidas, Achilleas. Sustainable Development Goals: Changing the World in 17 Steps. The
Guardian. (Jan. 2015).
http://www.theguardian.com/global-development/ng-interactive/2015/jan/19/sustainable-
development-goals-changing-world-17-steps-interactive
Greulich, Erica, John M. Quigley, and Steven Raphael. The Anatomy of Rent Burdens:
Immigration, Growth, and Rental Housing. Brookings-Wharton Papers on Urban
Affairs2004, no. 1 (2004): 149-205. doi:10.1353/urb.2004.0006.
Grieco, Elizabeth, Patricia De Le Cruz, Rachel Cortes, and Luke Larsen. “Who in the United
States Sends and Receives Remittances? An Initial Analysis of the Monetary Transfer
Data from the Aug. 2008 CPS Migration Supplement.” United States Census Bureau,
38

Working Paper No. POP-WP087 (Nov. 2010).
https://www.census.gov/library/working-papers/2010/demo/POP-twps0087.html
Guttentag, Lucas. “Immigration Preemption and the Limits of State Power: Reflections on
Arizona v. United.” Stanford Journal of Civil Rights & Civil Liberties,vol. 9, iss. 1 (Jan.
2013). Herring, Cedric. Does Diversity Pay?: Race, Gender, and the Business Case for
Diversity. American Sociological Review74, no. 2 (Apr. 2009): 208-24.
doi:10.1177/000312240907400203.
International Development Bank. Sending Money Home: Leveraging the Development Impact of
Remittances. Inter-American Development Bank Multilateral Investment Fund. (Oct.
2006).
https://publications.iadb.org/bitstream/handle/11319/593/Sending%20Money%20Home
%3a%20Leveraging%20the%20Development%20Impact%20of%20Remittances.pdf?se
quence=1&isAllowed=y
Kershaw, Sarah. For Schenectady, A Guyanese Strategy; Mayor Goes All Out to Encourage A
Wave of Hardworking Immigrants. The New York Times. (July 2002).
http://www.nytimes.com/2002/07/26/nyregion/for-schenectady-guyanese-strategy-mayor
-goes-all-encourage-wave-hardworking.html?utm_source=affiliate&utm_medium=ls&utm
_campaign=hL3Qp0zRBOc&utm_content=486358&utm_term=1&siteID=hL3Qp0zRBOc-
rXi9SF6qDJSSjHrOHDkXAg
Jamieson, Alastair. Report: HSBC Allowed Money Laundering That Likely Funded Terror,
Drugs. NBC. (July 2012).
http://www.nbcnews.com/business/report-hsbc-allowed-money-laundering-likely-funded-t
error-drugs-889170
Longhi, Simonetta, Peter Nijkamp, and Jacques Poot. Meta-Analyses of Labour-Market Impacts
of Immigration: Key Conclusions and Policy Implications. Environment and Planning C:
Government and Policy 28, no. 5 (Nov. 2010): 819-33. doi:10.1068/c09151r.
https://journals.sagepub.com/doi/pdf/10.1068/c09151r
Perez-Lopez, Jorge, and Sergio Diaz-Briquets. The Determinants of Hispanic Remittances: An
Exploration Using U.S. Census Data. Hispanic Journal of Behavioral Sciences20, no. 3
(Aug. 1998): 320-48. doi:10.1177/07399863980203003.
https://journals.sagepub.com/doi/pdf/10.1068/c09151r
39

Ritholtz, Barry. Congress, Not Amazon, Messed Up the Post Office. Bloomberg.(Apr. 2018),
https://www.bloomberg.com/opinion/articles/2018-04-04/congress-not-amazon-messed-
up-the-u-s-postal-service
Saiz, Albert. Immigration and Housing Rents in American Cities. Journal of Urban Economics61,
no. 2 (Mar. 2007): 345-71. doi:10.1016/j.jue.2006.07.004.
Sherman, Erik. Median Wealth Of Black And Latino Families Could Hit Zero By The Middle Of
The Century. Forbes.(Sept. 2017).
http://www.forbes.com/sites/eriksherman/2017/09/11/median-wealth-of-black-and-latino-f
amilies-could-hit-zero-before-the-centurys-end/#218d3e750f6a
Singer, Audrey. Welfare Reform and Immigrants: A Policy Review. Brookings Institute Report
(May 2004). https://www.brookings.edu/wp-content/uploads/2016/06/200405_singer.pdf
Sparber, Chad. Racial Diversity and Macroeconomic Productivity across US States and Cities.
Regional Studies44, no. 1 (Jan. 2009): 71-85. doi:10.1080/00343400802360436.
Suh, Michael. Average Annual Immigration for Racial and Ethnic Groups, Estimated and
Projected, for Five-Year Periods: 1960-1965 to 2060-2065. Pew Research Center's
Hispanic Trends Project. (Sept. 2015).
http://www.pewhispanic.org/2015/09/28/modern-immigration-wave-brings-59-million-to-u
-s-driving-population-growth-and-change-through-2065/9-26-2015-1-30-10-pm/
Trager, Lillian. Migration and Remittances: Urban Income and Rural Households in the
Philippines. The Journal of Developing Areas, Vol. 18, No. 3 (Apr. 1984), pp. 317-340,
https://www.jstor.org/stable/pdf/4191261.pdf?refreqid=excelsior%3A1aef0565f99a62204
64f77591c872326
Trombley, Nathan Edward. Remittance Behavior of US Immigrants. Trace. (Aug. 2016).
http://trace.tennessee.edu/cgi/viewcontent.cgi?article=5127&context=utk_gradthes
Tsang, Watkins. Integration of Immigrants: The Role of Ethnic Churches. Journal of
International Migration & Integration, Vol. 16 Issue 4 (Sept. 2014), p1177-1193. 17p.
United States Agency for Internal Development. U.S. Foreign Aid by Country. (July 2018).
https://explorer.usaid.gov/cd/GTM?fiscal_year=2016&measure=Obligations
United States Economic Research Service, Rural Economy Division. Commuting Zones and
Labor Market Areas. ERS staff paper; no. 9614. Tolbert, Charles and Molly Sizer.
(1996). https://permanent.access.gpo.gov/lps47146/LMACZ1990.pdf#?
40

United States Congressional Budget Office. Migrants’ Remittances and Related Economic
Flows. (Feb. 2011).
https://www.cbo.gov/sites/default/files/112th-congress-2011-2012/reports/02-24-remittan
ceschartbook.pdf
United States Federal Reserve Bank of Chicago. Remittance Behavior among New U.S.
Immigrants. Meckel, Katherine. (Nov. 2008).
https://www.chicagofed.org/~/media/publications/working-papers/2008/wp2008-19-pdf.p
df
United States, Office of the Inspector General. Providing Non-Bank Financial Services for the
Underserved. (Jan. 2014).
https://www.uspsoig.gov/sites/default/files/document-library-files/2015/rarc-wp-14-007_0.
United States, Congressional Budget Office. Migrants’ Remittances and Related Economic
Flows. (Feb. 2011).
https://www.cbo.gov/sites/default/files/112th-congress-2011-2012/reports/02-24-remittan
ceschartbook.pdf
United States, Postal Service. A Decade of Facts and Figures. (2018).
https://facts.usps.com/table-facts/
Wormald, Benjamin. Remittance Flows Worldwide in 2016. Pew Research Center's Global
Attitudes Project. (Jan. 2018). http://www.pewglobal.org/interactives/remittance-map/
World Bank. Migration and Development Brief 28. (Oct. 2017).
https://www.knomad.org/sites/default/files/2017-12/Migration%20and%20Development%
20Report%2012-14-17%20web.pdf
World Bank, Migration and Remittance Data: Remittance Outflows. (Nov. 2017).
http://www.worldbank.org/en/topic/migrationremittancesdiasporaissues/brief/migration-re
mittances-data
World Bank. Migration and Remittances Factbook 2016: Third Edition. World Bank Group. (Mar.
2016).
https://siteresources.worldbank.org/INTPROSPECTS/Resources/334934-119980790880
6/4549025-145045 5807487/Factbookpart1.pdf
41

Did World War II Help the US End the Great Depression?
Yizhen (Lucy) Liu Mount Holyoke College
Abstract
I evaluate whether World War II caused American recovery from the Great Depression and find instead that expansionary monetary policies helped the US emerge from recession. World War II in fact sharmed the US economy at the microeconomic level. I compare US economic performance to predictions from two classical models: a model of the market for loanable funds; and a model of the labor market. I use these two models to test whether monetary expansion or wartime spending fueled the recovery, and find that the increase in the money supply stimulated the US economy and helped end the Great Depression.
Did World War II help end the Great Depression in the United States? The Great
Depression is the most well-known recession in the twentieth century; in the US, the GDP did
not return to the level before the Great Depression until the US entered World War II, which left
major population with the impression that World War II helped to end the recession. Meanwhile,
some people believe that the US economy could recover without entering the war, and World
War II was accidently happened at the time when the recovery was about to complete.
Therefore, whether the war played an important role in helping boost the economy has been a
long-lasting debate. I want to figure out whether the US could recover from the Great
Depression without entering World War II, and further, if I can generalize this conclusion to
answer more widespread problems, like whether entering a war will aid a country in ending a
national recession. I plan to approach the topic by trying to answer the following questions: a)
Are wars necessary for a country to recover from a recession? b) If a war is not necessary for
economic recovery, then what is the main and best source of recovery for a country? And lastly,
c) is war positive for the economy? This essay will explore these questions based on five
previous pieces of research, and discuss two models that are related to the questions. Even
though four of the five research studies focus on the relationship between the Great Depression
and World War II, they approach the topic from different viewpoints and hold different
perspectives.
A widely accepted idea is that with the huge government spending on World War II
armaments, wartime spending fiscally stimulated the economy and was the principal reason for
42

the end of the Depression. However, Romer (1993) mentions that before the preparation of
World War II, the US economy had already begun to recover in 1933 because of the increases
in the money supply. Thus, she claims that the war cannot be the main source that moved the
US out of the Depression, although she acknowledges that World War II has a positive effect.
According to Romer (1993), without entering World War II, the US economy was still able to
recover from the economic recession. Comparing the consequences of the war and the fiscal
policies adopted by the Federal Reserve in the spring of 1932, Romer (1992) expands her idea
and points out that even before the war had a noticeable impact on finance, the recovery was
nearly completed by prior fiscal policy and spending. Therefore, fiscal policy rather than World
War II was the real main source that helped the US end the Great Depression.
On the other hand, though holding the same conclusion that World War II was not the
major force that brought the Great Depression to an end, Steindl (2007) argues against Romer’s
idea that the main source of recovery was fiscal policy. Steindl (2007) points out that Romer’s
analysis has ignored the regression which happened in the late 1930s. During the economic
recession from 1937 to 1938, prices declined although the money supply continued to increase.
Therefore, the growth of the money supply--caused by fiscal policy initiatives beginning in 1933
and gold inflows from Europe--was not the driving force for the end of the Great Depression
because the economy did not fully recover until 1942. Instead, Steindl (2007) argues that two
forces helped the economy return to an upward trend. The first one was the increase in money
demand, and the second one was the inherent upward movement in the economy obscured by
Word War II. Steindl provides a lot of graphs to support his viewpoint, and directly claims that
the war was not necessary for economic recovery.
Although Steindl’s argument seems reasonable, Irwin (2012) provides another view on
the cause of the 1937-38 recession. Irwin (2012) illustrates that the expansionary monetary
policy was based on large gold inflows in the mid-1930s as the M2 money supply grew at about
12% per year from 1934 to 1936, but stopped growing in 1937 and even began to decrease.
This was because the Treasury Department decided to block all the gold inflows, starting in
December 1936 as the administration was worried about inflation. After the Treasury
Department ended the policy in April 1938, the economy began to recover from the second
recession in June. Thus, the recession of the late 1930s was the result of the shortage of M2
money supply. Based on Irwin’s conclusion, I argue that Steindl’s view alone is not enough to
question the validity of Romer’s theory because the recession of 1937 was also caused by a
43

shortage of money supply. Thus, I use Romer’s viewpoint as the basic assumption in the
following analysis.
Both Romer and Steindl admit that World War II had a positive economic effect to some
extent (Romer, 1993; Steindl, 2007). In contrast, Horwitz and McPhillips (2013) offer a new
approach when they only discuss World War II’s economic impact on American residents.
Collecting a series of advertisements from an electric company, and American households’
personal letters during World War II, they draw a conclusion that though the war seemingly led
to a boom in macroeconomic aggregates, households’ living standards regressed greatly during
wartime (Horwitz & McPhillips, 2013). Hence, World War II did not help the US end the Great
Depression, and even worsened the economy based on the regression of average households’
living standards.
After analyzing the five articles, I conclude that the expansionary monetary policy was
the primary source of the US recovery, and World War II had a negative effect at the
microeconomic level. To verify the statement and to further explore the economic consequences
of World War II, I use two models to examine the historical data: the model that explains the
market of loanable funds and the model of the labor market. The Great Depression started in
1929 with the stock market crash. Economists generally consider the Federal Reserve’s
decision in 1928 to open market sells as the primary source of the recession. During the
recession, what worsened the situation was that people did not trust the bank anymore, so they
simultaneously drew their money back, which reduced the money supply and caused a higher
interest rate. This condition is called a bank panic. Moreover, due to the deflation, the price of
goods fell continually, so nationwide consumption also declined because people preferred to put
off purchasing goods to the future rather than buying them now. In order to solve the bank panic
and stimulate consumption, the Federal Reserve adopted an expansionary monetary policy in
1932, which increased the money supply greatly.
44

Figure 1: Market for Loanable Funds
Source: Williamson (2014) p. 446-448.
I test and verify whether the increase in money supply was the main source of the recovery by
analyzing the market of loanable funds. The model consists of an upward-sloping supply curve
and a downward-sloping demand curve, with the quantity of loanable funds on the x-axis and
real interest rates on the y-axis. The supply curve is upward sloping and the demand curve is
downward-sloping because people are more likely to loan to others but less willing to borrow
money with higher real interest rates. Their intersection is the equilibrium point. From the model,
I can learn that an increase in the money supply will shift the upward supply curve to the right,
which leads to the decrease of real interest rates and the increase of the quantity of loanable
funds. If the money supply declines, the real interest rate will rise and the quantity of loanable
funds will decline. Therefore, the crash of the stock market and bank panic could be the
consequences of the decreasing money supply in 1929 and could be solved by the
expansionary fiscal policy that was adopted in 1933.
45
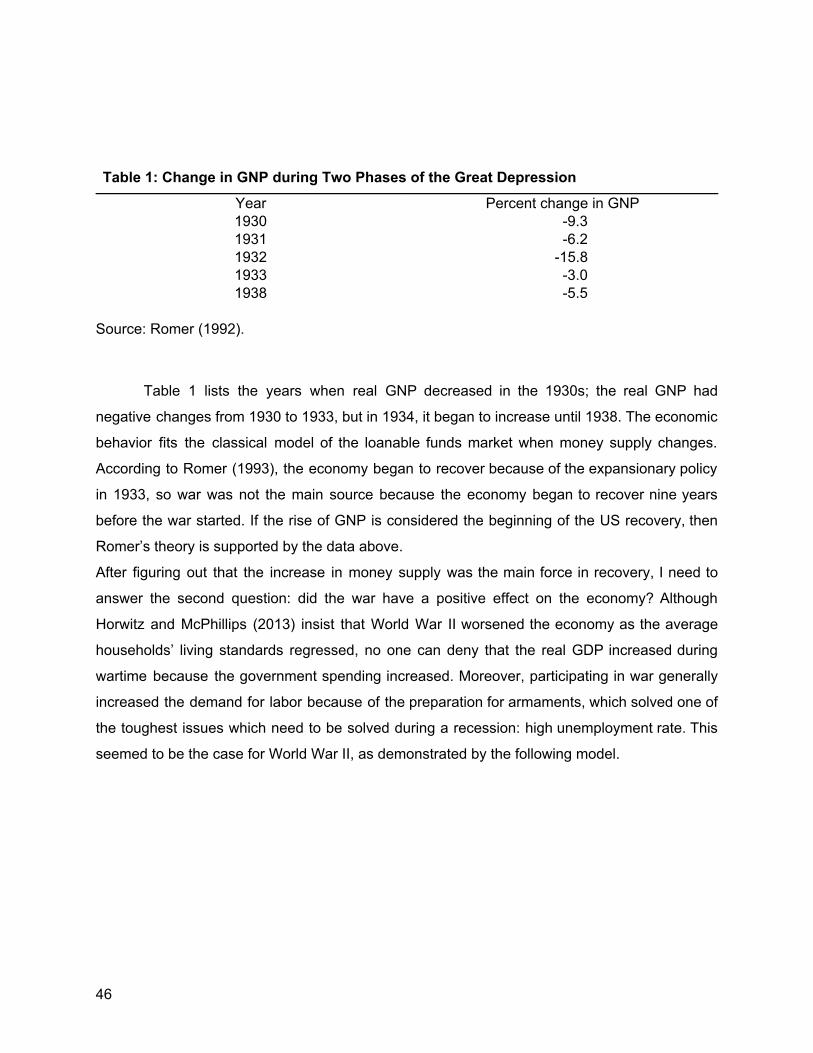
Table 1: Change in GNP during Two Phases of the Great Depression
Year Percent change in GNP 1930 -9.3 1931 -6.2 1932 -15.8 1933 -3.0 1938 -5.5
Source: Romer (1992).
Table 1 lists the years when real GNP decreased in the 1930s; the real GNP had
negative changes from 1930 to 1933, but in 1934, it began to increase until 1938. The economic
behavior fits the classical model of the loanable funds market when money supply changes.
According to Romer (1993), the economy began to recover because of the expansionary policy
in 1933, so war was not the main source because the economy began to recover nine years
before the war started. If the rise of GNP is considered the beginning of the US recovery, then
Romer’s theory is supported by the data above.
After figuring out that the increase in money supply was the main force in recovery, I need to
answer the second question: did the war have a positive effect on the economy? Although
Horwitz and McPhillips (2013) insist that World War II worsened the economy as the average
households’ living standards regressed, no one can deny that the real GDP increased during
wartime because the government spending increased. Moreover, participating in war generally
increased the demand for labor because of the preparation for armaments, which solved one of
the toughest issues which need to be solved during a recession: high unemployment rate. This
seemed to be the case for World War II, as demonstrated by the following model.
46

Figure 2: Labor Market
Source: Williamson (2014) p. 195-196.
In the model of the labor market, the quantity of labor is on the x-axis and the real wage is on
the y-axis. The demand curve is downward sloping because employers tend to hire fewer
workers or reduce working hours as real wage rises; otherwise, the cost of production will
increase. The supply curve is upward sloping because people tend to work more as the rate of
real wages rises. The intersection of the supply curve and the demand curve is the equilibrium
point. According to the model, the demand curve will shift to the right due to an increase in labor
demand. As a result, the real wage and quantity of labor will also increase. Therefore, the
increase of labor demand will cause a decrease in the unemployment rate and an increase in
the real wage. From Table 2 and Figure 3, I can deduce that during World War II, the
unemployment rate fell from 15% to 2%, and the real wage increased from 0.52 dollars per hour
to 0.90 dollars per hour. Economic behavior fits the classical model of the labor market when
labor demand increases. This fact supports the assumption that World War II increased the
demand for labor, and thereby reduced the unemployment rate, which means it had a positive
effect on the US economy.
47

Table 2: Avg. Hourly Earnings in Manufacturing (Production & Nonsupervisory Workers)
Year Dollars per hour 1940 0.52 1941 0.60 1942 0.75 1943 0.86 1944 0.91 1945 0.90
Source: Federal Reserve Bank of St. Louis (2018).
Figure 3: US Unemployment Rate, 1940-45
Source: American Social History Project Center for Media and Learning (2018).
48
From these two models, I can determine that the start and the end of the Great Depression are
strongly connected to the market of loanable funds because the recession began as the stock
market crashed and recovered as the monetary policy was adopted. Moreover, the
unemployment rate, which increases during recessions, is closely related to the labor market.
Together with the data and previous studies, the models provide the answer to my question: did
World War II helped the US end the Great Depression? I draw the conclusion that to recover
from the Great Depression, World War II was not a necessary source. Although it is positive on
a macroeconomic level to some extent, its effects on a microeconomic level are negative.
Hence, war is not the optimal choice for ending a recession.
Work Cited
American Social History Project Center for Media and Learning. (2018). Graph of US
Unemployment Rate, 1930-1945. Retrieved November 19, 2018, from
https://herb.ashp.cuny.edu/items/show/1510.
Federal Reserve Bank of St. Louis. (2018). Average Hourly Earnings of Production and
Nonsupervisory Employees: Manufacturing. Retrieved November 19, 2018, from
https://fred.stlouisfed.org/series/CES3000000008.
Horwitz, S., & McPhillips, M. J. (2013). The Reality of the Wartime Economy: More Historical
Evidence on Whether World War II Ended the Great Depression. The Independent
Review, 17 (3): 325-47.
Irwin, D. A. (2012). Gold Sterilization and the Recession of 1937-1938. Financial History
Review, 19(3): 249-67.
Romer, C. D. (1992). What Ended the Great Depression? Journal of Economic History, 52 (4):
757-84.
Romer, C. D. (1993). The Nation in Depression. Journal of Economic Perspectives, 7 (2): 19-39.
Steindl, F. G. (2007). What Ended the Great Depression? It Was Not World War II. The
Independent Review, 12 (2): 179-97.
Williamson, S. D. (2014). Macroeconomics. Boston: Pearson.
49

The Federal Reserve System: A Look at Our Country’s
Premier Financial Institution Abhay Partap Singla
University of Massachusetts Amherst
Abstract
The Federal Reserve System (also known as the Federal Reserve or simply the Fed) is the central banking system of the United States of America. Its mandate is to promote a strong U.S. economy, by ensuring maximum sustainable employment, stable prices, and moderate long- term interest rates. The functioning of this institution affects the finances of each and every citizen of this country. This article’s main objective is to analyze the working of this prime institution and also argue about whether we need a change in the system, so to confirm its ideal functioning.
Introduction
Before the creation of our country’s Federal Reserve, the Congress implemented various
short-lived experiments to illustrate the distinct views held by the public, regarding the execution
of monetary policy and the working of the financial system. During that time, the outcome of
these experiments was considered very alarming as in the background, our economy was
facing one serious financial crisis after another. This further resulted in the paralyzing of our
entire financial industry and also brought an abrupt stop to our once-booming economy. To
counter this, Congress enacted the Federal Reserve Act of 1913. This Act resulted in the
formation of the Federal Reserve System in the United States. According to me, the ideal role of
the Federal Reserve System is to constantly develop and maintain a healthy and efficient
monetary system, with its primary goal of maintaining stable prices and maximum employment.
As of today, the Federal Reserve system is divided into four parts: a central authority network
termed as the Board of Governors, a decentralized network of twelve Federal Reserve banks,
the Federal Open Market Committee (FOMC) and the Federal Advisory Council (FAC).
Branches of The Federal Reserve System
The Board of Governors is the main governing body of the Federal Reserve System. The
board comprises seven members. They are generally nominated by the President and are
50
confirmed by the Senate, for a tenure of fourteen years. One term begins every two years,
starting on February 1 of even-numbered years. A member who serves an entire tenure cannot
get reappointed in the future. Also, a member who completes an unexpired portion of a term can
get reappointed. All the terms end on their statutory date, regardless of the date on which the
member is sworn in to their respective office. The Board’s main aim is to analyze both the
domestic and international economic developments and also to align the Federal Funds Rate
with the target set up by the FOMC. The Board also supervises and regulates the operations of
the Federal Reserve Banks. They are also responsible for our country’s payments system and
they generally overlook and administer most of the consumer credit protection laws of our
country.
The twelve regional Federal Reserve Banks were established by Congress, as the
operating arms of the nation's central banking system. They essentially carry out the regular,
day to day operations like holding the cash reserves of depository institutions and setting the
monetary policy. They move the currency and coin into and out of circulation and further, collect
and process millions of checks each day. They provide checking accounts for the Treasury,
issue and redeem government securities, and act in other ways as a fiscal agent for the
Government. The Reserve Banks participate in literally all of the primary activities responsible
for the functioning of the Federal Reserve System. Their board of directors come from various
commercial financial organizations, which are also a member of the Fed, and also some certain
and proficient individuals who represent each of their very own districts. Each President of these
banks is appointed by the Board of Governors. Figure 1 shows the regions.
51

Figure 1: Regional Federal Reserve Banks
The Federal Open Market Committee (FOMC) is the Fed’s monetary policymaking body.
It consists of twelve members--the seven members of the Board of Governors of the Federal
Reserve System; the president of the Federal Reserve Bank of New York; and four of the
remaining eleven Reserve Bank presidents, who serve one-year terms on a rotating basis. It is
very much responsible for open market operations. It is scheduled to meet several times a year
to discuss whether to maintain or change any current economic policy. Generally, the FOMC
sets the targeted Federal Funds Rate. Below is a graph depicting the Federal Funds Rate from
the previous years.
52

Figure 2: Federal Funds Target Rate
53

The Federal Advisory Council is an organization composed of the representatives
elected by the twelve Federal Reserve Banks. Their aim is to deal with all the matters existing
within the board’s jurisdiction. The council and the Board of Governors discuss current financial
and business conditions and make recommendations for potential policy changes. The council
does research for the Board of Governors. The council doesn’t have the authority to make
policies, but its input and advice do influence matters that are within the Board of Governors’
jurisdiction.
Modifications
To begin with, The Fed should possess certain independence as it will result in proper
decision making, which is very much essential for the execution of monetary policy. But it also
should be constantly regulated by the government. Transparency is vital in ensuring
accountability to the public. And for the ideal structure, there are some amendments required in
the election procedures. The power of electing individuals to these higher ranks shouldn’t be all
concentrated at one end only. The term of the Chairman should be conterminous with that of the
President’s tenure. There should be another district in the western region, to operate a branch
of the Federal Reserve Bank like the one in San Francisco is governing the entire western
region, even including the states of Alaska and Hawaii. Further, the Fed should develop some
conditions to check how big companies and financial institutions adapt and are vulnerable to
sudden funding shocks and liquidity shocks. They should further overlook all the assets and
capital owned by the U.S branches of the foreign banks. The Fed is way too friendly with the big
banks, and that should be seriously regulated. It might be because of the importance of these
institutions towards the whole economy. These banks are literally classified as “too big to fail”.
The Fed should try to act as ethically as possible, and it should also increase the reserve
requirement ratio so that during the crisis, it can easily bail out the commercial banks in trouble.
54

Figure 3: The Federal Reserve System
55

Conclusion
My main aim to write this article was to help in explaining the fundamental workings of an
institution, as crucial as the Fed, whose decisions impact our daily lives to the very core. With all
its arsenal, the Fed was able to combat the aftermath of the financial crisis of 2008. Great
efficiency and proper decision making resulted in the lowering of the unemployment rate, which
is at a low of around 3.6%. Meanwhile, the inflation rate is stable at around 1.8%. The Fed has
more power and influence on financial markets than any other legislative entity. Today, the
Fed’s prime objective should always be to act ethically and try to steer the economy in the right
direction. It should also try to reduce income inequality among the masses. Below are the
graphs associated with the inflation rate and the unemployment rate, years from the end of the
Recession.
56

Figure 4: Fed Mandate for Price Stability
57

Figure 5: Fed Mandate for Maximum Employment
58

References
Chen, J. (2019, November 18). Federal Reserve System. Retrieved from
https://www.investopedia.com/terms/f/federalreservebank.asp.
Beattie, A. (2019, November 18). How The Federal Reserve Was Formed. Retrieved from
https://www.investopedia.com/articles/economics/08/federal-reserve.asp.
Current US Inflation Rates: 2009-2019. (2019, November 13). Retrieved from
https://www.usinflationcalculator.com/inflation/current-inflation-rates/.
United States Unemployment Rate. (n.d.). Retrieved from
https://tradingeconomics.com/united-states/unemployment-rate.
59
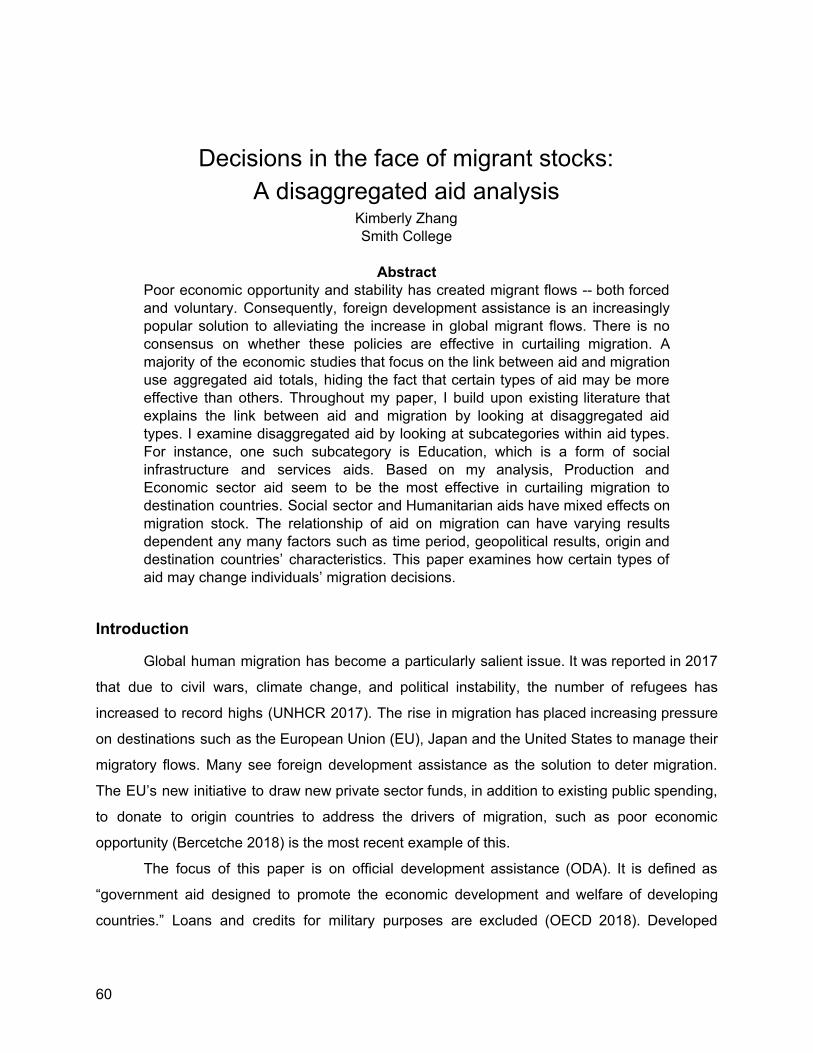
Decisions in the face of migrant stocks: A disaggregated aid analysis
Kimberly Zhang Smith College
Abstract
Poor economic opportunity and stability has created migrant flows -- both forced and voluntary. Consequently, foreign development assistance is an increasingly popular solution to alleviating the increase in global migrant flows. There is no consensus on whether these policies are effective in curtailing migration. A majority of the economic studies that focus on the link between aid and migration use aggregated aid totals, hiding the fact that certain types of aid may be more effective than others. Throughout my paper, I build upon existing literature that explains the link between aid and migration by looking at disaggregated aid types. I examine disaggregated aid by looking at subcategories within aid types. For instance, one such subcategory is Education, which is a form of social infrastructure and services aids. Based on my analysis, Production and Economic sector aid seem to be the most effective in curtailing migration to destination countries. Social sector and Humanitarian aids have mixed effects on migration stock. The relationship of aid on migration can have varying results dependent any many factors such as time period, geopolitical results, origin and destination countries’ characteristics. This paper examines how certain types of aid may change individuals’ migration decisions.
Introduction
Global human migration has become a particularly salient issue. It was reported in 2017
that due to civil wars, climate change, and political instability, the number of refugees has
increased to record highs (UNHCR 2017). The rise in migration has placed increasing pressure
on destinations such as the European Union (EU), Japan and the United States to manage their
migratory flows. Many see foreign development assistance as the solution to deter migration.
The EU’s new initiative to draw new private sector funds, in addition to existing public spending,
to donate to origin countries to address the drivers of migration, such as poor economic
opportunity (Bercetche 2018) is the most recent example of this.
The focus of this paper is on official development assistance (ODA). It is defined as
“government aid designed to promote the economic development and welfare of developing
countries.” Loans and credits for military purposes are excluded (OECD 2018). Developed
60

countries have been using ODA to curtail migration. This policy tool is predicated on the belief
that if developed countries can raise the quality of life of potential migrants in origin countries,
then individuals will be less inclined to migrate. Beyond the capital allocation question of
whether these billions of dollars in funds are effective, there lies a human motivation. Migration
is not easy. Year-to-date in 2018, there have been 2,806 migrant fatalities due to the physical
journey alone (International Organization for Migration 2018). Therefore, studying the
effectiveness of developmental aid policies can help policy makers to direct funds more
efficiently, and improve welfare on a global basis by reducing the percentage of people risking
their lives and allowing for greater development in majority sending countries.
Literature review
The relationship between migration and foreign ODA has not been understudied. The
existing literature suggests that aid’s capacity to deter migration is small at best, and even
shows that programs in formerly-poor countries have led to an increase in emigration. One way
scholars look at the aid-migration link is through income and budgetary constraint effects. The
income channel suggests that higher incomes, through developmental aid, will reduce
emigration, since the opportunity cost of moving increases. The budgetary constraint channel
builds off the fact that migration is costly and increased wealth from aid would decrease the
relative cost of migrating and will encourage movement. Especially because many poor families
view migration as an investment in their futures and an insurance policy against unexpected
economic events at home and decrease in migration costs would make migration easier
(Clemens and Postel 2018). Others point to a network effect resulting from bilateral aid
relations, where the existence of aid decreases the information cost about potential destinations
-- increasing migration to developed countries (Barthelemy et al. 2009). Studies like these,
however, examine this relationship at an aggregate level – lumping all types of aid like
humanitarian, social infrastructure, and debt forgiveness together.
The few disaggregated studies have shown a negative relationship between total aid
received and migration rates. Studies have focused primarily on the impact of foreign health aid
on the emigration rates of physicians (Moullan 2013) and agricultural aids’ impact on urban and
rural emigration (Gamso & Yuldashev 2018). The most recent study on the aid-migration builds
on Barthelemy’s gravity model using a disaggregated approach incorporating economic and
social infrastructure ODA spending. The results point to “a robust negative relationship between
aggregate aid received and emigration rates, which can be attributed to the dominance of the
61

public-services channel over the budgetary-constraint channel” (Lanati & Thiele 2018). Using
the example of infrastructure aid, they explain the public services channel simply: better roads
from ODA yield a positive externality of more foreign direct investment. As firms can use the
roads for commercial purposes, more jobs can be created. This is evidence that local services
are an important factor in developing migration decisions – even more than household wealth.
Based on these studies, there seems to be more to the story than what studies on
aggregated development aid data and migration flow show. My analysis will examine the
relationship between development aid and migration rates, as an extension of Lanati and
Thiele’s research. This will include ODA categories: Humanitarian Aid and Production Aid in
addition to Social and Economic Infrastructure and Services from Lanati and Thiele’s model. I
also include subcategories of each category such as Education and Water Supply. The Action
related to Debt, Program, Multisector and Other aid categories are left out, because these types
of aid are case-by-case and difficult to incorporate such categories and interpret their results
through the lens of my research question. This research aims to achieve greater clarity on how
different types of developmental aid effect recipient countries’ migration flows. I will be using an
approach similar to Lanati and Thiele’s gravity model to do my analysis.
Data
Below I describe the variables used in this analysis along with their sources and
explanations of what each variable measures. To build my dataset, I merge 6 different datasets
together, which are explained more in-depth below.
Table 1: Sectors and subsectors examined
● Economic infrastructure and services ○ Transport, communications ○ Energy ○ Banking, business and other services
● Humanitarian ● Production
○ Agriculture, forestry and fishing ○ Industry, mining and construction ○ Trade and tourism
● Social Infrastructure and services ○ Education ○ Water supply and sanitation
62

Table 2: Variable Sources and Notes
● Development Assistance Committee (DAC) bilateral aid: OECD. This dataset comes from the DAC, the world’s richest donor countries from the OECD. The DAC is a forum within the OECD that promotes developmental aid cooperation and other policies to contribute to the Sustainable Development Goals. The countries in the DAC are 30 of the world’s wealthiest donor countries in the OECD . Member countries, per
2
the OECD’s criteria, need to have existing strategies, policies and institutional frameworks for development cooperation, a history of giving aid and systems that promote accountability for aid given. More importantly, the data are broken out into detailed categories. Data from the Query Wizard for International Statistics (QWIDS), which preselects a general aid dataset to use, are shown below. The query selected the biggest categories and a selection of their subcategories. For example, Education is under the Social Infrastructure and Services umbrella. There are more subcategories of aid, but the QWIDS query only included some selected subcategories. A comprehensive analysis on the remaining subcategories has potential for new research, which will be discussed in the Further Thoughts section of this paper. The data spans from 2007 to 2015 and includes only donor country data. Organizations like the UN or the Bill and Melinda Gates Foundation excluded. To merge this dataset with the others, I define the donor country as the destination and the recipient country as the origin country. Due to this definition, the recipients/origin countries are not DAC countries. DAC countries do offer aid to each other and there is a considerable amount of migration within this group of countries, but my dataset does not capture these migration stocks. Omitting this group of data should not sway the results, as the DAC countries are among the wealthiest in the world and often, the most politically stable.
● GDP per capita in 2011 PPP: World Bank. Purchasing power parity is a method of standardizing the cost of goods in each country. It is calculated by examining the price of a similar “basket of goods” and comparing that same basket to another country.
● Migrant Stock by Origin and Destination: UN. The United Nations’ Population Division gathers data on the number of migrants in a given country. In some cases, due to missing data, they will project the number of migrants using trends. The UN defines an international migrant stock as people “born in a country other than that in which they reside.” They compile these estimates every five years, so this dataset only has information on migrant stock by origin and destination at year 2010 and year 2015.
● Distance between origin and destination, Common language, Colonized by destination country: United States International Trade Commission. This dataset is from the United States International Trade Commission and describes characteristics and relationships between two countries.
● Free, Partly Free, Not Free Status: Freedom House. Freedom House is an independent organization, which is dedicated to the expansion of freedom and
2 Note that there are fewer than 30 donor countries in this dataset, as some countries elect not to report these figures or only participate in other forms of aid types that are omitted here such as Multi Sector or Program aid.
63

democracy in the world. They analyze the state of political and civil rights around the world and designate scores to reflect the situation at a given country and construct three measures to score and rate countries and territories in the world to capture the extent of freedom. I use their Status variable, which is a composite of a country’s political and civil rights scores. Status has three levels: Free, Partly Free and Not Free. For the purposes of this analysis, I make Status a binary variable in which Free and Partly Free are lumped together under “Free” denoted by 1 and countries that are classified as “Not Free” as denoted by 0.
● Conflict: Uppsala Conflict Data Program (UCDP). I use the UCDP/PRIO Armed Conflict Dataset. I use the incompatibility variable to capture the existence of conflict using a binary variable. An incompatibility is the use of armed force between two parties, with the government of a state being a counterparty, that results in at least 25 battle-related deaths in a calendar year. The existence of a conflict, as defined by UCDP/PRIO is denoted by 1 and no conflict is denoted by 0.
64

Table 3: Categorized Summary Statistics, by Period
65

Table 4: Uncategorized Summary Statistics, by Period
66

From the summary statistics, I observe that the dataset used for Period 1 (2007 - 2010)
has a total of 3,990 number of observations with 23 OECD destination countries and 124 origin
countries. Period 2 (2011 - 2015) dataset has 3,698 number of observations using 81 countries’
data with the categorized aid types (Categorized Summary Statistics). When looking at the data
in its selected subcategories or the uncategorized analysis, there is a total of 9,019 observations
and the same number of OECD destination and origin countries in Period 1. Period 2 has
19,856 observations in uncategorized analysis (Uncategorized Summary Statistics). In my
dataset, there is missing data due to unavailability or conditions that may not apply to the
specific country-year-aid pair. In the regressions, I omit the missing data. The data covers three
years using the 2010 estimate of migrant stock. This way, I can look at the effects of the various
types of aid over a course of three years. The standard deviations of Bilateral Aid and all the aid
types (Energy, Food Aid, Industry, Mining and Construction, Trade and Tourism, Transport and
Communications and Water Supply and Sanitation) are very high due to the highly variable
nature of aid that is dependent on relations between the destination and origin country like
distance, migrant stock and population (Gurevich and Herman 2018). Overall, migrant stock is
higher in all countries in the second period, which is consistent with the increasing pace of
migration globally. There is a considerable amount of focus, measured by number of
observations, on Social Infrastructure and Services Aid in both periods. The remaining
categories have roughly similar observations.
67

Figure 1: Number of observations by aid type
68

The following maps show the top donor countries in this dataset which are the United
States, Japan and the United Kingdom. Bilateral aid is a summation of the years covered in
each period. The darker the shading, the more bilateral aid donated. The top donors are
unchanged over the two periods.
Figure 2: Map of Top Donor Countries, Period 1 (2007-2010)
69

Figure 3: Map of Top Donor Countries, Period 2 (2011-2015)
70

The following data visualizations provide a more detailed look into the amount of aid
received in a specific year during each given time period. Notably, Afghanistan and Iraq show
up most frequently in the period from 2007 to 2010. In the second period (2011 to 2015), there
does not appear to be any trend in which countries appear in the top 30 recipients by aid type
each year. This could be due to factors such as geopolitical events such as Sudan and South
Sudan splitting into two countries in 2013 (CIA 2018) and the Crimean Peninsula being annexed
from Ukraine by the Russian Federation in 2014 (Treisman 2016).
Figure 4: Top Recipients by Aid Type and Amount
71

Gravity Model
I use a gravity model to determine the relationship between migration and development
aid. The gravity model looks at the interaction between migration flow and its drivers, in this
case, the types of developmental aid. The gravity model is the best choice for this analysis,
because the OECD developmental finance dataset reports bilateral net aid, and gravity models
can incorporate paired country time and fixed effects into a regression. The time effects will be
particularly helpful in this instance because amounts of bilateral aid vary over time as countries’
situations change. I estimate the following model:
igrant Stock β lnM i,j,t = 1 ln GDP per Capita( i,t) + β2 ln GDP per Capita( j,t)
Conf lict Free ln Landlocked + β3 i,t + β4 i,t + β5 (Distance) i,j + β6 i Common Language i Former Colony of j + β7 i,j + β8 i,j ln + β9 (1 ilateral Aid)+ B j→i,t + β10 ln (1 id Type)+ A j→i,t + δi + δj + δt + εi,j,t
Continuous variables are expressed using natural log to allow for interpretation of the
results as percent changes from proportional movements in the explanatory variables (World
Bank 2018). The dependent variable is the migrant stock that originated in country and is i
resident in country at time . I use migrant stock instead of migrant flow, because I can control j t
the unique characteristics of specific time periods, destination and origin. Migrant flow measures
the number of individuals entering/leaving a country during a specific period, whereas migrant
stock captures the number of migrants at a given point in time. The research question is
whether aid is effective in reducing the drivers of migration, but the decision to migrate depends
on time, origin and available destination countries. Using migrant flow would wash out these
variables in this analysis. This migrant stock data has only 2010 and 2015 estimates and the
OECD’s aid data covers 2007 to 2015. To extract the most data and acknowledge that some
time is needed to see aid’s effects, I split the aid data into two periods: 2007 to 2010 and 2011
to 2015 and use corresponding migrant stock from 2010 and 2015 from the UN as the
dependent variable. The time periods are unfortunately unevenly split with period 1 having 3
72
years while period 2 has 4 years. Thus, the time periods are not meant for comparison, but
rather additional information to look at the aid-migration link in two time periods.
To control for each years’ unique characteristics within each time period such as the
presence of more conflict or uneven crop yields, I added a fixed effect to control for this. I δt
also use fixed effects with origin and destination . I add to my regression equation to δi δj
capture the network effects derived from bilateral aid from one country to another. We add
to our regression equation to capture the network effects derived from(1 ilateral Aid )ln + B j→i,t
bilateral aid. The terms and are added to (1 DP per Capita )ln + G i,t (1 DP per Capita )ln + G j,t
reflect the abundant literature which says economic potential is a key driver of migration. GDP
per capita is a proxy for potential wages migrants may earn at the destination country and
reflects the economic condition of countries. I add a constant of 1 to GDP per Capita, Bilateral
Aid and Aid type to work around the small values of these variables which would turn negative 3
when the log is taken. These aid amounts are expressed in 2016 constant USD millions, so a
constant of 1 will affect the results negligibly. I also separate my analysis into the categorized
aid groups and selected subcategories within the larger category to further examine the
differences between aid types. In addition to the aid type as a regressor, I add traditional
variables of a gravity model such as distance between countries, the status of political and civil
freedoms in a country and dummy variables to capture the following: conflict, landlocked,
commonality in language and colonial history to determine the pull factors of migration. These
variables have been shown to be strong determinants of migration. This is further evidenced by
the regression tables below that show a strong statistical significance of these variables in
predicting migration flows.
I use a quasi-poisson model with a log link or Poisson Pseudo Maximum Likelihood
(PPML) model. I use PPML as opposed to an ordinary least square model (OLS), based on
evidence that OLS overestimates many determinants of migration such as geographic distance
between countries (Silva and Tenreyro 2006). OLS exhibits this behavior because migration
data often has unequal variability across the range of variables of the predictors. Migration
patterns are dependent on many factors and it is often the case that there is zero migration
between a specific country pair.
3 Note that Aid is multiplied by a million to convert it to millions for an apples-to-apples comparison with the rest of aid and population statistics
73

Regression Results
Bilateral Aid
I ran a regression with the total amount of bilateral aid an origin country receives as a
baseline. In this analysis, bilateral aid is the total amount of aid that an origin country receives
from all of the OECD countries combined. The results reaffirm the literature’s consensus that
aid, as a whole, increases migration. In 2007 to 2010, the model estimates that every one
percent increase in total aid received results in a 0.106 percent change in migrant stock. The
small coefficient confirms that there is an indirect link between aid and migration. From the time
period 2011 to 2015, the relationship is the same with a slightly larger magnitude of 0.173. This
positive relationship between migrant stock, as a dependent variable, and bilateral aid given is
also seen in Barthelemy et al.’s paper in 2009, however their results show a larger coefficient of
0.31. The larger coefficient is due to a different methodology: they separate the data into
different country income groups and use a three-stage least squares model using two equations
describing wage differentials and one regarding the cost of migration.
Social Infrastructure and Services
The analysis of both periods show that Social Infrastructure and Services aid is not
statistically significant. The subcategory data, however, show that there are aid types that fall
under Social Infrastructure and Services that are statistically significant. From 2007 to 2010,
Education aid is not statistically significant, but Water exhibits a statistically significant negative
relationship with a coefficient of 0.014 with migrant stock. From 2011 to 2015, both Education
and Water have negative relationships with migrant stock. Holding all other variables constant, a
one percent increase in Education aid, on average, would decrease migrant stock by 0.019
percent. For Water aid, a one percent increase in aid would decrease migrant stock by 0.012
percent. Lanati and Thiele’s paper argues that better public services may outweigh aid’s
reduction of migration costs, decreasing migration from the origin country. My analysis shows
that this may not be the case, or at least aid directed at building public services has varying
impacts. This provides us with mixed initial results of the relationship between public services
aid and migrant stock.
74

Humanitarian Aid
I was curious whether the presence of humanitarian aid in conflict situations makes an
impact. In period 1, humanitarian aid and the interaction of conflict and humanitarian aid were
not statistically significant. In period 2, both are statistically significant, but show different
relationships with migrant stock. Humanitarian aid in a conflict zone increases migrant stock in
destination countries by 0.094 percent given a one percent increase in aid. In conflict zones,
which are defined to have more than 25 battleground deaths and the state is a counterparty, it
decreases migration by 0.092 percent — an opposite effect. In period 1, there were 1773
conflicts during this period, whereas in period 2, there were 361 conflicts. Donor countries gave
a total of $4.4 bn of humanitarian aid in period 1, whereas in period 2 they gave $6.6 bn of aid
and there were less conflicts. Just an indicator, assuming donors only gave humanitarian aid to
conflict zones and donated aid evenly, in period 1 each conflict received roughly $2.48m in aid
whereas in period 2 each conflict received almost $18.31mm in aid. Of course, equal distribution
of aid is an oversimplifying assumption to have and this does not reflect the severity of conflict,
but the existence of conflict. I suspect the differences in geopolitical events in these two periods
may explain the relationships but cannot conclude from this data analysis. I suspect that
humanitarian aid reduces the cost of migration in non-monetary ways and increases migration.
Figure 1 shows that refugees, the subset of migrants that receive the most humanitarian aid,
move the least distances to destination countries. Their needs and preferences are more about
safety than economic opportunity, unlike high-skilled emigrants (World Bank 2018).
Humanitarian aid like food, emergency response and reconstruction relief decreases the
short-term cost of rebuilding after conflict and reduces the cost of migration. In other words, if
migrants are provided with basic services and care during instability, then they can pursue
safety and a better life elsewhere. In connection with this finding, food aid is estimated to be
statistically significant and inversely related to migrant stock in period 1 -- further supporting the
hypothesis that aid decreases the cost of migration. In period 2, however, food aid is not
statistically significant. This shows that aid can have differing effects on migration depending on
factors like time, origin, destination and other factors that may not be shown in my analysis.
Economic Infrastructure and Services
I will discuss Economic and Production Aid together. This is often done when analyzing
aid data because these two categories of aid are usually given to well-governed origin countries
75

(Akramov 2012). In the first period, both Economic and Production sector aid show a negative
relationship with migrant stock. A one percent increase in Economic or Production aid, on
average, all else held constant, will yield an approximately 0.04 percent decrease in migrant
stock. The subcategories in period one loosely affirm this effect as both Transport and
Communications and Agriculture, Forestry and Fishery aid show a negative relationship with
coefficients of 0.012 and 0.038 respectively. These results are in line with the majority of
empirical work that determine that economic opportunity is a large driver of migration (World
Bank). Opportunity of more economic activity in origin countries may change individuals’
inclinations to migration.
In period 2, both Economic and Production Sector aid are not statistically significant. The
majority of sub-categories with the exception of agriculture, forestry and mining aid shows no
statistically significance. Agriculture, forestry and mining aid depicts an opposite relationship
than expressed in period 1. As this aid type increases by one percent, my model estimates that
migrant stock in destination countries increases 0.012 percent, holding all else constant. This
estimate of a positive relationship between migrant stock shows an alternative hypothesis.
Instead of a decrease in migration when economic opportunities are better at home, individuals
may choose to migrate due to a relative decrease in migration cost to find better wages
elsewhere. This scenario is what the majority of economists agree with, including Clemens and
Postel.
Lanati and Thiele use a similar three stage least squares model as Barthelemy et al. in
2009, but use migrant flow as the dependent variable instead. They find a general negative
relationship between emigration rates and each type of aid: Social, Economic and Production
with coefficients of -0.119, -0.046, -0.065 respectively. This is not exactly an apples to apples
comparison, but the differences estimate the relationship between aid and migration. In my
analysis, Economic and Production aid also exhibit a negative relationship with migration,
however Social aid’s impact is not statistically significant in both periods. In the subcategories of
each category, the negative relationship is clearer, as discussed above. The amount of
variability explained in their model is very close to mine, at around 90 percent of variability
explained. They use residuals squared (r-squared) values to describe the variability explained,
while I use deviance squared (d-squared), but the interpretations are the same.
76

Table 5: Categorized Period 1 Regression Results
77

Table 6: Uncategorized Period 1 Regression Results
78

Table 7: Categorized Period 2 Regression Results
79

Table 8: Uncategorized Period 2 Regression Results
80
Discussion of Endogeneity
A key assumption in this paper is that aid is given by donor countries completely
exogenously, implying that there is nothing that origin countries can do to receive more aid.
Immigrants in destination countries can lobby their governments to give out more aid in their
origin countries. This presents a reverse causality problem where large migrant stock can
actually increase foreign development aid, as opposed to developmental aid increasing migrant
stock. My analysis does not control for this, so the results of the analysis may overstate the
magnitude of migrant stock in destination countries. Another source of endogeneity are the
omitted variables that are related to the error term. My analysis also assumes that the OECD
countries allocate aid in countries and sectors where it is most needed. This is not necessarily
the case as aid is often used as a foreign policy tool. The underlying incentives of the aid given
is an omitted variable and one that is hard to measure. This creates a bias in my analysis by
understating the relationship between migration and aid because the allocation of aid is
imperfect.
Conclusion
My paper investigates a sample of the disaggregated data on developmental aid from
the DAC countries. Adding all of the subcategories to the data analysis may give a better picture
of how specific types of aid may change individuals’ decisions to migrate. Notice that some of
the results in the Categorized and Uncategorized regressions are inconsistent. For example, in
period 2, Social Infrastructure and Services aid is not statistically significant. However, its
subcategories, Education and Water, depict a statistically significant negative relationship with
migrant stock. The incorporation of more subcategories say, Healthcare, may provide more
evidence about the most effective types of aid in this category.
My analysis looks at potential factors which can be effective in promoting welfare in
origin countries in curtailing migration over many countries and aid types but does not offer
evidence on how to tailor solutions to specific situations, an area where more work can be done.
A theme throughout my analysis is the heterogeneous nature of aid. All aid does not work the
same way in all countries and aid does not necessarily always improve the quality of life in
origin countries. An interesting extension of this research could be to continue to investigate
specific sectors in the context of geographic regions.
Another avenue of research is examining production and economic sectors more
in-depth. These two aid types are similar in that they are often distributed to middle income
81

countries. The hypothesis being that perhaps aid cannot help low income countries in the long
run, but maybe middle-income countries can use aid to stimulate growth and decrease
migration.
The effectiveness of recent policies to manage migration flows has been debated and
my paper aimed to explore disaggregated aid further in relation to migration. Social aid
effectiveness on curtailing migration was mixed in this analysis. The results show only Water aid
decreases migration stocks in destination countries, as Lanati and Thiele predicted. Further an
investigation into public services should be done, as there seems to be high variability in the
social infrastructure and services category. Production and Economic sector aid are estimated
to be the best at reducing migration stocks, but the effects seem varied. These two types of aid
are often deployed to well-governed origin countries , so the aid may be deployed more
effectively. They also directly contribute to economic opportunity in origin countries, tackling one
of the main drivers of aid. Humanitarian aid appears to most frequently have a positive effect on
migration stock in destination countries and, in one case, does not have a statistically significant
effect. This paper has shown the potential for more research into the aid and migration link,
especially at the disaggregated level in shaping migration policy decisions.
References
Akramov, Kamiljon T. “Introduction.” Foreign Aid Allocation, Governance, and Economic
Growth, University of Pennsylvania Press, 2012, pp. 1–4. JSTOR,
www.jstor.org/stable/j.ctt3fhm24.8.
Bercetche, J. (2018, April 25). EU launches a new plan to deal with economic migration.
Retrieved from CNBC:
https://www.cnbc.com/2018/04/25/eu-launches-a-new-plan-to-deal-with-economic-migrat
ion.html
Berthélemy , J.-C., Maurel, M., & Beuran, M. (2009). Aid and Migration: Substitutes or
Complements. Global Patterns and European Perspective.
Central Intelligence Agency, “The World Factbook: South Sudan.”
www.cia.gov/library/publications/the-world-factbook/geos/print_od.html.
Clemens, M., & Postel, H. (2018). Deterring Emigration with Foreign Aid: An Overview of
Evidence from Low-Income Countries.
82

Development finance data. (n.d.). Retrieved from
http://www.oecd.org/dac/financing-sustainable-development/development-finance-data/
Gamso, J., & Yuldashev, F. (2018, October 10). Does rural development aid reduce
international migration? World Development, 15.
GDP per capita (current US$). (n.d.). Retrieved from
https://data.worldbank.org/indicator/NY.GDP.PCAP.CD
Guisan, Antoine, and Niklaus E. Zimmermann. "Predictive habitat distribution models in
ecology." Ecological modelling135.2-3 (2000): 147-186.
Hatton, T. J. (2016). 60 Million Refugees. American Economic Review, 6.
House, F. (2014, February 05). Methodology. Retrieved from
https://freedomhouse.org/report/freedom-world-2014/methodology
International Organization for Migration (IOM). (2018). Missing migrants. Retrieved from
https://missingmigrants.iom.int/
Lanati, M., & Thiele, R. (2018). The impact of foreign aid on migration revisited.
Moullan, Y. (2013). Can Foreign Health Assistance Reduce the Medical Brain Drain? Journal of
Development Studies.
Peace Research Institute Oslo. (n.d.). UCDP/PRIO Armed Conflict Dataset. Retrieved from
https://www.prio.org/Data/Armed-Conflict/UCDP-PRIO/
Silva, J. M. C. S., & Tenreyro, S. (2009). Comments on” The log of gravity revisited”.
Manuscript, London School of Economics.
Tamara Gurevich and Peter Herman, (2018). The Dynamic Gravity Dataset: 1948-2016. USITC
Working Paper 2018-02-A.
Treisman, Daniel. “Why Putin Took Crimea.” Foreign Affairs, Foreign Affairs Magazine, 26 July
2017, www.foreignaffairs.com/articles/ukraine/2016-04-18/why-putin-took-crimea.
UNHCR. (2018, June 19). Forced displacement above 68m in 2017 new global deal on
refugees critical. Retrieved from UNHCR:
http://www.unhcr.org/en-us/news/press/2018/6/5b27c2434/forced-displacement-above-6
8m-2017-new-global-deal-refugees-critical.html
World Bank. (2018). Moving for Prosperity: Global Migration and Labor Markets. DC: World
Bank.
World Population Prospects - Population Division. (n.d.). Retrieved from
https://population.un.org/wpp/Download/Standard/Population/
83