the mass of helium in white dwarf stars and the formation and … · the mass of helium in white...
TRANSCRIPT
Mon. Not. R. Astron. Soc. 371, 263–282 (2006) doi:10.1111/j.1365-2966.2006.10641.x
The mass of helium in white dwarf stars and the formation and evolutionof hydrogen-deficient post-AGB stars
T. M. Lawlor1� and J. MacDonald2�1Penn State University – Wilkes-Barre Campus, Department of Physics, Lehman, PA 18627, USA2University of Delaware, Department of Physics and Astronomy, Newark, DE 19716, USA
Accepted 2006 May 31. Received 2006 May 30; in original form 2006 February 8
ABSTRACTWe use two sets of ‘cradle-to-grave’ evolutionary calculations to investigate how the mass
of the helium buffer layer between the CO core and the hydrogen-burning shell in thermally
pulsing asymptotic giant branch (AGB) stars depends on the initial stellar mass and heavy
element abundance. Cool star mass loss is included by augmenting the Reimers’ formula
with fits to mass-loss rates observed for Galactic Mira variables, obscured Large Magellanic
Cloud (LMC) AGB variables and Galactic OH/IR sources. Resulting white dwarf masses are
in good agreement with the semi-empirical final mass–initial mass relation. We derive lower
and upper limits on the mass of helium in white dwarfs as functions of their mass and initial
heavy element abundance. We find that stars that experience a very late thermal pulse (VLTP)
have final helium masses that are about 25 per cent below the lower limit for stars that do not
experience a VLTP. We have derived a modified form of Iben’s criterion for a star to experience
a post-AGB helium shell flash, and subcriteria for discriminating between the occurrence of
late and VLTPs. We find that a post-AGB flash does not necessarily result in formation of a non-
DA white dwarf. Furthermore, we find that the relative amount of time spent burning helium
or hydrogen depends on how the mass-loss rate varies with stellar surface parameters. These
two considerations complicate the relationship between the probability that a star experiences
a post-AGB flash and the relative formation rates of DA and non-DA white dwarfs. However,
our calculations do lead to a non-DA/DA ratio that is consistent with the observed ratio.
We find that our predicted abundances for PG1159 stars agree within the error bars with the
observed abundances, without the need of convective overshoot. We also find that nitrogen is
produced during VLTPs but not in the other evolutionary paths to hydrogen-deficient objects.
Hence, we propose this as the reason why nitrogen is observed in some PG1159 stars but not
all. Our VLTP models also produce surface abundances close to those of the low-gravity hybrid
PG1159 stars.
An inconsistency between asteroseismological and our evolutionary model determinations
of helium layer mass remains.
Key words: stars: AGB and post-AGB – stars: evolution – white dwarfs.
1 I N T RO D U C T I O N
The mass, Mbuf, of the helium buffer layer which lies between the CO
core and the hydrogen-burning shell in thermally pulsing asymptotic
giant branch (AGB) stars is an important parameter for a number
of reasons (Iben 1987). When the star leaves the AGB, Mbuf not
only determines whether a post-AGB helium flash will occur but
also determines whether such a flash occurs as a late thermal pulse
(LTP) during the planetary nebula phase or as a very late thermal
�E-mail: [email protected] (TML); [email protected] (JM)
pulse (VLTP) after the star has entered the white dwarf cooling
phase. These LTPs and VLTPs have direct bearing on the formation
of non-DA white dwarfs (Renzini 1979; Schonberner 1979; Iben
et al. 1983; Iben 1984; Wood & Faulkner 1986; Vassiliadis & Wood
1994; Iben, Tutukov & Yungelson 1996; Herwig et al. 1999; Blocker
2001) and hydrogen-deficient planetary nebulae, such as Abell 30
and Abell 78 (Renzini 1983; Iben 1984; Iben et al. 1996), and have
been proposed as the cause of the born-again (hereafter BA) phe-
nomenon exhibited by FG Sge, V4334 Sgr (= Sakurai’s object)
and V605 Aql (Iben & MacDonald 1995; Blocker & Schonberner
1997; Herwig 2001; Lawlor & MacDonald 2003). The final value
of Mbuf controls the amount of C and O that can be convectively
C© 2006 The Authors. Journal compilation C© 2006 RAS
264 T. M. Lawlor and J. MacDonald
dredged to the surface in DQ white dwarfs (Koester, Weidemann
& Zeidler 1982; Pelletier et al. 1986; MacDonald, Hernanz & Jose
1998). It also determines whether a white dwarf can experience
a final hydrogen shell flash due to inward diffusion of hydrogen
and outward diffusion of carbon into regions hot enough for nu-
clear reactions to occur (Iben & MacDonald 1986). Also, astero-
seismological studies of DBv white dwarfs have been used to probe
their interior structure and to place constraints on Mbuf (Bradley &
Winget 1994; Fontaine & Brassard 2002; Metcalfe, Montgomery &
Kawaler 2003).
In this paper, we use two sets of ‘cradle-to-grave’ evolutionary
calculations to investigate how Mbuf depends on the initial stel-
lar mass and heavy element abundance. In Section 2, we give a
brief description of the stellar models and the stellar evolution pro-
gram. In Section 3, we compare the evolutionary stages prior to the
thermal pulsing AGB phase with earlier studies, and in Section 4
we describe the properties of the thermal pulses. In Section 5,
we use the semi-empirical initial mass–final mass relation to
justify our treatment of mass loss and our neglect of convec-
tive overshoot. In Section 6, we give details of the final white
dwarf hydrogen and helium layer masses. In Section 7, we re-
visit the Iben (1987) criterion for the occurrence of post-AGB
helium shell flashes. Discussion and conclusions are given in
Sections 8 and 9.
2 T H E S T E L L A R M O D E L S A N D T H ES T E L L A R E VO L U T I O N P RO G R A M
2.1 The stellar models
In the first set of calculations, 1.0 M� stars with heavy element
abundances Z = 10−3, 4 × 10⁻³, 10−2 and 2 × 10⁻² have been
evolved from the pre-main sequence (PMS) to white dwarf cooling
track. Mass loss was taken into account by using a scaled Reimers’
mass-loss law (Reimers 1975). To mimic the effects of small differ-
ences in mass-loss rate, we varied the mass-loss rate starting from
the peak of the last AGB thermal pulse by choosing different val-
ues for the Reimers’ mass-loss parameter, η. This gives a complete
range of the possible helium layer masses at the point when the star
leaves the AGB for the first time. These calculations have been used
by Lawlor & MacDonald (2003; hereafter LM03) to argue that the
BA stars V4334 Sgr, V605 Aql and FG Sge lie at different points
along a common evolutionary path, and hence we will refer to this
set of models as the LM03 set. In the second set of calculations,
stars of masses in the range 0.1–100 M� and Z = 2 × 10⁻⁴, 10−3,
4 × 10⁻³, 10−2, 2 × 10⁻², 5 × 10⁻² and 10−1 have been evolved with
mass loss from the PMS to an end point that depends on the initial
stellar mass. The evolution of low-mass stars (M � 3 M�) is ended
at the earlier of settling on to the white dwarf cooling sequence and
reaching an age of 20 Gyr. The evolution of massive stars (M �10 M�) is stopped at the earlier of the end of carbon burning or
the central temperature exceeding 109 K. For the intermediate-mass
stars, the calculation is stopped at the beginning of hydrodynamical
ejection of the outer layers due to the radiative luminosity exceed-
ing the local Eddington limit. In addition to the Reimers’ mass loss
(with a fixed value of η), we use a fit to observe mass-loss rates of
Mira variables and OH/IR sources to account for mass loss during
AGB evolution. This set of calculations has been used by Jimenez
et al. (2004) to produce synthetic stellar population predictions of
the integrated emission from star clusters and galaxies of arbitrary
age, and hence we will refer to this set of models as the JM04
set.
For both sets of calculations, the helium mass fraction, Y, is related
to the heavy element abundance by
Y = 0.235 + 2Z (1)
except for Z = 0.1 for which we use Y = 0.485. The dependence in
equation (1) is predicated on the assumption that nuclear processes
in stars produce helium in linear proportion to heavy elements. Our
values for the primordial helium abundance and dY/dZ are taken
from Peimbert, Peimbert & Luridiana (2002) and Jimenez et al.
(2003).
2.2 The stellar evolution program
Because the two sets of models have been calculated with slightly
different versions of the stellar evolution code, we give a descrip-
tion of the code here. Our code is a much modified version of the
Eggleton code (Eggleton 1971, 1972). The whole star is evolved by a
relaxation method without the use of separate envelope calculations.
Some of the advantages of this approach are that (i) gravothermal
energy generation terms are automatically included for the stellar
envelope, (ii) mass loss occurs at the stellar surface rather than
an interior point of the star and (iii) the occurrence of convective
dredge-up of elements produced by nucleosynthesis in the interior
to the photosphere is clearly identifiable. For numerical stability rea-
sons, a staggered mesh is used (Sugimoto 1970). Our code uses a
time-dependent adaptive mesh technique similar to that of Winkler,
Norman & Newman (1984) in which advection terms are approxi-
mated by using second-order upwind finite differences. Convective
energy transport is modelled by using the version of mixing-length
theory described by Mihalas (1970). Composition equations for H,3He, 4He, 12C, 14N, 16O and 24Mg are solved simultaneously with
the structure and adaptive mesh equations. For a few calculations,13C is also explicitly included, with neutrons produced by the 13C
(α, n) 16O reaction assumed to be instantly absorbed by heavy ele-
ments. Composition changes due to convective mixing are modelled
in the same way as Eggleton (1972) by adding diffusion terms to
the composition equations. We use a diffusion coefficient, σ con, that
is consistent with mixing-length theory (Eggleton 1972; Iben &
MacDonald 1995; Jimenez et al. 1996),
σcon = βwconl, (2)
where wcon is the convective velocity, l is the mixing length and β is
a dimensionless convective mixing efficiency parameter, which for
isotropic turbulence would be equal to 1/3. We have experimented
with different values for β in the range 10−4–1. We find that for most
stages of stellar evolution, the results are insensitive to the particu-
lar value of β because mixing time-scales are usually much shorter
than the evolution time-scales. However, smaller values of β lead to
smoother evolution and hence we set β = 10−4. To treat semiconvec-
tion in the same way as Eggleton (1972) with our staggered mesh,
we found that the opacity that enters into evaluation of σ con at the
edges of convection zones has to be evaluated on the convective side
of the boundary. Everywhere else a geometric average is used. This
procedure leads to the difference of radiative and adiabatic gradients
smoothly approaching zero as the edge of a convection zone is ap-
proached from the inside. Mixing due to convective overshooting is
not included. OPAL radiative opacities (Iglesias & Rogers 1996) are
used for temperatures (in K) above log10T = 3.84. For temperatures
below log10 T = 3.78, we use opacities kindly supplied by David
Alexander that have been calculated by the method of Alexander &
Ferguson (1994). Between these temperatures limits, we interpolate
between the OPAL and Alexander opacities. Pair and photoneutrino
C© 2006 The Authors. Journal compilation C© 2006 RAS, MNRAS 371, 263–282
The mass of helium in white dwarf stars 265
loss rates are from Beaudet, Petrosian & Salpeter (1967) with mod-
ifications for neutral currents (Ramadurai 1976). Plasma neutrino
rates are from Haft, Raffelt & Weiss (1994) and bremsstrahlung
neutrino losses rates are from Itoh & Kohyama (1983). The equa-
tion of state is determined by minimization of a model free energy
(see e.g. Fontaine, Graboske & van Horn 1977) that includes contri-
butions from internal states of the H2 molecule and all the ionization
states of H, He, C, N, O and Mg. Electron degeneracy is included by
the method of Eggleton, Faulkner & Flannery (1973). Coulomb and
quantum corrections to the equation of state follow the prescription
of Iben, Fujimoto & MacDonald (1992), with the Coulomb free en-
ergy updated to use the results of Stringfellow, DeWitt & Slattery
(1990). Pressure ionization is included in a thermodynamically con-
sistent manner by use of a hard-sphere free-energy term (Mansoori
et al. 1971).
One difference between the codes used for the two sets of models
is that for the JM04 set nuclear reaction rates are from the NACRE
compilation (Angulo et al. 1999), whereas for the LM03 set older
reaction rates from Fowler, Caughlan & Zimmerman (1975), Harris
et al. (1983), Nomoto, Thielemann & Miyaji (1985), Caughlan &
Fowler (1988) and Arnett (1996) were used. Weak screening correc-
tions from Salpeter & van Horn (1969) and strong screening correc-
tions from Itoh et al. (1979) were used for both sets of calculations.
For both sets of models, we use a scaled Reimers’ (1975) law
M = −4 × 10⁻¹³ηL
L�R
R�
(M
M�
)−1
M� yr−1 (3)
for mass loss by cool star winds (Teff � 104 K). The dimension-
less parameter η was taken to be 0.35 for the LM03 set. A slightly
different value η = 0.378 was used for the JM04 set. These partic-
ular values are consistent with the mean value of η needed to pro-
duce observed globular cluster horizontal branch (HB) morpholo-
gies (Jimenez et al. 1996). While the Reimers’ formula is adequate
for the purposes of the LM03 study of 1.0 M� stars, it severely un-
derestimates the mass-loss rate during the later ‘superwind’ phases
of more massive AGB stars (Renzini 1981; Willson 2000). To allow
for this increase in mass-loss rate, we add for the AGB phases of the
JM04 calculations, empirical relationships between the mass-loss
rates from Mira variables and OH/IR sources and their pulsation
periods. A fit to the mass-loss rates from galactic Mira variables
determined by Knapp et al. (1998) from CO line emission measure-
ments gives in terms of the pulsation period in days, P,
M = −10−22.8 P6.32 M� yr−1 (4)
for stars with P � 700 d. Longer period objects are in general OH/IR
sources for which the CO emission lines do not give reliable deter-
minations of mass-loss rate (Heske et al. 1990). Lepine, Ortiz &
Epchtein (1995) find from near-infrared photometry that, after av-
eraging over similar objects, the mass-loss rate of OH/IR sources
increases with the stellar luminosity but the rate of increase is lower
for the more luminous objects. Whitelock et al. (2003) find that
obscured AGB variables in the Large Magellanic Cloud (LMC) fol-
low an extrapolation of the period–luminosity relation determined
for stars of shorter period. Hence, the mass-loss rate for the long
period OH/IR sources is also expected to increase with the pul-
sation period but with a weaker dependence than for the shorter
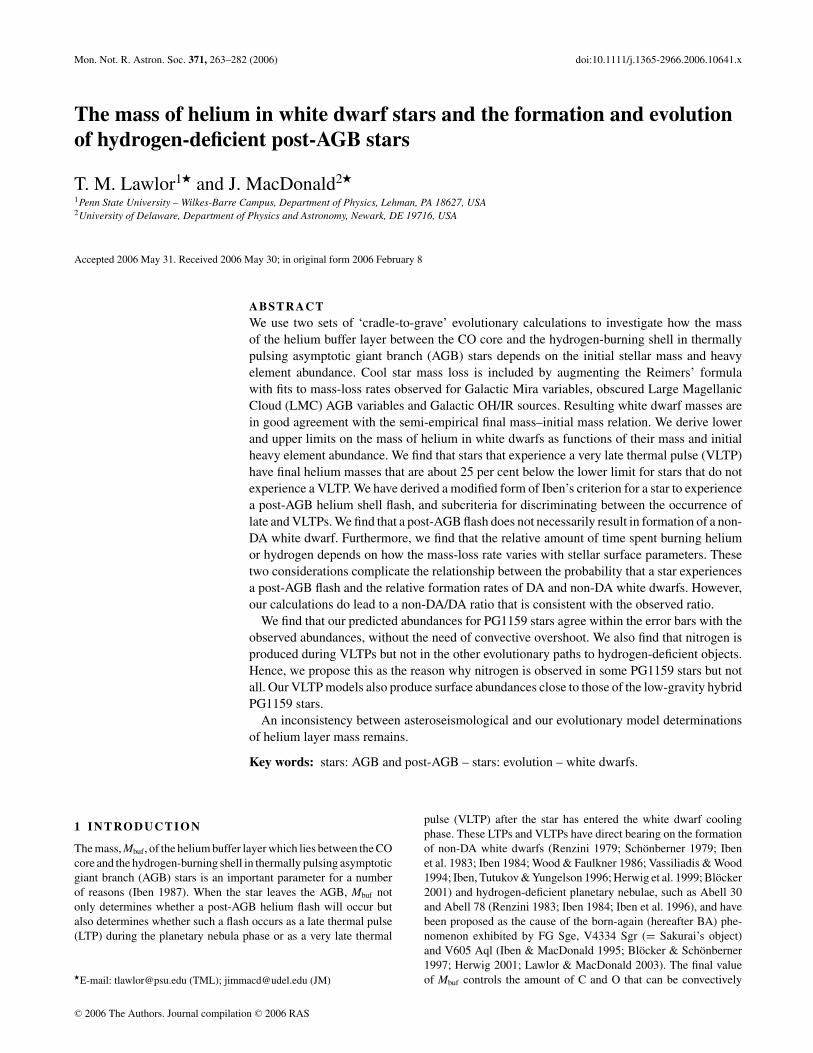
period variables. We show in Fig. 1, mass-loss rates against pul-
sation period for the Knapp et al. (1998) sample of Galactic Mira
variables, the Whitelock et al. (2003) sample of obscured LMC
AGB variables and the averaged mass-loss rates of the Lepine et al.
sample of Galactic OH/IR sources assuming that these objects obey
the period–luminosity relation for O-rich Miras (Feast et al. 1989;
2.4 2.5 2.6 2.7 2.8 2.9 3.0 3.1 3.2 3.3 3.4
Log P
-8
-7
-6
-5
-4
-3
-2
Log -
dM
/dt
Figure 1. Mass-loss rate (M� yr−1) plotted against pulsation period (d) for
Galactic Mira variables (filled circles), obscured LMC AGB variables (open
circles) and Galactic OH/IR sources (broken lines). The thick and thin solid
lines are the adopted relation for variables with periods less than 620 d and
greater than 620 d, respectively.
Whitelock et al. 1994) or C-rich Miras (Groenewegen & Whitelock
1996). Also shown is our fit to the Knapp et al. (1998) data. We see
that for P � 700 d, the data for the LMC stars overlap the data for
the galactic Miras, which indicates that the effects of heavy element
abundance differences are smaller than the scatter in the data. At
longer periods, the mass-loss rates are lower than would be given
by extrapolation of our fit for the shorter period variables. Hence,
for P � 620 d, we use
M = −10−16.1 P3.92 M� yr−1. (5)
This relation is also shown in Fig. 1.
To relate the mass-loss rate to stellar surface properties, we as-
sume that the AGB variables are pulsating in the fundamental mode
with period (Ostlie & Cox 1986)
P = 1.2 × 10⁻²
(M
M�
)−0.73 (R
R�
)1.86
d. (6)
For hot star winds (Teff � 104 K), we use a modified form of the
theoretical mass-loss law of Abbott (1982) that has a heavy element
abundance dependence that is closer to that of more recent theoret-
ical calculations (Kudritzki, Pauldrach & Puls 1987; Kudritzki &
Puls 2000; Vink, de Koter & Lamers 2001)
M = −1.2 10−15
(Z
Z�
)1/2 (L
L�
)2 (Meff
M�
)−1
M� yr−1. (7)
Here, Meff is the mass of the star multiplied by a factor to account
for the reduction of the effective gravity due to the radiative force
on electrons. Because the Abbott (1982) mass-loss rate formula
was originally developed for massive main-sequence (MS) stars,
its use for the hot late stages of evolution of low-mass stars is
open to question. We use it for these stages primarily because of
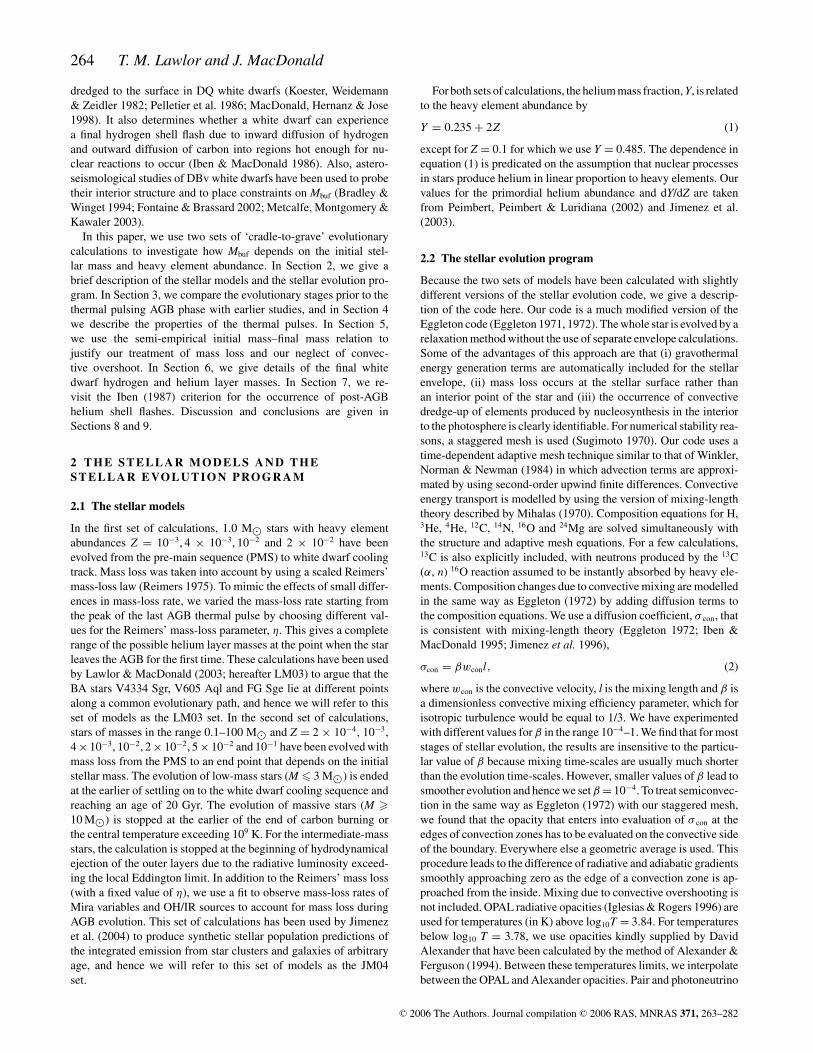
its simplicity. However, as can be seen in Fig. 2, the formula gives
mass-loss rates in fair agreement with those determined for central
C© 2006 The Authors. Journal compilation C© 2006 RAS, MNRAS 371, 263–282
266 T. M. Lawlor and J. MacDonald
3.0 3.2 3.4 3.6 3.8 4.0 4.2 4.4 4.6 4.8 5.0
Log L/L
-8
-7
-6
-5
-4
Lo
gF
(M
yr-1
)
Figure 2. Mass-loss rate plotted against luminosity for PG1159 stars (filled
triangles), CSPN in the LMC (filled circles) and WCL CSPN (filled squares).
The open circle indicates a H-poor LMC CSPN. Also shown are the mass-
loss rates from equation (7) for solar heavy element abundance and stellar
mass 0.6 M� (solid line) and a fit to the Pauldrach et al. (1988) theoretical
CSPN wind mass-loss rates (dashed line).
stars of planetary nebulae (CSPN) and PG1159 stars. In this figure,
we plot against luminosity the mass-loss rate from equation (7) for
solar heavy element abundance and stellar mass 0.6 M� together
with empirical determinations of mass-loss rates for PG1159 stars
(Koesterke & Werner 1998), CSPN in the LMC (Herald & Bianchi
2004) and CSPN of spectral-type WCL (Leuenhagen, Hamann &
Jeffery 1996). Also shown is a fit to the Pauldrach et al. (1988) the-
oretical CSPN wind mass-loss rates for solar abundance material.
Not surprisingly the empirical mass-loss rates for the WCL CSPN
are higher than the theoretical rates, just as mass-loss rate determi-
nations for Wolf–Rayet (WR) stars are higher than theoretical rates
for MS OB stars. The mass-loss mechanism for WR stars is poorly
understood but it is thought that helium enhancement is involved
in producing higher mass-loss rates. However, this cannot be the
whole story as the PG1159 stars have high helium abundances in
their atmospheres, yet their mass-loss rates are close to the theo-
retical values. An added complication is that the LMC CSPN and
WCL CSPN mass-loss rate determinations are based on spherically
symmetric models, whereas filling factors due to clumping of 0.1
are typical for WR winds (Hillier 2003; Schild et al. 2004). Clump-
ing reduces the empirical mass-loss rates in proportion to the square
root of the filling factor, and hence the smooth mass-loss rates give
only an upper limit to the true rates. Because of these uncertainties,
a clear choice between the equation (7) mass-loss formula and the
Pauldrach et al. (1988) mass-loss rates cannot be made. We will
briefly return to this question in the discussion.
3 E VO L U T I O N TO T H E T H E R M A L LYP U L S AT I N G AG B
All of our JM04 evolutionary sequences begin on the PMS with a
central temperature close to 106 K. They are evolved through all
evolutionary phases, including the helium core flash that occurs in
stars of mass less than about 2.5 M�, to the end point described
in Section 2.1. To allow for comparison with other calculations, we
summarize lifetimes of the various evolutionary phases in Table 1.
The PMS lifetime, τ PMS, is the time to reach the minimum in lumi-
nosity at the start of MS evolution. The MS lifetime, τMS, is the time
from the end of the PMS for the central hydrogen mass fraction to
drop to zero. The time τCHe I is the interval from the end of the MS to
core helium ignition, which we take to occur when the rate of energy
production by helium burning first becomes 10 per cent of the rate
of energy production by hydrogen burning. This interval includes
the subgiant phase and first red giant branch (RGB) phase. For those
stars that experience a core helium flash, we give τCHeF, the time
interval from helium ignition to the point at which star settles into a
thermal equilibrium state, which we take to be when gravothermal
energy production is less than 1 per cent of energy production from
nuclear reactions. The core helium-burning lifetime to the point
where the helium mass fraction at the stellar centre drops to 10−5 is
τCHeB. For models that reach the thermal pulse phase before carbon
ignition, we give the early AGB (EAGB) lifetime, τEAGB, which is
the time from the end of core helium burning to the first major shell
flash, and the thermally pulsing AGB lifetime, τTAGB, which is time
between the peak of the first helium shell flash and departure from
the AGB.
MS lifetimes increase with Z up to Z = 0.02. They decrease
at higher Z because the smaller hydrogen mass fraction leads to
a shorter time for core hydrogen exhaustion. MS stars with M >
∼ 1.2 M� have convective cores and hence τMS will depend on
the amount of mixing by convective overshooting that is included
in the models. Since we do not include convective overshooting
in our models, we expect that our models will have shorter MS
lifetimes than models that include convective overshooting. Com-
parisons with the Geneva models (Schaller et al. 1992; Mowlavi
et al. 1998; Lejeune & Schaerer 2001) and Padua models (Girardi
et al. 2000) show that this indeed the case. For the Geneva models,
our MS lifetimes agree within 2 or 3 per cent for stars which have
radiative cores (M < ∼1.2 M�). However, for stars with convective
cores, the Geneva MS lifetimes are significantly longer than ours by
about 35 per cent for Z = 0.001 and up to 50 per cent for Z = 0.02
and 0.1. On comparison with the Padua models for Z = 0.001 and
0.004, we find that our MS lifetimes are about 9 per cent longer for
the stars with radiative cores and up to 30 per cent shorter for the
more massive stars with convective cores.
Understanding the effects of convective overshooting on helium-
burning lifetimes is less straightforward than for the MS lifetimes.
Convective overshooting during MS evolution will produce larger
helium cores. Hence, we might expect the model star to evolve
at a faster rate similar to that of a more massive model star that
does not include convective overshoot. However, convective over-
shoot during core helium burning will mix more helium into the
core and this will increase τCHeB. It is these competing effects that
make comparison difficult. A further complication is the existence of
breathing pulses (Castellani, Giannone & Renzini 1971; Castellani
et al. 1985), which can occur near the end of core helium burning.
During a breathing pulse, the convective core expands and mixes
fresh helium into the burning region which extends the core helium-
burning phase. Hence, models which suppress breathing pulses will
have smaller values for τCHeB. We do not suppress breathing pulses.
Even so, for M � 2.5 M�, our values for τCHeB are in general less
than those found by Vassiliadis & Wood (1993) who do not in-
clude convective overshoot but do suppress breathing pulses. Our
core helium-burning lifetimes are in general longer than the Geneva
lifetimes, especially for the higher mass models. This is consistent
C© 2006 The Authors. Journal compilation C© 2006 RAS, MNRAS 371, 263–282
The mass of helium in white dwarf stars 267
Table 1. Lifetimes of evolutionary phases.
M/M� Z τPMS (yr) τMS (yr) τCHeI (yr) τCHeF (yr) τCHeB (yr) τEAGB (yr) τTAGB (yr) τAGB/τCHeB
0.9 0.0002 2.50 × 10⁷ 8.61 × 10⁹ 9.98 × 10⁸ 2.39 × 10⁶ 9.01 × 10⁷ 1.09 × 10⁷ 1.45 × 10⁶ 0.137
1.0 0.0002 2.02 × 10⁷ 5.83 × 10⁹ 8.17 × 10⁸ 2.06 × 10⁶ 8.49 × 10⁷ 1.12 × 10⁷ 1.88 × 10⁶ 0.154
1.2 0.0002 1.46 × 10⁷ 3.00 × 10⁹ 5.53 × 10⁸ 1.61 × 10⁶ 8.73 × 10⁷ 1.02 × 10⁷ 2.21 × 10⁶ 0.142
1.5 0.0002 9.05 × 10⁶ 1.33 × 10⁹ 3.68 × 10⁸ 9.41 × 10⁶ 8.33 × 10⁷ 8.81 × 10⁶ 2.14 × 10⁶ 0.131
2.0 0.0002 4.44 × 10⁶ 5.42 × 10⁸ 1.44 × 10⁸ 3.03 × 10⁶ 1.05 × 10⁸ 5.67 × 10⁶ 1.81 × 10⁶ 0.071
3.0 0.0002 1.73 × 10⁶ 1.97 × 10⁸ 2.10 × 10⁷ – 6.25 × 10⁷ 2.21 × 10⁶ 8.36 × 10⁵ 0.049
5.0 0.0002 5.34 × 10⁵ 6.63 × 10⁷ 4.00 × 10⁶ – 1.81 × 10⁷ 6.09 × 10⁵ 4.28 × 10⁵ 0.057
8.0 0.0002 2.15 × 10⁵ 2.76 × 10⁷ 1.18 × 10⁶ – 5.62 × 10⁶ – – –
0.8 0.001 4.11 × 10⁷ 1.44 × 10¹⁰ 1.83 × 10⁹ 2.01 × 10⁶ 9.97 × 10⁷ 1.31 × 10⁷ 3.83 × 10⁵ 0.135
0.9 0.001 2.91 × 10⁷ 9.15 × 10⁹ 1.42 × 10⁹ 2.03 × 10⁶ 9.11 × 10⁷ 1.34 × 10⁷ 1.15 × 10⁶ 0.160
1.0 0.001 2.27 × 10⁷ 6.11 × 10⁹ 1.15 × 10⁹ 2.62 × 10⁶ 1.00 × 10⁸ 1.09 × 10⁷ 1.40 × 10⁶ 0.123
1.2 0.001 1.76 × 10⁷ 3.04 × 10⁹ 7.98 × 10⁸ 2.82 × 10⁶ 9.18 × 10⁷ 1.10 × 10⁷ 1.71 × 10⁶ 0.138
1.5 0.001 1.10 × 10⁷ 1.35 × 10⁹ 4.67 × 10⁸ 3.63 × 10⁶ 9.21 × 10⁷ 1.01 × 10⁷ 1.77 × 10⁶ 0.129
2.0 0.001 4.34 × 10⁶ 6.38 × 10⁸ 1.12 × 10⁸ 1.59 × 10⁶ 9.88 × 10⁷ 8.09 × 10⁶ 1.71 × 10⁶ 0.099
3.0 0.001 1.69 × 10⁶ 2.13 × 10⁸ 2.15 × 10⁷ – 7.66 × 10⁷ 2.94 × 10⁶ 7.90 × 10⁵ 0.049
5.0 0.001 5.81 × 10⁵ 7.21 × 10⁷ 2.95 × 10⁶ – 1.88 × 10⁷ 6.14 × 10⁵ 3.60 × 10⁵ 0.052
8.0 0.001 2.29 × 10⁵ 2.92 × 10⁷ 7.75 × 10⁵ – 5.68 × 10⁶ – – –
0.85 0.004 4.55 × 10⁷ 1.35 × 10¹⁰ 2.33 × 10⁹ 2.06 × 10⁶ 1.03 × 10⁸ 1.47 × 10⁷ 5.70 × 10⁵ 0.148
0.9 0.004 3.85 × 10⁷ 1.07 × 10¹⁰ 2.11 × 10⁹ 2.36 × 10⁶ 1.06 × 10⁸ 1.34 × 10⁷ 7.22 × 10⁵ 0.133
1.0 0.004 2.92 × 10⁷ 6.98 × 10⁹ 1.73 × 10⁹ 2.18 × 10⁶ 1.02 × 10⁸ 1.30 × 10⁷ 9.23 × 10⁵ 0.136
1.2 0.004 1.82 × 10⁷ 3.35 × 10⁹ 1.17 × 10⁹ 2.98 × 10⁶ 1.04 × 10⁸ 1.15 × 10⁷ 1.01 × 10⁶ 0.120
1.5 0.004 1.71 × 10⁷ 1.60 × 10⁹ 5.06 × 10⁸ 3.25 × 10⁶ 1.02 × 10⁸ 1.09 × 10⁷ 1.18 × 10⁶ 0.118
2.0 0.004 1.04 × 10⁷ 6.80 × 10⁸ 1.48 × 10⁸ 3.26 × 10⁶ 1.11 × 10⁸ 1.13 × 10⁷ 1.87 × 10⁶ 0.119
3.0 0.004 2.18 × 10⁶ 2.36 × 10⁸ 2.21 × 10⁷ – 1.06 × 10⁸ 4.74 × 10⁶ 8.39 × 10⁵ 0.053
5.0 0.004 1.14 × 10⁶ 7.08 × 10⁷ 4.50 × 10⁶ – 2.36 × 10⁷ 9.41 × 10⁵ 3.36 × 10⁵ 0.054
8.0 0.004 2.56 × 10⁵ 3.02 × 10⁷ 6.85 × 10⁵ – 6.57 × 10⁶ – – –
1.0 0.01 4.03 × 10⁷ 8.92 × 10⁹ 2.34 × 10⁹ 2.96 × 10⁶ 1.09 × 10⁸ 1.47 × 10⁷ 4.53 × 10⁵ 0.139
1.2 0.01 2.58 × 10⁷ 4.26 × 10⁹ 1.47 × 10⁹ 3.13 × 10⁶ 1.26 × 10⁸ 1.04 × 10⁷ 4.61 × 10⁵ 0.086
1.5 0.01 2.26 × 10⁷ 1.99 × 10⁹ 6.11 × 10⁸ 3.33 × 10⁶ 1.11 × 10⁸ 1.27 × 10⁷ 5.07 × 10⁵ 0.119
2.0 0.01 1.67 × 10⁷ 8.39 × 10⁸ 1.67 × 10⁸ 3.79 × 10⁶ 1.20 × 10⁸ 1.34 × 10⁷ 1.21 × 10⁶ 0.122
3.0 0.01 5.59 × 10⁶ 2.77 × 10⁸ 3.20 × 10⁷ – 1.35 × 10⁸ 7.32 × 10⁶ 1.17 × 10⁶ 0.063
5.0 0.01 1.46 × 10⁶ 7.89 × 10⁷ 4.18 × 10⁶ – 2.73 × 10⁷ 1.27 × 10⁶ 1.86 × 10⁵ 0.053
8.0 0.01 4.54 × 10⁵ 2.95 × 10⁷ 9.80 × 10⁵ – 7.70 × 10⁶ – – –
1.0 0.02 5.01 × 10⁷ 1.09 × 10¹⁰ 2.94 × 10⁹ 2.30 × 10⁶ 1.17 × 10⁸ 1.61 × 10⁷ 1.52 × 10⁵ 0.139
1.2 0.02 2.98 × 10⁷ 5.10 × 10⁹ 1.86 × 10⁹ 2.52 × 10⁶ 1.20 × 10⁸ 1.43 × 10⁷ 1.49 × 10⁵ 0.120
1.5 0.02 1.63 × 10⁷ 2.37 × 10⁹ 7.43 × 10⁸ 2.36 × 10⁶ 1.10 × 10⁸ 1.54 × 10⁷ 2.04 × 10⁵ 0.142
2.0 0.02 2.42 × 10⁷ 9.74 × 10⁸ 1.62 × 10⁸ 2.96 × 10⁶ 1.24 × 10⁸ 1.50 × 10⁷ 9.40 × 10⁵ 0.129
3.0 0.02 8.68 × 10⁶ 2.86 × 10⁸ 2.90 × 10⁷ – 1.75 × 10⁸ 1.31 × 10⁷ 1.33 × 10⁶ 0.082
5.0 0.02 2.07 × 10⁶ 7.49 × 10⁷ 5.66 × 10⁶ – 3.32 × 10⁷ 1.77 × 10⁶ 1.16 × 10⁵ 0.057
8.0 0.02 5.51 × 10⁵ 2.69 × 10⁷ 1.35 × 10⁶ – 1.03 × 10⁷ 3.07 × 10⁵ 3.29 × 10⁵ 0.062
1.0 0.05 5.27 × 10⁷ 1.07 × 10¹⁰ 3.52 × 10⁹ 2.71 × 10⁶ 1.24 × 10⁸ 1.79 × 10⁷ –––— 0.144
1.2 0.05 3.18 × 10⁷ 5.05 × 10⁹ 2.10 × 10⁹ 2.64 × 10⁶ 1.28 × 10⁸ 1.46 × 10⁷ –––— 0.114
1.5 0.05 1.79 × 10⁷ 2.30 × 10⁹ 8.12 × 10⁸ 2.77 × 10⁶ 1.29 × 10⁸ 1.37 × 10⁷ 2.61 × 10⁴ 0.106
2.0 0.05 4.11 × 10⁷ 9.25 × 10⁸ 1.85 × 10⁸ 1.30 × 10⁶ 1.64 × 10⁸ 1.26 × 10⁷ –––— 0.077
3.0 0.05 1.14 × 10⁷ 2.65 × 10⁸ 2.88 × 10⁷ – 1.60 × 10⁸ 1.34 × 10⁷ 2.35 × 10⁴ 0.084
5.0 0.05 2.35 × 10⁶ 6.39 × 10⁷ 5.25 × 10⁶ – 3.10 × 10⁷ 2.29 × 10⁶ 1.47 × 10⁴ 0.074
8.0 0.05 6.10 × 10⁵ 2.14 × 10⁷ 1.07 × 10⁶ – 7.22 × 10⁶ 6.61 × 10⁵ 6.65 × 10⁴ 0.101
0.8 0.1 4.00 × 10⁷ 7.37 × 10⁹ 3.01 × 10⁹ 3.52 × 10⁶ 1.08 × 10⁸ 1.28 × 10⁷ –––— 0.118
0.9 0.1 3.07 × 10⁷ 4.74 × 10⁹ 2.10 × 10⁹ 3.01 × 10⁶ 1.00 × 10⁸ 6.54 × 10⁶ –––— 0.065
1.0 0.1 2.36 × 10⁷ 3.28 × 10⁹ 1.39 × 10⁹ 3.35 × 10⁶ 9.71 × 10⁷ 4.91 × 10⁶ –––— 0.051
1.2 0.1 1.57 × 10⁷ 1.82 × 10⁹ 6.34 × 10⁸ 1.82 × 10⁶ 1.09 × 10⁸ 3.46 × 10⁶ –––— 0.032
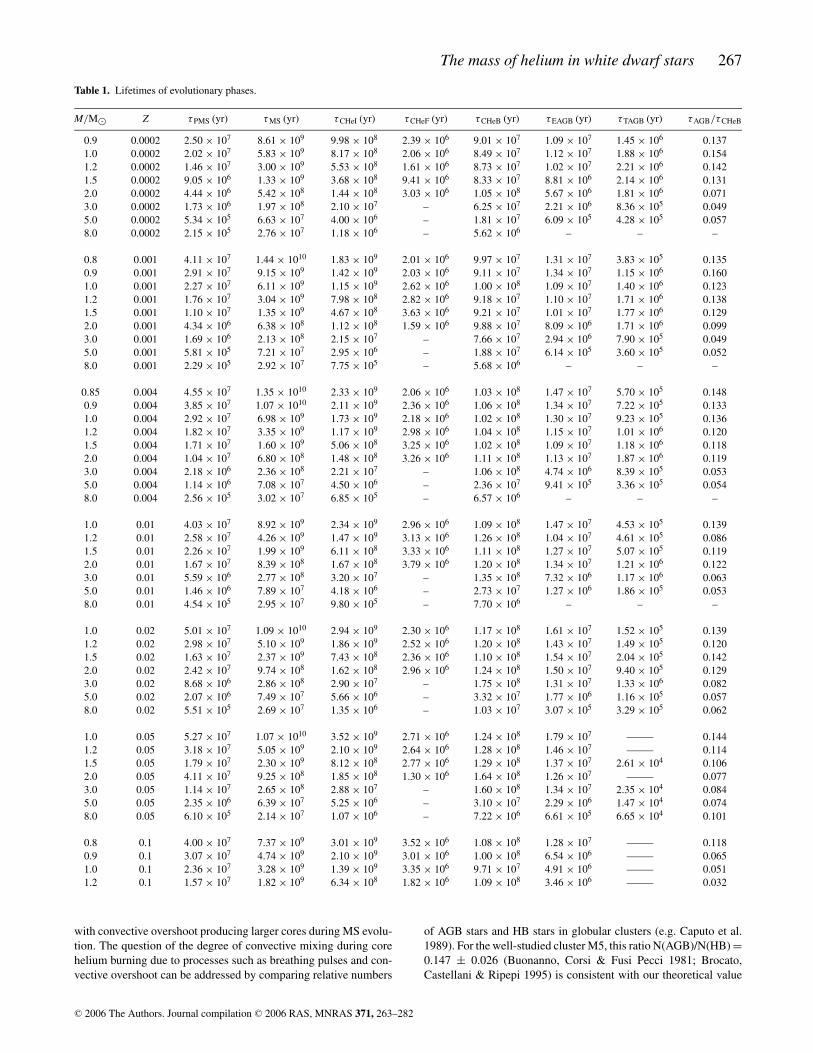
with convective overshoot producing larger cores during MS evolu-
tion. The question of the degree of convective mixing during core
helium burning due to processes such as breathing pulses and con-
vective overshoot can be addressed by comparing relative numbers
of AGB stars and HB stars in globular clusters (e.g. Caputo et al.
1989). For the well-studied cluster M5, this ratio N(AGB)/N(HB) =0.147 ± 0.026 (Buonanno, Corsi & Fusi Pecci 1981; Brocato,
Castellani & Ripepi 1995) is consistent with our theoretical value
C© 2006 The Authors. Journal compilation C© 2006 RAS, MNRAS 371, 263–282
268 T. M. Lawlor and J. MacDonald
Table 1 – continued
M/M� Z τPMS (yr) τMS (yr) τCHeI (yr) τCHeF (yr) τCHeB (yr) τEAGB (yr) τTAGB (yr) τAGB/τCHeB
1.5 0.1 5.14 × 10⁷ 8.78 × 10⁸ 2.13 × 10⁸ 2.60 × 10⁶ 1.23 × 10⁸ 4.05 × 10⁶ –––— 0.033
2.0 0.1 2.02 × 10⁷ 3.58 × 10⁸ 4.48 × 10⁷ – 1.26 × 10⁸ 3.70 × 10⁶ –––— 0.029
3.0 0.1 4.77 × 10⁶ 1.04 × 10⁸ 1.20 × 10⁷ – 4.40 × 10⁷ 2.62 × 10⁶ –––— 0.060
5.0 0.1 1.12 × 10⁶ 2.45 × 10⁷ 2.67 × 10⁶ – 1.04 × 10⁷ 1.23 × 10⁶ –––— 0.118
8.0 0.1 2.61 × 10⁵ 9.39 × 10⁶ 3.30 × 10⁵ – 3.48 × 10⁶ 2.64 × 10⁵ –––— 0.076
–––— indicates that there is no TPAGB phase.
Table 2. Mass limits for the TPAGB to occur.
Z Mflo1/M� Mflo2/M� Mfup/M� Mcc/M�0.0002 0.83 0.83 10 6.5
0.001 0.86 0.87 11 7.5
0.004 0.90 0.94 11 7.5
0.01 0.97 1.09 11.5 8.0
0.02 1.03 1.50 12.0 9.0
0.05 1.42 – 13.0 9.5
0.10 – – – 7.5
for stars of masses and heavy element abundance relevant to this
cluster.
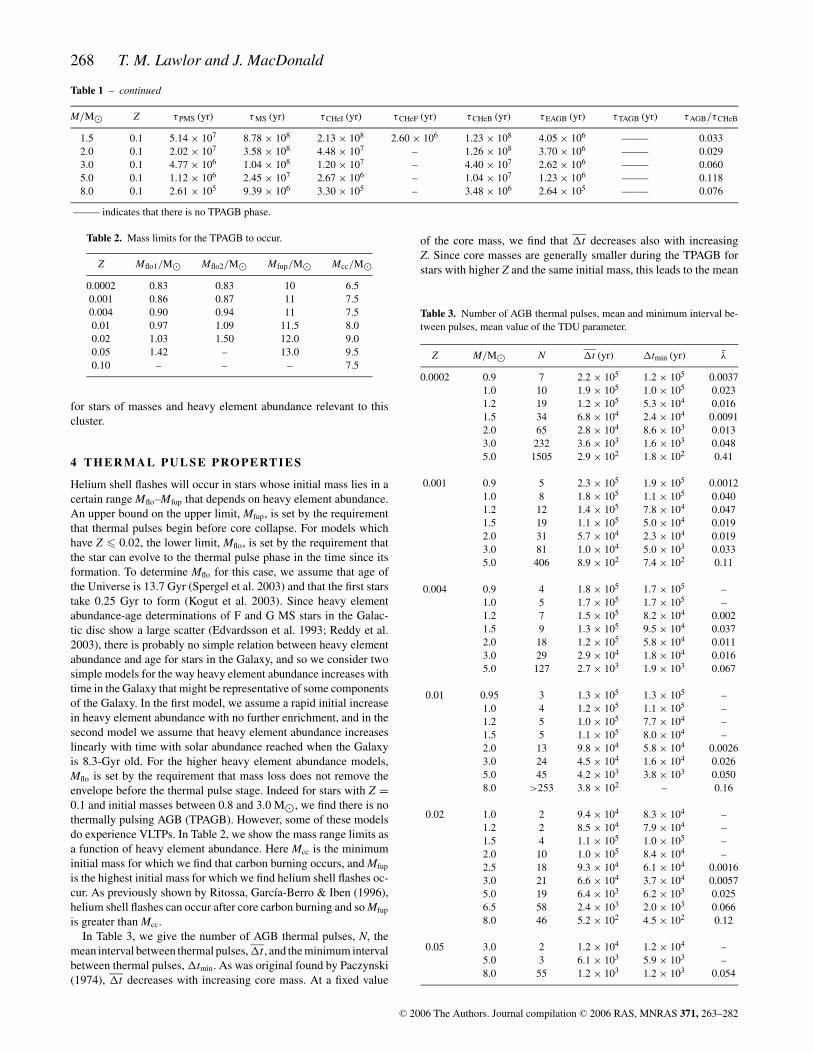
4 T H E R M A L P U L S E P RO P E RT I E S
Helium shell flashes will occur in stars whose initial mass lies in a
certain range Mflo–Mfup that depends on heavy element abundance.
An upper bound on the upper limit, Mfup, is set by the requirement
that thermal pulses begin before core collapse. For models which
have Z � 0.02, the lower limit, Mflo, is set by the requirement that
the star can evolve to the thermal pulse phase in the time since its
formation. To determine Mflo for this case, we assume that age of
the Universe is 13.7 Gyr (Spergel et al. 2003) and that the first stars
take 0.25 Gyr to form (Kogut et al. 2003). Since heavy element
abundance-age determinations of F and G MS stars in the Galac-
tic disc show a large scatter (Edvardsson et al. 1993; Reddy et al.
2003), there is probably no simple relation between heavy element
abundance and age for stars in the Galaxy, and so we consider two
simple models for the way heavy element abundance increases with
time in the Galaxy that might be representative of some components
of the Galaxy. In the first model, we assume a rapid initial increase
in heavy element abundance with no further enrichment, and in the
second model we assume that heavy element abundance increases
linearly with time with solar abundance reached when the Galaxy
is 8.3-Gyr old. For the higher heavy element abundance models,
Mflo is set by the requirement that mass loss does not remove the
envelope before the thermal pulse stage. Indeed for stars with Z =0.1 and initial masses between 0.8 and 3.0 M�, we find there is no
thermally pulsing AGB (TPAGB). However, some of these models
do experience VLTPs. In Table 2, we show the mass range limits as
a function of heavy element abundance. Here Mcc is the minimum
initial mass for which we find that carbon burning occurs, and Mfup
is the highest initial mass for which we find helium shell flashes oc-
cur. As previously shown by Ritossa, Garcıa-Berro & Iben (1996),
helium shell flashes can occur after core carbon burning and so Mfup
is greater than Mcc.
In Table 3, we give the number of AGB thermal pulses, N, the
mean interval between thermal pulses, �t , and the minimum interval
between thermal pulses, �tmin. As was original found by Paczynski
(1974), �t decreases with increasing core mass. At a fixed value
of the core mass, we find that �t decreases also with increasing
Z. Since core masses are generally smaller during the TPAGB for
stars with higher Z and the same initial mass, this leads to the mean
Table 3. Number of AGB thermal pulses, mean and minimum interval be-
tween pulses, mean value of the TDU parameter.
Z M/M� N �t (yr) �tmin (yr) λ
0.0002 0.9 7 2.2 × 10⁵ 1.2 × 10⁵ 0.0037
1.0 10 1.9 × 10⁵ 1.0 × 10⁵ 0.023
1.2 19 1.2 × 10⁵ 5.3 × 10⁴ 0.016
1.5 34 6.8 × 10⁴ 2.4 × 10⁴ 0.0091
2.0 65 2.8 × 10⁴ 8.6 × 10³ 0.013
3.0 232 3.6 × 10³ 1.6 × 10³ 0.048
5.0 1505 2.9 × 10² 1.8 × 10² 0.41
0.001 0.9 5 2.3 × 10⁵ 1.9 × 10⁵ 0.0012
1.0 8 1.8 × 10⁵ 1.1 × 10⁵ 0.040
1.2 12 1.4 × 10⁵ 7.8 × 10⁴ 0.047
1.5 19 1.1 × 10⁵ 5.0 × 10⁴ 0.019
2.0 31 5.7 × 10⁴ 2.3 × 10⁴ 0.019
3.0 81 1.0 × 10⁴ 5.0 × 10³ 0.033
5.0 406 8.9 × 10² 7.4 × 10² 0.11
0.004 0.9 4 1.8 × 10⁵ 1.7 × 10⁵ –
1.0 5 1.7 × 10⁵ 1.7 × 10⁵ –
1.2 7 1.5 × 10⁵ 8.2 × 10⁴ 0.002
1.5 9 1.3 × 10⁵ 9.5 × 10⁴ 0.037
2.0 18 1.2 × 10⁵ 5.8 × 10⁴ 0.011
3.0 29 2.9 × 10⁴ 1.8 × 10⁴ 0.016
5.0 127 2.7 × 10³ 1.9 × 10³ 0.067
0.01 0.95 3 1.3 × 10⁵ 1.3 × 10⁵ –
1.0 4 1.2 × 10⁵ 1.1 × 10⁵ –
1.2 5 1.0 × 10⁵ 7.7 × 10⁴ –
1.5 5 1.1 × 10⁵ 8.0 × 10⁴ –
2.0 13 9.8 × 10⁴ 5.8 × 10⁴ 0.0026
3.0 24 4.5 × 10⁴ 1.6 × 10⁴ 0.026
5.0 45 4.2 × 10³ 3.8 × 10³ 0.050
8.0 >253 3.8 × 10² – 0.16
0.02 1.0 2 9.4 × 10⁴ 8.3 × 10⁴ –
1.2 2 8.5 × 10⁴ 7.9 × 10⁴ –
1.5 4 1.1 × 10⁵ 1.0 × 10⁵ –
2.0 10 1.0 × 10⁵ 8.4 × 10⁴ –
2.5 18 9.3 × 10⁴ 6.1 × 10⁴ 0.0016
3.0 21 6.6 × 10⁴ 3.7 × 10⁴ 0.0057
5.0 19 6.4 × 10³ 6.2 × 10³ 0.025
6.5 58 2.4 × 10³ 2.0 × 10³ 0.066
8.0 46 5.2 × 10² 4.5 × 10² 0.12
0.05 3.0 2 1.2 × 10⁴ 1.2 × 10⁴ –
5.0 3 6.1 × 10³ 5.9 × 10³ –
8.0 55 1.2 × 10³ 1.2 × 10³ 0.054
C© 2006 The Authors. Journal compilation C© 2006 RAS, MNRAS 371, 263–282
The mass of helium in white dwarf stars 269
interval between pulses depending mainly on the initial stellar mass
and only weakly on the heavy element abundance. Because stars
with lower heavy element abundances are smaller, they have lower
mass-loss rates and therefore experience more thermal pulses.
Of fundamental interest to explain the carbon star luminosity
function of the Magellanic Clouds is the degree of third dredge-
up (TDU) following a helium shell flash. This is quantified by the
parameter (e.g. Boothroyd & Sackmann 1988)
λ = �Mdredge
�Mcore
, (8)
where �Mdredge is the mass dredged-up by the convective envelope
and �Mcore is the amount by which the hydrogen-exhausted core
mass increases due to H-burning during the preceding interpulse
period. In principle, the value of λ should depend only on physical
parameters, such as the heavy element abundance, the core mass and
possibly the total stellar mass. However, the amount of TDU found
in evolutionary calculations is found to depend also on the numerical
treatment of convection (Frost & Lattanzio 1996) and the composi-
tion equations (Pols & Tout 2001). Some codes do not find any TDU
for low-mass stars unless convective overshoot is included (Herwig
et al. 1997; Mowlavi 1999), whereas Pols & Tout (2001), Karakas,
Lattanzio & Pols (2002) and Stancliffe, Izzard & Tout (2005) find
very efficient dredge-up with λ ∼ 1. Pols & Tout (2001) and Stan-
cliffe et al. (2005) emphasize that the codes that find efficient TDU
without using overshoot solve the composition equations simultane-
ously with the structure equations. The physical importance of this
is that opacity and energy changes associated with changing com-
position are properly accounted for. However, more work is needed
to clarify the significance of this for TDU calculations. We give the
mean values of λ for our calculations in the last column of Table 3.
We find only modest amounts of dredge-up but λ does follow the
trends found by Boothroyd & Sackmann (1988), i.e. it increases
with decreasing Z and increasing mass. Significantly, we do not find
the very efficient dredge-up of Pols & Tout (2001), Karakas et al.
(2002) and Stancliffe et al. (2005) even though we solve the struc-
ture and composition equations simultaneously. Hence, it is likely
that the contrary TDU behaviour is due to different treatments of
the finite differencing of the convective diffusion coefficient.
Due to our small values for λ, only the 3 M� models with
Z = 0.0002 and 0.001 become carbon stars after 40 and 79 pulses,
respectively. At higher Z values, mass loss removes the envelope
before a sufficient number of pulses have occurred to produce a car-
bon star. To obtain consistency with the Magellanic Clouds’, carbon
star luminosity functions require significantly higher values for λ
(Marigo, Girardi & Bressan 1999) and/or more thermal pulses. Al-
though our 5 M� Z = 0.0002 and 0.001 models experience large
numbers of pulses with higher λ, they do not produce carbon stars
because most of the dredged-up carbon is destroyed by hot bottom
burning (Iben 1975; Lattanzio et al. 1996).
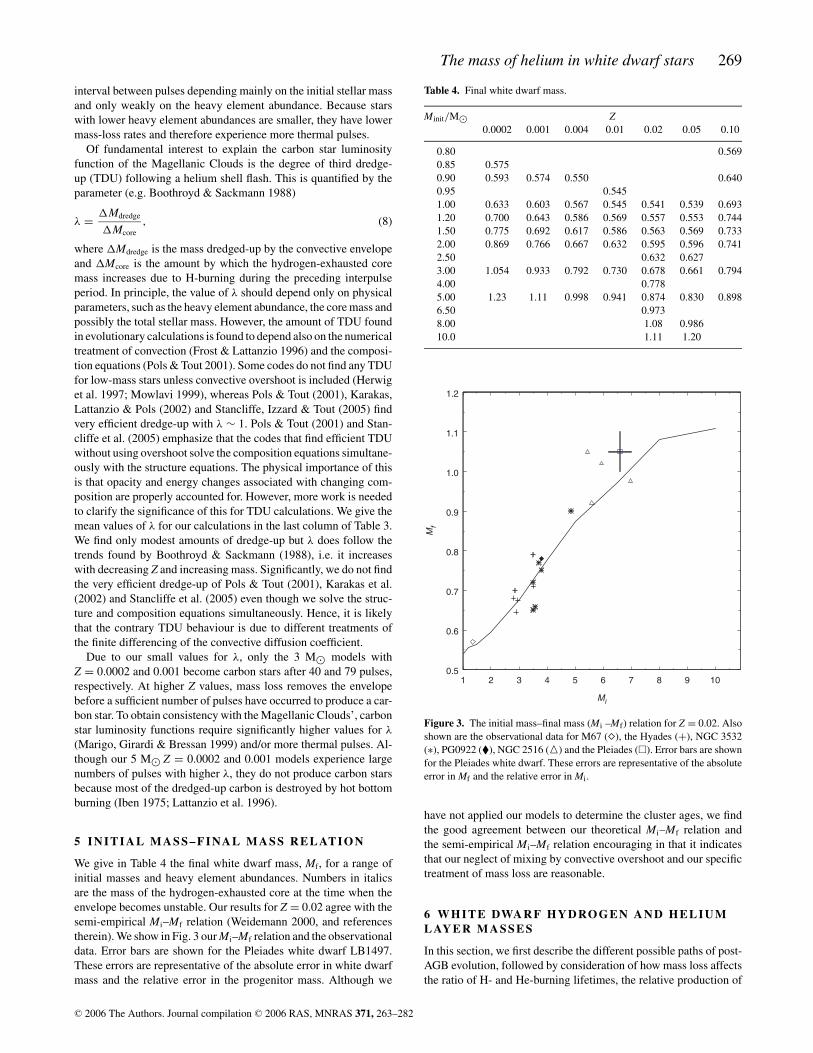
5 I N I T I A L M A S S – F I NA L M A S S R E L AT I O N
We give in Table 4 the final white dwarf mass, Mf, for a range of
initial masses and heavy element abundances. Numbers in italics
are the mass of the hydrogen-exhausted core at the time when the
envelope becomes unstable. Our results for Z = 0.02 agree with the
semi-empirical Mi–Mf relation (Weidemann 2000, and references
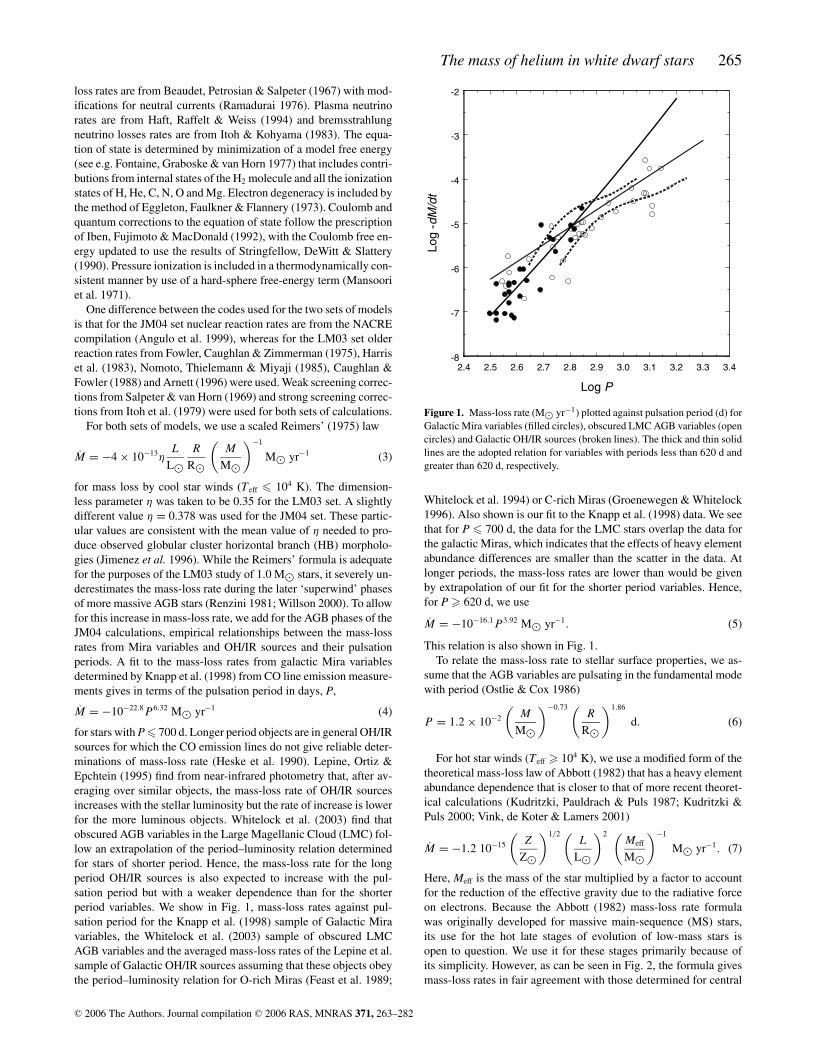
therein). We show in Fig. 3 our Mi–Mf relation and the observational
data. Error bars are shown for the Pleiades white dwarf LB1497.
These errors are representative of the absolute error in white dwarf
mass and the relative error in the progenitor mass. Although we
Table 4. Final white dwarf mass.
Minit/M� Z0.0002 0.001 0.004 0.01 0.02 0.05 0.10
0.80 0.569
0.85 0.575
0.90 0.593 0.574 0.550 0.640
0.95 0.545
1.00 0.633 0.603 0.567 0.545 0.541 0.539 0.693
1.20 0.700 0.643 0.586 0.569 0.557 0.553 0.744
1.50 0.775 0.692 0.617 0.586 0.563 0.569 0.733
2.00 0.869 0.766 0.667 0.632 0.595 0.596 0.741
2.50 0.632 0.627
3.00 1.054 0.933 0.792 0.730 0.678 0.661 0.794
4.00 0.778
5.00 1.23 1.11 0.998 0.941 0.874 0.830 0.898
6.50 0.973
8.00 1.08 0.986
10.0 1.11 1.20
1 2 3 4 5 6 7 8 9 10
Mi
0.5
0.6
0.7
0.8
0.9
1.0
1.1
1.2
Mf
Figure 3. The initial mass–final mass (Mi –Mf) relation for Z = 0.02. Also
shown are the observational data for M67 (�), the Hyades (+), NGC 3532
(∗), PG0922 (�), NGC 2516 (�) and the Pleiades (�). Error bars are shown
for the Pleiades white dwarf. These errors are representative of the absolute
error in Mf and the relative error in Mi.
have not applied our models to determine the cluster ages, we find
the good agreement between our theoretical Mi–Mf relation and
the semi-empirical Mi–Mf relation encouraging in that it indicates
that our neglect of mixing by convective overshoot and our specific
treatment of mass loss are reasonable.
6 W H I T E DWA R F H Y D RO G E N A N D H E L I U ML AY E R M A S S E S
In this section, we first describe the different possible paths of post-
AGB evolution, followed by consideration of how mass loss affects
the ratio of H- and He-burning lifetimes, the relative production of
C© 2006 The Authors. Journal compilation C© 2006 RAS, MNRAS 371, 263–282
270 T. M. Lawlor and J. MacDonald
DA and non-DA white dwarf remnants, and the final mass of helium
in a white dwarf star.
6.1 Post-AGB evolution scenarios
As outlined by Iben (1984), the masses of hydrogen- and helium-
rich layers in the white dwarf remnant depend on whether the star
leaves the AGB-burning hydrogen or helium, and on whether it
experiences a final helium shell flash after leaving the AGB. Iben
identifies six distinct types of model behaviour.
Type I models leave the AGB during the extended hydrogen-
burning phase of a pulse cycle and continue to burn hydrogen during
the CSPN phase until the envelope mass drops below a critical value.
Significant nuclear energy generation ceases and the star cools as a
DA white dwarf.
The evolution of type II models is similar to that of type I mod-
els except that a helium shell flash occurs after the star has begun
cooling as a white dwarf (Fujimoto 1977; Schonberner 1979). This
VLTP causes the star to evolve back to a red giant configuration
in what Iben (1984) called BA evolution. Most of the hydrogen in
the envelope is engulfed by the convective shell and consumed by
nuclear reactions (Iben & MacDonald 1995). During the ensuing
quiescent helium-burning phase, winds can strip off any remaining
hydrogen containing layers so that the surrounding nebula will be
helium-rich and the central star ends up as a non-DA white dwarf
(Iben et al. 1983).
Types III and IV models experience a helium shell flash while
burning hydrogen after leaving the AGB. This LTP also causes the
star to return to the AGB but unlike the type II models hydrogen
does not burn. Again winds might strip off all remaining hydrogen
to produce a non-DA white dwarf. The distinction between types
III and IV models is based on the effective temperature of the star
when the helium shell flash occurs. In type III models, the effective
temperature is high enough (Te > 30 000 K) to excite a planetary
nebula, whereas type IV models are too cool for PN excitation.
Type V models leave the AGB during a helium shell flash and type
VI models leave the AGB during quiescent helium burning. During
the CSPN phase, they burn helium quiescently and they can become
non-DA white dwarfs only if they lose sufficient mass during this
phase.
Due to the high AGB mass-loss rates, our models with Z =0.05 and 0.1 can leave the AGB during the EAGB phase before
the start of the TPAGB phase. To accommodate this behaviour, we
add four new departure types. Type VII models leave the EAGB-
burning helium and continue to burn helium quiescently after leav-
ing the AGB. They become white dwarfs once helium-burning re-
actions die out. The behaviour of type VIII models is similar to
that of type VII models except that a final helium shell flash oc-
curs on the white dwarf cooling track. Type IX models leave the
AGB during the hydrogen-burning phase that follows after the end
of helium burning on the EAGB. They continue to burn hydro-
gen and become white dwarfs without experiencing a final he-
lium shell flash. Type X models are similar to type IX models ex-
cept that they experience a final helium shell flash after starting to
cool as white dwarfs. Types IX and X models are similar to type
I and II models, respectively, except that do not have a TPAGB
phase.
In Table 5, we give the AGB departure type for the JM04 tracks.
To be specific, we define the point of departure from the AGB to
be when the stellar radius has decreased to the value it had at the
end of core helium burning, i.e. at the point of arrival on the AGB.
This definition gives a departure point that is essentially the same as
that found by using Iben’s point of greatest variation of radius with
hydrogen-rich envelope mass. We use our definition because it is
easier to apply. We also give in Table 5, Mcs and Mes, the masses of
the hydrogen exhausted core and the hydrogen-rich envelope at the
start of the TPAGB, Mcd and Med, the corresponding masses at AGB
departure and MHf and MHef, the masses of hydrogen and helium
left when all nuclear reactions have ceased.
6.2 Mass loss and the ratio of He- and H-burning lifetimes
Out of the 32 models in Table 5 that reach the TPAGB phase, i.e.
most of those with Z � 0.05, we find seven that leave the AGB while
burning helium. If the rate at which mass loss and nuclear reactions
depleted the envelope was constant over a thermal pulse cycle, we
would expect the ratio of the number of stars that leave the AGB-
burning helium to the number of stars that leave the AGB-burning
hydrogen to be equal to fheh, the ratio of the times spent burning
helium and hydrogen (determined from whether the helium buffer
mass is decreasing or increasing) during a thermal pulse cycle. Since
the luminosity is roughly the same in the two burning phases and
the energy available from helium burning is about 10 per cent of the
energy available from hydrogen burning, f heh ≈ 0.1, which is less
than the ratio from our models.
However, the rate at which mass loss and nuclear reactions deplete
the envelope is not constant. During the TPAGB the mass-loss rate,
as given by equations (4)–(6), has strong dependences on stellar ra-
dius and stellar mass. Unless the stellar mass changes significantly
during the TPAGB phase, it is mainly radius changes that modulate
the mass-loss rate during a thermal pulse cycle. The rapid energy
release from the helium shell flash causes the stellar radius to briefly
increase by as much as 50 per cent shortly after peak helium burn-
ing. During quiescent helium burning the hydrogen-burning shell is
extinguished and as a consequence the radius declines to a minimum
of about 70 per cent of the pre-flash value. Once hydrogen burning
is re-established the radius increases again to slightly larger than
its pre-flash value. Hence, the mass-loss rate, which increases with
radius, is largest during the first 5 per cent or so of the flash cycle and
smallest in the quiescent helium-burning phase. Because of the very
strong dependence on radius, the peak mass-loss rate is a factor of up
to 200 greater than the mass-loss rate during the hydrogen-burning
phase. Similarly, the minimum mass-loss rate is approximately 10
per cent of the mass-loss rate during the hydrogen-burning phase.
The dependence of mass-loss rate on stellar mass becomes impor-
tant only for stars that have massive envelopes at the start of the
TPAGB. A comparison of the Mcs and Mes values given in Table 5
shows that dependence will be important for stars with M � 1.5 M�if Z � 0.02.
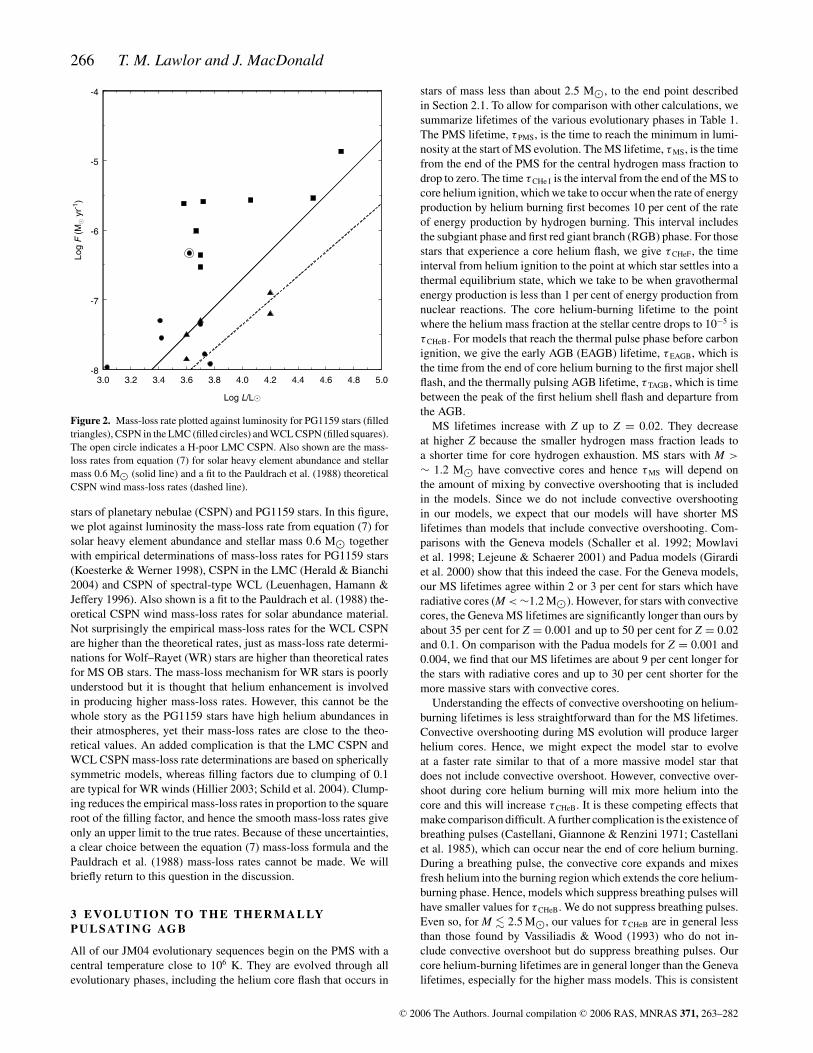
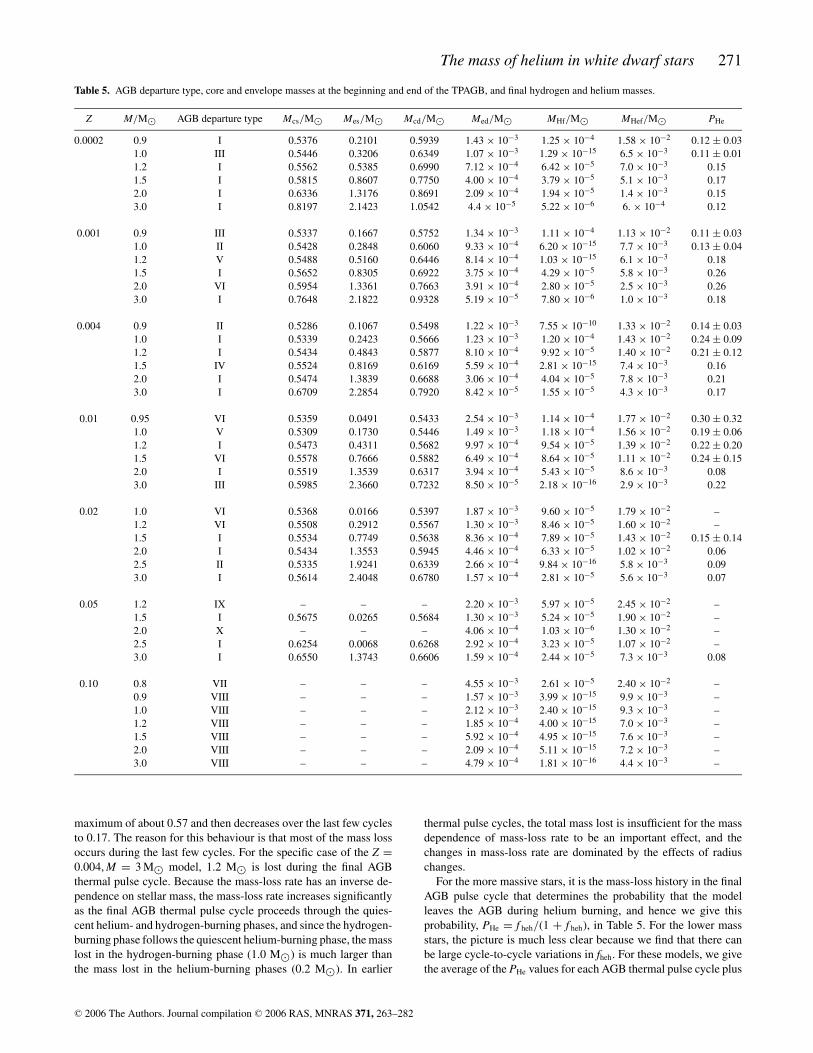
To illustrate the radius and mass-loss rate behaviour during the
TPAGB for a massive star, we plot in Fig. 4 these quantities against
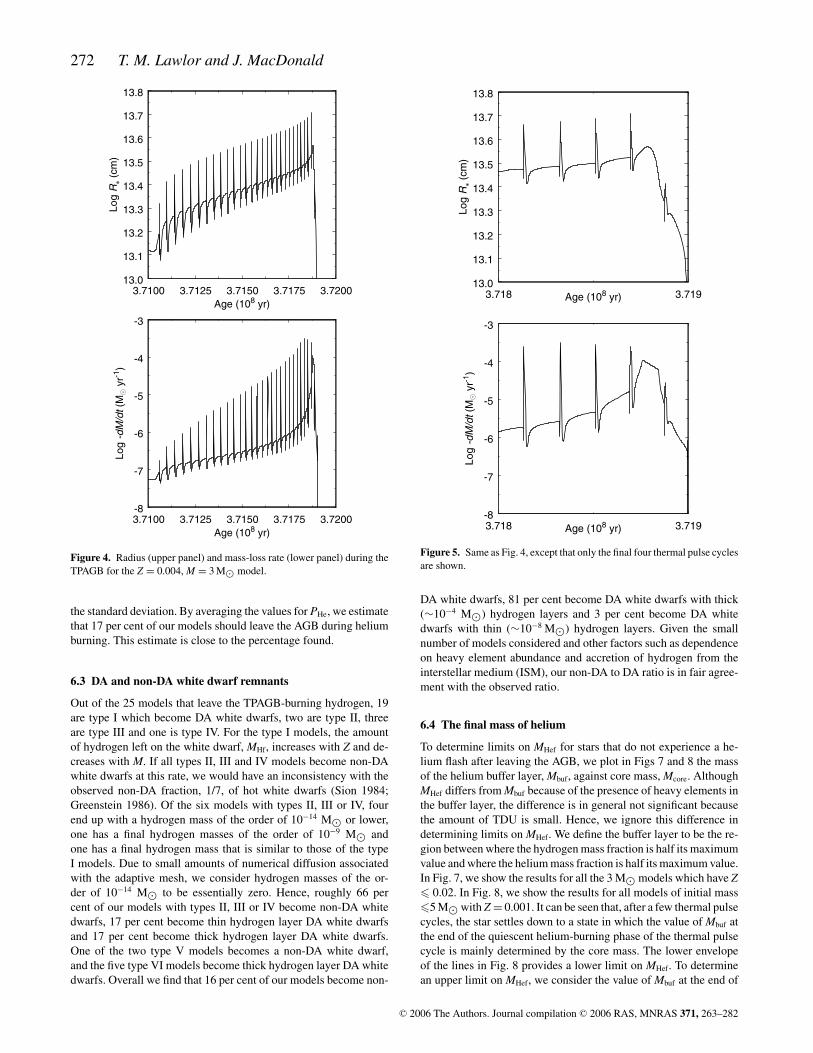
time for the Z = 0.004, M = 3 M� model. In Fig. 5, we plot the
same quantities but only show the final four thermal pulse cycles.
We see that the mass-loss behaviour for the last cycle differs sig-
nificantly from the previous cycles. During the last cycle, the mass-
loss rate in the hydrogen-burning phase is much closer to the peak
mass-loss rate during the helium-burning phases than for the ear-
lier thermal pulse cycles. This has a significant impact on the ratio
of envelope depletion during the two burning phases. Note that the
straight-line segment in the mass-loss rate that appears between
the last two flashes is due to the change in mass-loss rate depen-
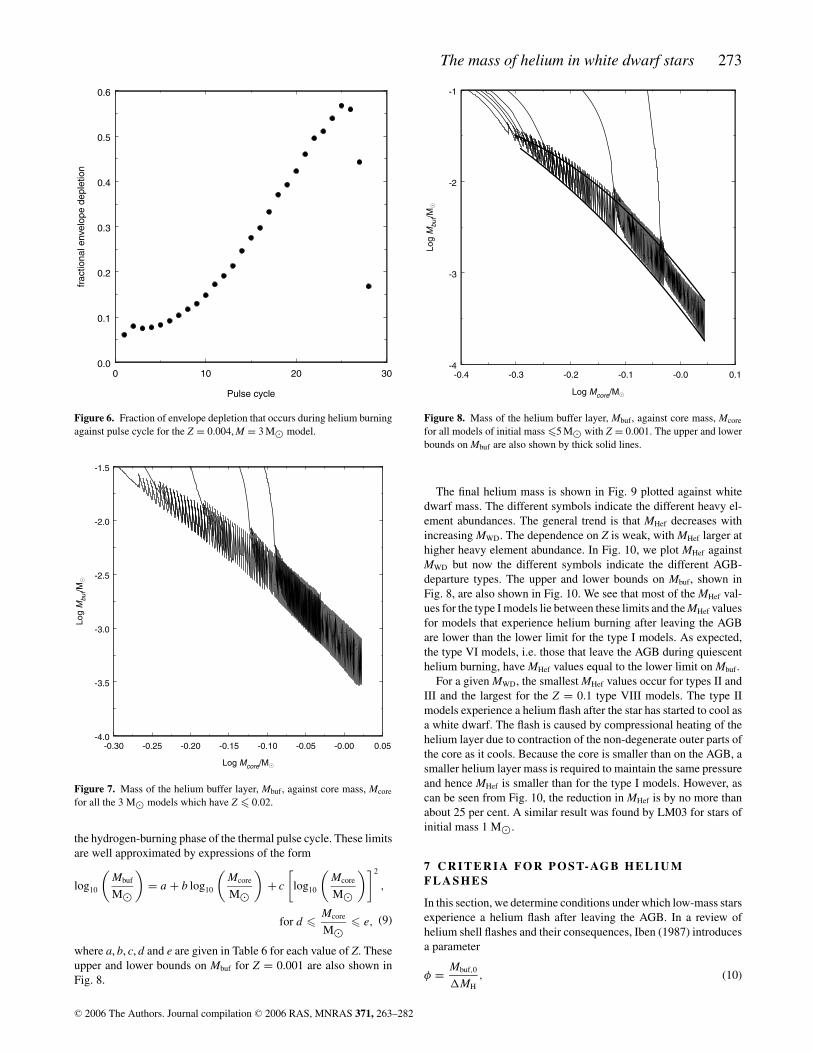
dence on pulsation period at 620 d. In Fig. 6, we plot the fraction
of envelope depletion that occurs during helium burning against
pulse cycle. We see that this fraction increases with pulse cycle to a
C© 2006 The Authors. Journal compilation C© 2006 RAS, MNRAS 371, 263–282
The mass of helium in white dwarf stars 271
Table 5. AGB departure type, core and envelope masses at the beginning and end of the TPAGB, and final hydrogen and helium masses.
Z M/M� AGB departure type Mcs/M� Mes/M� Mcd/M� Med/M� MHf/M� MHef/M� PHe
0.0002 0.9 I 0.5376 0.2101 0.5939 1.43 × 10⁻³ 1.25 × 10⁻⁴ 1.58 × 10⁻² 0.12 ± 0.03
1.0 III 0.5446 0.3206 0.6349 1.07 × 10⁻³ 1.29 × 10⁻¹⁵ 6.5 × 10⁻³ 0.11 ± 0.01
1.2 I 0.5562 0.5385 0.6990 7.12 × 10⁻⁴ 6.42 × 10⁻⁵ 7.0 × 10⁻³ 0.15
1.5 I 0.5815 0.8607 0.7750 4.00 × 10⁻⁴ 3.79 × 10⁻⁵ 5.1 × 10⁻³ 0.17
2.0 I 0.6336 1.3176 0.8691 2.09 × 10⁻⁴ 1.94 × 10⁻⁵ 1.4 × 10⁻³ 0.15
3.0 I 0.8197 2.1423 1.0542 4.4 × 10⁻⁵ 5.22 × 10⁻⁶ 6. × 10−4 0.12
0.001 0.9 III 0.5337 0.1667 0.5752 1.34 × 10⁻³ 1.11 × 10⁻⁴ 1.13 × 10⁻² 0.11 ± 0.03
1.0 II 0.5428 0.2848 0.6060 9.33 × 10⁻⁴ 6.20 × 10⁻¹⁵ 7.7 × 10⁻³ 0.13 ± 0.04
1.2 V 0.5488 0.5160 0.6446 8.14 × 10⁻⁴ 1.03 × 10⁻¹⁵ 6.1 × 10⁻³ 0.18
1.5 I 0.5652 0.8305 0.6922 3.75 × 10⁻⁴ 4.29 × 10⁻⁵ 5.8 × 10⁻³ 0.26
2.0 VI 0.5954 1.3361 0.7663 3.91 × 10⁻⁴ 2.80 × 10⁻⁵ 2.5 × 10⁻³ 0.26
3.0 I 0.7648 2.1822 0.9328 5.19 × 10⁻⁵ 7.80 × 10⁻⁶ 1.0 × 10⁻³ 0.18
0.004 0.9 II 0.5286 0.1067 0.5498 1.22 × 10⁻³ 7.55 × 10⁻¹⁰ 1.33 × 10⁻² 0.14 ± 0.03
1.0 I 0.5339 0.2423 0.5666 1.23 × 10⁻³ 1.20 × 10⁻⁴ 1.43 × 10⁻² 0.24 ± 0.09
1.2 I 0.5434 0.4843 0.5877 8.10 × 10⁻⁴ 9.92 × 10⁻⁵ 1.40 × 10⁻² 0.21 ± 0.12
1.5 IV 0.5524 0.8169 0.6169 5.59 × 10⁻⁴ 2.81 × 10⁻¹⁵ 7.4 × 10⁻³ 0.16
2.0 I 0.5474 1.3839 0.6688 3.06 × 10⁻⁴ 4.04 × 10⁻⁵ 7.8 × 10⁻³ 0.21
3.0 I 0.6709 2.2854 0.7920 8.42 × 10⁻⁵ 1.55 × 10⁻⁵ 4.3 × 10⁻³ 0.17
0.01 0.95 VI 0.5359 0.0491 0.5433 2.54 × 10⁻³ 1.14 × 10⁻⁴ 1.77 × 10⁻² 0.30 ± 0.32
1.0 V 0.5309 0.1730 0.5446 1.49 × 10⁻³ 1.18 × 10⁻⁴ 1.56 × 10⁻² 0.19 ± 0.06
1.2 I 0.5473 0.4311 0.5682 9.97 × 10⁻⁴ 9.54 × 10⁻⁵ 1.39 × 10⁻² 0.22 ± 0.20
1.5 VI 0.5578 0.7666 0.5882 6.49 × 10⁻⁴ 8.64 × 10⁻⁵ 1.11 × 10⁻² 0.24 ± 0.15
2.0 I 0.5519 1.3539 0.6317 3.94 × 10⁻⁴ 5.43 × 10⁻⁵ 8.6 × 10⁻³ 0.08
3.0 III 0.5985 2.3660 0.7232 8.50 × 10⁻⁵ 2.18 × 10⁻¹⁶ 2.9 × 10⁻³ 0.22
0.02 1.0 VI 0.5368 0.0166 0.5397 1.87 × 10⁻³ 9.60 × 10⁻⁵ 1.79 × 10⁻² –
1.2 VI 0.5508 0.2912 0.5567 1.30 × 10⁻³ 8.46 × 10⁻⁵ 1.60 × 10⁻² –
1.5 I 0.5534 0.7749 0.5638 8.36 × 10⁻⁴ 7.89 × 10⁻⁵ 1.43 × 10⁻² 0.15 ± 0.14
2.0 I 0.5434 1.3553 0.5945 4.46 × 10⁻⁴ 6.33 × 10⁻⁵ 1.02 × 10⁻² 0.06
2.5 II 0.5335 1.9241 0.6339 2.66 × 10⁻⁴ 9.84 × 10⁻¹⁶ 5.8 × 10⁻³ 0.09
3.0 I 0.5614 2.4048 0.6780 1.57 × 10⁻⁴ 2.81 × 10⁻⁵ 5.6 × 10⁻³ 0.07
0.05 1.2 IX – – – 2.20 × 10⁻³ 5.97 × 10⁻⁵ 2.45 × 10⁻² –
1.5 I 0.5675 0.0265 0.5684 1.30 × 10⁻³ 5.24 × 10⁻⁵ 1.90 × 10⁻² –
2.0 X – – – 4.06 × 10⁻⁴ 1.03 × 10⁻⁶ 1.30 × 10⁻² –
2.5 I 0.6254 0.0068 0.6268 2.92 × 10⁻⁴ 3.23 × 10⁻⁵ 1.07 × 10⁻² –
3.0 I 0.6550 1.3743 0.6606 1.59 × 10⁻⁴ 2.44 × 10⁻⁵ 7.3 × 10⁻³ 0.08
0.10 0.8 VII – – – 4.55 × 10⁻³ 2.61 × 10⁻⁵ 2.40 × 10⁻² –
0.9 VIII – – – 1.57 × 10⁻³ 3.99 × 10⁻¹⁵ 9.9 × 10⁻³ –
1.0 VIII – – – 2.12 × 10⁻³ 2.40 × 10⁻¹⁵ 9.3 × 10⁻³ –
1.2 VIII – – – 1.85 × 10⁻⁴ 4.00 × 10⁻¹⁵ 7.0 × 10⁻³ –
1.5 VIII – – – 5.92 × 10⁻⁴ 4.95 × 10⁻¹⁵ 7.6 × 10⁻³ –
2.0 VIII – – – 2.09 × 10⁻⁴ 5.11 × 10⁻¹⁵ 7.2 × 10⁻³ –
3.0 VIII – – – 4.79 × 10⁻⁴ 1.81 × 10⁻¹⁶ 4.4 × 10⁻³ –
maximum of about 0.57 and then decreases over the last few cycles
to 0.17. The reason for this behaviour is that most of the mass loss
occurs during the last few cycles. For the specific case of the Z =0.004, M = 3 M� model, 1.2 M� is lost during the final AGB
thermal pulse cycle. Because the mass-loss rate has an inverse de-
pendence on stellar mass, the mass-loss rate increases significantly
as the final AGB thermal pulse cycle proceeds through the quies-
cent helium- and hydrogen-burning phases, and since the hydrogen-
burning phase follows the quiescent helium-burning phase, the mass
lost in the hydrogen-burning phase (1.0 M�) is much larger than
the mass lost in the helium-burning phases (0.2 M�). In earlier
thermal pulse cycles, the total mass lost is insufficient for the mass
dependence of mass-loss rate to be an important effect, and the
changes in mass-loss rate are dominated by the effects of radius
changes.
For the more massive stars, it is the mass-loss history in the final
AGB pulse cycle that determines the probability that the model
leaves the AGB during helium burning, and hence we give this
probability, PHe = f heh/(1 + f heh), in Table 5. For the lower mass
stars, the picture is much less clear because we find that there can
be large cycle-to-cycle variations in fheh. For these models, we give
the average of the PHe values for each AGB thermal pulse cycle plus
C© 2006 The Authors. Journal compilation C© 2006 RAS, MNRAS 371, 263–282
272 T. M. Lawlor and J. MacDonald
3.7100 3.7125 3.7150 3.7175 3.7200
Age (108 yr)
13.0
13.1
13.2
13.3
13.4
13.5
13.6
13.7
13.8
Lo
gR
(cm
)
3.7100 3.7125 3.7150 3.7175 3.7200
Age (108 yr)
-8
-7
-6
-5
-4
-3
Lo
g-d
M/d
t (M
yr-1
)
Figure 4. Radius (upper panel) and mass-loss rate (lower panel) during the
TPAGB for the Z = 0.004, M = 3 M� model.
the standard deviation. By averaging the values for PHe, we estimate
that 17 per cent of our models should leave the AGB during helium
burning. This estimate is close to the percentage found.
6.3 DA and non-DA white dwarf remnants
Out of the 25 models that leave the TPAGB-burning hydrogen, 19
are type I which become DA white dwarfs, two are type II, three
are type III and one is type IV. For the type I models, the amount
of hydrogen left on the white dwarf, MHf, increases with Z and de-
creases with M. If all types II, III and IV models become non-DA
white dwarfs at this rate, we would have an inconsistency with the
observed non-DA fraction, 1/7, of hot white dwarfs (Sion 1984;
Greenstein 1986). Of the six models with types II, III or IV, four
end up with a hydrogen mass of the order of 10−14 M� or lower,
one has a final hydrogen masses of the order of 10−9 M� and
one has a final hydrogen mass that is similar to those of the type
I models. Due to small amounts of numerical diffusion associated
with the adaptive mesh, we consider hydrogen masses of the or-
der of 10−14 M� to be essentially zero. Hence, roughly 66 per
cent of our models with types II, III or IV become non-DA white
dwarfs, 17 per cent become thin hydrogen layer DA white dwarfs
and 17 per cent become thick hydrogen layer DA white dwarfs.
One of the two type V models becomes a non-DA white dwarf,
and the five type VI models become thick hydrogen layer DA white
dwarfs. Overall we find that 16 per cent of our models become non-
3.718 3.719Age (108 yr)
13.0
13.1
13.2
13.3
13.4
13.5
13.6
13.7
13.8
Lo
gR
(cm
)
3.718 3.719Age (108 yr)
-8
-7
-6
-5
-4
-3
Lo
g-d
M/d
t (M
yr-1
)
Figure 5. Same as Fig. 4, except that only the final four thermal pulse cycles
are shown.
DA white dwarfs, 81 per cent become DA white dwarfs with thick
(∼10−4 M�) hydrogen layers and 3 per cent become DA white
dwarfs with thin (∼10−8 M�) hydrogen layers. Given the small
number of models considered and other factors such as dependence
on heavy element abundance and accretion of hydrogen from the
interstellar medium (ISM), our non-DA to DA ratio is in fair agree-
ment with the observed ratio.
6.4 The final mass of helium
To determine limits on MHef for stars that do not experience a he-
lium flash after leaving the AGB, we plot in Figs 7 and 8 the mass
of the helium buffer layer, Mbuf, against core mass, Mcore. Although
MHef differs from Mbuf because of the presence of heavy elements in
the buffer layer, the difference is in general not significant because
the amount of TDU is small. Hence, we ignore this difference in
determining limits on MHef. We define the buffer layer to be the re-
gion between where the hydrogen mass fraction is half its maximum
value and where the helium mass fraction is half its maximum value.
In Fig. 7, we show the results for all the 3 M� models which have Z� 0.02. In Fig. 8, we show the results for all models of initial mass
�5 M� with Z = 0.001. It can be seen that, after a few thermal pulse
cycles, the star settles down to a state in which the value of Mbuf at
the end of the quiescent helium-burning phase of the thermal pulse
cycle is mainly determined by the core mass. The lower envelope
of the lines in Fig. 8 provides a lower limit on MHef. To determine
an upper limit on MHef, we consider the value of Mbuf at the end of
C© 2006 The Authors. Journal compilation C© 2006 RAS, MNRAS 371, 263–282
The mass of helium in white dwarf stars 273
0 10 20 30
Pulse cycle
0.0
0.1
0.2
0.3
0.4
0.5
0.6
fra
ctio
na
l e
nve
lop
e d
ep
letio
n
Figure 6. Fraction of envelope depletion that occurs during helium burning
against pulse cycle for the Z = 0.004, M = 3 M� model.
-0.30 -0.25 -0.20 -0.15 -0.10 -0.05 -0.00 0.05
Log Mcore/M
-4.0
-3.5
-3.0
-2.5
-2.0
-1.5
Lo
gM
bu
f/M
Figure 7. Mass of the helium buffer layer, Mbuf, against core mass, Mcore
for all the 3 M� models which have Z � 0.02.
the hydrogen-burning phase of the thermal pulse cycle. These limits
are well approximated by expressions of the form
log10
(Mbuf
M�
)= a + b log10
(Mcore
M�
)+ c
[log10
(Mcore
M�
)]2
,
for d � Mcore
M�� e, (9)
where a, b, c, d and e are given in Table 6 for each value of Z. These
upper and lower bounds on Mbuf for Z = 0.001 are also shown in
Fig. 8.
-0.4 -0.3 -0.2 -0.1 -0.0 0.1
Log Mcore/M
-4
-3
-2
-1
Log
Mbu
f/M
Figure 8. Mass of the helium buffer layer, Mbuf, against core mass, Mcore
for all models of initial mass �5 M� with Z = 0.001. The upper and lower
bounds on Mbuf are also shown by thick solid lines.
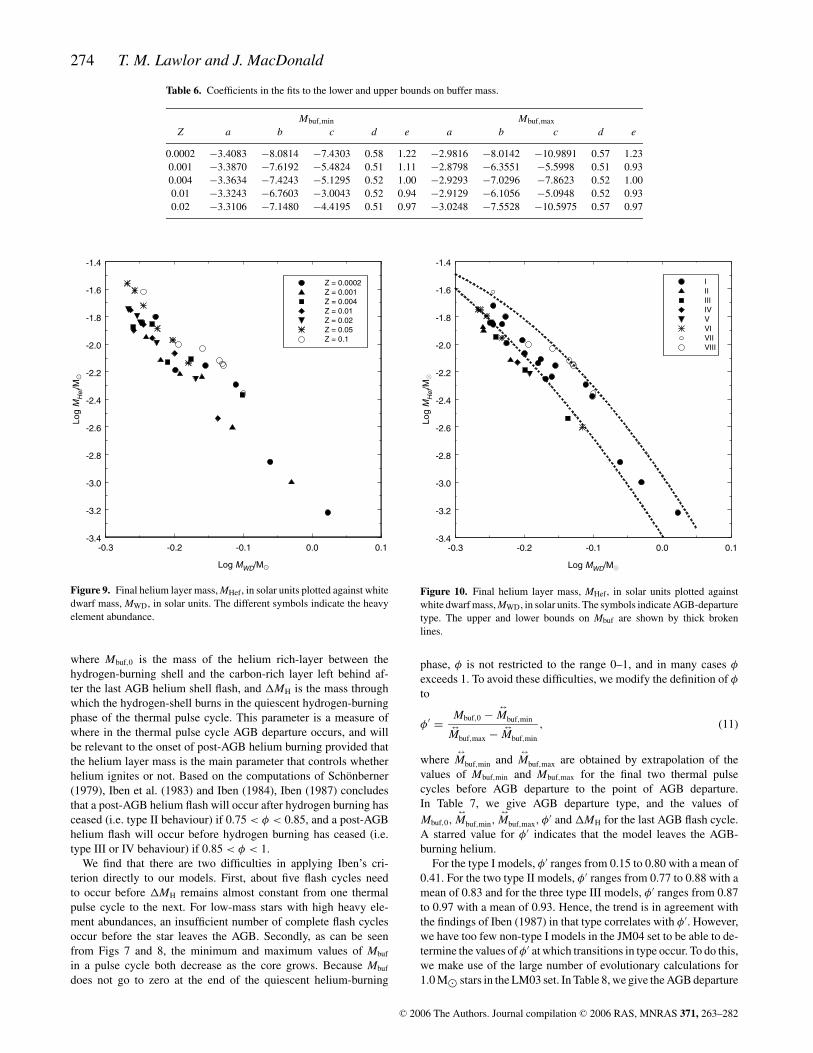
The final helium mass is shown in Fig. 9 plotted against white
dwarf mass. The different symbols indicate the different heavy el-
ement abundances. The general trend is that MHef decreases with
increasing MWD. The dependence on Z is weak, with MHef larger at
higher heavy element abundance. In Fig. 10, we plot MHef against
MWD but now the different symbols indicate the different AGB-
departure types. The upper and lower bounds on Mbuf, shown in
Fig. 8, are also shown in Fig. 10. We see that most of the MHef val-
ues for the type I models lie between these limits and the MHef values
for models that experience helium burning after leaving the AGB
are lower than the lower limit for the type I models. As expected,
the type VI models, i.e. those that leave the AGB during quiescent
helium burning, have MHef values equal to the lower limit on Mbuf.
For a given MWD, the smallest MHef values occur for types II and
III and the largest for the Z = 0.1 type VIII models. The type II
models experience a helium flash after the star has started to cool as
a white dwarf. The flash is caused by compressional heating of the
helium layer due to contraction of the non-degenerate outer parts of
the core as it cools. Because the core is smaller than on the AGB, a
smaller helium layer mass is required to maintain the same pressure
and hence MHef is smaller than for the type I models. However, as
can be seen from Fig. 10, the reduction in MHef is by no more than
about 25 per cent. A similar result was found by LM03 for stars of
initial mass 1 M�.
7 C R I T E R I A F O R P O S T- AG B H E L I U MF L A S H E S
In this section, we determine conditions under which low-mass stars
experience a helium flash after leaving the AGB. In a review of
helium shell flashes and their consequences, Iben (1987) introduces
a parameter
φ = Mbuf,0
�MH
, (10)
C© 2006 The Authors. Journal compilation C© 2006 RAS, MNRAS 371, 263–282
274 T. M. Lawlor and J. MacDonald
Table 6. Coefficients in the fits to the lower and upper bounds on buffer mass.
Mbuf,min Mbuf,max
Z a b c d e a b c d e
0.0002 −3.4083 −8.0814 −7.4303 0.58 1.22 −2.9816 −8.0142 −10.9891 0.57 1.23
0.001 −3.3870 −7.6192 −5.4824 0.51 1.11 −2.8798 −6.3551 −5.5998 0.51 0.93
0.004 −3.3634 −7.4243 −5.1295 0.52 1.00 −2.9293 −7.0296 −7.8623 0.52 1.00
0.01 −3.3243 −6.7603 −3.0043 0.52 0.94 −2.9129 −6.1056 −5.0948 0.52 0.93
0.02 −3.3106 −7.1480 −4.4195 0.51 0.97 −3.0248 −7.5528 −10.5975 0.57 0.97
-0.3 -0.2 -0.1 0.0 0.1
Log MWD/M
-3.4
-3.2
-3.0
-2.8
-2.6
-2.4
-2.2
-2.0
-1.8
-1.6
-1.4
Lo
gM
He
f/M
Z = 0.0002
Z = 0.001
Z = 0.004
Z = 0.01
Z = 0.02
Z = 0.05
Z = 0.1
Figure 9. Final helium layer mass, MHef, in solar units plotted against white
dwarf mass, MWD, in solar units. The different symbols indicate the heavy
element abundance.
where Mbuf,0 is the mass of the helium rich-layer between the
hydrogen-burning shell and the carbon-rich layer left behind af-
ter the last AGB helium shell flash, and �MH is the mass through
which the hydrogen-shell burns in the quiescent hydrogen-burning
phase of the thermal pulse cycle. This parameter is a measure of
where in the thermal pulse cycle AGB departure occurs, and will
be relevant to the onset of post-AGB helium burning provided that
the helium layer mass is the main parameter that controls whether
helium ignites or not. Based on the computations of Schonberner
(1979), Iben et al. (1983) and Iben (1984), Iben (1987) concludes
that a post-AGB helium flash will occur after hydrogen burning has
ceased (i.e. type II behaviour) if 0.75 < φ < 0.85, and a post-AGB
helium flash will occur before hydrogen burning has ceased (i.e.
type III or IV behaviour) if 0.85 < φ < 1.
We find that there are two difficulties in applying Iben’s cri-
terion directly to our models. First, about five flash cycles need
to occur before �MH remains almost constant from one thermal
pulse cycle to the next. For low-mass stars with high heavy ele-
ment abundances, an insufficient number of complete flash cycles
occur before the star leaves the AGB. Secondly, as can be seen
from Figs 7 and 8, the minimum and maximum values of Mbuf
in a pulse cycle both decrease as the core grows. Because Mbuf
does not go to zero at the end of the quiescent helium-burning
-0.3 -0.2 -0.1 0.0 0.1
Log MWD/M
-3.4
-3.2
-3.0
-2.8
-2.6
-2.4
-2.2
-2.0
-1.8
-1.6
-1.4
Lo
gM
He
f/M
I
II
III
IV
V
VI
VII
VIII
Figure 10. Final helium layer mass, MHef, in solar units plotted against
white dwarf mass, MWD, in solar units. The symbols indicate AGB-departure
type. The upper and lower bounds on Mbuf are shown by thick broken
lines.
phase, φ is not restricted to the range 0–1, and in many cases φ
exceeds 1. To avoid these difficulties, we modify the definition of φ
to
φ′ = Mbuf,0 − M↔
buf,min
M↔
buf,max − M↔
buf,min
, (11)
where M↔
buf,min and M↔
buf,max are obtained by extrapolation of the
values of Mbuf,min and Mbuf,max for the final two thermal pulse
cycles before AGB departure to the point of AGB departure.
In Table 7, we give AGB departure type, and the values of
Mbuf,0, M↔
buf,min, M↔
buf,max, φ′ and �MH for the last AGB flash cycle.
A starred value for φ′ indicates that the model leaves the AGB-
burning helium.
For the type I models, φ′ ranges from 0.15 to 0.80 with a mean of
0.41. For the two type II models, φ′ ranges from 0.77 to 0.88 with a
mean of 0.83 and for the three type III models, φ′ ranges from 0.87
to 0.97 with a mean of 0.93. Hence, the trend is in agreement with
the findings of Iben (1987) in that type correlates with φ′. However,
we have too few non-type I models in the JM04 set to be able to de-
termine the values of φ′ at which transitions in type occur. To do this,
we make use of the large number of evolutionary calculations for
1.0 M� stars in the LM03 set. In Table 8, we give the AGB departure
C© 2006 The Authors. Journal compilation C© 2006 RAS, MNRAS 371, 263–282
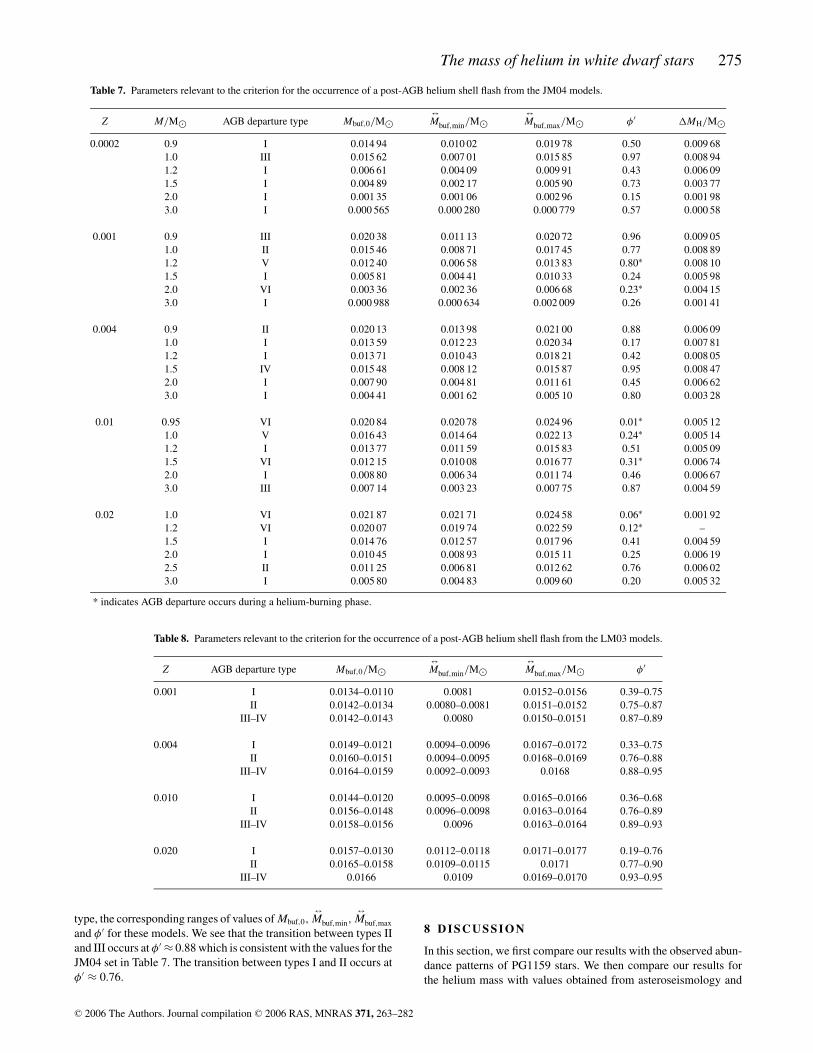
The mass of helium in white dwarf stars 275
Table 7. Parameters relevant to the criterion for the occurrence of a post-AGB helium shell flash from the JM04 models.
Z M/M� AGB departure type Mbuf,0/M� M↔
buf,min/M� M↔
buf,max/M� φ′ �MH/M�0.0002 0.9 I 0.014 94 0.010 02 0.019 78 0.50 0.009 68
1.0 III 0.015 62 0.007 01 0.015 85 0.97 0.008 94
1.2 I 0.006 61 0.004 09 0.009 91 0.43 0.006 09
1.5 I 0.004 89 0.002 17 0.005 90 0.73 0.003 77
2.0 I 0.001 35 0.001 06 0.002 96 0.15 0.001 98
3.0 I 0.000 565 0.000 280 0.000 779 0.57 0.000 58
0.001 0.9 III 0.020 38 0.011 13 0.020 72 0.96 0.009 05
1.0 II 0.015 46 0.008 71 0.017 45 0.77 0.008 89
1.2 V 0.012 40 0.006 58 0.013 83 0.80∗ 0.008 10
1.5 I 0.005 81 0.004 41 0.010 33 0.24 0.005 98
2.0 VI 0.003 36 0.002 36 0.006 68 0.23∗ 0.004 15
3.0 I 0.000 988 0.000 634 0.002 009 0.26 0.001 41
0.004 0.9 II 0.020 13 0.013 98 0.021 00 0.88 0.006 09
1.0 I 0.013 59 0.012 23 0.020 34 0.17 0.007 81
1.2 I 0.013 71 0.010 43 0.018 21 0.42 0.008 05
1.5 IV 0.015 48 0.008 12 0.015 87 0.95 0.008 47
2.0 I 0.007 90 0.004 81 0.011 61 0.45 0.006 62
3.0 I 0.004 41 0.001 62 0.005 10 0.80 0.003 28
0.01 0.95 VI 0.020 84 0.020 78 0.024 96 0.01∗ 0.005 12
1.0 V 0.016 43 0.014 64 0.022 13 0.24∗ 0.005 14
1.2 I 0.013 77 0.011 59 0.015 83 0.51 0.005 09
1.5 VI 0.012 15 0.010 08 0.016 77 0.31∗ 0.006 74
2.0 I 0.008 80 0.006 34 0.011 74 0.46 0.006 67
3.0 III 0.007 14 0.003 23 0.007 75 0.87 0.004 59
0.02 1.0 VI 0.021 87 0.021 71 0.024 58 0.06∗ 0.001 92
1.2 VI 0.020 07 0.019 74 0.022 59 0.12∗ –
1.5 I 0.014 76 0.012 57 0.017 96 0.41 0.004 59
2.0 I 0.010 45 0.008 93 0.015 11 0.25 0.006 19
2.5 II 0.011 25 0.006 81 0.012 62 0.76 0.006 02
3.0 I 0.005 80 0.004 83 0.009 60 0.20 0.005 32
* indicates AGB departure occurs during a helium-burning phase.
Table 8. Parameters relevant to the criterion for the occurrence of a post-AGB helium shell flash from the LM03 models.
Z AGB departure type Mbuf,0/M� M↔
buf,min/M� M↔
buf,max/M� φ′
0.001 I 0.0134–0.0110 0.0081 0.0152–0.0156 0.39–0.75
II 0.0142–0.0134 0.0080–0.0081 0.0151–0.0152 0.75–0.87
III–IV 0.0142–0.0143 0.0080 0.0150–0.0151 0.87–0.89
0.004 I 0.0149–0.0121 0.0094–0.0096 0.0167–0.0172 0.33–0.75
II 0.0160–0.0151 0.0094–0.0095 0.0168–0.0169 0.76–0.88
III–IV 0.0164–0.0159 0.0092–0.0093 0.0168 0.88–0.95
0.010 I 0.0144–0.0120 0.0095–0.0098 0.0165–0.0166 0.36–0.68
II 0.0156–0.0148 0.0096–0.0098 0.0163–0.0164 0.76–0.89
III–IV 0.0158–0.0156 0.0096 0.0163–0.0164 0.89–0.93
0.020 I 0.0157–0.0130 0.0112–0.0118 0.0171–0.0177 0.19–0.76
II 0.0165–0.0158 0.0109–0.0115 0.0171 0.77–0.90
III–IV 0.0166 0.0109 0.0169–0.0170 0.93–0.95
type, the corresponding ranges of values of Mbuf,0, M↔
buf,min, M↔
buf,max
and φ′ for these models. We see that the transition between types II
and III occurs at φ′ ≈ 0.88 which is consistent with the values for the
JM04 set in Table 7. The transition between types I and II occurs at
φ′ ≈ 0.76.
8 D I S C U S S I O N
In this section, we first compare our results with the observed abun-
dance patterns of PG1159 stars. We then compare our results for
the helium mass with values obtained from asteroseismology and
C© 2006 The Authors. Journal compilation C© 2006 RAS, MNRAS 371, 263–282
276 T. M. Lawlor and J. MacDonald
5.5 5.4 5.3 5.2 5.1 5.0 4.9 4.8 4.7 4.6 4.5
Log Teff (K)
8.4
7.4
6.4
5.4
Lo
gg
(cm
s-2
)
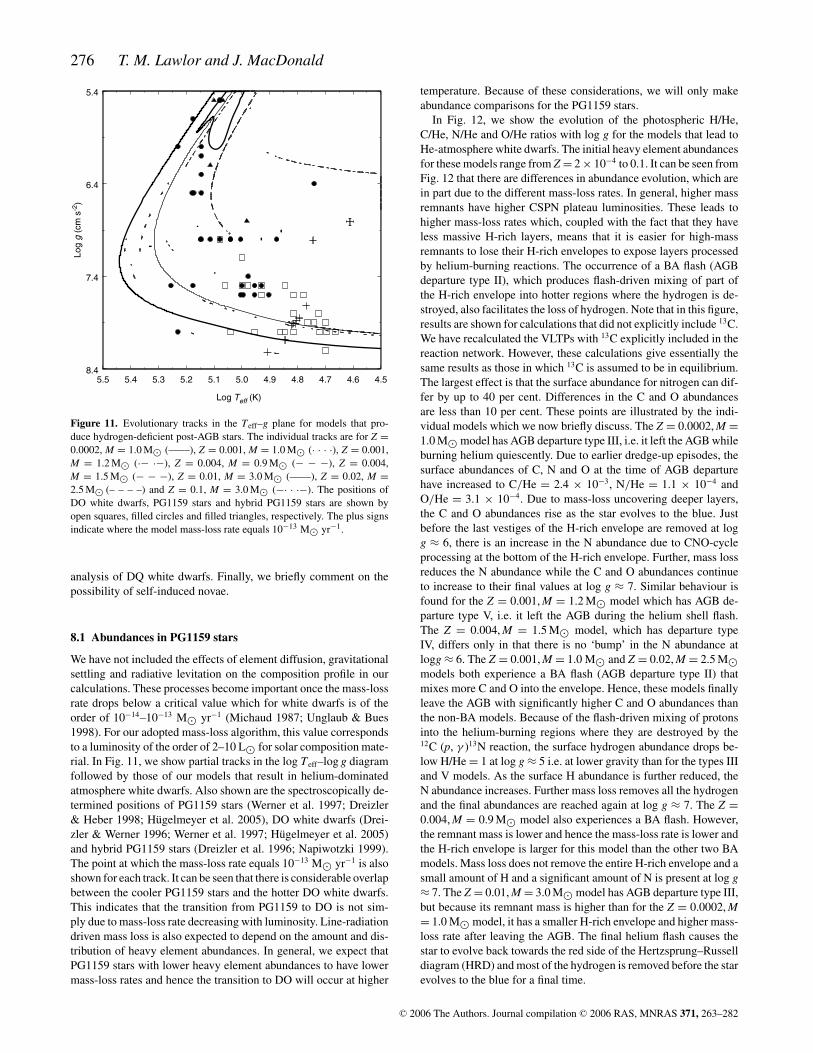
Figure 11. Evolutionary tracks in the Teff–g plane for models that pro-
duce hydrogen-deficient post-AGB stars. The individual tracks are for Z =0.0002, M = 1.0 M� (––––), Z = 0.001, M = 1.0 M� (· · · ·), Z = 0.001,
M = 1.2 M� (·− ·−), Z = 0.004, M = 0.9 M� (− − −), Z = 0.004,
M = 1.5 M� (− − −), Z = 0.01, M = 3.0 M� (––––), Z = 0.02, M =2.5 M� (– – – –) and Z = 0.1, M = 3.0 M� (−· · ·−). The positions of
DO white dwarfs, PG1159 stars and hybrid PG1159 stars are shown by
open squares, filled circles and filled triangles, respectively. The plus signs
indicate where the model mass-loss rate equals 10−13 M� yr−1.
analysis of DQ white dwarfs. Finally, we briefly comment on the
possibility of self-induced novae.
8.1 Abundances in PG1159 stars
We have not included the effects of element diffusion, gravitational
settling and radiative levitation on the composition profile in our
calculations. These processes become important once the mass-loss
rate drops below a critical value which for white dwarfs is of the
order of 10−14–10−13 M� yr−1 (Michaud 1987; Unglaub & Bues
1998). For our adopted mass-loss algorithm, this value corresponds
to a luminosity of the order of 2–10 L� for solar composition mate-
rial. In Fig. 11, we show partial tracks in the log Teff–log g diagram
followed by those of our models that result in helium-dominated
atmosphere white dwarfs. Also shown are the spectroscopically de-
termined positions of PG1159 stars (Werner et al. 1997; Dreizler
& Heber 1998; Hugelmeyer et al. 2005), DO white dwarfs (Drei-
zler & Werner 1996; Werner et al. 1997; Hugelmeyer et al. 2005)
and hybrid PG1159 stars (Dreizler et al. 1996; Napiwotzki 1999).
The point at which the mass-loss rate equals 10−13 M� yr−1 is also
shown for each track. It can be seen that there is considerable overlap
between the cooler PG1159 stars and the hotter DO white dwarfs.
This indicates that the transition from PG1159 to DO is not sim-
ply due to mass-loss rate decreasing with luminosity. Line-radiation
driven mass loss is also expected to depend on the amount and dis-
tribution of heavy element abundances. In general, we expect that
PG1159 stars with lower heavy element abundances to have lower
mass-loss rates and hence the transition to DO will occur at higher
temperature. Because of these considerations, we will only make
abundance comparisons for the PG1159 stars.
In Fig. 12, we show the evolution of the photospheric H/He,
C/He, N/He and O/He ratios with log g for the models that lead to
He-atmosphere white dwarfs. The initial heavy element abundances
for these models range from Z = 2 × 10⁻⁴ to 0.1. It can be seen from
Fig. 12 that there are differences in abundance evolution, which are
in part due to the different mass-loss rates. In general, higher mass
remnants have higher CSPN plateau luminosities. These leads to
higher mass-loss rates which, coupled with the fact that they have
less massive H-rich layers, means that it is easier for high-mass
remnants to lose their H-rich envelopes to expose layers processed
by helium-burning reactions. The occurrence of a BA flash (AGB
departure type II), which produces flash-driven mixing of part of
the H-rich envelope into hotter regions where the hydrogen is de-
stroyed, also facilitates the loss of hydrogen. Note that in this figure,
results are shown for calculations that did not explicitly include 13C.
We have recalculated the VLTPs with 13C explicitly included in the
reaction network. However, these calculations give essentially the
same results as those in which 13C is assumed to be in equilibrium.
The largest effect is that the surface abundance for nitrogen can dif-
fer by up to 40 per cent. Differences in the C and O abundances
are less than 10 per cent. These points are illustrated by the indi-
vidual models which we now briefly discuss. The Z = 0.0002, M =1.0 M� model has AGB departure type III, i.e. it left the AGB while
burning helium quiescently. Due to earlier dredge-up episodes, the
surface abundances of C, N and O at the time of AGB departure
have increased to C/He = 2.4 × 10⁻³, N/He = 1.1 × 10⁻⁴ and
O/He = 3.1 × 10⁻⁴. Due to mass-loss uncovering deeper layers,
the C and O abundances rise as the star evolves to the blue. Just
before the last vestiges of the H-rich envelope are removed at log
g ≈ 6, there is an increase in the N abundance due to CNO-cycle
processing at the bottom of the H-rich envelope. Further, mass loss
reduces the N abundance while the C and O abundances continue
to increase to their final values at log g ≈ 7. Similar behaviour is
found for the Z = 0.001, M = 1.2 M� model which has AGB de-
parture type V, i.e. it left the AGB during the helium shell flash.
The Z = 0.004, M = 1.5 M� model, which has departure type
IV, differs only in that there is no ‘bump’ in the N abundance at
logg ≈ 6. The Z = 0.001, M = 1.0 M� and Z = 0.02, M = 2.5 M�models both experience a BA flash (AGB departure type II) that
mixes more C and O into the envelope. Hence, these models finally
leave the AGB with significantly higher C and O abundances than
the non-BA models. Because of the flash-driven mixing of protons
into the helium-burning regions where they are destroyed by the12C (p, γ )13N reaction, the surface hydrogen abundance drops be-
low H/He = 1 at log g ≈ 5 i.e. at lower gravity than for the types III
and V models. As the surface H abundance is further reduced, the
N abundance increases. Further mass loss removes all the hydrogen
and the final abundances are reached again at log g ≈ 7. The Z =0.004, M = 0.9 M� model also experiences a BA flash. However,
the remnant mass is lower and hence the mass-loss rate is lower and
the H-rich envelope is larger for this model than the other two BA
models. Mass loss does not remove the entire H-rich envelope and a
small amount of H and a significant amount of N is present at log g≈ 7. The Z = 0.01, M = 3.0 M� model has AGB departure type III,
but because its remnant mass is higher than for the Z = 0.0002, M= 1.0 M� model, it has a smaller H-rich envelope and higher mass-
loss rate after leaving the AGB. The final helium flash causes the
star to evolve back towards the red side of the Hertzsprung–Russell
diagram (HRD) and most of the hydrogen is removed before the star
evolves to the blue for a final time.
C© 2006 The Authors. Journal compilation C© 2006 RAS, MNRAS 371, 263–282
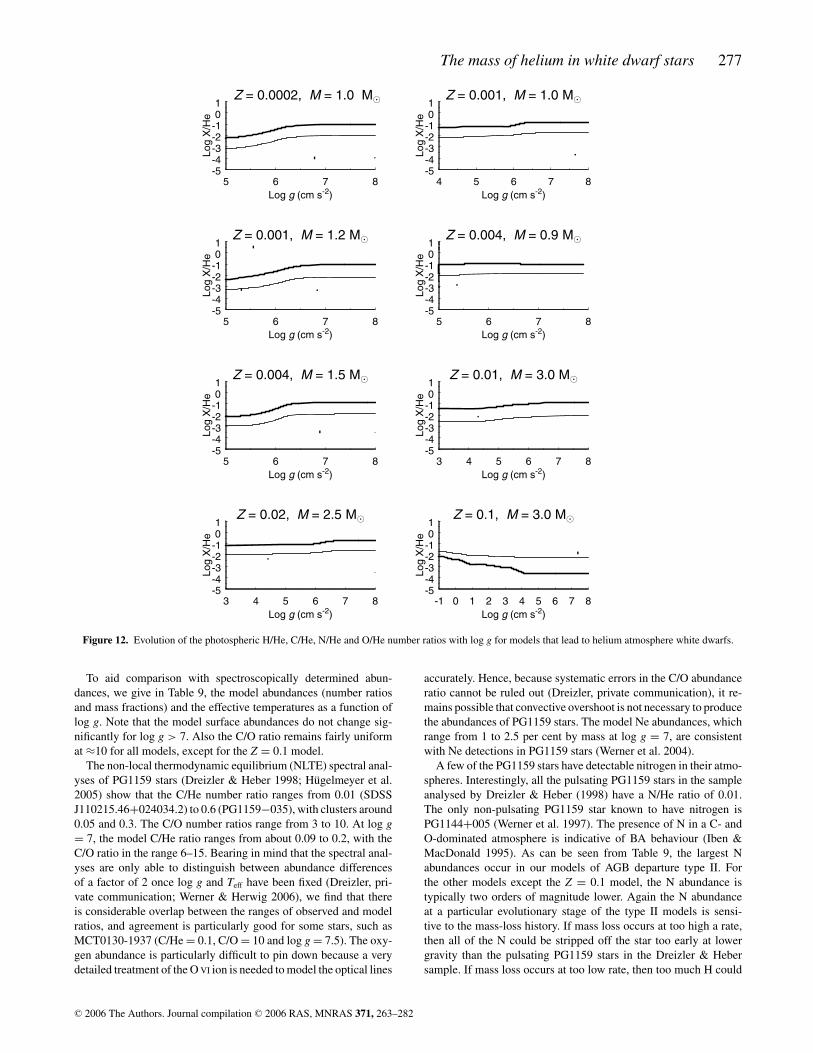
The mass of helium in white dwarf stars 277
5 6 7 8
Log g (cm s-2)
-5-4-3-2-101
Lo
g X
/He
Z = 0.0002, M = 1.0 M
4 5 6 7 8
Log g (cm s-2)
-5-4-3-2-101
Lo
g X
/He
Z = 0.001, M = 1.0 M
5 6 7 8
Log g (cm s-2)
-5-4-3-2-101
Lo
g X
/He
Z = 0.001, M = 1.2 M
5 6 7 8
Log g (cm s-2)
-5-4-3-2-101
Lo
g X
/He
Z = 0.004, M = 1.5 M
5 6 7 8
Log g (cm s-2)
-5-4-3-2-101
Lo
g X
/He
Z = 0.004, M = 0.9 M
3 4 5 6 7 8
Log g (cm s-2)
-5-4-3-2-101
Lo
g X
/He
Z = 0.01, M = 3.0 M
3 4 5 6 7 8
Log g (cm s-2)
-5-4-3-2-101
Lo
g X
/He
Z = 0.02, M = 2.5 M
-1 0 1 2 3 4 5 6 7 8
Log g (cm s-2)
-5-4-3-2-101
Lo
g X
/He
Z = 0.1, M = 3.0 M
Figure 12. Evolution of the photospheric H/He, C/He, N/He and O/He number ratios with log g for models that lead to helium atmosphere white dwarfs.
To aid comparison with spectroscopically determined abun-
dances, we give in Table 9, the model abundances (number ratios
and mass fractions) and the effective temperatures as a function of
log g. Note that the model surface abundances do not change sig-
nificantly for log g > 7. Also the C/O ratio remains fairly uniform
at ≈10 for all models, except for the Z = 0.1 model.
The non-local thermodynamic equilibrium (NLTE) spectral anal-
yses of PG1159 stars (Dreizler & Heber 1998; Hugelmeyer et al.
2005) show that the C/He number ratio ranges from 0.01 (SDSS
J110215.46+024034.2) to 0.6 (PG1159−035), with clusters around
0.05 and 0.3. The C/O number ratios range from 3 to 10. At log g= 7, the model C/He ratio ranges from about 0.09 to 0.2, with the
C/O ratio in the range 6–15. Bearing in mind that the spectral anal-
yses are only able to distinguish between abundance differences
of a factor of 2 once log g and Teff have been fixed (Dreizler, pri-
vate communication; Werner & Herwig 2006), we find that there
is considerable overlap between the ranges of observed and model
ratios, and agreement is particularly good for some stars, such as
MCT0130-1937 (C/He = 0.1, C/O = 10 and log g = 7.5). The oxy-
gen abundance is particularly difficult to pin down because a very
detailed treatment of the O VI ion is needed to model the optical lines
accurately. Hence, because systematic errors in the C/O abundance
ratio cannot be ruled out (Dreizler, private communication), it re-
mains possible that convective overshoot is not necessary to produce
the abundances of PG1159 stars. The model Ne abundances, which
range from 1 to 2.5 per cent by mass at log g = 7, are consistent
with Ne detections in PG1159 stars (Werner et al. 2004).
A few of the PG1159 stars have detectable nitrogen in their atmo-
spheres. Interestingly, all the pulsating PG1159 stars in the sample
analysed by Dreizler & Heber (1998) have a N/He ratio of 0.01.
The only non-pulsating PG1159 star known to have nitrogen is
PG1144+005 (Werner et al. 1997). The presence of N in a C- and
O-dominated atmosphere is indicative of BA behaviour (Iben &
MacDonald 1995). As can be seen from Table 9, the largest N
abundances occur in our models of AGB departure type II. For
the other models except the Z = 0.1 model, the N abundance is
typically two orders of magnitude lower. Again the N abundance
at a particular evolutionary stage of the type II models is sensi-
tive to the mass-loss history. If mass loss occurs at too high a rate,
then all of the N could be stripped off the star too early at lower
gravity than the pulsating PG1159 stars in the Dreizler & Heber
sample. If mass loss occurs at too low rate, then too much H could
C© 2006 The Authors. Journal compilation C© 2006 RAS, MNRAS 371, 263–282
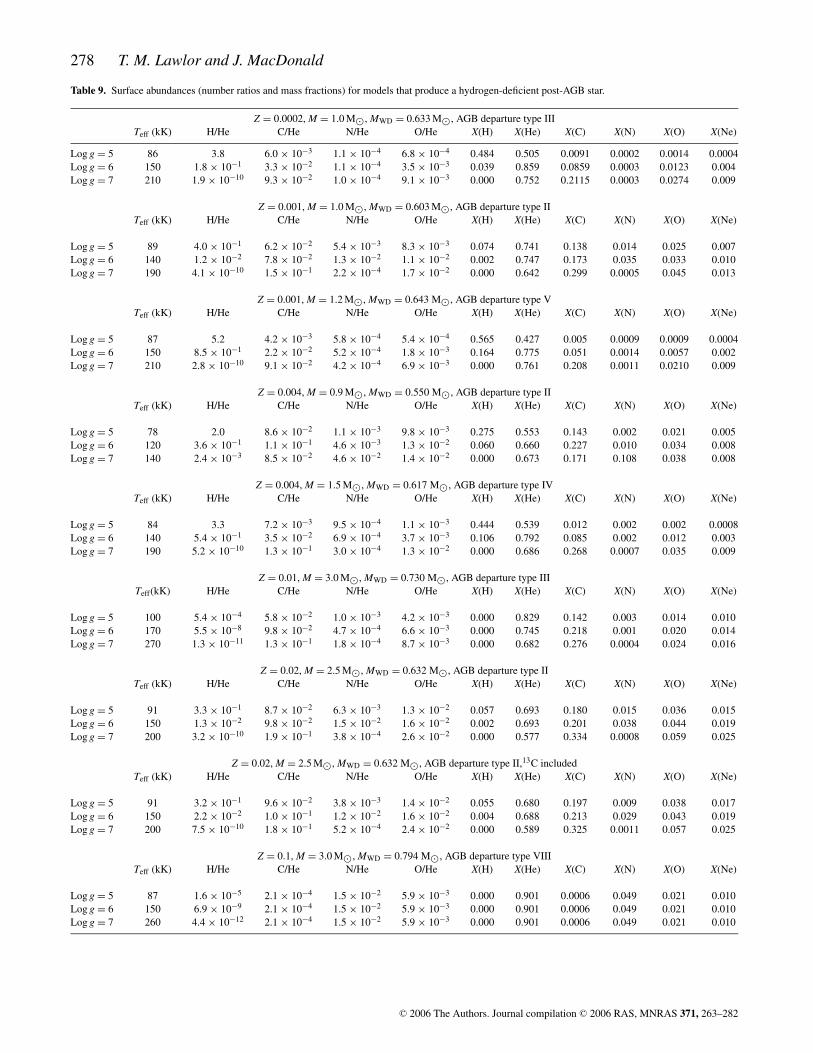
278 T. M. Lawlor and J. MacDonald
Table 9. Surface abundances (number ratios and mass fractions) for models that produce a hydrogen-deficient post-AGB star.
Z = 0.0002, M = 1.0 M�, MWD = 0.633 M�, AGB departure type III
Teff (kK) H/He C/He N/He O/He X(H) X(He) X(C) X(N) X(O) X(Ne)
Log g = 5 86 3.8 6.0 × 10⁻³ 1.1 × 10⁻⁴ 6.8 × 10⁻⁴ 0.484 0.505 0.0091 0.0002 0.0014 0.0004
Log g = 6 150 1.8 × 10⁻¹ 3.3 × 10⁻² 1.1 × 10⁻⁴ 3.5 × 10⁻³ 0.039 0.859 0.0859 0.0003 0.0123 0.004
Log g = 7 210 1.9 × 10⁻¹⁰ 9.3 × 10⁻² 1.0 × 10⁻⁴ 9.1 × 10⁻³ 0.000 0.752 0.2115 0.0003 0.0274 0.009
Z = 0.001, M = 1.0 M�, MWD = 0.603 M�, AGB departure type II
Teff (kK) H/He C/He N/He O/He X(H) X(He) X(C) X(N) X(O) X(Ne)
Log g = 5 89 4.0 × 10⁻¹ 6.2 × 10⁻² 5.4 × 10⁻³ 8.3 × 10⁻³ 0.074 0.741 0.138 0.014 0.025 0.007
Log g = 6 140 1.2 × 10⁻² 7.8 × 10⁻² 1.3 × 10⁻² 1.1 × 10⁻² 0.002 0.747 0.173 0.035 0.033 0.010
Log g = 7 190 4.1 × 10⁻¹⁰ 1.5 × 10⁻¹ 2.2 × 10⁻⁴ 1.7 × 10⁻² 0.000 0.642 0.299 0.0005 0.045 0.013
Z = 0.001, M = 1.2 M�, MWD = 0.643 M�, AGB departure type V
Teff (kK) H/He C/He N/He O/He X(H) X(He) X(C) X(N) X(O) X(Ne)
Log g = 5 87 5.2 4.2 × 10⁻³ 5.8 × 10⁻⁴ 5.4 × 10⁻⁴ 0.565 0.427 0.005 0.0009 0.0009 0.0004
Log g = 6 150 8.5 × 10⁻¹ 2.2 × 10⁻² 5.2 × 10⁻⁴ 1.8 × 10⁻³ 0.164 0.775 0.051 0.0014 0.0057 0.002
Log g = 7 210 2.8 × 10⁻¹⁰ 9.1 × 10⁻² 4.2 × 10⁻⁴ 6.9 × 10⁻³ 0.000 0.761 0.208 0.0011 0.0210 0.009
Z = 0.004, M = 0.9 M�, MWD = 0.550 M�, AGB departure type II
Teff (kK) H/He C/He N/He O/He X(H) X(He) X(C) X(N) X(O) X(Ne)
Log g = 5 78 2.0 8.6 × 10⁻² 1.1 × 10⁻³ 9.8 × 10⁻³ 0.275 0.553 0.143 0.002 0.021 0.005
Log g = 6 120 3.6 × 10⁻¹ 1.1 × 10⁻¹ 4.6 × 10⁻³ 1.3 × 10⁻² 0.060 0.660 0.227 0.010 0.034 0.008
Log g = 7 140 2.4 × 10⁻³ 8.5 × 10⁻² 4.6 × 10⁻² 1.4 × 10⁻² 0.000 0.673 0.171 0.108 0.038 0.008
Z = 0.004, M = 1.5 M�, MWD = 0.617 M�, AGB departure type IV
Teff (kK) H/He C/He N/He O/He X(H) X(He) X(C) X(N) X(O) X(Ne)
Log g = 5 84 3.3 7.2 × 10⁻³ 9.5 × 10⁻⁴ 1.1 × 10⁻³ 0.444 0.539 0.012 0.002 0.002 0.0008
Log g = 6 140 5.4 × 10⁻¹ 3.5 × 10⁻² 6.9 × 10⁻⁴ 3.7 × 10⁻³ 0.106 0.792 0.085 0.002 0.012 0.003
Log g = 7 190 5.2 × 10⁻¹⁰ 1.3 × 10⁻¹ 3.0 × 10⁻⁴ 1.3 × 10⁻² 0.000 0.686 0.268 0.0007 0.035 0.009
Z = 0.01, M = 3.0 M�, MWD = 0.730 M�, AGB departure type III
Teff(kK) H/He C/He N/He O/He X(H) X(He) X(C) X(N) X(O) X(Ne)
Log g = 5 100 5.4 × 10⁻⁴ 5.8 × 10⁻² 1.0 × 10⁻³ 4.2 × 10⁻³ 0.000 0.829 0.142 0.003 0.014 0.010
Log g = 6 170 5.5 × 10⁻⁸ 9.8 × 10⁻² 4.7 × 10⁻⁴ 6.6 × 10⁻³ 0.000 0.745 0.218 0.001 0.020 0.014
Log g = 7 270 1.3 × 10⁻¹¹ 1.3 × 10⁻¹ 1.8 × 10⁻⁴ 8.7 × 10⁻³ 0.000 0.682 0.276 0.0004 0.024 0.016
Z = 0.02, M = 2.5 M�, MWD = 0.632 M�, AGB departure type II
Teff (kK) H/He C/He N/He O/He X(H) X(He) X(C) X(N) X(O) X(Ne)
Log g = 5 91 3.3 × 10⁻¹ 8.7 × 10⁻² 6.3 × 10⁻³ 1.3 × 10⁻² 0.057 0.693 0.180 0.015 0.036 0.015
Log g = 6 150 1.3 × 10⁻² 9.8 × 10⁻² 1.5 × 10⁻² 1.6 × 10⁻² 0.002 0.693 0.201 0.038 0.044 0.019
Log g = 7 200 3.2 × 10⁻¹⁰ 1.9 × 10⁻¹ 3.8 × 10⁻⁴ 2.6 × 10⁻² 0.000 0.577 0.334 0.0008 0.059 0.025
Z = 0.02, M = 2.5 M�, MWD = 0.632 M�, AGB departure type II,13C included
Teff (kK) H/He C/He N/He O/He X(H) X(He) X(C) X(N) X(O) X(Ne)
Log g = 5 91 3.2 × 10⁻¹ 9.6 × 10⁻² 3.8 × 10⁻³ 1.4 × 10⁻² 0.055 0.680 0.197 0.009 0.038 0.017
Log g = 6 150 2.2 × 10⁻² 1.0 × 10⁻¹ 1.2 × 10⁻² 1.6 × 10⁻² 0.004 0.688 0.213 0.029 0.043 0.019
Log g = 7 200 7.5 × 10⁻¹⁰ 1.8 × 10⁻¹ 5.2 × 10⁻⁴ 2.4 × 10⁻² 0.000 0.589 0.325 0.0011 0.057 0.025
Z = 0.1, M = 3.0 M�, MWD = 0.794 M�, AGB departure type VIII
Teff (kK) H/He C/He N/He O/He X(H) X(He) X(C) X(N) X(O) X(Ne)
Log g = 5 87 1.6 × 10⁻⁵ 2.1 × 10⁻⁴ 1.5 × 10⁻² 5.9 × 10⁻³ 0.000 0.901 0.0006 0.049 0.021 0.010
Log g = 6 150 6.9 × 10⁻⁹ 2.1 × 10⁻⁴ 1.5 × 10⁻² 5.9 × 10⁻³ 0.000 0.901 0.0006 0.049 0.021 0.010
Log g = 7 260 4.4 × 10⁻¹² 2.1 × 10⁻⁴ 1.5 × 10⁻² 5.9 × 10⁻³ 0.000 0.901 0.0006 0.049 0.021 0.010
C© 2006 The Authors. Journal compilation C© 2006 RAS, MNRAS 371, 263–282
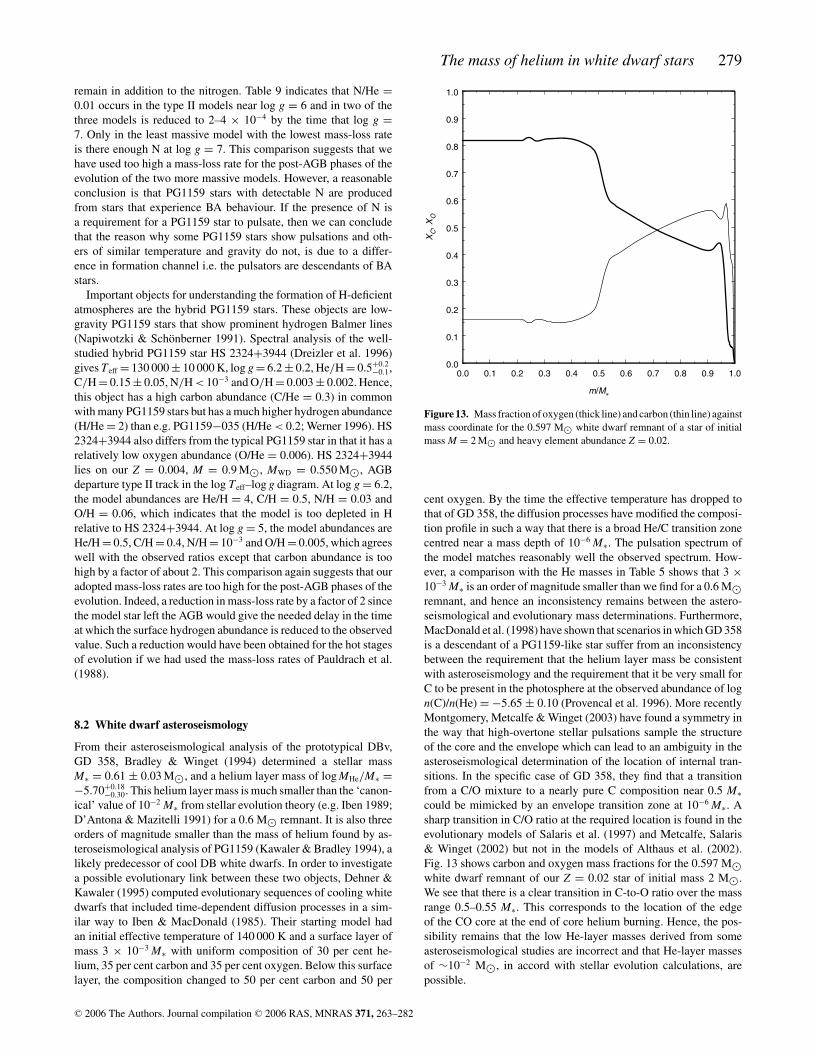
The mass of helium in white dwarf stars 279
remain in addition to the nitrogen. Table 9 indicates that N/He =0.01 occurs in the type II models near log g = 6 and in two of the
three models is reduced to 2–4 × 10⁻⁴ by the time that log g =7. Only in the least massive model with the lowest mass-loss rate
is there enough N at log g = 7. This comparison suggests that we
have used too high a mass-loss rate for the post-AGB phases of the
evolution of the two more massive models. However, a reasonable
conclusion is that PG1159 stars with detectable N are produced
from stars that experience BA behaviour. If the presence of N is
a requirement for a PG1159 star to pulsate, then we can conclude
that the reason why some PG1159 stars show pulsations and oth-
ers of similar temperature and gravity do not, is due to a differ-
ence in formation channel i.e. the pulsators are descendants of BA
stars.
Important objects for understanding the formation of H-deficient
atmospheres are the hybrid PG1159 stars. These objects are low-
gravity PG1159 stars that show prominent hydrogen Balmer lines
(Napiwotzki & Schonberner 1991). Spectral analysis of the well-
studied hybrid PG1159 star HS 2324+3944 (Dreizler et al. 1996)
gives Teff = 130 000 ± 10 000 K, log g = 6.2 ± 0.2, He/H = 0.5+0.2−0.1,
C/H = 0.15 ± 0.05, N/H < 10−3 and O/H = 0.003 ± 0.002. Hence,
this object has a high carbon abundance (C/He = 0.3) in common
with many PG1159 stars but has a much higher hydrogen abundance
(H/He = 2) than e.g. PG1159−035 (H/He < 0.2; Werner 1996). HS
2324+3944 also differs from the typical PG1159 star in that it has a
relatively low oxygen abundance (O/He = 0.006). HS 2324+3944
lies on our Z = 0.004, M = 0.9 M�, MWD = 0.550 M�, AGB
departure type II track in the log Teff–log g diagram. At log g = 6.2,
the model abundances are He/H = 4, C/H = 0.5, N/H = 0.03 and
O/H = 0.06, which indicates that the model is too depleted in H
relative to HS 2324+3944. At log g = 5, the model abundances are
He/H = 0.5, C/H = 0.4, N/H = 10−3 and O/H = 0.005, which agrees
well with the observed ratios except that carbon abundance is too
high by a factor of about 2. This comparison again suggests that our
adopted mass-loss rates are too high for the post-AGB phases of the
evolution. Indeed, a reduction in mass-loss rate by a factor of 2 since
the model star left the AGB would give the needed delay in the time
at which the surface hydrogen abundance is reduced to the observed
value. Such a reduction would have been obtained for the hot stages
of evolution if we had used the mass-loss rates of Pauldrach et al.
(1988).
8.2 White dwarf asteroseismology
From their asteroseismological analysis of the prototypical DBv,
GD 358, Bradley & Winget (1994) determined a stellar mass
M∗ = 0.61 ± 0.03 M�, and a helium layer mass of log MHe/M∗ =−5.70+0.18
−0.30. This helium layer mass is much smaller than the ‘canon-
ical’ value of 10−2 M∗ from stellar evolution theory (e.g. Iben 1989;
D’Antona & Mazitelli 1991) for a 0.6 M� remnant. It is also three
orders of magnitude smaller than the mass of helium found by as-
teroseismological analysis of PG1159 (Kawaler & Bradley 1994), a
likely predecessor of cool DB white dwarfs. In order to investigate
a possible evolutionary link between these two objects, Dehner &
Kawaler (1995) computed evolutionary sequences of cooling white
dwarfs that included time-dependent diffusion processes in a sim-
ilar way to Iben & MacDonald (1985). Their starting model had
an initial effective temperature of 140 000 K and a surface layer of
mass 3 × 10⁻³ M∗ with uniform composition of 30 per cent he-
lium, 35 per cent carbon and 35 per cent oxygen. Below this surface
layer, the composition changed to 50 per cent carbon and 50 per
0.0 0.1 0.2 0.3 0.4 0.5 0.6 0.7 0.8 0.9 1.0
m/M
0.0
0.1
0.2
0.3
0.4
0.5
0.6
0.7
0.8
0.9
1.0
XC,X
O
Figure 13. Mass fraction of oxygen (thick line) and carbon (thin line) against
mass coordinate for the 0.597 M� white dwarf remnant of a star of initial
mass M = 2 M� and heavy element abundance Z = 0.02.
cent oxygen. By the time the effective temperature has dropped to
that of GD 358, the diffusion processes have modified the composi-
tion profile in such a way that there is a broad He/C transition zone
centred near a mass depth of 10−6 M∗. The pulsation spectrum of
the model matches reasonably well the observed spectrum. How-
ever, a comparison with the He masses in Table 5 shows that 3 ×10⁻³ M∗ is an order of magnitude smaller than we find for a 0.6 M�remnant, and hence an inconsistency remains between the astero-
seismological and evolutionary mass determinations. Furthermore,
MacDonald et al. (1998) have shown that scenarios in which GD 358
is a descendant of a PG1159-like star suffer from an inconsistency
between the requirement that the helium layer mass be consistent
with asteroseismology and the requirement that it be very small for
C to be present in the photosphere at the observed abundance of log
n(C)/n(He) = −5.65 ± 0.10 (Provencal et al. 1996). More recently
Montgomery, Metcalfe & Winget (2003) have found a symmetry in
the way that high-overtone stellar pulsations sample the structure
of the core and the envelope which can lead to an ambiguity in the
asteroseismological determination of the location of internal tran-
sitions. In the specific case of GD 358, they find that a transition
from a C/O mixture to a nearly pure C composition near 0.5 M∗could be mimicked by an envelope transition zone at 10−6 M∗. A
sharp transition in C/O ratio at the required location is found in the
evolutionary models of Salaris et al. (1997) and Metcalfe, Salaris
& Winget (2002) but not in the models of Althaus et al. (2002).
Fig. 13 shows carbon and oxygen mass fractions for the 0.597 M�white dwarf remnant of our Z = 0.02 star of initial mass 2 M�.
We see that there is a clear transition in C-to-O ratio over the mass
range 0.5–0.55 M∗. This corresponds to the location of the edge
of the CO core at the end of core helium burning. Hence, the pos-
sibility remains that the low He-layer masses derived from some
asteroseismological studies are incorrect and that He-layer masses
of ∼10−2 M�, in accord with stellar evolution calculations, are
possible.
C© 2006 The Authors. Journal compilation C© 2006 RAS, MNRAS 371, 263–282
280 T. M. Lawlor and J. MacDonald
8.3 DQ white dwarfs
The widely accepted mechanism for formation of DQ white dwarfs,
initially proposed by Koester et al. (1982), is that as the star cools
the envelope convection zone grows inwards and dredges up carbon
diffusing outwards from the interior. This idea was explored further
by Pelletier et al. (1986) and MacDonald et al. (1998) with the lat-
ter paper also including oxygen in the simulations. This scenario
has been modified by Fontaine & Brassard (2005), who find that
the carbon pollution is not produced by carbon diffusing outward
from the core but by the inward growth of superficial helium con-
vection zone catching up some of the settling carbon and bringing
it to the surface. These studies show that the final value of �Mbuff
controls the amount of C and O that can be convectively dredged to
the surface, with smaller helium masses leading to larger C and O
abundances in the photosphere. In either scenarios, for white dwarfs
of known mass, the observed surface abundances can, in principle,
be used to estimate the helium mass. Recently, Dufour, Bergeron
& Fontaine (2005) have re-analysed spectrometric and photomet-
ric observations of 16 cool DQ white dwarfs from the Bergeron,
Ruiz & Leggett (1997) and Bergeron, Leggett & Ruiz (2001) sam-
ple to obtain effective temperatures, masses and carbon abundances.
They find that the DQ stars have the mean mass of 0.62 M� and
that n(C)/n(He) is strongly anticorrelated with effective tempera-
ture. Using the Fontaine & Brassard (2005) models for their single
white dwarf mass of 0.6 M�, Dufour et al. (2005) find that the
n(C)/n(He) ratios for the majority of the DQs are consistent with a
helium layer mass between 10−3 and 10−2 M∗.
Because helium envelope white dwarfs are the descendants of
stars that leave the AGB-burning helium or experience a VLTP,
their helium masses are expected to be near the lower end of the
possible range. For MWD = 0.6 M�, we estimate that the relevant
range for helium mass is 10−2–2 × 10⁻² M∗, which is marginally
consistent with the range found by Dufour et al. (2005). However,
the amount of C enrichment is also strongly dependent on white
dwarf mass (Pelletier et al. 1986; MacDonald et al. 1998). Further
calculations of DQ evolution at different white dwarf masses are
still needed before a meaningful comparison between helium masses
from stellar evolution calculations and those from DQ C abundances
can be carried out.
8.4 Self-induced novae
Iben & MacDonald (1986) found that the condition for a white dwarf
to experience a final hydrogen shell flash due to inward diffusion of
hydrogen and outward diffusion of carbon into regions hot enough
for nuclear reactions to occur is
Mbuf < Mcritbuf ≈ 0.1�MH. (12)
By comparing the values for M↔
buf,min and �MH in Table 7, we see
that M↔
buf,min � 0.4�MH and hence we conclude that conditions for
the self-induced nova do not occur for progenitor masses less than
3 M�.
9 C O N C L U S I O N S
We have shown, for evolution of single stars that do not experience
a VLTP, that the mass of helium remaining on a white dwarf star lies
between limits that depend primarily on the mass of the white dwarf
and only weakly on the heavy element abundance in the progenitor.
Also we find that stars that experience a VLTP have final helium
masses that are about 25 per cent below the lower limit.
Following Iben (1987), we have derived a criterion, based on the
phase of the thermal pulse cycle at which the star leaves the AGB, for
determining if a star will experience a post-AGB helium shell flash
and subcriteria for discriminating between the occurrence of late and
VLTPs. We find that a post-AGB flash does not necessarily result in
formation of a non-DA white dwarf. Furthermore, we find that the
relative amount of time spent burning helium or hydrogen depends
on how the mass-loss rate varies with stellar surface parameters.
These two considerations complicate the relationship between the
probability that a star experiences a post-AGB flash and the relative
formation rates of DA and non-DA white dwarfs. Although small
in number, our calculations do lead to a non-DA/DA ratio that is
consistent with the observed ratio, which suggests that our adopted
mass-loss rates are reasonable. This conclusion is supported by our
initial mass–final mass relation being consistent with observation.
We find that our predicted abundances for PG1159 stars agree
within the error bars with the observed abundances, without the
need of convective overshoot. We also find that nitrogen is produced
during VLTPs but not in the other evolutionary paths to hydrogen-
deficient objects. Hence, we propose this as the reason why nitrogen
is observed in some PG1159 stars but not all. Our VLTP models also
produce surface abundances close to those of the low-gravity hybrid
PG1159 stars.
AC K N OW L E D G M E N T S
We are grateful to Stefan Dreizler, Judi Provencal and Richard
Townsend for helpful correspondence and discussions. We also
thank the referee for constructive comments. This work has been
supported in part by the Annie Jump Cannon fund at the University
of Delaware and by funds from Penn State University at Wilkes-
Barre.
R E F E R E N C E S
Abbott D., 1982, ApJ, 259, 282
Alexander D. R., Ferguson J. W., 1994, ApJ, 437, 879
Althaus L. G., Serenelli A. M., Corsico A. H., Benvenuto O. G., 2002,
MNRAS, 330, 685
Angulo C. et al., 1999, Nucl. Phys. A, 656, 3
Arnett D., 1996, Supernovae and Nucleosynthesis: An Investigation of the
History of Matter, from the Big Bang to the Present. Princeton Univ.
Press, Princeton, NJ
Beaudet G., Petrosian V., Salpeter E. E., 1967, ApJ, 150, 979
Bergeron P., Ruiz M. T., Leggett S. K., 1997, ApJS, 108, 339
Bergeron P., Leggett S. K., Ruiz M. T., 2001, ApJS, 133, 413
Blocker T., 2001, Ap&SS, 275, 1
Blocker T., Schonberner D., 1997, A&A, 324, 991
Boothroyd A. I., Sackmann I.-J., 1988, ApJ, 328, 671
Bradley P. A., Winget D. E., 1994, ApJ, 430, 850
Brocato E., Castellani V., Ripepi V., 1995, AJ, 109, 1670
Buonanno R., Corsi C. E., Fusi Pecci F., 1981, MNRAS, 196, 435
Caputo F., Chieffi A., Tornambe A., Castellani V., Pulone L., 1989, ApJ,
340, 241
Castellani V., Giannone P., Renzini A., 1971, Ap&SS, 10, 340
Castellani V., Chieffi A., Pulone L., Tornambe A., 1985, ApJ, 296, 204
Caughlan G. R., Fowler W. A., 1988, At. Data Nucl. Data Tables, 40, 283
D’Antona F., Mazitelli I., 1991, in Michaud G., Tutukov A. V., eds, Proc.
IAU Symp. 145, Evolution of Stars: The Photospheric Abundance Con-
nection. Kluwer, Dordrecht, p. 399
Dehner B. T., Kawaler S. D., 1995, ApJ, 445, L141
Dreizler S., Heber U., 1998, A&A, 334, 618
Dreizler S., Werner K., 1996, A&A, 314, 217
Dreizler S., Werner K., Heber U., Engels D., 1996, A&A, 309, 820
C© 2006 The Authors. Journal compilation C© 2006 RAS, MNRAS 371, 263–282
The mass of helium in white dwarf stars 281
Dufour P., Bergeron P., Fontaine G., 2005, ApJ, 627, 404
Edvardsson B., Andersen J., Gustafsson B., Lambert D. L., Nissen P. E.,
Tomkin J., 1993, A&A, 275, 101
Eggleton P. P., 1971, MNRAS, 151, 351
Eggleton P. P., 1972, MNRAS, 156, 361
Eggleton P. P., Faulkner J., Flannery B. P., 1973, A&A, 23, 325
Feast M. W., Glass I. S., Whitelock P. A., Catchpole R. M., 1989, MNRAS,
241, 375
Fontaine G., Brassard P., 2002, ApJ, 581, L33
Fontaine G., Brassard P., 2005, in Koester D., Moehler S., eds, ASP Conf.
Ser. Vol. 334, Proc. 14th European Workshop on White Dwarfs. Astron.
Soc. Pac., San Francisco, p. 49
Fontaine G., Graboske H. C. Jr, van Horn H. M., 1977, ApJS, 35, 293
Fowler W. A., Caughlan G. R., Zimmerman B. A., 1975, ARA&A, 13, 69
Frost C. A., Lattanzio J. C., 1996, ApJ, 473, 383
Fujimoto M. Y., 1977, PASJ, 29, 331
Girardi L., Bressan A., Bertelli G., Chiosi C., 2000, A&AS, 141, 371
Greenstein J. L., 1986, ApJ, 304, 334
Groenewegen M. A. T., Whitelock P. A., 1996, MNRAS, 281, 1347
Haft M., Raffelt G., Weiss A., 1994, ApJ, 425, 222
Harris M. J., Fowler W. A., Caughlan G. R., Zimmerman B. A., 1983,
ARA&A, 21, 165
Herald J. E., Bianchi L., 2004, ApJ, 611, 294
Herwig F., 2001, ApJ, 554, L71
Herwig F., Blocker T., Schonberner D., El Eid M., 1997, A&A, 324,
L81
Herwig F., Blocker T., Langer N., Driebe T., 1999, A&A, 349, L5
Heske A., Forveille T., Omont A., van der Veen W. E. C. J., Habing H. J.,
1990, A&A, 239, 173
Hillier D. J., 2003, in van der Hucht K. A., Herrero A., Esteban C., eds,
Proc. IAU Symp. 212, A Massive Star Odyssey: From Main Sequence
to Supernova. Astron. Soc. Pac., San Francisco, p. 70
Hugelmeyer S. D., Dreizler S., Werner K., Nitta A., Kleinman S. J., Krzesin-
ski J., 2005, in Koester D., Moehler S., eds, ASP Conf. Ser. Vol. 334,
Proc. 14th European Workshop on White Dwarfs. Astron. Soc. Pac., San
Francisco, p. 233
Iben I., 1975, ApJ, 196, 525
Iben I., 1984, ApJ, 277, 333
Iben I., 1987, Late Stages of Stellar Evolution, Reidel, Dordrecht, p. 175
Iben I., 1989, in Johnson H. R., Zuckerman B., eds, Proc. IAU Coll. 106, Evo-
lution of Peculiar Red Giant Stars. Cambridge Univ. Press, Cambridge,
p. 205
Iben I., MacDonald J., 1985, ApJ, 296, 540
Iben I., MacDonald J., 1986, ApJ, 301, 164
Iben I., MacDonald J., 1995, in Koester D., Werner K., eds, Lecture Notes
in Physics, Vol. 443, Proc. 9th European Workshop on White Dwarfs.
Springer-Verlag, Berlin, p. 48
Iben I., Kaler J. B., Truran J. W., Renzini A., 1983, ApJ, 264, 605
Iben I., Fujimoto M. Y., MacDonald J., 1992, ApJ, 388, 521
Iben I., Tutukov A. V., Yungelson L. R., 1996, ApJ, 456, 750
Iglesias C. A., Rogers F. J., 1996, ApJ, 464, 943
Itoh N., Kohyama Y., 1983, ApJ, 275, 858
Itoh N., Totsuji H., Ichimaru S., Dewitt H. E., 1979, ApJ, 234, 1079
Jimenez R., MacDonald J., 1996, MNRAS, 283, 721
Jimenez R., Thejll P., Jørgensen U. G., MacDonald J., Pagel B., 1996,
MNRAS, 282, 926
Jimenez R., Flynn C., MacDonald J., Gibson B. K., 2003, Sci, 299, 1552
Jimenez R., MacDonald J., Dunlop J. S., Padoan P., Peacock J. A., 2004,
MNRAS, 349, 240
Karakas A. I., Lattanzio J. C., Pols O. R., 2002, Publ. Astron. Soc. Aust. 19,
515
Kawaler S. D., Bradley P. A., 1994, ApJ, 427, 415
Knapp G. R., Young K., Lee E., Jorissen A., 1998, ApJS, 117, 209
Koesterke L., Werner K., 1998, ApJ, 500, L55
Koester D., Weidemann V., Zeidler E.-M., 1982, A&A, 116, 147
Kogut A. et al., 2003, ApJS, 148, 161
Kudritzki R.-P., Puls J., 2000, ARA&A, 38, 613
Kudritzki R.-P., Pauldrach A., Puls J., 1987, A&A, 173, 293
Lattanzio J., Frost C., Cannon R., Wood P. R., 1996, Mem. Soc. Astron. Ital.,
67, 729
Lawlor T. M., MacDonald J., 2003, ApJ, 583, 913 (LM03)
Lejeune T., Schaerer D., 2001, A&A, 366, 538
Lepine J. R. D., Ortiz R., Epchtein N., 1995, A&A, 299, 453
Leuenhagen U., Hamann W.-R., Jeffery C. S., 1996, A&A, 312, 167
MacDonald J., Hernanz M., Jose J., 1998, MNRAS, 296, 523
Mansoori G. A., Carnahan N. F., Starling K. F., Leland T. W., 1971, J. Chem.
Phys., 54, 1523
Marigo P., Girardi L., Bressan A., 1999, A&A, 344, 123
Metcalfe T. S., Salaris M., Winget D. E., 2002, ApJ, 573, 803
Metcalfe T. S., Montgomery M. H., Kawaler S. D., 2003, MNRAS, 344, 88
Michaud G., 1987, in Phillip A. G. D., Hayes D. S., Liebert J., eds, Proc.
IAU Coll. 95, The Second Conference on Faint Blue Stars. Davis Press,
Schenectady, NY, p. 249
Mihalas D., 1970, Stellar Atmospheres. Freeman & Co., San Francisco
Montgomery M. H., Metcalfe T. S., Winget D. E., 2003, MNRAS, 344,
657
Mowlavi N., 1999, A&A, 344, 617
Mowlavi N., Schaerer D., Meynet G., Bernasconi P. A., Charbonnel C.,
Maeder A., 1998, A&AS, 128, 471
Napiwotzki R., 1999, A&A, 350, 101
Napiwotzki R., Schonberner D., 1991, A&A, 249, L16
Nomoto K., Thielemann F.-K., Miyaji S., 1985, A&A, 149, 239
Ostlie D. A., Cox A. N., 1986, ApJ, 311, 864
Paczynski B., 1974, ApJ, 192, 483
Pauldrach A., Puls J., Kudritzki R. P., Mendez R. H., Heap S. R., 1988,
A&A, 207, 123
Peimbert A., Peimbert M., Luridiana V., 2002, ApJ, 565, 668
Pelletier C., Fontaine G., Wesemael F., Michaud G., Wegner G., 1986, ApJ,
307, 242
Pols O. R., Tout C. A., 2001, Mem. Soc. Astron. Ital., 72, 299
Provencal J. L., Shipman H. L., Thejll P., Vennes S., Bradley P. A., 1996,
ApJ, 466, 1011
Ramadurai S., 1976, MNRAS, 176, 9
Reddy B. E., Tomkin J., Lambert D. L., Allende Prieto C., 2003, MNRAS,
340, 304
Reimers D., 1975, Mem. R. Soc. Sci. Liege, 8, 369
Renzini A., 1979, in Westerlund B. E., ed., Proc. Fourth European Regional
Meeting in Astronomy, ASSL Vol. 75, Stars and Star Systems. Reidel,
Dordrecht, p. 155
Renzini A., 1981, in Chiosi C., Stalio R., eds, Proc. IAU Coll. 59, ASSL
Vol. 89, Effects of Mass Loss on Stellar Evolution. Reidel, Dordrecht,
p. 319
Renzini A., 1983, in Flower D. R., ed., Proc. IAU Symp. 103, Planetary
Nebulae. Reidel, Dordrecht, p. 267
Ritossa C., Garcıa-Berro E., Iben I., 1996, ApJ, 460, 489
Salaris M., Dominguez I., Garcıa-Berro E., Hernanz M., Isern J.,
Mochkovitch R., 1997, ApJ, 486, 413
Salpeter E. E., van Horn H. M., 1969, ApJ, 155, 183
Schaller G., Schaerer D., Meynet G., Maeder A., 1992, A&AS, 96, 269
Schild H. et al., 2004, A&A, 422, 177
Schonberner D., 1979, A&A, 79, 108
Sion E. M., 1984, ApJ, 282, 612
Spergel D. N. et al., 2003, ApJS, 148, 175
Stancliffe R. J., Izzard R. G., Tout C. A., 2005, MNRAS, 356, L1
Stringfellow G. S., DeWitt H. E., Slattery W. L., 1990, Phys. Rev. A, 41,
1105
Sugimoto D., 1970, ApJ, 159, 619
Unglaub K., Bues I., 1998, A&A, 338, 75
Vassiliadis E., Wood P. R., 1993, ApJ, 413, 641
Vassiliadis E., Wood P. R., 1994, ApJS, 92, 125
Vink J. S., de Koter A., Lamers H. J. G. L. M., 2001, A&A, 369, 574
Weidemann V., 2000, A&A, 363, 647
Werner K., 1996, A&A, 309, 861
Werner K., Herwig F., 2006, PASP, 118, 183
Werner K., Dreizler S., Heber U., Kappelmann N., Kruk J., Rauch T., Wolff
B., 1997, Rev. Mod. Astron., 10, 219
C© 2006 The Authors. Journal compilation C© 2006 RAS, MNRAS 371, 263–282
282 T. M. Lawlor and J. MacDonald
Werner K., Rauch T., Reiff E., Kruk J. W., Napiwotzki R., 2004, A&A, 427,
685
Whitelock P., Menzies J., Feast M., Marang F., Carter B., Roberts G., Catch-
pole R., Chapman J., 1994, MNRAS, 267, 711
Whitelock P. A., Feast M. W., van Loon J. Th., Zijlstra A. A., 2003, MNRAS,
342, 86
Willson L. A., 2000, ARA&A, 38, 573
Winkler K.-H. A., Norman M. L., Newman M. J., 1984, Physica D, 12,
408
Wood P. R., Faulkner D. J., 1986, ApJ, 307, 659
This paper has been typeset from a TEX/LATEX file prepared by the author.
C© 2006 The Authors. Journal compilation C© 2006 RAS, MNRAS 371, 263–282