the market valuation of cash dividends the case of the cra bonus issue.pdf
TRANSCRIPT
7/28/2019 The Market Valuation of Cash Dividends The Case of the CRA Bonus Issue.pdf
http://slidepdf.com/reader/full/the-market-valuation-of-cash-dividends-the-case-of-the-cra-bonus-issuepdf 1/36
The Market Valuation of Cash Dividends: The Case of
the CRA Bonus Issue
Hung Chu
PhD Graduate, School of Finance and Economics, University of Technology, Sydney
Graham Partington*
Finance Discipline, School of Business, University of Sydney
ABSTRACT: In 1996 Australia’s CRA and UK’s RTZ merged to form the world’s
largest mining company, but the companies remained separately listed on their domestic
exchanges. In order to equalise the price of the two companies’ shares, prior to the dual
listing, CRA made a bonus issue. Shares in the bonus issue were not entitled to the next
CRA dividend, which carried imputation tax credits. The contemporaneous price
differences between the old shares and the bonus shares are used to measure the market
value of dividends and associated tax credits. Consistent with imputation tax credits
adding value to the dividend, one dollar face value of dividends was observed to have a
market value significantly greater that its face value. The market value of the dividend
varied depending on the proximity of observations to the ex-dividend date. Close to the
ex-dividend date the premium of market value over face value was smaller. The results
are consistent with dividend values set by short-term traders about the ex-dividend date
and by long-term investors at other times.
JEL Classification: G35
We acknowledge the assistance of the Australian Stock Exchange (ASX) and the Securities IndustryResearch Centre of Asia-Pacific (SIRCA) in providing data. We also acknowledge the support of theCapital Markets Cooperative Research Centre (CMCRC) and the University of Technology Sydney (UTS).We thank the ARC and PricewaterhouseCoopers for funding our research. We are grateful to Richard Stewart and Wayne Lonnergan for stimulating discussions and Kim Trang for excellent research assistance.We are also indebted to William Huang for excellent programming assistance.
*Corresponding Author: Associate Professor Graham Partington, Finance Discipline, School of Business,University of Sydney, NSW 2006, Australia. Email: [email protected]
1
7/28/2019 The Market Valuation of Cash Dividends The Case of the CRA Bonus Issue.pdf
http://slidepdf.com/reader/full/the-market-valuation-of-cash-dividends-the-case-of-the-cra-bonus-issuepdf 2/36
The Market Valuation of Cash Dividend:
The Case of the CRA Bonus Issue
1. Introduction
For over forty years researchers have sought to establish the relationship between the face
value of dividends and the dividend’s market value, and this remains a controversial
issue. A key barrier to resolving the controversy is the lack of experiments which provide
a clean measure of the market value of a dividend.
One experimental design for obtaining a measurement of dividend value is to observe
contemporaneous trading in two classes of securities that are identical in all aspects
except for their dividend entitlement. The contemporaneous differences in prices of the
two securities should provide a clean measure of the market value of the dividends. One
study of this type was undertaken by Chu and Partington (2001) who studied the price
difference between old shares and newly issued shares that were not entitled to the next
dividend. They found that, under Australia’s imputation tax system, a dollar face value of
fully franked dividends had a market value of about $1.50, which suggests that the tax
credits (franking credits) provided by dividend imputation have substantial value.
A contrasting result is found in Cannavan et.al (2004) who study the price difference
between derivatives and the underlying stock. They find that franking credits have a
relatively low value and that following the introduction of the 45 day rule, designed to
restrict trading in franking credits, that the franking credits have no value.
2
7/28/2019 The Market Valuation of Cash Dividends The Case of the CRA Bonus Issue.pdf
http://slidepdf.com/reader/full/the-market-valuation-of-cash-dividends-the-case-of-the-cra-bonus-issuepdf 3/36
In this paper, therefore, we set out to provide further evidence on the value of dividends
and franking credits by examining a different type of seasoned equity issues. That is
bonus share issues, where the newly issued bonus shares are identical to the existing
shares in all aspects except for dividend entitlement. Such bonus issues are labelled non-
parri-passu (NPP) bonus issues. The study of NPP bonus issues is a natural extension of
Chu and Partington’s (2001) study of NPP rights issues, and therefore provides an
opportunity to examine the generalisability of their results.
Unfortunately, only one NPP bonus issue suitable to analysis was found, the CRA bonus
issue. However, the CRA case is interesting for several reasons. First the bonus issue has
an interesting source, springing from the creation of the then largest mining company in
the world, through a dual listing merger. Second, it has been suggested that overseas
investors are the price setting investors in the Australian market and that they will place
little or no value on the imputation credits since they cannot use them (see for example
Cannavan et.al. (2004)). It is also suggested that overseas investors tend to have larger
holdings in the extractive industries and that consequently franking credits will have little
or no value in such industries (see for example Wood (1991)). CRA was one of
Australia’s largest mining companies, thus if the preceding conditions hold, the CRA
NPP bonus issue should provide little or no evidence that franking credits have value.1
Third, as explained later, CRA’s NPP bonus share issue has a number of attractive
features in relation to measuring the market value of dividends.
The contemporaneous price differences between the bonus shares and the existing shares
of CRA, which were observed repeatedly over a ten week period, provide a low noise
3
7/28/2019 The Market Valuation of Cash Dividends The Case of the CRA Bonus Issue.pdf
http://slidepdf.com/reader/full/the-market-valuation-of-cash-dividends-the-case-of-the-cra-bonus-issuepdf 4/36
measure of the market value of the dividend. The results show that the market value of
the dividend is significantly greater than its face value. The observed market value of the
dividend is consistent with franking credits having a substantial value, but a lesser value
than suggested by Chu and Partington (2001). The market value of the dividend is also
found to depend upon when the value is measured. Close to the ex-dividend date the
value is lower, and is consistent with a value being set in short-term trading of dividends.
The remainder of the paper is organised as follows. In Section 2 we review some of the
literature on the traditional ex-dividend approach to estimating the market value of
dividends and explain the Australian imputation tax system. Some of the problems with
the ex-dividend method are highlighted, and some recent alternatives to traditional ex-
dividend studies are considered. Section 3 describes the procedure used to search for NPP
bonus issues and discusses the features of bonus issue trading. Details of the CRA issue
are also discussed. In Section 4 the nature of the data set and the research method are
explained. Section 5 contains the results, first the descriptive statistics, followed by
hypothesis tests. Section 6 interprets the results and provides the conclusions.
2. Previous studies
2.1 The traditional ex-dividend approach to dividend valuation
Following Elton and Gruber (1970) an extensive literature has developed that attempts to
estimate the market value of dividends by studying ex-dividend price behaviour. Much of
this literature is based upon an analysis of the ex-dividend drop off ratio (the ex-dividend
price drop divided by the dividend). Elton and Gruber showed that the equilibrium value
1 CRA had at least one large overseas shareholder as prior to the merger RTZ had a forty-nine percentshareholding.
4
7/28/2019 The Market Valuation of Cash Dividends The Case of the CRA Bonus Issue.pdf
http://slidepdf.com/reader/full/the-market-valuation-of-cash-dividends-the-case-of-the-cra-bonus-issuepdf 5/36
for the drop-off ratio under a classical tax system is given by the ratio of the after tax
value of dividends to the after tax value of capital gains, (1-t i)/(1-t g), where: t i is the
income tax rate on dividends and t g is the tax rate on capital gains. Empirically, they
observed the drop-off ratio to be less than one, which was consistent with their hypothesis
that dividends were tax disadvantaged relative to capital gains. This view was challenged
by Kalay (1982) who suggested that a drop-off ratio that was not equal to one presented
an arbitrage opportunity to investors who were equally taxed on dividends and capital
gains. Such arbitrage would tend to drive the drop-off ratio towards one. However,
because of the transactions costs of such arbitrage, the equilibrium drop-off ratio might
diverge from one. In this case, a drop-off ratio less than one would be interpreted as a
transaction cost effect rather than a tax effect. Kalay’s estimate of the drop-off ratio was
less than one but the difference from one was not significant.
There have been many subsequent ex-dividend studies, most of which have taken place in
the context of a classical tax system. Such studies either find that dividends have a market
value less than their face value as in Michaely (1991), or find a market value equal to the
dividend’s face value as in Boyd and Jaganathan (1994). There has been increasing
recognition that the ex-day price drop arises from a complex interaction of the type of
trader (eg. long-term or short-term), taxes, transaction costs, risks, and bid ask spreads,
see for example Karpoff and Walkling (1988, 1990), Grammatikos (1989), Fedenia and
Grammatikos (1993), Boyd and Jaganathan(1994), Koski(1996), and Michaely, et.al.
(1997).
There has also been a growing volume of work on aspects of market microstructure that
may lead to a bias in ex-day price movements as an estimate of dividend value. For
5
7/28/2019 The Market Valuation of Cash Dividends The Case of the CRA Bonus Issue.pdf
http://slidepdf.com/reader/full/the-market-valuation-of-cash-dividends-the-case-of-the-cra-bonus-issuepdf 6/36
example, bid-ask bounce, Frank and Jagannathan (1998), price discreteness arising from
minimum tick sizes, Bali and Hite (1998), and settlement effects Lasfer (1995), and
Kadapakkam (2000). However, Graham et.al. (2003) suggest that there is little support
for tick size and bid-ask bounce explanations of ex-dividend price movements.
The issues discussed above make the interpretation of ex-dividend price movements
difficult, but there is also another problem inherent in the traditional ex-dividend
approach to dividend valuation. Ex-dividend drop-off ratios are extremely noisy. For
example, in the US market Bhardwaj and Brooks (1999) reported that the ex-dividend
drop-off ratio for stocks with regular taxable dividends in 1986 range between –84.46 and
+65.38. In the Australian market, a similar range of ex-dividend drop-off ratios were also
documented in Clarke (1992).
2.2. Ex-dividend valuation under the Australian imputation system
Australia operates an imputation tax system, where dividends paid from profits subject to
Australian corporate tax have tax credits attached, which are called franking credits.
Australian residents are taxed at their marginal income tax rate on the pre-tax profit from
which the dividend is distributed. However, they receive credit for the corporate tax paid
via the franking credit. The net effect is that corporate taxes wash out and resident
shareholders are taxed on distributed profits at their marginal personal tax rates.
Overseas investors and, at the time of the study, tax exempt investors, were not entitled to
the tax credits.
6
7/28/2019 The Market Valuation of Cash Dividends The Case of the CRA Bonus Issue.pdf
http://slidepdf.com/reader/full/the-market-valuation-of-cash-dividends-the-case-of-the-cra-bonus-issuepdf 7/36
7
The mechanics of the system for taxable Australian residents are as follows. Assuming
the dividends are fully franked,TP
2PT the shareholder’s taxable income is computed by
grossing up the dividend to its pre-corporate tax equivalent. This is done by multiplying
the dividend by 1/(1-t BcB), where t BcB is the corporate tax rate. Tax is then levied on the
grossed up value at the shareholder’s marginal income tax rate, t BiB but a tax credit is
allowed for the corporate tax paid. The after personal-tax dividend receipts based on a
dividend D are therefore:( ) ⎟⎟
⎠
⎞⎜⎜⎝
⎛
−
−=−
−−
c
ici
c t
t Dt t
t
D D
1
1)(
1.
Walker and Partington (1999) show that under the Australian imputation tax system the
equilibrium drop-off ratio for short-term traders can be written as:
D
P
a
a
at t
t
D
PP CD
gc
i XDCD
⎟ ⎠
⎞⎜⎝
⎛
−−⎟⎟
⎠
⎞⎜⎜⎝
⎛
−−−
−=
−
1
2
)1)(1)(1(
1
Where: PBCD Bis the price of the cum-dividend share
PB
XD B
is the ex-dividend price
D is the dividend to be paid (assumed fully franked)
t BcB is the corporate tax rate
t BiB is the investor’s tax rate on dividends
t BgB is the capital gains tax rate
a is the one way transactions cost as a percentage of the price.
For long-term investors the decision is whether to transact cum-dividend, or ex-dividend
and since they incur transactions costs at either date, the transactions costs are largely
TP
2PT Dividends may be fully or partially franked depending upon whether the income from which they have
been paid has been fully or partially taxed in Australia at the corporate tax rate. If the dividend has been partially franked, gross up factors and imputation tax credits are reduced accordingly.
7/28/2019 The Market Valuation of Cash Dividends The Case of the CRA Bonus Issue.pdf
http://slidepdf.com/reader/full/the-market-valuation-of-cash-dividends-the-case-of-the-cra-bonus-issuepdf 8/36
8
irrelevant to their decision. As a consequence, the equilibrium drop-off equation for long-
term investors can be closely approximated by:
⎟⎟ ⎠
⎞⎜⎜⎝
⎛
−−
−=
−
)1)(1(1
gc
i XDCD
t t t
DPP
This is equivalent to taking Elton and Gruber’s (1970) equation for the drop-off ratio
under a classical tax system and multiplying it by 1/(1-t BcB), in order to reflect the grossing
up of the dividend by the franking credits.
The above equations for equilibrium drop-off ratios show that, assuming equal tax rates,
the equilibrium drop-off ratios of long-term investors and short-term traders will differ.
The equilibrium drop off ratios of short-term traders will be lower, due to the burden of
the two-way transaction costs that they incur.
The above equations ignore discounting for delays in the cash flows for dividend
payments and taxes, and do not discount for price risk between the cum-dividend and ex-
dividend days. In the current study discounting for price risk is not applicable since the
prices of shares with and without dividends can be simultaneously observed. Discounting
for time lags in cash flows is a second order effect and usually has an insignificant impact
on the value of the drop-off ratio. TP
3PT The key drivers of the drop-off ratio, or dividend
valuation ratio (DVR) as we call it in our study, are the tax rates on dividends, capital
gains, and corporate profits for long–term investors, and these tax rates and transactions
costs for short-term traders.
TP
3PT
There is one exception, discounting for time can be significant for long-term buyers, in that tax cash flowfrom realising capital gains may be long delayed.

7/28/2019 The Market Valuation of Cash Dividends The Case of the CRA Bonus Issue.pdf
http://slidepdf.com/reader/full/the-market-valuation-of-cash-dividends-the-case-of-the-cra-bonus-issuepdf 9/36
Australia’s switch to the imputation tax system increased after tax dividend receipts for
all classes of investors able to fully utilise the franking credit. Therefore, as hypothesised
by Brown and Clarke (1993), it was expected that the market value of dividends would
increase following the introduction of the imputation tax system. However, Brown and
Clarke found that, immediately following the switch to imputation in 1987, there was a
decline in the average ex-dividend drop-off ratio although it increased in subsequent
years.
Following the introduction of the imputation tax system in 1987, there was another
important tax change in 1988, when superannuation funds, which had previously been
tax-exempt, became subject to tax at a flat rate of 15%. Corporate tax rates in Australia
have been 30% or more during the imputation tax system; consequently superannuation
funds enjoy surplus franking credits which give rise to an effective negative tax rate. This
makes franked dividends very attractive to such funds. In the words of the Association of
Superannuation Funds of Australia:
“ Neither a part nor full exemption of dividends from tax, nor a partial tax credit,
would substitute for the effective negative 15% tax rate that presently applies to
franked dividends derived by Australian superannuation funds.” ASFA (2002, p.7)
As a consequence superannuation funds are strong demanders of fully franked dividends
in the Australian market. This led Chu and Partington (2001) to argue that superannuation
funds trading as long-term investors are likely to set dividend values. They argue,
therefore, that the market value of franked dividends will be close to the face value
grossed up for imputation tax credits.
9
7/28/2019 The Market Valuation of Cash Dividends The Case of the CRA Bonus Issue.pdf
http://slidepdf.com/reader/full/the-market-valuation-of-cash-dividends-the-case-of-the-cra-bonus-issuepdf 10/36
Subsequent to Brown and Clarke’s (1993) study ex-dividend research in Australia has
generally suggested that franking credits have value, Bellamy (1994), Bruckner, Dews
and White (1994), Hathaway and Officer (1998), Walker and Partington (1999).
2.3 Alternatives to traditional ex-dividend studies
A substantial part of the noise associated with the ex-dividend drop-off ratio arises from
the non-contemporaneous observation of cum-dividend and ex-dividend prices. In
response to this problem new experiments have been developed where there is
contemporaneous trading in two classes of securities that only differ in their dividend
entitlements. In these experiments the contemporaneous price differences between the
two securities provide a measure of the market value of dividends.
Several experiments of this type have been conducted in Australia. In a modification of
the traditional ex-dividend experiment, Walker and Partington (1999), examine the
contemporaneous trading of shares cum-dividend in the ex-dividend period. The market
value of dividends in that setting is estimated at $1.23 per dollar of face value when
computing an average value across trades, and $1.15 when computing an average by ex-
dividend events. Walker and Partington suggest that these values are consistent with
dividend pricing dominated by short-term traders. Their results also show that most of the
noise in ex-dividend drop-off ratios can be eliminated by contemporaneous observation
of cum-dividend and ex-dividend prices.
An alternative design used by Twite and Wood (1997) compares the price of individual
share futures and the underlying stock. They estimate that the value of the dividend plus
franking credit averages $1.13 per dollar of the dividend’s face value. Cannavan et. al.
10
7/28/2019 The Market Valuation of Cash Dividends The Case of the CRA Bonus Issue.pdf
http://slidepdf.com/reader/full/the-market-valuation-of-cash-dividends-the-case-of-the-cra-bonus-issuepdf 11/36
(2004) extend this experiment by considering not only individual share futures but also
low exercise price options. Their results suggest that the value of dividends plus credits
initially exceeded the face value of the dividend.4 However, following the introduction of
the 45 day rule, which was designed to restrict trading in imputation credits, they suggest
that franking credits had zero value.
The preceding three experiments were based on a no arbitrage equilibria involving round
trip transactions costs. The dividend valuations they provide are therefore affected by
transactions costs. Chu and Partington (2001), provide another experimental design and
argue that their results are based on an equilibrium for long-term investors that is largely
unaffected by transactions costs. They study a set of non-parri-passu (NPP) rights issues
where the newly issued shares and the existing shares are identical in all respects except
for their entitlement to the dividend immediately succeeding the rights issue. In that
setting the market value of dividends is estimated as $1.50 per dollar of fully franked
dividends. While this estimate is based on thousands of trades, the trades are drawn from
only twenty-four rights issue events. Whether the results from the study can be
generalised is therefore open to question, and in part this is a question that we set out to
address in the current study.
It is widely recognised in the traditional ex-dividend literature that dividend pricing might
be affected by price risk (Heath and Jarrow (1989) and Michealy and Vila (1996)),
transaction costs (Kalay (1982), Karpoff and Walking (1988) and Lakonishok and
Vermealen (1986)), and bid-ask spread (Koski (1996), Frank and Jaganathan (1998)).
Price risk is mitigated in this study because the prices of shares with and without
4 The estimates from their “constant slope model” Table 3, p.188 suggest that, before the introduction of the
11
7/28/2019 The Market Valuation of Cash Dividends The Case of the CRA Bonus Issue.pdf
http://slidepdf.com/reader/full/the-market-valuation-of-cash-dividends-the-case-of-the-cra-bonus-issuepdf 12/36
dividends can be simultaneously observed. However, even with simultaneous trades
another source of risk may arise from uncertainty about the magnitude of the dividend,
and this was the case for some observations in the Chu and Partington (2001) study.
Uncertainty about the dividend is minimised in our experiment because the intended
dividend was announced before the contemporaneous trading in the bonus share and the
pre-existing shares commenced.
The effect of transactions costs will only arise if prices are set by short-term traders
engaged in dividend arbitrage, and we account for bid-ask spread in our empirical
analyses. The tick size problem identified by Bali and Hite (1998) does not arise because
the dividend is a multiple of the price tick.
The expected dividend of thirty-five cents is relatively large which should result in a
strong signal of the dividend’s market value relative to the noise caused by random
disturbances.5
A further advantage of the experiment arises from the simultaneous
observation of prices. The effect of information releases on price levels should wash out
in the price difference between the old and the bonus share. Only information relevant to
the value of the current dividend should affect the observed price difference.
Other work, with close parallels to this study, has investigated investor’s preference for
cash dividends or capital gains, using shares that are identical except for the form of the
dividend. This work is based on companies that issue two classes of shares; one that pays
a stock dividend while the other pays a cash dividend. Studying the case of Citizens
Utilities, Long (1978) concluded that, if anything, it was the shares paying cash dividends
that had a slight premium, but Poterba (1983), studying the same company, disputed this
45 day rule, a dollar of fully franked dividends is worth about $1.10 per dollar of face value.
12
7/28/2019 The Market Valuation of Cash Dividends The Case of the CRA Bonus Issue.pdf
http://slidepdf.com/reader/full/the-market-valuation-of-cash-dividends-the-case-of-the-cra-bonus-issuepdf 13/36
conclusion and also pointed out that ex-dividend day price movements suggested that the
stock dividends had more value. Bailey (1986) examined the trading of nine pairs of dual-
dividend-class shares. He found that shares paying cash dividends had a premium over
shares paying stock dividends. However, the face value of cash dividends was greater
than the stock dividend times the share price on the dividend payment date, and this
difference appeared to explain the premium on the cash dividend shares.
In contrast to the work of Long (1978), Poterba (1986), and Bailey (1988), the valuation
difference studied here is only driven by cash dividends. Another difference is that in this
study the trades are time matched to the minute, rather than the day. While this paper is
primarily concerned with the market value of cash dividends, if that value is greater than
one dollar, the implication is that a dollar of dividends is worth more than a dollar of
capital gains.
3. Identification of NPP bonus issues and the CRA issue
3.1 Searching for NPP bonus issues
Bonus issues in Australia offer existing shareholders additional shares at no cost.6 The
number of bonus shares that each shareholder is entitled to receive is proportional to their
existing shareholding. For instance, a one-for-ten bonus issue allows each existing
shareholder to receive one bonus share for every ten shares held. Following the
announcement of a bonus issue there are three dates that are important to our study: the
ex-bonus date, the books closing date, and the allotment date.
5 The mean dividend in Chu and Partington’s (2001) study was 9.5 cents.6The equivalent of bonus issues in the US and UK are stock dividends and scrip issues, respectively.
13
7/28/2019 The Market Valuation of Cash Dividends The Case of the CRA Bonus Issue.pdf
http://slidepdf.com/reader/full/the-market-valuation-of-cash-dividends-the-case-of-the-cra-bonus-issuepdf 14/36
The ex-bonus date is the first date on which shares are traded without the right to receive
bonus shares. On the books closing date, the issuer’s share registry is closed in order to
determine who is entitled to receive bonus shares. The allotment date is the date on which
holding certificates are despatched, or securities entered as holdings in the Clearing
House Electronic Sub-register System (CHESS).
Bonus shares on the Australian Stock Exchange (ASX) can be traded before the allotment
date on a deferred settlement basis. At the time of the study, deferred settlement trading
began seven business days before the books closing date and ended on the business day
after the allotment date. The ex-bonus date was normally seven business days before the
books closing date. Therefore, the commencement of the deferred settlement trading
period usually coincided with the ex-bonus date.
In order to be included in the study the bonus share must meet two conditions. First, the
bonus shares must be issued before the next ex-dividend date. That is to say, the
allotment date for the bonus issue must precede the next ex-dividend date. Second, the
bonus shares must be identical to the existing shares in all aspects except for the
entitlement to the next dividend.
The Securities Industry Research Centre of Asia Pacific (SIRCA) database was used to
identify the incidence of NPP bonus issues in the period between 1st January, 1991 and
31
st
December, 1998. This was done by tracking the changes in ASX security codes
associated with bonus issues.
An ASX code is used to uniquely identify a particular issue of a security The ASX code
consists of two components; the issuer code and the security code. The issuer code
14
7/28/2019 The Market Valuation of Cash Dividends The Case of the CRA Bonus Issue.pdf
http://slidepdf.com/reader/full/the-market-valuation-of-cash-dividends-the-case-of-the-cra-bonus-issuepdf 15/36
contains 3 letters and is used to represent the issuing company and its ordinary shares.
The security code is suffixed to the issuer code and can also be up to 3 letters long. It is
used to signify specific capitalisation events. The security code pertaining to bonus issues
is usually “BN”. For example, the ASX code used to signify bonus shares issued by
Coca-Cola Amatil would be CCLBN. The bonus share code (BN) should continue to
exist as long as there is some difference in characteristics between the bonus shares and
the existing shares. Since a difference in dividend entitlement is only one of the possible
differences in characteristics between the two classes of shares, tracking changes in bonus
share codes only provides identification of potential NPP bonus issues.
When the bonus shares do not rank equally with the existing shares for the next dividend
payment (but rank equally for all subsequent dividend payments) then the bonus share
code ceases to exist after the next ex-dividend date. The disappearance of the bonus share
code can be identified in the SIRCA database by a message sent out by the ASX. This
message, known as code change message, indicates that the bonus share code has
reverted back to the normal issuer code.
This coding convention is employed to identify the potential NPP bonus issues as
follows. First, all ex-dividend dates in SIRCA database were identified. A search was
then conducted for all share codes that ceased to exist within 20 days of the ex-dividend
date. Those cases which were bonus issue share codes were identified and the dates
relevant to each bonus issue were obtained. Using this procedure 62 potential NPP bonus
issues were identified.
In order to single out those issues which conform to the type of NPP bonus issues
required for this study, we collected and reviewed the text announcement for each of the
15
7/28/2019 The Market Valuation of Cash Dividends The Case of the CRA Bonus Issue.pdf
http://slidepdf.com/reader/full/the-market-valuation-of-cash-dividends-the-case-of-the-cra-bonus-issuepdf 16/36
62 bonus issues. This information was collected from ASX Signal G announcements and
the ASX annual market summaries.7 This analysis revealed that thirty-six out of the sixty-
two issues are actually pari-passu bonus issues, that is, it is stated explicitly in the bonus
issue announcement that the bonus shares will rank equally with the existing shares for
the next dividend payment. The code change therefore relates to some other aspect of
these issues.
For the remaining twenty-six issues, the terms of the announcement indicate that the
bonus share will not rank equally with the existing shares for the immediately succeeding
dividend payment. However, for twenty-four issues all the dates relevant to the bonus
issues coincide with the set of dates for the next dividend payment. That is, the ex-bonus
date coincides with the ex-dividend date, the books closing date for determining
entitlements to bonus shares coincides with the books closing date for determining
entitlements to dividends, and the allotment date for bonus shares coincides with the
dividend payment date. In these cases, excluding deferred settlement trading, there is no
trading in shares with differential dividend entitlements to observe. The existence of
bonus share codes only signifies deferred settlement trading in the bonus shares in the
period between the ex-bonus date (ex-dividend date) and the allotment date. The code
change messages signals the cessation of the deferred settlement trading.
The two remaining issues are the required NPP bonus issues. However, one of the issues
involves a firm paying an unfranked dividend and the dividend is of small magnitude.
The small magnitude means a low signal to noise ratio and the unfranked nature of the
dividend makes it unsuitable for triangulation of Chu and Partington (2001) who only
7 Signal G announcements from SIRCA database are only available for the period after September 1992.
16
7/28/2019 The Market Valuation of Cash Dividends The Case of the CRA Bonus Issue.pdf
http://slidepdf.com/reader/full/the-market-valuation-of-cash-dividends-the-case-of-the-cra-bonus-issuepdf 17/36
considered fully franked dividends. This leaves only one NPP bonus issue for empirical
analysis. This is CRA’s bonus issue.
3.2 The case of CRA’s NPP bonus issue
The CRA bonus issue was announced on 9th
October, 1995 as part of a proposed merger
between CRA Ltd (CRA) and RTZ Corporation PLC (RTZ) to form a dual listed
company (DLC).8 CRA shareholders were to retain their shares in CRA, which would
remain an Australian company listed on the ASX. Equally, RTZ shareholders would
retain their shares in RTZ, which would remain a UK company listed on the London
Stock Exchange. However, the DLC would have a common board of directors and
unified management. It was intended that once the DLC was in place, the dividend and
capital rights of each CRA and RTZ share would be equal. This required the share prices
of CRA and RTZ to be equalised before the merger became effective.
The period beginning 1 January 1995 and ending 6 October 1995 was used to determine
the share price of CRA relative to the share price of RTZ. During that period the closing
share price of CRA (translated into a common currency) was, on average, 1.075 times the
share price of RTZ. Consequently, CRA decided to make a bonus share issue to their
existing shareholders in a ratio of 7.5 bonus shares for every 100 CRA shares already
held. The number of bonus shares to be issued was 44,840,000 shares. The dilution effect
of the bonus issue was expected to make the CRA share price equal to the RTZ share
price. The bonus shares ranked equally with the existing shares in all aspects (including
For those bonus issues made prior to that time, details of the announcements are obtained from the ASXannual market summaries.8 CRA Ltd (CRA) subsequently became Rio Tinto Ltd. and RTZ Corporation PLC (RTZ) became RioTinto plc.
17
7/28/2019 The Market Valuation of Cash Dividends The Case of the CRA Bonus Issue.pdf
http://slidepdf.com/reader/full/the-market-valuation-of-cash-dividends-the-case-of-the-cra-bonus-issuepdf 18/36
voting rights), except that they were not entitled to the final dividend for the year to 31
December, 1995.
The final dividend in the prior year was thirty cents and this value would normally form a
basis for estimating the 1995 final dividend, which would fall due for payment about
March/April 1996. However, uncertainty about the 1995 final dividend was largely
resolved on 16th November, 1995. On that day CRA announced its intention to pay a
1995 final dividend of thirty-five cents per share. They also announced the intention that,
conditional on the government passing into legislation the new corporate tax rate and
franking arrangements, announced in the 1995 budget, the dividend would be fully
franked at the 36% tax rate. This would result in a grossed-up value for the dividend of
54.69 cents.
While the statement of intentions regarding the next dividend payment was made in
November, the formal declaration of the dividend was not made until March 7, 1996. We
have assumed no substantial uncertainty about the magnitude of the dividend over the
period that we observe prices (January through March) and thus we have taken the
expected dividend to be thirty-five cents per share. To the extent that there was any
dividend uncertainty, our estimate of dividend value is likely to be conservative.9
The ex-bonus date, books closing date and allotment date for the bonus issue were 29
December 1995, 9 January 1996, and 15 January 1996, respectively, whereas the ex-
dividend date, books closing date for the dividend, and the dividend payment date were
22 March 1996, 1 April 1996 and 15 April 1996, respectively. Consequently, concurrent
9 For example, if the expected dividend is taken to be last year’s final dividend of thirty cents before theformal dividend announcement and thirty-five cents thereafter, the mean market value of $1.00 face value
18

7/28/2019 The Market Valuation of Cash Dividends The Case of the CRA Bonus Issue.pdf
http://slidepdf.com/reader/full/the-market-valuation-of-cash-dividends-the-case-of-the-cra-bonus-issuepdf 19/36
trading in the bonus share and the existing share could be observed in the period between
16 January 1996 and 21 March 1996. We call this period the NPP trading period. The
allotment date (15 January 1996) was excluded from the NPP period, because the price of
the bonus share on that date might still reflect deferred settlement trades. As it turned out
the first trade that met our selection criteria was observed on 23 January 1996.
4. Data and method
A record of all trades in the existing share and the bonus share during the NPP trading
period was obtained from the SIRCA database. All of these trades were time-stamped to
the nearest second. We were able to form matched pairs of trades in the existing and
bonus shares as follows. We first identified all trades in the bonus share. We then formed
matched pairs of trades where the trade in the old share occurred within one minute of the
trade in the bonus shares. Where there was more than one matching trade in the old share,
which occurred within the one minute window, we selected the trade with the highest
volume. Once a particular trade in the old share was used to form a pair of matched
trades, that trade was not re-used for any subsequent matching. This provided us with 336
pairs of matched trades. We also restricted our observations to normal trading by
excluding trades which were (1) outside the ASX normal trading hours (10 am to 4 pm)
(2) at the opening of a trading day (3) executed under ASX crossing or special
arrangements (4) reported as an exercise of options, and (5) short sales. We found no
incidence of short sales in the bonus share and only two short sales in the old share. We
further restricted our sample to include only those matched pairs of trades in the old share
of fully franked dividends is $1.47 and the median is $1.5, values that are considerably higher than thosereported later in this paper.
19
7/28/2019 The Market Valuation of Cash Dividends The Case of the CRA Bonus Issue.pdf
http://slidepdf.com/reader/full/the-market-valuation-of-cash-dividends-the-case-of-the-cra-bonus-issuepdf 20/36
20
and the bonus share with a minimum volume of 100 securities. The resulting sample
contained 154 pairs of matched trades.
For each pair of matched trades the dividend valuation ratio (DVR) was computed as
follows:
(3) ,,
D
PP DVR
t bonust old
t
−=
where DVRBt B is the dividend valuation ratio for the matched pair of trades observed at time
t , PBold,t B and PBbonus,t B are matched prices of the old share and the bonus share, respectively
observed in the one-minute window at t , and D is the final dividend (35 cents) for the
year to 31 December 1995. Since no dividend reinvestment plan (DRP) was in place for
that dividend, no adjustment was required for the value effect of DRP discounts on the
measurement of the DVR.
Estimates of the DVR are formed using two samples. We call the first sample of 154
pairs of matched trades the full matched sample. The second sample is formed in order to
control for bid-ask bounce. This sample was restricted to cases where the matched trades
in the old share and the bonus share either both occurred at the ask, or both occurred at
the bid. This sample, which we call the no-spread sample, contained 85 pairs of matched
trades.
5. Results
5.1 Price behaviour and changes in the DVR
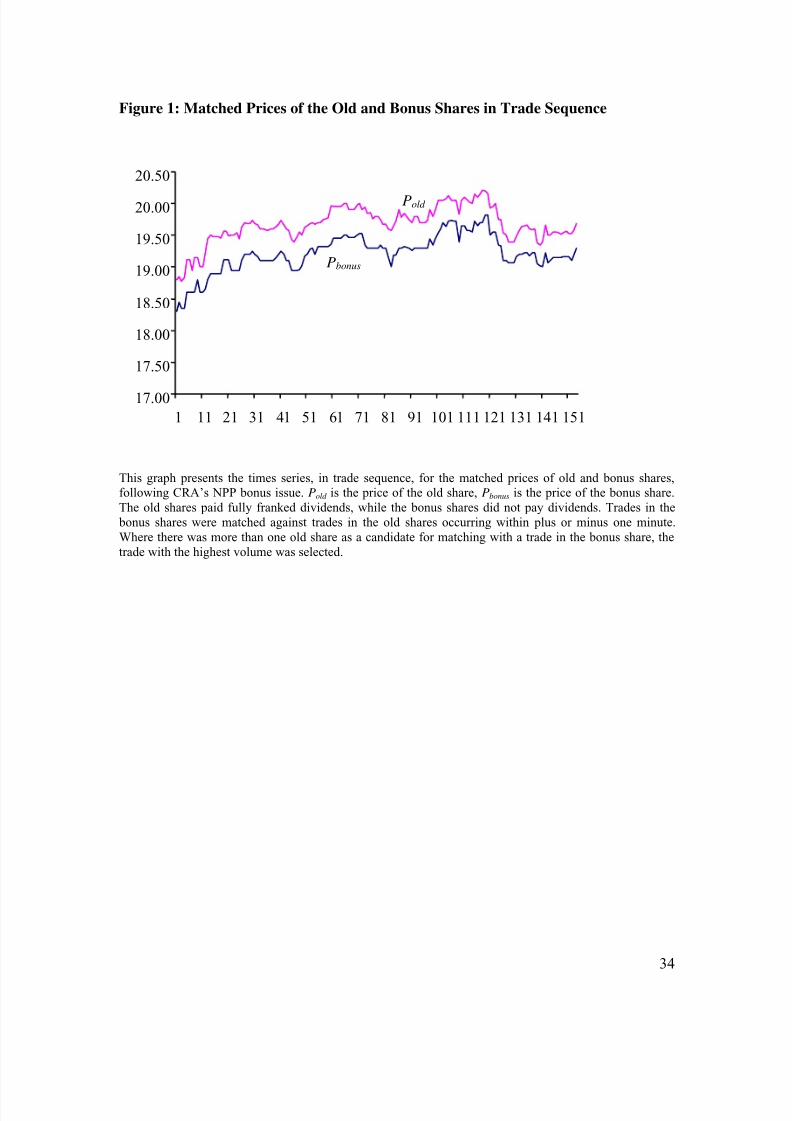
Figure 1 provides a plot of the sequence of trades for the matched prices of the old and
bonus shares during the NPP trading period. Figure 1 suggests that the two price series
7/28/2019 The Market Valuation of Cash Dividends The Case of the CRA Bonus Issue.pdf
http://slidepdf.com/reader/full/the-market-valuation-of-cash-dividends-the-case-of-the-cra-bonus-issuepdf 21/36
track one another closely. Fluctuations in price, presumably due to the arrival of market-
wide and company specific information, appear to be very similar for the two shares.
Visually the difference between the two price series appears reasonably stable, although
there is some variation. For example, there is some narrowing of the price difference
towards the end of the period of observation.
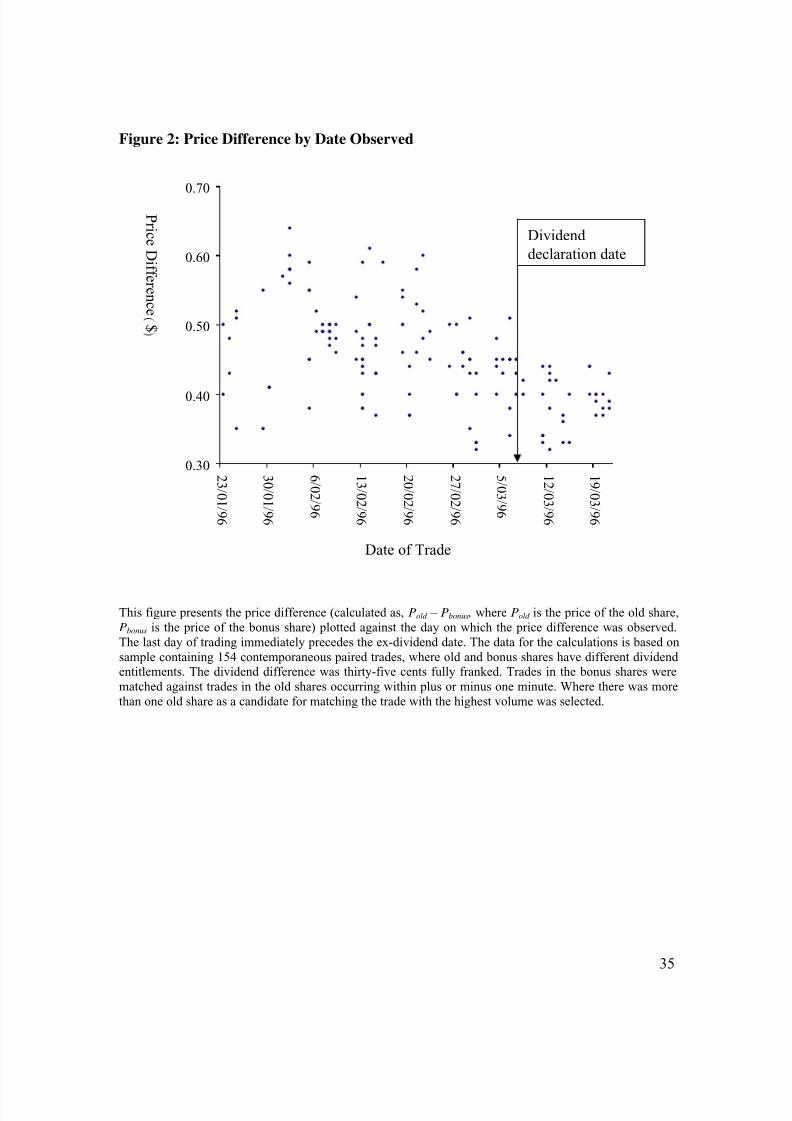
The narrowing of the price difference is more clearly evident in Figure 2, where we plot
the price differences observed each day against the date. Figure 2 shows a noticeably
lower price difference and hence lower dividend values as trading gets closer to the ex-
dividend date. The lower price difference, resulting in a lower DVR, is quite pronounced
from the dividend declaration date, March 7, onwards.
We had not anticipated this lower DVR a-priori. However, if dividend values are set by
dividend arbitrageurs close to the ex-dividend date and by long term investors at other
times, then the pattern of dividend valuation in Figure 2 is what would be expected.
Some investors not entitled to the dividend, such as overseas investors, will trade to avoid
dividends by selling cum-dividend. In so doing they capture some, or all of the credit,
depending on the extent to which it is capitalised into prices. Such sales would take place
in the old stock and create downward price pressure in that stock. An offsetting source of
demand would arise from dividend capture traders buying cum-dividend. However,
dividend capture traders are unlikely to bid cum-dividend prices back up to the level of
dividend values set by long-term investors able to use the imputation credits. This is
because dividend capture traders buy the stock cum-dividend and resell it ex-dividend.10
10 They might also buy the old share and sell the bonus share short; delivering the old share after it has goneex-dividend in order to close their position. However, we observed no short sales in the bonus shares.
21
7/28/2019 The Market Valuation of Cash Dividends The Case of the CRA Bonus Issue.pdf
http://slidepdf.com/reader/full/the-market-valuation-of-cash-dividends-the-case-of-the-cra-bonus-issuepdf 22/36
consequently, they receive the dividend net of the substantial two way transactions costs
that have to be incurred in the dividend’s capture, as in Walker and Partington (1999).
An alternative explanation for the narrowing in the price gap, and hence the lower DVR,
is liquidity. If the bonus share is less liquid than the old share and consequently sells at a
liquidity discount, that discount would be expected to diminish as the ex-date approaches.
At the ex-date the two shares become identical and any liquidity effect disappears.
We rule out a third explanation for the lower DVR post the dividend-announcement,
which is market overestimation of the size of the dividend. Such an overestimate would
cause the price of the old share to drop at the time of the dividend announcement. We
rule this explanation out because the magnitude of the intended dividend had been made
public by CRA well before the formal dividend announcement.
The two competing explanations for the lower DVR may be distinguished empirically. If
short-term dividend trading is the explanation, then it is expected that the cum-dividend
price of the old share will tend to be depressed prior to the ex-dividend date.11
Whereas,
if a liquidity discount on the bonus share is the explanation, then the price of the bonus
share would be expected to rise as the ex-dividend date approaches, while the cum-
dividend price of the old share would be relatively unchanged.
[FIGURES 1 AND 2 ABOUT HERE]
5.2 Descriptive statistics
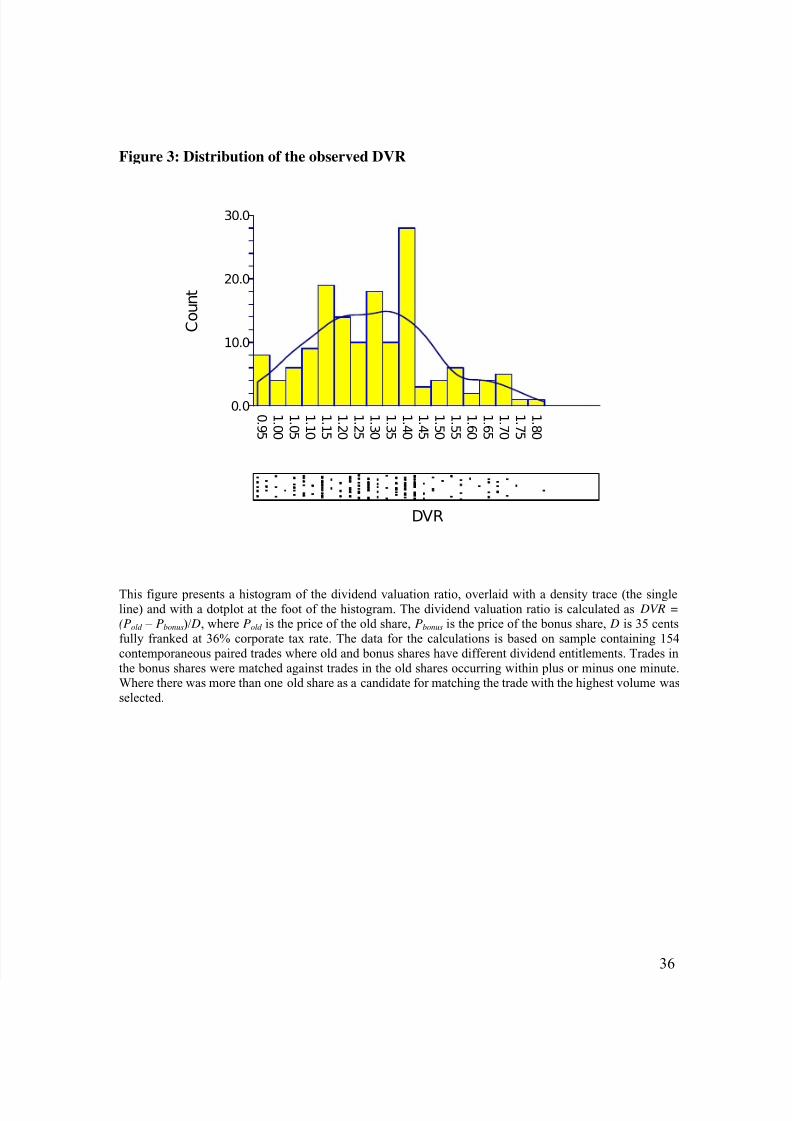
Figure 3 provides a histogram of the observed DVRs for the full matched sample together
with a density trace. Ten of the observations lie below one, with seventeen observations
22
7/28/2019 The Market Valuation of Cash Dividends The Case of the CRA Bonus Issue.pdf
http://slidepdf.com/reader/full/the-market-valuation-of-cash-dividends-the-case-of-the-cra-bonus-issuepdf 23/36
above 1.56. In other words, a substantial majority of the observations (82 percent) lie
between the face value of $1.00 of dividends and the grossed up value, including franking
credits of $1.56.12
Below the histogram is a dot plot. An interesting feature of the dot plot is the appearance
of pronounced striations, where dense lines are created by the observation of identical
values for the DVR. The strongest of these concentrations correspond to price differences
of $0.50 and then $0.40, which together represent twenty-three percent of the sample. It
is almost as though there are two groups of investors trading who have different dividend
valuations. Other noticeable concentrations, each in excess of five percent of the sample,
are at price differences of $0.43, $0.44 $0.45, and $0.49 which together represent twenty-
nine percent of the sample. We note that these observations are not simply a product of
multiple trades occurring with no changes in the price of the shares, nor are they simply
concurrent sequences of trades.
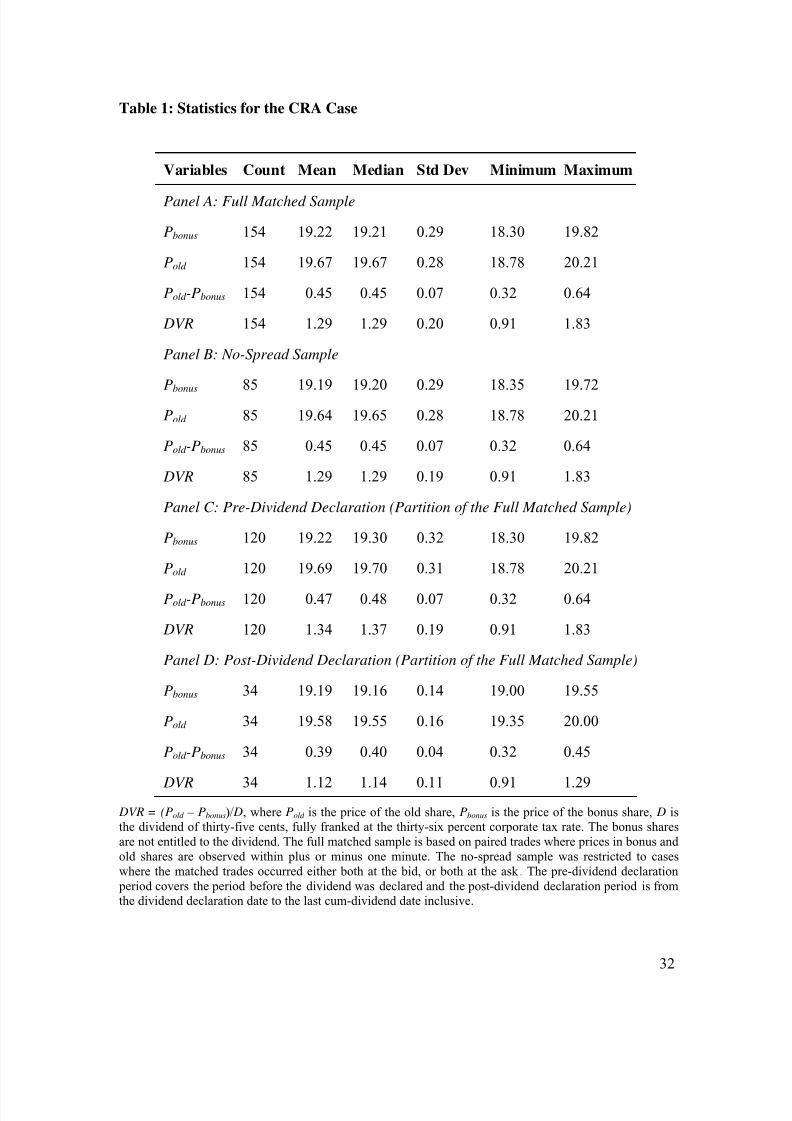
Descriptive statistics are given in Panel A of Table 1 for the full matched sample. These
statistics describe prices, price differences, and the DVR. Panel B provides descriptive
statistics for the no-spread sample. There is almost no difference in the results for the two
samples. Given the similarity in results we confine our discussion to the full matched
sample. The mean and median price difference between the old and bonus shares is
$0.45. With a $0.35 dividend this translates to a DVR of 1.29 for both the mean and
median. The range of the observations for the DVR is from 0.91 to 1.83.
11 Cum-prices may start to rise again on the last cum-dividend day as dividend capture purchases reach their peak volumes.12 Computed as 1/(1 - 0.36).
23
7/28/2019 The Market Valuation of Cash Dividends The Case of the CRA Bonus Issue.pdf
http://slidepdf.com/reader/full/the-market-valuation-of-cash-dividends-the-case-of-the-cra-bonus-issuepdf 24/36
In Panels D and E of Table 1 descriptive statistics are presented for the period before the
dividend declaration date and for the period from the dividend declaration date until the
last cum-dividend day. We only present results based on the full matched sample since
almost identical results arise from the no spread sample. The DVR is noticeably lower in
the post-dividend declaration period. In the period before the dividend is declared the
mean DVR is 1.34 and the median 1.37, while post the dividend declaration the mean is
1.12 and the median 1.14. The maximum DVR is also much lower in the post-dividend
declaration period at 1.29 as opposed to 1.83 in the prior period. It is apparent that the
mean price of the bonus share has changed very little following the dividend
announcement at $19.22 before the announcement and $19.19 afterwards. However, there
is a noticeable decline in the mean prices of the old share, at $19.69 before the dividend
announcement and $19.58 afterwards.
<TABLE 1 AND FIGURE 3 ABOUT HERE >
5.3 Hypothesis tests
In the analysis that follows we present the results of hypothesis tests, however, it is
arguable that our repeated measures of the DVR may not be independent. In which case
the significance levels for the tests of the DVR may be overstated, and therefore they
should be interpreted with caution.
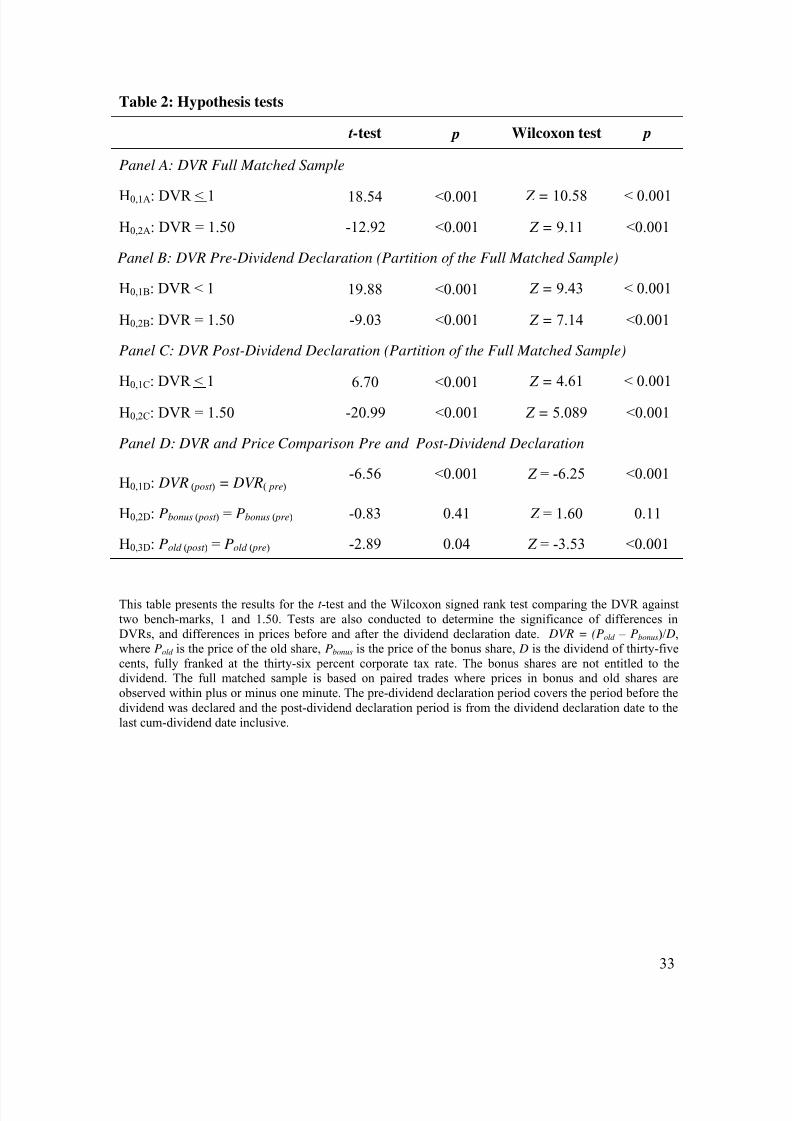
In Panel A of Table 2, the DVR is tested against two benchmarks. A natural bench mark
for the DVR is a value of one. We test the null (H0,1A) that the market value of fully
franked dividends is less than or equal to the face value of dividends (DVR < 1) against
the alternative that the market value of fully franked dividends exceeds the face value of
24
7/28/2019 The Market Valuation of Cash Dividends The Case of the CRA Bonus Issue.pdf
http://slidepdf.com/reader/full/the-market-valuation-of-cash-dividends-the-case-of-the-cra-bonus-issuepdf 25/36
the dividend. We also test the null (H0,2A) that the DVR is equal to 1.50 in order to
examine the generalisability of Chu and Partington’s (2001) results. Table 2, Panel A
shows using both a t -test and the Wilcoxon signed ranks test that the DVR is significantly
above one, and is also significantly different from 1.50.
Panels B and C of Table 2, repeat the foregoing tests for the pre-dividend declaration and
post dividend declaration periods respectively. As for the full sample the DVR is
significantly above 1 and significantly different from 1.50 in both periods.
Panel D of Table 2 examines the differences in drop off ratios and share prices before and
after the dividend declaration date using both a t -test13 and the Wilcoxon signed ranks
test. The DVRs and the prices of the old shares change significantly between the two
periods, but there is no significant difference in the price of the bonus shares.
6. Conclusions
A single case cannot be used to make sweeping generalisations, but it does provide some
evidence to weigh in the balance. Furthermore, observation of contemporaneous trades in
shares which are identical except for their dividend entitlement provides much cleaner
evidence on dividend value than has traditionally been available.
Our results strongly suggest that in the CRA case one dollar of fully franked dividends
was worth significantly more than one dollar, which in turn implies that franking credits
have value. In this case, at least, the joint proposition that foreign investors set prices with
no value accorded to imputation credits, and that this effect is particularly strong in the
extractives industry, is not supported for this particular mining company.
13 Since the variances are unequal between the periods, the Aspin-Welch unequal variance t-test was used.
25

7/28/2019 The Market Valuation of Cash Dividends The Case of the CRA Bonus Issue.pdf
http://slidepdf.com/reader/full/the-market-valuation-of-cash-dividends-the-case-of-the-cra-bonus-issuepdf 26/36
The mean DVR is significantly below the 1.50 suggested by Chu and Partington (2001).
Consequently, their result is not generalisable to the current case. Perhaps the explanation
for the lower value observed in this study is that substantial overseas shareholdings do
depress the combined market value of dividend plus franking credit, but not to the point
where the franking credit becomes worthless.
The dividend was $0.35 and the overwhelming majority of price differences observed
were greater than this figure. Price differences of $0.50 and $0.40, corresponding to
DVRs of 1.14 and 1.43, were particularly prevalent in the data, representing almost a
quarter of the sample. Overall, the mean and median DVRs were both 1.29 and these
values were unchanged after controlling for the effect of bid-ask spread. However, there
was a noticeable drop in the magnitude of the DVR following the dividend declaration
date, from a mean of 1.34 to a mean of 1.12. This latter figure is close to the DVR
estimates of 1.13 from Twite and Wood (1997) and 1.10 from Cannavan et. al. (2004)
and it is not far below the 1.15 from Walker and Partington (1999).14 Walker and
Partington argue that the DVR that they observe is set by short-term traders. Our results
also suggests that dividend values are set by short-term traders close to the ex-dividend
date, but the higher DVR observed before the dividend declaration date is more
consistent with dividend values set by long-term investors.
The key conclusions of the paper are first, that the market value of the dividend exceeds
its face value. It seems that taxes do matter in dividend valuation and that imputation
credits add value. Second the observed market value of the dividend varies depending on
14 The 1.15 was Walker and Partington’s (1999) value by event, their value by trades was higher at 1.23.Assuming short-term trading, a lower value would be expected in the CRA case as the dividend yield,about 1.8 percent, was less than half the average dividend yield in the Walker and Partington study at 3.88 percent.
26

7/28/2019 The Market Valuation of Cash Dividends The Case of the CRA Bonus Issue.pdf
http://slidepdf.com/reader/full/the-market-valuation-of-cash-dividends-the-case-of-the-cra-bonus-issuepdf 27/36
where it is measured relative to the dividend declaration and ex-dividend dates. It seems
that different groups of investors may dominate the setting of dividend values at different
times.
27
7/28/2019 The Market Valuation of Cash Dividends The Case of the CRA Bonus Issue.pdf
http://slidepdf.com/reader/full/the-market-valuation-of-cash-dividends-the-case-of-the-cra-bonus-issuepdf 28/36
References
ASFA (Association of Superannuation Funds of Australia) 2002, Review of Australia’s
International Taxation Arrangements: Submission to the Board of Taxation
Bailey, W., 1988. Canada’s dual class shares: Further evidence on the market value of
cash dividends, Journal of Finance, 43, 1143-1160.
Bali, R., G. Hite, 1998. Ex-dividend day stock price behaviour: discreteness or tax-
induced clienteles? Journal of Financial Economics, 47, 161-188.
Bellamy, D. E., 1994, Evidence of imputation clienteles in the Australian equity market,
Asia Pacific Journal of Management , 11, 275-287.
Bruckner, K., N. Dews, D. White, 1994, Capturing value from dividend imputation,
McKinsey and Company.
Bhardwaj, R., L. Brooks, 1999. Further evidence on dividend yields and the ex-dividend
day stock price effect, Journal of Financial Research, 22, 503-514.
Boyd, J., R. Jagannathan, 1994. Ex-dividend price behavior of common stocks, The
Review of Financial Studies, 7, 711-714.
Brown, P., A. Clarke, 1993. The ex-dividend day behaviour of Australian share prices
before and after dividend imputation, Australian Journal of Management , 18, 1-40.
Cannavan, D., F. Finn, S. Gray, (2004) The value of dividend imputation tax credits in
Australia, Journal of Financial Economics, 73, 167-197
28
7/28/2019 The Market Valuation of Cash Dividends The Case of the CRA Bonus Issue.pdf
http://slidepdf.com/reader/full/the-market-valuation-of-cash-dividends-the-case-of-the-cra-bonus-issuepdf 29/36
Chu, H., G. Partington, 2001, The market value of dividends: Evidence from a new
method , Accounting Association of Australia and New Zealand Conference.
Clarke, A., 1992. Ex-dividend day price behaviour of Australia share prices pre and post-
imputation, Managerial Finance, 18, 34-48.
Elton, E., M. Gruber, 1970. Marginal stockholder tax rates and the clientele effect,
Review of Economics and Statistics, 52, 68-74.
Fedina, M., T. Grammatikos, 1993, Risk premia and the ex-dividend stock price
behavior: Empirical evidence, Journal of Banking and Finance, 17, 575-589.
Frank, M., R. Jagannathan, 1998. Why do stock prices drop by less than the value of the
dividend? Evidence from a country without taxes, Journal of Financial Economics, 47,
161-188.
Graham, J., R. Michaely, M Roberts, 2003, Do price discreteness and transaction costs
affect stock returns? Comparing Ex-dividend pricing before and after decimalisation,
Journal of Finance, 6, 2611-2635.
Grammatikos, T., 1989, Dividend stripping, risk exposure, and the effect of the 1984 tax
reform act on the ex-dividend behavior, Journal of Business 62, 157-174.
Lakonishok, J., and Vermaelen, T., 1986, Tax-induced trading around ex-dividend days,
Journal of Financial Economics, 16, 287-319.
Lasfer, M.A., 1995, ‘Ex-Day Behavior: Tax or Short-Term Trading Effects’, Journal of
Finance, 50, pp. 875-97.
Heath, D., R. Jarrow, 1988. Ex-dividend Stock Price Behaviour and Arbitrage
Opportunities, Journal of Business, 61, 95-108.
29
7/28/2019 The Market Valuation of Cash Dividends The Case of the CRA Bonus Issue.pdf
http://slidepdf.com/reader/full/the-market-valuation-of-cash-dividends-the-case-of-the-cra-bonus-issuepdf 30/36
Kalay, A., 1982. The ex-dividend day behavior of sock prices: A re-examination of the
clientele effect, Journal of Finance, 37, 1059-1070.
Koski, J.L., 1996. A microstructure analysis of ex-dividend behavior before and after the
1984 and 1986 Tax Reform Acts, Journal of Business, 69, 313-338.
Hathaway, N.J. and R.R. Officer, 1998. The value of imputation tax credits, Working
paper, Graduate School of Management, University of Melbourne.
Long, J., 1978. The Market Value of Cash Dividends: A Case to Consider, Journal of
Financial Economics, 6, 235-264.
Michaely, R. 1991, Ex-dividend stock price behaviour: The case of the 1986 Tax Reform
Act, Journal of Finance, 46, 845-860
Michaely, R., J. Vila, 1996. Trading volume with private valuation: Evidence from the
ex-dividend day, The Review of Financial Studies, 9, 471-509.
Michaely, R., J. Vila, J. Wang, 1997, A model of trading volume with tax-induced
heterogeneous valuation and transactions costs, Journal of Financial Intermediation, 5,
340-371.
Poterba, J., 1985. The Market Valuation of Cash Dividends: The Citizens Utilities Case
Reconsidered, Journal of Financial Economics, 15, 395-405.
Twite, G., J. Wood, 1997, The pricing of Australian imputation tax credits: evidence from
individual share futures contracts. Unpublished working paper, Australian Graduate
School of Management, University of New South Wales.
30

7/28/2019 The Market Valuation of Cash Dividends The Case of the CRA Bonus Issue.pdf
http://slidepdf.com/reader/full/the-market-valuation-of-cash-dividends-the-case-of-the-cra-bonus-issuepdf 31/36
Wood, J. 1991, The influence of foreign investors on the ex-dividend day behaviour of
Australian equities, Unpublished working paper, Australian Graduate School of
Management, University of New South Wales.
Walker, S. and G. Partington, 1999, The Value of Dividends: Evidence from Cum-
Dividend Trading in Ex-dividend Period, Accounting and Finance, 39, 3, 1999.
31
7/28/2019 The Market Valuation of Cash Dividends The Case of the CRA Bonus Issue.pdf
http://slidepdf.com/reader/full/the-market-valuation-of-cash-dividends-the-case-of-the-cra-bonus-issuepdf 32/36
Table 1: Statistics for the CRA Case
Variables Count Mean Median Std Dev Minimum Maximum
Panel A: Full Matched Sample
Pbonus 154 19.22 19.21 0.29 18.30 19.82
Pold 154 19.67 19.67 0.28 18.78 20.21
Pold -Pbonus 154 0.45 0.45 0.07 0.32 0.64
DVR 154 1.29 1.29 0.20 0.91 1.83
Panel B: No-Spread Sample
Pbonus 85 19.19 19.20 0.29 18.35 19.72Pold 85 19.64 19.65 0.28 18.78 20.21
Pold -Pbonus 85 0.45 0.45 0.07 0.32 0.64
DVR 85 1.29 1.29 0.19 0.91 1.83
Panel C: Pre-Dividend Declaration (Partition of the Full Matched Sample)
Pbonus 120 19.22 19.30 0.32 18.30 19.82
Pold 120 19.69 19.70 0.31 18.78 20.21
Pold -Pbonus 120 0.47 0.48 0.07 0.32 0.64
DVR 120 1.34 1.37 0.19 0.91 1.83
Panel D: Post-Dividend Declaration (Partition of the Full Matched Sample)
Pbonus 34 19.19 19.16 0.14 19.00 19.55
Pold 34 19.58 19.55 0.16 19.35 20.00
Pold -Pbonus 34 0.39 0.40 0.04 0.32 0.45
DVR 34 1.12 1.14 0.11 0.91 1.29
DVR = (Pold – Pbonus)/ D, where Pold is the price of the old share, Pbonus is the price of the bonus share, D isthe dividend of thirty-five cents, fully franked at the thirty-six percent corporate tax rate. The bonus sharesare not entitled to the dividend. The full matched sample is based on paired trades where prices in bonus and old shares are observed within plus or minus one minute. The no-spread sample was restricted to caseswhere the matched trades occurred either both at the bid, or both at the ask . The pre-dividend declaration period covers the period before the dividend was declared and the post-dividend declaration period is fromthe dividend declaration date to the last cum-dividend date inclusive.
32
7/28/2019 The Market Valuation of Cash Dividends The Case of the CRA Bonus Issue.pdf
http://slidepdf.com/reader/full/the-market-valuation-of-cash-dividends-the-case-of-the-cra-bonus-issuepdf 33/36
Table 2: Hypothesis tests t-test p Wilcoxon test p
Panel A: DVR Full Matched Sample
H0,1A: DVR < 1 18.54 <0.001 Z = 10.58 < 0.001
H0,2A: DVR = 1.50 -12.92 <0.001 Z = 9.11 <0.001
Panel B: DVR Pre-Dividend Declaration (Partition of the Full Matched Sample)
H0,1B: DVR < 1 19.88 <0.001 Z = 9.43 < 0.001
H0,2B: DVR = 1.50 -9.03 <0.001 Z = 7.14 <0.001
Panel C: DVR Post-Dividend Declaration (Partition of the Full Matched Sample)
H0,1C: DVR < 1 6.70 <0.001 Z = 4.61 < 0.001
H0,2C: DVR = 1.50 -20.99 <0.001 Z = 5.089 <0.001
Panel D: DVR and Price Comparison Pre and Post-Dividend Declaration
H0,1D: DVR ( post ) = DVR( pre)-6.56 <0.001 Z = -6.25 <0.001
H0,2D: Pbonus ( post ) = Pbonus ( pre) -0.83 0.41 Z = 1.60 0.11
H0,3D: Pold ( post ) = Pold ( pre) -2.89 0.04 Z = -3.53 <0.001
This table presents the results for the t -test and the Wilcoxon signed rank test comparing the DVR againsttwo bench-marks, 1 and 1.50. Tests are also conducted to determine the significance of differences inDVRs, and differences in prices before and after the dividend declaration date. DVR = (Pold – Pbonus)/ D,where Pold is the price of the old share, Pbonus is the price of the bonus share, D is the dividend of thirty-fivecents, fully franked at the thirty-six percent corporate tax rate. The bonus shares are not entitled to thedividend. The full matched sample is based on paired trades where prices in bonus and old shares areobserved within plus or minus one minute. The pre-dividend declaration period covers the period before thedividend was declared and the post-dividend declaration period is from the dividend declaration date to thelast cum-dividend date inclusive.
33
7/28/2019 The Market Valuation of Cash Dividends The Case of the CRA Bonus Issue.pdf
http://slidepdf.com/reader/full/the-market-valuation-of-cash-dividends-the-case-of-the-cra-bonus-issuepdf 34/36
Figure 1: Matched Prices of the Old and Bonus Shares in Trade Sequence
20.50
Pold 20.00
19.50
Pbonus19.00
18.50
18.00
17.50
17.00
1 11 21 31 41 51 61 71 81 91 101 111 121 131 141 151
This graph presents the times series, in trade sequence, for the matched prices of old and bonus shares,following CRA’s NPP bonus issue. Pold is the price of the old share, Pbonus is the price of the bonus share.The old shares paid fully franked dividends, while the bonus shares did not pay dividends. Trades in the bonus shares were matched against trades in the old shares occurring within plus or minus one minute.Where there was more than one old share as a candidate for matching with a trade in the bonus share, thetrade with the highest volume was selected.
34
7/28/2019 The Market Valuation of Cash Dividends The Case of the CRA Bonus Issue.pdf
http://slidepdf.com/reader/full/the-market-valuation-of-cash-dividends-the-case-of-the-cra-bonus-issuepdf 35/36
Figure 2: Price Difference by Date Observed
0.30
0.40
0.50
0.60
0.70
2 3 / 0 1 / 9 6
3 0 / 0 1 / 9 6
6 / 0 2 / 9 6
1 3 / 0 2 / 9 6
2 0 / 0 2 / 9 6
2 7 / 0 2 / 9 6
5 / 0 3 / 9 6
1 2 / 0 3 / 9 6
1 9 / 0 3 / 9 6
Dividend
declaration date
P r i c e Di f f e r e n c e
$
Date of Trade
This figure presents the price difference (calculated as, Pold – Pbonus , where Pold is the price of the old share,Pbonus is the price of the bonus share) plotted against the day on which the price difference was observed.The last day of trading immediately precedes the ex-dividend date. The data for the calculations is based onsample containing 154 contemporaneous paired trades, where old and bonus shares have different dividend entitlements. The dividend difference was thirty-five cents fully franked. Trades in the bonus shares werematched against trades in the old shares occurring within plus or minus one minute. Where there was morethan one old share as a candidate for matching the trade with the highest volume was selected.
35
7/28/2019 The Market Valuation of Cash Dividends The Case of the CRA Bonus Issue.pdf
http://slidepdf.com/reader/full/the-market-valuation-of-cash-dividends-the-case-of-the-cra-bonus-issuepdf 36/36
Figure 3: Distribution of the observed DVR
0.0
10.0
20.0
30.0
DVR
C o u n t
0 . 9 5
1 . 0 0
1 . 0 5
1 .1 0
1 .1 5
1 .2 0
1 .2 5
1 . 3 0
1 . 3 5
1 .4 0
1 .4 5
1 . 5 0
1 . 5 5
1 . 6 0
1 . 6 5
1 .7 0
1 .7 5
1 . 8 0
This figure presents a histogram of the dividend valuation ratio, overlaid with a density trace (the single
line) and with a dotplot at the foot of the histogram. The dividend valuation ratio is calculated as DVR = (Pold – Pbonus)/ D, where Pold is the price of the old share, Pbonus is the price of the bonus share, D is 35 cents
fully franked at 36% corporate tax rate. The data for the calculations is based on sample containing 154
contemporaneous paired trades where old and bonus shares have different dividend entitlements. Trades in
the bonus shares were matched against trades in the old shares occurring within plus or minus one minute.Where there was more than one old share as a candidate for matching the trade with the highest volume was
selected.