the market for yield-bearing financial assets: bonds, notes, bills · 4 the distinction between...
TRANSCRIPT
Chapter 7 - The Market for Yield-Bearing Financial Assets: Bonds, Notes, and Bills
written for Economics 104 Financial Economics by Professor Gary R. Evans First edition October 10, 2016, this edition October 21, 2019
© Gary R. Evans. This work is licensed under a Creative Commons Attribution-NonCommercial-ShareAlike 4.0 International License.
It is time to take a break from stocks and switch over to the other primary class of investment assets, yield-bearing financial assets (YBFAs), generally classified as bonds, notes or bills. As this discussion proceeds, the term "bonds" will be used to refer to bonds, notes, and bills (so that we don't have to keep referring to that triad) unless the context makes it clear that we should distinguish them. In many respects bonds differ greatly from stocks. As will be seen, they are a type of debt asset rather than equity asset. The market for bonds is not fully electronic and in many respects is very primitive and traditional compared to the high-liquidity low-latency electronic stock exchanges that we learned about in earlier chapters. Even those who know little about bonds know that they pay interest. Perhaps more important than anything else, the features that define individual securities are not standardized like they are for stocks. Every bond in circulation is technically a legal debt contract that may have any number of different clauses or conditions that are peculiar to or customary for only that class of debt asset. Although in this chapter we will discuss "traditional" corporate bonds and notes, there really is no such thing as a standard bond or note. They are often very complicated assets, which makes trading them a potentially hazardous enterprise for the amateur investor. Stocks and bonds are similar though in other respects. Like stocks, bonds are initially issued but then traded on an enormous secondary market and it is that market that is our primary concern in this chapter. Bonds also rise and fall in value just like stocks, registering capital gains and losses that will supplement or detract from the interest earned on the bond. Sometimes the potential for capital gains and losses are of more interest to the markets than the earnings, often meager in recent years, that come from interest payments. People who don't invest in bonds often believe that they are simple assets, at least when compared to stocks. They are not. Bonds can be very complex. People who don't invest in bonds also often believe that they are relatively safe investment assets. Some are but many are not. An investor can lose a lot of money investing in bonds. Smart bond, note, and bill investing requires knowledge. The purpose of this chapter and the chapter that follows is to provide enough knowledge to inform and guide elementary investments in yield-bearing financial assets.1 This chapter breaks the YBFA markets down into the major participants, beginning with U. S. Treasury securities, which are the safest and simplest (and hence easiest to explain) of the YBFA categories. That discussion is followed by a section that describes traditional corporate notes and bonds (but not bills), which differ from U.S. Treasury securities primarily because they represent debt that can default (missing a payment), which substantially complicates their pricing. Then we discuss bonds and notes issued by state and local governments, which are called municipal bonds and notes. They differ largely because of their tax treatment for dividend payments. The second half of the chapter introduces the very complex issue of the types of risk associated with YBFAs, including default risk, and how that impacts bond prices. There is also a discussion of the special pricing conventions used for pricing bills and other assets that have maturities of less than one year (and these are called money market assets), concluding with a discussion of what role these exotic assets should play in any investment portfolio.
1 This chapter is a mere introduction to this deeply complex market. The truly interested student or finance professional-in-training is advised to read what your teacher regards as the bible of all bond books, the magnificent 1,800 page "Handbook of Fixed Income Securities," edited by Frank J. Fabozzi and Steven V. Mann. The eight edition (2012) of this book was consulted for fact-checking by your teacher throughout this chapter. Any resulting mistakes are almost certainly the mistakes of your teacher and not Professor Fabozzi nor his staff.

2
1. Basics of Bonds, Notes, and Bills This entire class of yield-bearing financial assets (YBFAs) are often referred to as fixed income investments, a misleading name if there ever was one. This name is derived from the traditional notion of bonds as very conservative, safe assets that primarily pay a stable rate of interest (hence fixed income) over a long period of time. Although many of the most conservative bonds can be used to satisfy this criteria, many YBFAs sold in the modern era have a risk profile that does not really conform to the image of providing a stable low-risk source of income over an extended period of time. Some so-called fixed income assets have a high probability of default and many more of them can suffer large capital losses in fragile markets. Nonetheless many books and mutual fund and ETP managers refer to the entire broad category of bonds, notes, and bills as fixed income assets. But we will break with tradition and use more accurate descriptors. We don't want to use terms that give a false sense of security.
You may remember that stocks (equities) represent partial ownership of the company that issued the stock. In contrast, a bond, note or bill is a debt instrument. It is specifically a debt contract between the issuer of the YBFA, whether that be a government or a corporation, and the owner of the YBFA, which would be you if you hold the bond in your investment portfolio. If you own a bond, regardless of whether you bought it when first issued or bought it later on the secondary market, then you are effectively the lender and the contract establishes an obligation between the issuing agency and you. That obligation typically mandates a payment of interest at a stipulated rate on a scheduled basis (such as monthly, quarterly, semi-annually or annually) plus a redemption of the full value of the bond on the date of its maturity. The periodic interest rate is called the coupon rate. For example, a 20-year corporate bond might offer to pay the owner of the bond 5% interest annually in four quarterly payments (of 1.25% each quarter) for a period of 20 years. At the end of 20 years the bond will be redeemed for its full initial value and the contract will be terminated.
3 The interest rate is called the coupon rate because bonds issued before the 20th century sometimes had strips of paper attached called coupons which had to be detached from the bond and presented to a financial agent for the interest payment to be made. In years past, bonds were issued in certain specific denominations, such as $1,000 or $10,000, and the purchaser had to buy them in blocks divisible by that large amount. The buyer would be given an actual gilded bond certificate. Refer to Figure 1 - Pennzoil United Bond Certificate, which is an image of a 20-year bond with a $10,000 denomination, issued in 1968 and maturing on October 1, 1988. It promised to pay annual interest at the rate of 7 3/8% (the coupon rate).2 This was the type of conservative corporate bond that contributed to the notion of a “fixed income” investment back in the 1970s. This bond would sit in a portfolio and generate a healthy $737.50 interest annually without any fanfare or drama. Modern bonds are now sold as bookkeeping entries (with typically no gilded certificate like the Pennzoil United Bond) and are often sold in small denominations as little as $100. Regardless of denomination, YBFAs are always priced in terms of $100 units, which is referred to as par. Bond pricing on the secondary market is always in terms of par. For example, if you buy a newly-issued corporate bond for $100,000 at par, at the time of the bond's purchase the “price” of the bond equals $100. If a year later the bond has risen in value (remember, these bonds can rise and fall in value over their lifetime - why they do is explained later) and is quoted at $101.825, then your bond is worth $101,825. If instead the bond is quoted at $98.73, then on paper you have suffered a small capital loss, because your bond is worth $98,730. Since we are now discussing bonds that are not trading at par value, let's introduce a couple of more terms. If a bond is trading above par, such an in our example of $101.825, the bond is said to be trading at a premium. If instead the bond is trading below par, such as $98.73 in our example, the bond is said to be trading at a discount. Therefore, when a bond is first issued it will be sold at or near par and when redeemed at maturity (if it has not defaulted and still exists), it will be redeemed at par exactly.3 During the time in between, the bond can trade at a premium or a discount, or both, going from one to the other. The periodic interest payment paid by a traditional note or bond is called coupon interest and is equal to the stated annual interest rate (coupon rate) times par divided by the number of payments made annually. For example, the coupon interest payment for the Pennzoil United bond used in our example, which was paid semi-annually was
$368.75 = (0.07375 X 1,000) / 2 There are other rates of return which depend upon context and are generally called the yield of the bond. For example, if you buy a bond at discount then the actual yield (the true rate if interest) that you will earn on the bond will not exactly equal the coupon rate of interest because that requires that you buy the bond at par. Various formulas for calculating different yields are derived in the next chapter. 1.1 Classes of yield-bearing financial assets based upon (mostly) maturity Now that these elementary terms have been introduced, this is the proper place for distinguishing between bonds, notes, and bills. These categories depend largely upon the maturity of the YBFA in question.4
2 This is an image of a specimen that was never issued (the bond series was issued, but not this particular specimen) owned by Professor Evans, purchased from a website that specializes in the sale of old bond and stock certificate, scripophily.com. Pennzoil United later changed their name to Pennzoil Company, merged with another company, then were finally purchased and absorbed by the Royal Dutch Shell Group in 2002 and are now part of the modern company Shell Oil Products U.S. 3 For the moment let’s assume that a bond is sold exactly at par, although in a later chapter we will see why they are instead sold at a price very close to par, like $100.28 or $99.87, but not at par. 4 The distinction between bonds, notes, and bills can be arbitrary and not everyone accepts the same definitions. Your teacher is using those that are associated with U.S. Treasury securities because they play such a prominent role in this chapter. Fabozzi, for example, refers to all of these assets as bonds and classifies them as "short term" (1-5 years), "intermediate term" (5-12 years and sometimes called "notes"), and "long term" (more than 12 years). Perhaps more important than these distinctions are the realization that the issuer of a new YBFA can pretty much call them anything they want.

4 A bond normally refers to an interest-bearing asset that has a maturity of more than ten years. Also a true bond always pays coupon interest as the means of paying interest through periodic payments made monthly, quarterly, semi-annually, or annually. A bond's issue value and redemption value are both at par (100). A note is identical to a bond except that it has a shorter maturity - greater than one year up to 10 years. Typical maturities include 2, 3, 5, 7 and 10 years. The note is otherwise identical to a bond. A bill is very different from notes and bonds. A bill has a maturity of one year or less. Typical maturities include 4, 13, 26 and 52 weeks, and some bills even have overnight maturities. (How an overnight maturity is possible requires a lot of explanation, which is offered in lectures for the Economics 104 student, but not in this text). Bills do not pay coupon interest and in fact do not pay direct interest of any kind. Instead, bills are intentionally sold at a discount (less than par) and are redeemed at par. The interest earned is implicit in the capital gain. For example, a 26-week bill might be sold for 98 and will be redeemed 6 months later for 100. At no time is an interest payment made but the bill has implicitly earned about 4% annually (2% each six months). [The annual interest earned in this example is not exactly 4%. The formula for calculating the exact interest rate earned is shown in the next chapter]. The market for bills is called the money market and bills themselves are often called money market financial assets (MMFAs). Bills are regarded as (usually) low-risk, low-yield financial assets and the very popular mutual funds that are comprised entirely of bills are called money market mutual funds. Given that bills are so distinct from notes and bonds, for the rest of this chapter we will keep them separated. We will be referring to bills only in the special sections of the chapter dedicated to (a) U.S. Treasury bills and (b) money market assets in general. In all other sections we are referring to bonds and notes and because they differ only by maturity we will (again) refer to them as bonds unless it is necessary to make the distinction. 1.2 Classes of yield-bearing financial assets based upon issuer category and their size It is useful to separate these assets and their markets into categories defined by the type of issuer. Much of the data that we review is separated along these lines and the acceptable conventions for asset design varies considerably from one class of issuer to another. Here is an introduction to these issuer categories, arranged according to how they will be presented in this chapter: United States Treasury securities - This group includes all categories of debt instrument issued by the United States Treasury mostly for the purpose of funding the annual budget deficits of the U.S. government. Federal agency securities - This group includes all categories of debt issued by federal agencies and what are called "government sponsored enterprises," which are independent agencies that issue debt that is effectively guaranteed by the U.S. government. Examples include the debt of the Federal National Mortgage Association (Fannie Mae) and the Federal Agricultural Mortgage Corporation (Farmer Mac). This category does not include any debts associated with U.S. government fiscal operations (all of that is under U.S. Treasury securities) nor does it include the non-marketable debt held by large U.S. government trust funds like the Social Security Trust Funds.5 Municipal (state and local government) securities - This group is in a class all of its own because of its unique tax status, as will be explained in the chapter. These securities are issued by state and local government and sometimes special agencies within, such as school districts, and they consist mostly of traditional bonds, notes, and bills with special tax privileges. Corporate debt securities (traditional) - This is an inclusive category that includes many kinds of debt assets issued by corporations, excluding collateralized debt obligations and mortgage debt, both of which have their own categories and are listed separately below. Most of the debt assets listed within this group are traditional bonds, notes, and bills. Asset-backed securities including collateralized debt obligations (CDOs) - This relatively new category includes debt issued for financing consumer credit cards, vehicle loans and leases, student loans, and similar consumer and small 5 Federal trust fund debt cannot be explained here. This exclusion was made just in case the reader who is aware of the trust fund debt is curious about whether it falls in this category - it does not.

5business lending categories. As will be seen, many of these assets - especially the CDOs - are not traditional bonds, notes or bills, are structured very differently, often do not have traditional interest-based payouts, do not have denominations, nor do they have a formal "maturity." These are very different in every way from traditional YBFAs. Mortgage securities including collateralized mortgage obligations (CMOs) - Some of these financial assets with their exotic non-traditional designs were at the heart of the terrible mortgage meltdown that serious damaged the global economy after 2007. Like CDOs, many of these also have very non-traditional designs when compared with traditional bonds and notes.
The United States market for debt assets is enormous. The total amount of debt outstanding excluding debt owed to banks at the end of 2018 totaled nearly $43 trillion! The composition of that debt is shown in Figure 2 - Outstanding U.S. Market Debt. As can be seen, the largest piece of the debt pie is owed by the U.S. Treasury at nearly $15.6 trillion, followed by mortgage debt ($9.7 trillion) and corporate debt ($9.2 trillion). The money market category, remember, consists only of bills with maturities of one year or less, and even that category represents more than $1 trillion. These markets have experience phenomenal growth. In 1996, only 22 years ago, these categories totaled only $12.372 trillion, nearly a 6% annualized rate of return in an economy that has been growing at only half that pace.
Excluded here is any discussion of international debt instruments, such as various categories of sovereign debt (debt issued by foreign governments). This chapter would probably double in length if we decided to give international debt instruments serious treatment, because the market is very complex and strongly impacted by the behavior of exchange rates. It is also often a very troubled market and your teacher generally advises small investors to stay away from international debt, even in the form of mutual funds and ETPs. It is a playground for professionals only. If you are a student in Economics 104 there will be some topical discussion of international debt in the lecture, but not here. These categories do not include any form of bank debt, which is to say that it does not include any debt owed by banks (mostly in the form of deposits, which are regarded as a liability of the bank where the deposits have been made) and does not include business and consumer loans owed to banks. These categories include only non-bank debt instruments.
2. The Market for U.S. Treasury Securities Figure 2 makes it clear that, by far, the largest category of debt outstanding in the United States is United States Treasury debt. Generally, this is the debt that is used to fund the budget deficits (the extent to which expenditures exceed receipts from taxes and other revenues) of the U.S. government in its fiscal operations. For example, if in any given year the U.S. Treasury runs a budget deficit of $500 billion, then this amount of new Treasury debt must be issued to fund the government. As of June 2018, the marketable debt of the U.S. Treasury stood at $14.955 trillion, and consisted of U.S. Treasury Bills, Notes, Bonds, Treasury Inflation Indexed Securities (TIPS) and Floating Rate Notes. Figure 3 shows the maturities of these securities that were offered in 2018. As explained earlier a U.S. Treasury Bill will mature in one year or less (from its date of issue), whereas a U.S. Treasury

6Note will have a maturity of more than one year to ten years and a U.S. Treasury Bond will have a maturity date of more than ten years, where twenty or thirty years is typical.6 At maturity, the financial asset is redeemed, or "paid off" by the Treasury.
Bills also differ from notes and bonds in the manner in which the interest is paid. A U.S. Treasury Bill is called a discounted financial asset because no direct interest is paid to the owner of the bill. Instead, the bill is sold at less than its maturity value (sold at a discount) and is redeemed at its maturity value, so the interest is implicit in its appreciation in price. For example, a $10,000 U.S. Treasury
Bill, 52-week series, might be sold to an investor by the treasury for $9,300. One year later when it matures the bill can be redeemed for $10,000, yielding a return of $700 (no interest would be paid otherwise). This return of $700 to an original investment of $9,300 amounts to an effective rate of return of about 7.5%. In contrast, both U.S. Treasury Notes and U.S. Treasury Bonds pay coupon interest. Semi-annual interest payments are made to the registered owners of these securities at the stipulated coupon rate. For example, an investor who purchases a ten-year $10,000 U.S. Treasury Bond yielding a coupon rate of 8% will be paid two payments annually of $400 each.
Figure 4 - Total Marketable Treasury Debt above shows the total level of marketable Treasury Bills, Notes, Bonds, and TIPS (to be explained below) outstanding for the date shown. As can be seen, notes make up the bulk of U.S. Treasury debt. Marketable Debt has that name because U.S. Treasury Bills, Notes and Bonds are sold to whomever wants to buy them, and they can be resold, and typically are, in a huge secondary market. For example, a three-year U.S. Treasury Note might be sold to a private investor who might then resell it six months later to a bank or mutual fund. Prices for these securities fluctuate in value on the secondary markets, just like stocks, and their prices are quoted daily in the nation's larger newspapers and online. There is also a category of U.S. Treasury debt that is classified as non-marketable U.S. Treasury debt that is not sold on the markets and is
never available for sale. There was more than $6.1 trillion of this debt outstanding in June 2019. This class of debt is associated with the internal trust funds used by the United States Treasury, such as the Social Security Old Age Survivors Insurance Trust Fund that maintains the long-term funding of the Social Security System. The debt does not represent the true indebtedness of the federal government to any outside parties. Instead it is used as in internal bookkeeping convention to maintain the funding status of large government funding programs like Social Security and Medicare. Given that the non-marketable debt is not marketed and cannot be used as an investment asset it has no relevance to this issues discussed in this chapter.7
6 These bonds should not be confused with the popular and inexpensive U.S. Savings Securities, which can be purchased for as little as $50. These are classified under Non-Marketable Debt and the amount outstanding in June 2019 was $282.1 billion.
7 Non-marketable debt should not be confused with agency debt. Trust funds and their debts are too complicated to discuss here and have no bearing upon investment options. The interested student can learn more about them in your teacher's Macroeconomics Entitlements and Trust Funds Lecture, http://palmislandtraders.com/econ53/e53l13.pdf
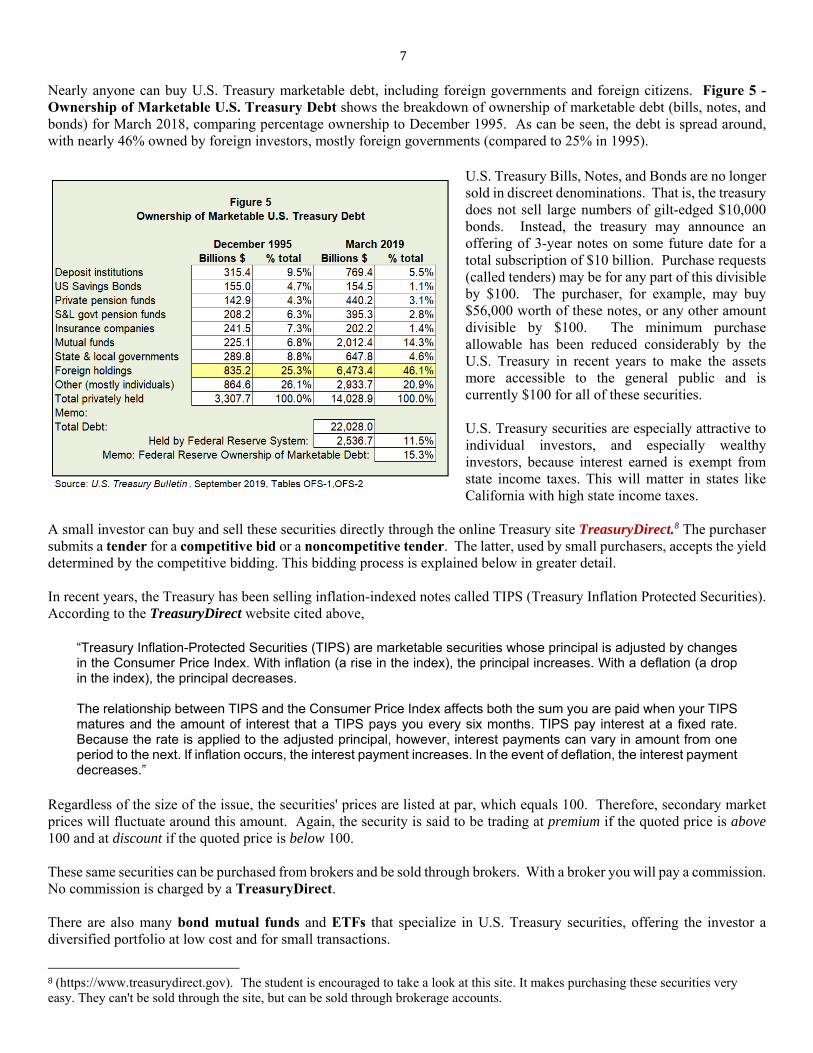
7 Nearly anyone can buy U.S. Treasury marketable debt, including foreign governments and foreign citizens. Figure 5 - Ownership of Marketable U.S. Treasury Debt shows the breakdown of ownership of marketable debt (bills, notes, and bonds) for March 2018, comparing percentage ownership to December 1995. As can be seen, the debt is spread around, with nearly 46% owned by foreign investors, mostly foreign governments (compared to 25% in 1995).
U.S. Treasury Bills, Notes, and Bonds are no longer sold in discreet denominations. That is, the treasury does not sell large numbers of gilt-edged $10,000 bonds. Instead, the treasury may announce an offering of 3-year notes on some future date for a total subscription of $10 billion. Purchase requests (called tenders) may be for any part of this divisible by $100. The purchaser, for example, may buy $56,000 worth of these notes, or any other amount divisible by $100. The minimum purchase allowable has been reduced considerably by the U.S. Treasury in recent years to make the assets more accessible to the general public and is currently $100 for all of these securities. U.S. Treasury securities are especially attractive to individual investors, and especially wealthy investors, because interest earned is exempt from state income taxes. This will matter in states like California with high state income taxes.
A small investor can buy and sell these securities directly through the online Treasury site TreasuryDirect.8 The purchaser submits a tender for a competitive bid or a noncompetitive tender. The latter, used by small purchasers, accepts the yield determined by the competitive bidding. This bidding process is explained below in greater detail. In recent years, the Treasury has been selling inflation-indexed notes called TIPS (Treasury Inflation Protected Securities). According to the TreasuryDirect website cited above,
“Treasury Inflation-Protected Securities (TIPS) are marketable securities whose principal is adjusted by changes in the Consumer Price Index. With inflation (a rise in the index), the principal increases. With a deflation (a drop in the index), the principal decreases.
The relationship between TIPS and the Consumer Price Index affects both the sum you are paid when your TIPS matures and the amount of interest that a TIPS pays you every six months. TIPS pay interest at a fixed rate. Because the rate is applied to the adjusted principal, however, interest payments can vary in amount from one period to the next. If inflation occurs, the interest payment increases. In the event of deflation, the interest payment decreases.”
Regardless of the size of the issue, the securities' prices are listed at par, which equals 100. Therefore, secondary market prices will fluctuate around this amount. Again, the security is said to be trading at premium if the quoted price is above 100 and at discount if the quoted price is below 100. These same securities can be purchased from brokers and be sold through brokers. With a broker you will pay a commission. No commission is charged by a TreasuryDirect. There are also many bond mutual funds and ETFs that specialize in U.S. Treasury securities, offering the investor a diversified portfolio at low cost and for small transactions.
8 (https://www.treasurydirect.gov). The student is encouraged to take a look at this site. It makes purchasing these securities very easy. They can't be sold through the site, but can be sold through brokerage accounts.
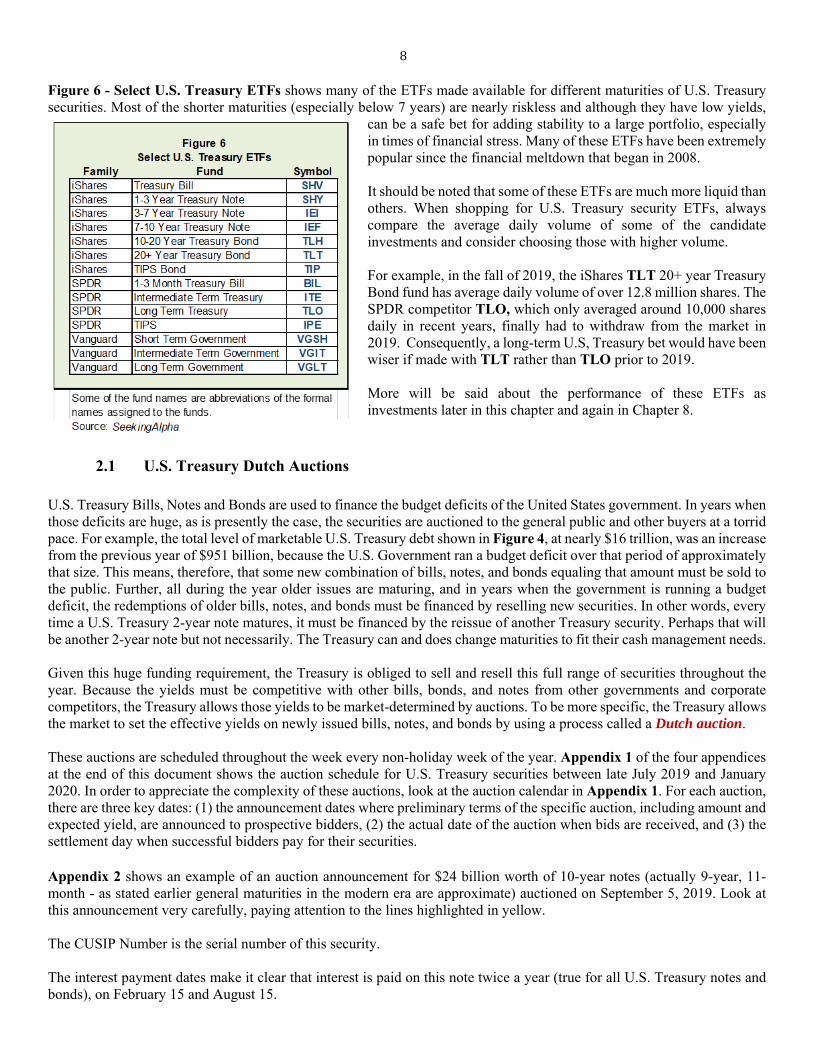
8 Figure 6 - Select U.S. Treasury ETFs shows many of the ETFs made available for different maturities of U.S. Treasury securities. Most of the shorter maturities (especially below 7 years) are nearly riskless and although they have low yields,
can be a safe bet for adding stability to a large portfolio, especially in times of financial stress. Many of these ETFs have been extremely popular since the financial meltdown that began in 2008. It should be noted that some of these ETFs are much more liquid than others. When shopping for U.S. Treasury security ETFs, always compare the average daily volume of some of the candidate investments and consider choosing those with higher volume. For example, in the fall of 2019, the iShares TLT 20+ year Treasury Bond fund has average daily volume of over 12.8 million shares. The SPDR competitor TLO, which only averaged around 10,000 shares daily in recent years, finally had to withdraw from the market in 2019. Consequently, a long-term U.S, Treasury bet would have been wiser if made with TLT rather than TLO prior to 2019. More will be said about the performance of these ETFs as investments later in this chapter and again in Chapter 8.
2.1 U.S. Treasury Dutch Auctions U.S. Treasury Bills, Notes and Bonds are used to finance the budget deficits of the United States government. In years when those deficits are huge, as is presently the case, the securities are auctioned to the general public and other buyers at a torrid pace. For example, the total level of marketable U.S. Treasury debt shown in Figure 4, at nearly $16 trillion, was an increase from the previous year of $951 billion, because the U.S. Government ran a budget deficit over that period of approximately that size. This means, therefore, that some new combination of bills, notes, and bonds equaling that amount must be sold to the public. Further, all during the year older issues are maturing, and in years when the government is running a budget deficit, the redemptions of older bills, notes, and bonds must be financed by reselling new securities. In other words, every time a U.S. Treasury 2-year note matures, it must be financed by the reissue of another Treasury security. Perhaps that will be another 2-year note but not necessarily. The Treasury can and does change maturities to fit their cash management needs. Given this huge funding requirement, the Treasury is obliged to sell and resell this full range of securities throughout the year. Because the yields must be competitive with other bills, bonds, and notes from other governments and corporate competitors, the Treasury allows those yields to be market-determined by auctions. To be more specific, the Treasury allows the market to set the effective yields on newly issued bills, notes, and bonds by using a process called a Dutch auction. These auctions are scheduled throughout the week every non-holiday week of the year. Appendix 1 of the four appendices at the end of this document shows the auction schedule for U.S. Treasury securities between late July 2019 and January 2020. In order to appreciate the complexity of these auctions, look at the auction calendar in Appendix 1. For each auction, there are three key dates: (1) the announcement dates where preliminary terms of the specific auction, including amount and expected yield, are announced to prospective bidders, (2) the actual date of the auction when bids are received, and (3) the settlement day when successful bidders pay for their securities. Appendix 2 shows an example of an auction announcement for $24 billion worth of 10-year notes (actually 9-year, 11-month - as stated earlier general maturities in the modern era are approximate) auctioned on September 5, 2019. Look at this announcement very carefully, paying attention to the lines highlighted in yellow. The CUSIP Number is the serial number of this security. The interest payment dates make it clear that interest is paid on this note twice a year (true for all U.S. Treasury notes and bonds), on February 15 and August 15.
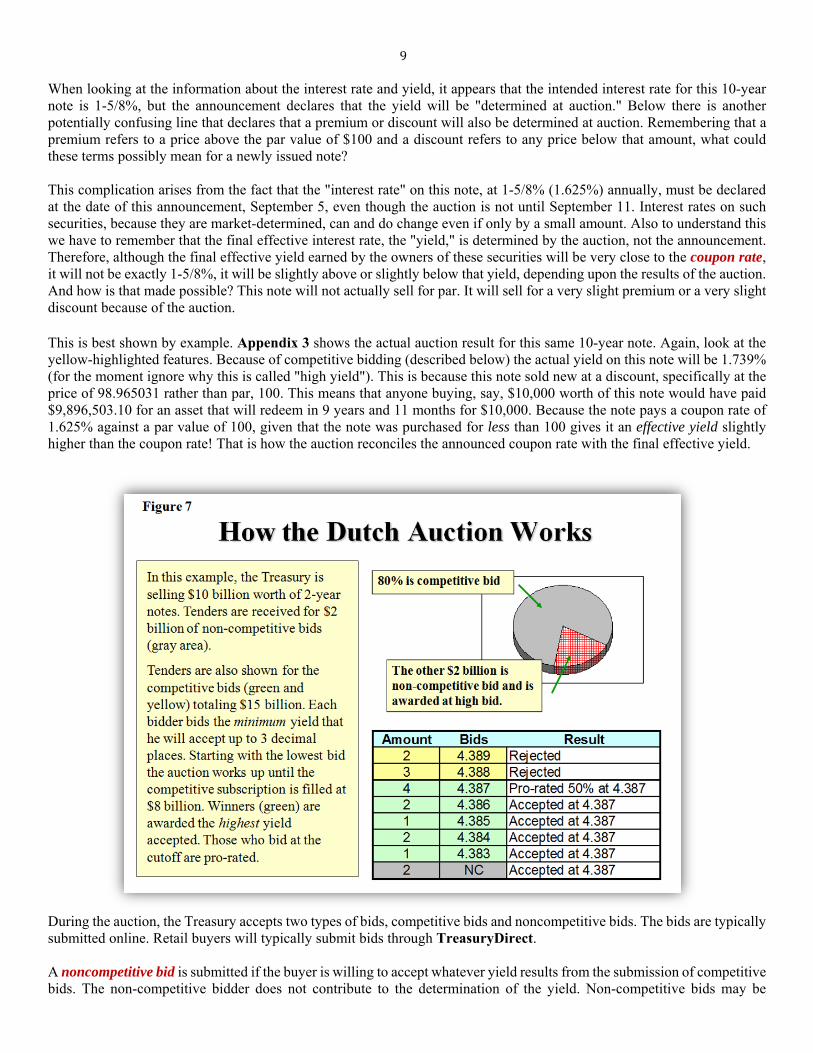
9 When looking at the information about the interest rate and yield, it appears that the intended interest rate for this 10-year note is 1-5/8%, but the announcement declares that the yield will be "determined at auction." Below there is another potentially confusing line that declares that a premium or discount will also be determined at auction. Remembering that a premium refers to a price above the par value of $100 and a discount refers to any price below that amount, what could these terms possibly mean for a newly issued note? This complication arises from the fact that the "interest rate" on this note, at 1-5/8% (1.625%) annually, must be declared at the date of this announcement, September 5, even though the auction is not until September 11. Interest rates on such securities, because they are market-determined, can and do change even if only by a small amount. Also to understand this we have to remember that the final effective interest rate, the "yield," is determined by the auction, not the announcement. Therefore, although the final effective yield earned by the owners of these securities will be very close to the coupon rate, it will not be exactly 1-5/8%, it will be slightly above or slightly below that yield, depending upon the results of the auction. And how is that made possible? This note will not actually sell for par. It will sell for a very slight premium or a very slight discount because of the auction. This is best shown by example. Appendix 3 shows the actual auction result for this same 10-year note. Again, look at the yellow-highlighted features. Because of competitive bidding (described below) the actual yield on this note will be 1.739% (for the moment ignore why this is called "high yield"). This is because this note sold new at a discount, specifically at the price of 98.965031 rather than par, 100. This means that anyone buying, say, $10,000 worth of this note would have paid $9,896,503.10 for an asset that will redeem in 9 years and 11 months for $10,000. Because the note pays a coupon rate of 1.625% against a par value of 100, given that the note was purchased for less than 100 gives it an effective yield slightly higher than the coupon rate! That is how the auction reconciles the announced coupon rate with the final effective yield.
During the auction, the Treasury accepts two types of bids, competitive bids and noncompetitive bids. The bids are typically submitted online. Retail buyers will typically submit bids through TreasuryDirect. A noncompetitive bid is submitted if the buyer is willing to accept whatever yield results from the submission of competitive bids. The non-competitive bidder does not contribute to the determination of the yield. Non-competitive bids may be
10submitted for any amount between $100 and $5 million divisible by $100. In contrast, parties submitting competitive bids specify the amount they would like to purchase (restricted to any amount between $100 and what the offering announcement specifies as the Maximum Award, which was $8.40 billion in the case of the 10-year note - see Appendix 2) and the minimum interest rate that the bidder is willing to accept, specified up to three decimal positions. For example, a competitive bid might be submitted for $2 billion at a yield of 1.822%. Looking again at Appendix 3, it can be seen that $59.122 billion in competitive bids were submitted (tendered), of which slightly less than $24 billion were accepted. Additionally, slightly more than $2.32 million in noncompetitive bids were submitted and accepted. The means by which the Dutch Auction determines the final yield, which in this case was 1.7391%, is best illustrated by a simplified example. Refer to Figure 7, which is a simplified example taken from a lecture (and is not meant to represent the actual historical example above – a higher interest rate is used for better understanding). Here the Treasury is accepting offers for $10 billion worth of 2-year notes. $2 billion dollars of noncompetitive bids have been submitted, leaving $8 billion eligible for competitive bids. The table in Figure 7 shows that $15 billion in competitive bids have been submitted (green and yellow rows) a bids ranging from a low of 4.383% to a high of 4.389%. The notes are fully subscribed at the rate of 4.387%. Any bids above that amount are rejected. Bids below that amount are accepted but the yield earned is not the yield submitted but instead the effective yield at the point the issue is fully subscribed, referred to as High Yield in Appendix 3 (1.739%), and which is 4.387% in Figure 7. This means that the noncompetitive bids and all accepted competitive bids will yield the same amount, 4.387%. Because the full amount of bids submitted at the high yield will sum to more that the subscription amount, only a certain percent of the bids submitted at the high yield will be allotted. In Figure 7, those who submitted $4 billion in bids at 4.387% will be allowed to purchase an amount equal to half of their subscription amount ($2 billion of the $4 billion). It can be seen in Appendix 3 that the amount allotted at high yield was 46.67% of bids submitted at the High Yield of 1.739%
The Dutch Auction is a fair and equitable process that clearly allows the market to set the yields paid on U.S. Treasury securities. Again, it should be remembered that because the published coupon yield (again, called merely the "interest rate" in Appendix 3) will typically be slightly different than the actual yield generated by the Dutch Auction, the security will be sold at a slight discount (if the yield is above the coupon rate) or a slight premium (if the yield is below the coupon rate). 2.2 The U.S. Treasury Yield Curve Sometimes it is instructive to see a graph of the various yields of similar YBFAs simply based upon their maturity. This mapping for U.S. Treasury securities is commonly shown in the financial media and is called the U.S. Treasury Yield Curve and in some financial textbooks is also called the Term Structure of Interests Rates. As we will see, under normal economic conditions the yields on bills, notes, and bonds that are otherwise similar will rise with longer maturities. For example, we would normally expect a 10-year note to have a higher yield than a 1-year bill. This is generally because there is more risk associated with holding a longer-term asset (a proposition here that must be accepted as intuitive, but that will be mathematically demonstrated in the next chapter) and the higher yield is compensation for the greater risk. U.S. Treasury yield curves are shown for three months in Figure 8. The graph on the left side of Figure 8, taken from an Economics 104 lecture, is meant to represent the shape and level of the full range of U.S. Treasury rates during "normal" times. January 2004 shows 1-month Treasury Bills starting with a yield below 1%, ranging all of the way up to 20-year bonds (30-year bonds were not sold by the U.S. Treasury in those years) with a yield above 5%. By March 2005 the yield curve had flattened because the Federal Reserve System was pushing up short-term rates as a preemptive anti-inflation

11move.9 The yield curve was nonetheless positive, with approximately a 2% spread between the shortest-term rate and the long term bond.
In contrast the graph on the right side of Figure 8 shows the level of U.S. Treasury rates in October, 2019. As can be seen they are lower than in 2005, but not lowest that they had ever been. Two years before, 2016, saw the lowest level of U.S. Treasury rates that had ever been recorded. For example, the one-month rate was only 0.275% in July 2016. Since that time the Federal Reserve System, the nation’s central banking authority, had followed a policy designed to push interest rates back up, perhaps closer to levels that were seen in January 2004. But the Federal Reserve System in 2019 caved into political pressure and their activity, combined with market pressure, pushed rates back down and flattened the yield curve. Only the 30-year bond rate is above 2%. Note however that the 30-year bond rate in 2019 is still much lower than the 20-year bond rate was in 2004 or 2005.
3. Federal Agency Debt Securities A full a diverse range of YBFAs classified as Federal Agency Debt Securities are sold each year by true agencies of the U.S. government, such as the Tennessee Valley Authority, and, more typically, private corporations that are classified as Government-sponsored enterprises (GSEs). A GSE is a corporation that is privately owned but chartered by the U.S. law to promote certain policy goals. Currently GSEs account for about 90% of the total debt classified as federal agency debt, and housing is by far the largest market promoted by GSE policy. Debt issued by a GSE is not legally guaranteed by the U.S. Treasury or any other branch of government as are, for example, U.S. Treasury securities. The extent to which GSEs have the backing of the government in the case of debt defaults is not clearly specified in the legislation that established the GSEs. But markets generally treat default risk for GSE debt as essentially the same for U.S. Treasury securities - there is no substantial risk because it is believed that either the U.S. Treasury or the Federal Reserve System will step in and protect any endangered GSE debt. As will be seen below, this sentiment of implied protection was enforced when certain large GSEs were kept solvent by the government after the real-estate crash that began in 2008. A good example of a GSE is the second largest (as measured by debt outstanding), the Federal National Mortgage Association (Fannie Mae or FNMA), whose charter, established in Title III of the National Housing Act of 1954 and amended many times since, created the corporation to “... establish secondary market facilities for residential mortgages ...” that would rely upon private capital markets to fund mortgages. Some emphasis was given to “... mortgages on housing for low-income and moderate-income families ...”10 In effect, Fannie Mae was created as a gigantic mortgage pool, using
9 They did not realize that inflation was the least of their problems given that the mortgage crisis would begin to take shape only a year later. 10 See the Federal National Mortgage Association Charter Act, as amended through July 21, 2010, at

12myriad designs of debt instruments to mostly fund the purchases of mortgages initially funded and sold by the private sector, including mortgages originated through private banks. Fannie Mae does not originate mortgages nor do they guarantee mortgages. They provide important liquidity to the real estate markets by buying and holding huge portfolios of mortgages. Even though it is a government-sponsored organization, Fannie Mae is a private corporation whose NYSE stock is listed
under symbol FNMA. A review of the trading history shows that this stock traded above $75 per share at the turn of the century but plunged during the housing crisis, was delisted, and now trades around $1.50 on the OTC Pink Sheets. By 2008 Fannie Mae had so many bad mortgage loans in its portfolio that if left unassisted the company would have been insolvent and its GSE debt next to worthless. But it was a GSE. To save the organization and protect its debtors, Fannie Mae and Freddie Mac (a similar GSE) were placed in conservatorship11 in 2008 by the U.S Treasury and ultimately much of the bad debt was indirectly absorbed by the Federal Reserve System through their open market operations. As part of this process Fannie Mae and Freddie Mac were forced to issue over $150 billion of preferred stock to the U.S. Treasury in order to stay afloat. This precedent established that at least in this case, the U.S. government was committed to protect the credit of a GSE. The markets understand that this precedent does not imply that the government would do this in every case in the future. http://www.fanniemae.com/resources/file/aboutus/pdf/fm-amended-charter.pdf . 11 Legally, when a person can no longer care for himself or manage his finances, a judge will appoint a person or organization (the “conservator”) to manage the estate. When it is a corporation, a court-appointed organization takes over the financial affairs of the damaged corporation.

13Figure 9 - Agency Debt., Long and Short Term (previous page) shows the list of primary borrowers for these markets with outstanding debt (as of Q2 2018) broken down by bills (less than one year) and bonds, along with a brief description of what the agency or GSE does. The total level of agency debt equaled slightly less than $1.9 trillion in the fall of 2018, with $1.4 trillion of it in the form of bonds. It is very clear that the bulk of this supports housing. It is important to understand that these numbers do not include, directly or indirectly, all forms of mortgage debt. First, the values shown represent the funding of agencies that allow them to accumulate portfolios of mortgages, so none of this is mortgage debt offered by the agency - instead it is a means of accumulating mortgage debt from other lenders. Additionally, not all mortgages are tied to this debt. As we will see, there are separate categories of mortgage-related securities called mortgage-backed securities that are not represented here. In past years, student loans were funded through a huge GSE called Sallie-Mae (the Student Loan Marketing Association). After accumulating $58.5 billion in debt by 2014, Sallie-Mae was dissolved and privatized. Perhaps this was just as well. By late 2018 student loan debt, most of which was made by or guaranteed by the U.S. Government, exceeded $1.5 trillion, ten percent of which were delinquent by 90 days or more despite generous provisions that allow the legal postponement of such debt. GSEs issue a full range of maturities. As Figure 9 below shows, a considerable amount of the debt issued are bills with maturities of less than one year, sometimes referred to as discount notes. Beyond that they issue a full range of notes and bonds ranging in maturity from one to thirty years. With one significant exception explained below, these notes and bonds are very similar to U.S. Treasury securities and are often seen as close substitutes. As do Treasuries, they pay coupon interest semi-annually. Because of the ambiguity about whether GSE debt is actually guaranteed by the U.S. Government, they trade at a yield that is typically slightly higher than the yield of a Treasury security of the same maturity. Agency securities are popular with risk-adverse large-scale institutional investors and generally share the same market as Treasury securities. There is one major difference between agency securities which will allow us here to introduce a common feature found with many bonds outside of the Treasury market. Many agency securities (along with many types of corporate bonds) are classified as callable debt. A callable bond is easy to define. A provision in the bond contract allows the issuer (the agency that sold the bond) to call in the bond - to redeem the bond - and pay off its principle value before the maturity date. A callable bond has a maturity date just like a regular bond but also has a lockout period, which is the length of time after issue before the bond can be called. For example, a “5-year agency note callable in 3 years” has a 5-maturity and a lockout period of 3 years. This means that the bond can be redeemed for its full principal value at any time after 3 years (but not before) and if not called the bond will automatically be redeemed at full principle value on the fifth anniversary of the issue. Sometimes the call provisions are complicated or have special conditions that must be met for the bond to be called. Some allow calls to be exercised only on coupon payment dates, others only on a single date, and others at any time after the lockout period (complexity and qualifications are found more in corporate bonds than agency bonds). For example, of Fannie Mae's $222.109 billion of long-term debt outstanding on August 31, 2018, $47.981 billion was callable.12 Obviously agency debt is no different than Treasury debt - when bonds mature they are replaced with new issues, sometimes with different maturities. The callable feature provides more flexibility to Fannie Mae if interest rates change (especially if they fall), effectively allowing them to refinance earlier than would otherwise be possible. Because callable bonds have this feature that benefits the issuer, a callable bond of a given maturity will have a slightly higher yield than a non-callable bond of the same maturity. Agency debt may be initially sold through any number of channels. Some agency debt is sold through Dutch Auctions just like Treasury securities. But unlike Treasury securities, some longer-dated agency debt is sold through an older, traditional process called syndication. A group of bond dealers (subsidiaries of the same large group of broker-dealers who sell stocks and ETPs) will belong to a syndicate that specializes in selling agency debt. The syndicate essentially sells the agency debt on consignment. The dealers are given a certain amount to sell and will promote the securities to their own customers while holding some for their own account, typically to be sold later. 12 Fannie Mae Funding Summary, September 28, 2018.
14Individual agency debt bonds and notes can be bought and sold online by retail investors just like Treasury securities and they are suitable investments for a diversified portfolio. It is wisest, however, to buy them in a through mutual funds or agency debt ETPs to get the benefit of diversification. Mutual funds and ETPs that blend both Treasury debt and agency debt are common and very safe. The iShares Agency Bond ETF (AGZ) is an example of a ETF consisting entirely of agency debt. On October 21, 2019, AGZ held 96 securities with a weighted average coupon yield of 2.42%. 25.50% of the portfolio was invested in Federal Home Loan Bank securities, 19.52% was in Fannie Mae securities, and so forth. Not all investments were restricted to the United States. 9.16% of the portfolio was invested in agency bonds from the State of Israel and, strangely. 6.16% was invested in agency securities from the Republic of Iraq! As an example of mixed (agency and Treasury) mutual funds, The Vanguard Group offers a family of mutual funds that combine both and are categorized according to maturity. For example, the Vanguard Long-Term Treasury Index Fund Admiral Shares (VLGSX) invests in 52 bonds, including agency bonds (despite the “Long-Term Treasury” title) with an average effective maturity of 25.4 years (on October 21, 2019). The same fund group also offers Vanguard Intermediate-Term Government Bond Index Fund Admiral Shares (VSIGX), which invests in 119 bonds with an average effective maturity of 5.7 years (on October 21, 2019).
4. Traditional Corporate Notes and Bonds and Credit Ratings
We can't go much further in this chapter without discussing credit rating agencies and the ways they rate bond credit and the impact that has upon bond pricing and yields. As suggested above, the best format for doing that is in the context of the ratings impact upon traditional corporate notes and bonds. Therefore, in this section we will introduce you to the structure of corporate notes and bonds, which are very similar to securities already discussed (they have maturities and pay coupon interest), and then will follow that with a detailed digression upon bond ratings.
4.1 Introduction to Traditional Corporate Notes and Bonds "Traditional" in this context refers to corporate bonds and notes that are simple and elementary debt instruments of the variety that we have already described, such as the Pennzoil United bond that we used as our first example at the introduction of this chapter. The traditional corporate note or bond (and from here on we will use only the word "bond") will be an elementary debt instrument that has a fixed maturity, such as two years or twenty years, a coupon rate of interest that is typically fixed but might be variable (more will be said about that later) and which pays coupon interest periodically, such as semi-annually (like U.S. Treasury securities) or quarterly. These traditional bonds may also have special features that the investor must know about, such as being callable like some agency debt, or convertible (to stock). Traditional corporate debt has a history that goes back for centuries. The newer and important non-traditional debt (in this context) includes asset-backed securities like collateralized debt obligations and mortgage-backed securities and corporate money market assets. The non-traditional debt securities are not explained here because they are very different and much more complicated than traditional corporate bonds, plus they are much less likely to be part of a retail investor's investment portfolio. Therefore, for the Economics 104 student, a discussion of non-traditional debt is included in the lecture, but not this chapter. As we saw earlier in Figure 2, there were more than $9.2 trillion outstanding of these traditional kinds of corporate notes and bonds, about 21% of all market debt in the fourth quarter of 2018. Although this market is relatively quiet, it is very large. Despite the nominal similarity between traditional corporate bonds and U.S. Treasury securities, they differ in one very significant way - corporate bonds are rated for default risk and their pricing and behavior in the market is highly dependent upon that rating. It is now time to introduce that issue.

154.2 Corporate Bond Ratings
If a borrower misses a payment on a loan, that is described in the finance markets as a default. If the missed payment is on a mortgage or an auto loan, the loan contract may classify the loan as delinquent once there is at least one missed payments. But if the missed payment is a single coupon payment on a corporate bond, that bond is technically in default. When a corporate bond is in default, it doesn't mean that all investor money is lost. Instead there will be a bankruptcy (or similar) legal filing and the allocation of the corporations remaining financial assets will be determined by a court. Although stock investors may lose everything, bond holders will likely recover some of their investment, but only after a long time, and the losses will be large. Corporations are much more vulnerable financially than the U.S. Government. When an investor buys a U.S Treasury security (and most agency securities) there is no chance of default. With a corporation however, there sometimes is. Common sense tells us that the yield that markets would expect on a newly issued bond will be highly dependent upon the probability of default and the price of the bond over time will also reflect any changes in the probability of default.
Therefore, nearly all debt assets of all kinds are rated for their default risk. These ratings are a global rather than national phenomenon. There are very many different kinds of credit ratings. Your credit rating as a consumer is reflected in your three credit scores (in the United States) maintained and released for review by the three different consumer credit agencies, Equifax, Experian, and Transunion. Sovereign national governments have their credit rated, as do state and local governments and,

16as stated in an earlier section, their muni bonds. The methods for rating credit vary considerably from one context to another. In this section of this chapter, we are reviewing specifically long-term issue credit ratings (the formal name), which is more commonly referred to as bond ratings. To be clear, this concerns itself with the ratings of notes and bonds that have a maturity of greater than one year (the ratings of money market assets are very similar but different as are ratings on mortgage assets). And long-term issue credit ratings concern themselves almost entirely with the probability of default of the asset being rated. It is an effort to inform the investor of the likelihood that the corporate bond issuer will default on a payment. Globally there are three credit rating agencies that control about 95% of the global credit rating business, Moody's, Fitch Ratings, and S&P Global Ratings (until April 2016 referred to as Standard and Poor's Ratings Services). These three agencies rate bonds by an archaic system designated by a combination of upper case and lower case letters of the alphabets between "A" and "D," supplemented with numbers in the case of Moody's and pluses and minuses in the case of Fitch Ratings and S&P Global Ratings. The methods used to derive the ratings are too detailed and complicated to describe here. It is the result of the rating system that matters. Refer to Figure 10 - Bond Ratings. This is a simplified version of the ratings done by S&P Global Ratings, along with your teacher's effort to provide an adequate simple explanation of what the rating implies. Because this is simplified and incomplete, Appendix 4 - Long-Term Issue Credit Ratings offers the more detailed and complete explanation for the ratings in addition to the use of the pluses and minuses in the ratings that are not discussed here. After completing this chapter, the student is advised to peruse Appendix 4 to appreciate the subtleties of some of these ratings. There are two important general classifications of bond debt shown by Figure 10. All debt that is rated at BBB or above is classified as Investment Grade debt and is seen as having a relatively low default risk. AAA and AA debt is seen as having essentially no default risk at all. Debt rated A is seen as having very low default risk, although it is conceded that under extremely adverse economic or commercial conditions (like a bad recession) there is a possibility of default. When we get to BBB, the bottom of the investment grade threshold, adverse economic, financial, or business conditions weaken the capacity of such a company to honor its debt commitments. Once we descend to BB ratings or less, we have entered the general class of High-yield debt (the polite term), also called Junk debt (the accurate term) and Speculative-grade debt. Looking at the interpretation we can see that the BB and B ratings describe companies that are expected to meet their coupon payments under normal conditions, but are regarded as very vulnerable under unfavorable economic, business, or financial conditions. In a few words, if a recession comes along, this company's bond debt is at great risk. CCC requires favorable business conditions to survive, whereas CC and C are regarded as nearly certain to default (with C essentially being hopeless). D has already defaulted. Clearly bond prices will be affected by these ratings!13 4.3 Bond Ratings and Default Probabilities The three ratings companies, using copious amounts of historical data, attempt to estimate the probability of default given assigned bond ratings. S&P Global Ratings, for example, estimated that of the 52 U.S. companies that defaulted on their debt in 2015, none were rated at the beginning of the year as investment grade. All were speculative grade. Since these bonds and their issuers are constantly being reassessed, common sense tells us that as a bond approaches default, before it arrives there it will have gone through a series of ratings reductions from where it started, such as BBB, to D, where it ends up when it is in default. Figure 11 shows the average cumulative default rates by ratings and by year between 1981 and 2017. Each colored line shows the probability of default by years of each bond issued originally at the rating represented by the color. The black X on the graph (not in the original) tells us that a junk bond rated B when issued has about a 27% default probability within
13 After reading this the reader might infer that U.S. Treasury securities actually are rated and simply have a AAA investment grade rating. That is almost true. S&P Global Ratings rates sovereign governments (as does the other two agencies), but S&P does not have the U.S. Government at a rating of AAA (Fitch does). Instead S&P rates the U.S. government at one rating below, AA+. In July 2016 the government of Venezuela was rated by S&P Global at CCC. That implied national bankruptcy at the first sign of adversity.

17ten years. The red X tells us that a higher rated BB bond has a 10% default probability in 7 years.14
Obviously if a bond has a maturity of only 5 years, then only the first five years on that chart are relevant for that bond. For example, a five-year BB bond has a default probability of about 8% before it matures. As can be seen, all classes of investment grade bonds have a 30-year default probability of well under 10%. They are not zero, however, and U.S. Treasury Bonds are rated with a default probability of zero. It should be noted that a bond with cashflow problems will be downgraded to reflect a higher default probability. For example, a bond issued with a long term credit rating of AA can be downgraded if problems arise. With such a downgrade the bond’s market value will fall. This is why Figure 11 shows the default probability of a bond at its original rating. When such a bond finally fails, its rating just before failure will likely be CCC. Again, the value of a defaulted bond will not plunge to zero because some assets are typically available to distribute to creditors, but the bond-holder is not very likely to receive much more than 30 or 40 cents on the dollar, and it will likely take years to realize even that. Generalizing, (a) the lower the rating and (b) the longer the maturity, the higher the probability of default. The market is supposed to take these default probabilities into account when bonds are first issued , with yields clearly being higher for lower-rated bonds given the maturity and for longer-maturity bonds given the rating.15 This would imply that if on any given day we look at a matrix of bond yields or spreads (differences in yields) based upon ratings on one axis and maturities on another, we would expect the yields (or the spreads) to be higher as ratings fell and years rose. Figure 12 shows a matrix of the full range of yield spreads above U.S. Treasury securities for all corporate ratings for all Treasury maturities between 1 year and 30 years, as measured in basis points (where one basis point equals one percent of one percent, or 100 basis points equals one percent) for March 2013. If you then look at the tip of the red arrow, the "37"
14 This graph was copied directly from S&P Global Ratings, “Default, Transition, and Recovery: 2017 Annual Global Corporate Default Study and Rating Transitions,” April 5, 2018. Anyone caring to understand bond ratings should review this detailed study. 15 We will also see in the next chapter that, given any ratings including AAA or AA, the longer the maturity the greater the probability of capital loss from rising interest rates, independent of default rates, which will explain why even long-term AAA bonds have a higher yield than shorter-term AAA bonds and notes, as was shown in Figure 8 in the discussion of the yield spread.

18there implies that the yield on a 5-year investment-grade AAA corporate note was 37 basis points (0.37%) higher than the yield of a 5-year Treasury note. The tip of the blue arrow tells us that a 10-year junk bond rated B+ yielded 385 basis points, nearly four full percentage points above the equivalent 10-year Treasury bond.
By inspection we can see that as we go from the top left part of the matrix to the bottom right the basis point numbers grow larger. This confirms our earlier sentiment that comparative yields on corporate bonds will rise with a decay in ratings (just look down the 10 yr column from top to bottom) and will rise with longer maturities (just look along the Aaa/AAA row). It also confirms that on at least this day, even AAA investment-grade corporate bonds will have a yield higher than their U.S. Treasury equivalents. In fact, in March 2013, the 30-year AAA bond was nearly a full percentage point (93 basis points) above its Treasury equivalent. These spreads, which are obviously important in bond pricing, change every moment, not to mention every day Data from 2013 are being used here because current data are very expensive
and one of the less expensive sources of data went out of business in 2017. Figure 13 (next page) shows comparative yields (not spreads) of U.S. Treasury securities and investment grade bonds for the industrial sector of all corporate bonds for August 3, 2016. As can be seen in the table at the bottom of Figure 13 some data were not available. It is very clear that the spreads are still positive and measurable, especially for the BB and B bonds16, but that yields were extremely low. For example, a typical 20-year BBB bond would have a yield barely above 4% (there aren't very many 20-year bonds in this category so data are sketchy) whereas in a normal year like 2006 lower-level investment grade bonds typically had yields above 7%, Given that long-term U.S. Treasury securities before 2007 typically had a yield much higher than 4% with no default probability, and given that according to Figure 11 our BBB bond has a default probability of nearly 5% in its first 10 years, one might infer that yields on lower-level investment grade debt may not accurately reflect risk in recent years.17
5. Municipal Bonds and Notes (Munis) Municipal bonds and notes are generally issued by state and local governments and government agencies. They consist of every conceivable maturity from short-term bills (not discussed in this chapter) to long-term bonds. Munis, as they are often called, are an indispensable source of finance for state and local governments, especially for infrastructure capital expansion projects, such as school construction or hiways. In 2018, total municipal bond market debt equaled $3.821 trillion, about 8.9% of total bonds outstanding for all categories. Nearly all of them are fixed-rate securities (the coupon rate does not change over the life of the security) with a maturity
16 We can provide no explanation for why the BB curve bows. Remember that these are fairly illiquid markets on any given day and this might even represent a measurement or posting error. 17 That subject will not be pursued in this chapter, but if you are reading this for Economics 104, this will be addressed extensively in the lectures.

19averaging about 16 years.18 To help in the investment choice, just like corporate bonds, municipal bonds are given a credit rating based upon perceptions of the bond's investment quality. The ratings can be interpreted much like they are for a corporate entity - they are based
upon estimations of default probabilities. In the case of municipal obligations, the ratings agencies evaluate the financial strength of the state and local governments who issue the bonds. Over the years these bonds have been very attractive for individual investors because of their tax status. Interest paid to the holders of qualifying munis are tax free at the federal level. In other words, no federal income taxes are paid on interest earned by a muni bond. Additionally, interest earned from munis are exempt from state income taxes if the bond was issued within the same state. For example, if a California investor buys a bond issued by the city of Los Angeles, California, that investor pays no state income taxes on interest earned on that bond. However, if the same investor buys a bond issued by the city of Chicago, Illinois, she must pay California state income tax on interest earnings on that bond, although no federal income tax.
When considering Munis as an alternative to U.S. Treasury securities or agency securities, the investor must keep in mind that state and local governments do not share the unrestricted borrowing rights enjoyed by the federal government. The right to borrow through the issue of municipal debt must first be authorized by either a legislature or voters, and then the debt repayment be formally linked to some known revenue stream. Therefore, Munis are typically classified by one of the two possible revenue streams that will allow the debt to be repaid, General Obligation Bonds or Revenue Bonds. In 2019, Revenue Bonds equaled about 60% of the value of General Obligation Bonds.19 A General Obligation Bond is secured by the general taxing power of the governmental unit, such as the capacity to assess property taxes to satisfy the obligations of a school bond (to be used to build new schools). A Revenue Bond is secured by some known revenue source linked to the project being funded. For example, a hospital bond used to finance a new municipal hospital might be secured by the fees associated with operating the hospital. A community college bond might be secured by revenues from tuition and student housing fees. Municipal bonds are normally authorized by the legislature or governing body of the government unit issuing the bond or, 18 Securities Industry and Financial Markets Association (sifma), SIFMA Fact Book, 2019. 19 Ibid.

20in some states, by ballot initiative. For example, a bond authorization initiative called the California Public Education Facilities Bond Initiative (2016) qualified for the November 8, 2016 ballot. A "yes" vote allowed the State of California to issue $9 billion in a mix of municipal bonds "to fund improvement and construction of school facilities for K-12 schools and community colleges."20 The proceeds of the bonds were allocated for the following purposes:
$3 billion for the construction of new school facilities; $500 million for providing school facilities for charter schools; $3 billion for the modernization of school facilities; $500 million for providing facilities for career technical education programs; and $2 billion for acquiring, constructing, renovating, and equipping community college facilities.
A good example (more or less randomly selected) of a premium grade small municipal bond might be the Williamson County Texas Unlimited Road Tax Road Bonds Series 2007 (CUSIP: 969887UH9), which has a maturity date of February 15, 2032, a coupon rate of 4.75% with interest paid semi-annually, rated AAA, which was issued in the amount of $50,640,000 on September 1, 2007 (making it more or less a 25-year bond), the proceeds of which were to be used to purchase, maintain, and improve roads in Williamson County, Texas. The bond had been authorized as a general obligation bond (meaning it is secured by taxes) by voters from Williamson County on November 7, 2006. The bond was fairly illiquid (as many municipal bonds are) and hasn't recently traded.21
There are tens-of-thousands of municipal bonds in circulation ranging from the really large proposed California school bond issue to the tiny (and somewhat illiquid) tiny Texas road bonds. The complexity of these bonds should warn the small retail investor that perhaps individual purchases of these assets should be avoided. Who has the time to research all of these details?
Of course there is a cottage business of investment advisors and, now, web sites that specialize in researching, finding, and promoting interesting muni issues, but there the investor may run into a potential conflict of interest. Is a muni being promoted because it is truly right for you as an investor, or because fees are being paid to promote the issue so it can find adequate liquidity?
6. Asset Backed Securities (ABS) When you use a credit card with the name of a bank written on it, you might be inclined to think that your bank is funding your credit by using the deposit cash of other customers of the bank. And that is typically the arrangement. But it is also possible that the bank's name on your credit card is little more than a marketing ploy because the bank is content to be paid service fees for processing the loan but is not funding the loan. That is a rather common practice in the modern era. The implicit loan represented by the balance on your credit card in the recent past might be funded by an Asset Backed Security or ABS. In addition to your credit card, other consumer loans like auto loans and leases (from a financial point of view, a lease is a special kind of loan), installment loans for home improvement and solar power, and even student loans were funded by Asset Backed Securities. ABSs are pooled assets, typically representing thousands of small credit card accounts (or auto loans and leases and similar consumer loans, but here we will use credit cards as the example). Credit card loans originate when the credit card is used, so credit card loans can be thought as very fluid. Cashflow from interest and principle payments are somewhat unpredictable, which, as we will see, will complicate investor payouts. In comparison, the planned payback of a corporate note is settled in advance. So any consolidated financial asset will have to overcome the uncertainty of the cashflow that will accrue to investors. Refer to Figure 14, which shows the hypothetical structure of an ABS. Typically the ABS is consolidated by a single lender, which may be a large bank or non-bank lender. That lender (which in Figure 14 is referred to as the “Seller” and is
20 Ballotpedia, California Public Education Facilities Bond Initiative (2016), as of June 6, 2016. 21 This bond was cited by example at MuncipalBonds.com on June 6, 2016. Realizing that there are thousands of bonds like this, one can see why it is important to know and remember the CUSIP number of any issued bond.

21represented by the green box) will have funded tens of thousands of credit cards and will have consolidated the fluid loans represented into a single investment pool often called something like an Issuance Master Trust, represented by the blue box in Figure 14. In turn, that trust will issue a series of conventional interest-bearing notes, each paying a monthly interest payment (rather than quarterly or semi-annual interest payment) with the longest maturity being no greater than five years. Like traditional corporate notes, the notes pay only interest until redemption, and the full principal balance is paid at
maturity. The notes will also be issued in multiple credit ratings, with the bulk rated at AAA, but also subordinated notes issued at lower ratings, like AA and BB. The notes will often have a fixed rate of interest, like 4.2% annually for the AAA and higher for the subordinated notes, but also may pay variable interest. These notes are sold to investors. The majority of investors are large institutional investors like pension funds and life insurance companies. The credit card consolidator (the original lender) will also hold a minority stake in the trust, represented as “Seller interest” in Figure 14. The ABS has a life of about five years. Typically, for the first year, only credit card interest payments are passed into the trust to be paid out as interest on the investor notes. Any principal redemption is used to purchase new credit card accounts receivable to maintain the full principal value of the trust. It is anticipated in all years that cashflow from credit card payments will exceed the interest obligations owed on the notes, allowing for a surplus that accumulates over the life of the trust. As the notes approach maturity, remembering that their full principal value must be redeemed at maturity (again, like traditional corporate notes and bonds, they earn interest only before maturity), the interest surplus and any principal redemption from credit cards after the first year (i.e. when a credit card user pays off the full balance of the card) accumulates for the purpose of the final redemption of the notes. The complicated structure of the ABS raises some interesting questions. For example, we know that in the case of credit card debt, the cardholder is allowed to make a payment of nearly any size when the monthly bill comes due, ranging from a small minimum (sometimes zero) to the full balance of the amount owed on the credit card. So the amount of cash flowing into the debt pool from the thousands of borrowers represented by the

22pool is highly variable and unpredictable. Given that, how is the Issuance Master Trust able to guarantee monthly interest payments to the note holders? Equally important, given that all of the notes issued by the Issuance Master Trust are secured by one source of collateral, tens of thousands of credit card accounts (each of them having a potentially different risk profile), how is the trust able to meet the high credit standards necessary for the AAA notes? One might guess that the AAA notes are secured by the highest-quality individual credit card accounts in the portfolio (such as credit cards held by households with credit scores about 760), but that would be incorrect. The collateral is treated as an aggregate pool, with no internal distinctions made for credit quality of the individual loans. Instead, the trust employs a complicated legal and financial device called a shared credit enhancement series to justify the credit ratings of the individual notes. Such a series is able to issue AAA-rated notes so long as the same series issues a certain number of notes with lower ratings. The notes with lower rating are intended as a buffer designed to take losses from cashflow deficiencies arising from problems with default and late payments from troubled credit cards in the portfolio. If, for example, cashflow from credit card payments are not adequate to pay all interest payments on all notes in the trust, investors in the subordinated lowest-rated notes will absorb all of the loss, protecting the cash needed for the monthly payout of the AAA notes and preserving their rating. For example, suppose the notes have a fixed annual rate of 4.2% for the AAA notes, 5.4% for the AA notes, and 6.5% for the BB notes. In a typical month, interest payments from the credit card portfolio are supposed to be more than adequate for covering all three of the monthly payments for the notes issued by the trust. But suppose over a bad period of recession, credit card delinquencies and defaults rise above expected levels and a cashflow shortage arises. There is simply not enough cash to cover all interest obligations. In such a case the AAA notes are not threatened. Full payments will still be made to the holders of the AAA notes. But the holders of the BB notes and possibly in the most extreme cases the AA notes will not receive full payment of interest until such time as cashflow is restored. This clever legal arrangement of the shared credit enhancement series is what allows for the issue of the AAA notes, which, of course, are popular with conservative institutional investors like pension funds. It should be noted, though, that this design of shared credit enhancement has not always withstood the test of time. Many consolidated mortgage pools were built with the same structure prior to the collapse of the real estate markets in 2008, and delinquency rates for mortgages were so high that the subordinated notes and bonds were unable to protect the AAA notes and bonds at the top of these pools, resulting in high failure rates for AAA-rated mortgage bonds. AAA bonds and notes are not supposed to ever fail, so this triggered off a financial catastrophe. Those mortgage pools and their failure won’t be discussed in more detail in this chapter. We return to that story in the real estate chapter of this book. Asset Backed Securities employing shared credit enhancement features have seen their market share plunge in recent years. They are essentially being regulated out of existence. After the mortgage market collapse in 2008, the Financial Accounting Standards Board (FASB), an organization that sets financial accounting standards, attributed some of the cause of the collapse to the fact that banks were carrying some of their loan portfolios “off their books” as separate “special purpose” financial entities, allowing them to escape regulatory scrutiny and understating their risk. Asset Backed Securities were included in the list of “special purpose” financial assets. In June, 2019, the FASB issued FASB 166/167 heavily regulating the use of such assets, which reduced their attractiveness to banks.22 Given their reduced importance, the design of Asset Backed Securities is discussed in this chapter primarily for the purpose of introducing the reader to the shared credit enhancement concept, which is at the foundation of these complicated assets. As suggested above, that story looms large in recent real estate history, a topic that will be revisited later in this book.
22 “What Banks Need to know: Understanding the Impact of FASB 166 and FASB 167 on Securities and Assets,” MBAF, July 1, 2009, https://mbafcpa.com/advisories/banks-need-know-understanding-impact-fasb-166-fasb-167-securitizations-assets/
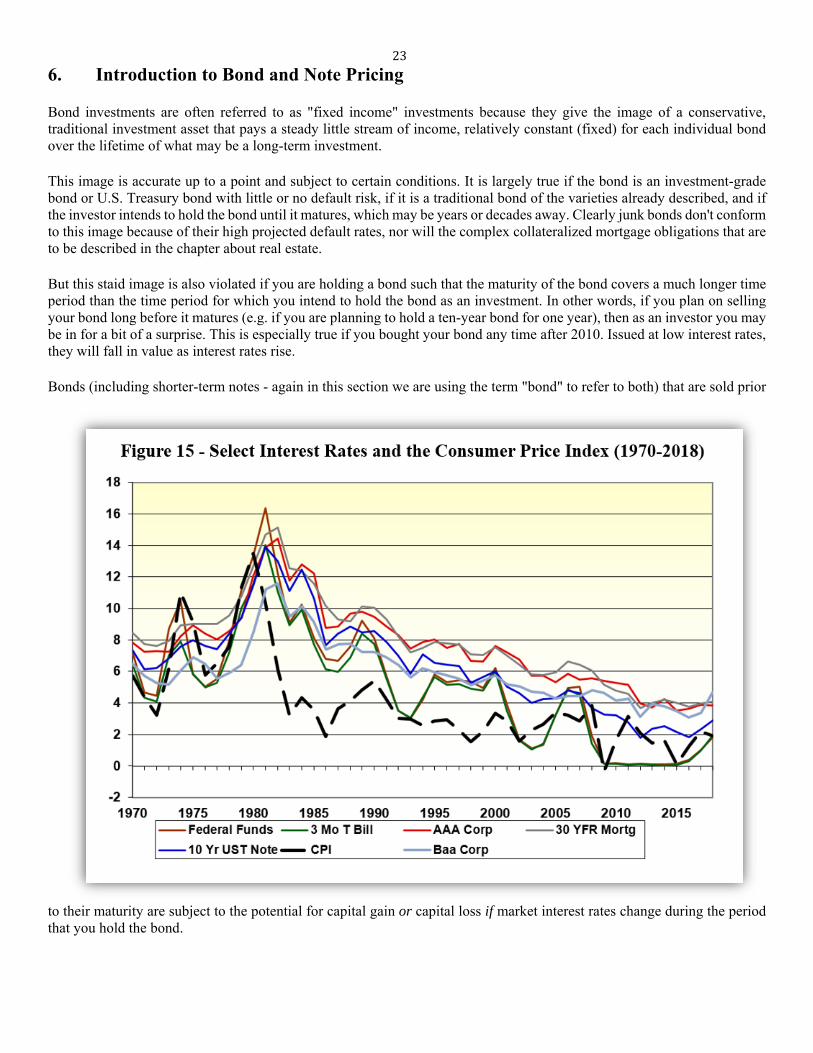
23
6. Introduction to Bond and Note Pricing
Bond investments are often referred to as "fixed income" investments because they give the image of a conservative, traditional investment asset that pays a steady little stream of income, relatively constant (fixed) for each individual bond over the lifetime of what may be a long-term investment.
This image is accurate up to a point and subject to certain conditions. It is largely true if the bond is an investment-grade bond or U.S. Treasury bond with little or no default risk, if it is a traditional bond of the varieties already described, and if the investor intends to hold the bond until it matures, which may be years or decades away. Clearly junk bonds don't conform to this image because of their high projected default rates, nor will the complex collateralized mortgage obligations that are to be described in the chapter about real estate.
But this staid image is also violated if you are holding a bond such that the maturity of the bond covers a much longer time period than the time period for which you intend to hold the bond as an investment. In other words, if you plan on selling your bond long before it matures (e.g. if you are planning to hold a ten-year bond for one year), then as an investor you may be in for a bit of a surprise. This is especially true if you bought your bond any time after 2010. Issued at low interest rates, they will fall in value as interest rates rise.
Bonds (including shorter-term notes - again in this section we are using the term "bond" to refer to both) that are sold prior
to their maturity are subject to the potential for capital gain or capital loss if market interest rates change during the period that you hold the bond.

24Generally speaking, bond market values respond inversely to interest rates. When market interest rates rise, bond market values fall, and when interest rates fall, bond values rise. Additionally, the longer the maturity of the bond (or the longer the span of time between the present and when the bond matures), the greater the sensitivity of the bond price to the interest rate movement. Given any interest rate rise, a bond with 20 years remaining until maturity will suffer a much greater percentage capital loss than a note with only 5 years remaining until maturity.
This condition does not depend upon the risk profile of the bond in question. This is just as true for default-free U.S. Treasury securities as it is for junk bonds.
What interest rates are we describing as rising or falling? When referring to a specific bond, competitive interest rates might refer to the market yields on other bonds that have similar risk profiles and roughly the same time to maturity. Consider that if you are an investor and you are in the market for corporate bonds with at least a AA rating and a maturity of at least 5 years, you will find hundreds if not thousands of candidates. From another perspective, suppose you have a target interest rate that you would like to earn for a portion of your portfolio, you may discover a very large selection of bonds that involve trading a rating for a maturity, such as an A-rated bond for 5 years versus a AA-rated bond for 10 years.
Also keep in mind that interest rates for all yield-bearing assets tend to rise and fall together over time. There will always be a spread of rates based upon risk and maturity, but the spreads will generally rise and fall together. When interest rates are rising they are all rising (maybe with some exceptions). Figure 15 shows a selection of interest rates including two Treasury rates, two corporate rates, the 30-year fixed mortgage rate, the Federal Reserve System target rate (Federal Funds) and the consumer price index (CPI), which generally shows that interest rates are correlated with each other but also to
inflation to a great extent. Although spreads widen and contract sometimes, these rates are loosely moving together. Therefore, little is lost in the generalization that "when interest rates rise, bond values fall."
So why does a bond's market value fall if interest rates rise?
To understand this, it helps to remember that, just like stocks, bonds are sold on the secondary market and even though they are issued at par (100) and will likely be redeemed at par their price can fluctuate considerably in between.
Let us start with an example. Suppose you had purchased a 30-year bond that yielded 3% interest when issued. The bond therefore pays $3 interest annually per par. You bought this bond in a $10,000 denomination, and that would pay $300.
Suppose 10 years later you want to sell the bond. You realize that to the buyer this bond will be the exact equivalent of a newly issued 20-year bond. Your bond will pay 20 years of interest of $300. But suppose also over the last ten years that interest rates have risen such that a new 20-year bond will pay 6% interest annually. A $10,000 denomination of a new 20-year bond will pay $600 per year.
Given this, can you sell your bond on the secondary market at par, for $10,000?

25Obviously not. Who would pay $10,000 to buy a bond yielding $300 annually for the next 20 years when they can buy a new bond that pays $600 annually?
Given that, can you sell your bond at any price?
Of course. You can sell your bond for approximately half of what you paid for it because at that price it is going to yield about 6%, a competitive rate (i.e. $5,000/$300 = 6%).
Figure 16 shows a hypothetical relationship more clearly. That image, taken from a lecture, shows the possible values of a 30-year bond that had been issued with an 8% coupon (8% interest per year) after 10 years had passed, showing various interest rates for a competitive 20-year bonds.
As can be seen, if interest rates remain unchanged, the original bond is still at par. But if interest rates have dropped, then the bond will be trading at a premium, above par and possibly well above par. On the other hand, if they have risen, the bond will be trading at discount, as it was in the example above.
The precise formula which will determine what your old bond will be worth in a new market with changed interest rates is introduced and explained in the next chapter. In fact, it is the only subject that is discussed on the next chapter. It turns out that the math is detailed and requires a lot of explanation. It is clear from this example, though, that there will be an inverse relationship.
All of this implies that bonds can generate sizable capital gains or capital losses if interest rates change from the range of rates that were in place when the bond was first issued.
We return to this important issue in the next chapter.
7. Bonds and Notes as Investment Assets
As might be guessed, bonds (again, using our shortcut term for both bonds and notes) play a sizeable role in portfolio allocation, and does so for all categories of investment strategies, from small personal portfolios, to retirement accounts, to enormous investment accounts like college endowments and defined pension plans. Bonds as an investment category are second in relevance only to stocks and sometimes not even that. Some portfolios with a low appetite for risk will strongly emphasize bonds over stocks.
Bonds generally are regarded as safer than stocks. Adding them to a portfolio at the expense of stocks is seen as a way of reducing the general risk of that portfolio. Stocks pay dividends (or at least some do) and bonds pay interest, but the real issue is whether bonds are likely to suffer capital losses during tough times, as we know stocks are inclined to do.
Bonds of high quality can provide a very stable and reliable flow of cash to conservative investment accounts. The Beinecke Rare Book and Manuscript Library owns a perpetuity bond (a bond that promises to pay interest forever) issued by a Dutch water company in 1648 for the purpose of financing dike improvements. This ancient bond, shown in Figure 17, still pays interest to the library.23
7.1 Qualifications to perceptions of bond safety
The conventional wisdom that bonds are safe is generally valid, but given what we have learned so far in this chapter, we know that we have to qualify notions that we might have about the relative safety of bonds in three ways:
1. Because bond values will fall in value during a period of rising interest rates, bonds can indeed suffer capital losses just like stocks. Additionally, the longer the maturity of the bond in question, the greater the percentage of capital loss given any interest rate increase.
23 Mike Cummings, “A Living Artifact from the Dutch Golden Age: Yale’s 367-year-old water bond still pays interest,” Yale News, Sept. 22, 2015.

262. Some bonds are a lot safer than others. Junk bonds have a much higher degree of default risk than do investment
grade bonds and they in turn are less safe than U.S. Treasury securities. 3. Bonds are less liquid than stocks (by a huge measure) and may therefore be difficult to sell during times of crisis or
when liquidity is needed (such as during a margin call).
All of this implies that simply adding bonds to a portfolio without consideration for the type of bond and the general direction of interest rates might actually increase the risk of the portfolio rather than reduce it.
As a rule of thumb, your teacher, who may be in a small minority about this matter, insists that you can be sure that you are reducing the risk of a portfolio, like your retirement portfolio, only if you are adding U.S. Treasury securities with (remaining) maturities of less than five years. Longer maturities are allowable only you are sure than interest rates are stable or falling (if falling, then longer maturities are advisable).
For the bond portion of a portfolio to earn a positive real yield, the portfolio would have to shift out in maturity and to some degree down the default risk scale.
Does your conservative (on this front) teacher think that investment grade assets are suitable for the low-risk side of the portfolio? Certainly almost all investment advisors think the answer is “yes,” and your teacher concedes that, logically, the other advisors are not really wrong. So does your teacher allow investment grade bonds into his own retirement portfolio?
No. The low-risk side of the portfolio must be counted on to represent preservation of capital in all possible economic environments, so in his portfolio the low-risk component is represented exclusively by U.S. Treasury securities, and at times when interest rates might rise, only with maturities of five years or less. Safety is safety, and if at times that means no yield, then so be it.
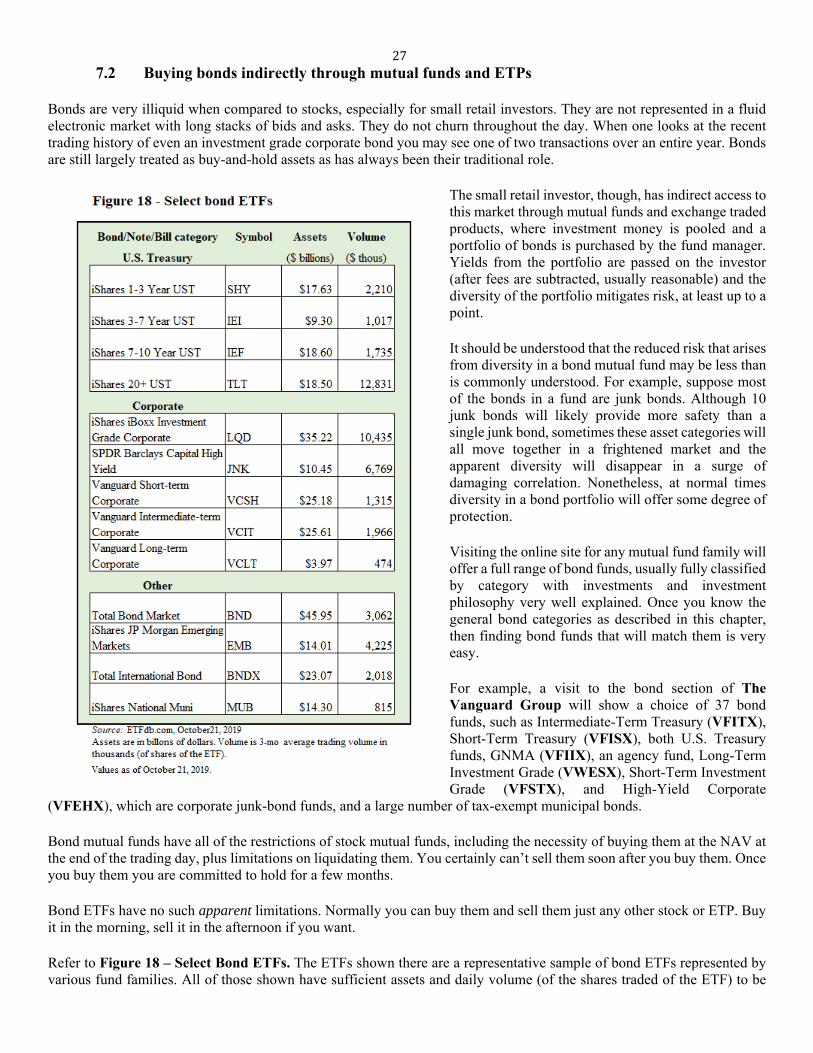
27 7.2 Buying bonds indirectly through mutual funds and ETPs
Bonds are very illiquid when compared to stocks, especially for small retail investors. They are not represented in a fluid electronic market with long stacks of bids and asks. They do not churn throughout the day. When one looks at the recent trading history of even an investment grade corporate bond you may see one of two transactions over an entire year. Bonds are still largely treated as buy-and-hold assets as has always been their traditional role.
The small retail investor, though, has indirect access to this market through mutual funds and exchange traded products, where investment money is pooled and a portfolio of bonds is purchased by the fund manager. Yields from the portfolio are passed on the investor (after fees are subtracted, usually reasonable) and the diversity of the portfolio mitigates risk, at least up to a point.
It should be understood that the reduced risk that arises from diversity in a bond mutual fund may be less than is commonly understood. For example, suppose most of the bonds in a fund are junk bonds. Although 10 junk bonds will likely provide more safety than a single junk bond, sometimes these asset categories will all move together in a frightened market and the apparent diversity will disappear in a surge of damaging correlation. Nonetheless, at normal times diversity in a bond portfolio will offer some degree of protection.
Visiting the online site for any mutual fund family will offer a full range of bond funds, usually fully classified by category with investments and investment philosophy very well explained. Once you know the general bond categories as described in this chapter, then finding bond funds that will match them is very easy.
For example, a visit to the bond section of The Vanguard Group will show a choice of 37 bond funds, such as Intermediate-Term Treasury (VFITX), Short-Term Treasury (VFISX), both U.S. Treasury funds, GNMA (VFIIX), an agency fund, Long-Term Investment Grade (VWESX), Short-Term Investment Grade (VFSTX), and High-Yield Corporate
(VFEHX), which are corporate junk-bond funds, and a large number of tax-exempt municipal bonds.
Bond mutual funds have all of the restrictions of stock mutual funds, including the necessity of buying them at the NAV at the end of the trading day, plus limitations on liquidating them. You certainly can’t sell them soon after you buy them. Once you buy them you are committed to hold for a few months.
Bond ETFs have no such apparent limitations. Normally you can buy them and sell them just any other stock or ETP. Buy it in the morning, sell it in the afternoon if you want.
Refer to Figure 18 – Select Bond ETFs. The ETFs shown there are a representative sample of bond ETFs represented by various fund families. All of those shown have sufficient assets and daily volume (of the shares traded of the ETF) to be

28liquid during normal times, an important issue when buying and selling ETFs.24 For example, LQD, the popular iShares iBoxx Investment Grade Corporate ETF holds $35 billion in investment-grade corporate bonds and average daily trades exceed 10.4 million shares. Note that trading in the junk-bond ETF is the highest on the page (and the highest among bonds when this data were collected).
The top four ETFs shown include some safe and sanguine U.S. Treasury portfolios arranged by maturity, all of which have respectable levels of assets and ample trade volume. These are generally suitable for the most risk-adverse investors and are not likely to be threatened even in the most severe market panic. It should be remembered though that TLT, the iShares
20+ U.S. Treasury Bond ETF could suffer sizeable capital losses in a rising interest rate environment.
Interest that is earned by bond ETFs are distributed through interest distributions to the shareholder, usually once per month. The interest distribution shows up as a cash credit (cash addition) in the shareholder’s brokerage account. Therefore, interest earned does not contribute to capital gains in the value of the bond. Figure 19 shows the interest distributions per share for the investment grade corporate bond fund offered by iShares (LQD) for select months in 2019. Although the bonds in this ETF pay interest only semi-annually or quarterly, because of the huge size of the portfolio (LQD held more than 2,000 bonds in 2019) with a full range of maturity dates, the fund can issue monthly distributions.
Data from Figure 19 makes it possible to calculate the effective yield on this ETF. On October 1, 2018, LQD closed at 127.29. The interest rate paid on that day implies annual rate of return of 3.1%:25
(0.335557 X 12) / 127.29 = 0.03163
Given that there are large numbers of bond ETFs offered in every category of bonds, the retail investor should avoid bond ETFs that do not offer adequate trading volume, and market volume is hugely concentrated in only the top few funds. For example, in October 2018, of the approximately 350 bond funds listed on ETFdb, only 24 of them
traded more than 1 million shares per day at a time when two junk-bond funds (HYG) and (JNK) traded more than 25 million shares per day together. The lack of trading volume could introduce serious liquidity problems in times of stress.
For that reason, your teacher advises against trading bond ETFs if they average less than 100,000 shares traded per day.
It was stated above that, unlike mutual funds for bonds, these ETFs can trade with no apparent restrictions. It should be understood though that because the core assets in these funds themselves are relatively illiquid even in the best of times, and would be completely illiquid during a market panic, retail investors might discover that trading privileges would be suspended during a serious downturn in the market (which would normally happen in a rising-interest-rate environment). If there is a major attempt to sell off the ETF shares and the fund cannot liquidate its portfolio of bonds to fund redeemed shares, then the fund family has the right to suspend trading and will do so. So these funds are typically liquid except when liquidity is in greatest demand.
It is for this reason that the prospectus for any bond ETF will typically have warnings with this kind of language in the risk section of the prospectus,
24 These examples were taken from the excellent online source ETFdb.com, which is highly recommended as a source for data about ETPs in general and certainly bond ETFs (bond ETPs are almost always pure ETFs, which is to say that they hold bonds as collateral). 25 This same etf at the same time last year, even though it paid a slightly smaller dividend, had a higher yield of 3.7%. That is because the popularity of the bond etf had bid up the price, lowering the dividend yield. Of course the investor investing in 2018 is still earning 3.7%.

29“… Fund shares may be more likely to trade at a premium or discount to NAV and possibly face trading halts and/or delisting.” 26
8. Categorical Summary of Bond and Note Risk and the Connection to Pricing
Bond textbooks often begin with a categorical listing of all of the risks associated with owning bonds. Here we have taken the approach of gradually describing why bonds behave as they do and why they are priced as they are, and now will use that information to summarize the risks from what we have learned.
Here are the three categories of risk that we can define from our examples above:
1. Default risk – Peculiar to most bonds and notes, but not U.S. Treasury securities, this reflects that the debt contract implied by the bond may not be honored. If a single coupon payment is missed, the bond is technically in default and the market value of the bond should plunge. Default risk is reflecting in the formal ratings of these bonds, as discussed in section 4.3. Clearly, the higher the default risk, the higher the yield of the bond for any given maturity.
2. Interest rate risk (sometimes called market risk) – This risk reflects that fact that investors will suffer capital losses on their bond assets in an environment of rising interest rates. Further, the longer the maturity the greater the loss for any given interest rate increase, and the greater the interest rate increase, the greater the capital loss at any maturity. No yield-bearing financial asset is exempt from this risk, including U.S. Treasury securities. If interest rates rise, a 30-year U.S. Treasury bond will fall in value just as much as a 30-year investment grade corporate bond.
3. Liquidity risk – This risk reflects the reality that the bond markets are relatively illiquid even in the best of times and might prove to be completely illiquid in times of crises. Such illiquidity could severely deflate the value of a bond in a crisis. This special risk is also extended to bond mutual funds and especially bond ETFs, as was discussed in section 7.2. Not only is it the case that bonds may not find a market in a crisis, it is also true that ETFs holding bonds as collateral may also fail to find a market.
It should be obvious that if bonds face these risks, then so do the mutual funds and ETFs that represent bonds.
If a single bond defaults in a high-yield bond ETF (an inevitable event) then the damage is mitigated by the fact than many bonds are held. But if defaults become widespread among junk bonds, then the 6% and 7% interest that these bonds were earning in 2019 will not be enough to offset the enormous capital losses of bunds plunging to a fraction of par.
Likewise, if interest rates rise, given that all bonds are exposed to interest rate risk, all bond mutual fund NAVs and bond ETF market values will fall to reflect the capital losses in the portfolio. There is no avoiding that.
This chapter began by warning that bonds, although generally safer than stocks, are not so safe as the mild term “fixed income” seems to imply. Bonds can be hazardous terrain for investing, just like stocks, and that is no less true when investing indirectly in bond mutual funds and ETFs.
There are two rules of thumb that the retail investor would be smart to remember:
1. When in doubt about risk, flee to U.S. Treasury securities, or mutual funds or ETFs that hold only U.S. Treasury securities.
26 A segment from the Authorized Participant Concentration Risk portion of the iShares iBoxx High-Yield Corporate Bond (HYG) Prospectus, July 1, 2016. The term “trading halt” means that there is no market for buying or selling this asset as long as the “halt” is in effect.

302. If there is a chance that interest rates are going to rise, especially quickly and appreciably, within the U.S. Treasury
yield spectrum, flee from long-term to mid-term and short-term, or even just short-term Treasuries. No yield will be found there, but safety will.
9. Precision Bond Pricing
Section 7 of this chapter introduced the proposition that bond values in the secondary market move inversely to interest rates. That is no small matter during periods of changing rates. Not much was explained, though, about how much bond values change in response to rising or falling interest rates.
The entire next chapter is dedicated to explaining that relationship mathematically, which is ultimately how it must be explained to be properly understood. The chapter requires an advanced knowledge of algebra and the ability to read algebraic expressions. Readers who do not have an adequate background in mathematics may skip the chapter, content to understand that, in the least, there is an inverse relationship. Readers who want to see precisely how the relationship is determined must attempt to understand the chapter.
© 2019, Gary Evans. This work is licensed under the Creative Commons Attribution-NonCommercial 4.0 International License. To view a copy of this license, visit http://creativecommons.org/licenses/by-nc/4.0/ or send a letter to Creative Commons, PO Box 1866, Mountain View, CA 94042, USA.

Tentative Auction Schedule of U.S. Treasury Securities
Security Type Announcement Date Auction Date Settlement Date3-Year NOTE Wednesday, July 31, 2019 Tuesday, August 06, 2019 Thursday, August 15, 2019
10-Year NOTE Wednesday, July 31, 2019 Wednesday, August 07, 2019 Thursday, August 15, 2019
30-Year BOND Wednesday, July 31, 2019 Thursday, August 08, 2019 Thursday, August 15, 2019
13-Week BILL Thursday, August 01, 2019 Monday, August 05, 2019 Thursday, August 08, 2019
26-Week BILL Thursday, August 01, 2019 Monday, August 05, 2019 Thursday, August 08, 2019
4-Week BILL Tuesday, August 06, 2019 Thursday, August 08, 2019 Tuesday, August 13, 2019
8-Week BILL Tuesday, August 06, 2019 Thursday, August 08, 2019 Tuesday, August 13, 2019
13-Week BILL Thursday, August 08, 2019 Monday, August 12, 2019 Thursday, August 15, 2019
26-Week BILL Thursday, August 08, 2019 Monday, August 12, 2019 Thursday, August 15, 2019
52-Week BILL Thursday, August 08, 2019 Tuesday, August 13, 2019 Thursday, August 15, 2019
4-Week BILL Tuesday, August 13, 2019 Thursday, August 15, 2019 Tuesday, August 20, 2019
8-Week BILL Tuesday, August 13, 2019 Thursday, August 15, 2019 Tuesday, August 20, 2019
13-Week BILL Thursday, August 15, 2019 Monday, August 19, 2019 Thursday, August 22, 2019
26-Week BILL Thursday, August 15, 2019 Monday, August 19, 2019 Thursday, August 22, 2019
30-Year TIPS R T Thursday, August 15, 2019 Thursday, August 22, 2019 Friday, August 30, 2019
4-Week BILL Tuesday, August 20, 2019 Thursday, August 22, 2019 Tuesday, August 27, 2019
8-Week BILL Tuesday, August 20, 2019 Thursday, August 22, 2019 Tuesday, August 27, 2019
13-Week BILL Thursday, August 22, 2019 Monday, August 26, 2019 Thursday, August 29, 2019
26-Week BILL Thursday, August 22, 2019 Monday, August 26, 2019 Thursday, August 29, 2019
2-Year FRN R Thursday, August 22, 2019 Wednesday, August 28, 2019 Friday, August 30, 2019
2-Year NOTE Thursday, August 22, 2019 Tuesday, August 27, 2019 Tuesday, September 03, 2019
5-Year NOTE Thursday, August 22, 2019 Wednesday, August 28, 2019 Tuesday, September 03, 2019
7-Year NOTE Thursday, August 22, 2019 Thursday, August 29, 2019 Tuesday, September 03, 2019
4-Week BILL Tuesday, August 27, 2019 Thursday, August 29, 2019 Tuesday, September 03, 2019
8-Week BILL Tuesday, August 27, 2019 Thursday, August 29, 2019 Tuesday, September 03, 2019
13-Week BILL Thursday, August 29, 2019 Tuesday, September 03, 2019 Thursday, September 05, 2019
26-Week BILL Thursday, August 29, 2019 Tuesday, September 03, 2019 Thursday, September 05, 2019
Holiday - Monday, September 02, 2019 - Labor Day
4-Week BILL Tuesday, September 03, 2019 Thursday, September 05, 2019 Tuesday, September 10, 2019
8-Week BILL Tuesday, September 03, 2019 Thursday, September 05, 2019 Tuesday, September 10, 2019
13-Week BILL Thursday, September 05, 2019 Monday, September 09, 2019 Thursday, September 12, 2019
26-Week BILL Thursday, September 05, 2019 Monday, September 09, 2019 Thursday, September 12, 2019
52-Week BILL Thursday, September 05, 2019 Tuesday, September 10, 2019 Thursday, September 12, 2019
3-Year NOTE Thursday, September 05, 2019 Tuesday, September 10, 2019 Monday, September 16, 2019
10-Year NOTE R Thursday, September 05, 2019 Wednesday, September 11, 2019 Monday, September 16, 2019
30-Year BOND R Thursday, September 05, 2019 Thursday, September 12, 2019 Monday, September 16, 2019
4-Week BILL Tuesday, September 10, 2019 Thursday, September 12, 2019 Tuesday, September 17, 2019
8-Week BILL Tuesday, September 10, 2019 Thursday, September 12, 2019 Tuesday, September 17, 2019
13-Week BILL Thursday, September 12, 2019 Monday, September 16, 2019 Thursday, September 19, 2019
26-Week BILL Thursday, September 12, 2019 Monday, September 16, 2019 Thursday, September 19, 2019
10-Year TIPS R T Thursday, September 12, 2019 Thursday, September 19, 2019 Monday, September 30, 2019
4-Week BILL Tuesday, September 17, 2019 Thursday, September 19, 2019 Tuesday, September 24, 2019
8-Week BILL Tuesday, September 17, 2019 Thursday, September 19, 2019 Tuesday, September 24, 2019
13-Week BILL Thursday, September 19, 2019 Monday, September 23, 2019 Thursday, September 26, 2019
26-Week BILL Thursday, September 19, 2019 Monday, September 23, 2019 Thursday, September 26, 2019
2-Year FRN R Thursday, September 19, 2019 Wednesday, September 25, 2019 Friday, September 27, 2019
2-Year NOTE Thursday, September 19, 2019 Tuesday, September 24, 2019 Monday, September 30, 2019
5-Year NOTE Thursday, September 19, 2019 Wednesday, September 25, 2019 Monday, September 30, 2019
7-Year NOTE Thursday, September 19, 2019 Thursday, September 26, 2019 Monday, September 30, 2019
4-Week BILL Tuesday, September 24, 2019 Thursday, September 26, 2019 Tuesday, October 01, 2019
8-Week BILL Tuesday, September 24, 2019 Thursday, September 26, 2019 Tuesday, October 01, 2019
13-Week BILL Thursday, September 26, 2019 Monday, September 30, 2019 Thursday, October 03, 2019
26-Week BILL Thursday, September 26, 2019 Monday, September 30, 2019 Thursday, October 03, 2019
4-Week BILL Tuesday, October 01, 2019 Thursday, October 03, 2019 Tuesday, October 08, 2019
8-Week BILL Tuesday, October 01, 2019 Thursday, October 03, 2019 Tuesday, October 08, 2019
13-Week BILL Thursday, October 03, 2019 Monday, October 07, 2019 Thursday, October 10, 2019
26-Week BILL Thursday, October 03, 2019 Monday, October 07, 2019 Thursday, October 10, 2019
52-Week BILL Thursday, October 03, 2019 Tuesday, October 08, 2019 Thursday, October 10, 2019
3-Year NOTE Thursday, October 03, 2019 Tuesday, October 08, 2019 Tuesday, October 15, 2019
10-Year NOTE R Thursday, October 03, 2019 Wednesday, October 09, 2019 Tuesday, October 15, 2019
30-Year BOND R Thursday, October 03, 2019 Thursday, October 10, 2019 Tuesday, October 15, 2019
4-Week BILL Tuesday, October 08, 2019 Thursday, October 10, 2019 Tuesday, October 15, 2019
8-Week BILL Tuesday, October 08, 2019 Thursday, October 10, 2019 Tuesday, October 15, 2019
13-Week BILL Thursday, October 10, 2019 Tuesday, October 15, 2019 Thursday, October 17, 2019
26-Week BILL Thursday, October 10, 2019 Tuesday, October 15, 2019 Thursday, October 17, 2019
5-Year TIPS T Thursday, October 10, 2019 Thursday, October 17, 2019 Thursday, October 31, 2019
Holiday - Monday, October 14, 2019 - Columbus Day
4-Week BILL Tuesday, October 15, 2019 Thursday, October 17, 2019 Tuesday, October 22, 2019
8-Week BILL Tuesday, October 15, 2019 Thursday, October 17, 2019 Tuesday, October 22, 2019
13-Week BILL Thursday, October 17, 2019 Monday, October 21, 2019 Thursday, October 24, 2019
26-Week BILL Thursday, October 17, 2019 Monday, October 21, 2019 Thursday, October 24, 2019
2-Year NOTE Thursday, October 17, 2019 Tuesday, October 22, 2019 Thursday, October 31, 2019
2-Year FRN Thursday, October 17, 2019 Wednesday, October 23, 2019 Thursday, October 31, 2019
5-Year NOTE Thursday, October 17, 2019 Wednesday, October 23, 2019 Thursday, October 31, 2019
Appendix 1 - U.S. Treasury Auction Calendar

Tentative Auction Schedule of U.S. Treasury Securities
Security Type Announcement Date Auction Date Settlement Date7-Year NOTE Thursday, October 17, 2019 Thursday, October 24, 2019 Thursday, October 31, 2019
4-Week BILL Tuesday, October 22, 2019 Thursday, October 24, 2019 Tuesday, October 29, 2019
8-Week BILL Tuesday, October 22, 2019 Thursday, October 24, 2019 Tuesday, October 29, 2019
13-Week BILL Thursday, October 24, 2019 Monday, October 28, 2019 Thursday, October 31, 2019
26-Week BILL Thursday, October 24, 2019 Monday, October 28, 2019 Thursday, October 31, 2019
4-Week BILL Tuesday, October 29, 2019 Thursday, October 31, 2019 Tuesday, November 05, 2019
8-Week BILL Tuesday, October 29, 2019 Thursday, October 31, 2019 Tuesday, November 05, 2019
3-Year NOTE Wednesday, October 30, 2019 Tuesday, November 05, 2019 Friday, November 15, 2019
10-Year NOTE Wednesday, October 30, 2019 Wednesday, November 06, 2019 Friday, November 15, 2019
30-Year BOND Wednesday, October 30, 2019 Thursday, November 07, 2019 Friday, November 15, 2019
13-Week BILL Thursday, October 31, 2019 Monday, November 04, 2019 Thursday, November 07, 2019
26-Week BILL Thursday, October 31, 2019 Monday, November 04, 2019 Thursday, November 07, 2019
52-Week BILL Thursday, October 31, 2019 Tuesday, November 05, 2019 Thursday, November 07, 2019
4-Week BILL Tuesday, November 05, 2019 Thursday, November 07, 2019 Tuesday, November 12, 2019
8-Week BILL Tuesday, November 05, 2019 Thursday, November 07, 2019 Tuesday, November 12, 2019
13-Week BILL Thursday, November 07, 2019 Tuesday, November 12, 2019 Thursday, November 14, 2019
26-Week BILL Thursday, November 07, 2019 Tuesday, November 12, 2019 Thursday, November 14, 2019
Holiday - Monday, November 11, 2019 - Veterans Day
4-Week BILL Tuesday, November 12, 2019 Thursday, November 14, 2019 Tuesday, November 19, 2019
8-Week BILL Tuesday, November 12, 2019 Thursday, November 14, 2019 Tuesday, November 19, 2019
13-Week BILL Thursday, November 14, 2019 Monday, November 18, 2019 Thursday, November 21, 2019
26-Week BILL Thursday, November 14, 2019 Monday, November 18, 2019 Thursday, November 21, 2019
10-Year TIPS R T Thursday, November 14, 2019 Thursday, November 21, 2019 Friday, November 29, 2019
4-Week BILL Tuesday, November 19, 2019 Thursday, November 21, 2019 Tuesday, November 26, 2019
8-Week BILL Tuesday, November 19, 2019 Thursday, November 21, 2019 Tuesday, November 26, 2019
13-Week BILL Thursday, November 21, 2019 Monday, November 25, 2019 Friday, November 29, 2019
26-Week BILL Thursday, November 21, 2019 Monday, November 25, 2019 Friday, November 29, 2019
2-Year FRN R Thursday, November 21, 2019 Tuesday, November 26, 2019 Friday, November 29, 2019
2-Year NOTE Thursday, November 21, 2019 Monday, November 25, 2019 Monday, December 02, 2019
5-Year NOTE Thursday, November 21, 2019 Tuesday, November 26, 2019 Monday, December 02, 2019
7-Year NOTE Thursday, November 21, 2019 Wednesday, November 27, 2019 Monday, December 02, 2019
4-Week BILL Tuesday, November 26, 2019 Wednesday, November 27, 2019 Tuesday, December 03, 2019
8-Week BILL Tuesday, November 26, 2019 Wednesday, November 27, 2019 Tuesday, December 03, 2019
13-Week BILL Wednesday, November 27, 2019 Monday, December 02, 2019 Thursday, December 05, 2019
26-Week BILL Wednesday, November 27, 2019 Monday, December 02, 2019 Thursday, December 05, 2019
52-Week BILL Wednesday, November 27, 2019 Tuesday, December 03, 2019 Thursday, December 05, 2019
Holiday - Thursday, November 28, 2019 - Thanksgiving Day
4-Week BILL Tuesday, December 03, 2019 Thursday, December 05, 2019 Tuesday, December 10, 2019
8-Week BILL Tuesday, December 03, 2019 Thursday, December 05, 2019 Tuesday, December 10, 2019
13-Week BILL Thursday, December 05, 2019 Monday, December 09, 2019 Thursday, December 12, 2019
26-Week BILL Thursday, December 05, 2019 Monday, December 09, 2019 Thursday, December 12, 2019
3-Year NOTE Thursday, December 05, 2019 Monday, December 09, 2019 Monday, December 16, 2019
10-Year NOTE R Thursday, December 05, 2019 Tuesday, December 10, 2019 Monday, December 16, 2019
30-Year BOND R Thursday, December 05, 2019 Thursday, December 12, 2019 Monday, December 16, 2019
4-Week BILL Tuesday, December 10, 2019 Thursday, December 12, 2019 Tuesday, December 17, 2019
8-Week BILL Tuesday, December 10, 2019 Thursday, December 12, 2019 Tuesday, December 17, 2019
13-Week BILL Thursday, December 12, 2019 Monday, December 16, 2019 Thursday, December 19, 2019
26-Week BILL Thursday, December 12, 2019 Monday, December 16, 2019 Thursday, December 19, 2019
5-Year TIPS R T Thursday, December 12, 2019 Thursday, December 19, 2019 Tuesday, December 31, 2019
4-Week BILL Tuesday, December 17, 2019 Thursday, December 19, 2019 Tuesday, December 24, 2019
8-Week BILL Tuesday, December 17, 2019 Thursday, December 19, 2019 Tuesday, December 24, 2019
13-Week BILL Thursday, December 19, 2019 Monday, December 23, 2019 Thursday, December 26, 2019
26-Week BILL Thursday, December 19, 2019 Monday, December 23, 2019 Thursday, December 26, 2019
2-Year FRN R Thursday, December 19, 2019 Tuesday, December 24, 2019 Friday, December 27, 2019
2-Year NOTE Thursday, December 19, 2019 Monday, December 23, 2019 Tuesday, December 31, 2019
5-Year NOTE Thursday, December 19, 2019 Tuesday, December 24, 2019 Tuesday, December 31, 2019
7-Year NOTE Thursday, December 19, 2019 Thursday, December 26, 2019 Tuesday, December 31, 2019
4-Week BILL Tuesday, December 24, 2019 Thursday, December 26, 2019 Tuesday, December 31, 2019
8-Week BILL Tuesday, December 24, 2019 Thursday, December 26, 2019 Tuesday, December 31, 2019
Holiday - Wednesday, December 25, 2019 - Christmas Day
13-Week BILL Thursday, December 26, 2019 Monday, December 30, 2019 Thursday, January 02, 2020
26-Week BILL Thursday, December 26, 2019 Monday, December 30, 2019 Thursday, January 02, 2020
52-Week BILL Thursday, December 26, 2019 Monday, December 30, 2019 Thursday, January 02, 2020
4-Week BILL Tuesday, December 31, 2019 Thursday, January 02, 2020 Tuesday, January 07, 2020
8-Week BILL Tuesday, December 31, 2019 Thursday, January 02, 2020 Tuesday, January 07, 2020
Holiday - Wednesday, January 01, 2020 - New Year's Day
13-Week BILL Thursday, January 02, 2020 Monday, January 06, 2020 Thursday, January 09, 2020
26-Week BILL Thursday, January 02, 2020 Monday, January 06, 2020 Thursday, January 09, 2020
3-Year NOTE Thursday, January 02, 2020 Tuesday, January 07, 2020 Wednesday, January 15, 2020
10-Year NOTE R Thursday, January 02, 2020 Wednesday, January 08, 2020 Wednesday, January 15, 2020
30-Year BOND R Thursday, January 02, 2020 Thursday, January 09, 2020 Wednesday, January 15, 2020
4-Week BILL Tuesday, January 07, 2020 Thursday, January 09, 2020 Tuesday, January 14, 2020
8-Week BILL Tuesday, January 07, 2020 Thursday, January 09, 2020 Tuesday, January 14, 2020
13-Week BILL Thursday, January 09, 2020 Monday, January 13, 2020 Thursday, January 16, 2020

Tentative Auction Schedule of U.S. Treasury Securities
Security Type Announcement Date Auction Date Settlement Date26-Week BILL Thursday, January 09, 2020 Monday, January 13, 2020 Thursday, January 16, 2020
4-Week BILL Tuesday, January 14, 2020 Thursday, January 16, 2020 Tuesday, January 21, 2020
8-Week BILL Tuesday, January 14, 2020 Thursday, January 16, 2020 Tuesday, January 21, 2020
13-Week BILL Thursday, January 16, 2020 Tuesday, January 21, 2020 Thursday, January 23, 2020
26-Week BILL Thursday, January 16, 2020 Tuesday, January 21, 2020 Thursday, January 23, 2020
10-Year TIPS T Thursday, January 16, 2020 Thursday, January 23, 2020 Friday, January 31, 2020
Holiday - Monday, January 20, 2020 - Birthday of Martin Luther King, Jr.
4-Week BILL Tuesday, January 21, 2020 Thursday, January 23, 2020 Tuesday, January 28, 2020
8-Week BILL Tuesday, January 21, 2020 Thursday, January 23, 2020 Tuesday, January 28, 2020
13-Week BILL Thursday, January 23, 2020 Monday, January 27, 2020 Thursday, January 30, 2020
26-Week BILL Thursday, January 23, 2020 Monday, January 27, 2020 Thursday, January 30, 2020
52-Week BILL Thursday, January 23, 2020 Tuesday, January 28, 2020 Thursday, January 30, 2020
2-Year NOTE Thursday, January 23, 2020 Monday, January 27, 2020 Friday, January 31, 2020
5-Year NOTE Thursday, January 23, 2020 Monday, January 27, 2020 Friday, January 31, 2020
2-Year FRN Thursday, January 23, 2020 Tuesday, January 28, 2020 Friday, January 31, 2020
7-Year NOTE Thursday, January 23, 2020 Tuesday, January 28, 2020 Friday, January 31, 2020
T --denotes TIPS
R --denotes reopening
For additional information regarding Treasury auction announcements and results please see web address below:
http://www.treasurydirect.gov/instit/annceresult/press/press.htm

1Governed by the Terms and Conditions set forth in The Uniform Offering Circular for the Sale and Issue of Marketable Book-Entry Treasury Bills, Notes, and Bonds(31 CFR Part 356, as amended), and this offering announcement.2Must be expressed as a yield with three decimals e.g., 7.123%.3FIMA up to $1,000 million in noncompetitive bids from Foreign and International Monetary Authority not to exceed $100 million per account.
Embargoed Until 11:00 A.M. CONTACT: Treasury AuctionsSeptember 05, 2019 202-504-3550
TREASURY OFFERING ANNOUNCEMENT 1
Term and Type of Security 9-Year 11-Month 1-5/8% Note(Reopening)
Offering Amount $24,000,000,000Currently Outstanding $44,619,000,000CUSIP Number 912828YB0Auction Date September 11, 2019Original Issue Date August 15, 2019Issue Date September 16, 2019Maturity Date August 15, 2029Dated Date August 15, 2019Series E-2029Yield Determined at AuctionInterest Rate 1-5/8%Interest Payment Dates February 15 and August 15Accrued Interest from 08/15/2019 to 09/16/2019 $1.41304 Per $1,000Premium or Discount Determined at Auction
Minimum Amount Required for STRIPS $100Corpus CUSIP Number 912821CR4Additional TINT(s) Due Date(s) and NoneCUSIP Number(s)
Maximum Award $8,400,000,000Maximum Recognized Bid at a Single Yield $8,400,000,000NLP Reporting Threshold $8,400,000,000NLP Exclusion Amount $9,500,000,000
Minimum Bid Amount and Multiples $100Competitive Bid Yield Increments 2 0.001%Maximum Noncompetitive Award $5,000,000Eligible for Holding in TreasuryDirect® YesEstimated Amount of Maturing Coupon Securities Held by the Public $24,000,000,000Maturing Date September 15, 2019SOMA Holdings Maturing $0SOMA Amounts Included in Offering Amount NoFIMA Amounts Included in Offering Amount 3 Yes
Noncompetitive Closing Time 12:00 Noon ETCompetitive Closing Time 1:00 p.m. ET
Appendix 2 - Treasury Auction Announcement for 10-year Note:

1All tenders at lower yields were accepted in full.250% of the amount of accepted competitive tenders was tendered at or below that yield.35% of the amount of accepted competitive tenders was tendered at or below that yield.4Bid-to-Cover Ratio: $59,124,129,600/$24,000,000,400 = 2.465Awards to TreasuryDirect = $1,368,600.6Primary dealers as submitters bidding for their own house accounts.7Non-Primary dealer submitters bidding for their own house accounts.8Customers placing competitive bids through a direct submitter, including Foreign and International Monetary Authorities placing bids through the Federal ReserveBank of New York.
For Immediate Release CONTACT: Treasury AuctionsSeptember 11, 2019 202-504-3550
TREASURY AUCTION RESULTS
Term and Type of Security 9-Year 11-Month NoteCUSIP Number 912828YB0Series E-2029
Interest Rate 1-5/8%High Yield 1 1.739%Allotted at High 46.67%Price 98.965031Accrued Interest per $1,000 $1.41304
Median Yield 2 1.700%
Low Yield 3 0.880%
Issue Date September 16, 2019Maturity Date August 15, 2029Original Issue Date August 15, 2019Dated Date August 15, 2019
Tendered AcceptedCompetitive $59,121,805,000 $23,997,675,800Noncompetitive $2,324,600 $2,324,600FIMA (Noncompetitive) $0 $0Subtotal 4 $59,124,129,600 $24,000,000,4005
SOMA $0 $0
Total $59,124,129,600 $24,000,000,400
Tendered AcceptedPrimary Dealer 6 $36,484,000,000 $5,920,000,000
Direct Bidder 7 $3,110,000,000 $3,052,000,000
Indirect Bidder 8 $19,527,805,000 $15,025,675,800Total Competitive $59,121,805,000 $23,997,675,800
Appendix 3 - Treasury Auction Results for same 10-year note.

Moody'sS&P Global
and Fitch S&P Global Ratings Definitions
Aaa AAAAn obligation rated 'AAA' has the highest rating assigned by S&P Global Ratings. The obligor's capacity to meet its financial commitment on the obligation is extremely strong.
Aa1 AA+Aa2 AAAa3 AA-A1 A+A2 A A3 A-Baa1 BBB+Baa2 BBB Baa3 BBB-Ba1 BB+Ba2 BBBa3 BB-B1 B+B2 B B3 B-
Caa CCC
An obligation rated 'CCC' is currently vulnerable to nonpayment, and is dependent upon favorable business, financial, and economic conditions for the obligor to meet its financial commitment on the obligation. In the event of adverse business, financial, or economic conditions, the obligor is not likely to have the capacity to meet its financial commitment on the obligation.
Ca CC An obligation rated 'CC' is currently highly vulnerable to nonpayment. The 'CC' rating is used when a default has not yet occurred, but S&P Global Ratings expects default to be a virtual certainty, regardless of the anticipated time to default.
CAn obligation rated 'C' is currently highly vulnerable to nonpayment, and the obligation is expected to have lower relative seniority or lower ultimate recovery compared to obligations that are rated higher.
C D An obligation rated 'D' is in default or in breach of an imputed promise.
Appendix 4 - Complete Long-term Bond Ratings
Investment Grade
High-Yield (Junk)
Source: S&P Global Ratings Definitions, June 29, 2016.Standard and Poor's Ratings Services changed their name to S&P Global Ratings on April 28, 2016, so older references will refer to these ratings as Standard and Poor's. Fitch has the same ratings structure as S&P Global. The definitions are taken only from the S&P Global Ratings Definitions. Some were shortened and emphasis was added. To check the exact language plus more explanation, refer to the original document.
An obligation rated 'AA' differs from the highest-rated obligations only to a small degree. The obligor's capacity to meet its financial commitment on the obligation is very strong.
An obligation rated 'A' is somewhat more susceptible to the adverse effects of changes in circumstances and economic conditions than obligations in higher-rated categories. However, the obligor's capacity to meet its financial commitment on the obligation is still strong.
An obligation rated 'BBB' exhibits adequate protection parameters. However, adverse economic conditions or changing circumstances are more likely to lead to a weakened capacity of the obligor to meet its financial commitment on the obligation.
An obligation rated 'BB' is less vulnerable to nonpayment than other speculative issues. However, it faces major ongoing uncertainties or exposure to adverse business, financial, or economic conditions which could lead to the obligor's inadequate capacity to meet its financial commitment on the obligation.
An obligation rated 'B' is more vulnerable to nonpayment than obligations rated 'BB', but the obligor currently has the capacity to meet its financial commitment on the obligation. Adverse business, financial, or economic conditions will likely impair the obligor's capacity or willingness to meet its financial commitment on the obligation.