the macroeconomic impact of healthcare financing ... · the macroeconomic impact of healthcare...
TRANSCRIPT

WP/08/272
The Macroeconomic Impact of Healthcare Financing Alternatives: Reform Options
for Hong Kong SAR
Dennis Botman and Nathan Porter


© 2008 International Monetary Fund WP/08/272 IMF Working Paper Asia and Pacific Department
The Macroeconomic Impact of Healthcare Financing Alternatives: Reform Options for Hong Kong SAR
Prepared by Dennis Botman and Nathan Porter1
Authorized for distribution by Nigel Chalk
December 2008
Abstract
This Working Paper should not be reported as representing the views of the IMF. The views expressed in this Working Paper are those of the author(s) and do not necessarily represent those of the IMF or IMF policy. Working Papers describe research in progress by the author(s) and are published to elicit comments and to further debate.
With much healthcare publicly funded, Hong Kong’s rapidly aging population will significant raise fiscal pressure over coming decades. We ask what the implications are of meeting these costs by public funding, or private funding voluntarily or through mandates. Our simulations suggest that without early reform, these costs quickly become unsustainable.Prefunding is key. Whether this is done through the public system or through mandatory private provision is less important. Voluntary schemes are likely to result in insufficient savings without tax incentives. Even then, voluntary accounts are unlikely to yield better macroeconomic outcomes, while mandates tend to produce more equitable consumption. JEL Classification Numbers: I18, H53
Keywords: Healthcare financing, aging population, aging-related fiscal pressures
Author’s E-Mail Address: [email protected]; [email protected]
1 We would like to thank Nigel Chalk, Hong Kong SAR’s Food and Health Bureau, and participants at the Hong Kong Monetary Authority seminar for helpful comments. All remaining errors are our own.
2
Contents I. Introduction..........................................................................................................................3 II. Hong Kong SAR’s Rising Healthcare Cost Challenge........................................................5 A. Background—Scope of the Challenge...........................................................................5 B. Options to Limit Healthcare Costs—Your Health, Your Life ........................................7 C. How Do We Assess the Impact of the Alternatives?.....................................................9 III. Global Fiscal Model...........................................................................................................10 IV. The Macroeconomic Impact of Financing Reform Options ..............................................12 A. Direct Government Funding and Social Insurance......................................................12 B. Private Funding of Rising Healthcare Costs................................................................15 V. Conclusions and Other Considerations..............................................................................21 References................................................................................................................................31 Figures 1. Macroeconomic Effects Baseline ......................................................................................13 2. Macroeconomic Impact of Prefunding ..............................................................................14 3. Macroeconomic Effects Mandatory Healthcare Savings: Private Versus Private-Public Funding .....................................................................................................17 4. Macroeconomic Effects of Voluntary Healthcare Provision without Tax Incentives .......19 5. Macroeconomic Effects of Voluntary Healthcare Provision with Tax Incentives ............20 Appendices I. Comparison of Different Supplementary Financing Options and Existing Financing Model ...............................................................................................................24 II. Summary of the IMF’s Global Fiscal Model.....................................................................26

3
I. INTRODUCTION
Hong Kong SAR, like many other economies in Asia and around the world is facing significant fiscal pressure from population aging. This pressure will manifest itself through a shrinking workforce and lower productivity, lower revenue from direct taxes, and higher age-related spending needs. Unless addressed early these pressures will quickly overwhelm the government’s savings—almost 30 percent of GDP—with attendant risks to the quality of public healthcare (and other public services), and Hong Kong SAR’s low tax environment. Looking forward, the Hong Kong SAR authorities are considering various alternatives to reform healthcare financing and provision (including related service and efficiency aspects), and has prepared a consultation report—Your Health, Your Life—seeking views on these options so that good healthcare remains affordable to all. This paper looks at the aging-related fiscal challenges from rising healthcare costs, and assesses the macroeconomic implications of alternative reforms. Healthcare costs remain largely the responsibility of the government in Hong Kong SAR, and without reform to its provision and financing, public costs could (as a share of GDP) almost double by 2033, and more than triple by 2050. There are clearly also other types of costs associated with aging, the most obvious of which may be pension-related expenses. The paper abstracts from these other costs as, for example, future retirement incomes have largely provided for by the introduction of the Mandatory Provident Fund (MPF) Schemes in December 2000.2 Our paper focuses on the medium-term macroeconomic implications of rising healthcare costs, and various alternatives to finance these costs. In particular, we focus on the macroeconomic impact of the Who (public or private), When (anticipate future payments or pay as you go), and How (through voluntary or mandatory provision) of financing reform. Specifically, the paper considers the macroeconomic implications—for consumption and saving, investment, GDP, competitiveness, and inequality—of having the public or private sectors alternatively cover healthcare costs; funding future (private and public) costs today or using pay-as-you-go; and using alternatively mandates for how the private sector anticipates future costs or leaving that to voluntary choice. Given its focus on the macroeconomic impact of these broad financing considerations, the paper does not cover in detail several important issues, including those related the specific differences between financing approaches (e.g., the differences between insurance and savings or out of pocket schemes) for individual outcomes and efficiency, alternative cost containment techniques, and how healthcare is provided. This is not, however, to say that the differences in individual 2 For individuals earning between HK$5,000 and HK$20,000 per month, they and their employer each contribute 5 percent of income to an eligible MPF scheme. For individuals earning less than HK$5,000, only the employer makes their contribution, while for individuals earning over HK$20,000, the employer and employee contributions are capped at HK$1,000. Well over 90 percent of the employed population is covered by MPF schemes and other eligible occupational schemes.

4
behavior induced by specific design details of various financing option will not have macroeconomic effects, but these design aspects are beyond the scope of the current paper. Nonetheless, for these, as well as their relative microeconomic efficiency benefits, that the design of the final option be done in a way to encourage optimal behavior of individuals. We use a version of the IMF’s Global Fiscal Model (GFM) calibrated to Hong Kong SAR to study the macroeconomic implications of alternative policies to address rising health care spending. GFM is a multi-country, dynamic, general equilibrium model developed specifically to analyze the macroeconomic effects of various fiscal policies. As such, it is able to offer a qualitative and quantitative assessment of alternative reform proposals, albeit unable to capture some of the more detailed, microeconomic, differences between the various options. Each financing alternative has different implications for equity, both within and across generations. We explicit study the impact on intragenerational equity of financing alternatives, by following how each would affect the relative consumption of the rich and poor individuals. For example, we provide some insight on the relative impact on the poor of direct public funding (anticipated or not), mandatory private provision, and voluntary private provision. However, there are also large intergenerational issues—the healthcare spending not anticipated or financed through debt will have to be covered by taxes collected from later generations even though the majority of spending is on the current. Prefunding places less burden on future generations than pay-as-you-go and some voluntary schemes. Although not explicitly modeled, our results point to intergenerational concerns through the impact current financing choices could have on government debt and tax rates over coming decades. We find that without timely financing reform, healthcare spending will quickly become unsustainable. If the government continues to predominantly fund healthcare—directly or through social insurance—then early provision (including through higher fiscal savings) will limit the future adverse impact. However, passing a substantial share of these costs to the private sector (with some fiscal incentives) can also stabilize economic outcomes and lead to higher investment and GDP. This is so regardless of whether it is funded through mandated private provision, mandated private and public provision, or through voluntary private provision. However, without sufficient (revenue-neutral) fiscal incentives to encourage long-term financial planning by households, voluntary private saving will be insufficient to pay for future healthcare costs without producing large swings in lending, possibly resulting in contingent liabilities for the public sector. The rest of the paper is organized with the next section laying out the basic challenge facing Hong Kong SAR, and the options the authorities are considering. Section III describes the basic modeling approach, with the impact of the alternative financing options descried in Section IV. Section V concludes.

5
II. HONG KONG SAR’S RISING HEALTH CARE COST CHALLENGE
A. Background—Scope of the Challenge
Hong Kong SAR faces a very steep aging profile. The average age is projected to increase from around 40 in 2007 to around 48 in 2033 and then 50 by 2050, with the steepest increase expected for women. The period of most rapid aging lays ahead—around 2010—with the number of people over 65 per thousand aged 20−64 rising 2½ times by 2033 and 3½ times by 2050, pointing not only to higher costs, but also lower direct tax revenue. In particular, an estimated healthcare cost function (based on OECD, 2006) shows how steeply of the cost of providing healthcare rises with age.
Average Age Projections
30
35
40
45
50
55
1990 1995 2000 2005 2010 2015 2020 2025 2030 2035 2040
Males Females Total
Source: UN Population Projections.
Old-Age Dependency Ratio(Population aged over 65/population aged 20–64)
0
10
20
30
40
50
60
70
80
1990 1995 2000 2005 2010 2015 2020 2025 2030 2035 2040
Males Females Total
Source: UN Population Projections.
Healthcare Costs of Survivors by Age
0
500
1,000
1,500
2,000
2,500
3,000
3,500
4,000
2 7 12 17 22 27 32 37 42 47 52 57 62 67 72 77 82 87 92AgeSource: OECD (2006).
-0.3
-0.2
-0.1
0.0
0.1
0.2
0.3
0.4
Hong Kong SAR Japan Korea Taiwan POC
TaxesSocial insurancePrivate insuranceOut-of-pocket expensesTotal
Health Financing Sources(Kakwani index 1/)
Source: Wagstaff (2007).1/ A positive value of Kakwani's 1977 index indicates a progressive payment structure, a zero value proportional payments, and a negative value a regressive structure.
Traditionally Hong Kong SAR’s healthcare system has ensured that a broad segment of the population has received adequate healthcare, financed in an equitable way. Moreover, it has provided this care very efficiently and has been more successful in containing costs than in many other countries. For example, Hong Kong SAR has had more progressive financing arrangements (as measured by Kakwani’s index of progressivity), including lower out of pocket expenses, than Japan, Korea, and Taiwan POC. This largely follows from its reliance on funding through general taxation, but even out of pocket expenditures (which are typically regressive) were levied in a such way that made it largely proportional to income (Wagstaff, 2007). Moreover, Hong Kong SAR’s system has been successful in keeping the

6
share of households facing catastrophic healthcare costs low, with the incidence of these costs typically falling on the more wealthy (Wagstaff, 2007).3 In doing so, however, Hong Kong SAR has placed a large emphasis on public financing (Wagstaff, 2007). The share of public funds going towards healthcare financing has increased steadily from 40 percent in 1989/90 to around 55 percent of total health care spending in 2004/05. Moreover, in a number of core areas, healthcare financing is especially unbalanced—the public sector currently pays directly for the vast majority of major services, including hospital-related care, long-term and home care, and preventative care. The only areas of spending where private funding dominates are healthcare administration, medical goods outside the patient care setting, and ambulatory services.
Real Per Capita Public Health Spending(In 2000 PPP U.S. dollar)
0
500
1,000
1,500
2,000
2,500
3,000
3,500
4,000
2000 2001 2002 2003 2004 2005 2006Australia Germany JapanKorea Luxembourg New ZealandUnited Kingdom United States Hong Kong SAR
Sources: Hong Kong SAR Domestic Health Accounts; OECD Health Data 2008 ; and staff estimates.
Healthcare Spending by Sector(FY 2004/05; in percent of total)
0
20
40
60
80
100
120
Inpa
tient
car
e
Day
pat
ient
hosp
ital
serv
ices
Am
bula
tory
serv
ices
Hom
e ca
re
Reh
abili
tativ
eca
re
Long
-term
care
Anci
llary
serv
ices
tohe
alth
car
eM
ed. g
oods
outs
ide
pat.
care
set
ting
Pre
vent
ion
and
publ
iche
alth
Hea
lthca
read
min
istra
tive
cost
s Tota
l
Public Private
Source: Hong Kong SAR Domestic Health Accounts.
However, without reform, rising healthcare costs will pose significant challenges: spending will quickly become unsustainable and breach constitutional limits.4 The pressure from the aging population and healthcare inflation on public healthcare spending without reform would see public healthcare spending rise from an estimated 3 percent of GDP in 2007 to
3 The share of households facing “catastrophic” healthcare spending—over 5 percent, 10 percent, 15 percent and 25 percent of income—in Hong Kong SAR was around 13 percent, 6 percent, 3 percent, and 1 percent, respectively. In Korea and Taiwan POC, around 20 percent of households had healthcare expenditures over 5 percent of their income.
4 The substantial fiscal reserves accumulated and maintained by the Hong Kong SAR government stems from prolonged fiscal prudence. Article 107 of the SAR’s Basic Law, its constitutional document, states that “the Hong Kong Special Administrative Region shall follow the principle of keeping the expenditure within the limits of revenues in drawing up its budget, and strive to achieve a fiscal balance, avoid deficits and keep the budget commensurate with the growth rate of its gross domestic product.” The increase in debt depicted in this scenario is presented only for illustrative purposes.

7
5½ percent in 2033, and around 9 percent in 2050.5 Although great uncertainty surrounds these estimates, they nonetheless show the likely trend for public health spending without reform. To avoid large deficits and debt accumulation, either taxes would have to rise dramatically, jeopardizing the financial center’s competitiveness, or there would need to be drastic cuts in already low discretionary spending. Either way, these changes will place pressure on Hong Kong SAR’s currency board and limit the government’s options for fiscal policy in response to shocks. An alternative option would be for private financing of future health care costs.
B. Options to Limit Healthcare Costs—Your Health, Your Life
Recognizing the challenges, the authorities released a consultation document outlining alternative healthcare reform options. These options address reforms to both provision (cost containment including aspects of service delivery and efficiency) and financing mechanisms. Regarding provision, the authorities are seeking to enhance the role of primary care, and increase the role for private-public partnerships, while on financing, the report asks how the burden should be split between public and private sectors. Reforms to the provision of healthcare aim to: • Enhance primary care. The reforms would hope to increase the emphasis on
preventative care and reduce unnecessary spending and treatment. In the past, primary care has not been central in the Hong Kong SAR healthcare system, with patients typically seeing different doctors for each illness, or seeking hospital care directly.
5 The projected spending amounts from 2005 to 2033 were prepared for the Hong Kong SAR government using the Wanless projection method (DCMSPA, 2008). Beyond 2033, the projections used in this paper were made by using an estimated econometric relationship between the growth in public health spending, the aging of the population, productivity growth, general inflation, and the aggregate participation rate. This relationship uses the main factors affecting healthcare spending identified in OECD (2006): demographic change reflects the principal driver of healthcare costs, the inclusion of income (the main nondemographic variable) captures that health care is a normal good, while productivity improvements and CPI inflation proxy for the gradual rise of the relative price of healthcare over time (the “Baumol effect”). Changes in the aggregate participation rate reflects changes in the labor costs of providing long-term care due to changes in informal care. The results suggest that for each additional person over 65 per 1,000 between 20 and 64, public healthcare spending in Hong Kong SAR rises by 2 percent.
Projected Public Health Spending in Hong Kong SAR(In percent of GDP)
0
1
2
3
4
5
6
7
8
9
10
2004
/05
2009
/10
2014
/15
2019
/20
2024
/25
2029
/30
2034
/35
2039
/40
2044
/45
2049
/50
8
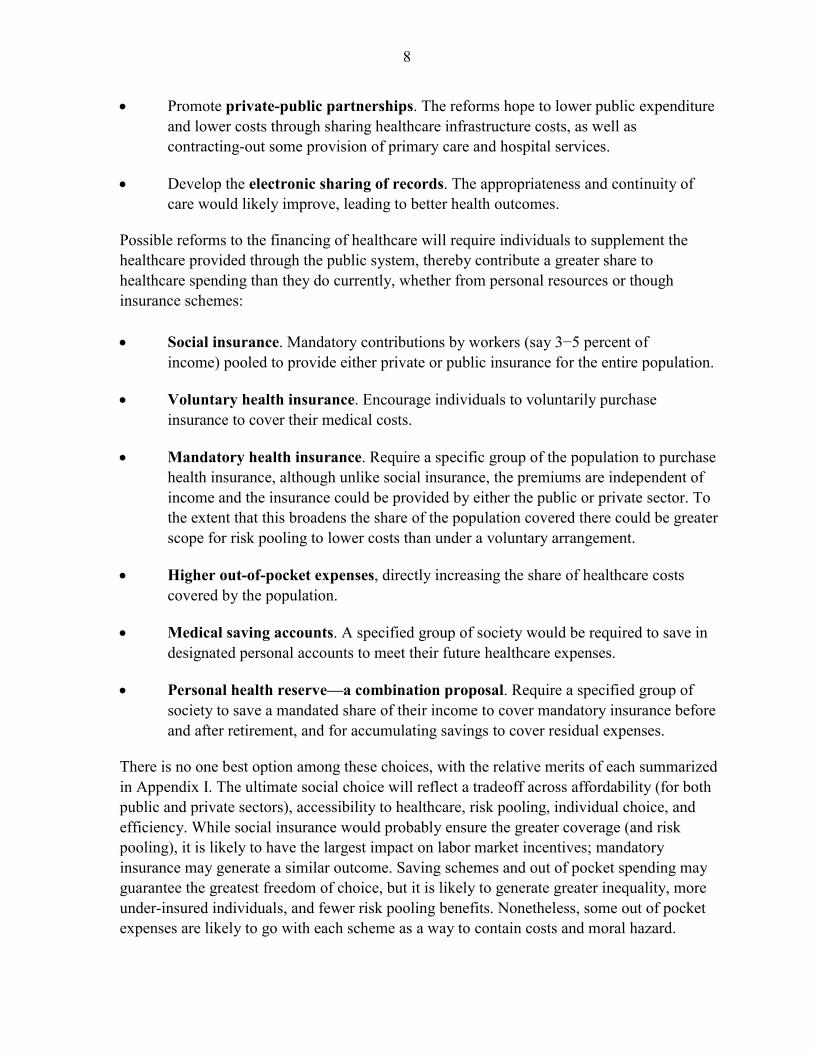
• Promote private-public partnerships. The reforms hope to lower public expenditure and lower costs through sharing healthcare infrastructure costs, as well as contracting-out some provision of primary care and hospital services.
• Develop the electronic sharing of records. The appropriateness and continuity of care would likely improve, leading to better health outcomes.
Possible reforms to the financing of healthcare will require individuals to supplement the healthcare provided through the public system, thereby contribute a greater share to healthcare spending than they do currently, whether from personal resources or though insurance schemes: • Social insurance. Mandatory contributions by workers (say 3−5 percent of
income) pooled to provide either private or public insurance for the entire population.
• Voluntary health insurance. Encourage individuals to voluntarily purchase insurance to cover their medical costs.
• Mandatory health insurance. Require a specific group of the population to purchase health insurance, although unlike social insurance, the premiums are independent of income and the insurance could be provided by either the public or private sector. To the extent that this broadens the share of the population covered there could be greater scope for risk pooling to lower costs than under a voluntary arrangement.
• Higher out-of-pocket expenses, directly increasing the share of healthcare costs covered by the population.
• Medical saving accounts. A specified group of society would be required to save in designated personal accounts to meet their future healthcare expenses.
• Personal health reserve—a combination proposal. Require a specified group of society to save a mandated share of their income to cover mandatory insurance before and after retirement, and for accumulating savings to cover residual expenses.
There is no one best option among these choices, with the relative merits of each summarized in Appendix I. The ultimate social choice will reflect a tradeoff across affordability (for both public and private sectors), accessibility to healthcare, risk pooling, individual choice, and efficiency. While social insurance would probably ensure the greater coverage (and risk pooling), it is likely to have the largest impact on labor market incentives; mandatory insurance may generate a similar outcome. Saving schemes and out of pocket spending may guarantee the greatest freedom of choice, but it is likely to generate greater inequality, more under-insured individuals, and fewer risk pooling benefits. Nonetheless, some out of pocket expenses are likely to go with each scheme as a way to contain costs and moral hazard.

9
Moving a larger share of supplementary healthcare spending to the private sector could ultimately increase the inequality of healthcare outcomes. Anticipating this, the authorities are committed to maintaining a strong public healthcare safety net, with the public system a safety net for those who lack the means to pay for their own healthcare. Consequently, those with sufficient means should cover their own healthcare costs, with public resources available for those with those unable to, including those who have who have suffered some catastrophic healthcare costs. In this vain, the authorities’ consultation paper states that the current fee waiver system for welfare recipients and other low-income households will stay in place. In addition, they have committed to increase the share of public spending on healthcare, from an average share of recurrent spending of around 15 percent to 17 percent by 2012, as well as a one-off HK$50 billion to cover transitional costs as Hong Kong SAR moves to a new financing arrangement.6 This increase in spending will most likely be targeted towards the least well off, with the reform to financing freeing resources to strengthen the public healthcare safety net including through shorter waiting times for public hospital services, and possibly establishing a personal medical expense limit. The first order macroeconomic impacts essentially come from the incentives generated by the who, when, and how rising healthcare costs will be financed. The extent of spending that is effectively moved from public to private sectors, how the burden of these additional costs is shared, when it is provided for, and whether provision for these costs occurs through voluntary or mandatory mechanisms, will be the key driver of the macroeconomic impact. It is these margins that the rest of this paper focuses on, with the broad patens of macroeconomic impacts likely generally independent of actual final magnitude of costs transferred.
C. How Do We Assess the Impact of the Alternatives?
To assess the macroeconomic impact of reform we use the GFM, calibrated to the specific features of Hong Kong SAR. The GFM is a model of a small open economy (Hong Kong SAR) with trade and financial linkages with the rest of the world. The model includes a detailed fiscal sector, which allows us to simulate the impact of various healthcare policy changes on spending and taxes and the resulting impact on the wider economy. After outlining the impact on debt of no change in policy, we consider the impact in turn of the “who,” “when,” and “how” of financing reforms. Specifically, we consider the macroeconomic impacts of the following: • Government funding/social insurance: We consider a policy response that increases
taxes (or a social insurance premium) and cuts other spending to finance rising healthcare costs (a pay-as-you-go strategy). The timing (“when” dimension) is then
6 This commitment was made by the Financial Secretary in the 2008/09 Budget.

10
considered by a “prefunding” of rising healthcare spending pressures through early tax increases is also considered.
• Private provision: We then consider the impact of the government shifting supplementary future funding to individuals, requiring them to provide for these costs:
♦ Through mandates: Individuals are required to set aside a fixed share of their income for healthcare-related spending.
♦ Voluntarily: Reforms that share the burden of future healthcare spending between the public and private sectors, but individuals decide when and how to provide for future costs.
♦ Voluntarily with tax incentives: As above, but the government provides revenue-neutral tax incentives to increase their provision.
While the reform option ultimately chosen is unlikely to perfectly mirror any of these experiments, together they provide a picture of their relative impacts on consumption and saving, investment, competitiveness, and intragenerational consumption inequality.
III. GLOBAL FISCAL MODEL
The GFM is calibrated to capture the key economic and fiscal features of Hong Kong (Appendix II). The model is based on a two-country, two-sector macroeconomic dynamic neo-Keynesian framework. It has a rich fiscal structure with a wide menu of taxes, social security contributions, and government transfers and spending which allows an analysis of various fiscal consolidation measures and their impact on debt sustainability in an endogenous macroeconomic model. The framework ensures a role for fiscal policy—a breakdown in Ricardian equivalence—through both demand and supply channels. On the demand side, fiscal policy has an impact on consumer behavior because consumers are impatient and have a different discount rate than the government. A fraction of consumers is also liquidity constrained with limited access to financial markets which prevents them from saving optimally over time. As two types of consumers are present, the model allows the analysis of the distributional implications of alternative policy responses to rising health care expenditures. Supply side effects take place due to distortionary effects of taxes on labor supply and investment. This model is good at looking at the looking at the macroeconomic impact of fiscal policy (though spending and various tax policies) as required by prospective healthcare financing pressures but the model does not model the particular details of the various financing options proposed in the consultation paper. Several model-specific assumptions play an important role in the transmission channels. Home bias towards nontradable goods in government spending is an important channel

11
through which fiscal consolidation affects domestic output. As a small, open economy with full capital mobility, interest rates are determined by the rest of the world. Despite allowing for an interest rate differential, monetary policy is absent in the model since full nominal wage and price flexibility is assumed. Furthermore, in the absence of an explicit demographic structure in the model, the path for higher government health care expenditure is imputed exogenously. In the baseline, higher health care expenditure is assumed to feed into the model through both higher government transfers and higher spending on domestically produced goods. The path for government spending, if the government does not reform financing, is assumed to be exogenous and follow the healthcare spending profile described in section II as well as an assumed gradual increase in other spending in line with medium-term fiscal projections. Total government spending is assumed to follow the FY 2008/09 budget plans until FY 2012/13. After that, nonhealthcare spending is assumed to rise from a projected 11¾ percent of GDP in FY 2012/13 to 14 percent over 20 years where it remains thereafter. As a consequence, on currently announced policies, total government spending would rise above 20 percent of GDP in FY 2038/39, and reach 23¼ percent of GDP in FY 2049/50.7 The assumption of exogenous healthcare spending obviates at least two channels through which healthcare may affect macroeconomic outcomes: a healthier workforce is likely to have higher productivity, and a longer working life. This assumption will, therefore, tend to lessen the reported (relative) benefits of financing reforms that generate broader healthcare coverage. That is, they would probably tend to emphasize the benefits of voluntary or pay-as-you-go systems, relative to mandatory of public ones. One important impact of the various policy alternatives that the paper considers is the impact on consumption inequality. In terms of the model, we consider inequality in terms of differences between the optimizing (agents with access to financial markets) and liquidity constrained consumers (those without such access). While this is something of a crude measure, it captures a key distinction—the relative wealth and consumption levels of different households. Moreover, the extent of inequality is the model is substantial—even through 40 percent of the population is assumed to be liquidity constrained, they account for only 18 percent of consumption in the steady state calibration (equivalent to a consumption gini coefficient of 0.223).8
7 The government has an informal spending cap, as maintained since the FY 2003/04 Budget, of 20 percent of GDP.
8 Households comprising 40 percent of the population have a monthly income (including bonus) of less than 81 percent of median monthly income (including bonus).
12
IV. THE MACROECONOMIC IMPACT OF FINANCING REFORM OPTIONS
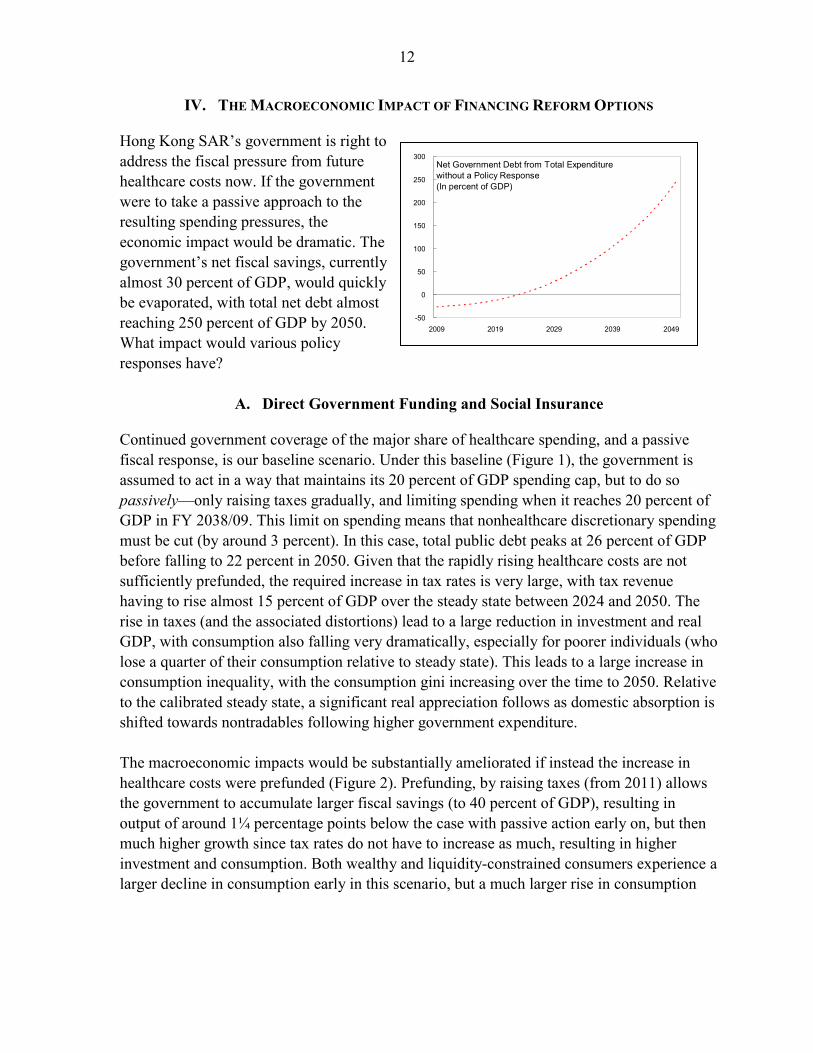
Hong Kong SAR’s government is right to address the fiscal pressure from future healthcare costs now. If the government were to take a passive approach to the resulting spending pressures, the economic impact would be dramatic. The government’s net fiscal savings, currently almost 30 percent of GDP, would quickly be evaporated, with total net debt almost reaching 250 percent of GDP by 2050. What impact would various policy responses have?
A. Direct Government Funding and Social Insurance
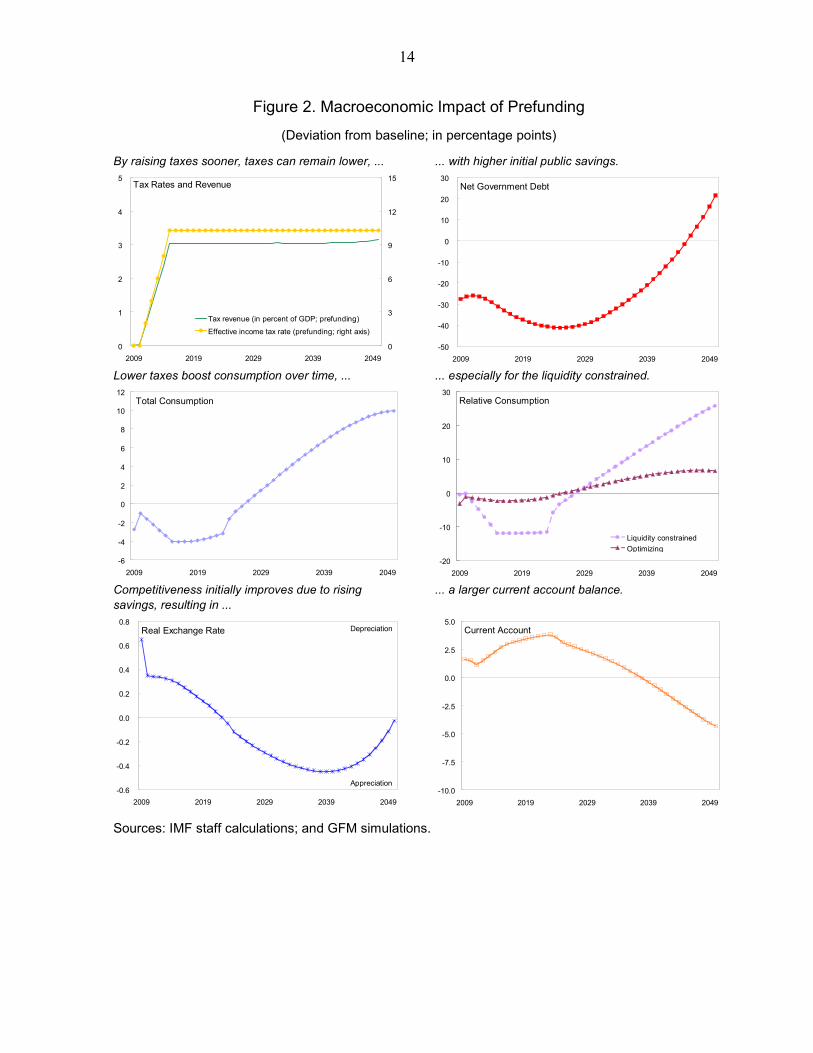
Continued government coverage of the major share of healthcare spending, and a passive fiscal response, is our baseline scenario. Under this baseline (Figure 1), the government is assumed to act in a way that maintains its 20 percent of GDP spending cap, but to do so passively—only raising taxes gradually, and limiting spending when it reaches 20 percent of GDP in FY 2038/09. This limit on spending means that nonhealthcare discretionary spending must be cut (by around 3 percent). In this case, total public debt peaks at 26 percent of GDP before falling to 22 percent in 2050. Given that the rapidly rising healthcare costs are not sufficiently prefunded, the required increase in tax rates is very large, with tax revenue having to rise almost 15 percent of GDP over the steady state between 2024 and 2050. The rise in taxes (and the associated distortions) lead to a large reduction in investment and real GDP, with consumption also falling very dramatically, especially for poorer individuals (who lose a quarter of their consumption relative to steady state). This leads to a large increase in consumption inequality, with the consumption gini increasing over the time to 2050. Relative to the calibrated steady state, a significant real appreciation follows as domestic absorption is shifted towards nontradables following higher government expenditure. The macroeconomic impacts would be substantially ameliorated if instead the increase in healthcare costs were prefunded (Figure 2). Prefunding, by raising taxes (from 2011) allows the government to accumulate larger fiscal savings (to 40 percent of GDP), resulting in output of around 1¼ percentage points below the case with passive action early on, but then much higher growth since tax rates do not have to increase as much, resulting in higher investment and consumption. Both wealthy and liquidity-constrained consumers experience a larger decline in consumption early in this scenario, but a much larger rise in consumption
Net Government Debt from Total Expenditure without a Policy Response(In percent of GDP)
-50
0
50
100
150
200
250
300
2009 2019 2029 2039 2049

13
Figure 1. Macroeconomic Effects Baseline
(Deviation from calibrated initial steady state; in percentage points; unless otherwise indicated)
The government raises taxes as healthcare costs rise...
...to limit the rising government debt.
0
5
10
15
20
2009 2019 2029 2039 20490
10
20
30
40
Change in tax revenue as a share of GDPEffective income tax rate (right axis)
Tax Rates and Revenue
Net Government Debt
-50
-40
-30
-20
-10
0
10
20
30
2009 2019 2029 2039 2049 Rising taxes reduces consumption, ... ... especially for the liquidity constrained.
Total Consumption
-12
-10
-8
-6
-4
-2
0
2
4
6
2009 2019 2029 2039 2049
Relative Consumption
-30
-20
-10
0
10
20
2009 2019 2029 2039 2049
Liquidity constrainedOptimizing
Lower competitiveness reflects lower savings than under initial steady state, ...
... although the current account improves towards the end of the simulation period.
Real Exchange Rate
-2.0
-1.8
-1.6
-1.4
-1.2
-1.0
-0.8
-0.6
-0.4
-0.2
0.0
2009 2019 2029 2039 2049
Depreciation
Appreciation
Current Account
-4
-3
-2
-1
0
2009 2019 2029 2039 2049 Sources: IMF staff calculations; and GFM simulations.
14
Figure 2. Macroeconomic Impact of Prefunding
(Deviation from baseline; in percentage points)
By raising taxes sooner, taxes can remain lower, ... ... with higher initial public savings.
0
1
2
3
4
5
2009 2019 2029 2039 20490
3
6
9
12
15
Tax revenue (in percent of GDP; prefunding)
Effective income tax rate (prefunding; right axis)
Tax Rates and Revenue
Net Government Debt
-50
-40
-30
-20
-10
0
10
20
30
2009 2019 2029 2039 2049 Lower taxes boost consumption over time, ... ... especially for the liquidity constrained.
Total Consumption
-6
-4
-2
0
2
4
6
8
10
12
2009 2019 2029 2039 2049
Relative Consumption
-20
-10
0
10
20
30
2009 2019 2029 2039 2049
Liquidity constrainedOptimizing
Competitiveness initially improves due to rising savings, resulting in ...
... a larger current account balance.
Real Exchange Rate
-0.6
-0.4
-0.2
0.0
0.2
0.4
0.6
0.8
2009 2019 2029 2039 2049
Depreciation
Appreciation
Current Account
-10.0
-7.5
-5.0
-2.5
0.0
2.5
5.0
2009 2019 2029 2039 2049 Sources: IMF staff calculations; and GFM simulations.

15
later, particularly for liquidity-constrained consumer whose disposable income depends to a larger extent on the level of taxation. Delaying action is clearly costly, with the poor particularly hard hit by the resulting drastic policy actions that are required in the medium term. These scenarios could be thought of as proxies for social insurance, with or without government anticipation of the future cost pressures: the tax levied on incomes (wages) to (partially) cover these healthcare costs is similar to levying a social insurance premium. However, given that debt increases and discretionary spending is cut, the scheme underlying these scenarios is clearly not fully funded by its premium. If it were, the distortions associated with the higher premium would be even larger, as would the impact of higher borrowing costs due to rising public debt (crowding out) would also be smaller. However, the crowding out effect of a limited increase in government debt is likely small in Hong Kong SAR given its open capital account (as in the model). Therefore, the first effect would probably dominate suggesting a fully funded social insurance scheme would lower growth, investment and consumption more than the partly funded ones assumed in these scenarios. We now consider other policy options for limiting the impact of rising healthcare costs, by passing a share of the costs to the private sector. First, we consider this being done through mandates requiring individuals to save a specified amount to pay for future healthcare spending and insurance. We consider two cases: one in which households save fully for higher health care expenditure and one scenario with a mix of private and public mandatory saving. Then we consider the case where individuals are requested to save for the additional spending in a voluntary manner. In these scenarios, we assume the government effectively passes over time responsibility to save the equivalent of 2½ percent of GDP to individuals. This amount would allow sufficient funds to accumulate in healthcare savings accounts to pay for higher healthcare outlays, not only until 2050, but also beyond.
B. Private Funding of Rising Healthcare Costs
We now consider, in turn, alternate options for how increased private healthcare spending could be financed, either through mandates or allowing individuals to provide for the spending voluntarily (i.e., though savings or by paying as the cost fall due). Given that individuals are forward looking (at least for the optimizing consumers in the model), are forward looking, they make provision immediately, although the extent of this depends on the method adopted. Mandatory Provision for Rising Healthcare Costs
Under mandates, the government is assumed to require that individuals gradually set aside funds—reaching 2½ percent of GDP annually by 2015—for healthcare expenditures,

16
although we also consider the impact of the government providing varying degrees of incentives to reach this goal. • In the first “private funding” scenario, workers need to set aside the entire 2½ percent
of GDP (gradually) themselves; in addition, they need to provide additional resources to the government equal to about 1¼ percent of GDP as other (nonhealth care related) expenditure also increases and we target the same level of (net) debt as under the baseline experiment (the passive public funding scenario). The private funding scenario requires mandatory savings contribution rate of around 5.2 percent of earned income to be set aside in savings.9
• In the second, the “public and private funding” scenario, workers need to set aside 1½ percent of GDP and the government funds the private health care account for the remaining 1 percent of GDP. Again, workers need to provide additional resources to the government equal to about 1¼ percent of GDP as other (nonhealthcare related) expenditure also increases. In this scenario, as the government adds the 1 percent of GDP without funding these outlays, (net) debt will be higher than in the baseline.
Under both mandated scenarios (Figure 3), the overall the macroeconomic impact is similar to the prefunding scenario. Of the two alternatives, the combined (private and public funding) mechanism generates higher real GDP and consumption. In particular, the liquidity-constrained consumers have a much a bigger rise in consumption over their lifetime relative to the passive government response (baseline) scenario. Taxes are much the same as under prefunding but debt is higher due to the fact that government spending never reaches the implicit 20 percent of GDP cap despite the additional 1 percent of GDP healthcare costs covered by the government. Consequently, there is a larger decline in the current account in the private and public mandatory funding scenario. Nonetheless, if there was more crowding out (a larger interest rate response to public debt), then the private funding scenario would be preferred.
9 This scenario does not assume that private spending increases (and public spending decreases) by 2½ percent of GDP each year. It is simply that workers are mandated in aggregate to save this amount of their earned income to use against current and future healthcare costs (i.e., directly for care and insurance). Therefore, this scenario does not assume public spending will be lower than the 17 percent of recurrent spending beyond 2011/12 previously committed by the government.

17
Figure 3. Macroeconomic Effects Mandatory Healthcare Savings: Private Versus Private-Public Funding
(Deviation from baseline; in percentage points)
Taxes rise slightly higher than under prefunding, ... ... although public debt is higher depending on the extent of the public contribution.
Tax Rates and Revenue
0
1
2
3
4
5
2009 2019 2029 2039 20490
3
6
9
12
15
Tax revenue (in percent of GDP)
Effective income tax rate (right axis)
Net Government Debt
-40
-20
0
20
40
60
80
100
120
140
2009 2019 2029 2039 2049
Private-public fundingPrivate funding
The mandates depress consumption initially, but result in much higher consumption later, ...
... especially for the liquidity constrained as they benefit from having saved early.
Optimizing Consumption
-6
-4
-2
0
2
4
6
8
10
12
2009 2019 2029 2039 2049
Private fundingPrivate-public funding
Liquidity Constrained Consumption
-20
-10
0
10
20
30
40
50
2009 2019 2029 2039 2049
Private fundingPrivate-public funding
Competitiveness initially improves due to high savings, but then deteriorates as ...
... consumption increases and the current account deteriorates.
Real Effective Exchange Rate
-0.6
-0.4
-0.2
0.0
0.2
0.4
0.6
0.8
2009 2019 2029 2039 2049
Private fundingPrivate-public funding
Depreciation
Appreciation
Current Account
-10.0
-7.5
-5.0
-2.5
0.0
2.5
5.0
2009 2019 2029 2039 2049
Private fundingPrivate-public funding
Sources: IMF staff calculations; and GFM simulations.

18
The savings mandate generates a less than proportionate response in aggregate household savings. Although healthcare savings in the mandatory accounts peak at around 40 percent of GDP in 2043, other “voluntary” private savings fall (by around 15 percent of GDP by 2040). This leaves only around 25 percent of GDP additional savings than would have occurred. This crowding out of savings occurs because the mandate requires (optimizing) individuals to save more than they would like to. Voluntary Provision for Rising Healthcare Costs
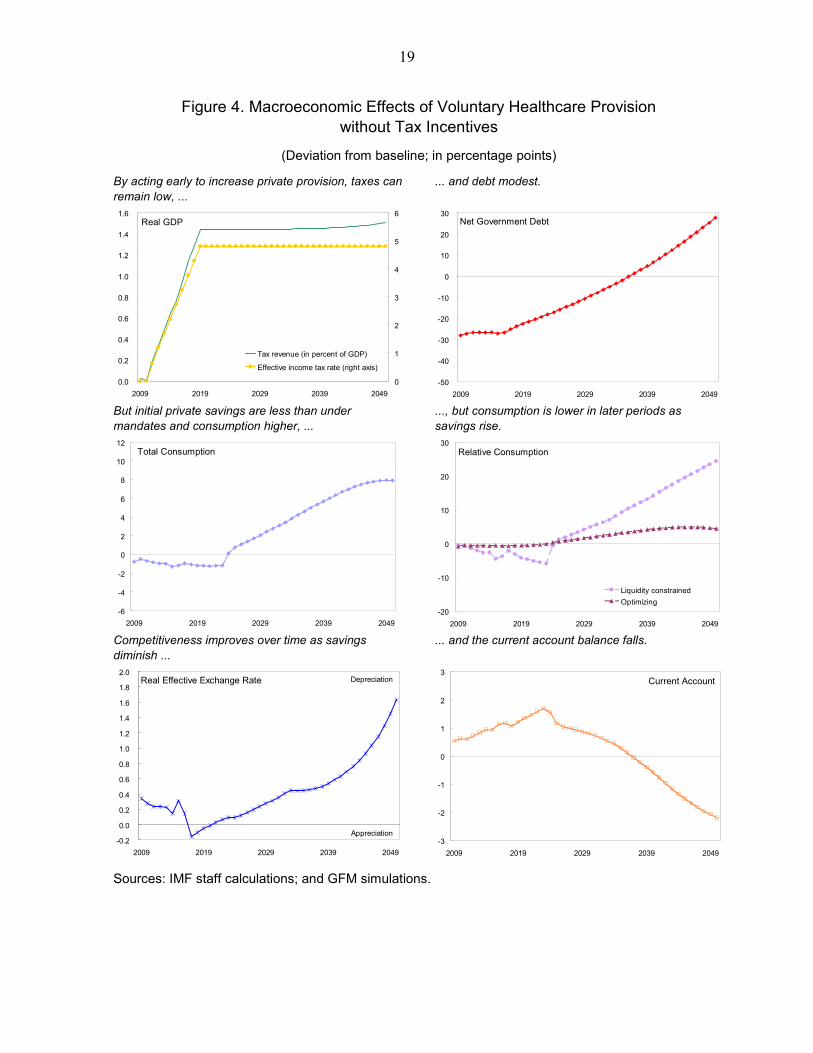
Voluntary provision for healthcare expenses—whether through savings or insurance—trusts that people are sufficiently far sighted (or patient) to adequately provide for these costs. Again we assume that the government passes the obligation for 2½ percent of GDP additional healthcare spending to private individuals, as in the mandatory provision scenario. Under this scenario, forward-looking individuals start preparing for the rise in spending early on, but they do so much more slowly than under the mandatory system, forcing them to constrain consumption relative to that under mandates later on. Accumulated healthcare assets are 16 percent of GDP below their level generated under the mandatory scheme (public-private) by 2035. Consequently, consumption is above the level under the mandatory scheme over much of the simulation period (Figure 4), especially for liquidity-constrained individuals. However, given that individuals are still required to make these healthcare payments, consumption falls below its level under the mandatory scheme as healthcare costs rise. As the government passes the responsibility for funding future health care costs, government debt rises less than under the mandatory scheme (but similar to baseline), implying a sharp rise in NFA accumulation, with an accompanying rise in competitiveness, and higher investment. Liquidity constrained consumers are significantly worse off under the voluntary scheme as they cannot save for their future healthcare costs, and so their consumption is almost 18 percent below its level under the mandatory scheme or government prefunding at 2050.
Private Saving: Deviations from Mandates 1/(In percent of GDP)
-20
-15
-10
-5
0
5
10
15
20
25
2009 2019 2029 2039 2049
No tax incentivesTax incentivesLong planning horizon/patient individuals
1/ Deviation from private savings under the public-private mandatory simulation.
-20
-10
0
10
20
30
40
50
2009 2019 2029 2039 2049
Private mandatedhealth care savings
Nonhealth relatedprivate savings
Private Savings Under Mandates(In percent of GDP)
19
Figure 4. Macroeconomic Effects of Voluntary Healthcare Provision without Tax Incentives
(Deviation from baseline; in percentage points)
By acting early to increase private provision, taxes can remain low, ...
... and debt modest.
Real GDP
0.0
0.2
0.4
0.6
0.8
1.0
1.2
1.4
1.6
2009 2019 2029 2039 20490
1
2
3
4
5
6
Tax revenue (in percent of GDP)
Effective income tax rate (right axis)
Net Government Debt
-50
-40
-30
-20
-10
0
10
20
30
2009 2019 2029 2039 2049 But initial private savings are less than under mandates and consumption higher, ...
..., but consumption is lower in later periods as savings rise.
Total Consumption
-6
-4
-2
0
2
4
6
8
10
12
2009 2019 2029 2039 2049
Relative Consumption
-20
-10
0
10
20
30
2009 2019 2029 2039 2049
Liquidity constrainedOptimizing
Competitiveness improves over time as savings diminish ...
... and the current account balance falls.
Real Effective Exchange Rate
-0.2
0.0
0.2
0.4
0.6
0.8
1.0
1.2
1.4
1.6
1.8
2.0
2009 2019 2029 2039 2049
Depreciation
Appreciation
Current Account
-3
-2
-1
0
1
2
3
2009 2019 2029 2039 2049 Sources: IMF staff calculations; and GFM simulations.

20
Figure 5. Macroeconomic Effects of Voluntary Healthcare Provision with Tax Incentives
(Deviation from baseline; in percentage points)
Revenue neutral incentives keep taxes and ... ... debt modest.
Real GDP
0.0
0.2
0.4
0.6
0.8
1.0
1.2
1.4
1.6
2009 2019 2029 2039 20490
1
2
3
4
5
6
Tax revenue (in percent of GDP)Effective income tax rate (right scale)
Net Government Debt
-50
-40
-30
-20
-10
0
10
20
30
2009 2019 2029 2039 2049 Incentives reduces consumption dramatically initially, but boost it in the long run, with...
...the optimizers worse off initially, and the constrained worse off always.
Total Consumption
-6
-4
-2
0
2
4
6
8
10
12
2009 2019 2029 2039 2049
Relative Consumption
-20
-10
0
10
20
30
2009 2019 2029 2039 2049
Liquidity constrainedOptimizing
Competitiveness improves over time as savings diminish, ...
... but the current account is boosted initially.
Real Effective Exchange Rate
-0.2
0.0
0.2
0.4
0.6
0.8
1.0
1.2
1.4
1.6
1.8
2.0
2009 2019 2029 2039 2049
Depreciation
Appreciation
Current Account
-3
-2
-1
0
1
2
3
2009 2019 2029 2039 2049 Sources: IMF staff calculations; and GFM simulations.

21
In this sense, by mandating savings the governments helps to overcome the liquidity constraints (market failures) the poor face. They are therefore worse off under voluntary healthcare provision in the long term. Tax incentives, even revenue neutral ones, to encourage additional voluntary provision, increase early provision, bringing savings closer to that under the mandatory scheme (the same would be achieved if individuals were intrinsically more patient).10 The tax incentive encourages the optimizing agents to provide for future healthcare needs earlier, resulting in a dramatic fall in consumption initially but higher later. Nonetheless, as the tax incentive is assumed to be financed through indirect taxes, overall consumption is generally lower.11 The higher savings which leads to higher investment and GDP over most of the simulation period. Nonetheless, the current account ends below that under the baseline as healthcare costs rise. However, the liquidity constrained consumers are even worse off than without the tax incentive, as not only do they not provide for their future needs, they have to pay the GST to fund the tax incentive.
V. CONCLUSIONS AND OTHER CONSIDERATIONS
Hong Kong SAR’s aging-related fiscal pressures will dramatically impact income, investment, competitiveness, and consumption regardless of how it is financed. Without policy action, the fiscal position quickly becomes unsustainable. Policy action—through higher taxes and cuts to discretionary spending—can significantly alleviate the impact, with early action resulting in less dramatic falls in output, investment and consumption, especially for the lower income households. The impact of this minimalist policy change could also be indicative of the likely impact of a social insurance system. Moving the additional fiscal pressures to individuals—either through mandates or allowing for voluntary provision—can improve overall welfare as it does not require such a large increase in distortionary taxes or cuts in discretionary spending. Overall mandatory schemes depress consumption early as people are forced to save more than they would otherwise, but then results in significantly higher consumption as healthcare costs rise substantially. Conversely, voluntary provision tends to lead to some under saving and loss of
10 Under the base parameterization, optimizing agents have an assumed planning horizon of 10 years. If this planning horizon were increased to 20 year then savings would come closer to that seen under the mandatory scheme or with a revenue-neutral tax incentive.
11 Although we assume the costs are covered by a goods and services tax, given its efficiency as a way to raise revenue, the Hong Kong SAR government withdrew its 2006 proposal for such a tax due to a lack of public support for it.

22
competitiveness early, with a dramatic increase in savings later. By increasing early provision for future healthcare costs, tax incentives for healthcare savings tends to smooth consumption over time for those with access to financial markets, and generally boost investment and output relative to other options. However, it is clear that poor households do not gain from increasing tax incentives for voluntary provision, as they gain little from the incentive, but have to pay for it.
Consumption Smoothing 2/ Inequality 3/ Net Debt Current Account REER 4/(Optimizing) 2050 2050 2050 2030
Public pre-fundingPre-funding + - -- - +
Private fundingMandatory +++ --- - -- 0Voluntary
No incentives ++ -- - 0 -Inventives ++ - - 0 -
1/ These results are relative to baseline.2/ The more + indicates the smoother consumption.3/ The more - indicates the more equality.4/ A + indicates an appreciated exchange rate.
Healthcare Financing: Impact Summary 1/
The analysis of this paper has clearly been selective, focusing on broad macroeconomic impacts of various policies to provide for future healthcare spending, and largely ignoring the microeconomic differences in various insurance and other provisioning schemes. However, differences along these other dimensions—the role of savings schemes on healthcare cost pressures; the seperability of healthcare financing and provision; and method for cost containment—all remain crucial. Medical saving schemes can lead to gaps in coverage and inequitable outcomes. Medical savings accounts cover at most 10 percent of healthcare spending in Singapore, with the complementary insurance and safety net accounting for only 2 percent of spending (Wagstaff, 2007, p. 454). This is likely to leave considerable pressure on many households (especially the poor), raising the risk that a large share of healthcare costs remain with the government. A scheme that generates saving for future insurance payments is likely to result
Consumption Gini Coefficient
0.2200
0.2205
0.2210
0.2215
0.2220
0.2225
0.2230
0.2235
0.2240
0.2245
2008 2012 2016 2020 2024 2028 2032 2036 2040 2044 20480.2200
0.2205
0.2210
0.2215
0.2220
0.2225
0.2230
0.2235
0.2240
0.2245
Private mandatoryPrivate-public mandatory (right axis)VoluntaryVoluntary plus tax incentives

23
in a more equitable outcome with lower contingent fiscal risks, particularly if it will ensure very broad coverage. More generally, savings schemes and fiscal incentives may result in higher healthcare inflation if they lead to over insurance, so the extent of any tax incentive should be considered carefully. Financing and delivery can be separated. Specifically, even if government decides to continue funding the care for individuals, the services do not need to be provided by government facilities. In fact, by allowing flexible healthcare financing (subsidy) to individuals would maximize the competition between public and private services. This flexible funding could be in the form of direct subsides for service (as in the voucher pilot currently underway), or subsidies to savings to pay for future care and insurance. Providing public funds through general taxation tends to make healthcare financing more progressive (Wagstaff, 2007), especially if it comes from progressive taxes, with the efficiency of tax base key to the overall cost. Cost containment is important regardless of which financing reform is pursued, as it ultimately determines the overall pressure (including through contingencies) on public finances (Hsiao and Heller, 2007). Provider reimbursement and out of pocket payments can be important in containing costs. Paying doctors through fee-for-service can result in excessive service provision and use of technology, accelerating healthcare inflation. Alternative payment schemes, such as capitation for primary care (where the provider is paid a fixed cost for treating a patient over a year) and diagnosis-related groups for hospitals. Korea and Japan use both these methods (Wagstaff, 2007). Other advanced courtiers have contained costs by establishing global budget caps on (public) healthcare spending and establishing a single source of payment for providers (Hsiao and Heller, 2007).

24
Financing Sustainability
Accessibility of Healthcare Risk-Pooling/Sharing Wealth Redistribution
Government funding (existing model)
Subject to fluctuations of fiscal position; unsustainable in the long-term
Accessibility based on needs (through triage and queuing)
Effective risk-sharing (healthy subsidize unhealthy)
High-income pay more and subsidize low-income
Social health insurance
Quite stable but unsustainable with shrinking workforce; require higher contribution rate as utilization increases to be sustainable
Accessibility depending on design (whether population coverage is universal or not)
Effective risk-sharing (healthy subsidize unhealthy)
High-income pay more and subsidize low-income
Out-of-pocket payments
Unsustainable Accessibility based on affordability to pay user fees (heavy users pay more)
No risk-pooling (unhealthy pay more)
High income and low-income pay the same
Medical savings accounts
Secure a sizeable and sustainable potential source of financing, but injection of financing unstable and unpredictable
Accessibility based on availability of savings (heavy users will use more from the savings)
No risk-pooling Not applicable
Voluntary private health insurance
Subscription unpredictable and financing unstable; unlikely to be a sizeable and sustainable supplementary financing source
Accessibility based on affordability to pay insurance premium (better access for those insured)
Some degree of risk-pooling (unhealthy or higher-risk pay more)
Not applicable
Mandatory private health insurance
Quite stable; require higher premium as utilization increases to be sustainable
Accessibility depending on design (whether population mandated to take out insurance is universal or not)
Effective risk-sharing (healthy subsidize unhealthy)
High-income and low-income, regardless of risk profile, pay the same
Personal healthcare reserve
Sustainable source of financing through savings; stable injection of savings into the healthcare system through insurance
Accessibility depending on design (better access for those insured and for those with savings)
Effective risk-sharing (healthy subsidize unhealthy)
High-income and low-income, regardless of risk profile, pay the same
Comparison of Different Supplementary Financing Options and Existing Financing Model Appendix I

25
Choice of Services Market Competition/ Efficiency Utilization/Cost Control Overhead Cost
Government funding (existing model)
Little choice Not enhancing competition or efficiency drive
Effective through supply and budget control
Low
Social health insurance
Some choice Some competition through procurement of services from different providers
May not be effective due to increased demands from contributors
Moderate
Out-of-pocket payments
Some choice Not enhancing competition or efficiency
Very effective but can result in healthcare less available to those more in need
Low
Medical savings accounts
Some choice Some enhancement of competition and efficiency
Control effective to some extent when cost is borne by patients
Moderate, but can be reduced by using MPF framework; disbursement admin. cost still required
Voluntary private health insurance
More choice Some enhancement of competition and efficiency
Little control High
Mandatory private health insurance
More choice Enhance competition and efficiency if insured pool is large; support market reform
Little control, but insurers with bigger pool in better position to control moral hazards and bargain fees
Moderate
Personal healthcare reserve
More choice Enhance competition and efficiency if insured pool is large; support market reform
Little control, but insurers with bigger pool in better position to control moral hazards and bargain fees
Moderate, but can be reduced by using MPF framework; admin. cost for claims processing still required
Comparison of Different Supplementary Financing Options and Existing Financing Model (Concluded)
Source: Hong Kong SAR, Food and Health Bureau, Your Health Your Life, Healthcare Reform Consultation Document .
Appendix I

26
APPENDIX II: SUMMARY OF THE IMF’S GLOBAL FISCAL MODEL
This paper uses a two-country version of GFM. Hong Kong SAR is the home country and the foreign country represents the rest of the world. In each period, n individuals are born in the home economy and 1-n individuals are born in the foreign economy. Under the assumption that consumers face identical probabilities of survival that are identical across countries, the relative size of the home economy versus the foreign economy will be equal to n/(1-n). There is a unit measure of monopolistic firms in the world producing intermediate goods which are traded internationally, with n of those located in the home economy and 1-n located abroad. Firms survive forever and each firm specializes in the production of a single differentiated variety. As is customary in these models, the intermediate tradable goods are combined into a final traded good. A similar structure of production exists in the nontraded goods sector. Asset markets are incomplete. The only assets traded internationally are nominal noncontingent bonds issued by each region. Both bonds are assumed to be denominated in the home currency. There is complete home bias in equity holdings: all shares of domestic (foreign) firms are owned by home (foreign) residents. The same assumption is made for government debt. The equations below apply to both the home country and the rest of the world unless noted otherwise. Households
In each period t, n individuals are born in the home country, where the world population is normalized to unity. Each agent has a planning horizon of 1/(1-q) derived from the constant probability of survival q. A representative agent born in period a derives utility from consumption, C, leisure, (1-L), where L denotes labor effort, and real money balances, (M/P), which are described by the following utility function:
( )( )⎥⎥
⎦
⎤
⎢⎢
⎣
⎡⎟⎟⎠
⎞⎜⎜⎝
⎛−
+−
−=
−−−∞
=∑
ρρηη
ρχ
ρβ
1,
11,,
0 1)1(1
)(t
tatata
t
ttt P
MLCqEU
where Et denotes the mathematical expectation conditional on information available at time t, β is the subjective discount factor, ρ>0 is the inverse of the intertemporal elasticity of substitution, and we restrict the remaining parameters such that 0< η<1 and χ>0. Notice that with a constant probability of death, the agent discounts the future by an additional factor q. As in Blanchard (1985) we assume the existence of insurance companies which charge a premium (1-q)/q to each agent that survives in a period and also confiscates the wealth of

27
deceased agents and redistribute it to newborns and surviving generations. Denoting government debt with Ba,s, Π after tax dividends by the firms, τL labor income tax, Φ any relevant rebates, P the aggregate price index, W the nominal wage, S the nominal exchange rate, Aa,t = Fa,t + St-1 F*
a,t net foreign assets (NFA), Vi the value claim to all future profits of firm i, where i є [0,n], and, finally, xi
a,t the share of firm i owned by the representative agent born in period a in the beginning of period t, we have the agent’s nominal budget constraint (abstracting from personal income taxation for simplicity):
( )( ) ( )[ ]
( )[ ]∫∫
∫
Φ+∏++−+
+++++=
++++
−
+++
ti
tait
ita
ittatl
tatttatatta
ita
ittattatatat
dixdixVLWq
FSiFBiMq
dixVFSFMCP
,,,
*,
*,,1,
1,*
1,1,,,
11
111
τ
Maximizing the utility function subject to the budget constraint yields optimality conditions that dictate the agent’s behavior. Among them is a Euler equation (stating the preference to smooth consumption), and a labor supply schedule. It is important to underscore that because agents choose the amount of labor effort optimally, the labor income tax will have distortionary effects on the consumption and leisure choices. Furthermore, since NFA is composed of a home and a foreign asset, a standard uncovered interest parity (UIP) condition follows from the households’ optimization problem, which underpins the main financial linkage between countries. Botman, Laxton, Muir, and Romanov (2006) show that using the budget constraint along with the first order conditions, the decision rule of the optimizing agents, denoted opt
taC , can
be written as the sum of human wealth, taH , , and financial holdings:
( )( )[ ]
( ) ( )[ ],11
,111
,,,
1,1,11,,,
ssssLts
tsstta
tatattatat
opttat
LWqRH
BAiMq
HD
CP
Θ+−Ψ−=
⎭⎬⎫
⎩⎨⎧
++++=
∑∞
=
−
−−−−
τ
Where, for simplicity, we assume that period profits (captured by the term sΘ ) are distributed equally across consumers. Also, Ψ denotes the share of rule-of-thumb consumers and tD is the marginal propensity to consume out of total wealth. Aggregate consumption by rule-of-thumb consumers is given by:
( )[ ],1 ,, ssssLrot
tat LWCP Θ+−Ψ= τ

28
The final consumption good in the home economy comprises traded, CT, and nontraded, CN, goods, and takes the form:
( )11111
1−−−
⎥⎦
⎤⎢⎣
⎡−+=
εε
εε
εεε
ε γγ NT CCC
In turn, CT is composed of home, CH, and foreign, CF, goods, which is also aggregated using a similar CES function. Both the traded and nontraded goods are themselves baskets of individual goods. For example, the nontraded good is composed of varieties, CN(i), produced by an arbitrary firm in the nontraded goods sector, with i є [0,n]. More formally:
( )11
)(1 −−
⎥⎥⎦
⎤
⎢⎢⎣
⎡⎟⎠⎞
⎜⎝⎛= ∫
θθ
θθθ
diiCn
C NN
The domestic traded good, CH, is a similar basket of differentiated varieties. With the standard restrictions on parameters, we can obtain an optimization-based price index for each consumption aggregate.
The measure of inequality used in the model is a consumption gini coefficient. This coefficient is calculated from an approximation of the consumption Lorenz curve. Since there are only two types of consumers—optimizing and liquidity constrained—the expression for the gini coefficient is the difference between the share liquidity constrained consumers make up in the population and their share in total consumption.
Firms
A typical firm, in either sector, maximizes the discounted value of current and future dividends, subject to a CES production technology, and a law of motion for capital. Denoting output with Y, capital with K (subject to quadratic adjustment costs), investment with I, productivity with Z, and the corporate income tax rate with τп, we have:
( )[ ]
( ) ( )( )
( ) ( )
( ) sisisi
si
sisississ
sH
sssi
tssssssisst
IKK
ZLKY
KI
IPLWYP
iP
KMPKPPRMax
,,1,
11111
,
2,
,,,
1
,,
,,,
1
1
2)(
1
+−=
⎥⎥⎦
⎤
⎢⎢⎣
⎡−+=
⎥⎥⎦
⎤
⎢⎢⎣
⎡⎟⎟⎠
⎞⎜⎜⎝
⎛+−−−=Π
−−Π
+
−−−
−
Π
∞
=Π∑
δ
μμ
ψτ
δτ
ξξ
ξξ
ξξξ
ξ
θ
θ

29
where δ, ξ, μ, θ, and MPK denote the rate of capital depreciation, the elasticity of substitution between the factors of production, the bias towards the use of capital in the production function, the elasticity of substitution between the goods produced by the firm, and the marginal product of capital, respectively. Firms choose the optimal levels of capital and labor for production, but, exploiting their monopoly power, they also optimally set the price of their individual variety above marginal cost. Notice that the corporate income tax applies to both the return of capital and excess profits resulting from monopolistic competition.
Government and Fiscal Policy
All government spending, G, falls on nontraded goods. Expenditures are financed by collecting taxes, issuance of debt, and seignorage. The nominal government budget constraint is therefore:
( ) ( ) 11, 1 +− +−+=++ ttttttttN BMMTBiGP
Fiscal closure is achieved by specifying a target path for the desired level of government debt as a ratio of GDP, denoted by b*. In the standard version of GFM, the aggregate tax rate, τ, adjusts until the actual debt-to-GDP ratio coincides with the target. By default, the change in the aggregate tax rate is achieved through a change in the labor income tax, but alternative adjustment (personal or corporate income taxation) are possible as well. The tax rate is determined by the following set of equations:
( ) ( )
( ) ,1
,1
*2
1
11
*1
_
⎟⎟⎠
⎞⎜⎜⎝
⎛Δ−
Δ+⎟⎟
⎠
⎞⎜⎜⎝
⎛−−−=
−++=
−
−t
t
t
t
tt
t
tt
tttttt
bGDP
Bv
GDPB
vbvGDP
Bdebtgap
debtgap τϕτϕτ
where φ is an exogenous (or dummy) variable that can temporary fix the tax rate at a certain
level_
,τ . As shown in Botman et al. (2006), in the case when φ=1, this rule reduces to a simple error-correction formulation whereby the gap between the actual and desired government debt-to-GDP ratio gradually disappears. More specifically:
( ) ,1 *2
1
11
*1 ⎟⎟
⎠
⎞⎜⎜⎝
⎛Δ−
Δ−−+=
−
−t
t
t
t
tt
t
t bGDP
Bv
GDPB
vbvGDP
B
where the term v2>0, prevents excessive cycling in the tax rate and the real economy. Characteristics of the “Rest of the World”
The current account balance for the home economy is the sum of interest receipts on the stock of net foreign assets plus the trade balance:

30
,11 tttt TBALAiCBAL += −−
where tTBAL is defined to be equal to nominal exports minus nominal imports. The change in net foreign assets will simply be equal to the current account balance. For the foreign economy the mirror image of this expression will be the following:
,1
*
t
tt S
An
nA−
−=
where St denotes the nominal exchange rate, which (with RERt denoting the real exchange rate) is equal to:
*t
ttt P
PRERS =
From the uncovered interest parity UIP condition, the real exchange rate, with r denoting the real interest rate, will be the following.
*1 11
rrRERRER tt +
+=+

31
References Department of Community Medicine and School of Public Health (DCMSPH), 2008,
Synopsis of Healthcare Financing Study: Projection of Hong Kong’s Healthcare Expenditure, March (Hong Kong: The University of Hong Kong).
Food and Health Bureau, 2008, Your Health Your Life—Healthcare Reform Consultation
Document, March (Hong Kong: Food and Health Bureau, Hong Kong Special Administrative Region Government).
Hsiao, William, and Peter Heller, 2007, What Macroeconomists Should Know about Health
Care Policy,” (Washington, DC: International Monetary Fund). OECD, 2006, “Projecting OECD Health and Long-Term Care Expenditures: What are the
Main Drivers?,” Economics Department Working Paper No. 477 (Paris: Organization for Economic Co-operation and Development).
Wagstaff, Adam, 2007, “Health Systems in East Asia: What Can Developing Countries
Learn From Japan and the Asian Tigers,” Health Economics, Vol. 16, pp. 441−456.