the macroalgal herbarium consortium accessing 150 years of specimen data to understand changes in...
TRANSCRIPT

The Macroalgal Herbarium Consortium
Accessing 150 Years of Specimen Data to Understand Changes in the Marine/Aquatic Environment
Janet Sullivan and Chris NeefusUniversity of New Hampshire
Consortium of Northeastern Herbaria meetingMontréal, June 2014

Eukaryota Tree of Life (Bauldauf 2003)
four divisions in two kingdoms
What are Macroalgae?

What are Macroalgae?
Rhodophyta (Red Algae) - 6,300 species in 10 orders
Chlorophyta (Green Algae) - 4,300 species in 15 orders
Charophyta - 3,500 species in 8 orders
Phaeophyta (Brown Algae) - 2,000 species in 18 orders

How are they important?• Foundation of aquatic ecosystems – provide food, shelter and
substrate for other organisms
• Maintain nutrient balance in aquatic ecosystem and produce oxygen
• $7.4 billion industry as human food, phycocolloids, pharmaceuticals
• Sensitive indicator of environmental changes in aquatic ecosystems
Photographs by Robert Lücking

What is the Macroalgal Herbarium Consortium?
• 49 institutions in 26 states and U.S. possessions
• 1.2 million specimens in collections ranging from 100 to 200,000
• Project goal is to digitize (image, database, georeference) all of them
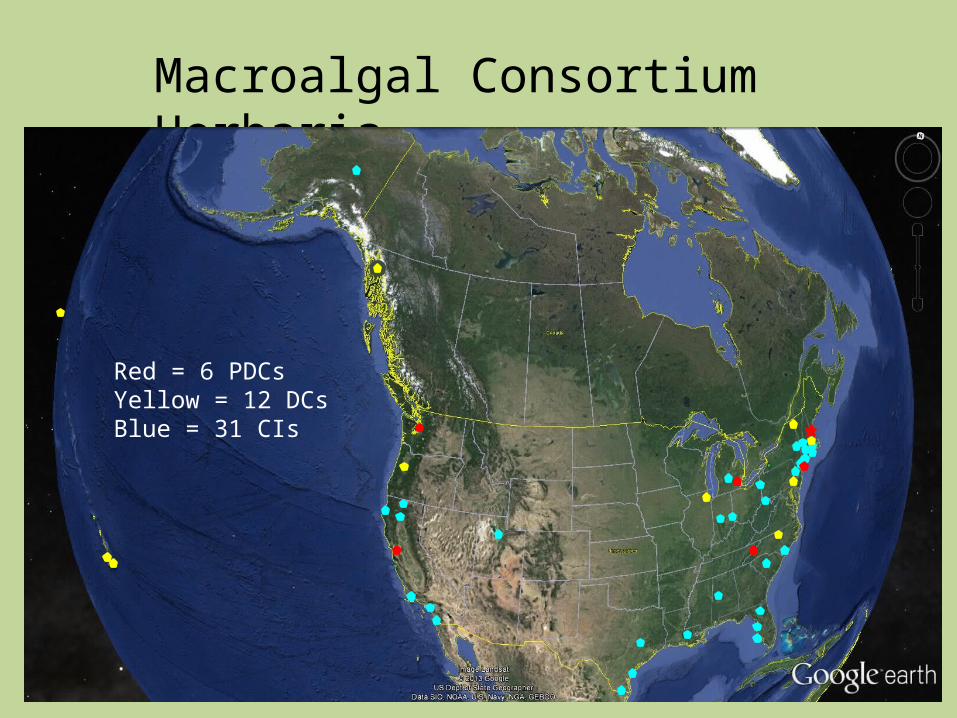
Macroalgal Consortium Herbaria
Red = 6 PDCsYellow = 12 DCsBlue = 31 CIs

Workflow – Step 1
• Any pre-digitization curation
• Barcode placement
Step 1 – Any pre-
digitization curation
accomplished
Step 2 – Specimen is
barcoded and skeletal label data captured in an Excel file
(or .csv)
Step 3 - High resolution
image captured
Step 4 - Image and label data uploaded to MHC Portal
Step 5 – Additional label data
transcribed from within the portal
Step 6 – Specimens
georeferenced from within the portal

Workflow – Step 2Skeletal label data captured in Excel or .csv file

Workflow – Step 3High-Resolution Image Captured
• Lightbox/copystand• 21 to 36 megapixel camera• Camera Control Software• Adobe Lightroom (white balance, tone
curve adjustment, .jpg & .dng export)
http://macroalgae.unh.edu

Workflow – Step 4Image and label data uploaded to portal (http://macroalgae.org)

Family classifications and authors from
AlgaeBase via WoRMS

Additional label data transcribed from within the portal
Workflow – Step 5

Workflow – Step 6Specimens are georeferenced from within the portal

Information Sharing1. Data portal – http://macroalgae.org2. Consortium Website – http://macroalgae.unh.edu

1. Undergraduate and Graduate Student Participation• Training in Imaging, Data Transcription, Georeferencing• Research Opportunities
2. Internships at NY Botanical Garden and Field Museum3. Exhibits and Programs
• Field Museum (650,000 visitors)• Bishop Museum (450,000 visitors)
Broader Impacts of the Project

Broader Impacts of the Project
• Systematics• Floristic Diversity and Biogeography• Historical Comparisons
Assessing human impact on coastal environments Assessing the impact of climate change on species distribution Tracking introduced and invasive species
4. Research Applications

Acknowledgments
and Ed Gilbert, lead developer of Symbiota
This material is based upon work supported by the National Science Foundation under Grant Number (NSF Grant Number:1304924)Any opinions, findings, and conclusions or recommendations expressed in this material are those of the author(s) and do not necessarily
reflect the views of the National Science Foundation.