the lunar rock and mineral characterization consortium: … · coordinated...
TRANSCRIPT

The lunar rock and mineral characterization consortium: Deconstruction and
integrated mineralogical, petrologic, and spectroscopic analyses of mare basalts
Peter J. ISAACSON1*, Amit BASU SARBADHIKARI2,3, Carle M. PIETERS1, Rachel L. KLIMA1,4,Takahiro HIROI1, Yang LIU2, and Lawrence A. TAYLOR2
1Department of Geological Sciences, Brown University, Box 1846, Providence, Rhode Island 02912, USA2Planetary Geosciences Institute, Department of Earth & Planetary Sciences, University of Tennessee, Knoxville,
Tennessee 37996, USA3The Pheasant Memorial Laboratory for Geochemistry and Cosmochemistry, Institute for Study of the Earth’s Interior,
Okayama University at Misasa, Tottori 682-0193, Japan4Planetary Exploration Group, Space Department, Johns Hopkins University Applied Physics Lab, Laurel,
Maryland 20723, USA*Corresponding author. E-mail: [email protected]
(Received 12 January 2010; revision accepted 15 October 2010)
Abstract–The lunar rock and mineral characterization consortium (LRMCC) has conductedcoordinated mineralogy ⁄petrography ⁄ spectroscopy analyses of a suite of pristine lunarbasalts. Four basalt slabs (two low-Ti, two high-Ti) and paired thin sections were analyzed.Thin sections were analyzed for mineralogy ⁄petrography, while the slabs were used toprepare particulate separates of major mineral phases and bulk samples. Mineral separatesand particulate bulk samples were crushed to controlled grain sizes and their reflectancespectra measured in the NASA RELAB at Brown University. The resulting data setprovides an essential foundation for spectral mixing models, offers valuable endmemberconstraints for space weathering analyses, and represents critical new ground truth resultsfor lunar science and exploration efforts.
INTRODUCTION
The current generation of lunar exploration is rich,with a number of orbital missions in operation andfuture surface missions in the planning phases toaddress critical, outstanding questions in lunar science.The present suite of lunar orbiters has returned and isreturning global data from a range of sophisticatedinstruments, which will allow the lunar sciencecommunity to address questions that have been poorlyconstrained due to limitations in the available data.
Optical instruments offer the highest spatialresolution for analyzing and mapping the Moon’ssurface mineralogy. A number of high-qualityinstruments on the current suite of orbiters provide thehigh spatial resolution, broad spectral coverage, andhigh spectral resolution data needed for accurateinterpretation of lunar surface mineralogy (Ohtake et al.2007; Matsunaga et al. 2008; Kiran Kumar et al. 2009;Mall et al. 2009; Pieters et al. 2009; Tschimmel et al.
2009). Interpretation of such data, however, relies inlarge part on links to returned samples analyzed interrestrial laboratories (e.g., Pieters 1986, 1999; Luceyet al. 2000; Pieters et al. 2000; Gillis et al. 2003). Assuch, careful measurement of samples returned by theApollo and Luna programs is essential for the currentera of lunar exploration.
Optical instruments that measure reflected visible tonear-infrared (VNIR) radiation are sensitive to surfacemineralogy because highly diagnostic absorptionfeatures occur in this wavelength region. The basicreflectance properties of the major lunar minerals areknown and based on mineral physics. In the VNIR, themajor lunar minerals have diagnostic absorptionfeatures caused by crystal field transitions in transitionmetal (largely Fe2+) cations in distorted crystal latticesites. Pyroxenes have diagnostic absorptions at 1 and2 lm, while olivine has a combination absorption near1 lm (Burns 1970, 1993; Adams 1974). Both minerals’absorption features shift in generally understood ways
� The Meteoritical Society, 2011. 228
Meteoritics & Planetary Science 46, Nr 2, 228–251 (2011)
doi: 10.1111/j.1945-5100.2010.01148.x

based on mineral composition (e.g., Burns 1974; Cloutisand Gaffey 1991; Sunshine and Pieters 1998; Klimaet al. 2007). Iron-bearing plagioclase has a weaker butstill diagnostic absorption feature near 1.3 lm, althoughit is often overwhelmed by the more optically activepyroxene or olivine features in spectra of bulk rocks(Bell and Mao 1973; Adams and Goullaud 1978; Burns1993). Example reflectance spectra of common lunarminerals are presented in the Supporting Information(Fig. S4). While the major crystal field absorptions aregenerally well understood, minor element substitutionsare sensitive to the local environment and can havesubstantial effects on the spectral properties of lunarminerals. Because lunar conditions are often distinct insubtle ways, it is important to use real lunar materialsas ground truth rather than relying on synthetic orterrestrial analogs. The lunar rock and mineralcharacterization consortium (LRMCC) has conductedcareful, integrated measurements of lunar materials withthe goal of extending the library of well-characterizedlunar materials available as ground truth.
The LRMCC builds on the work of the lunar soilcharacterization consortium (LSCC), which conduc-ted coordinated mineralogy ⁄petrography ⁄ spectroscopyanalyses of a suite of lunar soils of differentcomposition and maturity, but did not analyze theunweathered component of the lunar sample suite(Taylor et al. 2001, 2010). The LRMCC is conductingsimilar coordinated analyses, and has initially focusedon pristine, unweathered mare basalt samples andmineral separates prepared from the bulk rock samples.The measurement and compositional characterization ofboth mineral separates and the rocks from which theywere prepared are of particular value for spectralunmixing and space weathering models. In the case ofspectral unmixing, the LRMCC samples representexceptional constraints for models, because spectra ofboth bulk rock samples and their exact constituent(endmember) minerals were obtained. Spectral unmixingis discussed further in the Mixing Models section. In thecase of space weathering models, these measurementsprovide accurate constraints on the starting materialsfor the space weathering process, which, whencombined with the results of the LSCC, should providea more complete assessment of the space weathering oflunar materials (e.g., Pieters et al. 2000; Hapke 2001;Noble et al. 2001, 2007; Taylor et al. 2001, 2010; Sasakiet al. 2003). In total, the combined results from theLSCC and LRMCC provide a suite of well-characterized ground truth lunar materials that span arange of compositions and maturities. These groundtruth data provide a strong foundation for lunar scienceand exploration with these new high spectral resolutiondata sets.
METHODS, SAMPLES, AND SAMPLE
PREPARATION
Samples, Petrography, Modal Mineralogy
The LRMCC was allocated slabs and associatedthin sections of two low-Ti basalts (15058 and 15555)and two high-Ti basalts (70017 and 70035). The thinsections and slabs were created specifically for thecoordinated analyses of this study. The thin sectionsand slab samples were prepared from adjacent portionsof the parent samples to ensure similar mineralogy. Thethin sections (15058,248, 15555,971, 70017,541,70035,193) were used for detailed mineralogy andpetrography analyses. The slabs (15058,276, 15555,965,70017,535, 70035,188) were used to prepare particulatebulk samples, a portion of which were used for theseparation of mineral separates. Mineral separation wasdone by hand picking under an optical microscope atthe University of Tennessee. Mineral separates wereprepared from a 125–250 lm size fraction and visuallychecked for purity. Grains rejected for purity from theseseparations (i.e., grains with intergrown phases) werecrushed to less than 125 lm to remove impurities.Ethanol was used in the crushing process for 15058 and70035, while 15555 and 70017 were crushed without theuse of any liquids. No liquids were used to sieve thesamples. Representative subsamples of the mineralseparates were used to prepare grain mounts forchemical analyses. Because minerals were separated onthe basis of color, the separations do not follow strictcompositional divisions (e.g., pigeonite from augite).Thus, it is important to analyze directly thecompositional ranges of the prepared separates throughanalysis of these grain mounts, both to verify that theseparates are representative of the range of mineralcompositions found in the thin section and tounderstand precisely the composition of the minerals tobe analyzed with reflectance spectroscopy.
The paired thin sections were used to analyze thepetrography, modal mineralogy, and mineralcomposition of the basalt samples. Sample petrographywas evaluated using a combination of opticalmicroscopy and backscattered electron imagery.Chemical analyses of minerals were performed with theCameca SX-50 electron microprobe (EMP) at theUniversity of Tennessee. Operating conditions were asfollows: 15 keV accelerating voltage, 20 nA beamcurrent, and a 2 lm beam diameter, except forplagioclase analyses, in which case a 5 lm diameterbeam and 10 nA current were used to minimize loss ofvolatile elements K and Na. Modal mineralogy wasdetermined using the Oxford FeatureScan softwarepackage of an Oxford instrument energy dispersive
Lunar rock and mineral characterization consortium (LRMCC) 229

spectrometer (EDS) interfaced to the microprobe.Threshold values of cation abundance (based on EDSmeasurements) were specified and used to classify thevarious phases in the thin section. EDS spectra arequalitative (absolute cation abundances cannot bedetermined). Cation abundance thresholds were thusdefined as ‘‘corrected window percent’’ (CWPC). Thesevalues are defined as percentage of the counts in anelement’s energy window (where its ‘‘peak’’ in EDSspectra occurs) relative to the total count over allwindows after a background removal. However, theseCWPC are generally comparable to the given element’soxide weight percentage (Taylor et al. 1996). Modalmineralogy was then determined by an automated pointcounting procedure on the classified thin section. Adetailed description of this procedure is provided byTaylor et al. (1996). The CWPC values used in thisstudy are reported in Table 1.
The chemical compositions of the prepared mineralseparates were also determined by EMP analysis. Arepresentative subset of grains from each separate wasprepared as grain mounts for EMP. Compositions werecompared to those obtained from thin section analysesto ensure that the prepared mineral separates wererepresentative of the range of compositions found in thebulk sample.
While the mineral separates are expected to becompositionally similar to the bulk samples whenconsidered inclusively, it is necessary to check theircomposition, as there is a possibility that thepreparation of mineral separates by hand picking maybias the composition of the separates. Furthermore, thethin sections were classified modally by mineralchemistry, while the modal abundance of the mineralseparates in the bulk sample cannot be estimated. Thus,accurate compositional assessments of the thin sectionsare important in that they allow one to estimate thedegree to which the various pyroxene compositions arerepresented in the separates and the degree to which theseparates are representative of the overall mineralcompositions in the thin sections. In other words, thecomposition of the mineral separates is critical forplacing the mineral separates into the context of themeasured modal abundances from the thin sections.
Reflectance Spectroscopy
The particulate samples were used for spectroscopicmeasurements in the NASA Reflectance ExperimentLaboratory (RELAB) at Brown University. Particulatesamples were first received at Brown with a grain sizerange of about 125–250 lm. Initial measurements ofthese samples were made across a range of wavelengths,but this grain size range is too coarse for typical lunar
applications. The samples were crushed and sieved to aseries of finer grain sizes, first less than 125 lm andthen less than 45 lm, and measurements were collectedat each grain size prior to preparation of the next.Samples were crushed under dry conditions, with noliquids used either in the crushing or sieving process. Arough estimate of grain size distribution in the less than125 lm splits was obtained prior to crushing the
Table 1. Corrected window percent ranges used toclassify phases for modal mineralogy analyses.Mineral phase Cation Inclusive range
Olivine Mg 11–50
Si 35–60Ca 0–3
Orthopyroxene Ca 0–3.7
Si 50–75Mg 10–33Al 0–5
Pigeonite Si 43–72Ca 2–15Al 0–6
Mg 5–29Augite Si 39–70
Ca 14–40Al 0–7
Mg 4–25Fe-pyroxene Si 39–75
Ca 3–30
Mg 0–5Al 0–6
Plagioclase Al 20–43
Si 35–65Fe 0–2Ca 10–40
Silica Si 85–100K 0–5
Ilmenite Fe 20–50Ti 45–70
Chromite Cr 10–45Si 0–10
Ulvospinel Ti 15–45
Al 0–8Fe 40–75
Armalcolite Ti 68–85
Al 0–6Fe 5–20
Rutile Ti 85–100Fe 0–7
Troilite ⁄Metal Fe 35–100Si 0–12Ti 0–7
K-rich glass Si 40–90Al 4–29K 3–20
Phosphates P 20–70Ca 20–70
230 P. J. Isaacson et al.

samples to less than 45 lm. Prior to crushing, the lessthan 125 lm splits were passed through a 45 lm sieve,and the masses of the less than 45 lm and 45 lm to125 lm splits were measured by weighing. These resultsare presented graphically in the Supporting Information(Fig. S5). While not a true estimate of grain sizedistribution, this approach provides a rough estimate ofthe relative abundances of coarse versus fine particles inthe less than 125 lm splits. The less than 125 lmseparates are largely dominated by coarse particles,though most contain a non-negligible component of fineparticles. These results indicate that the mean particlesize of the less than 125 lm separates tends to be largerthan might be assumed. Several separates, most notablyplagioclase, tended to have slightly more fine particlesin the less than 125 lm split, perhaps due to lowerresistance to the crushing process.
Particle size should not be mistaken for the grainsize of the samples, particularly for the bulk samples(e.g., Bohren and Huffman 1983; Poulet and Erard2004). When the samples are crushed, a mixture ofsingle-grain and multigrain particles is produced. In thecase of multigrain particles (either single-phase ormultiple-phase), photons interact with multiplegrains ⁄phases while ‘‘traversing’’ a single particle. Thissituation has optical properties very different from thatin which mineral grains are physically separated fromone another. Even in typical nonlinear mixture modelsdesigned to deal with intimate mixtures, particles areassumed to be fundamentally mono-minerallic, withvoid spaces that affect the material’s scatteringproperties present between grains (e.g., Hapke 1993).Multimineral particles represent a more complex systemto model accurately, and the reader is cautioned thatthe samples discussed here often exhibit these additionalcomplexities.
Spectra were acquired as bidirectional reflectance(BDR) at 30� incidence and 0� emergence from 0.28 lmto 2.6 lm, and as biconical reflectance by FT-IR to50 lm. BDR spectra are the most applicable as groundtruth and to quantitative models, because they matchthe observation geometries of orbital sensors. A moredetailed description of the RELAB facilities is providedby Pieters and Hiroi (2004). BDR spectra were acquiredwith 0.005 lm (5 nm) spectral resolution. The spectralresolution of FT-IR measurements is variable withwavelength in nanometers, as spectra were acquiredwith a spectral resolution of 4 cm)1. We spliced theacquired FT-IR spectra to the BDR spectra throughmultiplicative scaling, which provides a better constraintof absolute reflectance and band strength beyond2.6 lm. Biconical measurements are not directlycomparable to BDR measurements for quantitativeassessments of band strengths and albedos.
Spectral reflectance results are presented bywavelength range: visible ⁄NIR (300–2600 nm), NIR ⁄short wavelength mid-IR (2.5–8 lm), and mid-IR(7–9.5 lm). The midinfrared wavelength region containsa number of diagnostic mineral absorption features,although the process responsible for most features in thiswavelength region is fundamentally different from thatin the visible ⁄NIR for the lunar minerals of interest tothis study. In the visible ⁄NIR, the absorption featuresare caused by crystal field transitions largely in Fe2+
ions. In the midinfrared, absorptions are linked tovibrations, stretches, and bends in crystal latticestructures tied to Si-O bonds with fundamentalabsorptions occurring at longer wavelengths (near10 lm). Specific features are caused by overtones andcombinations of these fundamental molecular vibrations,stretches, and bends (e.g., Salisbury and Walter 1989;Clark 1999; Cooper et al. 2002).
RESULTS
Mineralogy and Petrography
We discuss the major aspects of the mineralogy ⁄petrology analyses of these samples, particularly thoseaspects most relevant to analysis of the reflectancespectra. Detailed mineralogy ⁄petrography data arepresented in the Supporting Information to this article.Modal abundances determined from analyses of the thinsection samples are presented in Table 2. Note that thesemodal abundance data for the thin sections are notequivalent to the modal abundance of the mineralseparates, as separations were performed manually onthe basis of color rather than composition. Thisdistinction is discussed further below and in the MixingModels section. Overall sample texture is illustratedbriefly in Fig. 1. Sample 15058 is generally subophitic,whereas 15555 and the high-Ti samples are generallypoikilitic. Pyroxenes, the dominant mineral in thesesamples, were found to have compositions similar tothose reported by previous studies (Bence and Papike1972; Papike et al. 1974; Ryder 1985). Pyroxenes arestrongly zoned for all samples analyzed by the LRMCC.The low-Ti sample pyroxenes are zoned from core torim, becoming significantly more iron-rich toward therim. The high-Ti sample pyroxenes exhibit complexsector zoning, making a common core to rim zoningprofile difficult to establish, although the pyroxenesgenerally become more Fe-rich in their rims.
The mineral separates are all quite pure, beingestimated at 98–99% purity for all prepared separatesbased on visual inspection. However, in many cases,when prepared for reflectance measurements, theseparates show minor amounts of visible contamination
Lunar rock and mineral characterization consortium (LRMCC) 231

by other phases, so caution should be taken wheninterpreting the reflectance data. The composition of theprepared mineral separates (determined from analysis ofthe grain mounts) and of the mineral phases(determined from thin section analyses) are presentedgraphically in Fig. 2. The prepared mineral separateswere found to have compositional ranges consistentwith those observed in the thin section analyses.Average geochemical compositions of the mineralphases analyzed in the thin sections and of the preparedmineral separates are presented in the SupportingInformation (Tables S1–S8).
Mineral separates from slab sample 15058 areidentified as green pyroxene, brown pyroxene, andplagioclase. Green pyroxenes are orthopyroxenes andpigeonites, containing primarily Mg-rich compositions.Brown pyroxenes are primarily augites, containing bothMg-rich and Fe-rich clinopyroxene compositions.Plagioclases are very Ca-rich (typical of plagioclasesfrom mare basalts) and relatively Fe-rich (about 0.6wt% FeO), and are compositionally indistinguishablefrom the plagioclases in the thin section.
Sample 15555 separates consist of greenish olivine,two varieties of pyroxene (reddish brown and lightbrown), and plagioclase. Pyroxene compositions areconsistent with those observed in the polished thinsections; the reddish-brown pyroxenes are generallyMg-poor augite, and the light brown pyroxenes aregenerally Mg-rich subcalcic augite. Olivine andplagioclase have very similar compositional ranges tothose observed in thin section, though the olivineseparate lacks the fayalitic olivines (Fo5–10) seen in thinsection. The olivine contains small inclusions of Cr-richspinel (chromite). These are volumetrically minor, but
are quite significant optically. These chromites can beseen by visual inspection under a binocular microscope,and occur as inclusions (possibly nucleation sites) withinolivine grains. Due to their presence within olivinegrains, their strong absorption features, and their smallsize, they will have a disproportionally large opticaleffect. The plagioclase has slightly lower FeO than15058 (about 0.5 wt%)
Mineral separates from 70017 include pyroxene,plagioclase, and opaque oxides dominated by ilmenite.The pyroxenes were separated into two classes: darkbrown pyroxenes are generally augites, while lightbrown ones are mostly pigeonites. The plagioclaseseparate has compositions consistent with those foundin analysis of the polished thin section, and has lowerFeO than found in the Apollo 15 plagioclase separates(about 0.35 wt%). The high-Ca pyroxenes (augites)were found to be rich in TiO2 (up to about 3.5 wt%).
Sample 70035 separates are light brown pyroxene,dark brown pyroxene, plagioclase, and opaque oxidesdominated by ilmenite. As in 70017, the dark brownpyroxenes are mainly augites, while the light brownpyroxenes are generally pigeonites. Plagioclasecompositions are essentially identical to those observedin the thin section sample, and FeO content is similar tothe 70017 plagioclase (approximately 0.35 wt%). Thehigh-Ca pyroxenes were found to contain abundancesof TiO2 comparable to those observed in the 70017high-Ca pyroxenes (approximately 3.5 wt%). Some ofthe lower-Ca augites do not show enrichment in TiO2,suggesting that the system was enriched in TiO2 at somepoint during the augite crystallization sequence, but notwhile pigeonites and subcalcic augites formed later inthe sequence. This is discussed in the SupportingInformation (see the sections on Mineral Compositionand Pyroxene Zoning and Crystallization History, Figs.S1–S3).
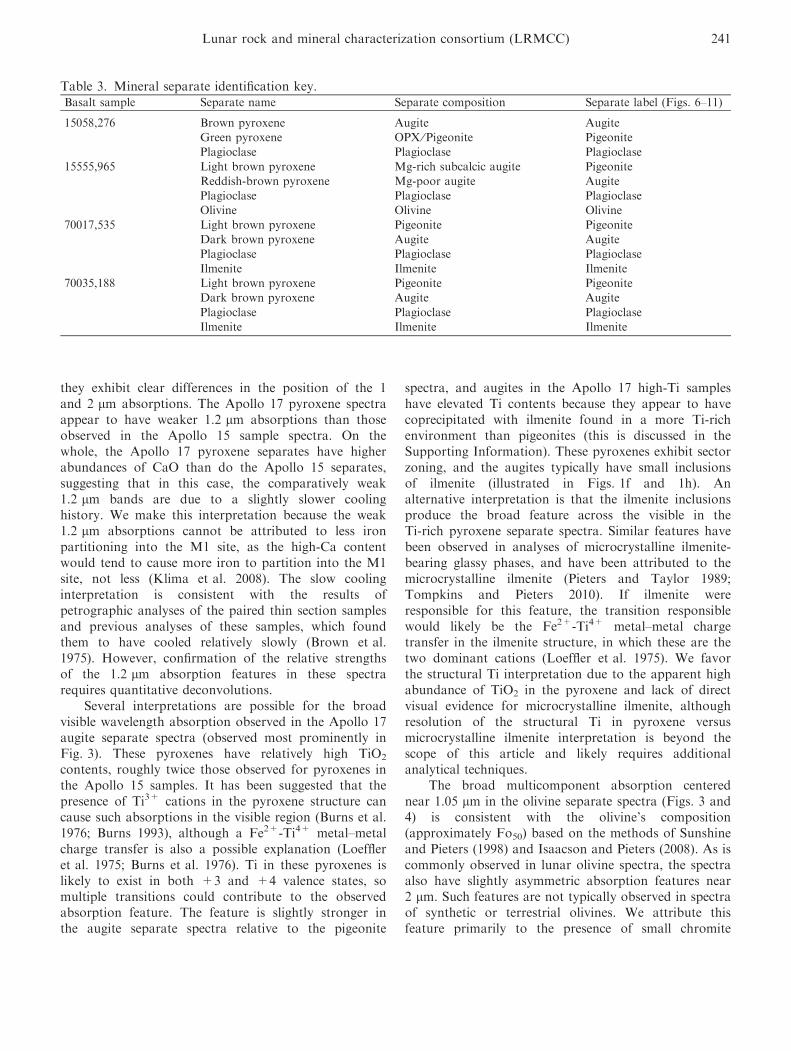
Mineral separates often span a range ofcompositions. For simplicity, pyroxenes are labeled as‘‘augite’’ or ‘‘pigeonite’’ in the reflectance spectra figures(Figs. 3–8), although these labels do not alwayscorrespond exactly to the composition of the separate.The key between actual separate names and the separatelabels as plotted is given in Table 3, which lists theseparate names as presented above, the separates’general composition as given above, and the separates’labeled composition in the reflectance spectra figures.
Reflectance Spectroscopy
The results of the spectral reflectance analyses aredescribed in this section grouped by wavelength range.Labels given to spectra shown in the figures (Figs. 3–8)are linked to specific mineral species in Table 3.
Table 2. Modal abundances from thin sectionanalysis.
Mineral phase 15058,248 15555,971 70017,541 70035,193Olivine 0.1
(fayalite)11.8 1.5 1.2
Orthopyroxene 3.7 0.3 – –Pigeonite 25.6 32.4 17.7 20.2Augite 16.7 18.6 34.2 27.7
Fe-pyroxene 17.1 5.4 0.6 1.1Plagioclase 30.1 27.3 25.7 30.1Tridymite 3.5 0.8 1.6 0.9
Ilmenite 1.4 1.3 17.3 17.4Chromite <0.1 0.4 – –Ulvospinel 0.9 1.0 0.3 0.3
Armalcolite – – 0.1 0.1Rutile – – <0.1 –Troilite ⁄Metal 0.2 0.2 0.3 0.4K-rich glass 0.5 0.4 0.6 0.6
Phosphates 0.1 0.1 0.1 <0.1Total 99.9 100 100 100
232 P. J. Isaacson et al.

Visible ⁄ NIR Bidirectional ReflectanceThe spectra of coarse and fine particle separates are
shown in Figs. 3 and 4, respectively. The fine-grainedsample spectra are generally consistent with the coarse-grained sample spectra, though with increased albedosand decreased band strengths.
Each basalt sample contains a range of pyroxenecompositions, as well as abundant plagioclase. Only15555 contains sufficient modal olivine to prepare amineral separate (the other samples exhibit about 2%modal olivine or less). Pyroxenes were selected andseparated into two groups on the basis of color. These
Fig. 1. Photomicrographs of LRMCC thin sections illustrating sample texture. a) and e) were collected with reflected light, andthe other images with transmitted light (plane-polarized for [c] and [h], cross-polarized for [b], [d], [f], [g]). a) demonstrates thesubophitic texture characteristic of 15058. b) exhibits zoning from pigeonite core to augite rim in a pyroxene grain from 15058; asimilar trend is observed in pyroxenes from 15555 (d). c) 15555 thin section showing euhedral chromite grain within pyroxeneand poikilitic enclosure of olivine in plagioclase. The sample exhibits poikilitic enclosure of pyroxene and olivine by plagioclase.e) exhibits the typical poikilitic texture of plagioclase in 70017, with elongated pyroxenes intergrown with ilmenite andplagioclase. g) shows the poikilitic texture of plagioclase in 70035. f) and h) show the complex sector zoning observed inpyroxenes from 70017 (f) and 70035 (h). Inclusions of ilmenite within pyroxenes are apparent in both cases.
Lunar rock and mineral characterization consortium (LRMCC) 233

Fig. 2. Compositions of major silicate mineral phases found in LRMCC samples. The left column shows the compositions of theprepared mineral separates, while the right column illustrates the compositions found in the thin section analyses. Thecompositions of the prepared separates generally reflect those found in thin section. Note that an olivine separate was obtainedonly from 15555,965. While olivine is present in the other samples, its modal abundance is too low to allow the preparation of aseparate.
234 P. J. Isaacson et al.

pyroxenes vary in composition as indicated by Fig. 2,which leads to different overall wavelength positions ofthe 1 and 2 lm absorption features. The separatescontaining more Ca-rich pyroxene (generally greaterthan 15–20% Ca) exhibit spectra with longerwavelength absorption features. The pyroxene separatespectra appear to exhibit 1.2 lm absorption features,which may vary in strength between compositions.Quantitative deconvolutions (e.g., see the QuantitativeAbsorption Modeling section) of the spectra arerequired to confirm this observation, however. TheApollo 17 samples are high-Ti basalts, and the augiteseparates from those rocks contain relatively highabundances of TiO2 (up to 3.8 wt%, as discussed in theMixing Models section). The Apollo 17 augite spectrashow a weak but perceptible feature in the visible (0.4–0.75 lm), which is essentially absent in the Apollo 17pigeonite separate spectra. Where present, this feature is
more pronounced in the coarse-grained samplepyroxene spectra.
The plagioclase spectra show relatively strongabsorption features near 1.3 lm. The plagioclase spectrashow marked drop-offs in reflectance at shortwavelength (less than 0.4 lm), and often shallowabsorption features in the visible (0.4–0.8 lm). Theyalso exhibit a broad absorption or altered continuumslope beyond the principal 1.3 lm feature. The Apollo17 plagioclase spectra differ from the Apollo 15plagioclase spectra in strength of the 1.3 lm feature andin long wavelength continuum slope. Specifically, theApollo 17 plagioclase spectra exhibit weaker 1.3 lmfeatures and steeper long wavelength continuum slopes,reaching higher reflectance values at 2.6 lm. The 70035plagioclase spectra have a weak feature near 1 lm,which is notably stronger in the fine-grained samplespectrum (Fig. 4).
Fig. 3. Visible and near-infrared spectra of coarse particle samples. Pyroxenes are labeled as pigeonites and augites for labelingsimplicity, but some compositional overlap exists, and the ‘‘pigeonite’’ separates do contain some minor orthopyroxene.
Lunar rock and mineral characterization consortium (LRMCC) 235

The olivine separate spectra for 15555 exhibit thecharacteristic composite absorption feature near 1 lm(Burns 1974; Sunshine and Pieters 1998; Dyar et al.2009), as well as an asymmetric long wavelengthabsorption feature. The ilmenite spectra are generallyflat and featureless through the visible, with apronounced upturn around 1.7 lm and a roll-off atlong wavelengths (2.4 lm to 2.6 lm). They do exhibit aminor reflectance minimum at about 0.5 lm, and apeak in reflectance at about 1 lm which becomesstronger at finer particle size.
The bulk basalt sample spectra generally resemblethe pyroxene spectra, as pyroxene is the dominantoptical phase in these samples. The 1 and 2 lmpyroxene absorptions in the bulk sample are broadenedrelative to the 1 and 2 lm features observed in spectraof the pyroxene separates. The 15555 bulk samplespectrum has an especially broad 1 lm absorption. Thebroad visible wavelength feature seen in the Ti-rich
pyroxene spectra is also subtly apparent in the high-Tibulk sample spectra. The high-Ti sample spectra exhibitnotable differences from spectra of the pyroxenesseparated from those samples and from the low-Ti bulksample spectra. The high-Ti bulk sample spectra havereduced albedos, have weakened 1 and 2 lm pyroxeneabsorptions (especially at the smaller particle size), andshow pronounced upturns in reflectance at wavelengthsbeyond about 1.5 lm.
NIR ⁄ Short Wavelength Mid-IR 2.5–8 lm (VolumeScattering)
The spectra of coarse and fine particle samples forthe long wavelength NIR region are shown in Figs. 5and 6, respectively. Spectra are plotted in reflectance,though approximate ‘‘emissivity’’ spectra can beobtained by the simple Kirchhoff’s law relationship,which holds that emissivity is approximately equal to1––reflectance (e = 1)r) (e.g., Nicodemus 1965; Clark
Fig. 4. Visible and near-infrared spectra of fine particle samples.
236 P. J. Isaacson et al.

1999). This approximation has been shown generally tobe correct to first order (Salisbury 1993). For thepurposes of this discussion, the NIR ⁄ short wavelengthmid-IR wavelength region extends from 2.5 lm to 8 lm,stopping just short of the Christiansen feature forsilicates. The pyroxene separate spectra exhibit severalabsorption features near 5 and 6 lm. Plagioclase spectraexhibit weak absorption features near approximately4.4 lm. The Apollo 17 plagioclase separate spectra aresomewhat brighter in the 3 to 4 lm range than theApollo 15 plagioclase separate spectra. Olivine has someweak but detectable features between 5 and 6 lm thatare often very diagnostic (Pieters et al. 2008). Spectra ofall separates exhibit sharp absorption features near3.4 lm. These features are notably stronger in the 15058and 70035 separate spectra, and are quite weak in the
bulk sample spectra. Ilmenite lacks major features in thiswavelength region, but does show evidence for the same3.4 lm absorption seen in spectra of the other separates.Ilmenite (FeTiO3) is not a silicate mineral and thus doesnot exhibit Si-O vibrational absorptions. It is darkerthan the other separates in the 3–4 lm region. As in theNIR, the bulk sample spectra generally follow thebehavior of the pyroxene separates, though featurescaused by other minerals can be detected as well.
Spectra of all fine particle separates and some ofthe coarse particle separates exhibit a broad absorptionfeature near 3 lm. Among coarse particle samples, onlyplagioclase consistently exhibits a 3 lm feature. All fineparticle samples (separates and bulk) exhibit a 3 lmfeature, though the feature is the strongest in theplagioclase spectra.
Fig. 5. Midinfrared spectra of coarse particle samples in the volume-scattering wavelength region.
Lunar rock and mineral characterization consortium (LRMCC) 237

Mid-IR 7–9.5 lm (Volume–Surface Scattering)This wavelength region generally contains the
transition from volume to surface scattering in silicateminerals. As in the long wavelength NIR wavelengthregion, spectra are plotted in reflectance. Spectra for theLRMCC coarse and fine particle samples are presentedin Figs. 7 and 8, respectively. This wavelength regioncontains spectral features that are useful compositionalindicators, most notably the Christiansen feature, areflectance minimum and an emission maximum (e.g.,Salisbury 1993). The position of the Christiansen featureis controlled by the position of the fundamentalvibrational absorption feature, which is in turncontrolled by a material’s composition. While thewavelength is physically controlled by the degree ofdepolymerization of the silicate material, the wavelengthof the Christiansen feature has been shown to correlate
with index measurements of material chemistry such asSCFM (Si ⁄ [Si + Ca + Fe + Mg]). The featuregenerally moves to longer wavelengths as materialsbecome more mafic (SiO2 content decreases) (e.g.,Salisbury and Walter 1989; Cooper et al. 2002).
The lunar mineral separate spectra behave asexpected. The Christiansen features for the plagioclaseseparate spectra occur at shorter wavelengths, near 8 lmin all cases at both grain sizes. The pyroxene Christiansenfeatures occur at longer wavelengths, at slightly greaterthan 8.5 lm. The olivine separate spectra have aChristiansen feature at a very slightly longer wavelengththan the pyroxene spectra, as expected from olivine’smore mafic composition. They have composite features,with a second feature near 9.2 lm. The fine particleolivine separate spectrum (Fig. 8) differs from the coarseparticle spectrum (Fig. 7) in that the longer wavelength
Fig. 6. Midinfrared spectra of fine particle samples in the volume-scattering wavelength region.
238 P. J. Isaacson et al.

‘‘component’’ (approximately 9.2 lm) of the Christiansenfeature becomes stronger, and the reflectance minimumof the spectrum shifts to this component of the feature.Otherwise, the fine particle sample spectra are similar totheir coarse-grained counterparts, albeit with increasedspectral contrast. They also have steeper slopes fromabout 7 lm to the Christiansen feature due to theirhigher reflectance values at shorter wavelengths. Theilmenite spectra lack a distinctive Christiansen feature inthis wavelength region, and have higher reflectancethroughout, particularly in the fine-grained samplespectra. Ilmenite does not have a Christiansen feature inthe same wavelength region as the silicate mineralsbecause as a Fe-Ti oxide, it does not have a Si-Ovibrational absorption feature. A feature for ilmeniteoccurs at significantly longer wavelengths (approximately12.5 lm). The bulk sample spectra contain compositefeatures, due to the presence of multiple mineral species
in the sample that have Christiansen features at differentwavelengths.
DISCUSSION
Mineralogy ⁄Petrography
This paper focuses on integrated analyses ofpetrography and reflectance spectroscopy. Themineralogy and petrography results are presented herein the context of the insight they provide forinterpreting the reflectance spectroscopy results. Morespecific mineralogy and petrography results arediscussed in the Supporting Information. The mineralseparate compositions are presented explicitly, as theyare directly relevant to the interpretation of thereflectance spectra. Mineral separate compositions weremeasured prior to crushing the samples to controlled
Fig. 7. Midinfrared spectra of coarse particle samples in the wavelength region of transition from volume to surface scattering.The approximate wavelength ranges where Christiansen features occur are noted by arrows.
Lunar rock and mineral characterization consortium (LRMCC) 239

particle size ranges for reflectance spectroscopymeasurements. The process of crushing the mineralseparates may impart a compositional bias, as certainphases, compositions or textures may be more or lessresistant to crushing and thus may be concentrated intoa particular size separate (e.g., Lin and Somasundaran1972; Jari 1995). While we do not expect such a bias tobe a substantial source of error, particularly for theparticle sizes analyzed by the LRMCC, it must beconsidered in interpreting the results of this study.
Visible ⁄NIR Bidirectional Reflectance
The reflectance spectroscopy results for thiswavelength region are presented in Fig. 3 (coarseparticles) and Fig. 4 (fine particles). The positions of the1 and 2 lm pyroxene absorption features are consistentwith pyroxene compositions for the 2-pyroxene
separates prepared from each sample, as the higher-Capyroxenes have absorption features at longerwavelengths (e.g., Adams 1974; Cloutis and Gaffey1991). The 15058 augite spectra appear to have slightlystronger 1.2 lm absorption features relative to theApollo 15 pigeonite spectra, which could be suggestiveof a faster cooling history (Klima et al. 2008), althougha stronger 1.2 lm absorption could also be caused bythe higher-Ca content of the augites (e.g., Burns 1993;Klima et al. 2007, 2008). However, such conclusionscannot be drawn without quantitative deconvolutions ofindividual pyroxene bands in the spectra (e.g., Sunshineet al. 1990; Klima et al. 2008) such as those presentedbelow.
The pyroxene separates from both Apollo 17samples are more compositionally distinct than thoseprepared from the Apollo 15 samples (see Fig. 2). Theirreflectance spectra reflect this compositional diversity, as
Fig. 8. Midinfrared spectra of fine particle samples in the wavelength region of transition from volume to surface scattering. Theapproximate wavelength ranges where Christiansen features occur are noted by arrows.
240 P. J. Isaacson et al.
they exhibit clear differences in the position of the 1and 2 lm absorptions. The Apollo 17 pyroxene spectraappear to have weaker 1.2 lm absorptions than thoseobserved in the Apollo 15 sample spectra. On thewhole, the Apollo 17 pyroxene separates have higherabundances of CaO than do the Apollo 15 separates,suggesting that in this case, the comparatively weak1.2 lm bands are due to a slightly slower coolinghistory. We make this interpretation because the weak1.2 lm absorptions cannot be attributed to less ironpartitioning into the M1 site, as the high-Ca contentwould tend to cause more iron to partition into the M1site, not less (Klima et al. 2008). The slow coolinginterpretation is consistent with the results ofpetrographic analyses of the paired thin section samplesand previous analyses of these samples, which foundthem to have cooled relatively slowly (Brown et al.1975). However, confirmation of the relative strengthsof the 1.2 lm absorption features in these spectrarequires quantitative deconvolutions.
Several interpretations are possible for the broadvisible wavelength absorption observed in the Apollo 17augite separate spectra (observed most prominently inFig. 3). These pyroxenes have relatively high TiO2
contents, roughly twice those observed for pyroxenes inthe Apollo 15 samples. It has been suggested that thepresence of Ti3+ cations in the pyroxene structure cancause such absorptions in the visible region (Burns et al.1976; Burns 1993), although a Fe2+-Ti4+ metal–metalcharge transfer is also a possible explanation (Loeffleret al. 1975; Burns et al. 1976). Ti in these pyroxenes islikely to exist in both +3 and +4 valence states, somultiple transitions could contribute to the observedabsorption feature. The feature is slightly stronger inthe augite separate spectra relative to the pigeonite
spectra, and augites in the Apollo 17 high-Ti sampleshave elevated Ti contents because they appear to havecoprecipitated with ilmenite found in a more Ti-richenvironment than pigeonites (this is discussed in theSupporting Information). These pyroxenes exhibit sectorzoning, and the augites typically have small inclusionsof ilmenite (illustrated in Figs. 1f and 1h). Analternative interpretation is that the ilmenite inclusionsproduce the broad feature across the visible in theTi-rich pyroxene separate spectra. Similar features havebeen observed in analyses of microcrystalline ilmenite-bearing glassy phases, and have been attributed to themicrocrystalline ilmenite (Pieters and Taylor 1989;Tompkins and Pieters 2010). If ilmenite wereresponsible for this feature, the transition responsiblewould likely be the Fe2+-Ti4+ metal–metal chargetransfer in the ilmenite structure, in which these are thetwo dominant cations (Loeffler et al. 1975). We favorthe structural Ti interpretation due to the apparent highabundance of TiO2 in the pyroxene and lack of directvisual evidence for microcrystalline ilmenite, althoughresolution of the structural Ti in pyroxene versusmicrocrystalline ilmenite interpretation is beyond thescope of this article and likely requires additionalanalytical techniques.
The broad multicomponent absorption centerednear 1.05 lm in the olivine separate spectra (Figs. 3 and4) is consistent with the olivine’s composition(approximately Fo50) based on the methods of Sunshineand Pieters (1998) and Isaacson and Pieters (2008). As iscommonly observed in lunar olivine spectra, the spectraalso have slightly asymmetric absorption features near2 lm. Such features are not typically observed in spectraof synthetic or terrestrial olivines. We attribute thisfeature primarily to the presence of small chromite
Table 3. Mineral separate identification key.Basalt sample Separate name Separate composition Separate label (Figs. 6–11)
15058,276 Brown pyroxene Augite AugiteGreen pyroxene OPX ⁄Pigeonite PigeonitePlagioclase Plagioclase Plagioclase
15555,965 Light brown pyroxene Mg-rich subcalcic augite PigeoniteReddish-brown pyroxene Mg-poor augite AugitePlagioclase Plagioclase PlagioclaseOlivine Olivine Olivine
70017,535 Light brown pyroxene Pigeonite PigeoniteDark brown pyroxene Augite AugitePlagioclase Plagioclase Plagioclase
Ilmenite Ilmenite Ilmenite70035,188 Light brown pyroxene Pigeonite Pigeonite
Dark brown pyroxene Augite Augite
Plagioclase Plagioclase PlagioclaseIlmenite Ilmenite Ilmenite
Lunar rock and mineral characterization consortium (LRMCC) 241
inclusions in the olivine (Pieters et al. 1990; Isaacson andPieters 2010), as spinels have characteristic, strongabsorption features near 2 lm (Cloutis et al. 2004).The chromite is observed as small crystalline growthswithin olivine crystals, a common feature of lunarolivine (Dymek et al. 1975; Papike et al. 1998). Photonsinteracting with olivine also interact with the chromitegrains without having to pass through void spacesbetween mineral grains. Common nonlinear models forradiative transfer in particulate media (e.g., Hapke 1993,2008) do not account for this situation quantitatively,but can be used to indicate that such a situation hasmajor effects on the overall reflectance properties of amaterial. Because olivine in 15555 typically intergrowswith plagioclase and pyroxene, as illustrated in Fig. 1, itis possible that trace amounts of pyroxene andplagioclase exist in our olivine separate. While visualinspection of the olivine separate shows it to berelatively pure, olivine is not optically active atwavelengths around 2 lm, and it is possible that minorquantities of pyroxene contamination could contributeto such features. However, the character of theabsorption and the lack of any pyroxene features near1 lm, confirmed by the quantitative deconvolutionsperformed by Isaacson and Pieters (2010), point tochromite being responsible for the 2 lm feature in theolivine spectra.
The Apollo 15 plagioclase spectra (Figs. 3 and 4)have strong absorption features relative to other pureplagioclase separate spectra, likely due to the high Fecontent (Bell and Mao 1973) of these separates (about0.5 wt% FeO). The Apollo 17 plagioclase separatespectra have slightly weaker 1.3 lm features, likely dueto their lower Fe content (about 0.3 wt%). Allplagioclase spectra presented here exhibit additionalabsorptions at longer wavelengths. The long wavelengthedge of the 1.3 lm absorption feature has lowerreflectance than its counterpart on the short wavelengthside for the plagioclase spectra presented here (mostapparent in the coarse particle spectra presented inFig. 3). Although the 1.3 lm feature clearly dominates,the plagioclase absorption feature is not simply a singlecrystal field transition in Fe2+. While most absorptionproperties of plagioclase are understood based onmineral physics (e.g., Bell and Mao 1973; Adams andGoullaud 1978; Pieters 1996), the long wavelengthbehavior may be related to Fe content and a separateabsorption feature (Hofmeister and Rossman 1984;Cheek et al. 2009). Lastly, the 70035 plagioclase is asomewhat less pure separate than the 70017 plagioclase,as evidenced by a weak absorption at 1 lmsuperimposed on the wing of the plagioclase 1.3 lmabsorption (most apparent in the fine particle spectrumin Fig. 4). We interpret this feature as a pyroxene
absorption likely caused by minor pyroxenecontamination of the plagioclase separate. The feature isstronger in the finer particle separate spectrum, likelybecause the strength of the plagioclase absorptiondecreases, and the more optically active pyroxeneabsorption becomes proportionally stronger.
Ilmenite acts as an opaque across visible wavelengthwhen the grain size is significantly greater than thewavelength of the light being measured (i.e., grain sizemuch greater than 1 lm). Thus, the ilmenite separatespectra are dark and relatively featureless through thevisible and part of the NIR before showing increasedreflectance beyond approximately 1.7 lm (seen moreprominently in Fig. 4, but also apparent in Fig. 3). Themagnitude of features in the ilmenite spectra is stronglydependent on particle size (they become more prominentwith decreasing particle size, as evidenced by the greaterspectral contrast in the ilmenite spectra in Fig. 4 relativeto those in Fig. 3), but the overall spectral properties ofthese lunar ilmenites are consistent with measurementsof synthetic ilmenite (Riner et al. 2009).
The bulk sample spectra exhibit largely mirrors thepyroxene spectra. Pyroxene is the dominant opticalphase in these samples, so this is unsurprising. The effectof the range of pyroxene compositions on the bulksample is observed in the broader 1 and 2 lmabsorptions in the bulk sample spectra as compared tothe individual pyroxene separate spectra. The prominentinflection near 1.2 lm seen in all bulk basalt spectra(Figs. 3 and 4) has many potential contributions.Pyroxene, olivine, and plagioclase all have absorptionfeatures in this region, although not all play equal rolesin bulk sample spectra. Plagioclase has an absorptionfeature in this region, although it is quickly overwhelmedin mixtures with more strongly absorbing phases likepyroxene and olivine. Careful quantitative analysis (i.e.,spectral deconvolution and quantification of theproperties of individual absorption features) is requiredbefore drawing conclusions about the detectability ofplagioclase in such spectra (Klima et al. 2008). Thepyroxene absorption is the most dominant component,as the inflection is observed in olivine-rich and olivine-poor samples alike. The effect of olivine is apparent in acomparison of the 15555 bulk sample spectra with otherbulk sample spectra; the proportionally stronger 1.2 lmfeature in 15555 relative to the 1.2 lm features exhibitedby the other bulk sample spectra is attributed to thecontribution of the olivine absorption.
The Apollo 17 bulk sample spectra differ markedlyfrom the Apollo 15 bulk sample spectra. The mostprominent differences are decreased albedo, significantlyweakened absorption features at 1 and 2 lm, andpronounced long wavelength (greater than 1.7 lm)reflectance upturns in the Apollo 17 bulk sample spectra.
242 P. J. Isaacson et al.

The curvature of the bulk sample spectra in the 2 lmregion is caused by the reflectance upturn, and mimicsan absorption feature. These properties are attributed tothe abundant ilmenite, which exhibits a reflectancemaximum near 1 lm, is generally opaque, and exhibitsan upturn in reflectance beyond approximately 1.7 lm.These effects are observed in both coarse particle andfine particle spectra, although they are exhibited moreclearly by the fine particle spectra in Fig. 4. Thedifference between spectra of the coarse and fine particlesplits of the Apollo 17 bulk samples is one of the mostprominent differences between particle size separates, sowe have illustrated this difference explicitly in a separatefigure. Figure 9 shows visible ⁄NIR reflectance spectra ofcoarse and fine particle sizes for the 15058 bulk sample,70017 bulk sample, and 70017 ilmenite separate. Thesespectra are also plotted in Figs. 3 and 4, but arereplotted here to illustrate clearly some prominent effectsof particle size differences. This figure illustrates thedramatic effect of ilmenite on reflectance spectra ofbasalts, as the principal difference between the low-Ti(15058) and high-Ti (70017) samples is the abundantilmenite in 70017. The spectral effects of ilmenitedescribed above are exhibited quite clearly in the 70017
bulk sample spectra, as is the much more pronouncedeffect of ilmenite at finer particle size (compare theheavy black lines; the only difference between the two isparticle size, assuming no preferential sorting during thecrushing process). The effects of ilmenite on reflectancespectra are similar to some of the optical effects of spaceweathering, which include decreased albedo, increasedspectral slope, and weakened absorption features. All ofthese effects are observed when comparing the low-Ti(Apollo 15) to the high-Ti (Apollo 17) bulk samplespectra. These samples are optically immature, so theseresults hint at the complexity of addressing spaceweathering and maturity in ilmenite-rich regions of theMoon, and generally indicate that ilmenite is a majorcomplication in interpretation of reflectance spectra(e.g., Hiroi et al. 2009).
NIR ⁄Short Wavelength Mid-IR 2.5–8 lm (Volume
Scattering)
Many spectra presented in Figs. 5 and 6 have broadabsorptions at 3 lm. The feature near 3 lm ischaracteristic of an O-H vibrational absorption (Farmer1974). We attribute this feature to adsorbed terrestrialwater, which persists despite measurement in a dry airpurged environment (Gibson and Moore 1972; Epsteinand Taylor 1973; Dyar et al. 2010; Hibbitts et al. 2010).This feature is apparently the strongest in theplagioclase separate spectra. The 3 lm feature also isgenerally more apparent in coarse particle samplespectra (Fig. 5). A number of explanations for thisobservation are possible. First, plagioclase may be moresusceptible to adsorption of water, perhaps due to asurface chemistry process. Additionally, althoughplagioclase is a nominally anhydrous mineral (it has noOH or H2O in its chemical formula), it has been shownto contain structural water and OH (e.g., Bell andRossman 1992; Seaman et al. 2006), in some cases up toapproximately 1000 ppm (e.g., Johnson and Rossman2003, 2004), so the 3 lm absorption may be causedpartially or entirely by internal water in the plagioclasegrains. Alternatively, the apparent stronger absorptionfeature in plagioclase may be simply an effect of therelative transparency of plagioclase relative to the otherphases analyzed. The mean optical path length isgreater in a transparent phase, which increases thenumber of times light interacts with grain surfaces. Ifwater is adsorbed on grain surfaces, additional surfaceinteractions due to this increased mean optical pathlength would produce a proportionally stronger 3 lmabsorption feature. The strength of the O-H absorptionmay also be anticorrelated with the depolymerizationstate of the Si-O bond in silicates (strongest absorptionin plagioclase). The 3 lm absorption is the weakest for
Fig. 9. Selected coarse and fine particle visible to near-infraredreflectance spectra. Sample spectra plotted include 15058 bulk(low-Ti, ilmenite-poor), 70017 bulk (high-Ti, ilmenite-rich),and 70017 ilmenite. The abundant ilmenite in the 70017 bulksample causes suppressed absorption features, reduced overallalbedo, and a pronounced ‘‘red’’ spectral slope at longerwavelengths. These effects are far more prominent at the fineparticle size, suggesting that the effect of ilmenite onreflectance spectra of basalts is strongly dependent on textureand particle size, as discussed in the text.
Lunar rock and mineral characterization consortium (LRMCC) 243

ilmenite, although this observation would be consistentwith both the mean optical path length explanation andthe Si-O depolymerization explanations.
Spectra of all separates show sharp absorptionfeatures near 3.4 lm, although the strength of thesefeatures is variable between spectra. These features areattributed to the C-H fundamental stretch, which isdiagnostic of organic hydrocarbons (e.g., Cruikshankand Brown 1987; Gaffey et al. 1993; Clark 1999). Thefeatures are much stronger in spectra of separates from15058 and 70035, likely because these samples weresubjected to a preparation step in which they wereprocessed in ethanol (CH3CH2OH) which caused someethanol to remain in the separates as a tracecontaminant. The weaker features in the spectra ofseparates from 15555 and 70017 likely are due to smallamounts of contamination during sample preparation,but these samples were not processed in ethanol,explaining the weaker 3.4 lm absorption. The featuresare also weaker in the bulk samples, which were notsubjected to the preparation step involving ethanol.
The pyroxene separate spectra show similarabsorption properties to one another at thesewavelengths. The position and strength of theirabsorption features do not show significant variationwith mineral composition.
Absorption features in the olivine spectra between 5and 6 lm are weak (slightly more apparent in Fig. 6)but highly diagnostic. These features have potentialvalue for remote detection, as they provide anindependent indication of the presence of olivinebeyond the 1 lm crystal field absorptions (which can becomplicated by the presence of other absorbing phases).
Plagioclase spectra show a weak but importantabsorption feature near approximately 4.4 lm. Becausethe 4.4 lm feature occurs in a wavelength regionunaffected by the mafic crystal field absorptions, thepresence of this feature may allow plagioclase to bedetected unambiguously. The Apollo 17 plagioclaseseparate spectra are somewhat brighter than theirApollo 15 counterparts in the 3 to 4 lm region. TheApollo 17 plagioclase separates have slightly lower ironcontents than the Apollo 15 plagioclase separates,although we cannot attribute unequivocally thisbrightness difference to variable iron contents.
The bulk sample spectra generally follow thebehavior of the pyroxene spectra. The presence ofolivine is apparent in the fine particle olivine-bearingbulk sample spectrum (15555), as evidenced mostnotably by the feature near 5.7 lm. The plagioclaseabsorption at 4.4 lm is weak-to-absent in the bulksample spectra, suggesting that the modal abundance ofplagioclase in these basaltic samples may be below thedetection limit for this feature.
Mid-IR 7–9.5 lm (Volume–Surface Scattering)
As predicted by theory, plagioclase separates exhibitshort wavelength Christiansen features, pyroxenes andolivine have features at longer wavelengths, and bulksamples show composite absorption features dominatedby a variety of phases. These spectra, illustrated in Figs. 7and 8, are consistent with previous work suggesting thatthis wavelength range is very useful for remote detectionof plagioclase (e.g., Salisbury and Walter 1989); theplagioclase ‘‘feature’’ is readily apparent in the bulksample spectra as well as in plagioclase separate spectra.The 15555 olivine separate spectra exhibit an unusualproperty, in that the reflectance minimum appears to shiftbetween particle size separates. This behavior is notapparent in the bulk sample spectra, suggesting that theother phases dominate the bulk sample spectra. Thisapparent shift in the Christiansen feature position may beexplained by a change in mineralogy due to preferentialcrushing. Regardless, it is not clear which phase isresponsible for this behavior, as the Christiansen featurefor spinels typically occurs at wavelengths beyond thiswavelength region (Cloutis et al. 2004).
APPLICATIONS
Mixing Models
One of the principal goals of reflectancespectroscopy is remote determination of planetarysurface mineralogy. Visible to near-infrared reflectancespectra contain diagnostic mineral absorption features,as discussed above. Mixtures of minerals, such as thosefound in rocks and rock powders, produce reflectancespectra that are effectively a composite of the individualcomponent mineral reflectance spectra. The quantitativerelationship between the mixed spectrum and theindividual endmember spectra is complex, however, andis an area of ongoing research (e.g., Mustard andPieters 1987; Hapke 1993; Hiroi and Pieters 1994; Clark1995; Shkuratov et al. 1999; Poulet and Erard 2004).
Mixture models can be classified into linear andnonlinear varieties. Linear models are the simplest, andassume that the endmembers are physically separated bymore than the wavelength of the incident radiation andthat photons can interact with only one endmemberprior to being reflected. Linear models can be consideredspatially akin to a checkerboard. Nonlinear models treatthe complexities that arise when components areintimately mixed and photons can interact with multipleendmembers prior to being scattered back to a sensor.
Mixture models rely on accurate knowledge of theendmember spectra used. Most endmember spectra,regardless of their quality, are approximations, because
244 P. J. Isaacson et al.

the mineral composition and general character cannotmatch exactly those of the minerals found in the mixturebeing studied. The LRMCC samples and mineralseparates presented here offer the ability to overcomethis limitation, because the endmember minerals wereextracted from the exact bulk sample being analyzed.The thin sections are directly linked to the slab samples,and portions of the slabs were used to prepare separateswhile other portions were retained as ‘‘bulk samples.’’The detailed characterization of the samples, theircomponent mineral composition, and their modalabundances represent a very accurate understanding ofthe ‘‘ground truth’’ which a mixture model seeks toestimate. These samples thus represent the ‘‘ideal’’ caseto test mixture models: realistic mixtures with realisticmineralogical properties (as opposed to syntheticmixtures created from laboratory mixtures of pureendmembers), and precise knowledge of the endmembermineral spectra. Models that cannot reproduce the‘‘truth’’ for the bulk samples need refinement. Thenumber of unconstrained variables is significantlyreduced (although not zero) compared to most othermodeling situations. Spectral mixture modeling iscomplex, and full treatment of this subject for theLRMCC results is beyond the scope of the presentwork. However, we present an example set of analysesfor one of the four samples presented here, 15058.
In the case of pyroxene separates for the LRMCCsamples, modal abundances as reported from thinsection analyses should not be equated with modalabundance of the prepared mineral separates. Modalabundances from the thin section were determined formineral compositions, and separations were performedvisually, so assumptions must be made to convertmeasured abundance with mineral separate abundance.The modal abundances of the specific mineralseparates from 15058 were estimated by classifying themineral separates (e.g., Brown ⁄Green Pyroxene) ascombinations of mineral compositions (e.g.,orthopyroxene), for which abundances were measured.This classification was performed by comparing thecomposition of the pyroxene separates (Fig. 2, left) tothe range of compositions observed in analysis of thethin sections (Fig. 2, right). Our assumptions are thatGreen Pyroxene = orthopyroxene + pigeonite, andthat Brown Pyroxene = augite + Fe-pyroxene. This isnot strictly true based on the mineral compositionresults (Fig. 2), but is sufficient for approximation(although this classification is a potential source of errorfor the mixture model results).
Initial example nonlinear fits calculated for one ofthe samples and mineral separates are illustrated inFig. 10. These fits were calculated using the methods ofHiroi and Pieters (1994), and are discussed by Hiroi
Fig. 10. Examples of preliminary nonlinear spectral unmixingmodels using the coarse particle 15058,276 bulk sample andmineral separate spectra. Line styles and symbols follow theapproach employed for the reflectance spectroscopy figures(Figs. 3–8), with some minor changes. The bulk samplespectrum is no longer plotted as a heavier line, and its crosssymbols have been hidden. The calculated fit is plotted as ‘‘x’’symbols. The unmixing method follows the approach of Hiroiand Pieters (1994). a) Fit with effective grain size for theendmembers (mineral separate spectra) allowed to vary(‘‘unconstrained’’). This fit has a calculated root mean squaredeviation (RMSD) of 0.55% over the full wavelength rangeused for the fit (0.4–2.5 lm). b) Fit with effective grain size forthe endmembers constrained to a constant value of 72 lm.This fit has a RMSD of 1.68% over the wavelength rangeused for fitting (0.4–2.5 lm).
Lunar rock and mineral characterization consortium (LRMCC) 245

et al. (2009). Briefly, volume abundance of endmembersand surface roughness of the bulk sample were allowedto vary. Isotropic scattering was assumed. The fit inFig. 10a allows effective grain size of the endmembers tovary (‘‘unconstrained’’), while the fit in Fig. 10bconstrains the grain sizes to a constant value of 72 lm(‘‘constrained’’). More detail regarding the modelparameters and assumptions is provided by Hiroi andPieters (1994). The line and symbol styles in Fig. 10 arelargely the same as used in the reflectance spectroscopyfigures (Figs. 3–8). The fit is plotted as ‘‘x’’ symbols. Thefit in Fig. 10a has a calculated root mean squaredeviation (RMSD) of 0.55% over the full wavelengthrange used for the fit (0.4–2.5 lm), and the fit in Fig. 10bhas a RMSD of 1.68% over the same wavelength range.
The resulting modeled abundances for the fits inFig. 10 are listed in Table 4, along with the modeledeffective grain sizes for unconstrained fit (Fig. 10a).Also presented in Table 4 are the actual modalabundances as determined from analysis of the thinsection sample, based on the groupings described above.Because only three endmembers were used to performthe unmixing, the sum of the three modeled abundancesis 100%. In determining the modal mineralogy of thethin section, more phases were reported than twopyroxenes and plagioclase. To facilitate comparisonbetween modeled and measured abundances, we alsoreport the thin section abundances of the two pyroxenegroupings after normalizing the two pyroxene plusplagioclase components to a total of 100% (analogousto the spectral unmixing results). The quality of the fitsis generally good, and fitting generally is able toreproduce the modal abundances determined from thethin section, especially considering the assumptionsdescribed above. The abundances of Brown Pyroxeneand Plagioclase differ significantly from the thin sectionvalues in both fits, indicating that despite the quality ofthese samples and spectra, questions about the mixture
model remain. The deviations in effective grain size forthe unconstrained fit merit further investigation, as thesamples were crushed and prepared with near-identicalmethods. For example, plagioclase is modeled to have amuch lower grain size than the pyroxene separates. It ispossible that differing physical properties for thevarious separates lead to varying particle sizes in thecrushed bulk sample and mineral separates, although itis also possible that the optical properties of plagioclaseare not fully accounted for by these models.
Quantitative Absorption Modeling
To characterize fully the specific crystal fieldabsorption features in the spectra acquired in this study,quantitative analyses of the absorption band propertiesare required. Band properties such as band position,band strength, and band width are diagnostic ofmineral ⁄ rock composition and are the basis of remotemineralogical analyses with reflectance spectroscopy. Touse these spectra in mixture models and ininterpretation of remotely acquired data, quantificationof these parameters is essential.
Currently, one of the best methods for quantitativeassessment of absorption features is the ModifiedGaussian Model (MGM) (Sunshine et al. 1990). TheMGM models the shape of a spectrum by applying aseries of Gaussian curves to fit the shapes of individualabsorption features. The properties of the fitted Gaussiancurves can be interpreted as the properties of theindividual, deconvolved component absorption featuresin the modeled spectrum. This approach removesambiguity in interpretation of absorption features inreflectance spectra; the positions and strengths of theabsorption features are clear, and interpretations ofmineralogy based on those spectra are more reliable.
Example fits to one of the LRMCC bulk samplesare presented in Figs. 11 and 12. The 15058 bulk samplespectra are the simplest example for deconvolutionbecause the sample lacks abundant olivine or ilmenite,which complicate the other bulk sample spectra. Whilethis sample is the simplest of the four in mineralogy, thedeconvolutions are not simple. We performed fits forboth the coarse particle (Fig. 11) and fine particle(Fig. 12) separate spectra. We performed two fits foreach spectrum, one using single pyroxene absorptionsfor the 1 and 2 lm features and one using two pyroxeneabsorptions for each feature. Using two absorptionfeatures is reasonable based on the range of pyroxenesfound in the sample, but when fitting an ‘‘unknown’’spectrum, one should always use the least number ofbands required for a numerically and physicallyreasonable fit. In other words, additional bands shouldnot be added to reduce the ‘‘error’’ of the fit unless
Table 4. Modal mineral abundances from thin sectionanalysis and spectral fitting for 15058.
Greenpyroxene
Brownpyroxene Plagioclase
Thin sectiona 29.3 33.8 30.1Norm. thin sectiona 31.4 36.3 32.3Spectral fitting, freeb 32.1 52.3 15.6
Modeled effectivegrain size (lm)
55.5 58.5 30.5
Spectral fitting,
constrainedb29 51 20
aSee discussion in the Mixing Models section.bFree refers to the fit shown in Fig. 10a, in which effective grain
size is allowed to vary. Constrained refers to the fit shown in
Fig. 10b, in which effective grain size was constrained to a constant
value of 72 lm.
246 P. J. Isaacson et al.

there is a sound reason to do so based on mineralogyand mineral physics. As can be seen in the RMS errorof our fits, the single pyroxene fit is significantly worsethan the two pyroxene fits for both size separates.Additionally, the single pyroxene fits required the use ofa linear continuum slope to produce a stable fit. Thetwo pyroxene fits show improved RMS error in both
cases. The fine particle separate spectra showedimproved RMS error for both single and two pyroxenefits compared to their coarse particle counterparts,suggesting that the bands may be saturated in thecoarse-grained separate spectra. When two absorptionsare used at 1 and 2 lm, the shorter-wavelength
Fig. 11. Modified Gaussian model deconvolutions of the15058,276 bulk sample coarse particle separate spectrum.Deconvolution examples are shown using one (a) and two (b)absorption features to fit the 1 and 2 lm pyroxene absorptionfeatures. The principal pyroxene absorptions are plotted inblack and dashed (in the case of the two pyroxene fit) lines,and the 1.2 lm pyroxene absorption in dotted lines. Otherabsorption features are plotted in gray.
Fig. 12. Modified Gaussian model deconvolutions of the15058,276 bulk sample fine particle separate spectrum.Deconvolution examples are shown using one (a) and two (b)absorption features to fit the 1 and 2 lm pyroxene absorptionfeatures. The principal pyroxene absorptions are plotted inblack and dashed (in the case of the two pyroxene fit) lines,and the 1.2 lm pyroxene absorption in dotted lines. Otherabsorption features are plotted in gray. RMS error is plottedoffset from 0 by 0.2 for clarity.
Lunar rock and mineral characterization consortium (LRMCC) 247

absorption is modeled to be stronger in both grain sizeseparates, consistent with the mineralogy of the sample(Sunshine and Pieters 1993; Klima et al. 2007, 2008).These MGM fits provide quantification of the specificabsorption band properties observed in the spectra:band width, band strength, and band position. Suchquantification is critical for reliable application of thesespectra as ground truth, and will be performed for thebulk sample and selected mineral separate spectraacquired in this study.
CONCLUSIONS ⁄SUMMARY
The lunar rock and mineral characterizationconsortium (LRMCC) has conducted coordinatedmineralogy ⁄petrography ⁄ spectroscopy analyses of a suiteof lunar basalts. Slab samples were used to prepareparticulate separates of bulk samples and mineralseparates, and paired thin sections were used formineralogy ⁄petrography analyses. The LRMCC data areimportant for lunar science in many contexts. Thespectra represent controlled ground truth for opticalremote-sensing instruments, which rely on such groundtruth measurements to conduct mapping. The samplesanalyzed by the LRMCC are unweathered, and providean excellent complement to the results of the lunar soilcharacterization consortium (LSCC), which analyzed theweathered component of lunar surface materials in asuite of lunar soils. The spectra also represent some ofthe best constraints on spectral mixture models yetproduced, as the mineral endmembers are produceddirectly from the rock sample being investigated(‘‘unmixed’’), and their compositions are well known.Quantitative analyses of spectral mixing and absorptionfeatures are ongoing. The combined data sets from theLSCC and LRMCC represent an invaluable resource forcurrent and future lunar science and exploration efforts.
Acknowledgments—The authors gratefully acknowledgethe support of NASA NLSI contract numberNNA09DB34A as well as Cosmochemistry grantsNNG05GG15G (C. M. P.) and NNG05GG03G (L. A.T.). The NASA RELAB is supported as a multiuserfacility under grant NNG06GJ31G. Constructive andthorough reviews by Timothy Glotch and M. DarbyDyar improved the quality of this manuscriptsubstantially.
Editorial Handling—Dr. A. J. Timothy Jull
REFERENCES
Adams J. B. 1974. Visible and near-infrared diffuse reflectancespectra of pyroxenes as applied to remote sensing of solid
objects in the solar system. Journal of GeophysicalResearch 79:4829–4836.
Adams J. B. and Goullaud L. H. 1978. Plagioclase feldspars––Visible and near infrared diffuse reflectance spectra asapplied to remote sensing. Proceedings, 9th Lunar andPlanetary Science Conference. pp. 2901–2909.
Bell P. M. and Mao H. K. 1973. Optical and chemicalanalysis of iron in Luna 20 plagioclase. Geochimica etCosmochimica Acta 37:755–759.
Bell D. R. and Rossman G. R. 1992. Water in Earth’s mantle:The role of nominally anhydrous minerals. Science255:1391–1397.
Bence A. E. and Papike J. J. 1972. Pyroxenes as recorders oflunar basalt petrogenesis: Chemical trends due to crystal-liquid interaction. Proceedings, 3rd Lunar ScienceConference. pp. 431–469.
Bohren C. F. and Huffman D. R. 1983. Absorption andscattering of light by small particles. New York: Wiley.530 p.
Brown G. M., Peckett A., Emeleus C. H., Phillips R., andPinsent R. H. 1975. Petrology and mineralogy of Apollo17 mare basalts. Proceedings, 6th Lunar ScienceConference. pp. 1–13.
Burns R. G. 1970. Crystal field spectra and evidence of cationordering in olivine minerals. American Mineralogist55:1608–1632.
Burns R. G. 1974. The polarized spectra of iron in silicates:Olivine. A discussion of neglected contributions from Fe2+
ions in M(1) sites. American Mineralogist 59:625–629.Burns R. G. 1993. Mineralogical applications of crystal field
theory, 2nd ed. New York: Cambridge University Press.551 p.
Burns R. G., Parkin K. M., Loeffler B. M., Leung I. S., andAbu-Eid R. M. 1976. Further characterization of spectralfeatures attributable to titanium on the Moon. Proceedings,7th Lunar Science Conference. pp. 2561–2578.
Cheek L. C., Pieters C. M., Dyar M. D., and Milam K. A.2009. Revisiting plagioclase optical properties for lunarexploration (abstract #1928). 40th Lunar and PlanetaryScience Conference. CD-ROM.
Clark B. E. 1995. Spectral mixing models of S-type asteroids.Journal of Geophysical Research 100:14,443–14,456.
Clark R. N. 1999. Chapter 1: Spectroscopy of rocks andminerals, and principles of spectroscopy. In Manual ofremote sensing, volume 3, remote sensing for the earthsciences, edited by Rencz A. N. New York: John Wileyand Sons. pp. 3–58
Cloutis E. A. and Gaffey M. J. 1991. Pyroxene spectroscopyrevisited: Spectral-compositional correlations andrelationship to geothermometry. Journal of GeophysicalResearch 96:22,809–22,826.
Cloutis E. A., Sunshine J. M., and Morris R. V. 2004.Spectral reflectance-compositional properties of spinels andchromites: Implications for planetary remote sensing andgeothermometry. Meteoritics & Planetary Science 39:545–565.
Cooper B. L., Salisbury J. W., Killen R. M., and Potter A. E.2002. Midinfrared spectral features of rocks and theirpowders. Journal of Geophysical Research 107, doi:10.1029/2000JE001462.
Cruikshank D. P. and Brown R. H. 1987. Organic matter onasteroid 130 Elektra. Science 238:183–184.
Dyar M. D., Sklute E. C., Menzies O. N., Bland P. A.,Lindsley D., Glotch T., Lane M. D., Schaefer M. W.,
248 P. J. Isaacson et al.

Wopenka B., Klima R., Bishop J. L., Hiroi T., Pieters C.,and Sunshine J. 2009. Spectroscopic characteristics ofsynthetic olivine: An integrated multi-wavelength andmulti-technique approach. American Mineralogist 94:883–898.
Dyar M. D., Hibbitts C. A., and Orlando T. M. 2010.Mechanisms for incorporation of hydrogen in and onterrestrial planetary surfaces. Icarus 208:425–437.
Dymek R. F., Albee A. L., and Chodos A. A. 1975.Comparative petrology of lunar cumulate rocks of possibleprimary origin—Dunite 72415, troctolite 76535, norite78235, and anorthosite 62237. Proceedings, 6th LunarScience Conference. pp. 301–341.
Epstein S. and Taylor H. P. Jr. 1973. The isotopiccomposition and concentration of water, hydrogen, andcarbon in some Apollo 15 and 16 soils and in the Apollo17 orange soil. Proceedings, 4th Lunar Science Conference.pp. 1559–1575.
Farmer V. C., ed. 1974. The infrared spectra of minerals.London: Mineralogical Society. 539 p.
Gaffey S. J., McFadden L. A., Nash D., and Pieters C. M.1993. Ultraviolet, visible, and near-infrared reflectancespectroscopy: Laboratory spectra of geologic materials. InRemote geochemical analysis: Elemental and mineralogicalcomposition, edited by Pieters C. and Englert P.Cambridge, UK: Cambridge University Press, Lunar andPlanetary Institute. pp. 43–77.
Gibson E. K. Jr. and Moore G. W. 1972. Inorganic gasrelease and thermal analysis study of Apollo 14 and 15soils. Proceedings, 3rd Lunar Science Conference. pp.2029–2040.
Gillis J. J., Jolliff B. L., and Elphic R. C. 2003. A revisedalgorithm for calculating TiO2 from Clementine UVVISdata: A synthesis of rock, soil, and remotely sensed TiO2
concentrations. Journal of Geophysical Research 108b,doi:10.1029/2001JE001515.
Hapke B. 1993. Theory of reflectance and emittancespectroscopy. Cambridge, UK: Cambridge UniversityPress. 455 p.
Hapke B. 2001. Space weathering from Mercury to theasteroid belt. Journal of Geophysical Research 106,doi:10.1029/2000JE001338.
Hapke B. 2008. Bidirectional reflectance spectroscopy 6.Effects of porosity. Icarus 195:918–926.
Hibbitts C. A., Dyar M. D., Orlando T. M., Grieves G.,Moriarty D., Poston M., and Johnson A. 2010. Thermalstability of water and hydroxyl on airless bodies (abstract#2417). 41th Lunar and Planetary Science Conference.CD-ROM.
Hiroi T. and Pieters C. M. 1994. Estimation of grain sizes andmixing ratios of fine powder mixtures of common geologicminerals. Journal of Geophysical Research 99, doi:10.1029/94JE00841.
Hiroi T., Isaacson P. J., Klima R. L., Pieters C. M.,Sarbadhikari A. B., Liu Y., and Taylor L. A. 2009.Reproducing visible and near-infrared reflectance spectraof lunar rocks directly from their end-member spectra:Importance of ilmenite in estimating the lunar surfacecomposition (abstract #1723). 40th Lunar and PlanetaryScience Conference. CD-ROM.
Hofmeister A. M. and Rossman G. R. 1984. Determination ofFe3+ and Fe2+ concentrations in feldspar by opticalabsorption and EPR spectroscopy. Physics and Chemistryof Minerals 11:213–224.
Isaacson P. J. and Pieters C. M. 2008. Detecting a broader lunarmagnesian suite with orbital spectroscopy (abstract #1783).39th Lunar and Planetary Science Conference. CD-ROM.
Isaacson P. J. and Pieters C. M. 2010. Deconvolution of lunarolivine reflectance spectra: Implications for remotecompositional assessment. Icarus 210(1):8–13.
Jari M. K. 1995. Effects of grinding and chemical factors onthe generation and composition of the till fine fraction: Anexperimental study. Journal of Geochemical Exploration54:49–62.
Johnson E. A. and Rossman G. R. 2003. The concentrationand speciation of hydrogen in feldspars using FTIR and1H MAS NMR spectroscopy. American Mineralogist88:901–911.
Johnson E. A. and Rossman G. R. 2004. A survey of hydrousspecies and concentrations in igneous feldspars. AmericanMineralogist 89:586–600.
Kiran Kumar A. S., Chowdhury A. R., Banerjee A., Dave A.B., Sharma B. N., Shah K. J., Murali K. R., Mehta S.,Joshi S. R., and Sarkar S. S. 2009. Hyper Spectral Imagerfor lunar mineral mapping in visible and near infraredband. Current Science 96:496–499.
Klima R. L., Pieters C. M., and Dyar M. D. 2007.Spectroscopy of synthetic Mg-Fe pyroxenes I: Spin-allowedand spin-forbidden crystal field bands in the visible andnear-infrared. Meteoritics & Planetary Science 42:235–253.
Klima R. L., Pieters C. M., and Dyar M. D. 2008.Characterization of the 1.2 lm M1 pyroxene band:Extracting cooling history from near-IR spectra ofpyroxenes and pyroxene-dominated rocks. Meteoritics& Planetary Science 43:1591–1604.
Lin I. J. and Somasundaran P. 1972. Alterations in propertiesof samples during their preparation by grinding. PowderTechnology 6:171–179.
Loeffler B. M., Burns R. G., and Tossell J. A. 1975. Metal-to-metal charge transfer transitions––Interpretation ofvisible-region spectra of the moon and lunar materials.Proceedings, 6th Lunar Science Conference. pp. 2663–2676.
Lucey P. G., Blewett D. T., and Jolliff B. L. 2000. Lunar ironand titanium abundance algorithms based on finalprocessing of Clementine ultraviolet-visible images. Journalof Geophysical Research 105:20297–20305.
Mall U., Banaskiewicz M., Bronstad K., McKenna-Lawlor S.,Nathues A., Soraas F., Vilenius E., and Ullaland K. 2009.Near infrared spectrometer SIR-2 on Chandrayaan-1.Current Science 96:506–511.
Matsunaga T., Ohtake M., Haruyama J., Ogawa Y., YokotaY., Morota T., Honda C., Torii M., Nakamura R., andKodama S. 2008. Kaguya (SELENE) ⁄Spectral profiler:In-Flight performance and future plan (abstract #2226).39th Lunar and Planetary Science Conference. CD-ROM.
Mustard J. F. and Pieters C. M. 1987. Quantitative abundanceestimates from bidirectional reflectance measurements.Journal of Geophysical Research 92:E617–E626.
Nicodemus F. E. 1965. Directional reflectance and emissivityof an opaque surface. Applied Optics 4:767–773.
Noble S. K., Pieters C. M., Taylor L. A., Morris R. V., AllenC. C., McKay D. S., and Keller L. P. 2001. The opticalproperties of the finest fraction of lunar soil: Implicationsfor space weathering. Meteoritics & Planetary Science36:31–42.
Noble S. K., Pieters C. M., and Keller L. P. 2007. Anexperimental approach to understanding the optical effectsof space weathering. Icarus 192:629–642.
Lunar rock and mineral characterization consortium (LRMCC) 249

Ohtake M., Haruyama J., Matsunaga S., Morota T., YokotaY., Honda C., Yamamoto A., Arai T., and Takeda H.2007. Objectives of the SELENE multiband imager andspectral study of Dho 489 (abstract #1829). 38th Lunarand Planetary Science Conference. CD-ROM.
Papike J. J., Bence A. E., and Lindsley D. H. 1974. Marebasalts from the Taurus-Littrow region of the Moon.Proceedings, 5th Lunar Science Conference. pp. 471–504.
Papike J. J., Ryder G., and Shearer C. K. 1998. Lunarsamples. In Planetary materials, edited by Papike J. J.Washington, D.C.: Mineralogical Society of America. pp.5.1–5.234
Pieters C. M. 1986. Composition of the lunar highland crustfrom near-infrared spectroscopy. Reviews of Geophysicsand Space Physics 24:557–578.
Pieters C. M. 1996. Plagioclase and maskelynite diagnosticfeatures (abstract #1031). 27th Lunar and PlanetaryScience Conference. CD-ROM.
Pieters C. M. 1999. The moon as a spectral calibrationstandard enabled by lunar samples: The Clementineexample. Workshop on New Views of the Moon II:Understanding the Moon Through the Integration ofDiverse Datasets. LPI Contribution 980. Houston, Texas:Lunar and Planetary Institute, p. 47.
Pieters C. M. and Hiroi T. 2004. RELAB (ReflectanceExperiment Laboratory): A NASA multiuser spectroscopyfacility (abstract #1720). 35th Lunar and Planetary ScienceConference. CD-ROM.
Pieters C. M. and Taylor G. J. 1989. Millimeter petrology andkilometer mineralogical exploration of the moon.Proceedings, 19th Lunar and Planetary ScienceConference. pp. 115–125.
Pieters C. M., Pratt S. F., and Sunshine J. M. 1990. Petrologyof the olivine mountains at Copernicus (abstract #962).21th Lunar and Planetary Science Conference. CD-ROM.
Pieters C. M., Taylor L. A., Noble S. K., Keller L. P., HapkeB., Morris R. V., Allen C. C., McKay D. S., and WentworthS. 2000. Space weathering on airless bodies: Resolving amystery with lunar samples. Meteoritics & Planetary Science35:891–1120..
Pieters C. M., Klima R. L., Hiroi T., Dyar M. D., Lane M.D., Treiman A. H., Noble S. K., Sunshine J. M., andBishop J. L. 2008. Martian dunite NWA 2737: Integratedspectroscopic analyses of brown olivine. Journal ofGeophysical Research 113, doi:10.1029/2007JE002939.
Pieters C. M., Boardman J., Buratti B., Chatterjee A., ClarkR. N., Glavich T., Green R., Head J. W., Isaacson P. J.,Malaret E., McCord T., Mustard J. F., Petro N., RunyonC., Staid M. I., Sunshine J. M., Taylor L., Tompkins S.,Varanasi P., and White M. 2009. The Moon MineralogyMapper (M3) on Chandrayaan-1. Current Science 96:500–505.
Poulet F. and Erard S. 2004. Nonlinear spectral mixing:Quantitative analysis of laboratory mineral mixtures.Journal of Geophysical Research 109, doi:10.1029/2003JE002179.
Riner M. A., Lucey P. G., Desch S. J., and McCubbin F. M.2009. Nature of opaque components on Mercury: Insights
into a Mercurian magma ocean. Geophysical ResearchLetters 36, doi:10.1029/2008GL036128.
Ryder G. 1985. Catalog of Apollo 15 rocks. 1296 p. JSC20787. Houston, Texas: Lyndon B. Johnson Space Center.
Salisbury J. W. 1993. Mid-infrared spectroscopy: Laboratorydata. In Remote geochemical analysis: Elemental andmineralogical composition, edited by Pieters C. and Englert P.Cambridge, UK: Cambridge University Press, Lunar andPlanetary Institute. pp. 79–98.
Salisbury J. W. and Walter L. S. 1989. Thermal infrared (2.5-13.5 lm) spectroscopic remote sensing of igneous rocktypes on particulate planetary surfaces. Journal ofGeophysical Research 94:9192–9202.
Sasaki S., Kurahashi E., Yamanaka C., and Nakamura K.2003. Laboratory simulation of space weathering: Changesof optical properties and TEM ⁄ESR confirmation ofnanophase metallic iron. Advances in Space Research31:2537–2542.
Seaman S. J., Dyar M. D., Marinkovic N., and Dunbar N.W. 2006. An FTIR study of hydrogen in anorthoclase andassociated melt inclusions. American Mineralogist 91:12–20.
Shkuratov Y., Starukhina L., Hoffmann H., and Arnold G.1999. A model of spectral albedo of particulate surfaces:Implications for optical properties of the Moon. Icarus137:235–246.
Sunshine J. M. and Pieters C. M. 1993. Estimating modalabundances from the spectra of natural and laboratorypyroxene mixtures using the modified Gaussian model.Journal of Geophysical Research 98:9075–9087.
Sunshine J. M. and Pieters C. M. 1998. Determining thecomposition of olivine from reflectance spectroscopy.Journal of Geophysical Research 103:13675–13688.
Sunshine J. M., Pieters C. M., and Pratt S. F. 1990.Deconvolution of mineral absorption bands: An improvedapproach. Journal of Geophysical Research 95:6955–6966.
Taylor L. A., Patchen A., Taylor D.-H. S., Chambers J. G.,and McKay D. S. 1996. X-ray digital imaging petrographyof lunar mare soils: Modal analyses of minerals andglasses. Icarus 124:500–512.
Taylor L. A., Pieters C. M., Keller L. P., Morris R. V., andMcKay D. S. 2001. Lunar mare soils: Space weatheringand the major effects of surface-correlated nanophase Fe.Journal of Geophysical Research 106:27985–27999.
Taylor L. A., Pieters C., Patchen A., Taylor D.-H. S., MorrisR. V., Keller L. P., and McKay D. S. 2010. Mineralogicaland chemical characterization of lunar highland soils:Insights into the space weathering of soils on airlessbodies. Journal of Geophysical Research 115, doi:10.1029/2009je003427.
Tompkins S. and Pieters C. 2010. Spectral characteristics oflunar impact melts and inferred mineralogy. Meteoritics &Planetary Science 45:1152–1169.
Tschimmel M., Robinson M. S., Humm D. C., Denevi B. W.,Lawrence S. J., Brylow S., Ravine M., and Ghaemi T.2009. Lunar Reconnaissance Orbiter Camera (LROC):Ready for rocks (abstract #2475). 40th Lunar andPlanetary Science Conference. CD-ROM.
SUPPORTING INFORMATION
Additional supporting information may be found inthe online version of this article:
Figure S1. Examples of pyroxene zoning in LRMCCApollo 15 (left) and Apollo 17 (right) basalt samples.Pyroxene quads (top) are labeled with zoning trends from‘‘core’’ to ‘‘rim’’ along profiles from A to B as indicated
250 P. J. Isaacson et al.

on the plane-polarized transmitted light microscopeimages (bottom). Pyroxenes in the two Apollo 17 samplesexhibit sector zoning, so clear identification of ‘‘core’’and ‘‘rim’’ is difficult to define precisely as in the examplefrom an Apollo 15 pyroxene (left).
Figure S2. CaO versus TiO2 abundance for70035,188 pyroxene separates. The abundancesdetermined by EMP analysis of grain mounts preparedfrom subsets of the mineral separates. Separates arelabeled as augite and pigeonite, but as discussed in thetext, there is some compositional overlap. High-Capyroxenes show significant increases in TiO2 contentabove a certain CaO content, suggesting that the systembecame enriched in TiO2 during augite crystallization,and thus that the augite grains largely crystallized in aTi-rich environment.
Figure S3. XMg (molar Mg ⁄ [Mg + Fe]) forilmenites versus augites in 70035. The high degree ofcorrelation indicates that the two minerals are inequilibrium and coprecipitated during crystallization.
Figure S4. Bidirectional reflectance spectra ofcommon lunar materials. The diagnostic absorptionfeatures of pyroxene and olivine are readily apparent, asis the weaker absorption in plagioclase. Variouspyroxene compositions are shown, illustrating the shiftin band position with changing pyroxene composition.Pyroxene compositions are labeled as high-calcium(HCP) and low-calcium (LCP). The long wavelengthabsorption in olivine is attributed to chromite (Cr-spinel) inclusions. A spectrum of mature Apollo 16 soil62231 is plotted, and exhibits the characteristic
decreased albedo, reduced band strengths, and red-sloped continuum of lunar soil reflectance spectra. Theband centers of the Moon Mineralogy Mapper (M3)imaging spectrometer on Chandrayaan-1 in its tworesolution modes are plotted for reference. Note thatthe M3 instrument’s spectral coverage extends to 3 lm,but data for these samples extend only to 2.6 lm.
Figure S5. Particle size distribution results for theless than 125 lm separates obtained from weighingexperiments. The analytical technique is discussed in thetext. The coarse particle samples are largely dominatedby larger (45 to125 lm) particles, but havenonnegligible abundances of fine particles. Plagioclaseseparates tend to have more fine particles.
Table S1. Compositional data for 15058,248.Table S2. Compositional data for 15555,971.Table S3. Compositional data for 70017,541.Table S4. Compositional data for 70035,193.Table S5. Compositional data for mineral separates
from 15058,276.Table S6. Compositional data for mineral separates
from 15555,965.Table S7. Compositional data for mineral separates
from 70017.535.Table S8. Compositional data for mineral separates
from 70035.188.Please note: Wiley-Blackwell is not responsible for
the content or functionality of any supporting materialssupplied by the authors. Any queries (other thanmissing material) should be directed to thecorresponding author for the article.
Lunar rock and mineral characterization consortium (LRMCC) 251