the low velocity impact response of sandwich beams … · the low velocity impact response of...
TRANSCRIPT

1
The low velocity impact response of sandwich beams with a corrugated core or a Y-frame core
L. St-Pierre, V.S. Deshpande* and N.A. Fleck
Department of Engineering, University of Cambridge, Trumpington Street, Cambridge, CP2 1PZ, UK.
Abstract
The low speed impact responses of simply-supported and clamped sandwich beams
with corrugated and Y-frame cores have been measured in a drop-weight apparatus at
5 ms-1. The AISI 304 stainless steel sandwich beams comprised two identical face
sheets and represented scaled-down versions of ship hull designs. No significant rate
effects were observed at impact speeds representative of ship collisions: the drop-
weight responses were comparable to the ones measured quasi-statically. Moreover,
the corrugated and Y-frame core beams had similar performances. Three-dimensional
finite element (FE) models simulated the experiments and were in good agreement
with the measurements. The simulations demonstrated correctly that the sandwich
beams collapsed by core indentation under both quasi-static loading and in the drop-
weight experiments. These FE models were then used to investigate the sensitivity of
impact response to (i) velocity, over a wider range of velocities than achievable with
the drop-weight apparatus, and (ii) the presence of the back face sheet. The response
of sandwich beams with both front and back face sheets was found to be relatively
insensitive to the loading velocity for speeds less than approximately 5 ms-1. This
suggests that quasi-static considerations are adequate to model the collision of a
sandwich ship hull. By contrast, beams absent the back face collapsed by Brazier
buckling under quasi-static loading conditions, and by core indentation at a loading
velocity of 5 ms-1. Thus, dynamic considerations are needed in ship hull designs that
do not employ a back face. Keywords: Drop-weight test, Sandwich beam, Corrugated core, Y-frame core.
* Corresponding author. Tel: +44 1223 332664 Fax: +44 1223 332662 Email: [email protected]

2
1. Introduction
Commercial ship structures require adequate strength to survive impact by submerged
rocks, icebergs and by collisions with other vessels. More than 200 such accidents
were recorded in the Gulf of Finland from 1997 to 2006 [1], 50% of which were
groundings and another 20% were ship-ship collisions. Current ship hull designs are
based upon either a monolithic skin with an internal stiffening frame or upon double-
hulled designs which have minimal mechanical coupling between the inner and outer
hulls (Fig. 1a). Over the past decade or so there have been substantial changes in ship
design, see for example the review by Paik [2]. Currently, there is industrial interest
in determining whether significant enhancements in structural stiffness, strength and
energy absorption without weight penalty can be achieved by employing a sandwich
construction. One example is the Y-frame sandwich hull design as proposed by
Damen Schelde Navel Shipbuilding1 and as illustrated in Fig. 1b. A competing design
to the Y-frame is the corrugated core (Fig. 1c), which is also known under the trade-
name of Navtruss2.
Full-scale ship collision tests have revealed that the Y-frame design (Fig. 1b) is more
resistant to tearing than conventional monolithic designs (Fig. 1a), see Wevers and
Vredeveldt [3]. Likewise, the finite element simulations by Konter [4] suggest that
the Y-frame confers improved perforation resistance. Naar et al. [5] have argued in
broad terms that the ability of the bending-governed Y-frame topology to spread the
impact load over a wide area, combined with the in-plane high stretching resistance of
the Y-frame, gives the enhanced performances of the Y-frame sandwich construction
over conventional double hull designs.
Rubino et al. [6,7] performed a laboratory investigation into the quasi-static
performance of Y-frame sandwich beams and then evaluated the effect of high
velocity dynamic loadings, representative of blast events [8,9]. Similarly, Tilbrook et
al. [10] reported the dynamic crushing response of Y-frame and corrugated cores for
crushing velocities up to 100 ms-1. In contrast, ship collisions and groundings of oil
and chemical tankers occur at speeds of approximately 5 ms-1. These accidents are
typically considered to be quasi-static in nature [11]. The authors have been unable to
1 Damen Schelde Naval Shipbuilding, Glacisstraat 165, 4381 SE Vlissingen, The Netherlands.
2 Astech Engineering Products Inc., 3030 Red Hill Ave., Santa Ana, CA 92705, USA.

3
locate any existing studies in the literature on the impact performance of sandwich
structures in this low velocity regime, for the case of a corrugated core or a Y-frame
core.
The full-scale collision tests [3] performed on the Y-frame sandwich structure
revealed that the inner hull plays only a minor role and undergoes negligible plastic
deformation. This motivated the development of a single hull structure where the Y-
frame stiffeners are welded directly to the bulkheads as shown in Fig. 1d. Full-scale
collision tests have also been performed on this single hull Y-frame structure. It has a
similar crash-worthiness to the Y-frame double hull design, but it is significantly
simpler and cheaper to manufacture. Several inland waterway tankers have now been
manufactured using the single hull Y-frame construction [12]. St-Pierre et al. [13]
compared the quasi-static performances of the conventional sandwich beam design,
comprising two identical face sheets and either a corrugated or a Y-frame core, with
another beam design of equal mass but with the back face absent. They identified two
modes of collapse: beams with both face sheets present collapse by core indentation
whereas the beams without the back face display a Brazier plastic buckling collapse
mode. It is unclear whether these modes will change at low velocity impacts.
The low velocity impact regime is typically investigated in a laboratory setting using a
drop-weight apparatus. Such experiments have been reported on sandwich beams
with aluminium face sheets and an aluminium foam core [14,15], and more recently
on aluminium sandwich panels with a honeycomb core [16]. In all cases, the
responses measured dynamically were similar to those measured quasi-statically, and
no change in the collapse mechanism was observed when comparing the quasi-static
and dynamic deformation modes. Such tests have not been reported for the
corrugated and Y-frame core structures, as used in the construction of ship hulls, and
this study aims to fill this gap.
This article is organised as follows. First, the manufacture of sandwich beams with
corrugated and Y-frame cores is presented, followed by a description of the drop-
weight apparatus and a discussion of the experimental results for both simply-
supported and clamped beams. Then, three-dimensional finite element (FE) models
are developed and the predictions are compared to the measurements of the drop-
weight tests. The FE method is then used to investigate (i) the effect of impact

4
velocity on the beam response over a wider range of velocities than achievable in a
drop-weight apparatus and (ii) the influence of the back face sheet on the response of
sandwich beams. The FE models are used to explore whether quasi-static
considerations suffice to model a ship collision for both the corrugated core and Y-
frame core.
2. Experimental investigation
Drop weight tests were conducted on sandwich beams with a corrugated core or a Y-
frame core. The aims of the experimental investigation are:
(i) To measure the response of the beams subjected to a low velocity impact.
(ii) Compare the low velocity and quasi-static responses of the sandwich beams.
(iii) Use the experimental measurements to gauge the fidelity of finite element
models.
2.1 Specimen manufacture
The face sheets and core of the sandwich beams were manufactured from AISI type
304 stainless steel sheet of thickness t = 0.3 mm and density f = 7900 kgm-3. Both
the Y-frame and corrugated cores were manufactured with an effective density c =
200 kgm-3 and a core depth c = 22 mm. Consequently, the effective relative density
of the cores is = 2.5%. All sandwich beams had an areal mass m = f (2t + c)
= 9.1 kgm-2.
The cross-sections of the corrugated and Y-frame cores are sketched in Fig. 2 and
show the relevant dimensions. The co-ordinate system (x1,x
2,x
3) is also defined in
Fig. 2 such that the prismatic direction of the core is parallel to the longitudinal axis of
the beam, x3. As shown in Fig. 2, the corrugated and Y-frame cores are close packed
along the x1 direction and the beams comprise two corrugated or Y-frame sections.
Beams of length 2Lf = 375 mm and width b = 55 mm were manufactured using the
process as developed by Rubino et al. [6,7] and as briefly described below.
Corrugated beams: The corrugated core, comprising struts inclined at ±60°, was
manufactured by computer-numerical-control (CNC) folding of stainless steel sheets
of thickness t = 0.3 mm. The folded section was then spot welded to the face sheets
and the braze alloy Ni–Cr 25-P10 (wt%) was applied in powder form. The assembly

5
was then brazed together in a vacuum furnace at 1075°C for one hour in a dry argon
atmosphere at 0.03–0.1 mbar.
Y-frame beams: Stainless steel sheets were CNC folded to form the upper part of the
Y-frame and the Y-frame leg. Slots were CNC cut into the horizontal web of the
upper part of the Y-frame and the Y-frame leg was then fitted into the upper part of
the Y-frame, as described in [6]. The core was then spot welded to the face sheets and
the beam was brazed together according to the details as given above.
2.2 Material properties
Uniaxial tensile tests have been performed on standard dog-bone specimens; these
were cut from as-received AISI 304 stainless steel sheets and subjected to the same
brazing cycle as that used to manufacture the sandwich beams (see Section 2.1). The
uniaxial tensile response of the brazed stainless steel material, at an applied strain-rate
p& = 10-3 s-1, is shown in Fig. 3a. The measured Young's modulus E and 0.2% offset
yield strength Y are 210 GPa and 210 MPa, respectively. The post-yield response of
the stainless steel is approximately linear with a tangent modulus Et ≈ 2.1 GPa.
The strain-rate sensitivity of stainless steel has been previously investigated by Stout
and Follansbee [17] for strain-rates in the range 10-3 s-1 ≤ p& ≤ 104 s-1. Define the
dynamic strengthening ratio R as the ratio of the stress 0.1d p at an applied
strain-rate p& to the stress 0 0.1p at an applied strain rate p& = 10-3 s-1. Their
results for R as a function of the plastic strain-rate p& are reproduced in Fig. 3b. The
measured stress versus strain histories presented in [17] indicate that R is reasonably
independent of the choice of plastic strain p at which R is calculated. Thus, the
dynamic stress d versus plastic strain p history can be estimated as
0d p p pR & , (1)
where pR & is given in Fig. 3b. In the dynamic finite element simulations of the
experiments presented in Section 4.1 we employ this prescription for the strain-rate
sensitivity of stainless steel, with 0 p given by the measured quasi-static ( p& =
10-3 s-1) stress versus strain history (Fig. 3a). For illustration, the estimated true
tensile stress versus logarithmic plastic strain histories of the 304 stainless steel at four
selected values of applied strain-rate are shown in Fig. 3a.

6
2.2 Support conditions for the beams
The beams of length 2Lf = 375 mm were tested under both simply-supported and
clamped boundary conditions. We emphasise that, in all cases, the prismatic axis of
the core (i.e. the x3 direction in Fig. 2) was aligned with the longitudinal axis of the
beam; see Fig. 4. In the simply-supported condition, steel rollers of diameter D = 9
mm were used to support the beams with a span 2L = 250 mm, as shown in Fig. 4a.
In the clamped configuration, the beam end portions, of length 62.5 mm, were bolted
to the testing rig using steel clamping plates and M6 bolts; see Fig. 4b. For clamped
beams, the end portions of the core were filled with an epoxy resin to ensure that a
sufficient clamping force could be applied without crushing the core within the
clamps.
2.3 Drop weight apparatus and test protocol
The sandwich beams were loaded centrally via a cylindrical roller of diameter 2R =
20 mm and length 60 mm, such that the axis of the cylinder was aligned with the x1
direction as shown in Fig. 4. The top surface of the roller was machined flat and a
piezoelectric load cell (PCB model 218C) was fixed onto the roller to provide a
measurement of the transient force exerted on the beam, see Fig. 4.
The sandwich beams were impacted using a drop weight apparatus as sketched in
Fig. 4. A cylindrical steel projectile of diameter Dp = 57 mm and mass M was
dropped from a height of 1.3 m through a transparent guide tube as shown in Fig. 4.
The projectile impacts the beam at a velocity 0v = 5 ms-1 via the load cell and the
roller. A rubber sheet of thickness tr = 1.5 mm was glued to the bottom surface of the
projectile to dampen the contact forces and reduce the ringing in the load cell. The
mass M was selected so that the residual central roller displacement δ is about 10% of
the beam half-span, i.e. δ/L = 0.1. Clamped beams required more energy to achieve
this deflection than simply-supported beams and consequently, a mass M = 2 kg and
3 kg was used for simply-supported and clamped beams, respectively.
The impact event was visualised by high-speed photography using a Phantom V12
camera taking images at an inter-frame time of 100 μs and an exposure time of 30 μs.
The high speed photographs were used to (i) measure the velocity 0v of the projectile
just prior to impact and (ii) measure the temporal evolution of the central roller

7
displacement δ. Typically, the projectile maintained contact with the force sensor for
about 8-10 ms and this was followed by a succession of smaller impacts as the mass
rebounded and re-impacted the beam. The effect of these subsequent impacts was
negligible as most of the kinetic energy of the projectile was dissipated in the primary
impact. The force F versus time history, measured from the piezoelectric load cell,
was synchronised with the timing of the high speed camera (which was used to
measure the central roller displacement δ) to generate a F versus δ response for all
beams tested in this study.
3. Summary of measurements
Here, we present a summary of the observations and measurements from the drop-
weight tests on sandwich beams with a corrugated core or a Y-frame core. The results
are compared with previous quasi-static measurements reported by St-Pierre et al.
[13] on simply-supported and clamped sandwich beams: the corrugated and Y-frame
core sandwich beams in [13] were identical to those employed in this study in terms
of the solid material, beam geometry and manufacturing process, hence a direct
comparison is straightforward.
3.1 Simply-supported beams
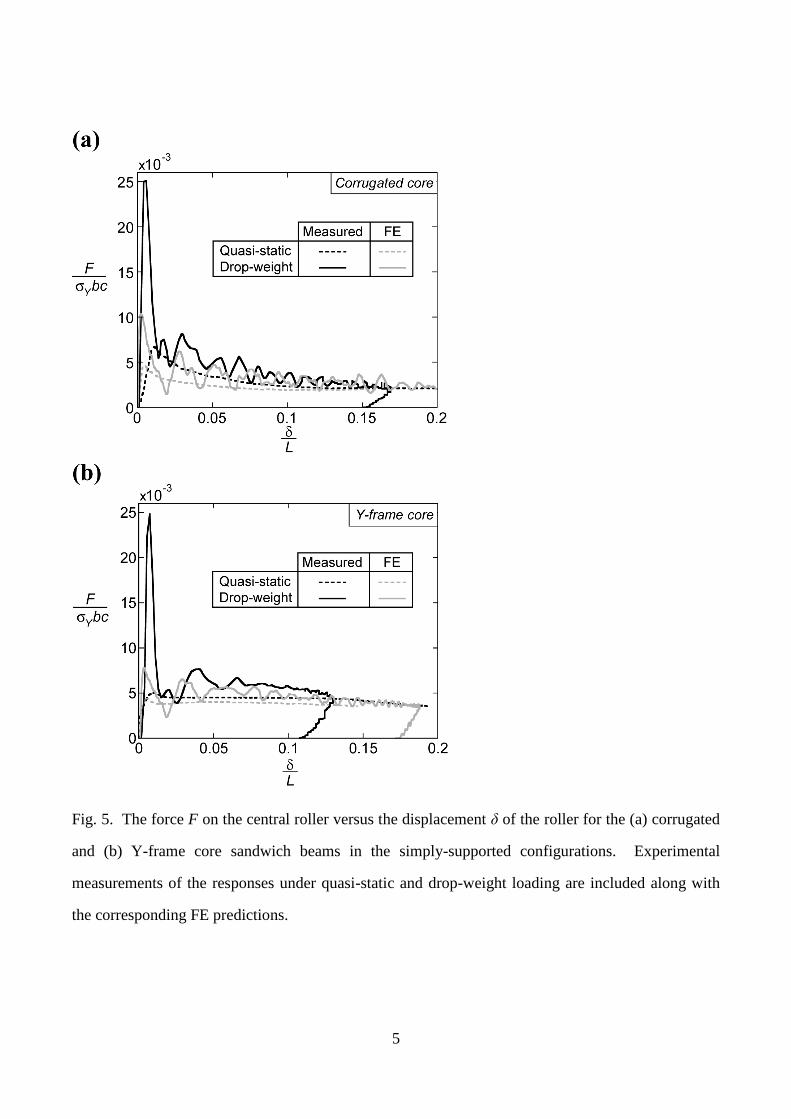
The measured drop-weight impact responses of the simply-supported corrugated and
Y-frame core sandwich beams are plotted in Fig. 5a and b, respectively. The
responses are plotted in terms of the compressive force F measured by the
piezoelectric load cell (see Fig. 4) versus the displacement δ of the central roller. In
Fig. 5, the force F is normalised by Ybc , where Y = 210 MPa is the quasi-static
yield strength of the 304 stainless steel, and b = 55 mm and c = 22 mm are the width
of beam and core height, respectively. The displacement δ is normalised by the beam
half-span L = 125 mm.
The corrugated and Y-frame core sandwich beams both display a high initial peak
load followed by a sudden drop. Subsequently, the corrugated core response is mildly
softening while the Y-frame sandwich beam displays a plateau in load that is
relatively insensitive to the roller displacement. The kinetic energy of the projectile is
approximately 25 J and while this energy is absorbed by the corrugated core beam at a
displacement δ/L ≈ 0.15, the higher load carrying capacity of the Y-frame beam leads
to a smaller maximum deflection of δ/L ≈ 0.12. Measurements of the unloading

8
responses of the sandwich beams, as the projectile rebounds off the beam, are
included in Fig. 5.
The quasi-static measurements of St-Pierre et al. [13] are included in Fig. 5 for the
simply-supported beams. It is clear that while the quasi-static measurements do not
display the high initial peak load, the post-peak responses for the drop-weight and
quasi-static measurements are very similar. This suggests that the sandwich beam
responses are relatively insensitive to rate effects (material strain-rate effects or
inertial effects) for impacts velocities in the range of 5 ms-1. One caveat to this
conclusion is the high initial peak loads measured in the drop-weight experiments.
Our hypothesis to explain this discrepancy between the quasi-static initial peak loads
and those measured during the drop-weight tests is that the initial peak loads
measured during the drop weight measurements are strongly influenced by the mass
of the load cell and roller through which the loading is applied to the beam. To test
this hypothesis, an additional drop-weight measurement was conducted on the simply-
supported Y-frame sandwich beam in which the steel roller was replaced by an
aluminium roller of identical dimensions. The aluminium roller had a mass of 64 g
whereas the steel roller used in the reference experiment had a mass of 146 g. The
reference drop-weight measurement with the steel roller and the additional
measurement of the simply-supported Y-frame sandwich beam with the aluminium
are compared in Fig. 6. It is clear that use of an aluminium roller reduces the initial
peak load by a factor of two but does not have a significant effect on the post-peak
response. This confirms our hypothesis that the high initial peak load is not due to
dynamic effects within the sandwich beam. Instead, the measured peak load is related
to the force required to accelerate the roller/load cell assembly. In Appendix A, we
present a simple model (which neglects the sandwich beam) to show that the peak
load scales with the projectile mass M and the combined mass m of the roller/load cell
assembly according to
max
MmF
M m
. (2)

9
This model predicts that the ratio of the initial peak forces for the steel roller and for
the aluminium roller is 1.48. Recall that the measured peak force ratio is about 2.
Thus, the model correctly predicts the reduction in the peak force with decreasing
mass of the roller/load cell assembly and, given that the model neglects the influence
of the sandwich beam in this initial phase, it is not surprising that the agreement
between the predictions and measurements is imprecise.
High-speed photographs showing the deformation of the simply-supported Y-frame
sandwich beam in the drop-weight experiment are shown in Fig. 7a for two values of
the steel roller displacement δ. Photographs of the simply-supported Y-frame beam
deformed to the same values of δ under quasi-static loading conditions are included in
Fig. 7b from the study of St-Pierre et al. [13]. It is clear that under both quasi-static
and low velocity impact conditions, as in the drop-weight apparatus, the deformation
modes are very similar and involve the indentation of the core under the central roller.
This is consistent with the fact that the F versus δ responses are very similar under
these two loading conditions. Likewise, the beams with a corrugated core deform by
core indentation under both quasi-static and low velocity impact conditions; however,
images of these deformed beams are omitted for the sake of brevity.
3.2 Clamped beams
The measured F versus δ responses of the clamped sandwich beams with a corrugated
or Y-frame core are plotted in Fig. 8a and b, respectively. Similar to the simply-
supported beams, the clamped corrugated and Y-frame core beams display an initial
peak load, but now followed by a smaller load drop. Unlike the simply-supported
beams, the clamped beams display a mild hardening response after the initial peak
load. This hardening is due to stretching of the face sheets and core (along its
prismatic axis), as discussed by St-Pierre et al. [13]. Both the corrugated and Y-frame
core sandwich beams absorb the kinetic energy of the projectile at a deflection δ/L ≈
0.1 and subsequently unload as seen in the measurements in Fig. 8.
The corresponding quasi-static measurements of St-Pierre et al. [13] for clamped
sandwich beams are included in Fig. 8. Similar to the simply-supported case, the
initial peak load measured in the drop-weight tests exceed those measured under
quasi-static loading, but subsequently there is a good agreement between the F versus

10
δ responses. The discrepancy in peak load is again ascribed to acceleration of the
roller/load cell assembly.
Photographs showing the deformation of the clamped Y-frame sandwich beams, at
two selected values of roller displacement δ, are given in Fig. 9a and b for the drop-
weight and quasi-static tests, respectively. The quasi-static specimens are those of St-
Pierre et al. [13]. As for the simply-supported case, the Y-frame sandwich beams
suffer core indentation under the central roller for both quasi-static and low velocity
impact conditions. The corrugated core sandwich beams also deformed in this
manner, but photographs are again omitted for the sake of brevity.
In summary, there is no observable change in deformation mode of the corrugated and
Y-frame core sandwich beams when the roller speed is increased from quasi-static to
5 ms-1. This holds true for both simply supported and clamped beams.
4. Finite element models
Three-dimensional Finite Element (FE) models were developed to simulate the
response of the corrugated and Y-frame core sandwich beams. The FE models are
first validated against the measurements reported in Section 3 and then used to
investigate:
(i) the effect of impact velocity over a wider range of velocities than achievable by the
drop-weight apparatus, and
(ii) the significance of the back face sheet in dictating the low velocity impact
response of the sandwich beams.
4.1 Description of the finite element models
All computations were performed using the explicit time integration version of the
commercially available finite element code Abaqus (version 6.9). Three-dimensional
simulations were performed by modelling one quarter of the sandwich beams.
Symmetry boundary conditions on the beam were prescribed along the mid-plane
( 3 0x ) and a plane dividing the beam into two equal longitudinal halves ( x1 0),
see Fig. 2. Simply-supported beams of half-length Lf = 187.5 mm were modelled by
placing the beam on a rigid cylindrical roller of diameter D = 9 mm such that the
roller was at a distance L = 125 mm from mid-span, see Fig. 4. Thus, the overhang of
the simply-supported beams was modelled as in the experiments. For the clamped

11
beams, the half-span of length L = 125 mm was modelled, and all displacement
degrees-of-freedom were constrained to zero at the edge 3x = L, in order to simulate
clamped boundary conditions. The face sheets and core of the sandwich beams were
modelled using four-noded shell elements (S4R in Abaqus notation) with an element
size of 0.5 mm. Perfect bonding between core and face sheets was assumed, and all
dimensions were identical to those used in the experiments, see Fig. 2.
The AISI 304 stainless steel, used to manufacture the sandwich beams, was treated as
a J2-flow theory rate-dependent solid, of density f = 7900 kgm-3, Young’s modulus
E = 210 GPa and Poisson’s ratio ν = 0.3. The uniaxial tensile true stress versus
equivalent plastic strain curves at plastic strain-rates 10-3 s-1 ≤ p& ≤ 104 s-1 were
tabulated in Abaqus using the prescription described in Section 2.2 and employing the
data of Fig. 3.
The prescription of the loading imposed in the drop-weight experiments was
simplified in the FE simulations; we do not separately model the cylindrical projectile
and the roller/load cell assembly as shown in Fig. 4. Rather, we model contact
between the central roller and the beam as follows. The central roller was modelled
as a rigid cylinder of diameter 2R = 20 mm and mass M/4, where M is the mass of the
projectile (recall M = 2 kg for simply-supported beams and 3 kg for clamped beams)
and given an initial velocity 0v = -5 ms-1 in the 2x -direction. Consequently, the initial
kinetic energy in the simulations was the same as that in the experiments. The roller
was constrained to only move in the 2x -direction and all rotations of the roller were
constrained to zero. The general contact option in Abaqus was employed to simulate
contact between all possible surfaces including (i) the core and face sheets, (ii) self-
contact of the core, (iii) contact of the two face sheets, (iv) contact between the central
roller and front face sheet and (v) contact between the support roller and the back face
sheet for simply-supported beams. The general contact algorithm in Abaqus enforced
a hard and frictionless contact interaction using a penalty algorithm. 4.2 Comparison between measurements and predictions
The FE predictions of the F versus δ responses for the simply-supported and clamped
sandwich beams in the drop-weight experiments are included in Figs. 5 and 8,
respectively. Here, F is the contact force between the central roller and the sandwich
beam while δ is the displacement of the roller. As expected, the FE predictions do not

12
capture the initial peak load measured as the impact between the drop-weight and the
roller/load cell assembly is not modelled in the simulations. However, the FE
predictions capture the post-initial peak response to a high level of accuracy with two
exceptions: (i) in the simply-supported case the FE model overestimates the deflection
of the beam prior to unloading: we attribute this to the fact that in the experiments
some of the kinetic energy of the drop-weight is dissipated in the impact between the
projectile and the roller/load cell assembly which is not accounted for in the FE
simulations, and (ii) the FE model slightly overestimates the loads measured in the
clamped beam experiments: this is attributed to the observation that there is a small
amount of pull-out of the sandwich beams from the end supports in the experiments,
which is not accounted for in the FE model.
FE predictions of the quasi-static responses of the sandwich beams are included in
Figs. 5 and 8; they are reproduced from St-Pierre et al. [13]. Again, the agreement
between measurements and FE predictions is good and any discrepancies are similar
to those discussed above for the drop-weight experiments.
4.3 The effect of impact velocity on the beam response
The range of impact velocities that can be explored using a drop-weight apparatus is
rather limited. We have demonstrated in Section 4.2 that the FE model accurately
captures the response of the sandwich beams in the drop-weight experiments. Thus,
we now use the FE model to explore the effect of impact velocity on the response of
the sandwich beam. To simplify interpretation of the results, simulations are
performed with a constant velocity 0v imposed to the central roller, and the F versus δ
response is calculated. All other aspects of the calculations are identical to those
described in Section 4.1 in which the central roller was given an initial velocity.
Imposing a constant velocity on the roller removes the complication of requiring both
the initial kinetic energy and momentum to describe the loading conditions. Instead,
the loading is described by a single parameter 0v .
The predicted F versus δ responses for the simply-supported and clamped Y-frame
core sandwich beams are plotted in Fig. 10a and b, respectively. It is clear that the
response is relatively insensitive to 0v for 0v ≤ 5 ms-1 in both the simply-supported
and clamped cases. At higher values of 0v the contact force F increases with
increasing 0v and the mode of deformation changes with the development of

13
travelling plastic hinges as in the high velocity impact study of Rubino et al. [8]. This
high velocity impact regime is not the primary focus of this study and readers are
referred to Rubino et al. [8] for more details about this regime. Similar results are
obtained for the corrugated core sandwich beams but not included here for the sake of
brevity. It suffices to conclude that for velocities typical for ship collisions, i.e. 0v ≤
5 ms-1, the response of corrugated and Y-frame core sandwich beams is relatively
insensitive to velocity and a quasi-static assessment should be adequate for such
applications.
4.4 The effect of the back face on the beam response
Full-scale collision tests performed on the Y-frame double hull design (Fig. 1b)
revealed that the inner hull underwent negligible deformation and hence played only a
minor role in terms of energy absorption [3]. This motivated the development of a
single hull structure where the Y-frame stiffeners are welded directly to the bulkheads
and the outer hull as shown in Fig. 1d. Full-scale collision tests were subsequently
performed on this single hull Y-frame structure. It had a similar crash-worthiness to
the Y-frame double hull design, but is significantly simpler and cheaper to
manufacture. St-Pierre et al. [13] analysed the quasi-static response of sandwich
beams with and without the back face sheet. Their results demonstrated that the mode
of deformation typically switches from core indentation in the sandwich beams with
both front and back face sheets to Brazier buckling when the back face sheet is
removed. Here, we use the FE analysis to predict the responses of sandwich beams
with and without a back face under low velocity impact conditions similar to those in
typical ship collisions. In line with the technique employed in Section 4.3, we do not
model an impact event but rather impose a constant velocity 0v = 5 ms-1 on the central
roller and calculate the F versus δ responses. In all cases, the results at 0v = 5 ms-1
are compared with the corresponding quasi-static predictions from St-Pierre et al.
[13].
The cross-sectional geometries of the corrugated and Y-frame core sandwich beams
without the back face are identical of those shown in Fig. 2 except that the front face
sheet thickness is doubled to 0.6 mm and the back face sheet is eliminated. Thus, the
areal mass of beams with both face sheets is identical to that of beams without the
back face. The predicted F versus δ responses for the corrugated and Y-frame core
beams with both front and back faces are included in Fig. 11a and b, respectively,

14
whereas the corresponding results for the beams without the back face are presented
in Fig. 11c and d. In each figure, simulations for both simply-supported and clamped
beams are presented; and, for each support condition, the response for 0v = 5 ms-1 is
compared to the quasi-static response.
The results in Fig 11 indicate that the initial peak load is sensitive to the deformation
rate; it increases from quasi-static loading to 0v = 5 ms-1. This increase is larger for
beams without a back face (Fig. 11c,d) than for those with front and back faces (Fig.
11a,b). Recall that the areal mass of the front face sheet for sandwich beams without
a back face is double that of beams with front and back faces. This heavier front face
requires a higher initial force to accelerate it to 0v = 5 ms-1 and consequently, the
initial peak load is higher for beams without a back face.
St-Pierre et al. [13] revealed that the quasi-static collapse mode for simply supported
and clamped beams with a Y-frame or corrugated core switches from core indentation
to Brazier buckling loading when the back face of the beam is moved to augment the
front face. Their study, and the results in Fig. 11, show that the load versus
displacement response is relatively insensitive to this mechanism switch. We proceed
to investigate whether this same switch in collapse mechanism occurs at 0v = 5 ms-1.
The observed mechanism(s) are reported only for the simply supported beam with a
Y-frame core. However, the numerical simulations revealed that the same
conclusions hold for clamped beams and for the corrugated core; these details are
omitted for brevity.
FE predictions of the distribution of the von-Mises equivalent plastic strain pl in
simply-supported Y-frame beams with and without the back face sheet are shown in
Fig. 12 at a roller displacement δ/L = 0.05. Results are given for both quasi-static and
dynamic loading at 0v = 5 ms-1. First consider the quasi-static case. The central roller
indents the sandwich beam when it contains front and back faces: plastic straining is
concentrated beneath the roller. In contrast, plastic straining is diffuse for the
sandwich beam without a back face: the plastic strain spreads over a larger area on the
rear surface of the beam indicating that Brazier buckling is the active collapse mode.
Now, consider the case of 0v = 5 ms-1. Again, it is clear that core indentation is the
collapse mode for the sandwich beam with front and back face sheets. However, for

15
the beam without a back face, deformation and plastic straining is again concentrated
under the roller. We conclude that there is no switch in deformation mode between
the beams with and without back faces for dynamic loading at 0v = 5 ms-1: core
indentation is the operative mode for both beam designs.
5. Concluding remarks
Sandwich hull designs, with a corrugated core or a Y-frame core, have been proposed
to improve the impact resistance of ships in the event of a collision. In this study, we
have investigated, via experiments and finite element (FE) simulations, the response
of corrugated and Y-frame sandwich beams at loading rates ranging from quasi-static
conditions to velocities up to 20 ms-1.
Drop-weight experiments were conducted on corrugated and Y-frame core sandwich
beams with identical front and back face sheets, and in both simply-supported and
clamped configurations. All beams were manufactured from AISI 304 stainless steel
and had an areal mass of 9.1 kgm-2. The force on the central loading roller was
measured as a function of roller displacement. In all cases, the drop-weight and
quasi-static responses were found to be very similar, indicating that inertia or material
rate effects play a minor role in the drop-weight tests where the impact velocity was 5
ms-1. Moreover, the corrugated and Y-frame core beams had similar performances in
terms of their force versus deflection responses.
Three-dimensional FE simulations of the drop-weight experiments were in excellent
agreement with the measurements. The FE model was then extended to study (i) the
effect of impact velocity over a wider range of velocities than those achievable using
a drop-weight apparatus, and (ii) the influence of the back face sheet. The response of
the sandwich beams containing both front and back face sheets was found to be
relatively insensitive to the loading velocity for speeds less than approximately 5 ms-1.
This suggests that quasi-static considerations should suffice to model a ship collision
in which the hull has a sandwich construction with front and back faces. In contrast,
while beams without a back face collapsed by Brazier buckling under quasi-static
loading, the collapse mode switched to core indentation at a loading velocity of
5 ms-1. Thus, dynamic considerations are needed for sandwich ship hull designs that
do not employ a back face.

16
Acknowledgments
This research was carried out under the project number MC2.06261 in the framework
of the Research Program of the Materials innovation institute M2i (www.m2i.nl). The
authors are also grateful for the financial support of the Fonds Québécois de la
Recherche sur la Nature et les Technologies (FQRNT).

17
References
[1] P. Kujala, M. Hänninen, T. Arola, J. Ylitalo, Analysis of the marine traffic
safety in the Gulf of Finland, Reliab. Eng. and Syst. Saf. 94 (2009) 1349-1357.
[2] J.K. Paik, Innovative structural designs of tankers against ship collisions and
grounding: a recent state-of-the-art review, Mar. Technol. 40 (2003) 25-33.
[3] L.J. Wevers, A.W. Vredeveldt, Full scale ship collision experiments 1998, TNO
report 98-CMC-R1725, Delft, The Netherlands, 1999.
[4] A. Konter, J. Broekhuijsen, A.W. Vredeveldt, A quantitative assessment of the
factors contributing to the accuracy of ship collision predictions with the finite
element method, Proceedings of the Third International Conference on the
Collision and Grounding of Ships, Izu, Japan (2004) 17-26.
[5] H. Naar, P. Kujala, B.C. Simonsen, H. Ludolphy, Comparison of the
crashworthiness of various bottom and side structures, Mar. Struct. 15 (2002)
443-460.
[6] V. Rubino, V.S. Deshpande, N.A. Fleck, The collapse response of sandwich
beams with a Y-frame core subjected to distributed and local loading, Int. J. of
Mech. Sci. 50 (2008) 233-246.
[7] V. Rubino, V.S. Deshpande, N.A. Fleck, The three-point bending of Y-frame
and corrugated core sandwich beams, Int. J. of Mech. Sci. 52 (2010) 485-494.
[8] V. Rubino, V.S. Deshpande, N.A. Fleck, The dynamic response of end-clamped
sandwich beams with a Y-frame or corrugated core, Int. J. of Impact Eng. 35
(2008) 829-844.
[9] V. Rubino, V.S. Deshpande, N.A. Fleck, The dynamic response of clamped
rectangular Y-frame and corrugated core sandwich plates, Eur. J. of Mech.
A/Solids 28 (2009) 14-24.
[10] M.T. Tilbrook, D.D. Radford, V.S. Deshpande, N.A. Fleck, Dynamic crushing
of sandwich panels with prismatic lattice cores, Int. J. of Solids and Struct. 44
(2007) 6101-6123.
[11] ISSC, Report of committee V1: collision and grounding, in: P.A. Frieze, R.A.
Shenoi, (Eds.), Proceedings of the 16th International Ship and Offshore
Structures Congress, Southampton, UK (2006).
[12] B. van de Graaf, J. Broekhuijsen, A.W. Vredeveldt, A. van de Ven,
Construction aspects for the Schelde Y-shape crashworthy hull structure,
Proceedings of the Third International Conference on the Collision and
Grounding of Ships, Izu, Japan (2004) 229–233.

18
[13] L. St-Pierre, N.A. Fleck, V.S. Deshpande, Sandwich beams with corrugated and
Y-frame cores: does the back face contribute to the bending response? J. of
Appl. Mech. 79 (2012) 011002.
[14] V. Crupi, R. Montanini, Aluminium foam sandwiches collapse modes under
static and dynamic three-point bending, Int. J. of Impact Eng. 34 (2007) 509-
521.
[15] J. Yu, E. Wang, J. Li, Z. Zheng, Static and low-velocity impact behavior of
sandwich beams with closed-cell aluminum-foam core in three-point bending,
Int. J. of Impact Eng. 35 (2008) 885-894.
[16] V. Crupi, G. Epasto, E. Guglielmino, Collapse modes in aluminium honeycomb
sandwich panels under bending and impact loading, Int. J. of Impact Eng. 43
(2012) 6-15.
[17] M.G. Stout, P.S. Follansbee, Strain-rate sensitivity, strain-hardening, and yield
behaviour of 304L stainless steel, J. of Eng. Mater. and Technol. 108 (1986)
344-353.

19
Appendix A: A model to demonstrate the effect of the roller mass
The measurements in Fig. 6 illustrate that the initial peak force measured during the
drop-weight experiments is sensitive to the mass of the roller/load cell assembly. In
this appendix, we present a simple two degrees-of-freedom model to explain this
observation. The model is sketched in Fig. A.1 and comprises two rigid bodies of
masses M and m representing the projectile and the roller/load cell assembly,
respectively. The masses are connected by a linear massless spring of stiffness k that
represents the rubber sheet on the bottom surface of the projectile; see Fig. 4. The
two masses are constrained to move only in the vertical direction and thus the model
has only two degrees of freedom. The force in the spring is the force measured by the
load cell in the roller/load cell assembly.
Just prior to impact, the projectile has an initial velocity 0v and the mass m is
stationary. The spring attains its maximum compression when the velocities the two
masses equalise. Momentum conservation then provides that this common velocity
fv as
vf
Mvo
M m, (A.1)
and energy conservation specifies that the maximum compressive force maxF in the
linear spring is given by the expression
22 2
0 max
2 2 2fM m vMv F
k
. (A.2)
Combining Eq. (A.1) and (A.2), the maximum compressive force as measured by the
load cell is
Fmax
kMmv
o
2
M m. (A.3)
Thus, the maximum or peak measured force is expected to scale as

20
max
MmF
M m
. (A.4)
This model predicts that the ratio of the peak forces with the steel roller and
aluminium roller is 1.48. Recall that the measured peak force ratio is about 2. Thus,
the model correctly predicts the reduction in the peak force with decreasing mass of
the roller/load cell assembly. Given that this simple two degrees-of-freedom model
neglects the influence of the sandwich beam in this initial phase, it is not surprising
that the quantitative agreement between the prediction and measurement is inexact.

21
Figure captions
Fig. 1. Sketches of four ship hull designs considered to improve the collision
resistance: (a) a conventional double hull and two sandwich hull constructions with
(b) a Y-frame core and (c) a corrugated core. (d) The Y-frame hull without the back
face illustrating how the Y-frames are directly attached to the bulk-heads.
Fig. 2. Geometries of the (a) corrugated core and (b) Y-frame core sandwich beams.
All dimensions are in mm and the co-ordinate system used to define the orientations is
also included.
Fig. 3. The measured quasi-static ( p& = 10-3 s-1) tensile stress versus strain response
of the AISI 304 stainless steel and the estimated high strain-rate responses at four
additional values of strain-rate, using the data of [17]. (b) The dynamic strength
enhancement ratio R as a function of plastic strain-rate p& for the AISI 304 stainless
steel at plastic strain p = 0.1.
Fig. 4. Sketch of the experimental setup used to perform drop-weight tests at 5 ms-1
for beams in the (a) simply supported and (b) clamped configurations. A sandwich
beam with a corrugated core is shown. All dimensions are in mm.
Fig. 5. The force F on the central roller versus the displacement δ of the roller for the
(a) corrugated and (b) Y-frame core sandwich beams in the simply-supported
configurations. Experimental measurements of the responses under quasi-static and
drop-weight loading are included along with the corresponding FE predictions.
Fig. 6. The measured force F on the central roller versus the displacement δ of the
roller for simply-supported Y-frame sandwich beams tested in the drop-weight
apparatus. Measurements for both a steel central roller and a geometrically identical
aluminium roller are presented to illustrate the effect of the roller mass on the
measurements.
Fig. 7. (a) High-speed photographs showing the deformation of the simply-supported
Y-frame sandwich beam in the drop-weight tests. The photographs show the
deformation at two values of the central roller displacement δ. (b) The corresponding

22
photographs for the deformation of the simply-supported Y-frame beams under quasi-
static loading taken from the study of St-Pierre et al. [13].
Fig. 8. The force F on the central roller versus the displacement δ of the roller for the
(a) corrugated and (b) Y-frame core sandwich beams in the clamped configurations.
Experimental measurements of the responses under quasi-static and drop-weight
loading are included along with the corresponding FE predictions.
Fig. 9. (a) High-speed photographs showing the deformation of the clamped Y-frame
sandwich beam in the drop-weight tests. The photographs show the deformation at
two values of the central roller displacement δ. (b) The corresponding photographs
for the deformation of the simply-supported Y-frame beams under quasi-static loading
taken from the study of St-Pierre et al. [13].
Fig. 10. FE predictions of the force F on the central roller versus the displacement δ
of the roller for the Y-frame sandwich beams in the (a) simply-supported and (b)
clamped configurations. The predictions are shown for selected values of the velocity
0v imposed on the central roller.
Fig. 11. FE predictions of the force F on the central roller versus the displacement δ
of the roller for simply-supported and clamped beams under quasi-static and dynamic
loading with a constant central roller velocity 0v = 5 ms-1. Results are presented for
(a) corrugated and (b) Y-frame sandwich beams with both front and back faces and
for beams without the back face in (c) and (d) for the corrugated and Y-frame cores,
respectively.
Fig. 12. FE predictions of the distribution of von-Mises equivalent plastic strain pl
in the simply-supported Y-frame beams at a central roller displacement δ/L = 0.05.
Sandwich beams with and without a back face are shown, and the results are given for
quasi-static loading and for a constant central roller velocity 0v = 5 ms-1.
Fig. A.1. Sketch of the two degrees-of-freedom model used to understand the effect
of the mass of the roller/load cell assembly on the initial peak force measured in the
drop-weight tests.

1
Fig. 1. Sketches of four ship hull designs considered to improve the collision resistance: (a) a
conventional double hull and two sandwich hull constructions with (b) a Y-frame core and (c) a
corrugated core. (d) The Y-frame hull without the back face illustrating how the Y-frames are
directly attached to the bulk-heads.

2
Fig. 2. Geometries of the (a) corrugated core and (b) Y-frame core sandwich beams. All dimensions
are in mm and the co-ordinate system used to define the orientations is also included.

3
Fig. 3. The measured quasi-static (p
= 10-3
s-1
) tensile stress versus strain response of the AISI 304
stainless steel and the estimated high strain-rate responses at four additional values of strain-rate,
using the data of [17]. (b) The dynamic strength enhancement ratio R as a function of plastic strain-
rate p
for the AISI 304 stainless steel at plastic strain p
= 0.1.

4
Fig. 4. Sketch of the experimental setup used to perform drop-weight tests at 5 ms-1
for beams in the
(a) simply supported and (b) clamped configurations. A sandwich beam with a corrugated core is
shown. All dimensions are in mm.
5
Fig. 5. The force F on the central roller versus the displacement δ of the roller for the (a) corrugated
and (b) Y-frame core sandwich beams in the simply-supported configurations. Experimental
measurements of the responses under quasi-static and drop-weight loading are included along with
the corresponding FE predictions.

6
Fig. 6. The measured force F on the central roller versus the displacement δ of the roller for simply-
supported Y-frame sandwich beams tested in the drop-weight apparatus. Measurements for both a
steel central roller and a geometrically identical aluminium roller are presented to illustrate the effect
of the roller mass on the measurements.

7
Fig. 7. (a) High-speed photographs showing the deformation of the simply-supported Y-frame
sandwich beam in the drop-weight tests. The photographs show the deformation at two values of the
central roller displacement δ. (b) The corresponding photographs for the deformation of the simply-
supported Y-frame beams under quasi-static loading taken from the study of St-Pierre et al. [13].

8
Fig. 8. The force F on the central roller versus the displacement δ of the roller for the (a) corrugated
and (b) Y-frame core sandwich beams in the clamped configurations. Experimental measurements
of the responses under quasi-static and drop-weight loading are included along with the
corresponding FE predictions.

9
Fig. 9. (a) High-speed photographs showing the deformation of the clamped Y-frame sandwich
beam in the drop-weight tests. The photographs show the deformation at two values of the central
roller displacement δ. (b) The corresponding photographs for the deformation of the simply-
supported Y-frame beams under quasi-static loading taken from the study of St-Pierre et al. [13].

10
Fig. 10. FE predictions of the force F on the central roller versus the displacement δ of the roller for
the Y-frame sandwich beams in the (a) simply-supported and (b) clamped configurations. The
predictions are shown for selected values of the velocity 0
v imposed on the central roller.

11
Fig. 11. FE predictions of the force F on the central roller versus the displacement δ of the roller for
simply-supported and clamped beams under quasi-static and dynamic loading with a constant central
roller velocity 0
v = 5 ms-1
. Results are presented for (a) corrugated and (b) Y-frame sandwich beams
with both front and back faces and for beams without the back face in (c) and (d) for the corrugated
and Y-frame cores, respectively.

12
Fig. 12. FE predictions of the distribution of von-Mises equivalent plastic strain pl
in the simply-
supported Y-frame beams at a central roller displacement δ/L = 0.05. Sandwich beams with and
without a back face are shown, and the results are given for quasi-static loading and for a constant
central roller velocity 0
v = 5 ms-1
.

13
Fig. A.1. Sketch of the two degrees-of-freedom model used to understand the effect of the mass of
the roller/load cell assembly on the initial peak force measured in the drop-weight tests.