the long-run performance of firms that issue convertible … of corporate finance 7 2001...
TRANSCRIPT

Ž .Journal of Corporate Finance 7 2001 447–474www.elsevier.comrlocatereconbase
The long-run performance of firms that issueconvertible debt: an empirical analysis of
operating characteristics and analyst forecasts
Craig M. Lewis a,), Richard J. Rogalski b, James K. Seward c
a Owen Graduate School of Management, Vanderbilt UniÕersity NashÕille, TN 37203, USAb Amos Tuck School of Business Administration, Dartmouth College, HanoÕer, NH 03755, USA
c Graduate School of Business, UniÕersity of Wisconsin-Madison Madison, WI 53706, USA
Accepted 22 June 2001
Abstract
Many firms issue hybrid securities, such as convertible debt, instead of standardsecurities like straight debt or common equity. Theoretical arguments suggest that convert-ible debt minimizes costs for firms facing high debt- and equity-related external financingcosts. Theory also suggests that an appropriately designed convertible security providesefficient investment incentives. We show, however, that firms on average perform poorlyfollowing the issuance of convertible debt. The empirical evidence suggests that theefficient investment decisions predicted by theory are not in fact achieved by the actualdesign and issuance of convertible debt securities. An alternative interpretation of convert-ible debt offers is that investors ration the participation of some issuers in the seasonedequity market. q 2001 Elsevier Science B.V. All rights reserved.
Keywords: Debt; Security; Firm
1. Introduction
Corporate financing decisions are efficient if security choice and securitydesign mitigate the costs of external finance. Capital market imperfections, such as
) Corresponding author.Ž .E-mail address: [email protected] C.M. Lewis .
0929-1199r01r$ - see front matter q2001 Elsevier Science B.V. All rights reserved.Ž .PII: S0929-1199 01 00035-9

( )C.M. Lewis et al.rJournal of Corporate Finance 7 2001 447–474448
asymmetric information, risk shifting and overinvestment problems, create debt-Ž . Ž .and equity-related costs of external finance. Green 1984 , Stein 1992 and
Ž .Mayers 1998 illustrate that for some firms, convertible debt can simultaneouslymitigate both debt- and equity-related financing problems. Although the modelsdiffer in their assumptions about the source of the debt- and equity-relatedfinancing costs, they all suggest that convertible debt can be designed to inducemanagers to make efficient capital expenditure decisions.
We demonstrate, however, that the facts do not support this prediction aboutŽ .investment behavior. Using a sample of 566 convertible debt offerings CDOs by
U.S. industrial companies during the period 1979–1990, we find that firmsexperience poor long-run stock price and operating performance following con-vertible debt offers. This evidence is not consistent with the theories of convertibledebt financing.
Firms that sell common equity in initial public and seasoned equity offersŽ .SEOs also experience poor stock price performance for up to 5 years following
Žthe issue date see, e.g., Ritter, 1991; Loughran and Ritter, 1995; Spiess and.Affleck-Graves, 1995 . Some researchers attribute the poor long-run stock price
Žperformance to poorer operating performance following equity offerings see, e.g.,Hansen and Crutchley, 1990; Healy and Palepu, 1990; Jain and Kini, 1994;
.Loughran and Ritter, 1997; Mikkelson et al., 1997 . Like our results for issuersfollowing CDOs, one explanation that is consistent with these findings is thatequity issue proceeds are not invested efficiently. These is little empirical evidence
Ž .that indicates whether common factor s are responsible for the poor long-runstock price and operating performance of issuers following convertible andnonconvertible security offers.1
Although there are some similarities in operating performance after convertibledebt and common equity issues, we document important differences. First, thedecline in profitability for CDO firms is related to industry conditions rather than
Ž .firm-specific factors. For equity issuers, Loughran and Ritter 1997 attribute poorperformance to firm-specific factors. Second, firms issue convertible debt when
Ž .large relative increases in capital expenditures are required Lewis et al., 1998 .Equity issuers demonstrate no significant investment behavior difference com-pared to nonissuing firms prior to an SEO. Finally, SEO firms have consistently
Ž .high levels of post-issue capital expenditures Loughran and Ritter, 1997 . ForCDO issuers, capital expenditures revert to median industry levels once theirfunding requirements are fulfilled.
1 Other explanations of the equity issue decision include asymmetric information between issuersŽ . Žand investors Myers and Majluf, 1984 , funding of unexpected earnings shortfalls Miller and Rock,
. Ž .1985 , managerial discretion problems Jung et al., 1996 and opportunistic market timing byŽ .management Loughran and Ritter, 1995, 1997 .

( )C.M. Lewis et al.rJournal of Corporate Finance 7 2001 447–474 449
Thus, unlike issuers of common equity, convertible debt issuers issue contin-gent equity when the investment patterns in an entire industry are changing.Convertible debt also funds the end of a cyclical increase in the level of a firm’scapital expenditures, rather than the beginning. Consequently, there are fundamen-tal differences in operating performance that affect the post-issue stock priceperformance of CDO and SEO firms.2
The fact that the poor post-issue stock price performance of firms followingCDOs occurs gradually over time suggests that investors do not fully anticipate thepoorer operating performance. Analysts are also surprised by poor operatingperformance following CDOs. They appear to be optimistic about industry-levelcash flows rather than issuer cash flows. Analysts adjust their long-run growthforecasts for issuers slowly, taking almost a full year post-issue before their overlyoptimistic growth forecasts dissipate. If analysts’ forecasts reflect investor expecta-tions, the poor post-issue stock price performance following convertible debtoffers may be partially explained by the finding that earnings and growth rateforecasts adjust only gradually to the information conveyed by security offers.
Our empirical findings support an alternative interpretation of convertible debtfinancing decisions; that rationing in the seasoned equity market forecloses someissuers from participation. When issuers are rationed out of the market issuers forsenior investment capital, convertible debt allows Awould-beB equity issuers toraise external capital. In effect, high costs of adverse selection and capital structureconsiderations force some firms to raise investment capital outside the seasonedequity market. Issuers are not necessarily choosing convertible debt to signalinformation, to eliminate risk-shifting problems or to reduce overinvestmentincentives. Instead, investors are using the contingent equity issue market to screenissuers.
While we do not rule out the possibility that supply-side motives play a role inthe convertible debt financing decision, we suggest that demand-side constraintsimposed on issuers may dominate in some cases. That is, convertible debt issuesare motivated by market constraints on issue choices, as well as other frictions liketaxes, agency costs and asymmetric information. To our knowledge, convertibledebt issuers never mention adverse selection, risk shifting or overinvestment as amotive for an issue. We believe these motives are important, but suggest thatdemand-side constraints may explain the ‘Street’ view that convertible debt isoften issued as a last resort, when the firm is unable to access the equity marketsdirectly. The fact that aggregate issue volume is high in the convertible debt andseasoned equity markets at similar times, and that aggregate issue activity appearsto depend on industry conditions, suggests that firm-specific characteristics areimportant to investors.
2 Ž .Lee and Loughran 1998 also examine long-run stock performance following CDOs and findresults similar to ours. They do not relate the stock price performance to post-issue operatingperformance, however.

( )C.M. Lewis et al.rJournal of Corporate Finance 7 2001 447–474450
The remainder of the paper is organized as follows. Section 2 describes thetestable hypotheses. Section 3 describes our data sources and sample selectionprocedure. Section 4 compares the pre- and post-issue operating performance offirms that issue convertible debt and a matched sample of nonissuers. Section 5investigates the relation between stock price performance and operating perfor-mance for issuer and comparison firms. Section 6 provides analyst earningsforecast errors and analyst forecasts of long-term earnings growth for issuing andcomparison firms. Section 7 discusses the implications of the empirical evidencefor theories of convertible debt financing. Section 8 summarizes and concludes thepaper.
2. Testable hypotheses
Capital market imperfections increase the cost of external finance. Informationcosts, risk-shifting problems and managerial discretion are important. The adverseconsequences of these imperfections include the sale of mispriced securities,overinvestment in high-risk projects and overinvestment in negative net present
Ž . Žvalue NPV projects. Theoretical explanations of the use of convertible debt see,.e.g., Green, 1984; Brennan and Schwartz, 1988; Stein, 1992; Mayers, 1998
illustrate how the combination of straight debt and contingent equity features builtinto a hybrid security can reduce the information and agency costs companies facewhen raising capital from external investors.
All these models argue that an appropriately designed CDO will help restoreinvestment incentives so that managers will make investment decisions that
Ž .maximize firm value. Lewis et al. 1998, 1999 examine the security designchoices of convertible issuers and provide evidence that the actual security designssupport the predictions of these models. The major limitation of these studies isthat they do not evaluate the actual performance of the new investments followingthe issue date.
The main hypothesis we test is whether convertible debt offerings lead toefficient investment decisions. If CDO firms use issue proceeds to fund value-en-hancing investments, we predict that they will experience improved operatingperformance. To evaluate this prediction, we examine several measures of operat-ing performance, classified according to their relation to the profitability ofassets-in-place or to the estimated present value of future growth opportunities.3
3 We consider the implications of CDOs on the profitability of current capital expenditures andfuture investment opportunities. Profitability measures include the operating income-to-assets ratio,profit margin, return on assets and operating income relative to sales. These measures provide evidenceon the efficient utilization of the firm’s assets-in-place. We also measure investment-related operating
Ž .performance by examining 1 capital expenditures and research and development expenses relative toŽ .total assets, and 2 the profitability of future growth opportunities based on the market-to-book ratio.
( )C.M. Lewis et al.rJournal of Corporate Finance 7 2001 447–474 451
The second hypothesis we examine is whether investors anticipate the changesin operating performance following a CDO. We predict that analysts will use theinformation incorporated in the security design choice with their knowledge of theinvestment opportunity set to make unbiased forecasts of future earnings andearnings growth rates. If these forecasts are unbiased, we also predict that long-runstock market returns following a convertible issue should exhibit no excessŽ .positive or negative performance.
3. Sample description and data sources
3.1. ConÕertible debt issuers
The sample for our analysis consists of all completed domestic convertible debtofferings between 1979 and 1990. The initial sample of convertible debt issuerswas obtained from the Investment Dealers’ Digest Domestic and International
Ž .New Issues database. Regulated utilities SICs481 and 491–494 and financialŽ .institutions and their holding companies SICs600–699 are excluded from the
final sample.We require issuing firms to meet several criteria. First, the sample is limited to
issuers whose daily common stock returns are included in the Center for ResearchŽ .in Security Prices CRSP daily returns file. Second, since the study uses account-
ing-based measures of operating performance, we require that issuing companydata appear on the Compustat Annual Research Tapes in the year of the convert-ible debt offering. Finally, some firms are multiple issuers of convertible debt.Because we examine operating performance over several years, we require theissuing firm to have had no other convertible debt offer in the 5 years prior to theissue date. This requirement is similar to the restrictions imposed by Healy and
Ž . Ž .Palepu 1990 and Loughran and Ritter 1997 in their studies of operatingperformance following SEOs. The final sample consists of 566 CDOs.
Summary information on the number of CDOs by issue year and issuer industryis provided in Table 1. Panel A indicates that convertible debt offerings varyconsiderably during the sample period. In 1985–1987, there is a high level of issueactivity, about 43% of the total number of offerings. In their examination of theoperating performance of firms conducting SEOs over a similar sample period,
Ž .Loughran and Ritter 1997 report that 1983 is the year of highest issue activity.This lag is consistent with the aggregate issue volume data reported in Choe et al.Ž .1993 . Cyclical peaks in the volume of CDOs occur subsequent to cyclical peaksin SEOs, which suggests some time variation in the extent of the externalfinancing costs that makes each of these sources an attractive funding choice.
Panel B of Table 1 provides two-digit SIC codes for the CDO sample. Issuersrepresent a broad cross-section of industries, indicating that convertible debt is a

( )C.M. Lewis et al.rJournal of Corporate Finance 7 2001 447–474452
Table 1Ž .Number of convertible debt offerings CDOs by year and industry
Panel A: number of CDOs by calendar year
Year Number of Percentage ofŽ .offerings sample %
1979 20 3.51980 60 10.61981 42 7.41982 35 6.21983 58 10.21984 35 6.21985 65 11.51986 105 18.61987 74 13.11988 19 3.41989 33 5.81990 20 3.5Total 566 100.0
Part B: number of CDOs by industrial classification
Industry SIC code Number of Proportion ofŽ .offerings firms %
Office and computer equipment 35 56 16.3Communication and electronic equipment 36 47 13.6Computer and data-processing services 73 35 10.4Oil and gas 13 33 17.2Engineering and scientific instruments 38 32 10.5Chemicals and pharmaceuticals 28 25 7.5Transportation equipment 37 24 21.6Wholesale trade-durable goods 50 21 14.8Transportation by air 45 20 46.5Wholesale trade-nondurable goods 51 18 24.3Eating and drinking places 58 17 22.7Health services 80 17 15.6Food and kindred products 20 13 10.7Miscellaneous retail 59 13 15.5Motion pictures 78 11 23.4General merchandise stores 53 10 21.7Fabricated metal products 34 10 10.5Electric, gas and sanitary services 49 10 3.8Other – 154 –Total 566
To be included in the sample, a CRSP-listed NASDAQ, Amex or NYSE firm must not have issued aŽconvertible during the 5 years prior to the issue date. The industries defined by CRSP two-digit SIC
. Ž .codes listed in Panel B have 10 or more CDOs. Regulated utilities SIC 481 and 491–494 andŽ .financial institutions and their holding companies SIC 600–699 are excluded.
( )C.M. Lewis et al.rJournal of Corporate Finance 7 2001 447–474 453
useful financing instrument in a variety of business conditions. The top sixŽ .industries in terms of the number of convertible debt offers are the same as for
Ž .the equity offers reported in Loughran and Ritter 1997 , indicating that somesimilarity in the business and financial conditions that influence the issue ofcommon equity or convertible debt.
We also report the proportion of firms making CDOs compared to the numberof firms in each two-digit SIC code. In industries with at least 10 offerings overthe sample period, an average of 17.0% of the firms have made a CDO. For theseindustries, convertible debt is an important source of investment capital.
3.2. Matched sample
We examine operating performance following convertible debt issues both inabsolute terms for the issuer and adjusted for industry performance. Industry-ad-justed results allow us to compare issuers with nonissuers matched on industryaffiliation, firm size and issue year operating performance. This approach allowsus to detect changes in operating performance that are unrelated to simple meanreversion.
To identify the matched sample, we follow the procedure recommended byŽ . Ž .Barber and Lyon 1996 that Loughran and Ritter 1997 in their study of the
operating performance of firms that issue seasoned equity. Specifically, we matcheach issuing firm with a comparison firm that has not issued convertible debtduring the prior 5 years according to an algorithm as follows.
Ž .1 If there is at least one nonissuer in the same two-digit industry withend-of-year assets within 25–200% of the issuing firm, we choose the nonissuerwith the closest OIBDrassets ratio to that of the issuer as the matching firm.
Ž .2 If no nonissuer meets this criterion, then all nonissuers with Year 0 assets of90–110% of the issuer are ranked and the firm with the closest, but higher,OIBDrassets ratio is selected as the matching firm.
This procedure is designed to select a comparison firm on the basis of similarindustry affiliation, asset size and normalized operating income. Comparison firmsmust also appear on Compustat and can be listed on the NYSE, the AMEX orNasdaq.
4. Operating performance changes before and after new issues of convertibledebt
4.1. Summary operating performance results for issuers and matched nonissuers
Table 2 provides absolute and comparative operating performance measures forthe CDO and matched samples. We report median values for the four cash flowvariables and two investment-related variables used to measure operating perfor-

()
C.M
.Lew
iset
al.rJournalof
Corporate
Finance
72001
447–
474454
Table 2Median OIBDrassets, profit margin, ROA, OIBDrsales, capital expendituresqR&Drassets and market-to-book ratios for issuers and industry-matched
Ž .nonissuers 1979–1990
Panel A: CDO median values
Fiscal year relative OIBDrassets Profit margin ROA OIBDrsales CEqRDr Marketr Number ofŽ . Ž . Ž . Ž . Ž .to offering % % % % assets % book firms
y4 8.8 4.0 5.7 6.2 11.3 1.37 266y3 9.1 4.4 6.0 6.7 12.1 1.60 329y2 8.8 4.6 5.9 7.0 13.1 1.70 388y1 8.8 4.6 5.7 6.8 13.0 1.93 453
0 8.1 4.5 4.8 7.3 11.4 2.20 5241 7.7 3.5 4.1 6.7 12.0 1.82 5142 6.8 2.9 3.4 6.0 11.0 1.72 7823 7.0 3.0 3.5 6.1 10.7 1.60 4404 6.4 2.3 3.0 5.5 10.6 1.45 401
Panel B: nonissuers with the same CDO industry composition
Fiscal year relative OIBDrassets Profit margin ROA OIBD sales CEqRDr Marketr Number ofŽ . Ž . Ž . Ž . Ž .to offering % % % % assets % book firms
y4 8.7 4.0 6.2 6.0 11.5 1.17 266y3 8.5 4.3 6.1 6.2 11.5 1.29 329y2 8.5 4.0 5.5 6.3 10.7 1.32 388y1 8.3 3.9 5.3 6.2 11.3 1.52 453
0 8.0 3.9 5.2 6.1 10.8 1.51 5241 7.7 3.9 4.6 6.9 10.6 1.45 5142 7.3 3.1 4.3 5.4 10.7 1.48 4823 7.1 3.0 4.2 5.3 9.9 1.45 4404 6.7 2.8 3.2 5.1 10.6 1.50 401

()
C.M
.Lew
iset
al.rJournalof
Corporate
Finance
72001
447–
474455
Panel C: Z-statistics testing the yearly equality of distribution between the CDOs and their matching firms using the Wilcoxon matched-pairs signed-rank test
Fiscal year relative OIBDrassets Profit margin ROA OIBDrsales CEqRDrassets MarketrŽ . Ž . Ž . Ž . Ž .to offering % % % % % book
y4 0.46 1.32 y0.15 1.46 0.71 1.99y3 1.58 1.25 y0.01 2.48 1.21 3.12y2 1.28 1.72 0.88 1.83 3.73 5.10y1 1.34 2.23 0.70 2.87 2.94 6.27
0 0.27 2.64 y2.00 4.30 1.43 8.731 y0.93 y1.34 y3.47 1.02 2.78 4.672 y1.82 y1.93 y3.68 0.26 1.39 3.073 y1.03 y1.53 y2.70 y0.20 y0.02 2.524 y1.09 y1.33 y1.78 0.57 y0.18 0.57
Panel D: Z-statistics testing, the equality of distributions between the change in the ratios between Years 0 and q4 using the Wilcoxon matched-pairsigned-rank test
Fiscal year relative OIBDrassets Profit margin ROA OIBDrsales CEqRD assets MarketrŽ . Ž . Ž . Ž . Ž .to offering % % % % % book
Years 0–4 y1.02 y1.61 y1.36 y0.95 y2.22 y5.78
Panel A reports median ratios for the 566 issuing firms, all of which are present on Compustat for their issuing year. Matching firms are chosen by matchingŽ .each issuing firm with a firm that has not issued a convertible bond during the prior 5 years using the algorithm. i If there is at least one nonissuer in the
Ž .same two-digit industry with end-of-year 0 assets within 25–200% of the issuing firm, the nonissuer with the closest OIBDrassets is used. ii If no nonissuermeets this criterion, then all nonissuers with Year 0 assets of 90–110% of the issuer are ranked, and the firm with the closest, but higher, OIBDrassets is used.Panel B reports the median ratios for nonissuers. If a nonissuer is delisted from Compustat while the issuer is still trading, a replacement nonissuing firm is
wspliced in on a point-forward basis. The Compustat data items for the variables are operating income before depreciationrassets OIBDqinterest incomeŽ . Ž .x w Ž . Ž .x witems a13qa62 rassets item a6 ; profit margin net income including extraordinary items item a172 rsales item a12 ; return on assets net incomeŽ . Ž .x w Ž . Ž .x w Žitem a172 rassets item a6 ; OIBDrsales OIBDqinterest income items a13qa62 rsales item a12 ; CEqRDrassets capital expenditures item
. Ž . Ž .x w Ž . Ž .a128 qresearch and development expense item a46 rassets item a6 ; and market valuerbook value shares item a54 times price item a199 rbookŽ .xvalue of equity item a60 . The significance tests are based on the Wilcoxon signed-rank test, which assumes that the observations are independent.

( )C.M. Lewis et al.rJournal of Corporate Finance 7 2001 447–474456
mance. Results are reported for Years y4 through q4, where Year 0 is the fiscalyear of the convertible offer.
Panel A presents median operating performance measures for issuing firms. WeŽ .report the same performance measures as those in Loughran and Ritter 1997 for
seasoned equity issuers to facilitate comparisons between CDO and SEO firms.The evidence in Panel A suggests that the absolute operating performance of CDOfirms generally worsens after the issue.
For the median issuer, operating income relative to assets decreases to 6.4% 4years after the offering from 8.1% in the year of the offering. Median issuer profitmargins also decline. In the year of the issue, the median issuer’s profit margin is4.5%. It is 2.3% 4 years later. This decline in profit margin appears to beattributable at least partially to a parallel reduction in the issuer’s return on assets.Return on assets declines from 4.8% in the offer year to 3.0% 4 years later.
One drawback of these AprofitabilityB measures is that they are affected bychanges in the level of assets-in-place and interest expense. That is, changes ininvestment levels and capital structure policy impact these performance measures,which potentially confounds inferences. The same cannot be said for operatingincome per dollar of sales. Operating income per dollar of sales, however, declinesfrom 7.3% in the offer year to 5.5% 4 years later. Overall, then, all the measuresof current profitability deteriorate for issuers following CDOs.
Investment rates per dollar of assets, a longer-term measure of future profitabil-ity, also decline in the period following convertible debt offers. Capital expendi-tures and R&D expenses decrease from 11.4 cents per dollar of assets in the issueyear to 10.6 cents per dollar in the fourth year following the offer. Unlike SEOfirms, whose reinvestment rates peak in the year after the offer, reinvestment ratesfor CDO firms peak 2 years prior to issuance. Thus, CDOs typically occurfollowing the period of highest investment activity. This suggests that the timingof capital expenditure programs may influence security choice decisions.
Similarly, the median convertible issuer’s market-to-book ratio peaks in theyear of the CDO. Thereafter, it declines significantly, from 2.20 in the offer yearto 1.45 in the fourth year after the offer. This suggests that the marginalprofitability of the issuer’s future investment opportunities declines substantiallyafter the issue of convertible debt. Note, however, that market-to-book is stillsignificantly higher than 1.0, indicating the continued presence of profitablegrowth opportunities. Consequently, it is somewhat surprising that reinvestmentrates decline during this time period.
While these absolute measures indicate poorer issuer operating performancefollowing convertible debt offers, a more reliable assessment depends on relativeoperating performance. We present the median operating performance results forthe comparison firms in Panel B of Table 2.
The issue year OIBDrassets ratios are essentially identical for issuers andŽ .nonissuers 8.1% vs. 8.0% because the matching procedure is designed to select
comparison firms on the basis of this operating performance measure. Comparison

( )C.M. Lewis et al.rJournal of Corporate Finance 7 2001 447–474 457
firms’ OIBDrassets, profit margin, return on assets and OIBDrsales all declineduring the 4 years subsequent to the offer year, much like the results reported inPanel A for the issuer firms. This suggests that the poor post-issue operatingperformance of CDO firms is attributable at least partially to an industry effect.
Comparison firm investment expenditures per dollar of assets and market-to-book ratios are relatively stable in the 4 years after the offering. Thus, the exerciseand profitability of future growth opportunities remains relatively constant forcomparison firms.
One interpretation of these results is that convertible debt is issued prior to aŽdownturn in an industry’s overall level of profitability i.e., prior to the decline in
.the value of the assets-in-place . Industry growth opportunities and capital rein-vestment rates remain relatively constant during the 4-year post-issue time period,but CDO firms experience a decline in these measures of long-run profitability tomedian industry levels.
Panel C of Table 2 reports the results of formal statistical tests of theperformance differences between the two groups. We compute Z-statistics using aWilcoxon matched-pair signed-rank test to examine the hypothesis that the annualdistribution of issuer and nonissuer operating performance measures is identical. A
Ž .positive negative Z-statistic indicates that the operating performance measure forŽ .the issuer is higher than lower than the same measure in the same year for the
comparison firm. These results confirm the results in Panels A and B.Panel D provides further evidence regarding the relative post-issue operating
performance of CDO firms. We report Z-statistics using a Wilcoxon matched-pairsigned-rank test to examine the hypothesis that the median change in operatingperformance level ratios between the pre- and post-issue period for issuers and
Ž .comparison firms is identical. A negative positive Z-statistic indicates the changeŽ .in operating performance is worse better for issuers than for comparison firms.
Operating performance measures worsen more for issuers than for comparisonfirms, although the changes beyond the third year after issue are not statisticallydifferent for the profitability-based measures. Issuers and comparison firms differin their investment-related measures of growth and the profitability of incrementalinvestment opportunities. In particular, normalized reinvestment rates and themarket-to-book ratio decline much more significantly for CDO firms than forcomparison firms.
Overall, the results in Table 2 suggest that post-issue operating performance ofCDO firms is influenced by two factors—industry conditions that influence the
Žprofitability of assets-in-place OIBDrassets, profit margin, return on assets,. ŽOIBDrsales and issuer-specific effects that influence reinvestment rates capital
.expenditures and R&D expenserassets and the marginal profitability of futureŽ .growth opportunities market-to-book ratio .
As other researchers have documented for SEO firms, we find substantivelyimproved operating performance of issuers prior to a CDO and significantdeterioration following the offer. Post-issue profitability is, however, a key

( )C.M. Lewis et al.rJournal of Corporate Finance 7 2001 447–474458
distinction between SEOs and CDOs. These results are consistent with theinterpretation that equity and equity-linked securities are issued prior to significantdeterioration in investment-related operating performance, and that a seasonedequity offer may be chosen over an equity-linked security when issuer-specificprofitability is expected to weaken as well. In addition, because both measures ofoperating income for CDO firms are substantially below the levels for SEO firms
Ž .reported in Loughran and Ritter 1997 , internally available sources of cash flowfor reinvestment may be lower for CDO firms than for SEO firms. Although theAdelayed equityB characterization suggests that convertible debt is often issuedprior to an optimal period for an SEO, our results overall suggest that convertibledebt is actually issued once the optimal period for an SEO has already passed.
4.2. Concurrent issue actiÕity
Although our results indicate differences between the performance of CDO andSEO firms, this might happen because of a flawed selection of comparison firms.Our sample may consist of firms in high-valuation industries in which some firmsend up issuing convertible debt and others offer common equity. In this case, theselection procedure for choosing comparison firms might simply reflect SEO
wdecisions note that the same could be so in the sample of SEOs used by LoughranŽ .xand Ritter 1997 .
To be sure that there is an independent effect for CDO firms, we examinewhether the poor operating performance we document is limited to firms that alsoconducted SEOs near the time of the CDO. We repeat the analysis four ways.First, we require that the comparison firms have no SEO or IPO in the 5 yearsprior to the CDO. Second, we require that the issuer have no SEO or IPO in the 5years prior to the CDO. Third, we require that the comparison firm have no SEOin the 5 years after the CDO. Fourth, we require that the issuer have no SEO in the5 years after the CDO.
Our main results are qualitatively unchanged when any of these four additionalsample restrictions is imposed. Therefore, our results appear to be driven byoperating performance differences between CDO firms and comparison firmsrather than by the security choice decisions of the CDO firms and the comparisonfirms during the period surrounding the decision to issue convertible debt.4
4.3. The relation between issuer size and operating performance
Ž .Spiess and Affleck-Graves 1999 document that the smallest CDO firmsexperience the poorest post-issue stock price performance. Might our results bedue to extremely poor performance by small firms that conduct CDOs? To
4 The results of this analysis are available from the authors upon request.
( )C.M. Lewis et al.rJournal of Corporate Finance 7 2001 447–474 459
examine this, we sort issuer and comparison firms into quartiles on the basis ofasset size. While there is some evidence that the differences in yearly distributionsare due to a size effect, in general, operating performance is worse for the medianissuer than the median comparison firm during the years after the offer. Regardlessof issuer size, the relative long-run performance of firms following a CDO ispoor.5
5. Operating performance changes and stock returns
Although the operating performance of firms issuing convertible debt deterio-rates on both an absolute and a relative basis subsequent to the issue date, it mightbe that this performance is anticipated by investors and may already be factoredinto the issuer’s stock price. We address this issue by examining the long-runstock performance of CDO firms.
To compare our results for CDOs with the post-issue performance of SEOfirms, we initially measure stock returns exactly the same way as Loughran and
Ž .Ritter 1997 . Average annual returns are calculated as an equally weightedaverage of event year returns for each firm. If a firm is delisted during themeasurement time interval, the annual return for that year is computed by splicingin the CRSP value-weighted index returns for the remainder of the year. Stockreturns are calculated in event time, so the measurement period now does notcorrespond exactly to the fiscal year operating performance measurement period.
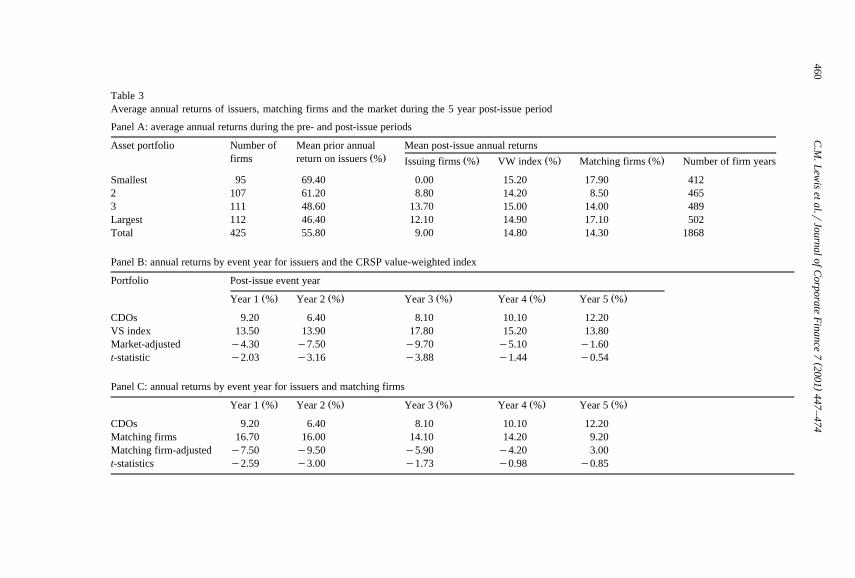
Annual stock price returns for issuers and matching firms are provided in Table3. Panel A provides average annual returns for issuers sorted by size quartile. Inthe year prior to the offer date, issuers experience extremely large positive rawreturns, ranging from 46.4% for the largest convertible issuers to 69.4% for thesmallest issuers. This suggests that, like SEO firms, convertible debt issues followlarge stock price run-ups.6
In the 5 years following the offer date, CDO issuers do not perform well. Theaverage return for all issuers is 9.0% per year during the 5 years after issue. This
Ž .return lags both the CRSP value-weighted index 14.8% and the comparison firmsŽ .14.3% . Issuing firms underperform these benchmarks by 580 and 530 basispoints, respectively, on a per year basis.7
Do CDO firms underperform in each year, or are there certain post-issueperiods when relative stock price performance is exceptionally poor? Panel B
5 The results of this analysis are available from the authors upon request.6 ŽA greater pre-issue run-up for the smallest firms also occurs for issuers of seasoned equity see
.Loughran and Ritter, 1997 .7 Ž .Loughran and Ritter 1997 report that the average annual return of SEO issuers is also 9.0%
during the 5 years after issuance.
()
C.M
.Lew
iset
al.rJournalof
Corporate
Finance
72001
447–
474460
Table 3Average annual returns of issuers, matching firms and the market during the 5 year post-issue period
Panel A: average annual returns during the pre- and post-issue periods
Asset portfolio Number of Mean prior annual Mean post-issue annual returnsŽ .firms return on issuers % Ž . Ž . Ž .Issuing firms % VW index % Matching firms % Number of firm years
Smallest 95 69.40 0.00 15.20 17.90 4122 107 61.20 8.80 14.20 8.50 4653 111 48.60 13.70 15.00 14.00 489Largest 112 46.40 12.10 14.90 17.10 502Total 425 55.80 9.00 14.80 14.30 1868
Panel B: annual returns by event year for issuers and the CRSP value-weighted index
Portfolio Post-issue event year
Ž . Ž . Ž . Ž . Ž .Year 1 % Year 2 % Year 3 % Year 4 % Year 5 %
CDOs 9.20 6.40 8.10 10.10 12.20VS index 13.50 13.90 17.80 15.20 13.80Market-adjusted y4.30 y7.50 y9.70 y5.10 y1.60t-statistic y2.03 y3.16 y3.88 y1.44 y0.54
Panel C: annual returns by event year for issuers and matching firms
Ž . Ž . Ž . Ž . Ž .Year 1 % Year 2 % Year 3 % Year 4 % Year 5 %
CDOs 9.20 6.40 8.10 10.10 12.20Matching firms 16.70 16.00 14.10 14.20 9.20Matching firm-adjusted y7.50 y9.50 y5.90 y4.20 3.00t-statistics y2.59 y3.00 y1.73 y0.98 y0.85

( )C.M. Lewis et al.rJournal of Corporate Finance 7 2001 447–474 461
compares average year-by-year returns for issuer firms and the CRSP value-weighted index. The evidence indicates that issuer firms significantly underper-form the broad market in each of the first 3 years following the convertible debtoffer date. Inferences about stock price performance in Years 4 and 5 depend on
Ž . Žwhether t-statistics no performance difference or Z-values issuers significantly.underperform are used to measure statistical significance.
The results are essentially the same when we look at annual returns for theŽ .comparison firms Panel C . Issuers underperform the comparison firms in each of
the first 3 years following issue, although the performance difference in the thirdyear is only marginally significant. Thus, it appears that investors do not fullyanticipate the adverse performance of issuers following a CDO.
Stock price performance for CDO firms differs from the return performanceŽ .following an SEO, as reported by Loughran and Ritter 1997 . They document that
seasoned equity issuer underperformance begins in Year q2 and continuesthrough Year q5. They interpret this as evidence that the poor operatingperformance following SEOs is unanticipated. Post-issue stock market perfor-mance by CDO firms differs, in that significant poor performance occurs onlyduring the initial 3 years. Investors react more quickly to the issuance ofconvertible debt, but the persistent underperformance indicates that, similar toSEOs, the deteriorating operating performance was not fully anticipated.
Ž .Fama 1998 argues that long-run return inferences are sensitive to the waylong-run returns are measured. Skewness and possible correlations of returnsacross events may significantly bias the statistical results. Fama recommends thatalternative measures of long-run abnormal performance be estimated in order toensure that return performance measurement is not sensitive to model specifica-tion.
Note to Table 3:In Panel A, the average annual returns are calculated for the 566 companies conducting CDOs in
Ž .1979–1990 meeting the criteria used in this paper. Matching nonissuer firms are chosen on the basisŽof industry, size and OIBDrassets using an algorithm described in Table 2. Return periods 1 and 5
.years are measured from the issue date, rather than using fiscal year. The average CRSP value-weightedNYSE–Amex–Nasdaq market return during the prior year is 23.8%. Index returns are calculated bycompounding the daily CRSP value-weighted NYSE–Amex–Nasdaq index over the same trading days.In Panel A, the number of firm years is calculated by summing, over the number of firms in a portfolio,the number of post-issue event years for which the firm is listed on the CRSP tapes for at least part of ayear. For the majority of firms, this is 5 years. For a firm that is delisted early, it may be less than 5years. Firms in the small quartile have post-issue assets of US$2.6–112.2 million; those in quartile 2have assets of US$113.3–277.2 million; those in quartile 3 have assets of US$278.4–706.6 million;and those in the largest quartile have assets of US$709.1 million to US$42.7 billion. Asset values at theend of the fiscal year of issuing are expressed in terms of 1994 purchasing power. In Panels B and C,average annual returns are computed for the five post-issue event years. Each year, the CRSPvalue-weighted index of NYSE–Amex–Nasdaq stocks is spliced in for the remainder of the year.t-statistics are calculated assuming independence and normality.
( )C.M. Lewis et al.rJournal of Corporate Finance 7 2001 447–474462
To investigate the sensitivity of our results to these statistical problems, weŽ .follow Fama 1998 and measure stock underperformance of convertible debt
issuers using the average monthly returns procedure. For each calendar month, wecalculate the abnormal return for each CDO firm as the difference between thereturn of the issuing firm and the return of a matched nonissuing firm. Comparisonfirms are again chosen on the basis of industry, size and OIBDrassets. Equal- andvalue-weighted portfolio abnormal returns are formed each calendar month.
Ž . Ž .Following Jaffe 1974 and Mandelker 1974 , we allow for changes in the riskof each abnormal return portfolio and the heteroscedasticity of returns due tochanges in portfolio composition. Specifically, we divide the abnormal portfolioreturn each month by an estimate of its standard deviation to produce a time seriesof monthly standardized portfolio abnormal returns. The overall abnormal return isthen estimated by averaging the standardized monthly abnormal returns.
The results again show that CDO firms significantly underperform the compari-son firms during the sample period. The overall abnormal portfolio return is a
Ž .significantly negative 52 basis points per month tsy4.06, p-0.0001 forequally weighted portfolio abnormal returns and a significantly negative 34 basis
Ž .points per month tsy2.67, p-0.01 for the value-weighted portfolio abnormalreturns.8
Overall, then, our long-run return results do not appear to change. Investorsanticipate that the future operating performance of CDO firms will be good, buttheir expectations are not met. This suggests that the adverse changes in operatingperformance that we document are not fully expected. In this case, we anticipatethat stock price performance will change as investors revise their expectationsabout future operating performance.
6. Analysts’ forecasts and issuer performance
More direct information on expectations of post-issue operating performancecan be obtained by examining changes in analyst forecasts following CDOs. Ifcurrent stock prices naively incorporate analysts’ forecasts of long-term earnings
8 Our conclusions regarding long-run stock price underperformance by CDO firms are robust acrossmethods used to calculate abnormal returns. If size and book-to-market matched nonissuing firms are
Žused, the overall abnormal return is a significantly negative 62 basis points per month tsy4.82,.p-0.0001 for equally weighted portfolio abnormal returns and a significantly negative 32 basis pointsŽ .per month tsy2.50, p-0.015 for the value-weighted portfolio abnormal returns. If an intercept
Ž .test based on the Fama and French 1993 three-factor model is used, the overall abnormal return is aŽ .significantly negative 31 40 basis points per month with equally weighted portfolio abnormal returns
Ž .using ordinary least squares weighted least squares ; value-weighted portfolio abnormal returns arenegative but not significantly different from zero. Detailed results of these analyses are available fromthe authors upon request.

( )C.M. Lewis et al.rJournal of Corporate Finance 7 2001 447–474 463
Ž . Ž .growth, as suggested by LaPorta 1996 and Dechow and Sloan 1997 , securityoffer issue decisions may reflect management’s attempt to reduce the cost ofraising new investment capital by issuing securities when analysts are overlyoptimistic. We examine whether analyst forecasts of earnings and of long-term
Ž .earnings growth rates can help explain: 1 convertible debt security offer deci-Ž . Ž .sions, 2 investor reactions to those decisions, and 3 the post-issue operating and
stock price performance of convertible debt issuers.A similar line of inquiry has been followed for firms conducting initial public
Ž . Žofferings Rajan and Servaes, 1997 and seasoned equity offerings Healy and.Palepu, 1990 . To the extent that forecasts by analysts are correlated with investor
expectations, our analysis sheds light on whether investors anticipate poor operat-ing performance.
We report two measures of analyst activity: analyst earnings forecasts andestimates of long-term earnings growth. Information on analyst forecasts is
Ž .obtained from the International Brokers Estimate System IBES database. Morethan two-thirds of the firms in our sample of 566 convertible debt offers areincluded in the IBES database for at least part of the period around the offer date.
6.1. EÕidence on analyst earnings forecast errors for issuers and matching firms
Evidence on analyst optimism may provide evidence on whether security offersŽinfluence analyst forecasts e.g., do analysts revise their earnings forecasts around
.the issue announcement? . We first examine the accuracy of short-term earningsforecasts in the 2 years before and after a convertible debt offer. Our measure of
Ž .forecast error equals actual earningsyearnings forecast divided by stock price atthe time of the earnings forecast. This is the same measure of standardized
Ž .earnings forecast accuracy used by Rajan and Servaes 1997 .To assess how forecast accuracy changes over time, we report errors for several
different forecast horizons.9 We also report forecast errors for several differenttime periods surrounding the CDO offer date.
Finally, we report industry-adjusted forecast errors to control for size, offeryear operating performance and industry effects. Industry-adjusted forecast errorsare computed by subtracting the forecast error for the comparison firm from theissuing firm’s forecast error.
Table 4 provides the earnings forecast errors for issuers and the comparisonfirms. Panels A and B report trends in forecast errors prior to the offer date. Forissuing firms, raw forecast errors are negative and significant for all forecasthorizons, which indicates that analysts are overly optimistic about CDO issuers’
Žnear-term earnings performance for up to 2 years prior to issue. Forecast errors as
9 The forecast horizon is defined as the number of months between the time the forecast is made andthe fiscal year-end for which the forecast is made. Thus, longer windows correspond to a longer periodof time between the time of the forecast and the date of the actual earnings report.

( )C.M. Lewis et al.rJournal of Corporate Finance 7 2001 447–474464
Table 4Ž .Analyst earnings forecast errors for convertible debt offerings CDOs
Window Forecast error Number Matched firm-adjusted NumberŽ .months forecast error
Panel A: forecasts made between 1 and 2 years before the CDOŽ . Ž .3 y0.0459 y2.00 283 y0.0113 y0.64 182Ž . Ž .6 y0.0309 y2.67 285 0.0063 0.74 171Ž . Ž .9 y0.0295 y3.82 284 0.0101 1.21 178Ž . Ž .12 y0.0200 y2.20 275 0.0285 1.33 174Ž . Ž .15 y0.0316 y5.20 272 0.0240 1.09 161Ž . Ž .18 y0.0334 y2.30 242 0.0032 0.27 123Ž . Ž .21 y0.0438 y7.73 189 0.0072 0.42 85
Panel B: forecasts made within 1 year before the CDOŽ . Ž .3 y0.0114 y2.06 330 0.0054 0.51 221Ž . Ž .6 y0.0236 y4.49 337 0.0061 0.47 220Ž . Ž .9 y0.0181 y2.47 344 0.0178 1.20 221Ž . Ž .12 y0.0442 y6.57 332 0.0055 0.51 209Ž . Ž .15 y0.0449 y6.20 314 0.0012 0.17 190Ž . Ž .18 y0.0493 y6.36 284 y0.0053 y0.54 162Ž . Ž .21 y0.0467 y4.03 216 0.0119 0.93 95
Panel C: forecasts made within 1 year after the CDOŽ . Ž .3 y0.0356 y1.92 380 y0.0258 y0.95 258Ž . Ž .6 y0.0298 y3.86 367 y0.0103 y0.92 250Ž . Ž .9 y0.0346 y4.59 369 y0.0010 y0.07 244Ž . Ž .12 y0.0359 y7.76 361 0.0191 1.50 233Ž . Ž .15 y0.0417 y8.96 351 0.0051 0.46 206Ž . Ž .18 y0.0492 y9.07 315 0.0065 0.59 155Ž . Ž .21 y0.0498 y8.83 252 0.0025 0.21 117
Panel D: forecasts made between 1 and 2 years after the CDOŽ . Ž .3 y0.0177 y2.68 373 0.0092 0.63 269Ž . Ž .6 y0.0318 y4.45 364 0.0162 0.69 242Ž . Ž .9 y0.0475 y5.80 358 y0.0010 y0.05 239Ž . Ž .12 y0.0759 y6.51 353 y0.0009 y0.03 223Ž . Ž .15 y0.0787 y8.66 344 y0.0179 y1.30 202Ž . Ž .18 y0.0752 y9.07 314 y0.0191 y1.36 169Ž . Ž .21 y0.0884 y6.73 260 0.0509 0.69 117
The sample consists of all forecasts made by analysts for earnings in the 2-year period before and the2-year period following the CDO. Only forecasts made for firms listed on Institutional Brokers
Ž . ŽEstimate Systems IBES are included. The forecast error is computed as actual earningsyearnings.forecast rstock price at the time of the earnings forecast. We report forecast errors for forecast
windows of 3–21 months in 3-month intervals. Window is the number of months between the time theforecast is made and the fiscal year end for which the forecast is made. Matched firm-adjusted forecasterrors are computed by subtracting the forecast error of the matched firm from the forecast error of the
Ž .issuing firm. Matching nonissuer firms are chosen on the basis of industry, size and OIBDrassetsusing an algorithm described in Table 2. The number of observations in the matched firm-adjustedsample is smaller because no matched firms can be found for certain forecast windows. t-statistics aregiven in parentheses.

( )C.M. Lewis et al.rJournal of Corporate Finance 7 2001 447–474 465
.a percentage of the issuer’s stock price range from y2.0% to y4.6% 2 yearsbefore issue and from y1.1% to y4.9% 1 year prior before issue.
Overestimated short-term earnings may be the result of either a desire to inflateissuer stock prices in the security offer or analysts’ inability to forecast issuerperformance accurately. One way to distinguish between these two cases is toexamine forecast accuracy in the periods immediately prior to and more distantfrom the issue date.
ŽIf analysts try to influence investor short-term expectations and, therefore, firm.valuations , incentives to overestimate would become greater as the issue date
approaches. This implies that industry-adjusted forecast errors are expected toremain significantly negative, which indicates that analyst overreaction is issuer-specific.
The matched-firm data indicates that analysts are also optimistic about theearnings prospects of the comparison firms during the pre-offer period—theindustry-matched adjusted forecast errors are insignificantly different from zero.This suggests that analyst expectations are due to an industry effect andror thatanalysts are generally optimistic. Note also that this behavior is persistent, becauseanalysts overestimate earnings throughout the pre-issue period. The insignificantmatched firm-adjusted forecast error is inconsistent with the hypothesis thatanalysts intentionally misestimate earnings to inflate stock prices.
Panels C and D show forecast errors for the 1 and 2 years following theconvertible debt offer. These results provide evidence on the evolution of analysts’opinions about earnings. Two important trends are evident in these time periods.First, analyst forecast accuracy does not improve in the period following thesecurity offer. In fact, forecast accuracy appears to worsen in the second year afterissue, especially for forecasts in the 12–21-month horizons. The exaggeratedissuer forecasts suggest that analysts do not anticipate the relatively poor post-is-sue operating performance of convertible debt issuers.
Interestingly, the industry-adjusted forecast errors continue to be insignificantlydifferent from zero for all forecast windows in both the first and second yearsfollowing the offer. This suggests that analysts continue to have high expectationsabout the issuer’s industry as a whole in the period subsequent to a convertibledebt offer. An explanation for the persistent forecast errors is, thus, likely to besystematic optimism rather than selection bias or agency relationships betweenissuers and their investment banks.
If firms that issue convertible debt are overvalued at the offer date, why do theynot issue equity instead of an equity-linked security to more fully take advantageof this pricing error? A comparison of our operating performance results with the
Ž .post-issue operating results of SEOs reported in Loughran and Ritter 1997 isinformative. They find that the post-issue cash flow operating performance ofequity issuers is significantly poorer, even after adjusting for the performance ofmatching firms. Although the absolute level of post-issue short-term operatingperformance also is worse for our convertible debt issuers, their performance is

( )C.M. Lewis et al.rJournal of Corporate Finance 7 2001 447–474466
insignificantly different from that of the matching firms. Therefore, issuers maychoose convertible debt over common equity when they anticipate better relativecash flow operating performance.
Given that financial distress is costly, firms expecting poorer short-termoperating performance would be disinclined to choose a debt-related financialobligation. Debt service requirements compete with investment uses of the firm’sinternal cash flow. What is still unclear from this analysis is why analysts remainoverly optimistic about CDO issuers and their industry in the 2-year periodfollowing the convertible debt offer.
6.2. EÕidence on analyst forecasts of long-term earnings growth for issuers andmatching firms
An examination of analyst forecasts of long-term earnings growth rates for a5-year time horizon should shed light on whether differences between issuers andcomparison firms are anticipated at the issue date.
In Table 5, we provide long-term growth forecast comparisons. The growthestimates are presented at 3-month intervals for the 3 years before and after the
Ž .CDO i.e., updated forecasts are reported at 3-month intervals . The industry-ad-justed long-term growth forecasts are calculated as the percentage point differencebetween the long-term growth forecast of the issuing firm and the comparisonfirm. A positive industry-adjusted long-term growth forecast indicates the CDOissuer is expected to grow at a faster rate than the matched firm.
Pre-issue long-term earnings growth rate projections are presented in Panel A.Ž .Issuers’ earnings are expected to grow at a relatively high rate 19–20% per year ,
and the growth rate forecasts exhibit relatively little variation prior to issue. On anindustry-adjusted basis, issuers’ long-term growth forecasts are similar to those ofthe comparison firms. Significant differences appear approximately 9 monthsbefore the security offering. In the period immediately before the issue offer,issuer long-term growth rates are significantly higher than those of the comparisonfirms. Positive revisions in the forecasts of the issuers’ long-term growth rates mayexplain the high pre-issue stock returns of CDO firms.
Panel B of Table 5 indicates that post-issue long-term growth rates also areforecast to be high for issuers for up to 9 months after the convertible debt offerŽ .approximately 20% per year . After this period, growth rate forecasts are consid-erably lower. By the end of the third year, issuer growth rate forecasts drop to17%. Immediately after the issue, CDO firms are expected to grow at a signifi-
Ž .cantly faster rate of about 3.00 percentage points per year than the comparisonfirms. By the end of the first year, however, long-term growth rates of issuers arevirtually the same as the industry average.
For issuing firms, analysts do not anticipate subsequent declines in investmentor investment profitability. Initially, they continue to forecast superior long-term

( )C.M. Lewis et al.rJournal of Corporate Finance 7 2001 447–474 467
Table 5Ž .Forecasts of long-term earnings growth for convertible debt offerings CDOs
Panel A: pre-issue forecasts of long-term earnings growth
Time Long-term growth Number Industry-adjusted long-term NumberŽ . Ž .months forecast % growth forecast
Ž .y36 19.52 119 3.66 2.64 65Ž .y33 19.14 132 y0.85 y0.35 76Ž .y30 19.48 138 1.88 1.29 83Ž .y27 19.27 145 0.79 0.47 82Ž .y24 19.36 154 1.12 0.74 89Ž .y21 19.32 163 1.77 1.45 93Ž .y18 19.02 168 0.35 0.25 100Ž .y15 20.34 180 4.06 1.63 109Ž .y12 19.54 209 1.47 1.48 116Ž .y9 19.60 224 1.65 1.81 132Ž .y6 19.68 245 1.96 2.08 145Ž .y3 19.59 256 2.05 2.42 150
Panel B: post-issue forecasts of long-term earnings growth
Time Long-B25 term growth Number Industry-adjusted long-term NumberŽ . Ž . Ž .months forecast % growth forecast %
Ž .3 20.36 278 2.93 3.35 158Ž .6 20.14 290 3.15 3.95 166Ž .9 19.37 306 2.17 3.05 186Ž .12 18.80 315 1.09 1.38 198Ž .15 18.51 328 0.88 1.14 204Ž .18 18.23 337 0.75 1.26 212Ž .21 18.26 341 1.44 2.44 213Ž .24 18.35 342 1.29 2.07 201Ž .27 17.83 339 1.26 1.95 195Ž .30 17.34 330 0.61 0.90 187Ž .33 17.39 329 0.91 1.39 184Ž .36 17.02 322 0.79 1.23 188
Ž .Time refers to the time period after the CDO that the forecast is made. Matching nonissuer firms arechosen on the basis of industry, size and OIBDrassets using an algorithm described in Table 2.Matched firm-adjusted long-term growth forecasts are computed by subtracting the long-term growthforecast of the matched firm from the long-term growth forecast of the issuing firm. Only forecastsmade the last month of each quarter after the CDO are listed. Only forecasts made for firms listed on
Ž .Institutional Brokers Estimate System IBES are included. t-statistics are given in parentheses.
earnings growth by CDO firms for a full year subsequent to the offering. Table 5also implies that there is very little change in the forecasted long-term growth ratesof the comparison firms at the different forecast intervals over the 3-year post-is-sue time period. This suggests that analysts recognize the issuer-specific decline ininvestment-related operating performance of convertible debt issuers. It takes

( )C.M. Lewis et al.rJournal of Corporate Finance 7 2001 447–474468
almost one full year for analysts to realize that future capital expenditures andgrowth opportunity profitability are declining relative to the industry average.
6.3. Post-issue stock price performance and analyst growth forecasts
If gradual recognition of declining operating performance by analysts is repre-sentative of a gradual recognition by investors, the poor stock price performanceof convertible debt issuers could be partially explained by a lagged adjustmentprocess. To explore this conjecture, we examine the relation between post-issuestock price returns and long-term earnings growth forecasts. Post-issue stockreturn performance may be explained by a gradual revision of analyst and investorexpectations of future growth, which is a function of initial analyst overestimationregarding cash flow- and investment-related operating performance. There shouldalso be a systematic relation between analyst long-term growth forecasts andpost-issue stock return performance.
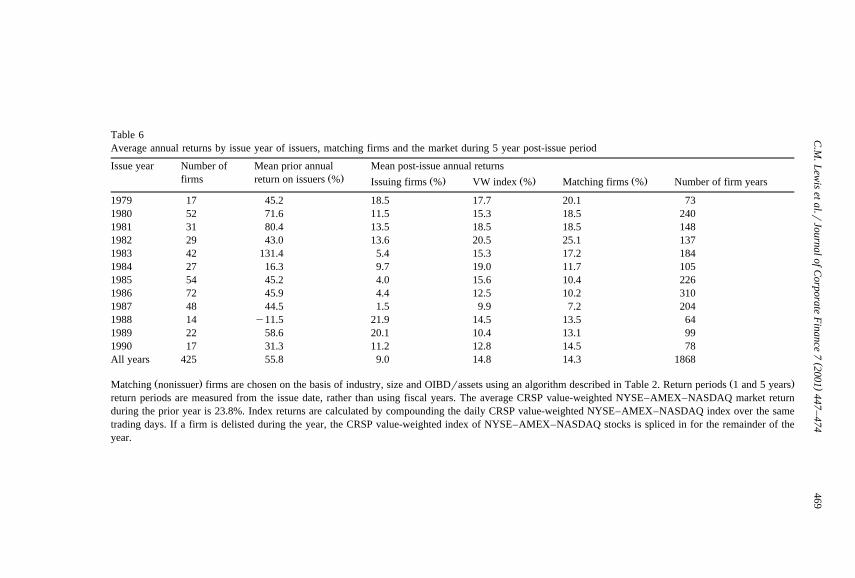
Table 6 provides raw and adjusted measures of issuer stock return performancefor 1 year before and 5 years after the CDO year. The stock price performanceevidence indicates that CDO issuer returns are similar to the pre- and post-issuereturn patterns of firms conducting SEOs. Column 2 confirms that the pre-issuestock return performance of convertible debt issuers is strongly positive in everyyear except 1988, where pre-issue stock price performance includes the effects ofthe October 1987 stock market crash.
Ž .Spiess and Affleck-Graves 1999 indicate that underperformance of bothstraight debt and convertible debt issuers occurs during periods of high issuevolume. Our results in Table 6 are consistent with this finding. Average underper-formance following convertible debt offers varies across time periods, but CDOfirms significantly underperform in high-volume issue periods.
The considerable variation in the long-run stock price performance of CDOfirms may reflect the variation in analyst expectations about future growth. Weconsider this issue by examining whether this poor stock price performancecorrelates with analyst overoptimism of long-run growth prospects.
In Table 7, we divide CDO firms into quartiles on the basis of their long-termearnings growth rate projections at the time of issue. Pre-issue returns are highestfor those firms projected to experience the fastest long-term earnings growth. Forexample, the low-projected growth issuers experience a 27.8% mean return in theyear prior to issue, while the high-projected growth issuers experience a 58.0%mean return. In the post-issue period, low-projected growth firms perform betterthan the high-projected growth firms. The worst performance is observed in thetwo higher long-term earnings growth rate quartiles. Issuers for whom analystshave the highest expectations at the time of issue experience the worst post-issuestock price performance.
Overall, Table 7 indicates that the poor stock price performance of CDO firmsis correlated with analyst overestimation of long-term earnings growth rate projec-
()
C.M
.Lew
iset
al.rJournalof
Corporate
Finance
72001
447–
474469
Table 6Average annual returns by issue year of issuers, matching firms and the market during 5 year post-issue period
Issue year Number of Mean prior annual Mean post-issue annual returnsŽ .firms return on issuers % Ž . Ž . Ž .Issuing firms % VW index % Matching firms % Number of firm years
1979 17 45.2 18.5 17.7 20.1 731980 52 71.6 11.5 15.3 18.5 2401981 31 80.4 13.5 18.5 18.5 1481982 29 43.0 13.6 20.5 25.1 1371983 42 131.4 5.4 15.3 17.2 1841984 27 16.3 9.7 19.0 11.7 1051985 54 45.2 4.0 15.6 10.4 2261986 72 45.9 4.4 12.5 10.2 3101987 48 44.5 1.5 9.9 7.2 2041988 14 y11.5 21.9 14.5 13.5 641989 22 58.6 20.1 10.4 13.1 991990 17 31.3 11.2 12.8 14.5 78All years 425 55.8 9.0 14.8 14.3 1868
Ž . Ž .Matching nonissuer firms are chosen on the basis of industry, size and OIBDrassets using an algorithm described in Table 2. Return periods 1 and 5 yearsreturn periods are measured from the issue date, rather than using fiscal years. The average CRSP value-weighted NYSE–AMEX–NASDAQ market returnduring the prior year is 23.8%. Index returns are calculated by compounding the daily CRSP value-weighted NYSE–AMEX–NASDAQ index over the sametrading days. If a firm is delisted during the year, the CRSP value-weighted index of NYSE–AMEX–NASDAQ stocks is spliced in for the remainder of theyear.

( )C.M. Lewis et al.rJournal of Corporate Finance 7 2001 447–474470
Table 7Ž .Long-term returns on convertible debt offerings CDOs by Forecasted Growth Quartiles
Issuer forecast quartile Issuer mean prior Mean post-issue annual returnsŽ .annual return % Issuing VW index- Matching firms-
Ž . Ž . Ž .firms % adjusted % adjusted %
Less than 13.18% 27.8 12.8 y0.9 y9.413.18–19.00% 49.7 16.4 1.8 y6.619.00–24.47% 45.3 2.5 y9.5 y20.3Greater than 24.47% 58.0 6.9 y6.4 y17.4
Ž .Matching nonissuer firms are chosen on the basis of industry, size and OIBDrassets using anŽ .algorithm described in Table 2. Return periods 1 and 5 years are measured from the issue date, rather
than using fiscal years. The average CRSP value-weighted NYSE–Amex–Nasdaq market return duringthe prior year is 23.0%. Index returns are calculated by compounding the daily CRSP value-weightedNYSE–Amex–Nasdaq index over the same trading days. Adjusted returns are computed by subtractingthe return on the NYSE–Amex–Nasdaq value-weighted index and matching firms from the return forthe issuing firms.
tions. The poor stock price performance is issuer-specific in that it is not explainedby projections for the industry itself. These results are consistent with our previousfindings on the investment-related operating performance of CDO firms.
7. Implications for theories of convertible debt financing
Capital market imperfections increase the cost of external finance. Informationcosts, risk-shifting problems and managerial discretion are important examples ofcapital market imperfections. The adverse consequences of these imperfectionsinclude the sale of overpriced securities, overinvestment in high-risk projects andoverinvestment in negative NPV projects. Theory suggests that convertible debtissues can mitigate these costs, but other solutions to these financing problemsexist as well.10
Why, then, do firms issue convertible debt instead of solving their financingproblems in alternative ways? One possible answer is that the alternative solutions
10 Ž .Information costs are analyzed in Myers and Majluf 1984 , risk-shifting problems are analyzed inŽ . Ž .Jensen and Meckling 1976 and managerial discretion problems are analyzed in Jensen 1986 and
Ž .Stulz 1990 . The role that convertible debt can play in resolving these problems is described in GreenŽ . Ž . Ž .1984 , Stein 1992 and Mayers 1998 . The alternative solutions include waiting until informationcosts decline, eliminating risk-shifting problems by maintaining all-equity capital structures andmitigating managerial discretion problems by increasing debt levels.

( )C.M. Lewis et al.rJournal of Corporate Finance 7 2001 447–474 471
create other inefficiencies for the issuer. For example, waiting to issue commonequity when adverse selection costs are low may entail other costs, such as the lossof a valuable investment opportunity. Since the costs and benefits of thesealternative solutions are unobservable, our analysis offers no direct evidence inthis regard.
Suppose, however, that issuers want to issue common stock, but their participa-tion in the equity market is foreclosed. The possibility of rationing in credit
Ž .markets is demonstrated by Stiglitz and Weiss 1981 , who show that lenders maybe unwilling to extend funds to some borrowers when adverse selection costs arehigh. Since debt is the most senior obligation in the firm’s capital structure,rationing in this market precludes the firm from raising external finance. Sinceequity is a junior security, rationing may not necessarily preclude the firm fromraising external finance with a more senior security. An equity-like security suchas convertible debt is the next logical consideration.
Our evidence provides some insights into the issue- and firm-specific factorsthat may cause equity rationing. First, adverse selection costs are higher in larger
Ž .security offers Krasker, 1986; Lewis et al., 1998 document that, on average,convertible debt offers represent 30% of the issuer’s market value, while seasonedequity offers represent only 19% of the typical issuer’s market value. Sinceconvertible debt is senior to common equity, its value will be less sensitive to thesubsequent revelation of private information. Therefore, the firm may be able toraise larger amounts of capital in the convertible debt market.
Ž .Our evidence does not support the predictions of Green 1984 and MayersŽ .1998 , who predict that convertible debt completely solves the adverse investmentincentives created by risk-shifting problems and managerial discretion. Bothmodels predict that the consequence of convertible debt is that firms invest only inpositive NPV projects. Our long-run stock market and operating performanceevidence does not support this prediction. While these models may possiblyidentify the issue motives for some firms, their predictions are inconsistent withthe post-issue performance of the typical issuer.
Ž .Our results are closest in spirit to Stein 1992 , who suggests that adverseselection problems cause firms to substitute convertible debt for common equitywhen adverse selection costs are high and management is optimistic about thefirm’s future performance. Managers issue convertible debt to signal their opti-mism about future performance. If managers are optimistic about future perfor-mance at the time of issue, our results suggest that this superior performance is notsubsequently realized. Therefore, on average, managers are either wrong, or thereis another explanation.
Our interpretation of the evidence is that managers are actually rationed out ofthe equity markets by investors. Some firms choose to issue equity later, whileother firms issue convertible debt now. Firms that issue now are offered contin-gent access to the equity market, but only if post-issue performance is sufficientlyhigh.

( )C.M. Lewis et al.rJournal of Corporate Finance 7 2001 447–474472
8. Conclusions
Multidimensional capital market imperfections induce firms to forgo standardfinancing instruments like straight debt or common equity. In the absence ofsecurity offers designed to mitigate the costs of these financing problems, firmshave a limited opportunity to make valuable investments. Theories of convertibledebt financing suggest that an appropriately designed convertible debt offer canminimize these financing-related costs and simultaneously restore efficient invest-ment incentives. By implication, a poorly designed convertible debt security offercan induce poor investment decisions.
We document two new findings about convertible debt issuers. First, cash flowŽoperating performance measured by OIBDrassets, profit margin, return on assets
.and OIBDrsales worsens on average after an issue, apparently because ofindustry factors. Furthermore, analysts appear to be surprised by this post-issue
Ždeterioration. Second, investment-related operating performance measured by.capital expenditures and R and D expenserassets and market-to-book ratio also
deteriorates. This effect is due primarily to firm-specific factors, since nonissuingmatched firms do not experience similar declines. In this case, analysts adjust theirlong-term growth estimates slowly; it takes almost a full year before their opti-mism dissipates.
Our results also provide evidence that extends our understanding of the relationbetween security choice decisions and post-issue operating and stock price perfor-mance. As in the case of SEOs, CDOs can be used to forecast poor post-issueoperating performance. Firms issue securities other than common equity prior toperiods of poor operating performance. As is the case with SEOs, future operatingperformance is not fully impounded into market prices at the time of issue. That is,investors expect the positive pre-issue operating performance to continue in thefuture. Post-issue stock price performance then is poor as investors realize thepoorer operating performance. These findings suggest that firms issue securitiesother than common equity when they are overvalued. Consequently, the Awindow
Ž .of opportunityB hypothesis suggested by Loughran and Ritter 1997 may not be acomplete description of security choice decisions.
The security choice decision appears to depend on firm characteristics that areresponsible for the weaker operating performance. The factors that influence thechoice of convertible debt are somewhat different from the factors that influencethe choice of common equity. Our results indicate that post-issue operatingperformance influences a manager’s decision to issue convertible debt. Bothfirm-specific and industry factors conditions make convertible debt a usefulfinancing choice. Firms that are rationed out of the equity markets respond byissuing convertible debt.
Our results are also consistent with the interpretation that managerial decisionsregarding convertible debt security design appear to be inefficient. Convertibledebt is not a fully revealing signal, nor does it appear to be designed to fully

( )C.M. Lewis et al.rJournal of Corporate Finance 7 2001 447–474 473
eliminate ex post agency costs. An important question for future research iswhether the poor post-issue stock price and operating performance can be pre-dicted ex ante by the security design decisions of issuers.
References
Barber, B., Lyon, J., 1996. Detecting abnormal operating performance: the empirical power andspecification of test statistics. Journal of Financial Economics 41, 359–399, July.
Brennan, M., Schwartz, E., 1988. The case for convertibles. Journal of Applied Corporate Finance,55–64, Summer.
Choe, H., Masulis, R., Nanda, V., 1993. Common stock offerings across the business cycle: theory andevidence. Journal of Empirical Finance 1, 3–31, June.
Dechow, P., Sloan, R., 1997. Returns to contrarian investment strategies: tests of naive expectationshypotheses. Journal of Financial Economics 43, 3–27, January.
Fama, E., 1998. Market efficiency, long-term returns, and behavioral finance. Journal of FinancialEconomics 49, 283–306, July.
Fama, E., French, K., 1993. Common risk factors in the returns on stocks and bonds. Journal ofFinancial Economics 33, 3–56.
Green, R., 1984. Investment incentives, debt and warrants. Journal of Financial Economics 13,115–136, March.
Hansen, R., Crutchley, C., 1990. Corporate earnings and financings: an empirical analysis. Journal ofBusiness 63, 347–371, July.
Healy, P., Palepu, K., 1990. Earnings and risk changes surrounding primary stock offers. Journal ofAccounting Research 28, 25–48, Spring.
Jaffe, J., 1974. Special information and insider trading. Journal of Business 47, 410–428, July.Jain, B., Kini, O., 1994. The post-issue operating performance of IPO firms. Journal of Finance 49,
1699–1726, December.Jensen, M., 1986. Agency costs of free cash flow, corporate finance and takeovers. American
Economic Review 76, 323–329, May.Jensen, M., Meckling, W., 1976. Theory of the firm: managerial behavior, agency costs and ownership
structure. Journal of Financial Economics 4, 305–360, October.Jung, K., Kim, Y., Stulz, R., 1996. Timing, investment opportunities, managerial discretion and the
security issuance decision. Journal of Financial Economics 42, 159–185, October.Krasker, W., 1986. Stock price movements in response to stock issues under asymmetric information.
Journal of Finance 41, 93–106, March.LaPorta, R., 1996. Expectations and the cross-section of stock returns. Journal of Finance 51,
1715–1742, December.Lee, I., Loughran, T., 1998. Performance following convertible debt issuance. Journal of Corporate
Finance 4, 185–207, June.Lewis, C., Rogalski, R., Seward, J., 1998. Agency problems, information asymmetries and convertible
debt security design. Journal of Financial Intermediation 7, 32–59, February.Lewis, C., Rogalski, R., Seward, J., 1999. Is convertible debt a substitute for straight debt or common
equity? Financial Management 28, 5–27, Autumn.Loughran, T., Ritter, J., 1995. The new issues puzzle. Journal of Finance 50, 23–51, March.Loughran, T., Ritter, J., 1997. The operating performance of firms conducting seasoned equity
offerings. Journal of Finance 52, 1823–1850, December.Mandelker, G., 1974. Risk and return: the case of merging firms. Journal of Financial Economics 1,
303–325, December.

( )C.M. Lewis et al.rJournal of Corporate Finance 7 2001 447–474474
Mayers, D., 1998. Why firms issue convertible bonds: the matching of financial and real investmentoptions. Journal of Financial Economics 47, 83–102, January.
Mikkelson, W., Partch, M., Shah, K., 1997. Ownership and operating performance of companies thatgo public. Journal of Financial Economics 44, 281–307, June.
Miller, M., Rock, K., 1985. Dividend policy under asymmetric information. Journal of Finance 40,1031–1051, September.
Myers, S., Majluf, N., 1984. Corporate financing and investment decisions when firms have informa-tion that investors do not have. Journal of Financial Economics 13, 187–222, June.
Rajan, R., Servaes, H., 1997. Analyst following of initial public offerings. Journal of Finance 52,507–529, June.
Ritter, J., 1991. The long-run performance of initial public offerings. Journal of Finance 46, 3–27,March.
Spiess, D.K., Affleck-Graves, J., 1995. Underperformance in long-run stock returns following seasonedequity offerings. Journal of Financial Economics 38, 243–267, July.
Spiess, D.K., Affleck-Graves, J., 1999. The long-run performance of stock returns following debtofferings. Journal of Financial Economics 54, 45–74, October.
Stein, J., 1992. Convertible bonds as backdoor equity financing. Journal of Financial Economics 32,3–21, August.
Stiglitz, J., Weiss, A., 1981. Credit rationing in markets with imperfect information. AmericanEconomic Review 71, 393–410, June.
Stulz, R., 1990. Managerial discretion and optimal financing policies. Journal of Financial Economics26, 3–27, July.