the long road to resilience - ifrc.org - ifrc long road to resilience / march 2012 table of contents...
TRANSCRIPT

The long road to resilienceImpact and cost-benefit analysis of community-based disaster risk reduction in Bangladesh

The long road to resilience.Impact and cost-benefit analysis of disaster risk reduction in Bangladesh.
This report shows the results of an evaluation of the Community-Based Disaster Risk Reduction Programme, implemented by Bangladesh Red Crescent Society (BDRCS) between 2005 and 2011. All greenhouse gas emissions of 6,100 kg CO2e caused by the flights for this evaluation have been offset by Banyaneer.
Evaluation teamDennis Eucker Team leader and co-author, BanyaneerPatrick Bolte Co-author, BanyaneerM. Fitri Rahmadana Survey analyst, Banyaneer
AcknowledgementsOn behalf of the authors, I am thankful to everyone who has helped to make this evaluation study possible. Special gratitude is expressed to Gaurav Ray, Khaled Masud Ahmed and Nazmul Azam Khan for the overall guidance during the process of the evaluation, and Laily Khan Majlish for the excellent and helpful support at any time. Most of all, I would like to thank Sayeeda Farhana, Md. Shahjahan, and Alauddin Ahmed for making the field trip so highly successful and unforgettable.
Dennis Eucker
© International Federation of Red Cross and Red Crescent Societies, Geneva, 2012Copies of all or part of this study may be made for noncommercial use, providing the source is acknowledged. The IFRC would appreciate receiving details of its use. Requests for commercial reproduction should be directed to the IFRC at [email protected].
The opinions and recommendations expressed in this study do not necessarily represent the official policy of the IFRC or of individual National Societies. The designations and maps used do not imply the expression of any opinion on the part of the International Federation or National Societies concerning the legal status of a territory or of its authorities. All photos used in this study are copyright of the IFRC unless otherwise indicated.
P.O. Box 372CH-1211 Geneva 19SwitzerlandTelephone: +41 22 730 4222Telefax: +41 22 733 0395E-mail: [email protected]: http://www.ifrc.org

The long road to resilience / March 2012
TABLE OF CONTENTSAbbreviations i
Executive summary ii
Introduction 1
SECTION A | BACKGROUND
1. Programme overview 3
2. Evaluation objectives and methodology 7
2.1 Objectives 8
2.2 Methodology 8
SECTION B | FINDINGS
3. Relevance 12
3.1 Disaster risk context 13
3.2 Policy context 15
3.3 Relevance to programme communities 15
4. Effectiveness 17
4.1 Programme management 18
4.2 Individual activities 20
5. Impact 21
5.1 Impact towards reduced disaster risk 24
5.2 Impact towards enhanced livelihoods 25
6. Efficiency 27
6.1 Costs 28
6.2 Benefits 29
6.3 Benefit-cost ratios 30
7. Sustainability 33
SECTION C | IMPLICATIONS
8. Lessons learnt 35
8.1 Effectiveness: Plan thoroughly and implement long-term 36
8.2 Relevance, impact and sustainability: Build long-term hazard resilience 37
8.3 Efficiency: Adapt programme focus and stay longer 38
9. Conclusion 40 Inte
rnat
ion
al F
eder
atio
n o
f R
ed C
ross
an
d R
ed C
resc
ent
Soci
etie
s

Appendix 42
A. Measuring community resilience 43
B. Survey results 47
C. Case studies 50
C.1 Programme communities 50
C.1.1 Ananda Bazaar | Chandpur district 50
C.1.2 Char Mayesha | Chandpur district 53
C.1.3 Tarail | Tangail district 56
C.1.4 Paikpara | Sirajganj district 59
C.1.5 Purbolbaoitara | Sirajganj district 61
C.2 Control communities 64
C.2.1 Niklagopal | Tangail district 64
C.2.2 South Digalkandi | Bogra district 66
C.2.3 Hoakowa | Bogra district 68
D. Literature 70
E. List of interviews and workshops 71
List of figures and maps
Figure 1: Overview of lessons learnt and recommendations v
Figure 2: Programme timeline 5
Map 1: Overview of CDDRR programme locations 6
Figure 3: List of assumptions 11
Figure 4: List of recent severe floods 13
Map 2: Extent of flooding in 2007 14
Figure 5: Actors and processes 19
Figure 6: Change of perceived living conditions 2006-2011 22
Figure 7: Overview of observed changes between 2006 and 2011 23
Figure 8: Estimated costs and benefits in selected communities 29
Figure 9: List of benefits included and excluded in the CBA 30
Figure 10: Considerations for future cost-benefit analyses 32
Figure 11: Model of hazard resistance and resilience over time 43
Figure 12: Proposed indicators for community resilience 45
Figure 13: Survey respondent profile 47
Th
e lo
ng
road
to
resi
lien
ce. I
mp
act
and
cos
t-be
nefi
t an
alys
is o
f d
isas
ter
risk
red
uct
ion
in B
angl
ades
h.

ABBREVIATIONSBCR Benefit-cost ratio
BDT Bangladesh Taka
BDRCS Bangladesh Red Crescent Society
CBA Cost-benefit analysis
CCA Climate change adaptation
CBDRR Community-based disaster risk reduction
CBDM Community-based disaster management
CDMC Community Disaster Management Committee
CDRT Community Disaster Response Team
CHF Swiss Franc
CPP Cyclone Preparedness Programme
DFID Department for International Development (United Kingdom)
DMB Disaster Management Bureau
DRM Disaster risk management
DRR Disaster risk reduction
EPRP Earthquake Preparedness and Response Programme
GADRR Global Alliance on Disaster Risk Reduction
GoB Government of Bangladesh
Ha Hectare
HFA Hyogo Framework for Action
HKRC Hong Kong Branch of the Red Cross Society of the People’s Republic
of China
IFRC International Federation of Red Cross and Red Crescent Societies
MAPP Method of Assessment for Projects and Programmes
MG Micro-group
Mio Million
NDMC National Disaster Management Council
NGO Non-governmental organisation
PNS Partner National Society
PoA Plan of Action
SARD (IFRC) South Asia Regional Delegation (based in New Delhi)
SOD Standing Orders on Disaster
TEV Total economic value
UDRT Unit Disaster Response Team
UNISDR United Nations International Strategy for Disaster Reduction
VCA Vulnerability and capacity assessment
VGF Vulnerable group feeding (programme of the government)
Inte
rnat
ion
al F
eder
atio
n o
f R
ed C
ross
an
d R
ed C
resc
ent
Soci
etie
s
i

The long road to resilience / March 2012
EXECUTIVE SUMMARYThe road to resilience for Bangladesh’s flood-prone communities is long.
As this report shows, activities to reduce disaster risk as implemented under the Community-based Disaster Risk Reduction (CBDRR) programme between 2005 and 2011 by the Bangladesh Red Crescent Society (BDRCS) bear merit, as they generated a positive impact on programme communities.
Future DRR programmes however should be implemented over a longer time frame to facilitate the sustainability of achievements and render the programme more efficient. Such programmes also need to address local concerns such as riverbank erosion more comprehensively and should aim to enhance the adaptive capacity of communities at large more fully.
The report starts off by setting the context. Recognizing the substantial damages regularly experienced by flood-prone communities, BDRCS transferred the knowledge it had gained through its Cyclone Preparedness Programme (CPP) in coastal areas to inland districts. Since 1994, it has been implementing risk reduction activities in more than 200 communities.
“The long road to resilience” focusses on activities implemented between 2006 and 2011, first with the support of the UK Department for International Development (DFID) and the Hong Kong Branch of the Red Cross Society of the People’s Republic of China, then with funding from the International Federation of Red Cross and Red Crescent Societies (IFRC) and the Global Alliance on Disaster Risk Reduction (GADRR). Throughout this timeframe, the CBDRR programme included activities to enhance risk awareness and preparedness, small-scale mitigation and livelihood support.
The report findings are based on a household survey and workshops in eight communities (five that were supported by the CBDRR programme and three that serve as control groups), as well as on a document review and key informant interviews. Note that for the cost-benefit analysis, assumptions and excluded benefits are listed in figures 3 and 9 respectively.
Regarding relevance, the study finds that the programme activities have been highly relevant to the overall risk context and the local communities it supported. It is also recognized that the programme has been aligned with activities of other actors and run in support of relevant overarching strategies. However, the CBDRR programme failed to address several aspects that were and are highly relevant to local communities. In particular, riverbank erosion and the diminishing size of arable land is a key concern that was not addressed.
Concerning effectiveness, it is seen that while the CBDRR programme has been effective in the sense that it reached the majority of its objectives, it faced six constraints regarding programme management: (1) incomplete planning, (2) inadequately short implementation periods, (3) a significant lack in monitoring, (4) insufficiency of programme staff, (5) the unmet need for consistently close communication between IFRC Delegation and BDRCS, and (6) an implementation modus that has been overly top-down in nature. Most of the individual activities, such as the establishment of community groups and disaster emergency funds, are seen as
ii
Th
e lo
ng
road
to
resi
lien
ce. I
mp
act
and
cos
t-be
nefi
t an
alys
is o
f d
isas
ter
risk
red
uct
ion
in B
angl
ades
h.

highly effective. However, more long-term tools should have been added to raise resilience further.
The report proceeds with an in-depth discussion of impact and reveals that the programme has made programme communities more resilient to floods than control communities: programme communities rebounded more quickly from the impact of the disastrous 2007 flood. In spite of similar flood levels, they were less affected by minor floods in 2008 and 2009. Furthermore, it is found that perceived general living conditions in programme communities have exceeded those in control groups despite their lower baseline values. The analysis shows that this is not a mere correlation, but that the programme was indeed causal for these differences.
How, then, did the programme generate this impact? “The long road to resilience” finds that the establishment of community groups served as a platform on which all other activities could be built. This has led to greater community cohesion and mutual collaboration, the lack of which is bemoaned in control groups as the chief reason for their low disaster preparedness. Notably, the establishment of community groups has brought about a number of indirect benefits such as greater accountability and transparency.
The impact of livelihood support is mixed: in a few cases such as distribution of rickshaws and fishing boats, the desired effect of income-generation hardly materialised. Others, especially the delivery of new vegetable seeds has brought about significant yield increases. In more general terms though, it is found that the leverage of increasing the asset base used by the programme is not as powerful as a leverage that would raise long-term adaptive capacity and resilience.
The report analyses the CBDRR programme’s efficiency through a cost-benefit analysis and encounters numerous challenges on both the cost and the benefit side. As available financial records did not allow for a direct attribution of individual expenditures to a particular community, the study deployed an informed estimate. Considering benefits, many benefits were identified but had to be excluded from the calculation of benefit-cost ratios (BCR) for several reasons - many could not be quantified or monetized or would have required much more substantial research. The report makes four recommendations for future CBAs: It sets preconditions that must be met (comparable hazards before and after the programme), proposes steps to make CBAs comparable to each other, and suggests improvements to data for both costs and benefits.
The calculation shows with confidence that in the four communities studied, benefits exceeded costs - benefit-cost ratios at present stand between 1.18 and 3.04. If future protective benefits are included (a time frame of 15 years was chosen), BCRs are identified to be between 3.05 and 4.90. Since many benefits had to be excluded from the calculation, the ‘real’ benefit-cost ratios are certain to be significantly higher.
The monetization of benefits also shows that if paddy fields could have been even partially better protected, the programme would have yielded substantially higher benefit-cost ratios: flood destruction of paddy fields and harvests is by far the biggest damage value that could be monetized - but without any protective measures by the programme, any future flood similar to the one in 2007 will cause just as much havoc.
With regards to sustainability, the report recalls the pivotal role of local ownership - the willingness and capacity of local communities to maintain programme achievements. While the sense of local ownership is seen as high - for instance through the regularity of meetings and dedication of members of the newly created community groups - the case of one community is a frank reminder that In
tern
atio
nal
Fed
erat
ion
of
Red
Cro
ss a
nd
Red
Cre
scen
t So
ciet
ies
iii

sustainability cannot be taken for granted: Niklagopal community had been supported in the mid-1990s, but after the conclusion of BDRCS support, the groups faded into oblivion.
Future programmes should aim for greater local involvement in the planning process and be extended by a consolidation period that runs over three to four years in order to provide more back-up guidance and render results more sustainable.
“The long road to resilience” ends with three key lessons learnt and recommendations for future DRR programming: First, programmes should be planned more throughly and implemented over a longer time-frame. Second, they should be geared to build even greater hazard resilience - in particular, through raised adaptive capacity and not just an increase of asset bases. Third, they should adapt their focus and extend support beyond the most vulnerable to middle-income groups. Figure 1 on the opposite page provides an overview of lessons learnt and recommendations.
The report concludes that the CBDRR programme has been successful in the sense that it created a positive impact to preparedness and resilience of local flood-prone communities. However, much remains to be done to raise resilience even further. With the impending effects of climate change, improved adaptive capacity of communities must be the goal - this will require more time and new alliances with actors that hold expertise in issues where the Red Cross/Red Crescent Movement has gaps.
The road to resilience is long, but is worth taking.
iv
Th
e lo
ng
road
to
resi
lien
ce. I
mp
act
and
cos
t-be
nefi
t an
alys
is o
f d
isas
ter
risk
red
uct
ion
in B
angl
ades
h.

Figure 1: Overview of lessons learnt and recommendations
Relevance | Impact | SustainabilityWhich approaches are most likely to produce a relevant and sustainable impact?
2 | Build long-term hazard resilience
EfficiencyHow can CBDRR be designed to generate maximum benefits cost-efficiently?
3 | Adapt programme focus and stay longer
1c | Enhance programme management and monitoring
2a | Raise the adaptive capacity of communities
3a | Continue to support community development and awareness
Most programmes, including the one evaluated in this report, are planned centrally and often result in rigid frameworks that leave little space for local determination.
However, as this report shows, greater flexibility of the overarching framework and more localized planning renders a programme more effective, as it leads to a more targeted tackling of local needs. It also contributes to sustainability (through fostering a sense of ownership). Thus, the principle of subsidiarity should always be considered in programme management and implementation: Locate decision-making on programme activities as low as possible, but as high as necessary.
The CBDRR programme has focused its livelihood activities around the widening of the asset base of vulnerable households. The approach alone generates limited impact that is usually short-lived. Crucially, it does very little to raise adaptive capacity.
Future DRR programmes should put their main focus on improving adaptive capacity, for instance through cultivation of more hazard-resistant crops and diversification of income sources. Alliances with organisations with relevant expertise (e.g. agriculture institutes) should be built and activities piloted before being applied more widely.
Providing small-hold and cash crop farmers with and/or assisting them in the use of more flood-resistant crops and practices is likely to not only increase their income, but also to stabilize food security in their community.
While costs for such an activity are expected to be rather low, especially since middle-income earners may be able to purchases seeds themselves, benefits are likely to be significantly higher compared to an exclusive focus on the most vulnerable. Although middle-income groups may not be immediately vulnerable, they too face climate change related long-term threats.
1b | Extend implementation periods to at least three years
2c | Align disaster risk reduction with disaster response more closely
3b | Extend support to middle-income groups
While many DRR activities can be implemented over the course of 12-18 months, this timeframe is too short to demonstrate mid-to long term benefits and to consolidate new practices and institutions.
This, in turn, tarnishes effectiveness, impact and sustainability of achievements. Future DRR programmes should include an initial set-up period of 12-18 months and a consolidation period of two years or more. The consolidation period entails no additional activities, but rather sustained guidance, follow-up (e.g. refresher training) and moni-toring. If possible, the existing CBDRR pro-gramme should be extended in such a way.
Although DRR and disaster response both are both under the responsibility of the BDRCS DM division, they are separate activities in practice.
Synergies could be tapped better by utilizing the local capacities of the CDRT for assessments and relief. The tool of the community disaster emergency fund is seen as highly promising and should be replicated in future programmes. Ideally, these funds should be able to increase social security both in disaster risk preparedness and in actual times of hardship. Present volumes are not yet sufficient to support both aspects adequately.
Improving community organization and raising awareness is a central part of a cost-efficient approach to CBDRR. Costs associated with establishment of CDMCs and CDRTs, training and awareness-raising are low, while the direct and especially the indirect benefits of these activities are considerable.
Many problems in at-risk communities can be related to widespread day-to-day mis-behaviour which prevents them from increasing their resilience. Protecting the environment and keeping dredging channels clean from household and other sources of waste is an easy and cost-efficient measure that should be part of all future CBDRR programmes.
1a | Enable greater local involvement in the planning process
3c | Stay longer to consolidate impacts and raise benefits
Comprehensive planning based on close collaboration between National Society and Delegation, appropriate programme management (assignment of a full-time programme manager, strong differentiation between director and managing positions, and a clear structuring of means and ways of cooperation between the Delegation and the National Society), and communication at all levels will facilitate programme effectiveness and adaptability. A consistent plan for measuring the progress of implementation that lays out the programme logic and specific and measurable indicators, and an effective monitoring and evaluation system (based on initial baseline studies) is crucial.
The small-scale mitigation measures under the CBDRR programme chiefly mitigated risks to human lives but did little to mitigate risks to livelihoods. They have neither addressed the key concern of land erosion nor did they reduce risks to livestock, paddies and larger productive assets.
Mitigating these risks usually comes neither easy nor cheap, as larger structural measures are often involved. Nonetheless, potential solutions should be sought and implemented in collaboration with local governments and relevant experts. Measures exist that are inexpensive (e.g. bamboo planting) or can be made affordable with use of volunteers.
This recommendation is similar to 1b, but comes from the angle of efficiency: Under the current CBDRR approach, initial set-up costs are relatively high, while the benefits are relatively low without consolidation of programme achievements due to their low sustainability.
By contrast, an approach that would add a consolidation period would not cost much more (since the initial set-up is already covered) but is likely to reap far greater benefits.
EffectivenessWhat should an effective planning and implementation approach look like?
1 | Plan thoroughly and implement long-term
Inte
rnat
ion
al F
eder
atio
n o
f R
ed C
ross
an
d R
ed C
resc
ent
Soci
etie
s
v
2b | Mitigate risks more comprehensively

1
Bre
akin
g th
e w
aves
. Im
pac
t an
alys
is o
f co
asta
l aff
ores
tati
on f
or d
isas
ter
risk
red
uct
ion
in V
iet
Nam
.
The long road to resilience / March 2012
INTRODUCTION

Imagine you lived in a country that is ravaged by cyclones and floods almost every year. Imagine that this country is both densely populated and affected by land erosion, making you struggle to find arable land. To make matters worse, imagine that people say that in future, floods, cyclones and other weather-related hazards are likely to become more severe and frequent.
This is the reality for millions of people in Bangladesh, one of the world’s most disaster-prone countries. The particularly unfavourable combination of hazards and risks results in millions being highly vulnerable to loosing their lives and livelihoods.
For more than three decades, the Bangladesh Red Crescent Society (BDRCS) has been aiming to reduce this vulnerability by building up local disaster preparedness capacities and by applying numerous tools to reduce risks. Since 1996, it has been running a programme in flood-prone communities with the support of the International Federation of Red Cross and Red Crescent Societies (IFRC) and various donors. Note that while the programme has changed names twice1, this report refers to it under the current name of Community-Based Disaster Risk Reduction (CBDRR). This report contains the results of an evaluation that focussed on the programme between 2006 and 2011. The evaluation was commissioned by the IFRC chiefly to measure the impact the programme has generated, to review its efficiency through a cost-benefit analysis (CBA), and to identify lessons learnt that enable enhancements in future risk reduction programming.
The evaluation was conducted in November/December 2011 and included field visits to eight communities; findings are based on the results of a household survey, workshops and the use of qualitative research techniques. In order to adequately assess impact, field visits included three control communities in which no activities had been implemented by BDRCS.
“The long road to resilience” is structured in three sections. Section A (chapters 1-2) reviews the background of the programme and this evaluation. Section B (chapters 3-7) includes the key findings, relating to relevance, effectiveness, impact, efficiency and sustainability. Section C (chapters 8-9) presents the implications of those findings.
Note that the recommendations and lessons learnt in section C are referenced to related findings. For this purpose, all paragraphs in section B are numbered.
To illustrate findings, the report makes frequent use of figures, maps and charts. The appendix provides additional information, in particular the comprehensive survey results and case studies of the eight communities visited. Appendix A proposes a set of indicators to help measure community resilience.
Inte
rnat
ion
al F
eder
atio
n o
f R
ed C
ross
an
d R
ed C
resc
ent
Soci
etie
s
2
The programme was called Community-Based Disaster Preparedness (CBDP) between 1996 and 2004, Community-Based Disaster Management (CBDM) between 2005 and 2009, and has been run under the banner of Community-Based Disaster Risk Reduction (CBDRR) since 2009.
1.

3
Bre
akin
g th
e w
aves
. Im
pac
t an
alys
is o
f co
asta
l aff
ores
tati
on f
or d
isas
ter
risk
red
uct
ion
in V
iet
Nam
.
The long road to resilience / March 2012
1. PROGRAMME OVERVIEW
SEC
TIO
N A
| BAC
KGRO
UND

As mentioned above, the CBDRR programme has a long history - in order to provide the full context, this chapter begins with a look back in time before turning to the current programme outline.
1972 – 2004: Background
Given the extreme hazard and risk exposure found in Bangladesh, disaster risk management (DRM) has been the cornerstone of BDRCS since its very inception in 1971. Following the devastating Cyclone Bhola in 1970, which claimed about 500,000 lives, BDRCS launched a cyclone preparedness programme (CPP) in 1972 to reduce the vulnerability of cyclone-exposed communities along the country’s coastline. Between 1985 and 1995, 149 cyclone shelters were built in these areas.
While the main focus of its DRM activities in its first two decades had thus concerned cyclone preparedness along the coast, in 1996 BDRCS began to transfer the knowledge it had gained to inland areas. Considering the havoc two very severe floods had caused in 1987 and 1988 in many low-lying areas and along the country’s main rivers, it aimed to mitigate risks and build community preparedness in flood-prone communities. In 1997 BDRCS established a DM division at its headquarters in Dhaka to raise management capacity for the several preparedness programmes and response operations it was now running.
Through the Community-Based Disaster Preparedness (CBDP) programme, concluded in 2004, BDRCS reached out to 179 communities in 39 flood-prone districts.2 The CBDP programme included capacity-building, awareness-raising and small-scale mitigation measures. An external evaluation in 2004 recommended to extend this programme and to address underlying risk factors more comprehensively. In particular, the livelihoods of community members needed to be strengthened and made more flood-resilient.
The CBDM phase 2005-2008/09: enter livelihood support
Based on the 2004 recommendations, BDRCS re-designed the programme to include a livelihood component. Now called Community-Based Disaster Management (CBDM), the programme was launched in March 2005 with funding from the UK Department for International Development (DFID) and the Hong Kong branch of the Red Cross Society of the People’s Republic of China (HKRC)3.
The BDRCS proposal originally envisioned activities across 80 communities in 10 districts, however, due to funding limitations, the eventual main focus was limited to 20 communities, in which vulnerability and capacity assessments (VCAs) and subsequent activities were implemented - supporting livelihoods, small-scale mitigation and technical preparedness. Out of the remaining 60 communities, 52 saw limited activities around awareness-raising and training, while implementation in another eight communities in Shariotpur district was suspended in 2007 due to an internal conflict and local management issues at the BDRCS unit.
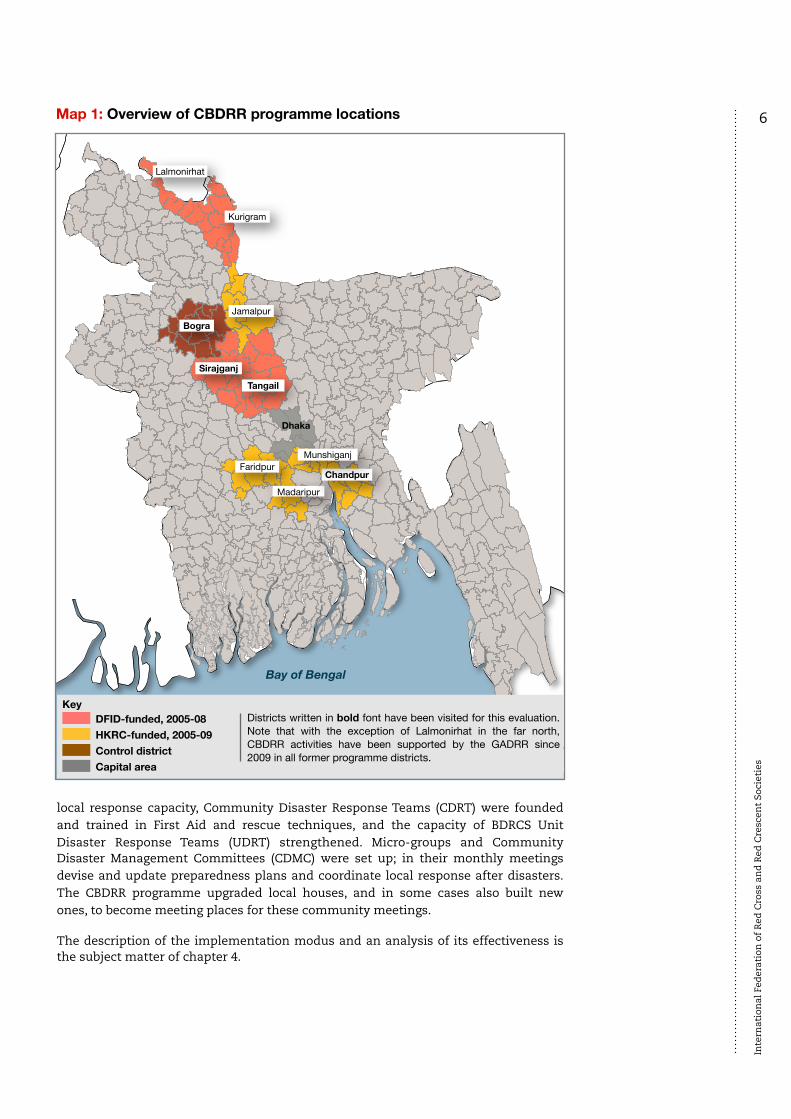
Throughout the CBDM period, a total of CHF 1,033,441 was channelled through IFRC, with separate programme areas designated. DFID funds4 were allocated for programme activities in 40 communities in the four districts of Lalmonirhat, Kurigram, Sirajganj and Tangail, while HKRC money was used to fund activities in 32 communities in the five districts of Jamalpur, Faridpur, Madaripur, Munshiganj and Chandpur (see map 1). BDRCS prioritised the 20 communities in which VCAs as well as livelihood and mitigation support would be implemented on the basis of their higher-
Inte
rnat
ion
al F
eder
atio
n o
f R
ed C
ross
an
d R
ed C
resc
ent
Soci
etie
s
4
Between 2002 and 2004, CBDP in Bangladesh was part of the global IFRC DRR I programme, which the UK Department for International Development (DFID) had funded.
Aside from the main focus on flood preparedness, the CBDM programme also contained a compo-nent addressing earth-quake preparedness in three urban areas (Earth-quake Preparedness and Response Programme, EPRP). EPRP is not taken into account in this evaluation; for an EPRP review, see Ragno 2009.
DFID funds for CBDM were part of the DRR II global programme.
2.
3.
4.

than average vulnerability.6 The CBDM programme was to conclude in April 2008, however, due to the impact of Cyclone Sidr in November 2007, the DFID and HKRC-funded components were only completed in October 2008 and May 2009 respectively.
The CBDRR phase 2009-2011 Following the end of DFID and HKRC support, the programme was extended with residual IFRC funds from the 2007 flood and Cyclone Sidr operation (CHF 448,334) and with support from the Global Alliance on Disaster Risk Reduction (GADRR, CHF 29,820). Throughout 2009-2011, the programme reached 16 communities in eight districts that had been involved in the previous phase (all but Lalmonirhat). Initially, one community was targeted per district, with a second one added in 2010.
The CBDRR programme outline 2005-2011 Despite the change of names, the programme outline has remained almost unchanged since the programme was launched in 1996. The only adaptation was the incorporation of a livelihood component from 2005 onwards. Over the past seven years, the programme has thus been geared towards the four following ‘key result areas’:
1. Raised community awareness towards preparedness and mitigation2. Mitigated risks through small-scale mitigation measures3. Enhanced livelihood security in particular for the most vulnerable4. Strengthened local disaster response capacity
In support of the first key result area, VCAs were conducted at the outset – on the one hand, this served planning purposes for mitigation and livelihood, on the other, VCAs helped raise awareness towards flood preparedness and risk mitigation. Small-scale mitigation included the raising of house plinths, drilling of shallow and deep tube-wells, construction of bridges (for speedy evacuation, but also for maintaining a certain degree of normal village life during floods and high water levels) and the construction of latrines. Livelihood support contained the distribution of productive animals (cows, goats, chicken), vegetable seeds and tree saplings as well as material assets (sewing machines, fishing boats and nets, rickshaws).
Community disaster response emergency funds were also established in most communities: households contribute BDT 2 per month to the fund, with its reserves being allocated for repairs and replacements after an eventual disaster. Concerning
5 Figure 2: Programme timeline 5
5.
6.
CBDM Programme (DFID-funded)in 4 flood-prone districts (40 communities)
Lalmonirhat, Kurigram, Sirajganj, Tangail
CBDM Programme (HKRC-funded)in 5 flood-prone districts (32 communities)
Jamalpur, Faridpur, Madaripur, Munshiganj, Chadpur
CBDRR Programme (GADRR-funded)
in 8 flood-prone districts (16 communities)
Kurigram, Sirajganj, Tangail, Jamalpur,
Faridpur, Madaripur, Munshiganj, Chadpur
CBDP Programmein 39 flood-prone districts (179 communities)
1996 1997 1998 1999 2000 2001 2002 2003 2004 2005 2006 2007 2008 2009 2010 2011
GADRR: IFRC:Total:
29,820 CHF448,334 CHF
478,154 CHF
DFID: HKRC: Total:
332,695 CHF700,746 CHF
1,033,441CHF
The timeline indicates different phases, respective programme areas and expenditure volumes at original CHF values. For 2009-11, expenditures are included up to December 19th 2011.
Communities were selected by BDRCS based on standardized selection criteria such as previous disaster damage, poverty rates and education levels. T
he
lon
g ro
ad t
o re
sili
ence
. Im
pac
t an
d c
ost-
ben
efit
anal
ysis
of
dis
aste
r ri
sk r
edu
ctio
n in
Ban
glad
esh
.
- no financial data available -
local response capacity, Community Disaster Response Teams (CDRT) were founded and trained in First Aid and rescue techniques, and the capacity of BDRCS Unit Disaster Response Teams (UDRT) strengthened. Micro-groups and Community Disaster Management Committees (CDMC) were set up; in their monthly meetings devise and update preparedness plans and coordinate local response after disasters. The CBDRR programme upgraded local houses, and in some cases also built new ones, to become meeting places for these community meetings.
The description of the implementation modus and an analysis of its effectiveness is the subject matter of chapter 4.
Inte
rnat
ion
al F
eder
atio
n o
f R
ed C
ross
an
d R
ed C
resc
ent
Soci
etie
s
6Map 1: Overview of CBDRR programme locations
Lalmonirhat
Kurigram
JamalpurBogra
Sirajganj
Tangail
Faridpur
Madaripur
Chandpur
Munshiganj
Dhaka
DFID-funded, 2005-08HKRC-funded, 2005-09Control districtCapital area
Key
Bay of Bengal
Districts written in bold font have been visited for this evaluation. Note that with the exception of Lalmonirhat in the far north, CBDRR activities have been supported by the GADRR since 2009 in all former programme districts.

7 The long road to resilience / March 2012
2. EVALUATION OBJECTIVES AND
METHODOLOGY

The CBDRR programme was externally evaluated at least three times (in 2004, 2008 and 2009; see Ragno 2009). As the programme has since been extended and modified, and as IFRC has renewed its efforts to better measure impact and efficiency of the DRR programmes it supports around the world, this evaluation was commissioned in order to capture a more detailed and updated picture of the programme’s achievements.
It is worthwhile recalling the general two-fold purpose of an evaluation: to deliver accountability to donors by identifying and/or verifying programme achievements, and to identify lessons learnt. This identification enables the replication of what went well and the modification of what did not.
This chapter discusses the ‘what’ and the ‘how’: it looks at the concrete evaluation objectives before proceeding to a brief look at the methodology applied.
2.1 Objectives
The IFRC Secretariat commissioned this evaluation with four objectives in mind:
a) to document the evolution of the Bangladesh Red Crescent Society’s Community-Based Disaster Risk Reduction Programme, touching on the approach to planning, implementation and follow-up;
b) to identify the key aspects and outputs of the programme’s evolution that have contributed towards sustainable outcomes leading to the enhanced awareness and capacity of at-risk communities;
c) to undertake an impact and cost-benefit analysis (CBA) of the CBDRR programme versus disaster response operations undertaken by the Bangladesh Red Crescent Society; and
d) […] to contribute to a broader Federation-wide effort to improve disaster risk reduction performance measurement and impact analysis.
Concerning the programme evolution, the terms of reference (ToR) highlight the need to describe and analyse the selection of target communities, stakeholder linkages, the degree of community and gender participation, major milestones and the sustainability of the various programme components.
In regard to key aspects and outputs, the ToR require that community safety and resilience be measured and analysed in such a way that the results can inform the Federation-wide discussion on a globally applicable measurement of community safety and resilience.
Finally, the ToR specify that the impact analysis should compare the impact of structural versus non-structural measures as well as short-term versus long-term implementation modi (slow versus fast), and summarise the contributions of communities and stakeholders. Through the lenses of the cost-benefit analysis, the efficiency of individual activities as well as the full programme are to be measured.
Having summarised the ‘what’ – the evaluation’s objectives and specifications – it is time to turn to the ‘how’: the methodology applied for this evaluation.
2.2 Methodology
Under consideration of (a) the evaluation objectives, (b) the CBDRR programme outline, (c) the requirements for an assessment of impact, efficiency and sustainability, and (d) the available resources and time for the evaluation, an
Inte
rnat
ion
al F
eder
atio
n o
f R
ed C
ross
an
d R
ed C
resc
ent
Soci
etie
s
8

analytical framework was devised to carry out the task in an efficient, realistic, timely, sound and valid manner. At its core, the research design consists of three components: systematisation (to capture the programme evolution), impact analysis (to capture the difference the programme has made), and cost-benefit analysis (to capture the programme’s economic efficiency).
Regarding data gathering and analysis, the evaluation followed a mixed-method approach, making use of both qualitative (document review, key informant interviews, workshops, transect walks) and quantitative tools (household survey).
Workshops were arranged based on the ‘method of assessment for projects and programmes’ (MAPP, see Neubert 2010) - a comparative approach that elicits relative perceptions rather than absolute values. Since no baseline data were available, the approach is particular appropriate in that it generates a view of changing conditions over time. Workshop participants were asked to rate several aspects of their living conditions for each year between 2006 and 2011. Furthermore, as MAPP also addresses the questions as to how and why changes occurred, the methodology is particularly helpful for generating lessons learnt as to which changes can be attributed to the CBDRR programme and, maybe even more important, as to the direct and indirect impacts that the individual activities have brought about.
Data-gathering was conducted between November 17th and December 5th, 2011 in Dhaka as well as in eight hazard-prone communities. Following discussion with IFRC and BDRCS staff, five programme communities were selected – two each in the districts of Chandpur and Sirajganj and one in Tangail.7 In all five communities VCAs and substantial support to risk reduction and livelihood were implemented.
Notably, the evaluation focus was not limited to communities that had been involved in the CBDRR programme, but extended to places without a similar intervention (control groups). This is because impact analysis requires the measurement not only of the factual, but also of the counterfactual (what outcomes would have been found in the absence of a programme intervention). A solid design is needed to attribute certain changes in outcome to the CBDRR programme, and as much as feasible, a quasi-experimental approach was adhered to (comparing the before versus the after of an intervention in a programme community with the before versus after in a control group). In line with the programme outline, particular focus was attached to changes in hazard resilience and livelihood.
9
7. In Chandpur, the CBDRR programme was funded by HKRC in 2005-2009, while Sirajgang and Tangail were funded by DFID in 2005-2008. In all the five sample communities, follow-up activities were implemented between 2009 and 2011. T
he
lon
g ro
ad t
o re
sili
ence
. Im
pac
t an
d c
ost-
ben
efit
anal
ysis
of
dis
aste
r ri
sk r
edu
ctio
n in
Ban
glad
esh
.
Riverbank erosion diminishes the arable land across most visited communities.

10Cost-benefit analysis (CBA), a tool ubiquitously used by economists that over recent years has become increasingly popular in the humanitarian field, was deployed to measure efficiency. Compared to impact analysis, which measures the changes in outcomes attributable to a programme to date, CBA goes further – first, by juxtaposing impact/benefits with costs, and second, by expanding the time horizon: as neither costs nor benefits are likely to cease at the present time but are likely to extend into the future, costs and benefits are projected over the expected lifetime of a particular investment. Protective benefits (avoided risk) over such a period were calculated by multiplying the avoided risk value with the annual probability rate for the recurrence of major hazards and the number of years of the expected lifetime.
For the household survey, 194 community members were interviewed (123 in programme communities, 71 in control locations, see appendix A for survey results).
Limitations and assumptionsThe evaluation experienced several constraints that need to be made explicit. In many cases the time between particular interventions and this evaluation is too short to analyse their impact. Many activities require more time to fully create their impact. One case in point are the fruit trees that were distributed under the programme, most of which have only been planted over the past two years.
More importantly, in order to assess the impact and the benefit value of improved disaster preparedness capacities, ideally two comparable hazards would be needed, the timing of which are before and after the programme. However, in the case of this evaluation, real-life conditions did not fully meet methodological requirements. Over the past decade, “only” two major disasters occurred: in 2007, both a severe flood and Cyclone Sidr had a devastating effect on all communities visited.
This creates three methodological challenges: first, these disasters occurred two years into the programme – at a time when the programme is likely to already have created some impact. To some extent, the lack of a neat before-versus-after comparison can however be overcome through the use of control communities.
Second, the close temporal proximity of the two disasters in 2007 renders a disambiguation of damages difficult.
Third, and most crucially, the lack of a comparable hazard to those of 2007 towards the final stage of the programme means that there is no valid point of comparison. Although this evaluation managed this problem by asking workshop participants to gauge damages that would result from present-day disasters similar to those in 2007, these values must be understood as a rough estimation only.
Regarding the cost-benefit analysis, three major limitations inherent to the CBA approach should be noted:
First, a CBA looks at overall costs and benefits rather than at their distribution. To identify the distribution of benefits (e.g. who were the winners and the losers?), qualitative tools need to complement a CBA.
Second, a CBA faces difficulties when it comes to assessing non-market impacts such as those on health and environment. For instance, questions concerning the value of a saved human life require difficult ethical judgments. Although tools exist to address this question, a monetary value cannot be placed on a human life or on psychosocial well-being, bearing in mind the Red Cross Red Crescent principles and values (IFRC
Inte
rnat
ion
al F
eder
atio
n o
f R
ed C
ross
an
d R
ed C
resc
ent
Soci
etie
s

2010:4). It is important to note then that the benefits described in this report represent only a share of the actual real-life benefits – the picture as seen through the CBA lenses is thus incomplete.
The third limitation concerns time and scale: as a cost-benefit analysis involves estimates, the usefulness and robustness of a CBA generally declines as time and scale increases (Mechler 2008:7). Generally, cost-benefit analysis must be understood as an approximation rather than an expression of the exact economic value of a given investment. It is also important to note that underlying assumptions need to be made explicit in order to make a CBA valuable (see figure 3 below).
11
Figure 3: List of assumptionsItem Assumption
Programme costs • It is assumed that 80% of costs during the DFID/HKRC funded phase were incurred in those communities in which VCAs and livelihood activities were carried out
Annual hazard probability • Based on historical flood data, it is assumed that a major flood comparable to the one in 2007 occurs every five years - leading to an annual hazard probability of 20%.
Future benefits • The time horizon for protective benefits (especially raised house plinths) is set to 15 years• Future direct economic benefits have been excluded from the calculation (see figure 9 on page 30)• No discount rate was applied for future benefits, but an assumed inflation rate of 7.74 % (average inflation 2006-2011
Excluded benefits • See figure 9 on page 30 for the list of identified but excluded benefits
Th
e lo
ng
road
to
resi
lien
ce. I
mp
act
and
cos
t-be
nefi
t an
alys
is o
f d
isas
ter
risk
red
uct
ion
in B
angl
ades
h.

12
Bre
akin
g th
e w
aves
. Im
pac
t an
alys
is o
f co
asta
l aff
ores
tati
on f
or d
isas
ter
risk
red
uct
ion
in V
iet
Nam
.
The long road to resilience / March 2012
3.RELEVANCE
SECTIO
N B | FINDINGS

To what extent has the CBDRR programme been relevant? This chapter answers this question by looking at the disaster risk context (3.1), the policy context (3.2) and the relevance to the beneficiaries in target communities (3.3).
3.1 Disaster risk context
With its densely populated low-lying and river zones, high poverty rates and extreme exposure to cyclones, storms and floods, multiple hazards and risks culminate in Bangladesh – making it one of the most disaster-prone countries in the world.
Bangladesh ranks as the most cyclone-prone and the sixth-most flood-prone nation, having 32.1 and 1.1 deaths per 100,000 people and year respectively (GoB 2010:5). Behind these figures stands an appalling alliance of hazards and risks that produce this high degree of vulnerability. On the hazard side, tropical cyclones develop in the Bay of Bengal each year, many of which find their way north to Bangladesh’s coastal areas.8 In addition, the country is both blessed and cursed by its 230 rivers, amongst them the massive Ganges-Bramaputra-Meghna system that feeds from the Himalayas. Both extreme rainfall and upstream snow melting cause regular floods that turn into severe disasters every five years on average – at times inundating around two thirds of the country’s landmass.
Aside from floods, cyclones and storms, Bangladesh is also exposed to earthquakes, droughts, riverbank erosion9, landslides, saline intrusion and high levels of arsenic in groundwater.10 Added the risk factors such as Bangladesh’s extreme population density (946/km2, the highest amongst non-city non-island countries) and poverty (according to the World Bank, 40% of the population live below the national poverty line) many remain vulnerable, living in precarious locations and often without adequate access to basic public services such as education and primary healthcare.
While the country has made advances in disaster preparedness and early warning and has experienced GDP growth of 6% over the past decade, the adverse impacts of climate change are set to pose a growing burden on the population. With the forecasted increase of cyclone frequencies and strengths, a rising sea-level and more irregular and extreme precipitation, the country braces itself for things to come (GoB 2010). It is the poor and vulnerable in particular that face growing risks, a circumstance that calls for investment and promotion of disaster-resilient support strategies.
Considering this background and the fact that the CBDRR programme specifically targeted particularly vulnerable communities along the river flood plains, the programme’s objectives are principally seen as highly relevant. Before examining the relevance of individual programme activities to the target communities more closely, it is worth to look at the policy context: to what extent has the programme been aligned with and in support of overarching policies?
13 Relevance:
"The extent to which the objectives of a
development intervention are consistent with
beneficiaries’ requirements, country
needs, global priorities and partners’ and donors’ policies."
OECD 2010:32
Figure 4: List of recent severe floods (GoB 2010:9)
Year Inundated area Deaths Economic damage
1984 50,000 km2 n/a USD 0.38 billion
1987 50,000 km2 2,055 USD 1.0 billion
1988 89,000 km2 2,000 - 6,500 USD 1.2 billion
1988 100,000 km2 1,100 USD 2.8 billion
2004 56,000 km2 700 USD 2.0 billion
2007 32,000 km2 649 USD 1.0 billion
8.
9.
10.
Out of 508 cyclones that developed in the Bay of Bengal over the past 100 years, 86 made landfall in Bangladesh (GoB 2008:21).
It is estimated that 8,700 ha of land are lost each year to riverbank erosion, displacing an annual 180,000 – 200.000 people (GoB 2009:5).
According to a study published in 2010, up to 77 Mio people may have been exposed to continuous arsenic contamination through groundwater obtained from wells (See Karagas 2010).
1
2
3
4
5
6
Th
e lo
ng
road
to
resi
lien
ce. I
mp
act
and
cos
t-be
nefi
t an
alys
is o
f d
isas
ter
risk
red
uct
ion
in B
angl
ades
h.

Map 2: Extent of flooding in 2007 14
Inte
rnat
ion
al F
eder
atio
n o
f R
ed C
ross
an
d R
ed C
resc
ent
Soci
etie
s

3.2 Policy context
Perhaps unsurprising for a country so severely exposed to hazards and experienced in disasters, Bangladesh has a well-established institutional and policy set-up regarding disaster risk management (DRM). The National Disaster Management Council (NDMC) as the highest organisational body is compounded by a wide array of committees, in several of which BDRCS holds an advisory function. Key guidance regarding DRM is presented in the government’s “Standing Orders on Disaster” (SOD, see GoB 2009). The SOD assign an explicit role to BDRCS, both for disaster risk reduction and disaster response – in point 5.6, it obliges BDRCS to “incorporate disaster risk reduction considerations into BDRCS policies, plans and programmes” (ibid:177). In adherence with national policy, in 2009 BDRCS devised a disaster risk management strategy (DRM Strategy 2010-2014), most of whose key result areas the CBDRR programme addresses.11 The programme is also seen as supportive to the UN International Strategy on Disaster Reduction (UNISDR) Hyogo Framework for Action (HFA), which Bangladesh has adopted. It directly addresses the priorities for action 3 (build understanding and awareness), 4 (reduce risk) and 5 (be prepared and ready to act).12 The programme also runs in support of the IFRC’s Strategy 2020 (See IFRC 2010a), in particular its strategic aim 1 (save lives, protect livelihoods, and strengthen recovery from disasters and crises). In sum, it is found that the CBDRR programme has been well-aligned with overarching strategies.
3.3 Relevance to programme communities
In general, interviewees and workshop participants from the five programme communities found the implemented activities highly relevant to address their needs. The set-up of institutional arrangements such as the CDMC, CDRT, Micro-groups and the establishment of community funds was widely seen as relevant in the sense that it enhanced community-level preparedness. The drilling of wells addressed the key concern of access to safe water; although most wells were drilled on private land, access was given to the entire communities. Raising of house plinths was regarded as very relevant by the beneficiary households, as it did improve their ability to secure their belongings during floods.
Results from control communities illustrate the relevance of disaster risk reduction: community members here identified the impact of natural hazards as one of the key reasons for deprived livelihoods.
As far as livelihood support is concerned, the distribution of productive assets, animals, seedlings and saplings was viewed as relevant to improve the immediate livelihoods of particularly vulnerable households. There appears to have been little dispute over beneficiary household selection: out of the three quarters that said they had been aware of the beneficiary selection criteria, 99% said they had been fair.
While in almost all cases13 the programme activities addressed community needs, not all community needs were addressed by programme activities. Two points need to be raised in this regard:
First, the programme came with a limited “menu” of pre-packaged goods - while VCAs usually revealed comprehensive vulnerability profiles and wide arrays of potential solutions, the CBDRR programme could only offer the limited range of interventions that had been planned beforehand. Several major concerns of the communities, such as sanitation, therefore remained largely unaddressed. Riverbank erosion in particular stands out as a threat high on communities’ priority list – however, no attempts were
15
11.
12.
13.
Result areas 1-4 (professionalization, capacity-building, local empowerment, preparedness and mitigation capability) are seen as addressed by the CBDRR programme to some extent. See BDRCS 2009:15).
For a brief overview of the HFA, see ISDR 2005.
A notable exception is the distribution of fishing boats in several communities where fishing stocks are almost depleted to the extent that many fishermen have abandoned their boats.
7
8
9
10
11
12
13
Th
e lo
ng
road
to
resi
lien
ce. I
mp
act
and
cos
t-be
nefi
t an
alys
is o
f d
isas
ter
risk
red
uct
ion
in B
angl
ades
h.

made by the programme to reduce erosion rates (e.g. through bamboo plantation), or to consult on issues of local and households` settlement priorities and areas of cultivation and land use. This has left communities` physical and economic exposure to riverbank erosion constantly high.
The second point regards livelihood resilience: with the exception of some income diversification, little was done to protect livelihoods from floods and other hazards. While the distribution of seedlings, saplings and productive animals improves the socio-economic situation in the short term, this distribution on its own does little to make the livelihood of households more hazard-resilient in the long term. Without better protection of paddy fields, for instance, the seeds/plants are likely to be washed away by the next major flood. We will return to this point when discussing impact in chapter 5.
In spite of the two points raised above, the CBDRR programme activities have been highly relevant to communities, and an overwhelming part of survey respondents judged that they had benefitted the majority of households (23%) or even the entire community (67%). Although in most communities the government and other NGOs (notably BRAC) provided support, there was no overlap, and activities of different actors were remarkably well aligned to each other.14 In most communities, BDRCS was the only organisation providing training.
Who benefitted from the actions implemented?[Respondents in programme communities, N=98]
Inte
rnat
ion
al F
eder
atio
n o
f R
ed C
ross
an
d R
ed C
resc
ent
Soci
etie
s
16
A man in one of the programme communities shows the level of the 2007 flood on his house.
For instance, livestock support was usually provided to programme communities – however, no livestock was provide to Purbolbaoitara, as an NGO had previously distributed 37 cows to the most vulnerable households.
14.
14
15
9%
23%
67%
Whole communityMajority of the communityA few households only

17 The long road to resilience / March 2012
4. EFFECTIVENESS

Following the review of the relevance of the CBDRR programme above, this chapter turns to its effectiveness, looking first at its management set-up (4.1) and then at individual activities.
4.1 Programme management
As the CBDRR programme has been implemented over seven years in its current design, its objectives and activities are well understood amongst BDRCS staff. Based on the information reviewed for this evaluation, the programme appears to also have been largely effective in reaching its objectives. Having that said, implementation encountered numerous delays that were caused by both external factors – such as the severe flood and Cyclone Sidr 2007 – and internal constraints.
Six such constraints have been identified concerning programme management: (1) incomplete planning, (2) inadequately short implementation periods, (3) a significant lack in monitoring, (4) insufficiency of programme staff, (5) the unmet need for consistently close communication between IFRC Delegation and BDRCS, and (6) an implementation modus that has been overly top-down in nature.
First, as pointed out in the 2009 evaluation, planning should have involved “the preparation of a comprehensive project document which includes the concepts behind the project, its overall strategies, the monitoring system, the indicators […], area selection criteria and guidelines […]” (Ragno 2009:35). Neither for the period 2005-2008 nor for the follow-up programme from 2009 to 2011 did such a document exist. Instead, planning was documented in logframes and annual plans of action, often without adequately specific indicators and without consistency in its terminology. For instance, the terms ‘objectives’, ‘outcomes’ and ‘results’ are used interchangeably across available programme documents; this point is not just a linguistic finesse but means that the programme has been void of explicit programme logic. The planning process also consistently failed to devise a strategy for a smooth exit towards programme conclusion. It is noteworthy that in spite of the recommendations in two earlier evaluations (Bhatt 2008:18; Ragno 2009:35), programme management appears to not have made any substantial progress in this regard. In order to avoid future gaps of explicit programme logics, a stronger focus should be put on the programme design from the outset of the planning phase. Programme planning should also be based on closer collaboration between National Society and Delegation.
The second constraint concerns the short implementation periods. Dubbed the “multiplicative approach”, BDRCS has been implementing programme activities in a limited number of communities over the course of one year before supposedly learning from that experience and proceeding to another set of communities. A project cycle extending over a mere twelve months is sufficient to establish CDMCs and CDRTs, provide basic training, distribute productive livelihood assets and implement certain small-scale mitigation measures – but it is found to be too short to provide sustained guidance, follow-up support and to demonstrate long-term benefits to communities. With one-year implementation periods, the programme is seen to severely constrain both the effectiveness and the sustainability of its investments, as will be further explored below. Hence, in order to provide sustained guidance and facilitate longer-term benefits, programme activities in a given community should be extended to a three-year period. Taking into account the capacities on the local and branch unit levels, needs in training and follow-up support need to be identified.
Third, the CBDRR programme has suffered from a lack of effective monitoring. Although the importance of adopting a monitoring strategy had been identified and In
tern
atio
nal
Fed
erat
ion
of
Red
Cro
ss a
nd
Red
Cre
scen
t So
ciet
ies
18Effectiveness:
"The extent to which the development intervention’s objectives were achieved, or are expected to be achieved, taking into account their relative importance."
OECD 2010:20
16
17
18
19
20
21

addressed in 2009 through the draft of a programme implementation guideline, BDRCS has neither adopted nor applied this guideline. The clear statement of specific objectives, measurable indicators, and the use of baseline and end-line studies are indispensable to measure progress. Unsurprisingly, the programme neither features regular progress reports nor an institutionalised process to identify “lessons learnt” and subsequently adapt and improve the programme design. The fact that the programme design has remained almost unaltered over the more than a decade (with the exception of the livelihood component added following the 2004 evaluation) in spite of multiple (and newly arising) challenges, and the fact that BDRCS keeps proposing it to donors for future funding, is seen as a logical consequence of this gap. BDRCS thus far lacks the tools and the culture of learning but will need to set them up if it wishes to improve its service delivery to the country’s most vulnerable.
Fourth, the CBDRR programme appears to have suffered from management constraints. While it has been overseen by a BDRCS director, this position also requires a multitude of other responsibilities apart of managing the CBDRR programme. Thus, not as much time could be devoted to the programme as eventually would have been the case if a full-time programme manager had been assigned. In the director’s absence, decision-making was put on hold rather than delegated, causing the programme sustained delays. Hence, ways should be found as to how programme management can be made more effective in the future. Three conceivable options are the assignment of a full-time programme manager, a stronger differentiation between director and managing positions, and a clearer structuring of means and ways of cooperation between IFRC Delegation and BDRCS.
For now, this collaboration and communication between IFRC Delegation and National Society remains improvable - a circumstance seen as a fifth constraint. Consistently close collaboration should be aimed for. While this may require more meetings and thus add to the busy schedules of IFRC and BDRCS staff involved, the importance of a closer partnership cannot be overstated: first, closer communication is likely to streamline programme management. Second, by working more closely in tandem, capabilities of all involved are likely to evolve through mutual learning - and may well it contribute to the organisational development of BDRCS.
19
Figure 5: Actors and processes
IFRCCountry Delegation
BDRCSHQ DM Division
BDRCSUnit
Relief: UDRT
CDMCwith Micro-groups
Relief: CDRT
national level
district level
community level
Th
e lo
ng
road
to
resi
lien
ce. I
mp
act
and
cos
t-be
nefi
t an
alys
is o
f d
isas
ter
risk
red
uct
ion
in B
angl
ades
h.
supports, funds
reports
supports, funds
supports, funds
reports
reports
22
23

A final constraint is found in the top-down nature of the CBDRR programme. Conceptually, risk assessments should lead to the identification of possible interventions. However, while the VCAs were conducted under the CBDRR programme in 20 communities between 2005 and 2009 and in all 16 programme communities served between 2009 and 2011, the needs identified through these VCAs were not fully addressed because the solutions had already been determined in a pre-packaged set of activities. VCAs thus served to answer the question “how can we implement our programme in this community” rather than “how can we best address the community needs?” This point is crucial and has severe ramifications: With many needs such as riverbank erosion remaining untackled, and with BDRCS overriding solutions that had been suggested by community members, the potential in local ownership and effectiveness towards building resilience and preparedness has remained somewhat un-utilised.
Future DRR programmes should start off with a more flexible framework, select target areas, conduct VCAs and then use the VCA results as a basis for more concrete planning, based on close coordination and support by the unit - or, at best, national-level BDRCS staff. This way, a programme would not just involve community-based implementation but also community-based planning.
4.2 Individual activities
Generally, most activities implemented through the CBDRR programme have been effective and reached their objectives. Micro-groups, CDMCs and CDRTs meet monthly and work well; across all five programme communities visited, CDMCs and CDRTs have their supposed strength of 25 and 16 respectively, and members show a high level of commitment. Disaster emergency funds are well-established and managed. Awareness-raising activities, training courses and simulations were widely described as effective.
Small-scale mitigation measures, which in other DRR programmes are usually community-based and geared to benefit the majority of the community (e.g bridges, dams, flood canals, shelters), were centred around upgrades to private houses in the BDRCS programme (raising of house plinths, latrine upgrades) and thus had an immediate benefit only for the beneficiary households. However, as stated above, there were little disputes over beneficiary selection. The construction of wells and, in one community, of a bamboo bridge and a road, were seen as effective for entire communities.
Although the implementation of CBDRR activities has been largely effective, they were designed to deliver tangible results that can be easily monitored. However, none of these activities were geared to raise the long-term hazard resilience profoundly. Thus, there is clear room for improving long-term implementation, particularly in the context of climate change adaptation.
Inte
rnat
ion
al F
eder
atio
n o
f R
ed C
ross
an
d R
ed C
resc
ent
Soci
etie
s
2024
25
26
27
28

21 The long road to resilience / March 2012
5. IMPACT

In spite of the constraints identified above, the CBDRR programme created a significant impact, as the comparison of target communities with control communities reveals.
Figure 6 shows the results of the eight workshops held in programme and control communities concerning perceived living conditions. Workshop participants were asked to rate their living conditions for each year between 2006 and 2011; their responses are shown as numerical values between +2 (very good) and -2 (very bad). In all communities, there is a clear dip in 2007, representing the effect the severe flood and Cyclone Sidr have had in that year. The figure suggests three key hypotheses regarding impact:
First, that perceived living conditions are significantly better in programme than in control communities, despite the programme communities’ lower baseline value.
Second, that programme communities were able to recover more quickly from the 2007 floods than control communities.
Third, that programme communities are more resilient to hazards than control communities: based on improved disaster preparedness, they are more capable to cope with minor hazards (e.g. torrential rains, storms and seasonal floods) than control communities, as can be seen from the differences in the two graphs from 2008/2009 onwards.
However, taken on its own, the figure merely shows a correlation between living conditions and the CBDRR programme. In order to establish causality - that is to confirm that the CBDRR programme has had an impact - the observed changes need to be attributed to the programme. In other words, the change produced by the programme needs to be filtered out of the overall changes, many of which are due to other interventions by the government, other NGOs, or the private sector. The results of the household survey as well as of the more detailed insights obtained through workshops held in the eight inspected communities serve this purpose. In
tern
atio
nal
Fed
erat
ion
of
Red
Cro
ss a
nd
Red
Cre
scen
t So
ciet
ies
22
Figure 6: Change of perceived living conditions 2006-2011
-2
-1.5
-1
-0.5
0
0.5
1
2006 2007 2008 2009 2010 2011
Programme communitiesControl communities
+ 2 Very good+ 1 Good 0 Normal -1 Bad -2 Very bad
Source: results from eight workshops, during which participants were asked to rate their living conditions for each year between 2006 and 2011.
Key
Impacts:
"Positive and negative, primary and secondary long-term effects produced by a development intervention, directly or indirectly, intended or unintended."
OECD 2010:24
29
30
31
32
33
34

Overview of observed changes of conditions in all visited communities. Figures are the results of workshops, where participants were asked to rate aspects of their conditions as either very bad (-2), bad (-1), normal (0), good (+1) or very good (+2). The figures on the left side of each community show the baseline (2006, top) and end-line (2011, bottom) values, whereas the figures on the right side represent the change between 2006 and 2011. The red signs mark the impact of the CBDRR programme as perceived by workshop participants: (+) equals a positive, (++) a very positive, and no sign no impact. No negative impacts of the CBDRR programme were mentioned.
Programme communitiesProgramme communitiesProgramme communitiesProgramme communitiesProgramme communitiesProgramme communitiesProgramme communitiesProgramme communitiesProgramme communitiesProgramme communitiesProgramme communities Control communitiesControl communitiesControl communitiesControl communitiesControl communitiesControl communitiesControl communities
Community Ananda BazaarAnanda Bazaar
Char Mayesha
Char Mayesha
TaraiTarai PaikparaPaikpara Purbol-baoitaraPurbol-baoitara
Overall NiklagopalNiklagopal South Digalkandi
South Digalkandi
HoakowaHoakowa Overall
District ChandpurChandpur ChandpurChandpur TangailTangail SirajganjSirajganj SirajganjSirajganj TangailTangail BograBogra BograBogra
Basic information
Population 1,9181,918 1,7461,746 2,7202,720 1,9281,928 3,0003,000 11,312 1,7001,700 3,0003,000 7,0007,000 11,700
Number of households 361361 381381 477477 422422 356356 1,997 250250 498498 800800 1,548
Survey sample size 2222 2525 2626 2525 2525 123 2525 2525 2121 71
Poverty rate (estimated) 7070 7070 8585 8080 7070 75.31 7070 7878 n.a.n.a. 75.10*
% of HH VGF beneficiaries 3.873.87 15.7415.74 6.286.28 2.842.84 1.681.68 8.41 4.804.80 8.438.43 n.a.n.a. 8.02*
BDRCS DRR support 2005-20092005-2009 2005-20102005-2010 2005-20112005-2011 2005-20082010-20112005-20082010-2011
2005-20082010-20112005-20082010-2011
nonenone nonenone nonenone
Observed changes 2006-11
Overall living conditions +3+3 +2+2 +2+2 +1+1 +2+2 +2 +1+1 00 -1-1 0
Basic living conditions +3.28+3.28 +1.57 +1.57 +1.42+1.42 +1.71+1.71 +1.85+1.85 +1.97 +0.67+0.67 +1.00+1.00 +0.86+0.86 +0.86
Housing -1+2
+3(+)
0+1
+1(+)
-1+1
+2(+)
-10
+1(+)
-1+1
+2 +1.80 0+1
+1 -1+1
+2 -1+1
+2 +1.67
Food security -1+1
+2(+)
0+1
+1 -2-1
+1(+)
-1+1
+2(+)
0+1
+1(+)
+1.40 -10
+1 -10
+1 00
0 +0.67
Income -1+2
+3(+)
00
0(++)
-1-1
0(+)
-1-1
0(+)
-1+1
+2(+)
+1.00 0-1
-1 0-1
-1 00
0 -0.67
Drinking water -2+2
+4(+)
-2+2
+4 -1+2
+3(++)
-1+2
+3(+)
-1+2
+3(+)
+3.40 0+1
+1 00
0 0+1
+1 +0.67
Sanitation -2+2
+4(+)
-1+2
+3(++)
-1+1
+2(+)
-1+1
+2(+)
-1+1
+2(+)
+2.60 0+1
+1 -1+1
+2 0+1
+1 +1.33
Health -2+2
+4(+)
0+1
+1(++)
-1-1
0(++)
-1+1
+2(+)
-10
+1(+)
+1.60 0+1
+1 -10
+1 0+1
+1 +1.00
Education -1+2
+3 0+1
+1 -1+1
+2 -1+1
+2 -1+1
+2 +2.00 0+1
+1 -1+1
+2 0+1
+1 +1.33
Security +1.50+1.50 +1.50+1.50 +1.50+1.50 +0.50+0.50 +1.50+1.50 +1.35 +1.00+1.00 +0.33+0.33 0.000.00 +0.16
Social security -2+1
+3(+)
0+2
+2 -1+1
+2(+)
-1+1
+2(+)
-1+1
+2(+)
+2.40 0+1
+1 0+1
+1 0+1
+1 +1.00
Crime rate 0+1
+1 +1+2
+1 -1+1
+2 -10
+1 -1+1
+2 +1.40 n.a. n.a. 00
0 0.00
Access to land 0-1
-1 -10
+1 -2-2
0 1-2
-3 0-1
-1 -0.80 n.a. -1-1
0 +1-1
-2 -1.00
Disaster preparedness -2+1
+3(+)
-1+1
+2(++)
-1+1
+2(+)
-1+1
+2(+)
-2+1
+3(+)
+2.40 -10
+1 -1-1
0 0+1
+1 +0.67
Governance +2.00+2.00 +2.00+2.00 +1.00+1.00 +2.00+2.00 +1.50+1.50 +1.70 +1.00+1.00 +2.00+2.00 0.000.00 +1.00
Public participation -1+1
+2(+)
-1+1
+2 -1+1
+2 -1+1
+2(+)
-1+1
+2(+)
+2.00 0+1
+1 -1+1
+2 -1-1
0 +1.00
Accountability -1+1
+2 0+2
+2 -1-1
0 -1+1
+2(+)
-10
+1(+)
+1.40 0+1
+1 -1+1
+2 00
0 +1.00
Average change (of all criteria) +2.54+2.54 +1.61+1.61 +1.38+1.38 +1.38+1.38 +1.77+1.77 +1.74 +0.82+0.82 +1.00+1.00 +0.46+0.46 +0.67
23 Figure 7: Overview of observed changes between 2006 and 2011
Th
e lo
ng
road
to
resi
lien
ce. I
mp
act
and
cos
t-be
nefi
t an
alys
is o
f d
isas
ter
risk
red
uct
ion
in B
angl
ades
h.

According to the survey respondents in programme communities, the CBDRR programme had a positive (65%) or very positive (32%) impact on the preparedness of their households. Similarly, respondents found that the programme had positively (72%) or very positively (23%) impacted on the preparedness of their communities. According to survey respondents, the programme also had a positive (71%) or very positive (13%) impact on their household income. Combined with a close look at workshop results, where participants were asked first to rate changes in several aspects of their living conditions and then rate attributions to the CBDRR programme, the three hypotheses are confirmed.
Workshop results (see figure 7) reveal that the CBDRR programme had a strong, direct and positive impact on disaster preparedness, housing conditions, food security, income, drinking water and sanitation. Furthermore, indirect positive impacts were found on health, social security, public participation and accountability. Notably, no major negative impacts of the programme were identified during the workshops.
Meanwhile, the CBDRR programme failed to address one of the most critical problems that communities endure: access to land. Due to increasingly high rates of riverbank erosion, the size of arable land in communities is shrinking. In four out of five programme communities, conditions have worsened over the past six years – of all analysed criteria, access to land is the only one that witnesses a negative trend. Future programmes therefore need to address this issue to reduce vulnerability more comprehensively, either by finding ways to reduce erosion rates, by creating alternative and diversified livelihoods in particular for affected farmers, or by a combination of both.
While the overall analysis shows with confidence that the CBDRR programme has impacted positively on disaster preparedness and livelihoods, it should be noted that actual impacts varied considerably between communities. The impact analysis thus goes deeper in the following parts – first looking at how the programme impacted towards a reduction of disaster risk (5.1), then analysing the impact towards enhanced livelihoods (5.2).
5.1 Impact towards reduced disaster risk
Community development served as the entry point through which the programme created an impact: The VCA process and the establishment of micro-groups, CDMCs and later CDRTs has enhanced the quality with which the programme communities organise themselves; it has also provided the platform on which other activities were built. Risk awareness as well as knowledge as to how households can better prepare for the onslaught of hazards has been raised through information shared at the meetings of the newly created institutions.
The stark contrast between programme and control communities supports this observation: while the creation of community groups through the CBDRR programme is highly valued as enabling collective action, facilitating mutual support, and enhancing security, control communities pointed out that the lack of effective community organisation was the chief reason behind ineffective community preparedness. Remarkably, the increase in public participation in programme communities has had two spill-over effects: participation appears to have increased more broadly beyond the realm of DRR. As an indirect result, community members also observed that the accountability of local government units had slightly improved. There is a contrast in the perception of individual versus community preparedness between programme and control communities. In control communities, people mark In
tern
atio
nal
Fed
erat
ion
of
Red
Cro
ss a
nd
Red
Cre
scen
t So
ciet
ies
2435
36
37
38
39
40
41
Has your level of [disaster] preparedness changed over the past five years?
Positive changeNo changeNegative change
14%
2%
84%
6%
41% 54%
Programme communities [N=121]
Control communities [N=71]
Have these [BDRCS-supported] actions changed your level of preparedness for future disasters?
Programme communities [N=98]
2%1%
65%
32%
Very positive impactSomewhat positive impactNo impactNegative impactNo answer
Based on these [BDRCS-supported] actions, has your income changed in any way?
Programme communities [N=98]
1%1%
13%
71%
13%
Very positive impactSomewhat positive impactNo impactNegative impactNo answer
Selected household survey results. See the full results in appendix B.

their individual preparedness relatively higher than community preparedness, while the order is reversed in programme communities. While this observation could not be fully explored, a likely explanation is that in programme communities, people witness the proactive measures towards community preparedness (and view this as high), while at the same time being more aware of the risks they are exposed to, without the capability to always enhance their own household preparedness (which they thus rate as lower). After all, it should be recalled that the programme provided household preparedness and risk mitigation measures only to selected households.
Having raised risk awareness and built knowledge as to how households can better protect and prepare themselves triggered investments that households would not have made in the absence of the CBDRR programme. For instance, after having seen the raising of house plinths supported for 10 selected vulnerable households in Ananda Bazaar, 80 more households decided to raise their plinths with their own resources. More broadly, the CBDRR programme enabled community members to assess risks better and to adapt their behaviour accordingly.
The set-up of community disaster emergency funds has impacted on social security and indirectly on accountability. In all programme communities, the majority of households now pay BDT 2 (CHF 0.02) per month into the funds, which currently hold reserves of BDT 50,000 (CHF 620) to 90,000 (CHF 1,115). The fund can be used for repairs and relief after a disaster, as well as to cover maintenance (e.g. of tube wells) costs and livelihood support – however, agreement amongst communities needs to be reached before expenditures can be made. Any withdrawal requires authorization by three assigned individuals. Having in-built checks and balances represents a remarkable progress over the way the government usually distributes relief goods, which is often seen as in-transparent and unfair.15
The construction of tube-wells raised access to drinking water for entire communities, and has indirectly impacted on health conditions. Of all criteria evaluated, the improvement of access to water was judged as most positive.
Training and awareness-raising in health and sanitation was seen as having had a major impact – for instance, in the community of Char Mayesha, many people had learned for the first time about basic concepts of hygiene and sanitation, such as boiling water before drinking to prevent diarrhoea. The upgrading of latrines for 100 households in one community was also seen as having a very positive impact.
In two cases where the CBDRR programme funded the construction of access and evacuation routes (a small bamboo bridge and one kilometre of road), a positive impact was detected towards income and risk reduction.
Generally, programme communities showed to be more resilient to natural hazards: they recovered more quickly and more comprehensively from the 2007 floods than control communities and suffered a much less significant set-back from the minor floods encountered between 2008 and 2011, at least as far as physical damages are concerned.
5.2 Impact towards enhanced livelihoodsThe impact the CBDRR programme has produced on livelihood was created through two channels: First, improved community organisation, access to drinking water, health, sanitation and disaster preparedness all had an indirect positive impact on food security and income; we will return to this aspect in the next chapter. Second, the actual livelihood component had an impact on livelihoods that differed significantly between the various investments made.
25
In one community, government practice after the 2007 flood was particularly criticized as unfair, as the local union chairman allegedly had distributed items to his friends and colleagues.
15.
Th
e lo
ng
road
to
resi
lien
ce. I
mp
act
and
cos
t-be
nefi
t an
alys
is o
f d
isas
ter
risk
red
uct
ion
in B
angl
ades
h.
42
43
44
45
46
47
48

Generally, the focus of the programme rested on the enlargement of beneficiaries’ asset base rather than on diversifying sources of income or creating livelihoods that are better adapted to risk patterns and that would lead to greater livelihood resilience. As opposed to risk reduction investments (which saw trickle-down effects beyond immediate beneficiaries), the impact of livelihood support has been limited to its direct beneficiaries.
The distribution of cows, chicken, ducks, as well as that of vegetable seeds, has significantly raised the income of recipient households and reduced their vulnerability - for instance, in some cases rice production went up by more than 20%. Sewing machines were also seen as raising the livelihood of recipient households.
The planting of fruit trees has yet to create an impact – however, while the collection of their fruits is set to increase subsistence for a limited time, most workshop participants said they would cut the trees once they had matured after 8-10 years in order to sell its timber. The impact is therefore seen as very limited and can only be seen as a one-off effect.
The impact of the distribution of rickshaws, fishing boats and nets is fairly low: despite BDRCS findings that have identified the role of rickshaws for income-generation, this study finds that the rickshaws are rarely used to make money, but for personal transport of goods. Given the high competition between rickshaw drivers, community members said that not much money could be generated with the new vehicles. In the case of fishing equipment, the fact that many fishing stocks are almost depleted renders them almost useless to generate income. In fact, several fishermen have abandoned their boats in search of alternative income sources.
Inte
rnat
ion
al F
eder
atio
n o
f R
ed C
ross
an
d R
ed C
resc
ent
Soci
etie
s
26
49
50
51

27 The long road to resilience / March 2012
6. EFFICIENCY

Having discussed the impact the CBDRR programme has created, let us turn to the question as how this impact translates into efficiency. To do so, this chapter ascribes a monetary value to the identified impact (as much as feasible), and divides this value by the related costs. Such a cost-benefit analysis is conducted for four communities, two each of which had originally been supported by HKRC (Ananda Bazaar and Char Mayesha) and DFID (Tarail and Purbolbaoitara).16
The chapter begins with a calculation of costs (6.1), proceeds to the monetization of benefits (6.2) and concludes with the calculation of benefit-cost ratios (6.3). As the analysis of the CBDRR programme encountered numerous challenges, figure 10 at the end of the chapter provides recommendations as to how future CBAs could be designed to overcome some of these challenges.
6.1 Costs
Between 2005 and 2011, a total of CHF 1,511,595 has been spent on the CBDRR programme, consisting of (a) DFID funds of CHF 332,695 (2005-2008), (b) HKRC funds of CHF 700,746 (2005-2009), and (c) IFRC/GADRR funds of CHF 478,154 (2009-2011; see figure 2 on page 5). Since no annual expenditure overviews were available, which would have allowed for a translation of original expenditures to their present value, these provided figures had to be taken as present value.
In order to calculate benefit-cost ratios per community, the proportion of the total costs that were incurred for a particular community need to be identified. However, since financial reports do not provide consistent attribution of expenditures to communities, informed estimates were deployed for this study: For the DFID and HKRC periods, it is assumed that 80% of the total costs were incurred in those 20 communities (10 DFID, 10 HKRC) in which VCAs and substantial follow-up implementation in risk reduction and livelihood support were implemented - and that by implication, the remaining 20% were incurred in the other 52 communities that saw only very limited support.
The 80% of costs are then divided by the number of ‘VCA communities’ (10 DFID, 10 HKRC). This results in an amount of CHF 26,615 that was spent on each DFID ‘VCA community’ and CHF 56,059 on each HKRC ‘VCA community’. Note that these figures include all proportional costs such as overheads.
In three out of the four communities inspected (all but Ananda Bazaar), programme activities were continued between 2009 and 2011 - thus, the proportional costs of this phase need to be added. Since all 16 communities that were supported during this phase saw a similar composition of activities, the overall costs for this IFRC/GADRR funded phase can be divided by 16, with the result of CHF 29,884 being added to the costs for each of the three communities. The sum of proportional DFID or HKRC costs and IFRC/GADRR costs thus comes to overall costs per community between CHF 56,059 (Ananda Bazaar) and CHF 85,944 (Char Mayesha; see figure 8 overleaf).
Needless to say, these sums are rough estimates that assume an equal distribution of costs between communities. But in the absence of more detailed financial figures, they are the only feasible option. The evaluators have attempted to supplement data directly from the communities. However, this information bears limited value for two reasons: It is calculated on the basis of average prices for certain items 17, and it is limited to material support (see figure 8, ‘material support’). No information could be obtained on the costs of workshops, simulations, training courses, and office upgrades - this explains the significant disparity between material support and overall costs; it should thus not be assumed that the difference was attributable to mere overhead. In
tern
atio
nal
Fed
erat
ion
of
Red
Cro
ss a
nd
Red
Cre
scen
t So
ciet
ies
28Efficiency:
"A measure of how economically resources/inputs (funds, expertise, time, etc.) are converted to results."
OECD 2010:21
52
53
54
55
56
57
58
A fifth community visited for this evaluation, Paikpara, is left out of this analysis. Since there was a wide array of organisa-tions supporting risk reduction and livelihood, the identification and monetization of benefits attributable to the CBDRR programme would have required more substantial research.
Prices (in BDT) used for the calculation of material support are as follows:
House plinths Well, shallow Well, deep Latrine upgrade 1km of road Cash grants Tree saplingHybrid rice setCow Goat Chicken/duck Sewing machine Weaving machine Rickshaw Fishing boat
16.
17.
1,50012,00080,0001,000
235,0003,000
5500
11,0001,700
1006,000
12,0002,000
14,000

6.2 Benefits
While the attribution of costs to communities proved difficult, the real challenge lies in the monetization of benefits. In order to obtain a ‘true’ picture of the benefits, all impacts identified in chapter 5 would have to be quantified, monetized and extended over a time horizon that would reflect the realistic life span of such impacts. However, in many cases such quantification was not feasible, so that these benefits had to be excluded from the calculation. (see figure 9).
Benefits included that could be included fall into the two categories of protective benefits and direct economic benefits.
Protective benefits relate mainly to the raising of house plinths. As all four communities said that a 2012 flood similar to the one in 2007 would cause less destruction of houses and contents (a reduction by 10-30%), this avoided risk represents a benefit that could be used in two ways: First, the difference between damages in 2007 and the hypothetical damages in 2012 is the protective benefit value as described under point B in figure 8 above. Second, this value was multiplied by the annual probability of such a flood recurring (every five years, annual probability rate of 20%) to establish the annually avoided risk. This amount was then multiplied by the number of years of the expected lifespan (of 15 years) and adjusted for inflation over the years up to 2025, resulting in the values listed under point C in figure 8. 18
Direct economic benefits used in the calculation mainly relate to the distribution of hybrid rice seeds that led to a considerable yield increase in the communities. The majority of these seeds were delivered after the 2007 flood, so a standard was used that put 2008 as the first year of yield increase. Since only the overall yield increase was available, it should be noted that this study assumes a linear increase between 2008 and 2011. The total yield increase between 2008 and 2011 was then put as the
29
Th
e lo
ng
road
to
resi
lien
ce. I
mp
act
and
cos
t-be
nefi
t an
alys
is o
f d
isas
ter
risk
red
uct
ion
in B
angl
ades
h.
59
60
61
62
Community Ananda Bazaar Char Mayesha Tarail Purbolbaoitara
District Chandpur Chandpur Tangail Sirajganj
Population 1,918 1.746 2,720 3,000
Households 361 381 477 356
Intervention timeframe 2005-2009 2005-2010 2005-2011 2005-2011
Material support, CHF 6,904 14,123 6,223 11,200
A. Total costs, CHF 56,059 85,944 56,500 56,500
B. Protective benefit value (hypothetical 2012 incidence)
1,023 20,458 10,385 12,323
C. Protective benefit value (15-year projection)
9,438 188,747 95,813 113,693
D. Direct economic benefit value (materialised)
161,538 80,769 161,538 150,769
E. Total benefit value (present; B+D)
162,561 101,227 171,923 163,092
F. Total benefit value (15-year projection; C+D)
170,976 269,516 257,351 276,785
G. Benefit-cost ratio 1 (present; E/A)
2.90 1.18 3.04 2.89
H. Benefit-cost ratio 2 (15-year projection; F/A)
3.05 3.14 4.55 4.90
Figure 8: Estimated costs and benefits in selected communities
An inflation rate of 7.74% was used, representing the average inflation over the years 2006 to 2011. Note that no discount rate was applied, as it is seen as inappropriate in the context of risk reduction: (high) discount rates lead to an over-valuation of the present over future risks.
18.

direct economic benefit as listed in point D of figure 8. While this benefit has already been materialised, the study refrains from projecting such benefits into the future (see figure 9).
One point concerning protective benefits requires special attention: Out of the quantifiable damages caused by the 2007 flood, by far the greatest damage arose through the destruction of paddy fields and harvest - these damages exceed the sum of all other quantifiable damages three to ten times. Unfortunately, the CBDRR programme did not include any measures that would substantially reduce the flood-induced destruction of paddy fields. As a result, community members estimated that the damage caused by a hypothetical 2012 flood would be same as in 2007. This point is a call to action for future DRR programmes: If flood-induced paddy field destruction could be reduced, this could make a far greater difference to community resilience than the measures chosen by the current CBDRR programme.
6.3 Benefit-cost ratiosHaving identified the costs and (quantifiable) benefits in each of the four communities, the benefit-cost ratios (BCR) can now be calculated by dividing benefits by costs. The study provides two BCRs: BCR 1 (point G in figure 8) describes the efficiency to date - on the benefit side, it includes avoided risk to date as well as direct economic benefits. BCR 2 (point H in figure 8) adds the expected risk avoidance over the coming 15 years.
Inte
rnat
ion
al F
eder
atio
n o
f R
ed C
ross
an
d R
ed C
resc
ent
Soci
etie
s
30
63
64
Identified but excluded benefits Reason for exclusion
Improved community development; gains in participation and transparency
Non-quantifiable: While improved community cohesion is found to be a key impact of the programme, it is impossible to quantify it as such.
Greater sense of security Non-quantifiable: A greater sense of security has a significant potential to enhance quality of life, a circumstance that many community members confirmed. The disaster emergency play an important role in this regard. Unfortunately, such a benefit can not be adequately quantified and monetized.
Lives saved, injuries avoided Non-monetisable: Although data exist about casualties in the 2007 flood (eight persons killed across the four communities), the lack of a comparable flood after the programme conclusion renders a calculation of saved lives and avoided injuries impossible. Even if there was a comparable flood, the monetization of saved lives would stand against the principles of the RC/RC Movement.
Having said that, it is recognized that saved lives and avoided injuries or disabilities are not only the greatest potential social benefit, but would likely be the biggest financial benefit: If one valued a saved life by multiplying median annual income with half the number of economically productive years, a single saved life would exceed all other benefits identified in this study.
Hybrid vegetable seeds: future benefits Non-quantifiable: While the yield gains attributed to the programme’s distribution of hybrid rice seeds between 2008 and 2011 have been included in the calculation, the study refrains from extrapolation of these benefits into the future.
This is due to the conviction that any major flood in the future is highly likely to destroy all gains; while the absence of a major flood over the next 15 years would imply tremendous gains, a flood in 2012 would annul such gains. Considering that a major flood is more likely than not in the near future (based on Bangladesh’s flood history), and that no steps have been taken to better protect paddy fields, any potential future benefits from hybrid rice seeds have been excluded from the calculation in this study.
Other livelihood support benefits Lack of data/time: Although benefits from the distribution of productive animals and assets have been identified, they could not be comprehensively quantified due to a lack of time that would have been required.
Improved health conditions /access to water / sanitation
Lack of data/time, high complexity: As presented in the previous chapter, the CBDRR programme has been hugely successful in improving health, water and sanitation conditions. However, in order to quantify (and monetize) these gains, health conditions would have needed to be assessed in baseline and endline surveys.
Figure 9: List of benefits excluded in the CBA

All BCRS are above 1.0 since the quantifiable benefits exceed the costs in all four communities. In economic terms, the investments have thus been worthwhile.
Considering the findings of the previous chapter, it can be said with great confidence that the ‘real‘ benefit-cost ratio is much higher. The ‘real-world‘ benefits to programme communities are significantly greater than reflected in the identified ratios. Notably, no negative impacts or ‘disbenefits’ have been identified.
A more comprehensive and more sound depiction of of costs and benefits should be attempted in future cost-benefit analysis to capture the value of disaster risk reduction more fully. The IFRC and Movement partners should thus strive to enable conditions for such improvements. Figure 10 provides practical steps into this direction.
While it is found that the CBDRR programme has been efficient, it should be reiterated that it could have been far more efficient: For instance, if it had incorporated measures to better protect paddy fields and agricultural assets from flood damage, the benefits would have been far greater, very likely in excess of the additional costs.
As this report will demonstrate in the following chapter, the programme could have also been made more efficient by generating benefits that are more sustainable and long-lasting.
31
Th
e lo
ng
road
to
resi
lien
ce. I
mp
act
and
cos
t-be
nefi
t an
alys
is o
f d
isas
ter
risk
red
uct
ion
in B
angl
ades
h.
65
66
67
68
69

The challenges encountered in this cost-benefit analysis should be a call to action and re-consideration for future CBAs. The following four suggestions may be considered to improve quality and meaningfulness of such studies:
When to conduct a CBA - and when notImpact and cost-benefit analyses in the context of disaster risk reduction should be conducted well after the conclusion of main programme activities. To properly ascribe protective benefits, two comparable hazards must surround the programme - e.g. one flood should have occurred after the conclusion that was similar in force to one before the beginning of the programme. A second reason to leave some time between programme conclusion and the timing of an impact analysis/CBA is that many impact take more time to fully unfold. The IFRC should conduct a mapping exercise to identify suitable programmes. No CBA should be conducted without two surrounding hazards.
Making CBAs comparable The CBA’s blessing may be a curse in disguise: Expressing a complex finding in the numerical value of the BCR often tempts invalid comparisons: Considering the huge difference in assumptions, time horizons, and included benefits, a simple comparison between BCRs found across different studies is misleading (for an example, see IFRC 2010:11). IFRC should establish a minimum standard that should be adhered to across all CBAs it commissions. The guidance thus far provided by the IFRC (ibid) should thus be updated and be made more specific. The recommendation that impact and cost-benefit analysis should be conducted separately should be revised - in the authors view, it makes perfect sense to combine the two aspects, provided that adequate capacity is allowed for.
Improving data: costsIFRC has direct leverage over the quality of financial data it produces, and should aim to provide data attributable by year and location/community. Over the long term, IFRC should thus consider to update its booking system in such a way that all costs incurred in a particular community can be summarized. If this is done for all communities, the proportional attribution of overhead costs presents no further challenge. Data should furthermore be traceable to the year they were incurred - this will allow for proper calculation of costs at present value. It is important that financial data are available for at least ten years in order to make post-programme evaluations as described above possible.
Improving data: benefitsBenefits can best be quantified if a sound monitoring and evaluation system is given. In particular, the importance of baseline studies should be highlighted: without adequate baselines, the quality of CBAs will inevitably suffer. Much more attention to the preparation of baseline surveys should therefore be paid than it is current practice. National Societies should therefore aim to significantly raise their monitoring and evaluation capacities.
Inte
rnat
ion
al F
eder
atio
n o
f R
ed C
ross
an
d R
ed C
resc
ent
Soci
etie
s
32Figure 10: Considerations for future cost-benefit analyses

33 The long road to resilience / March 2012
7. SUSTAINABILITY

The sustainability of an intervention largely depends on a strong sense of local ownership - local actors’ willingness and capacity to continue running or maintaining the intervention’s results. Neither willingness nor capacity is a fixed given.
Willingness can be maximized by meaningfully involving target groups from early on, by developing activities that address beneficiaries’ most urgent needs, and by creating incentives for a high sense of ownership, for instance by requiring financial or in-kind contributions. Local actors’ capacity - skills and know-how as well as material and financial resources - can similarly built up to an extent. However, any sustainable programme must be adapted to local ground conditions and will not overburden local communities.
The sense of local ownership of CBDRR programme achievements is seen as high - the regularity with which CDMC, micro-group and CDRT meetings are held and the continued flow of a majority of households to the disaster emergency funds are indicative. Since the newly established groups serve as a platform on which all other activities were built, their sustainability is pivotal to the endurance of all other achievements. Yet, the sustainability of these groups is all but guaranteed: for one, the role of the community organizers, one of which is paid by BDRCS in each commune, is likely to diminish once their salary support runs out. The functioning of these groups also depends on strong individuals that lead these groups – the death or disinterest of such a person can have severe ramifications for sustainability.
Niklagopal community holds an insightful episode regarding sustainability of these groups. While this community in Tangail district was not part of the CBDRR programme and was visited as a control location, BDRCS had provided support here under the previous CBDP programme. In the early 2000s, a CDMC and CDRT had been established. As the programme concluded in 2005, the CDMC became dysfunctional and collapsed. The CDRT still held irregular meetings for another three years before it faded into oblivion. The contact to the district BDRCS unit broke down. There is reason to believe that the communities supported between 2006 and 2011 may share the same fate sooner or later – unless follow-on support is provided. Such support does not necessarily have to include material means but should at least entail regular visits by the BDRCS unit and refresher training when needed.
The foundation is there - the strong motivation of CDMC and CDRT members should be seen as a valuable asset that is worth to maintain. It is worth noting that the reason behind this strong sense of local ownership is that BDRCS got many things right: it listened to the voices of communities and addressed most of their concerns as much as the pre-planned programme allowed. It required material and labour contributions rather than just handing out complete products. And with the disaster emergency funds, it set up a tool that is – literally – an investment in preparedness.
Nonetheless, there are two items that could have enhanced sustainability had they been conceptualized differently: First, with a more flexible approach to planning, BDRCS may have been able to address the communities’ key concern of riverbank erosion. That way, the programme benefits to communities would have been greater, the maintenance of whom would have been seen as a worthwhile investment. Second, the programme should have involved a consolidation period of two to three years. Following the set-up of institutions and implementation of activities, the consolidation period would not entail major investments but merely provide technical support (maintenance, refresher training) and sustained guidance. Crucially, such an extended period would allow for communities to better see the full benefits of the programme.
Inte
rnat
ion
al F
eder
atio
n o
f R
ed C
ross
an
d R
ed C
resc
ent
Soci
etie
s
34Sustainability:
"The continuation of benefits from a development intervention after major development assistance has been completed. The probability of continued long-term benefits. The resilience to risk of the net benefit flows over time."
OECD 2010:36
70
71
72
73
74
75

As far as the sustainability of individual results is concerned, the picture is mixed and ranges between high (house plinths) to very low (seedlings, trees). The raising of house plinths is not only regarded as extremely effective to protect households from being inundated, it also requires no expensive and complicated maintenance. In principle, the same applies to tube wells. Their maintenance is relatively easy and inexpensive, and can be covered by the disaster emergency fund. However, two of the three tube wells in Char Mayesha have been out of order for some time, and no initiative has been taken yet to repair them.
The sustainability of trees and seedlings is judged as very limited. Most beneficiaries of trees plan to cut them down to sell their timber, and no information has been given to re-plant (which would enable a sustained income). Meanwhile, the distribution of vegetable seeds has raised productivity and income temporarily, but will be limited to one planting cycle or at best until the next major flood sweeps them away.
34
Th
e lo
ng
road
to
resi
lien
ce. I
mp
act
and
cos
t-be
nefi
t an
alys
is o
f d
isas
ter
risk
red
uct
ion
in B
angl
ades
h.
76
77

35
Bre
akin
g th
e w
aves
. Im
pac
t an
alys
is o
f co
asta
l aff
ores
tati
on f
or d
isas
ter
risk
red
uct
ion
in V
iet
Nam
.
The long road to resilience / March 2012
8. LESSONS LEARNT
SECTIO
N C | IM
PLICATIO
NS

The methodological approach of this evaluation, in particular the workshops held in programme and control communities, brought about a significant number of lessons on which recommendations can be based to enhance future DRR programming. This chapter provides key recommendations with regard to effectiveness (8.1), relevance, impact and sustainability (8.2) and efficiency (8.3).
All recommendations are presented in conjunction with the underlying lesson learnt; in some cases, further implementation advice is supplemented to facilitate follow-through. A summary of recommendations can also be found at the end of the executive summary.
8.1 Effectiveness: Plan thoroughly and implement long-termThe overarching recommendation regarding effectiveness is based on the recognition that disaster risk reduction is no quick fix. In order to maximize effectiveness, a CBDRR programme needs to be planned more thoroughly, with greater involvement of local communities; monitored more consistently; and implemented over a significantly longer term than currently found - of at least three years.
Recommendation 1a ENABLE GREATER LOCAL INVOLVEMENT IN THE PLANNING PROCESSLesson learnt: Most programmes, including the one evaluated in this report, are planned centrally (on the basis of assessments) and often result in rigid frameworks that leave little space for local determination. However, as this report shows, greater flexibility of the overarching framework and more localized planning renders a programme more effective, as it leads to a more targeted tackling of local needs. It also contributes to sustainability (through fostering a sense of ownership). Thus, the principle of subsidiarity should always be considered: Locate decision-making on programme activities as low as possible and as high as necessary.
Of course, greater framework flexibility is easy to suggest but much harder to provide, given the logic behind project proposals and donor requirements. However, at least two pragmatic approaches could be conceived of: First, limited funding is provided to BDCRS to conduct programme preparation – with these funds, BDRCS conducts baseline assessments and VCAs, on the basis of which proposals are then prepared. The advantage would be that local needs can be fully incorporated into the original programme concept. The disadvantage is that VCAs would be conducted without the confirmation that actual implementation will follow – thus expectations may be raised that cannot be fulfilled. Second, a community development fund could be established that could provide top-up funding for activities not originally foreseen in existing programmes. Communities could lodge applications for funding, and a review commission would select – based on transparent criteria – which applications would receive funding in a given year. Introducing the element of competition tends to result in high quality of lodgments and raise the sense of ownership of the winning
communities. ( see related paragraphs 13, 24, 25, 75)
Recommendation 1bEXTEND IMPLEMENTATION PERIODS TO AT LEAST THREE YEARSLesson learnt: While many DRR activities can be implemented over the course of 12-18 months, this timeframe is too short to demonstrate mid- to long-term benefits and to
36
Th
e lo
ng
road
to
resi
lien
ce. I
mp
act
and
cos
t-be
nefi
t an
alys
is o
f d
isas
ter
risk
red
uct
ion
in B
angl
ades
h.

consolidate new practices and institutions. This, in turn, tarnishes effectiveness, impact and sustainability of achievements. Future DRR programmes should include an initial set-up period of 12-18 months and a consolidation period of two years or more. The consolidation period entails no additional activities, but rather sustained guidance, follow-up (e.g. refresher training) and monitoring. If possible, the existing CBDRR programme should be extended in such a way. ( 20, 28)
Recommendation 1cENHANCE PROGRAMME MANAGEMENT AND MONITORINGLesson learnt: Insufficient planning, programme management and monitoring seriously threaten the effectiveness of an entire programme and diminish its ability to identify and adapt to challenges.
The importance of a comprehensive and consistent plan that lays out the programme logic and specific and measurable indicators, adequate staffing, and an effective monitoring system cannot be overstated. In particular, future programmes should put more effort in conducting baseline studies to make progress measurable. Not the least, this is crucial if cost-benefit and impact analysis are to be improved.
It is recommended that the programme implementation guideline prepared with the support of IFRC should be reviewed and used as a basis for future programmes. ( 19, 21)
8.2 Relevance, impact and sustainability: Build long-term hazard resilience
Resilience to future hazards has become a key concept in the context of climate change adaptation – it goes beyond preparedness, small-scale mitigation and the increase of the asset base of vulnerable households but rather requires an integrated approach that also includes the raising of communities’ adaptive capacity, for instance through diversification of income sources.
Recommendation 2a RAISE THE ADAPTIVE CAPACITY OF COMMUNITIESLesson learnt: The CBDRR programme has focused its livelihood activities around the widening of the asset base of vulnerable households. The approach alone generates limited impact that is usually short-lived. Crucially, it does very little to raise adaptive capacity.
Future DRR programmes should put their main focus on improving adaptive capacity, for instance through cultivation of more hazard-resistant crops and diversification of income sources. Alliances with organisations with relevant expertise (e.g. agriculture institutes) should be built and activities piloted before being applied more widely.
( 14)
Recommendation 2b MITIGATE RISKS MORE COMPREHENSIVELYLesson learnt: The small-scale mitigation measures under the CBDRR programme chiefly mitigated risks to human lives but did little to mitigate risks to livelihoods.
Inte
rnat
ion
al F
eder
atio
n o
f R
ed C
ross
an
d R
ed C
resc
ent
Soci
etie
s
37

They have neither addressed the key concern of land erosion nor did they reduce risks to livestock, paddies and larger productive assets. Mitigating these risks usually comes neither easy nor cheap, as larger structural measures are often involved. Nonetheless, potential solutions should be sought and implemented in collaboration with local governments and relevant experts. Measures exist that are inexpensive (e.g. bamboo planting) or can be made affordable with use of volunteers.( 63, 68, 75)
Recommendation 2cALIGN DISASTER RISK REDUCTION WITH DISASTER RESPONSE MORE CLOSELYLesson learnt: Although both DRR and disaster response are under the responsibility of the BDRCS DM division, they are separate activities in practice.
Synergies could be tapped better by utilizing the local capacities of the CDRT for assessments and relief. The tool of the community disaster emergency fund is seen as highly promising and should be replicated in future programmes. Ideally, these funds should be able to increase social security both in disaster risk preparedness and in actual times of hardship. Present volumes are not yet sufficient to support both aspects adequately. ( 22)
8.3 Efficiency: Adapt programme focus and stay longer
Making most use of available funds is imperative, and future CBDRR programmes should increase efficiency by continuing to focus on community development and awareness, by broadening the focus from the most vulnerable to middle-income groups, and by staying longer to raise benefits further.
Recommendation 3a CONTINUE TO SUPPORT COMMUNITY DEVELOPMENT AND AWARENESS Lesson learnt: Improving community organization and raising awareness is a central part of a cost-efficient approach to CBDRR. Costs associated with establishment of CDMCs and CDRTs, training and awareness-raising are low, while the direct and especially the indirect benefits of these activities are considerable.
Many problems in at-risk communities can be related to widespread day-to-day misbehaviour, which prevents them from increasing their resilience. Protecting the environment and keeping dredging channels clean from household and other sources of waste is an easy and cost-efficient measure that should be part of all future CBDRR programmes. ( 39-41)
Recommendation 3b EXTEND SUPPORT TO MIDDLE-INCOME GROUPSLesson learnt: Providing small-hold and cash crop farmers with and/or assisting them in the use of more flood-resistant crops and practices is likely to not only increase their income, but also to stabilize food security in their community.
38
Th
e lo
ng
road
to
resi
lien
ce. I
mp
act
and
cos
t-be
nefi
t an
alys
is o
f d
isas
ter
risk
red
uct
ion
in B
angl
ades
h.

While costs for such an activity are expected to be rather low, especially since middle-in-come earners may be able to purchases seeds themselves, benefits are likely to be significantly higher compared to an exclusive focus on the most vulnerable. Although middle-income groups may not be immediately vulnerable, they too face climate
change-related long-term threats. ( 68)
Recommendation 3cSTAY LONGER TO CONSOLIDATE IMPACTS AND RAISE BENEFITSLesson learnt: This recommendation is similar to 1b, but comes from the angle of efficiency: Under the current CBDRR approach, initial set-up costs are relatively high, while the benefits are relatively low without consolidation of programme achievements due to their low sustainability.
By contrast, an approach that would add a consolidation period would not cost much more (since the initial set-up is already covered) but is likely to reap far greater benefits. ( 73-75)
Inte
rnat
ion
al F
eder
atio
n o
f R
ed C
ross
an
d R
ed C
resc
ent
Soci
etie
s
39

40 The long road to resilience / March 2012
9. CONCLUSION

Reducing disaster risks is no quick fix. As this report has demonstrated, the creation of long-term impacts towards reduced vulnerability and increased resilience requires not only effective programme management, but also expertise in adaptation techniques and, crucially, longer-term horizons than currently found.
As time horizons of many donors of risk reduction activities tend to be limited, the IFRC should advocate for longer implementation periods of future programmes. This report provides three key arguments for such extensions:
First, long-term implementation that includes sustained guidance to newly created community groups has a significantly greater chance of building lasting improvements for local communities.
Second, long-term implementation as described above is likely to be more efficient because benefits are more sustainable (and therefore greater), while costs are only mildly increased (because the guidance required for during a consolidation period is relatively inexpensive).
Third, disaster risk reduction must raise the adaptive capacity of local communities – this will require a change of communal practices. Behavioural change, however, is not produced over night.
Raising adaptive capacity furthermore requires expert knowledge in issues such as climatology, agriculture, fishing and development. Although the Red Cross/Red Crescent Movement has gained some expertise in recent years, for instance through the establishment of the RC/RC Climate Centre in The Hague, its capacity in this regard should not be overestimated. RC/RC Movement partners such as BDRCS should therefore actively seek alliances with research bodies and organisations that can bring the necessary knowledge into future risk reduction programmes.
Having pointed to possible ways to future improvement, it is also important to recall the achievements BDRCS has created over the past six years with the support of IFRC, DFID, HKRC and GADRR.
Communities that have been supported by the CBDRR programme are more prepared for disasters and rebound more quickly from the impact of hazards than control communities. The CBDRR programme is thus seen as having reduced vulnerability and increased resilience.
Building up community groups and then anchoring a set of various mitigation and livelihood activities around them is seen as a successful example of an integrated approach, and should be replicated. It is not this platform of community groups, but rather the surrounding activities whose adaption is argued for: future programmes must not only focus on expanded asset bases but raised adaptive capacity to achieve even greater hazard resilience.
While total resilience or hazard-proofing is extremely difficult to achieve, the vision should be that the impact that hazards have on communities’ lives and livelihoods is as small as possible.
The road to resilience is long, but is worth taking.
Inte
rnat
ion
al F
eder
atio
n o
f R
ed C
ross
an
d R
ed C
resc
ent
Soci
etie
s
41

42 The long road to resilience / March 2012
APPENDIX

A. MEASURING COMMUNITY RESILIENCEGiven the tremendous damage floods, cyclones and other natural hazards continue to cause in Bangladesh, there can be little doubt that much remains to be done to make communities more hazard-resilient. En route to resilience, several tools utilised by the CBDRR programme have been successful, while the report shows that significant gaps persist.
Two crucial questions have thus far been unanswered: First, what exactly is resilience? Second, how can you measure resilience? The terms of reference for this evaluation envisage the preparation of up to ten indicators of community resilience, so both questions deserve thorough discussion.
The term resilience is based on the Latin verb resilire (to rebound or recoil) and was first used in the 19th century to describe a property of timber, and to explain why some types of wood were able to withstand sudden and severe loads without breaking (Mc Aslan 2010:2). Today it is used widely across many disciplines to describe characteristics of materials, plants, ecosystems, persons, communities and nations. Walter and Salt define resilience as “the ability of a system to absorb disturbance and still retain its basic function and structure.” (Walker/Salt 2005:1)19 Resilience can be conceived of as the middle ground on a continuum that has fragility (even a small shock causes severe harm) at its one end and robustness (even the greatest possible shock causes no harm). Resilience is the ability to bounce back.
The concept of resilience has become popular in recent years to describe the ability of communities to absorb the shocks induced by natural hazards and climate change. 20 Despite some differences on definitions, there appears to be broad consensus that a more resilient community will suffer less deaths and injuries, less material and economic damage, and a quicker recovery to normal community life than a community of low resilience. In other words, the more resilient a community is, the shallower and shorter is the dip it experiences in economic and social performance.
Inte
rnat
ion
al F
eder
atio
n o
f R
ed C
ross
an
d R
ed C
resc
ent
Soci
etie
s
43
Figure 11: Model of hazard resistance and resilience over time
Model of hazard resistance and resilience over time (adapted from Norris et al. 2008:130): Resistance occurs when resources are sufficiently robust, redundant or rapid to buffer of counteract the effects of the immediate stressor (hazard); such robustness is rather hypothetical, making a temporary dysfunction most likely. Resilience occurs when resources are sufficiently robust, redundant or rapid to buffer or counteract the effects of the stressor in such a way that a return to functioning, adapted to the altered environment, is enabled. Vulnerability occurs when resources were insufficiently robust, redundant or rapid to build resistance or resilience - leading to persistent dysfunction. The more severe, enduring and surprising the stressor, the stronger the resources must be to create resistance or resilience.
Pre-hazard functioning, adapted to pre-hazard
environment
Post-hazard functioning, adapted to pre-hazard
environment
Post-hazard functioning, adapted to altered
environment
Temporary dysfunction Persistent dysfunction
StressorSeverityDurationSurprise
ResourcesRobustnessRedundancy
Rapidity
Crisis? Resistance
Vulnerability
Resilience
Resource mobilization/deterioration
For an overview of definitions, see Norris et al. 2008:2008.
For instance, see Adger 2003; Norris et al 2008; Paton/Johnston 2006; and McAslan 2011.
19.
20.

44
Th
e lo
ng
road
to
resi
lien
ce. I
mp
act
and
cos
t-be
nefi
t an
alys
is o
f d
isas
ter
risk
red
uct
ion
in B
angl
ades
h.
Having discussed the concept of community resilience, the question remains as to how community resilience can be measured. For three reasons, it is seen impossible to measure actual community resilience in absolute terms. First, while a set of globally applicable resilience indicators might seem attractive, such an effort is hampered by the huge variance in socioeconomic conditions and cultures. Second, as community resilience would need to be measured against a particular hazard exposure, such an effort would require standardised hazard forces (e.g floods of three, five and seven meters above average water levels) - while one could apply such standard forces to a timber, this is impossible in social sciences. Third, a measurement of actual community resilience could only be conducted after a hazard has hit.
In spite of these obstacles, it is still possible to obtain some indication on the level of resilience seen in a given community: this is achieved by looking at the driving indicators of community resilience rather than at actual community resilience. Various sets of such indicators have been proposed (See Mayunga 2007; Norris et al. 2008; McAslan 2011); these have informed the development of indicators for the context of flood-prone communities in Bangladesh. It should be noted that due to time constraints, these indicators have been developed on the basis of field research and have not yet been elaborated in a participatory manner - they must thus be understood as a suggestion in need of further refinement. Once refined, these indicators can be used to assess baseline conditions, as a tool for planning, and as an instrument to monitor progress.
Devising a set of indicators, one has to decide between practicability and accuracy: Conceptualising them as a tool to assess, plan and monitor means that data acquisition must be simple enough for volunteers and local staff to carry out this task. Given the complexity of resilience, such a tool will always be reductionist in nature and cannot claim full accuracy - which would require much more in-depth research. Thus, while the set of indicators can be seen as a useful tool for programme management, it can neither replace the more sophisticated research usually applied for evaluations, nor must it be understood as an complete measure that would be able to neatly forecast the speed with which a community rebounds from a given hazard. This is due to two key reasons: First, the set of indicators is not comprehensive - many factors that are likely to play a role for community resilience cannot be easily quantified. In particular, this applies to issues relating to social capital. Second, the indicators are not weighted. While it is recognised that some indicators may be more influential than others in building resilience, the proposed set refrains from assigning weights due to a lack of information that such a weighting can be based on.21
Despite choosing a reductionist approach, the measurement of community resilience remains a difficult undertaking that will at the least require a full-day workshop with community members as well as a standardised and representative household survey. The resources and time required for such an exercise imply that such a measurement cannot be undertaken frequently - however, in order to be able to measure progress, it should be conducted at least twice: at the beginning of a programme intervention (to enable planning and deliver baseline data; this should be complemented by a VCA) as well as after the programme conclusion. If programmes are implemented over three years or more, it may be sensible to also conduct a measurement as part of a mid-term review.
Seven indicators are proposed here (see figure 12), relating to physical, procedural and social capital. Most required data will need to be gathered through a representative household survey with random sampling.22 For this survey, a standard questionnaire needs to be developed that can then be used across communities. Additional information will need to be obtained through workshops, the outline of which should be similarly standardised.
For a discussion as to how weights may be assigned to different indicators, see Mayunga 2008:11.
For a household survey to be representative, 200-300 households per community need to be covered to facilitate a confidence level of 95% and a margin of error of 5.
21.
22.

Inte
rnat
ion
al F
eder
atio
n o
f R
ed C
ross
an
d R
ed C
resc
ent
Soci
etie
s
45
Indicator Indicator Indicator Indicator Score
Physical capitalPhysical capitalPhysical capitalPhysical capitalPhysical capital
1 Safe shelter1 Safe shelter1 Safe shelter1 Safe shelter
The expected loss through damage of houses and contents from a hazard comparable in severity to the most severe hazard of the past 10 years, as a percentage of the overall value of houses in the community
a. 0-10%a. 0-10%a. 0-10% 4The expected loss through damage of houses and contents from a hazard comparable in severity to the most severe hazard of the past 10 years, as a percentage of the overall value of houses in the community
b. 11-25%b. 11-25%b. 11-25% 3
The expected loss through damage of houses and contents from a hazard comparable in severity to the most severe hazard of the past 10 years, as a percentage of the overall value of houses in the community
c. 26-50%c. 26-50%c. 26-50% 2
The expected loss through damage of houses and contents from a hazard comparable in severity to the most severe hazard of the past 10 years, as a percentage of the overall value of houses in the community
d. 51-75%d. 51-75%d. 51-75% 1
The expected loss through damage of houses and contents from a hazard comparable in severity to the most severe hazard of the past 10 years, as a percentage of the overall value of houses in the community
e. 76-100%e. 76-100%e. 76-100% 0
2 Safe livelihoods and food security2 Safe livelihoods and food security2 Safe livelihoods and food security2 Safe livelihoods and food security
a. Natural resource dependency: percentage of community income derived from agriculture: 0-25% (3 points); 26-50% (2 points); 51-75% (1 point); 76-100% (0 point) a. Natural resource dependency: percentage of community income derived from agriculture: 0-25% (3 points); 26-50% (2 points); 51-75% (1 point); 76-100% (0 point)
3/2/1/03/2/1/03/2/1/0
b. Level of protection of natural resources; percentage of area that is likely to be unaffected by a hazard as severe as the most severe hazard of the past ten years: 76-100% (3 points); 51-75% (2 points); 26-50% (1 point); 0-25% (0 point)
b. Level of protection of natural resources; percentage of area that is likely to be unaffected by a hazard as severe as the most severe hazard of the past ten years: 76-100% (3 points); 51-75% (2 points); 26-50% (1 point); 0-25% (0 point)
b. Level of protection of natural resources; percentage of area that is likely to be unaffected by a hazard as severe as the most severe hazard of the past ten years: 76-100% (3 points); 51-75% (2 points); 26-50% (1 point); 0-25% (0 point)
3/2/1/03/2/1/0
c. Level of protection of productive assets (e.g. livestock, boats, machinery): percentage of the value of productive assets that is likely to be unaffected by a hazard as severe as the most severe hazard of the past ten years: 76-100% (3 points); 51-75% (2 points); 26-50% (1 point); 0-25% (0 point)
c. Level of protection of productive assets (e.g. livestock, boats, machinery): percentage of the value of productive assets that is likely to be unaffected by a hazard as severe as the most severe hazard of the past ten years: 76-100% (3 points); 51-75% (2 points); 26-50% (1 point); 0-25% (0 point)
c. Level of protection of productive assets (e.g. livestock, boats, machinery): percentage of the value of productive assets that is likely to be unaffected by a hazard as severe as the most severe hazard of the past ten years: 76-100% (3 points); 51-75% (2 points); 26-50% (1 point); 0-25% (0 point)
3/2/1/03/2/1/0
d. Level of insurance coverage: percentage of assets covered by disaster insurance: 76-100% (3 points); 51-75% (2 points); 26-50% (1 point); 0-25% (0 point) d. Level of insurance coverage: percentage of assets covered by disaster insurance: 76-100% (3 points); 51-75% (2 points); 26-50% (1 point); 0-25% (0 point) d. Level of insurance coverage: percentage of assets covered by disaster insurance: 76-100% (3 points); 51-75% (2 points); 26-50% (1 point); 0-25% (0 point)
3/2/1/03/2/1/0
e. Secure food stock: the amount of food stored securely to be unaffected by a hazard as severe as the most severe hazard of the past ten years will last to feed the community less than one week (0 point)/1-2 weeks (1 point)/2-4 weeks (2 points)/more than four weeks (3 points)e. Secure food stock: the amount of food stored securely to be unaffected by a hazard as severe as the most severe hazard of the past ten years will last to feed the community less than one week (0 point)/1-2 weeks (1 point)/2-4 weeks (2 points)/more than four weeks (3 points)e. Secure food stock: the amount of food stored securely to be unaffected by a hazard as severe as the most severe hazard of the past ten years will last to feed the community less than one week (0 point)/1-2 weeks (1 point)/2-4 weeks (2 points)/more than four weeks (3 points)
3/2/1/03/2/1/0
3 Safe utilities and services
Utilities and services will be affected from a hazard comparable in severity to the most severe hazard of the past ten years in the following way: No disruption (3 points); Minor disruption (2 points); Major disruption (1 point), Total disruption (0 point)
a. Access to clean watera. Access to clean watera. Access to clean water 3/2/1/0Utilities and services will be affected from a hazard comparable in severity to the most severe hazard of the past ten years in the following way: No disruption (3 points); Minor disruption (2 points); Major disruption (1 point), Total disruption (0 point)
b. Latrinesb. Latrinesb. Latrines 3/2/1/0
Utilities and services will be affected from a hazard comparable in severity to the most severe hazard of the past ten years in the following way: No disruption (3 points); Minor disruption (2 points); Major disruption (1 point), Total disruption (0 point)
c. Health servicesc. Health servicesc. Health services 3/2/1/0
Utilities and services will be affected from a hazard comparable in severity to the most severe hazard of the past ten years in the following way: No disruption (3 points); Minor disruption (2 points); Major disruption (1 point), Total disruption (0 point)
d. Schoolsd. Schoolsd. Schools 3/2/1/0
Utilities and services will be affected from a hazard comparable in severity to the most severe hazard of the past ten years in the following way: No disruption (3 points); Minor disruption (2 points); Major disruption (1 point), Total disruption (0 point)
e. Safety shelterse. Safety shelterse. Safety shelters 3/2/1/0
Procedural capitalProcedural capitalProcedural capitalProcedural capitalProcedural capital
4 Disaster preparedness knowledge
Level of knowledge amongst households concerning hazards and risks, risk reduction tools, preparedness and response: 76-100% of households know key concepts (3 points), 51-75% (2 points), 26-50% (1 point), 0-25% (0 point) (identified through a standard test)
a. Understanding of locally applicable hazards and risksa. Understanding of locally applicable hazards and risksa. Understanding of locally applicable hazards and risks 3/2/1/0Level of knowledge amongst households concerning hazards and risks, risk reduction tools, preparedness and response: 76-100% of households know key concepts (3 points), 51-75% (2 points), 26-50% (1 point), 0-25% (0 point) (identified through a standard test)
b. Knowledge of tools to reduce risk at household and community levelsb. Knowledge of tools to reduce risk at household and community levelsb. Knowledge of tools to reduce risk at household and community levels 3/2/1/0
Level of knowledge amongst households concerning hazards and risks, risk reduction tools, preparedness and response: 76-100% of households know key concepts (3 points), 51-75% (2 points), 26-50% (1 point), 0-25% (0 point) (identified through a standard test)
c. Knowledge of disaster preparedness strategiesc. Knowledge of disaster preparedness strategiesc. Knowledge of disaster preparedness strategies 3/2/1/0
Level of knowledge amongst households concerning hazards and risks, risk reduction tools, preparedness and response: 76-100% of households know key concepts (3 points), 51-75% (2 points), 26-50% (1 point), 0-25% (0 point) (identified through a standard test)
d. Knowledge of disaster response mechanismsd. Knowledge of disaster response mechanismsd. Knowledge of disaster response mechanisms 3/2/1/0
5 Disaster response teams
Effectiveness of community disaster response teams (CDRT)
a. A CDRT exists with full strength and equipment and prepares itself (meets <1x/month)a. A CDRT exists with full strength and equipment and prepares itself (meets <1x/month)a. A CDRT exists with full strength and equipment and prepares itself (meets <1x/month) 3Effectiveness of community disaster response teams (CDRT)
b. A CDRT exists with full strength and equipment, but meets less than once a monthb. A CDRT exists with full strength and equipment, but meets less than once a monthb. A CDRT exists with full strength and equipment, but meets less than once a month 2
Effectiveness of community disaster response teams (CDRT)
c. A CDRT exists, but lacks full members and/or standard equipment and stockc. A CDRT exists, but lacks full members and/or standard equipment and stockc. A CDRT exists, but lacks full members and/or standard equipment and stock 1
Effectiveness of community disaster response teams (CDRT)
d. No CDRT existsd. No CDRT existsd. No CDRT exists 0
6 Early warning systems
Effectiveness of an Early Warning System a. An EWS is fully functional and well known, at least annual simulations are held a. An EWS is fully functional and well known, at least annual simulations are held a. An EWS is fully functional and well known, at least annual simulations are held 4Effectiveness of an Early Warning System
b. An EWS is fully functional and well-known by the communityb. An EWS is fully functional and well-known by the communityb. An EWS is fully functional and well-known by the community 3
Effectiveness of an Early Warning System
c. An EWS exists and is fully functional, but community knowledge is limited c. An EWS exists and is fully functional, but community knowledge is limited c. An EWS exists and is fully functional, but community knowledge is limited 2
Effectiveness of an Early Warning System
d. An EWS exists, but does not function properlyd. An EWS exists, but does not function properlyd. An EWS exists, but does not function properly 1
Effectiveness of an Early Warning System
e. No EWS existse. No EWS existse. No EWS exists 0
Social capitalSocial capitalSocial capitalSocial capitalSocial capital
7 Community cohesion and coordination
a. Community leadership is seen as effective, responsive and accountable by 75-100% of households (3 points)/ 51-75% (2 points)/ 26-50% (1 point)/ 0-25 % (0 point) a. Community leadership is seen as effective, responsive and accountable by 75-100% of households (3 points)/ 51-75% (2 points)/ 26-50% (1 point)/ 0-25 % (0 point) a. Community leadership is seen as effective, responsive and accountable by 75-100% of households (3 points)/ 51-75% (2 points)/ 26-50% (1 point)/ 0-25 % (0 point)
3/2/1/0
b. Community participation is seen as strong by 75-100% of households (3 points)/ 51-75% (2 points)/ 26-50% (1 point)/ 0-25 % (0 point) b. Community participation is seen as strong by 75-100% of households (3 points)/ 51-75% (2 points)/ 26-50% (1 point)/ 0-25 % (0 point) b. Community participation is seen as strong by 75-100% of households (3 points)/ 51-75% (2 points)/ 26-50% (1 point)/ 0-25 % (0 point)
3/2/1/0
c. Mutual support amongst community members is seen as strong by 75-100% of households (3 points)/ 51-75% (2 points)/ 26-50% (1 point)/ 0-25 % (0 point) c. Mutual support amongst community members is seen as strong by 75-100% of households (3 points)/ 51-75% (2 points)/ 26-50% (1 point)/ 0-25 % (0 point) c. Mutual support amongst community members is seen as strong by 75-100% of households (3 points)/ 51-75% (2 points)/ 26-50% (1 point)/ 0-25 % (0 point)
3/2/1/0
Total maximum score:Total maximum score:Total maximum score:Total maximum score: 62
Figure 12: Proposed indicators for community resilience

Note that adaptive capacity - a key ‘ingredient’ to community resilience - , is not listed explicitly amongst the indicator set. However, adaptive capacity is implicitly included in points 2a-2d: any progress on these scores over time will require considerable adaptive capacity.
Furthermore, it should be noted that in spite of the exclusion of some factors that are seen as important (such as income equality), the proposed indicator set is still as holistic as practicability allows for. Some indicators, such as the natural resource dependency, are unlikely to see any change induced by a BDRCS programme. But natural resource dependency - or income diversification - is still included in the list in order to show additional ways towards greater resilience.
Finally, it should be reiterated that the proposed indicator set is a starting point for discussion. Some refinement and testing, as well as the preparation of standard methodologies for household surveys and workshops, will be required to make it operational.
46
Th
e lo
ng
road
to
resi
lien
ce. I
mp
act
and
cos
t-be
nefi
t an
alys
is o
f d
isas
ter
risk
red
uct
ion
in B
angl
ades
h.

B. SURVEY RESULTS
Figure 13: Survey respondent profile
Respondent details Programme community respondents (N=123)
Control community respondents (N=71)
Overall respondents (N=194)
Gender: male/female (%) 69/54 (56/44%) 40/31 (56/44%) 109/85 (56/44%)
VGF* beneficiary 15 (12%) 7 (10%) 22 (11%)
Disaster-affected (all types)** 119 (97%) 71 (100%) 190 (98%)
Affected by floods** 78 (63%) 46 (65%) 124 (64%)
Affected by cyclones** 9 (7%) 0 (0%) 9 (5%)
Affected by multiple types** 32 (26%) 25 (35%) 57 (29%)
* VGF is the government’s vulnerable group feeding and serves as a poverty indicator.** Between 2006 and 2011.
Change of living conditions over the past five years [Q 1.8]Programme communities [N=119] Control communities [N=71]
Perceived preparedness for future natural disasters [Q 3.1] Programme communities [N=122] Control communities [N=71]
Change of perceived preparedness level over the past five years [Q 3.2] Programme communities [N=121] Control communities [N=71]
Receipt of disaster preparedness information [Q 3.3/3.4] Programme communities [N=120] Control communities [N=69]
Positive changeNo changeNegative change
15%
7%
78%
11%
14%
75%
5%4%
66%
25%
Very preparedPreparedUnpreparedVery unprepared
23%
8%
46%
23%
Positive changeNo changeNegative change
14%2%
84%
6%
41% 54%
9%
33%
1% 42%
2%14% From friends
From the governmentFrom BDRCSFrom NGOsFrom othersFrom multiple sourcesNo information received
44%
14%7%
6%
17%
1%11%
Inte
rnat
ion
al F
eder
atio
n o
f R
ed C
ross
an
d R
ed C
resc
ent
Soci
etie
s
47

Concrete steps taken by household towards disaster preparedness over the past five years [Q 3.5]Programme communities [N=119] Control communities [N=69]
Concrete steps taken by community towards disaster preparedness over the past five years [Q 3.6]Programme communities [N=104] Control communities [N=68]
Assistance provided for community preparedness over the past five years [Q 3.7]Programme communities [N=98] Control communities [N=30]
Main provider of this assistance [Q3.8]Programme communities [N=91] Control communities [N=21]
Impact of community action on respondents’ perceived preparedness [Q 3.10]Programme communities [N=98]
Impact of community action on respondents’ household income [Q 3.11]Programme communities [N=98]
17%
83%
YesNo
49% 51%
5%12%
83%
YesNoDon’t know
7%
49%44%
2%11%
87%
YesNoDon’t know
33%
67%
3%16%
1%
79%
GovernmentBDRCSOtherMultiple sourcesDon’t know
5%5%
38% 52%
2%1%
65%
32%
Very positive impactSomewhat positive impactNo impactNegative impactNo answer
1%1%
13%
71%
13% Very positive impactSomewhat positive impactNo impactNegative impactNo answer
48
Th
e lo
ng
road
to
resi
lien
ce. I
mp
act
and
cos
t-be
nefi
t an
alys
is o
f d
isas
ter
risk
red
uct
ion
in B
angl
ades
h.

Comparison of household income pre- and post-disaster [Q 3.12]Programme communities [N=123] Control communities [N=71]
Impact of community action on community preparedness [Q 3.13]Programme communities [N=98] Control communities [N=30]
Beneficiaries of action taken [Q 3.17]Programme communities [N=98]
Knowledge of beneficiary selection criteria [Q 3.18]Programme communities [N=98]
Perceived fairness of beneficiary selection criteria [Q 3.19]Programme communities [N=73]
15%
7%
10%
53%
16% Much more incomeSlightly more incomeSame as beforeLess than beforeNo answer55%
1%4%
34%
6%
4%
72%
23%
Very great impactGreat impactSmall impactNo impactNo answer
7%
20%
63%
10%
9%
23%
67%
Whole communityMajority of the communityA few households only
26%
74%
YesNo
1%
99%
YesNo
Inte
rnat
ion
al F
eder
atio
n o
f R
ed C
ross
an
d R
ed C
resc
ent
Soci
etie
s
49

C. CASE STUDIES
C.1 Programme communities
C.1.1 Ananda Bazaar | Chandpur districtLocation, demographic and socio-economic context | Ananda Bazaar community is
located six kilometers north of Chandpur City on the banks of Meghna river. The community consists of 361 households, 1,918 people (1,012 male/ 906 female). The poverty rate is estimated to be around 70 percent. 14 households receive VGF support from the local government.
The main livelihood activity in the community is fishing in which around half of the adult male population is involved. Yet, fish is mainly used for subsistence.
Perceived living conditions in the community | Overall living conditions in Ananda Bazaar have improved from 'bad' in 2007 to 'very good' in 2011. Participants at the evaluation workshop stated that, even though conditions are still on a low level, the community is experiencing certain levels of progress. And even though the community was badly affected by the 2007 Flood, the general perception is that conditions have improved ever since.
According to the workshop participants, main influential factors that have directly impacted on the perception of overall living conditions between 2006 and 2011 are a) enhanced preparedness and resilience to natural disasters such as the 2007 Flood, b) riverbank erosion which has become worse and more devastative over time, due to some major landslide incidents, c) access to the road network and to electricity which both have improved over time, and d) opportunities to send children to school (a primary education system has not existed in the community before 2010).
In terms of changing basic living conditions between 2006 and 2011, all aspects that were considered during the workshop have improved, including housing conditions (from 'bad' to 'very good'), drinking water (from 'very bad' to 'very good'), food security (from 'bad' to 'good'), health (from 'very bad' to 'very good'), income (from 'bad' to 'very good'), primary education (from 'bad' to 'very good'), and sanitation (from 'very bad' to 'very good').
In terms of security, while improvements were identified by the community in terms of social security (from 'very bad' to 'good'), crime (from 'normal' to 'good'), and preparedness to natural disasters (from 'very bad' to 'good'), one of the biggest problems in the community is access to land (from 'normal' to 'bad'; mainly due to river bank erosion that signifies a constant threat).
Finally, in terms of public participation and accountability, the perceived situation has also improved (from 'bad' to 'good').
Disaster damages | In Ananda Bazaar, 17 households were directly affected by the 2007 Flood and by the cyclone that hit the community later in the same year. 11 houses were irreparably damaged, 15 fishing boats were destroyed, and an unspecified number of fish ponds were destroyed. One person was killed when his stall collapsed. The road system was flooded and not usable for almost two months.
Interestingly, the flood had a direct consequence on the crime situation: Workshop participants reported that there was a noticeable higher rate of thefts and housebreakings compared to the time before the flood (the situation has then been improving during 2008 and 2009, when livelihoods were retained).
50
Th
e lo
ng
road
to
resi
lien
ce. I
mp
act
and
cos
t-be
nefi
t an
alys
is o
f d
isas
ter
risk
red
uct
ion
in B
angl
ades
h.

Relief activities by BDRCS | Workshop participants stated that 100 households—based on a beneficiary list—received relief support by the BDRCS from late 2007 to early 2008. This included reconstruction (construction slabs were provided to the most affected households), blankets, and the provision of family kits. Among the most affected families, though, apparently there were only seven who received family kits, and out of which three also received tents.
Overview of CBDM/CBDRR activities | BDRCS has been active in the community from
2005-2009. Yet, workshop participants particularly mentioned that it was especially from 2008 on when BDRCS “helped us to organize, to become aware of risks, and to generally enhance our feeling of preparedness” (on disaster preparedness activities and community organization, a CDMC and a CDRT were set up and trained. A disaster simulation and various trainings on disaster preparedness and hygiene were implemented. Moreover, three community members were trained in PHC, and a disaster emergency fund was brought into being).
On small-scale mitigation activities, BDRCS provided material for two tube dwells and one deep tube dwell in 2007. In 2009, construction material for raising the plinths of 10 houses was paid.
On livelihood support, 361 households were selected for receiving goods for stimulating their income-generating activities: 200 families were provided with chicken, two families got cows, and some of the families were provided with three-wheelers. 350 community-based trees were planted, and 150 households received an additional four seedlings each. Finally, hybrid rice seedlings were provided to 300 households.
Is CBDM/CBDRR relevant given the overall situation in the community? Yes, activities undertaken by the BDRCS have been mostly relevant.
Influential factors that have directly impacted on the living conditions of the people over the sample period have been mainly related to a) enhanced preparedness/resilience to natural disasters, b) river bank erosion, c) road conditions, and d) schooling.
Concerning a), activities undertaken on disaster risk reduction and community preparedness have raised the awareness and general preparedness of the major parts of the community members. Concerning c) and d), areas in which the BDRCS was not active, there were some public infrastructure-related activities undertaken by the local government; the road system was upgraded, and new schools were built.
Yet, concerning b), the constant challenge of river bank erosion and the hazard it poses to the community, BDRCS (as well as other actors) have failed to come up with relevant activities.
Have CBDM/CBDRR activities produced positive impacts?Yes. BDRCS has been playing an important role for strengthening disaster preparedness of the whole community, and for improving the livelihood conditions of the group of beneficiaries.
More specifically, CBDM/CBDRR activities have resulted in positive impacts on flood preparedness, income, health, food security, and public participation. Some positive impacts were also reported on sanitation, housing conditions, drinking water, and social security. In
tern
atio
nal
Fed
erat
ion
of
Red
Cro
ss a
nd
Red
Cre
scen
t So
ciet
ies
51

Related to the various activities undertaken, the analysis depicts the following:
- Small-scale mitigation: The installation of tube dwells has produced positive impacts in mostly all aspects of overall living conditions (provision of drinking water, but also improving food security, health, income, sanitation, security, and public participation).
The raising of house plinths had a very positive impact on housing conditions, not only for the direct beneficiaries, but also for the broader community that in many cases (around 80 households) then also raised their homesteads on their own initiative.
- Livelihood support: Impacts of the livelihood activities were mainly unfolding on areas related to basic living conditions (income, but also housing, drinking water, food security, and health).
Most importantly, then, the whole set of activities undertaken have increased disaster preparedness in an impressive way, not only through training, but also through small-scale mitigation and livelihood support; apart of the distribution of rice seedlings, all activities have produced a positive (deep dwells, tree plantation, livelihood activities) or even a very positive (raising house plinths) impact on the aspect of flood security and preparedness.
Cooperation among community members has increased in different areas and among different community hierarchies, particularly due to initiative undertaken under the CDMC. Female participants, in particular, explained they feel more represented in community affairs than a number of years ago. In addition, the disaster emergency fund now has BDT 79,300, with around 270 households making financial contributions on a regular basis.
Yet, it must be stressed out that while these activities had many positive or even very positive impacts on many aspects of living conditions in the community, they could not improve the situation in one of the major concerns, i.e. the challenges related to ongoing river bank erosion (the main reason why people do not feel completely safe and prepared to natural disasters).
Are the results sustainable?Partially. All results are expected to be sustainable at least over the short-term, but sustainability of some results (livelihood support) is only likely over the mid-term and even unlikely over a longer term. Taking a closer look on the different activities, the analysis shows a mixed picture:
Small-scale mitigation: The three dwells that were constructed in 2009 are located on private land at different sites of the community. The places where the dwells were built were chosen by the whole community, and everybody can use them. The CDMC has the responsibility to maintain the dwells and to ensure their functioning. In case repairing has to be made, money was said to be taken from the community disaster response fund. Tube dwells can hence be said to be sustainable. Moreover, raised homesteads are generally in good conditions. While maintenance is due to be undertaken on behalf of the respective households, there is no sign indicating that sustainability is at risk.
Livelihood support: As for the tree seedlings that were planted in 2008, all participants have stated that while a number of trees have died, the overwhelming majority is growing strong. Beneficiaries have taken full responsibility of the trees and decision is left to them if they want to use the trees (fruit trees mainly) for subsistence or for
52
Th
e lo
ng
road
to
resi
lien
ce. I
mp
act
and
cos
t-be
nefi
t an
alys
is o
f d
isas
ter
risk
red
uct
ion
in B
angl
ades
h.

selling the timber one day. Most of the participants stated, however, that they will try to sell the timber instead of using the trees as a means for increased subsistence. Hence, the sustainability of this activity will mostly result in a one-time income generation. Moreover, the provision of rice seedlings had led to more crops and an increased harvest in 2010. It is not traceable, though, how many seedlings from this harvest were then used over the next cultivation period(s). Moreover, people fear that a future flood will, once again, bring full destruction of the paddy fields. Thus, the long-term sustainability of this activity is highly questionable.
Have CBDM/CBDRR activities been efficient?Yes, programme activities have been efficient. Based on the whole set of costs and benefits, the analysis shows a present benefit-cost ratio of 2.90 which increases to 3.05, based on a 15-year projection. This number shows the total economic benefit of costs undertaken.
Importantly, though, there is a number of indirect economic benefits that cannot be considered in the CBA: Better organization and public participation among the community and the integration of vulnerable members of the community into decision-making, the increased safety from floods that leads to a more secure (even though not improved) income also for those parts of the community that have not benefitted from the activities, faster recovering after a future flood, and a number of other benefits (improved health conditions) cannot be overstated.
C.1.2 Char Mayesha | Chandpur districtLocation, demographic and socio-economic context | Char Mayesha community is located on a five kilometers long island of Dakatia river around ten kilometers southeast of Chandpur. The island is only accessible by boat. Population is 381 households, 1,746 people (911 male/ 835 female). Rice farming is the most important economic activity, but fishing and fish cultivation provide an important means for subsistence for the majority of households. Poverty rate is around an estimated 75 percent. 60 households are provided with VGF assistance, which is an amount significantly higher than in the other selected communities.
Perceived living conditions in the community | The overall living conditions in Char Mayesha have improved from 'bad' in 2006 to 'good' in 2011. Even though the community was highly affected by the 2007 Flood and the subsequent cyclone, living conditions have considerably improved since then.
In general, some of the most influential factors that have impacted on the estimation of living conditions, and changes thereof over time, are related to income, housing conditions, sanitation, and health. Concerning income, a considerable challenge that the community is facing is ongoing depletion of fishing resources in Dakatia river, which is mainly due to overfishing. After regaining their fishing equipment in 2008, fishermen started to use tighter sorts of fishing nets than before, in order to compensate their losses from the previous year. Over the following years, the vast majority of fishermen did not comply with existing government regulations to not to engage in fishing activities during an annual two months breeding period. Now that fishing activities result in much lower income and food supply than before, many households have started to search for new income sources. However, income opportunities in the non-fishing and non-agriculture related sectors are limited. Hence, many former fishermen have started to work as day laborers, a circumstance that has resulted in increased levels of outward migration in the community. It is In
tern
atio
nal
Fed
erat
ion
of
Red
Cro
ss a
nd
Red
Cre
scen
t So
ciet
ies
53

mainly therefore that the income dimension has not changed and stayed 'normal', i.e. “insufficient” for the majority of households.
Yet, apart from the income dimension, the present situation of the community does not look that bleak: Concerning aspects of perceived basic living conditions, people in the community have experienced improvements in almost all dimensions (excepting the year 2007 when almost all of the conditions were perceived as 'very bad'): Housing conditions, food security, primary education, and health conditions have improved (from 'normal' to 'good'), sanitation (from 'bad' to 'very good'), and drinking water (from 'very bad' to 'very good').
In terms of security, conditions have largely improved concerning flood prevention (from 'bad' to 'good'), social security (from 'normal' to 'very good'), and crime conditions (from 'good' to 'very good'). One bottleneck for further improvement of risk safety is related to access to land which has only improved in a very slight way (from 'bad' to 'normal'), due to ongoing river bank erosion.
In terms of public participation and accountability, the situation in the community has improved, as by the perception of the workshop participants, from 'bad' to 'good', and from 'normal' to 'very good', respectively (according to the people, this particularly has to do with the newly elected community leader who appears to follow a highly transparent approach to decision-making, and who strongly integrates the various representatives of the community into what some of the community members have called “collective decision-making”).
Disaster damages | In 2007, the community was affected by the Flood which destroyed the winter-crop harvest and which also damaged parts of the infrastructure. Yet, the community was hit even more badly by cyclone 'Sidr' that hit the island in the same year. Therefore, all community members unanimously agreed that 2007 was the worst year in the recent past in terms of destruction and damages caused by natural disasters.
While each year around 50 percent of the cultivable land gets flooded (a situation to which people in the community have learned to cope with and even to adapt to), it was more than 90 percent of total community land in 2007.
In terms of overall damage, the cyclone was considered worse by the community than the flood, with 198 households that were directly affected (compared to 150 flood-affected households in the same year). 197 houses were totally or partially damaged. Rice paddies along the river were completely destroyed, an unspecified number of fish ponds were flooded, and around 23 small fishing boats, including equipment, were destroyed. Moreover, one fisherman was killed, and health conditions decreased dramatically during and after the disaster, with a high number of diarrhea incidents in the community.
Relief activities by BDRCS | During and after the 2007 disasters, family kits and blankets were given to 100 households in Char Mayesha community, and 361 families were supplied with dry food.
Overview of CBDM/CBDRR activities | CBDM and CBDRR program activities were implemented in the community from 2005-2009, and in 2010, respectively.
The building up of a CDMC and CDRT and training for its members, disaster simulations, training activities on disaster preparedness and hygiene (the programmes showed a high level of understanding of local realities and needs: even though people were provided with latrines by the local government from 2004 on, awareness raising about hygiene did not happen), PHC and traditional birth
54
Th
e lo
ng
road
to
resi
lien
ce. I
mp
act
and
cos
t-be
nefi
t an
alys
is o
f d
isas
ter
risk
red
uct
ion
in B
angl
ades
h.

attendance, setting up of a disaster emergency fund, built the basis of community support.
Moreover, direct livelihood support was provided, consisting of the following: Sewing machines for eight households (in 2009), 4 cows for 4 households (16 cows, in 2008), 4 chicken and/or ducks for 50 households (200 chicken/ducks, in 2007), small fishing boats and nets for 16 households (in 2007 and 2010), hybrid rice seedling for 150 households (in 2010), direct financial support for 12 farming households (BDT 3,000 each, in 2010), and 3 container packages for securing assets for 50 households (in 2010).
Concerning small-scale mitigation, 2 tube wells and 1 deep tube well were provided (in 2010), and the construction of a 1 km road was financed (in 2009).
Is CBDM/CBDRR relevant given the overall situation in the community?Mostly yes. As described above, some of the most crucial aspects that have influenced people in their overall estimation of changing living conditions can be related to income, housing conditions, sanitation, and health. Activities undertaken under the CBDM and CBDRR programmes were mostly related to one or more of these aspects.
Yet, findings from Char Mayesha leave three aspects to be considered in terms of relevance of CBDM/CBDRR activities in the future:
-‐ Firstly, while fishing boats were provided to the fishermen, many of those that were involved in fishing a couple of years ago are now looking for new income sources and have “left their boats”, due to an ongoing depletion of fishing resources. So this support has not been remarkably relevant.
-‐ Secondly, an overarching concern for the community is riverbank erosion, which remains widely untouched by BDRCS interventions. Up to now, the community has not received any advice or help for how to cope with the situation that is particularly worrisome during the rainy season when river tides are high. Expanding activities towards erosion could raise relevance to a significant level.
Thirdly, workshop participants have stated that some groups have received a considerable amount of trainings in recent years—but not only from BDRCS but also from local government institutions and some local NGOs. Overlaps should be prevented in order to keep activities relevant.
Have CBDM/CBDRR activities produced positive impacts?Yes. Based on the results from the workshop, the following positive impacts were produced:
-‐ Income: Agricultural production is still increasing by around 20 percent per year, and people largely confirmed that this is also due to BDRCS support (very positive impact).
-‐ Housing conditions: While, unlike in other programme communities, no direct activities were related to raise people`s homesteads (i.e. to make them more protected from floods), workshop participants confirmed that higher awareness about the importance of hygiene standards have made their houses and lands cleaner (positive impact). Moreover, while the community has collected an overall amount of BDT 84,185 to date for the disaster In
tern
atio
nal
Fed
erat
ion
of
Red
Cro
ss a
nd
Red
Cre
scen
t So
ciet
ies
55

emergency fund, this money can be used for repair works and maintenance of houses when needed.
-‐ Sanitation and health: In 2008, some of the people in the community for the first time ever did learn about basic conceptions of health safety and hygiene, for example, by drinking boiled water in order to prevent diarrhea. As a result, people have learnt how (and that) sanitary facilities and latrines need to be kept clean (very positive impact).
Moreover, preparedness to floods has been increasingly increased. People are more aware of how to save food, and have learnt how to cope more easily with high water levels caused by a flood (for example, people have learned how they can make boats out of banana leaves in times of emergency). Generally, as workshop participants confirmed, “we know what to do and how disastrous consequences of floods can be avoided, thanks to CBDM activities” (very positive impact).
Are the results sustainable?Yes, partially. BDRCS activities have contributed to sustainability of improvements in a number of living conditions: Most importantly, and related to small-scale mitigation activities, latrines are getting maintained and kept clean. Hence, training results are considered as highly sustainable. Yet, while the CDMC distributed material for three tube wells in 2009, two of them are already out of order and would need to be repaired. While, normally, maintenance and repair works would be financed by using money from the disaster preparedness fund or from collecting money from households, this has not been done so far to solve the problem. Hence, sustainability is at stake. As regards the Disaster Emergency Fund itself, then, results are rated as sustainable, since a comparatively high amount of money has been collected so far, contributions are made on a regular basis, and accounts are regularly updated by the Head of CDMC.
On the other hand, some of the activities undertaken in the area of direct livelihood support are not sustainable. Among the workshop participants, there was agreement that all agricultural land areas would be affected by a future cyclone and/or flood in the same way as by the 2007 Flood and Cyclone. Moreover, the financial support for 12 households was mainly not spent for investment, i.e. income-generating activities.
Have CBDM/CBDRR activities been efficient?Yes, programme activities have been efficient—even though to a very low amount only considering the direct economic benefits of the actual costs. Based on the whole set of activities, the analysis shows a present benefit-cost ratio of 1.18 which increases to 3.14 when based on a 15-year projection.
Yet, same as in all other programme communities, the level of non-quantifiable benefits, such as increased perception of flood security, and improved levels of health and hygiene standards, is important for considering the overall amount of benefits.
C.1.3 Tarail | Tangail districtLocation, demographic and socio-economic context | Tarail community is located close to the river banks of Jamona river, around 35 km north of Tangail city. Population is 2,720 (1,400 male/ 1,320 female), living in 477 households. The community is split-up into an eastern (398 households) and a western (79 households) part. Poverty rate, as
56
Th
e lo
ng
road
to
resi
lien
ce. I
mp
act
and
cos
t-be
nefi
t an
alys
is o
f d
isas
ter
risk
red
uct
ion
in B
angl
ades
h.

estimated by the village head, is 85 percent. 30 households receive full-year VGF support, especially in the western part that is highly exposed to riverbank erosion and that is affected by floods almost every year.
Perceived living conditions in the community | The overall living conditions in the
community have improved from 'bad' to 'good' between 2006-2011, with 2007 being the perceived worst ('very bad') and 2010 ('very good') the best year.
Main influential factors and concerns of the workshop participants that have directly and strongly impacted on the overall living conditions are related to riverbank erosion, income, and sanitation.
In terms of basic living conditions, some improvements in some of the dimensions were identified, i.e. in housing conditions (from 'bad' to 'rather good'), drinking water (from 'bad' to 'rather very good'), sanitation and primary education (from 'bad' to 'good'), as well as food security (only very slight improvement, though, from 'bad' to 'rather bad'). However, health conditions have remained 'bad', same as the income situation.
In terms of security, social security and crime conditions have both improved (from 'bad' to 'good'), and flood security and preparedness were increased (improvement from 'bad' to 'good'). Access to land remains a major concern, though, where the situation has remained 'very bad' over the whole time (due to riverbank erosion).
In terms of public participation and accountability, results from the workshop show a mixed picture. Overall, people perceive that participation has improved (from 'bad' to 'good'); yet, accountability of local government has remained 'bad', mainly due to a lack of transparency (while accountability across BDRCS supported activities was perceived as having changed from 'good' to 'very good', though).
Disaster damages | The community was severely hit by the 2007 Flood (a flood in the community is considered “severe” when both parts of the community, i.e. the western and the eastern part, are affected). 300 households living close to the riverside were directly affected, out of which a disproportionally high amount was located in the western part of the community. Total damage from the flood included the destruction of 50 houses, mainly due to severe erosion of the riverbanks that stretched around 1 km into the community area. Five people were killed, mainly from drowning in their houses. During the flood, many people had to take shelter for several weeks on the main road. Economically, 250 ha of agricultural land were flooded, and all crops were lost. Most of the consequences from the damages were overcome by the end of 2008.
Relief activities by BDRCS | During the flood, BDRCs provided family kits to around 150 households, while the local government provided food support to 100 families (yet, people stated that the selection of beneficiaries for food support was highly nontransparent). Relief activities from BDRCS were coordinated with the local government.
Overview of CBDM/CBDRR activities | Tarail community was covered both by the CBDM and the CBDRR program. From 2005-2008, BDRCS facilitated the setting up, organization, and training of the CBDM and CBRT. While financial support was limited to keeping the organizational structure of the committee running, to contribute to
Inte
rnat
ion
al F
eder
atio
n o
f R
ed C
ross
an
d R
ed C
resc
ent
Soci
etie
s
57

some awareness raising, and to support the organization of micro groups, from 2010-2011, livelihood support and small-scale mitigation activities were implemented under the CBDRR programme.
In terms of small-scale mitigation, households received access to upgraded latrine systems, and six tube wells were constructed in community.
In terms of direct livelihood support, 56 households were provided with an overall amount of 8 three-wheelers, direct financial support (BDT 30,000 in total), 14 goats, and 3 sewing machines. 300 farming households received seedling for hybrid rice for the 2010 growing period, and a small amount of households received tree saplings.
Moreover, a disaster emergency fund was brought into life. Workshop participants stated that almost all households in the community contribute money to the fund, even though in very small amounts: Presently, there are around BDT 90,000 in the fund.
Is CBDM/CBDRR relevant in terms given the overall situation in the community?Yes, mostly. Main concerns of the workshop participants that directly impact on the overall living conditions are related to riverbank erosion, income, and sanitation. While the CBDM programme put a focus on “soft” measures, i.e. the setting-up of organizational structures for flood protection and disaster management, the CBDRR program envisaged to improve people`s living conditions related to income and sanitation. However, no activities were undertaken related to riverbank erosion.
Have CBDM/CBDRR activities produced positive impacts?Yes. Activities that were implemented under the CBDRR program impacted positively, or even very positively, on the target group members` living conditions and provided positive aspects to the broader community. This mainly relates to the livelihood activities undertaken in 2010 (very positive impacts on housing conditions, food security, and income; positive impacts on water, health, social security, sanitation, and flood security), sanitation measures in 2011 (positive impacts on all aspects related to basic living conditions and security), and the construction of tube wells in 2007 and 2010 (very positive impacts on drinking water and health conditions, and positive impacts on housing conditions, food security, income, sanitation, and flood security).
Yet, two results deserve closer consideration: Firstly, none of the activities had an impact on one of the great worries of the people, i.e. access to land/riverbank erosion. Secondly, income raised from the rickshaws has not been high, since workshop participants stated that competition with motorized rickshaws is simply too high.
Are the results sustainable?Yes, partially. While results from the small-scale mitigation measures are expected to be sustainable (after joint agreement, money from the disaster emergency fund can also be used for maintenance of small-scale mitigation activities, including tube-wells and latrines), activities on livelihood improvement are sustainable over the short term, but will face challenges in terms of sustainability over the mid- to long-term. Since livelihood activities were focusing on improvement of the asset base of the
58
Th
e lo
ng
road
to
resi
lien
ce. I
mp
act
and
cos
t-be
nefi
t an
alys
is o
f d
isas
ter
risk
red
uct
ion
in B
angl
ades
h.

targeted households, these results can be expected to be easily diminished by a future flood or other types of natural disasters, such as a cyclone.
Have CBDM/CBDRR activities been efficient?Yes, programme activities have been efficient. Based on the whole set of activities, the analysis shows a present benefit-cost ratio of 3.04 which increases to 4.55 when based on a 15-year projection.
Same as in the other selected communities for this study, it is important to stress out that the whole set of activities has produced benefits that cannot be monetized.
C.1.4 Paikpara | Sirajganj districtLocation, demographic and socio-economic context | Paikpara community is located 6 km southeast of Sirajganj city, along the banks of Jamona river. Population size is 1,928, living in 422 households. A remarkable characteristic of the community is that its population size has almost doubled over the past 5 years (from around 250 in 2006). This is mainly due to the 1998 Flood, after which many people originally stemming from Paikpara left the community and then only started to return from 2005 on. Poverty rate in the community was estimated by the head of the community to be as high as around 80 percent, while the number of VGF supported households is considerably low (only 12 households have received assistance over the past two years). The main economic activity in the community is farming, but a remarkable high number of people are working as day laborers.
Perceived living conditions in the community | In Paikpara community, the overall living conditions have slightly improved between 2006 and 2011 (from 'bad' to 'normal'), based on the perception of workshop participants. Yet, like in all of the selected communities, living conditions in 2007 were considered as 'very bad', but then reached 'normal' in 2009. However, in 2010 there was a deterioration of living conditions (from 'normal' to 'bad'), due to very high levels of riverbank erosion that affected many households.
Main influential factors on the overall living conditions in the community are access to land (due to the above mentioned riverbank erosion), and housing conditions, food security, and health (which all relate to the income situation, though, based on farming activities).
In terms of basic living condition, improvements were identified in housing conditions (from 'bad' to 'normal'), food security, sanitation, health, and primary education (all from 'bad' to 'good'), and especially in drinking water conditions (from 'bad' to 'very good', mainly because the community received support from different sources over the past 4 years).
In terms of security, some improvements in some of the dimensions were reported. Concerning social security, due to collective insecurity during floods in 2007 and 2008, situation before was estimated to have been 'bad' but has improved to 'good' since then. The crime situation has slightly improved (from 'bad' in 2007 - mainly due to previous residents coming back to the community while land ownership was unclear in some cases - to 'normal' in 2011), The most pressing issue is access to land where the situation has worsened from 'good' in 2007 - when there was a lot of land available due to the limited number of households living in the area by this time - to
Inte
rnat
ion
al F
eder
atio
n o
f R
ed C
ross
an
d R
ed C
resc
ent
Soci
etie
s
59

'very bad' in 2011. Land scarcity is a serious challenge and, moreover, many hectares of cultivable land have already been taken by the river due to riverbank erosion.
Finally, public participation and accountability were improved from 'bad' to 'good' over the past six years, based on the perception of workshop participants.
Disaster damages | The community was affected by the 2007 Flood, but also was hit by
a minor flood in 2008. While the number of households in the community was 250 at this time, 150 households were directly affected by the 2007 Flood, with their houses being either destroyed or damaged. Other direct damages included flooding and destruction of around 70 ha (or 80 percent) of the total of farming crops (mainly rice). In total, 3 people were killed during the 2007 flood. Moreover, due to ongoing riverbank erosion, around 130 households had to resettle to areas further inland between 2006 and 2010. Erosion hence signifies an ongoing problem to houses and agricultural fields located nearby the riverbanks.
Relief activities by BDRCS | BDRCS relief activities during and in the aftermath of the 2007 Flood comprised support to 200 households. However, implementation of relief was handed over to the union chairman; based on the perception of the workshop participants, the local government then only supported “its own people”, based on nontransparent and “unfair” criteria.
Apart of BDRCS, there were various other international organizations (Care, WFP) and local NGOs that provided support to the people.
Overview of CBDM/CBDRR activities | Under the CBDM programme, a number of 'soft' activities related to the setting up, organization and training of CDMCs and CDRTs were implemented from 2004-2008.
Activities under the CBDRR were implemented from February 2010 to February 2011, and involved small-scale mitigation as well a livelihood measures. These activities included the following:
On small-scale mitigation, 2 tube wells were raised while livelihood support comprised the following: Providing 50 goats and training on goat raising to 50 of the most vulnerable households, providing 10 three-wheelers to ten households, acquisition of 4 sewing machines to four households, including training of 10 household members, and provision and planting of 300 fruit trees.
Moreover, a Disaster Emergency Fund was brought into life, based upon which the CDMC was able to collect an amount of approximately BDT 50,000 up so far.
Is CBDM/CBDRR relevant given the overall situation in the community?Yes, mostly. Main problems in the community are related to access to land (due to riverbank erosion), and housing conditions, food security, and health (which all relate to the income situation based on farming activities). The CBDRR programme has mostly aimed to contribute to improve living conditions in areas related to the three latter conditions, based on small-scale mitigation activities and livelihood support. These activities have been highly relevant activities in fact. Yet, none of the activities was directly contributing to the ongoing and increasing challenge of land access in the community.
Moreover, after the 2007 Flood, a number of international organizations such as UNDP, WFP, and Care, as well as local government agencies and local NGOs supported people in raising their tube wells and houses. In addition, we were told that the local government provided more and better training on agricultural farming techniques from 2009 on. Hence, when being asked about the most important activities that were
60
Th
e lo
ng
road
to
resi
lien
ce. I
mp
act
and
cos
t-be
nefi
t an
alys
is o
f d
isas
ter
risk
red
uct
ion
in B
angl
ades
h.

undertaken in the community over the past six years, workshop participants came up with only one activity that was implemented under the CBDRR program, i.e. livelihood support.
Have CBDM/CBDRR activities produced positive impacts?Yes. All but one (access to land) conditions have significantly, or at least slightly, improved over the period covered in the analysis. Due to the sheer number of support to the community from sources apart of BDRCS—including international organizations, local NGOs, and the local government—though, an overall and clear estimation of BDRCS`s contribution to these improvements cannot be made.
Yet, it is possible to come up with the following overview of direct and indirect impacts of livelihood support activities: `Positive' impacts were achieved in all dimensions of basic living conditions (i.e. housing, water, food, health, income, sanitation, and primary education), security (social security and flood security), as well as in public participation and accountability.
Are the results sustainable?Yes, partially. Up to now, results from small-scale mitigation activities are sustainable. However, even though the situation has improved in most of the aspects of perceived living conditions, the community still experiences a high level of vulnerability, due to increasing levels of land scarcity and exposure of especially the poor households to river bank erosion. Hence, in terms of livelihood activities that were implemented in the community, mid- to long-term sustainability is seriously at stake.
Have CBDM/CBDRR programme activities been efficient?Certainly, levels of flood preparedness and security have increased, while damages from a future flood are expected to be reduced by around two thirds in housing conditions, and 30 percent in terms of agricultural losses. The economic damage would be lower than in 2007, mainly due to improvements in housing conditions, sanitation, health, and overall levels of preparedness.
Yet, it would be a bold venture to attribute benefits to the program costs in the particular case of the community, since support was provided from many different sources and interventions, and on many aspects related to the main areas of intervention under the CBDRR.
C.1.5 Purbolbaoitara | Sirajganj districtLocation, demographic and socio-economic context | Purbolbaoitara community is located on the edges of Jamona river, around 5 km northeast of Sirajganj city. Total population is approximately 3,000, living in 356 households. While the estimated poverty rate is 70 percent, there are only six households receiving VGF assistance by the government. The main income-generating activity is farming; yet, a remarkable amount of people is involved in the garment sector.
Perceived living conditions in the community | Overall living conditions in the community improved considerably between 2006 and 2011 (from 'bad' to 'good').
Access to land, flood security, food security, health and income conditions are the main striking (with the three latter being the most volatile, though) and most influential factors that have crucially affected the overall perception of living conditions in the community over the past years. In
tern
atio
nal
Fed
erat
ion
of
Red
Cro
ss a
nd
Red
Cre
scen
t So
ciet
ies
61

During the workshop, participants identified the following changes in different aspects of living conditions in the community: Related to basic living conditions, housing conditions, income, sanitation, and primary education were all improved (from 'bad' to 'good') between 2006 and 2011. Food security improved from 'normal' to 'good', health conditions from 'bad' to 'normal', and drinking water conditions even from 'bad' to 'rather very good'. Yet, the severe vulnerability of community members became particularly clear by the 2010 flood that worsened living conditions, especially so by deteriorating the food, health, and income situation to 'bad' from 'good' in 2009.
On security, aspects of social security and crime improved from 'bad' to 'good' over the sample period, and flood security even improved from 'very bad' to 'good'. Certainly, there is one major constraint, though, that prevents further improvement of overall living conditions, i.e. access to land. This aspect has worsened from 'normal' to 'bad' over the past six years (mainly due to an ever-increasing number of people that have been migrating to the village).
As regards public participation and accountability, accountability of the local government related, especially when related to DRM and DRR, is considered low, even though certain improvements were identified by the workshop participants. Overall, accountability has improved from 'bad' to 'normal', while public participation was perceived to have even more improved from 'bad' to 'good'.
Disaster damages | Due to its close proximity to Jamona river, the community was severely hit by the 2007 Flood, especially when considered in comparison with other communities in the region. Almost 90 percent of houses in Purbolbaoitara were destroyed or at least partially damaged, and around 90 percent of the agricultural farming land was flooded, with the same percentage of harvest being lost. During the Flood, people took shelter on the embankment system or had to escape to areas located further inland. Access to the community was nearly impossible for more than four weeks. At least one person was killed.
Floods did not only affect the farming sector; in 2007, many weavers lost their jobs what affected their immediate food security. Hence, many people went hungry and were dependent on relief support. The same then happened during and after the flood that affected the community in 2010, even though to a lower amount than in 2007 (especially those households located outside of the embankment system were affected).
Unlike other communities selected as case studies for this evaluation, the riverbanks of Purbolbaoitara community are not affected by erosion. This, in combination with a comparatively high demand of labor in the garment sector, has led to constant population increase and inward migration of people from the region.
Relief activities by BDRCS | During the 2007 Flood, BCDRS provided dry food to 200 out of the most affected households. Parallel food support was provided by the WFP, and by a local NGO. Besides relief support provided by the BDRCS and others, the local government provided financial support to families who had to rebuild or repair their houses with a fixed amount of BDT 5,000, and BDT 1,700, respectively.
In total, then, workshop participants acknowledged that support was provided from different sources, even though they said that the amount of support provided was not sufficient in order to quickly overcome the losses from the flood.
Overview of CBDM/CBDRR activities | Purbolbaoitara community was supported by the BDRCS both under the CBDM (2004-2008) and the CBDRR (April 2010-February 2011) programmes. While it were mostly “soft activities” and a small amount of other activities that were undertaken under the CBDM programme, including the setting up
62
Th
e lo
ng
road
to
resi
lien
ce. I
mp
act
and
cos
t-be
nefi
t an
alys
is o
f d
isas
ter
risk
red
uct
ion
in B
angl
ades
h.

and training of the CDMC and CDRT, the CBDRR aimed at providing both targeted households and the broader community with livelihood activities and small-scale mitigation measures.
The following small-scale mitigation activities were implemented: The platforms of two tube wells were raised (which were built some years earlier under the CBDM program), and a wooden footbridge was built in order to give people from the community easy access to the main connecting road in the flooding season (this activity was financed by Dutch princess Margriet who visited the community in early 2010). In addition, a disaster emergency fund was brought into life.
The livelihood activities that were implemented comprised the following: Provision of 200 goats to 40 households, provision of 16 weaving machines, provision of four sewing machines, provision of eight three wheelers, and provision of hybrid rice seedlings and tree samplings to 300 households. In total, 62 households received support under the CBDRR program.
Is CBDM/CBDRR relevant given the overall situation in the community?Yes. In a list of those five activities that were perceived to be among the most important ones to improve living condition in the community over the past six years, workshop participants included two activities implemented under the CBDRR program (construction of a footbridge in 2007, livelihood assistance throughout the year 2010).
The construction and maintenance of two tube wells was also considered relevant, yet it was not perceived as an activity of community-wide relevance. Generally, the distribution and upgrading of tube wells over the past few years both by BDRCS and by the local government have led to the overall perception that the drinking water situation has significantly improved over the past few years. Yet, it was only in 2010 that results from testing the groundwater quality showed that most of the tube wells provided by the local government pumped arsenical groundwater. In consequence, people have been avoiding to using these wells any longer. Instead, people now use those tube wells provided by BDRCS which are said to be safe and to provide clean drinking water. Hence, even though the amount of input provided by the BDRCS was relatively low (only two tube wells were built under the CBDM and later upgraded under the CBDRR program), the level of relevance for living conditions in the community is rather high.
Have CBDM/CBDRR activities produced positive impacts?Yes. In terms of small-scale mitigation measures, the building of the footbridge had a number of positive impacts on the food, health, and income situation (direct impacts), as well as on sanitation (over time, people have gained more awareness about the importance of hygiene and sound sanitary conditions, resulting in an overall perception that “the whole community is now cleaner than before”) and social security (indirect impacts).
Related to livelihood support, a high number of positive impacts was mainly produced on basic living conditions (direct impacts), security (indirect impacts), as well as on public participation and accountability (indirect impacts).
Positive impacts, both direct (footbridge, tube wells) and indirect (livelihood support) ones, were also identified on flood security.
Are the results sustainable?Yes, partially. While sustainability is mainly given related to small-scale mitigation measures, the long-term sustainability of livelihood activities, same as in the majority of the other villages, should be considered as unlikely. In
tern
atio
nal
Fed
erat
ion
of
Red
Cro
ss a
nd
Red
Cre
scen
t So
ciet
ies
63

Moreover, even though there is a disaster emergency fund to which the majority of households provide regular contributions, there was no information available on how much money has been raised so far. Money from the fund, moreover, has not been used so far.
Have the CBDM and CBDRR program activities been efficient?Yes, programme activities have been efficient. Based on the whole set of activities, the analysis shows a present benefit-cost ratio of 2.89 which increases to 4.90 when based on a 15-year projection.
Same as in the other selected communities for this study, it is important to stress out that the whole set of activities has produced benefits that cannot be monetized. Yet, in terms of flood security and preparedness, most of the workshop participants whose houses are located outside of the embankments system stated that despite the considerable amount of activities undertaken in their community, they do not feel much better prepared to potential disasters than before.
Improvements, therefore, were mainly achieved in those areas of the located further inland. Here, around 50 percent of houses are estimated to stay unaffected by a future flood.
Moreover, workshop participants stated that because of the community organization provided by the CDMT and the CDRT, and based on training provided under the CBDM program, fewer people would be physically affected or killed during a future flood. Yet, participants estimated the amount of financial losses would be around 90 percent of amount compared to the 2007 losses, both agriculture- and non-agriculture related.
C.2 Control communities
C.2.1 Niklagopal | Tangail districtLocation, demographic and socio-economic context | Niklagopal community is located 25 km north of Tangail city, and 5 km away from Jamona river. Total population is 1,700 that live in 250 households. Poverty rate was estimated by the village head to be approximately 70 percent. This is in contrast to a low number of VGF recipients which is around five households only. Around 10 percent of households are living on marginal lands, and even though they are mostly affected by poverty and highly vulnerable to natural hazards, they have not received any government support so far. The main livelihood activity is agriculture (paddy farming); in 95 percent of the households, there is at least one person involved in agricultural activities.
Perceived living conditions in the community | Since 2006, and up to 2011, overall living conditions in Niklagopal community have only slightly improved from 'bad' to 'rather bad'. In 2007, as in most other selected communities for this study, the situation in the community was 'very bad'. In the following, then, while living conditions improved to 'normal' in 2008 and 'rather good' in 2009, they were constantly decreasing over the last two years ('normal' in 2010, and 'rather bad' in 2011).
Some of the most influential factors that weigh heavily on the community`s overall situation are related to flood security, to the income situation (especially when related to agricultural activities), access to land (since land is scarce and much of the areas available are affected by erosion), and to housing conditions. The individual dimension upon which the overall living situation is based are explained in more detail in the following:
64
Th
e lo
ng
road
to
resi
lien
ce. I
mp
act
and
cos
t-be
nefi
t an
alys
is o
f d
isas
ter
risk
red
uct
ion
in B
angl
ades
h.

Basic living conditions: While some improvements were reported in housing conditions (from 'normal' to 'good'), food security (from 'bad' to 'normal'), drinking water (based on local government support, the number of tube wells in the community has significantly increased from 2 to 14 since 2006), health and sanitation (mainly due to the provision of 100 latrines by the local government to the community over the last years, and awareness raising on hygiene measures provided by the local government and by Care which resulted in a reduced number of diarrhea incidents and waterborne diseases in the community), and primary education (all from 'normal' to 'good'), it is in particular the income situation (from 'normal' to 'bad') that is an ongoing concern.
Security: In terms of security, people from the community perceived some improvement in social security (from 'normal' to 'good'), but still feel unprepared in terms of natural disasters (even though they feel a bit better prepared now than in 2007, they struggle with annual and seasonal floods and storms).
Public participation and accountability: People in the community reported some improvements related to the governance context in Niklagopal (with the situation having improved in both public participation and accountability of the local government from 'normal' to 'good'. Yet, these improvements are mainly related to some specific actions and interventions in which local community people were involved to some part over the past six years, while in others (especially local government performance in relief distribution) the situation is perceived as insufficient.
Disaster damages | As mentioned above, the community was hit by the 2007 Flood and by subsequent Cyclone Sidr. Moreover, some of the households in the community also were negatively affected by a storm in 2010 and by unexpected torrential rains during the growing season in 2011. In addition, some areas of the community are highly exposed to annual flooding during the rainy season.
In terms of damages caused, the 2007 Flood was certainly the most devastating natural disaster affecting the living conditions of the community over the past six years. 30 households were severely affected with their houses being destroyed when the only river dam broke, while another 20 households were partially affected with their houses and homes being damaged. Even though no people from the community were killed, several got injured. Most of those that were directly affected then took shelter in the homes of relatives or friends during the flood and in the period of rebuilding/repairing their houses.
In terms of economic damage, around 100 ha of land were flooded what caused a 50 percent loss of the winter rice harvest and some additional losses of jute cultivation.
Relief activities by BDRCS | During and after the 2007 Flood, BDRCS provided some immediate relief to the most affected households in the community: Out of 38 households each received a 20 kg rice support. Other support was provided by the local government in the aftermath of the flood, comprising some seeds, hygiene workshops, and some direct financial compensation to the most affected families (which, though, was only a small amount of money that they did not receive until only by the end of 2009).
Inte
rnat
ion
al F
eder
atio
n o
f R
ed C
ross
an
d R
ed C
resc
ent
Soci
etie
s
65

Overview of CBDM/CBDRR activities | The community was not covered by any activities under the CBDM and CBDRR programmes. Yet, from 2002-2005, BDRCS facilitated and supported the setting up of a CDMT and of a CDRT.
Is CBDM/CBDRR relevant given the overall situation in the community?Yes. Security from, and preparedness to, natural disasters and especially to floods is considered one of the main concerns in the community. Even though no activities under the CBDM and the CBDRR programme took place in Niklogopal community, a CDMT and a rescue team were brought into life from 2002-2005. Concerning this, it should be emphasized that no meetings were held and no activities were undertaken by the CDMT since 2008, even though the committee is (at least officially) equipped with the full amount of members (25), based on BDRCS standards. Instead, people expressed that meetings were held “regularly” from 2002-2005 (when BDRCS provided financial support by that time), “occasionally” from 2006-2008, but “no longer” from after 2008 then. Moreover, no activities related to DRR have been undertaken in the community. Even though the community has received some support from the government and from a local NGO (BRAC), none of these activities was identified by the workshop participants to be related to DRR.
Are the results sustainable?No. Even though the community was not covered by the CBDM and/or the CBDRR program, the setting up of a CDMT and rescue team in the village from the time before 2005 provides some highly interesting information about the sustainability of such interventions. After the support from BDRCS came to an end in 2005, sustainability of the CBDM was not warranted any longer. Without technical and financial support provided by the BDRCS, though, the CDMT worked for as long as three more years, with meetings being held occasionally. Since then, the CBDM has not worked effectively for any longer, and hardly any communication was upheld with the unit level/with the national level.
C.2.2 South Digalkandi | Bogra districtLocation, demographic and socio-economic context | South Digalkandi is located 20 km east of Bogra city, along the Jamona river edges. Population in the community is around 3,000, and the number of households is 498. There was no exact information on the poverty rate available (the chairman of the village provided an estimation of 78 percent), but the actual number of VGF recipient households is considerably high (42 households). Agriculture is the population`s economic mainstay, with the majority of farmers being involved in rice cultivation (two crops per annum).
In 2007, same as in the whole study sample, the community was hit by the Flood. No BDRCS activities have thus far taken place in the village.
Perceived living conditions in the community | Overall, the perceived living conditions in the community have not changed, based on data and information provided by the workshop participants. While the situation in 2006 was perceived as 'normal', and 'bad' in 2007, it got back to 'normal' in the years 2008 and 2009, even improved then to 'rather good', but again decreased to 'normal' in 2011.
South Digalkandi is a farming community, and living conditions depend highly on the harvest amount and quality. Hence, some of the most tremendous problems and most influential factors that people in the community see are on flood security (the embankment system is perceived as largely useless, and there is no drainage system, and even in “normal” years water is encroaching into many parts of the community), and disaster preparedness (due to a lack of capabilities to cope with, and to adapt to,
66
Th
e lo
ng
road
to
resi
lien
ce. I
mp
act
and
cos
t-be
nefi
t an
alys
is o
f d
isas
ter
risk
red
uct
ion
in B
angl
ades
h.

respectively, environmental hazards and climate variability, even comparatively “small” disturbances during the growing season such as prolonged lack of rain in 2011 and “heavy fog” in 2008 have led to an undermining of people`s livelihood basis over the past few years). Moreover, other major challenges that weigh heavily on people`s lives are to be found in insufficient health (due to a lack of basic infrastructure, but also insufficient knowledge and awareness) and sanitation conditions (due to a lack of number of properly functioning latrines, but also due to waterlogging after rain).
The following provides a more detailed overview of how different aspects of living conditions were perceived by the community members:
Basic living conditions: While small improvements were identified in housing conditions (from 'bad' in 2006 to 'rather good' in 2011), food security and health (from 'bad' to 'normal'), sanitation and primary education (from 'bad' to '(rather) good'), drinking water conditions have stayed 'normal'. Most importantly, though, the income situation has worsened (from 'normal' to 'bad').
Security: As mentioned above, flood security and preparedness presents a major and ongoing concern to the community. While aspects of social security have slightly improved from 'normal' in 2006 to 'good' in 2011 (mainly due to neighborhood support in times of hardship, which is an important aspect but which cannot be drawn upon in times of collective insecurity and hardship, such as during a flood), flood insecurity (the situation was 'very bad' in 2011 and 'bad' in 2010) and access to land (which remained 'bad' over the sample period) represents a constant burden.
Public participation and accountability: Levels of public participation and accountability are perceived to have improved over the last years (from 'bad' to 'good'), mainly because people are increasingly unsatisfied with the situation in the village and have started to “raise their voices more often”. Concern should be expressed that the situation in the community is about to face a sociopolitical crisis.
Disaster damages | As mentioned above, the community was hit severely by the 2007 Flood. 85 percent of houses were inundated, and 60 houses were totally destroyed through riverbank erosion. 100 percent of the farming land (102 acres) was flooded and all crops lost. Yet, no one was killed.
Relief activities by BDRCS | No relief support was provided by BDRCS to the community. Yet, activities and support from the local government during the flood comprised the provision of rice, wheat, cooking oil, as well as clothes, to 300 households. In the aftermath, some very limited amounts of construction material (for 3 households) were provided, and some support for latrines and the construction/repairing of tube wells was given.
Overview of CBDM/CBDRR activities | No activities were implemented by the BDRCS so far (yet, it is envisaged at this stage that the community will be one among eight communities to be covered by the upcoming CCA programme).
Is CBDM/CBDRR relevant given the overall situation in the community?Yes. While the community faces several tremendous challenges, preparedness to natural disasters and enhanced security is certainly one of South Digilkandi`s major concerns. Yet, no activities were implemented by BDRCS in the community. Based on the results from the workshop, though, it becomes clear that CBDM/CBDRR-related activities have a high relevance that can lead to an improvement of living conditions. Considering the overall and ongoing concerns of the community related to flood insecurity and disaster risks, high exposure and vulnerability to climate variability, and insufficient sanitary and health conditions, activities implemented by the BDRCS
Inte
rnat
ion
al F
eder
atio
n o
f R
ed C
ross
an
d R
ed C
resc
ent
Soci
etie
s
67

provide a lasting moment to improving both the overall and specific community conditions.
Moreover, when having entered into a discussion with the community members about what could represent appropriate steps to be taken by themselves to overcome these major challenges, it became striking (and eye-opening to the participants), that there is a clear lack of communication and self-organization among community members in order to be able to create improved conditions.
C.2.3 Hoakowa | Bogra districtLocation, demographic and socio-economic context | Hoakowa community is located 30 km east of Bogra city, along the margins of Bengali river. The overall number of people in the community is considerably high, with 7,000 persons living in around 800 households. The size of the community brings with itself a comparatively high level of public infrastructure, and which includes a post office, a medical center (UP Health Complex), a market, electricity, a community center, etc. The size of farming land is 1,100 acres in total. No information was available on the poverty rate and on the number of VGF recipients.
Natural disasters that have occurred in the community are the 2007 Flood, and a minor and subsequent flood in 2008. No activities were implemented by the BDRCS so far.
Perceived living conditions in the community | Overall living conditions in Hoakowa
community were perceived as 'normal' for the year 2011, same as in the year 2006. This means the community is facing around the same conditions today as it did six years ago, and no major improvements were experienced.
Yet, living conditions underwent a couple of drastic fluctuations in the years between: In 2007, living conditions were perceived as 'bad' during the Flood, but even worse, i.e. 'very bad' then in 2008, when another flood hit the community that, even though smaller in size, made those that were affected by the flood in the previous year even more deprived. While living conditions in the community were retained to 'normal' in 2009, and even to 'good' in 2010, a prolonged rainy season and unexpected rain during the dry season—which was then followed by a major incident of pest—destroyed large amounts of the annual jute and chili crop, and led to deterioration of living conditions.
In total, main influential factors and challenges in Hoakowa community are related to flood security and preparedness, which includes a direct linkage to food security, health, income, as well as access to land.
In more detail, the following lists an overview of the findings from the analysis of living conditions in the community:
Basic living conditions: Perceived improvements were achieved in terms of housing conditions (from 'bad' to 'good'), health, sanitation and primary educations (from 'normal' to 'good'). Yet, no changes took place related to income, health and food security where conditions have stayed 'normal'.
Security: Only a very slight improvement was identified in the community in terms of the two dimensions of social security and flood security (from 'normal' to 'rather good'). Crime conditions have stayed 'normal'.
68
Th
e lo
ng
road
to
resi
lien
ce. I
mp
act
and
cos
t-be
nefi
t an
alys
is o
f d
isas
ter
risk
red
uct
ion
in B
angl
ades
h.

Public participation and accountability: These two aspects of living conditions represent a major challenge that have not changed over the last six years, and which have stayed 'bad' in terms of participation, and 'normal' in terms of transparency.
Disaster damages | 25 percent of households were directly affected by the 2007 Flood,
while around 60 percent of the existing farming land was flooded. In addition, those houses damaged and agricultural fields inundated under the 2007 Flood were more vulnerable to a minor 2008 flood.
Relief activities by BDRCS | No relief support was provided by BDRCS to the community. However, the local government provided food support to 200 households.
Overview of CBDM/CBDRR activities | No activities were implemented by the BDRCS in
Hoakowa community so far (yet, it is envisaged at this stage that the community will be one among eight communities to be covered by the upcoming CCA programme).
Inte
rnat
ion
al F
eder
atio
n o
f R
ed C
ross
an
d R
ed C
resc
ent
Soci
etie
s
69

D. LITERATUREAdger, W.N. (2003): Social capital, collective action and adaptation to climate change. Economic Geography Vol. 79(4), p. 287-404.
Adger, W.N., T.P. Hughes, C. Folke, S.R. Carpenter and J. Rockström (2005): Social- ecological Resilience to Coastal Disasters. Science, Vol. 309 (5737), p. 1036-1039. http://www.sciencemag.org/content/309/5737/1036.full
BDRCS (2009): Disaster Risk Management Strategy 2010-2014.
BDRCS (2009a): Baseline assessment for the Global Alliance on DRR.
Bhatt, M. R., D. Zappa (2008): Evaluation of DRR II in Bangladesh. Final report, August 2008 (prepared for IFRC).
Chauhan, S. (2009): Climate change adaptation programme review (prepared for IFRC).
GoB (2008): Cyclone Sidr in Bangladesh. Damage, Loss and Needs Assessment for Disaster Recovery and Reconstruction, Dhaka.
GoB (2009): Climate change policy and action plan 2009. http://www.moef.gov.bd/climate_change_strategy2009.pdf
GoB (2010): Standing Orders on Disaster. http://www.dmb.gov.bd/reports/SOD_rev_30210%20updated%20on%2004.02.10.pdf
IFRC (2008): Programme Update No.1, Bangladesh. Appeal No. MAABD001 27/08/2008.
IFRC (2008a): Programme Update No. 2, Bangladesh. Appeal No. MAABD001
IFRC (2009): Building Safer Communities – Think Tank Workshop on climate change adaptation and community-based disaster risk reduction. 10-12 February 2009, Dhaka, Bangladesh. Workshop summary report.
IFRC (2010): Cost-benefit analysis of community-based disaster risk reduction. Red Cross Red Crescent lessons learned, recommendations and guidance.
IFRC (2010a): Strategy 2020. Saving lives, changing minds. http://www.ifrc.org/Global/Publications/general/strategy-2020.pdf
IFRC (2011): Building Safer Communities – a community-based disaster risk reduction approach for the South Asia Region. Prepared by the IFRC South Asia Regional Delegation.
IFRC (2011a): Concept note on CBDRR for Swedish Red Cross potential funding. Scaling up CBDRR actions towards building community resilience. Dated 23.05. 2011.
IFRC (2011b): CBDRR Flood Programme review (internal document, February 2011).
ISDR (2007): Hyogo Framework for Action 2005-2015: Building the Resilience of Nations and Communities to Disasters. http://www.unisdr.org/files/1217_HFAbrochureEnglish.pdf
Karagas, M.R. (2010): Arsenic-related mortality in Bangladesh, in: The Lancet, Vol. 376, Issue 9737, p.213-214. http://www.thelancet.com/journals/lancet/article/PIIS0140-6736(10)61002-1/fulltext
Mayunga, J. S. (2007): Understanding and Applying the Concept of Community Disaster Resilience: a capital-based approach. http://www.ehs.unu.edu/file/get/3761
McAslan, A. (2010): The Concept of Resilience. Understanding its Origins, Meaning and Utility. Adelaide: Torrens Resilience Institute.
McAslan, A.(2011): Community Resilience: Understanding its Concept and its Application. Adelaide: Torrens Resilience Institute.
70
Th
e lo
ng
road
to
resi
lien
ce. I
mp
act
and
cos
t-be
nefi
t an
alys
is o
f d
isas
ter
risk
red
uct
ion
in B
angl
ades
h.

Mechler, R. and The Risk to Resilience Study Team, (2008): The Cost-Benefit Analysis Methodology, From Risk to Resilience Working Paper No. 1, eds. Moench, M., Caspari, E. & A. Pokhrel, ISET, ISET-Nepal and ProVention, Kathmandu, Nepal. http://www.preventionweb.net/english/professional/publications/v.php?id=8088
Neubert, S. (2010): Description and examples of MAPP (Method of assessment for projects and programmes. Bonn: German Development Institute. www.ngo-ideas.net/mediaCache/MAPP/
Norris, F.H., S.P. Stevens, B. Pfefferbaum, K.F. Wyche and R.L. Pfefferbaum (2008): Community Resilience as a Metaphor, Theory, Set of Capabilities and Strategy for Disaster Readiness. American Journal of Community Psychology, Vol. 41, p. 127-150.
OECD (2010): Glossary of key terms inn evaluation and results based management. Paris: OECD http://www.oecd.org/dataoecd/29/21/2754804.pdf
Paton,D. and D. Johnston (2006): Disaster Resilience: An Integrated Approach. Springfield: Chales C. Thomas Publications.
Ragno, L.P. (2009): Impact Review of the Community-Based Disaster Management Program. Prepared for IFRC, February 2009.
E. INTERVIEWS AND WORKSHOPS
Inte
rnat
ion
al F
eder
atio
n o
f R
ed C
ross
an
d R
ed C
resc
ent
Soci
etie
s
71
Date Name / community Position / remarks
17.11.2011 Udaya Kumar Regmi Head of Delegation, IFRC Bangladesh Delegation
17.11.2011 K. Jakaria Khaled Deputy Secretary-General, BDRCS National Headquarters
17.11.2011 Gaurav Ray Disaster Management Coordinator,IFRC Bangladesh Delegation
19.11.2011 Nazmul Azan Khan Director, International Relations Department, BDRCS National Headquarters
20.11.2011 Khaled Masud Ahmed Disaster Management Manager, IFRC Bangladesh Delegation
20.11.2011 Biplob Kanti Mondal Monitoring, Evaluation and Programme Support Officer CDI, IFRC Bangladesh Delegation
21.11.2011 Motiar Rahman Senior Finance Officer, IFRC Bangladesh Delegation
22.11.2011 Meeting with Chandpur District Unit
BDRCS Chandpur Unit
23.11.2011 Ananda Bazaar workshop 21 participants, key informant interviews
24.11.2011 Char Mayesha workshop 25 participants, key informant interviews
25.11.2011 Meeting with Tangail District Unit BDRCS Tangail Unit
26.11.2011 Niklagopal workshop 25 participants, key informant interviews
27.11.2011 Tarail workshop 25 participants, key informant interviews
28.11.2011 Paikpara workshop 24 participants, key informant interviews
29.11.2011 Purbolbaoitara workshop 24 participants, key informant interviews
29.11.2011 Meeting with Bogra District Unit BDRCS Bogra Unit
30.11.2011 South Digalkandi workshop 25 participants, key informant interviews
01.12.2011 Hoakowa workshop 21 participants, key informant interviews

Notes
Th
e lo
ng
road
to
resi
lien
ce. I
mp
act
and
cos
t-be
nefi
t an
alys
is o
f d
isas
ter
risk
red
uct
ion
in B
angl
ades
h.

The Fundamental Principles of the International Red Cross and Red Crescent Movement
Humanity / The International Red Cross and Red Crescent Movement, born of a desire to bring assistance without dis-crimination to the wounded on the battlefield, endeavours, in its international and national capacity, to prevent and alle-viate human suffering wherever it may be found. Its purpose is to protect life and health and to ensure respect for the human being. It promotes mutual understanding, friendship, co-operation and lasting peace amongst all peoples.
Impartiality / It makes no discrimination as to nationality, race, religious beliefs, class or political opinions. It endeavours to relieve the suffering of individuals, being guided solely by their needs, and to give priority to the most urgent cases of distress.
Neutrality / In order to enjoy the confidence of all, the Movement may not take sides in hostilities or engage at any time in controversies of a political, racial, religious or ideological nature.
Independence / The Movement is independent. The National Societies, while auxiliaries in the humanitarian services of their governments and subject to the laws of their respective countries, must always maintain their autonomy so that they may be able at all times to act in accordance with the principles of the Movement.
Voluntary service / It is a voluntary relief movement not prompted in any manner by desire for gain.
Unity / There can be only one Red Cross or Red Cres- cent Society in any one country. It must be open to all. It must carry on its humanitarian work throughout its ter- ritory.
Universality / The International Red Cross and Red Crescent Movement, in which all societies have equal status and share equal responsibilities and duties in help- ing each other, is worldwide.

For more information on the community-based disaster risk reduction programme in Bangladesh, please contact:
Bangladesh Red Crescent SocietyJakaria KhaledDeputy Secretary-GeneralTel.: +880-(0)2-933 2540E-mail: [email protected]
International Federation of Red Cross and Red Crescent SocietiesBangladesh DelegationMr. Udaya Kumar RegmiHead of DelegationTel.: +880-(0)2-933 7314E-mail: [email protected]
The International Federation of Red Cross and Red Crescent Societies promotes the humanitarian activities of National Societies among vulnerable people.
By coordinating international disaster relief and encouraging development support it seeks to prevent and alleviate human suffering.
The International Federation, the National Societies and the International Committee of the Red Cross together constitute the International Red Cross and Red Crescent Movement.
www.ifrc.orgSaving lives, changing minds.