the load generation balance report for 2017-18 is ... · भार उत्पादन...
TRANSCRIPT

भार उत्पादन संतलुन ररपोर्ट
2017-18
L OA D G E N E R AT I O N B A L A N C E R E P O RT
2 0 1 7- 1 8
भा र त स र का र
G O V E R N M E N T O F I N D I A
वि द्यु त मं त्रा ल य
M I N I S T R Y O F P O W E R
के न्द्री य वि द्यु त प्रा धि क र ण
C E N T R A L E L E C T R I C I T Y A U T H O R I T Y
( वि द्यु त अ धि नन य म , 2 0 0 3 की िा रा 7 3 ( ए ) के त ह त के . वि . प्रा . के सां वि धि क दा नय त्ि का नन िट ह न क र ते हु ए )
( I N F U L F I L L M E N T O F C E A ’ S O B L I G A T I O N U N D E R
S E C T I O N 7 3 ( A ) O F E L E C T R I C I T Y A C T , 2 0 0 3 )
S T U D E N T N A M E
R O O M N U M B E R

Central Electricity Authority LGBR: 2017-18
Ravindra Kumar Verma
Chairperson
Central Electricity Authority
Foreword
The Load Generation Balance Report (LGBR) is brought out annually by
Central Electricity Authority towards fulfillment of its obligations under section
73(a) of the Electricity Act, 2003. The annual Load Generation Balance Report
(LGBR) for the year 2017-18 is the thirty-sixth publication in the series brought
out by CEA. The Report covers the month-wise anticipated energy requirement
and availability (in MU) as well as peak demand and availability (in MW) for the
year 2017-18 considering all India annual generation target of 1229.4 BU, finalized
by CEA and approved by Ministry of Power after detailed discussions with the
States/ Utilities and Central/ State/ Private Generation Companies and
availability from import of Power from Generation Projects in Bhutan and also
availability from non-conventional and renewable energy sources in the country.
The report also brings out comparison of the actual Power Supply Position with
the forecasted Power Supply Position indicated in LGBR for the year 2016-17.
Central Electricity Authority LGBR: 2017-18
Assessment of unrestricted peak demand and unrestricted energy
requirement and peak and energy availability of constituent states of each Region
has been done by the respective Regional Power Committees (RPCs) after review
of the projections made by the constituent states, past data and the trend analysis.
The inputs provided by the RPCs have been analyzed and the anticipated month-
wise power supply position for each State, Region and the Country has been
prepared by CEA. As per this LGBR, the country is likely to experience energy
surplus of 8.8% and peak surplus of 6.8%. State-wise power supply position shows
that most the states/UTs would be having surplus energy, and the remaining few
states/UTs would need to arrange additional power from them to meet their
peaking and/or energy shortages during 2017-18.
During the year 2016-17, a total of 26,300 circuit-km (ckm) of transmission
lines and 81,816 MVA transformation capacity was added in Central, State &
Private Sector. This includes 2 nos. of 800kV HVDC line, 11 nos. of 765kV lines
& 30 nos. of 400kV lines in Central Sector and 1 no. of 765kV, 33 nos. of 400kV
& 147 nos. of 220kV lines in State Sector. Further, 4 nos. of 765kV, 22 nos. of
400kV & 2nos. of 220kV totaling 4,578 ckm of Transmission lines were added in
Private Sector during this period. With the commissioning of these transmission
lines, the inter-state and intra-state capability of power transfer in the country
enhanced considerably. Further, a generating capacity addition of 13,405 MW has
been considered in the LGBR for 2017-18. These measures are expected to
facilitate the deficit states to reduce / eliminate their shortages.
I hope that the Load Generation Balance Report would provide valuable
inputs to the Utilities for their operational planning, including bilateral tie-ups.
The report would enable the States/ Utilities to plan their power supply and
demand so as to minimize the energy and peak shortages. The information on the
anticipated power supply position in the various States would also be useful to
those involved in the power trading.
I would like to place on record my appreciation for special efforts made by
Shri Dinesh Chandra, Chief Engineer, in supervising the entire exercise and Shri
Vikram Singh, Director; Shri Annepu Suresh, Deputy Director and Shri

Central Electricity Authority LGBR: 2017-18
Anshuman Swain, Assistant Director in compilation and bringing out this
publication. Thanks are also due to Operation Performance Monitoring Division
of CEA for setting the Generation Targets for the year 2017-18 and the Member
Secretaries of all the five RPCs along with their team for furnishing the
requirement/ availability figures for 2017-18 after having detailed discussions with
the constituents of the concerned region.
Feedback from the users for improvement in the Report is welcome.
New Delhi (Ravindra Kumar Verma)
May, 2017

Central Electricity Authority LGBR: 2017-18
TABLE OF CONTENTS
SL.
NO CONTENTS PAGE
Executive Summary i
Anticipated PSP in the Country during 2017-18 iii
1 INTRODUCTION 1
2 ACTUAL POWER SUPPLY POSITION DURING 2016-17 1
2.1 All India 1
2.2 Region-wise Actual Power Supply Position 2
2.3 State-wise Actual Power Supply Position 3
2.4 Month-wise Actual Power Supply Position 4
2.5 Power Supply from Central Generating Stations 4
3 ACTUAL POWER SUPPLY POSITION VERSUS LGBR
FOR THE YEAR 2016-17 4
3.1 All India 4
3.2 Region-wise/ State-wise comparison of LGBR vs Actual
Power Supply Position 5
4 LOAD GENERATION BALANCE REPORT FOR 2017-18 9
4.1 Overview 9
4.2 Assessment of Power Supply Position for 2017-18 10
4.3 Consultation with States/ UTs 12
4.4 Anticipated power supply position for 2017-18 13
4.5 State-wise Power Supply Position 14

Central Electricity Authority LGBR: 2017-18
ANNEXURES
Annex-I Month-wise power supply position of India in 2016-17
Annex-II Actual power supply position in terms of energy requirement
vis-à-vis energy availability of various States/ Systems during
the year 2016-17
Annex-III Actual power supply position in terms of peak demand vis-à-
vis peak met of various States/ Systems during the year 2016-
17
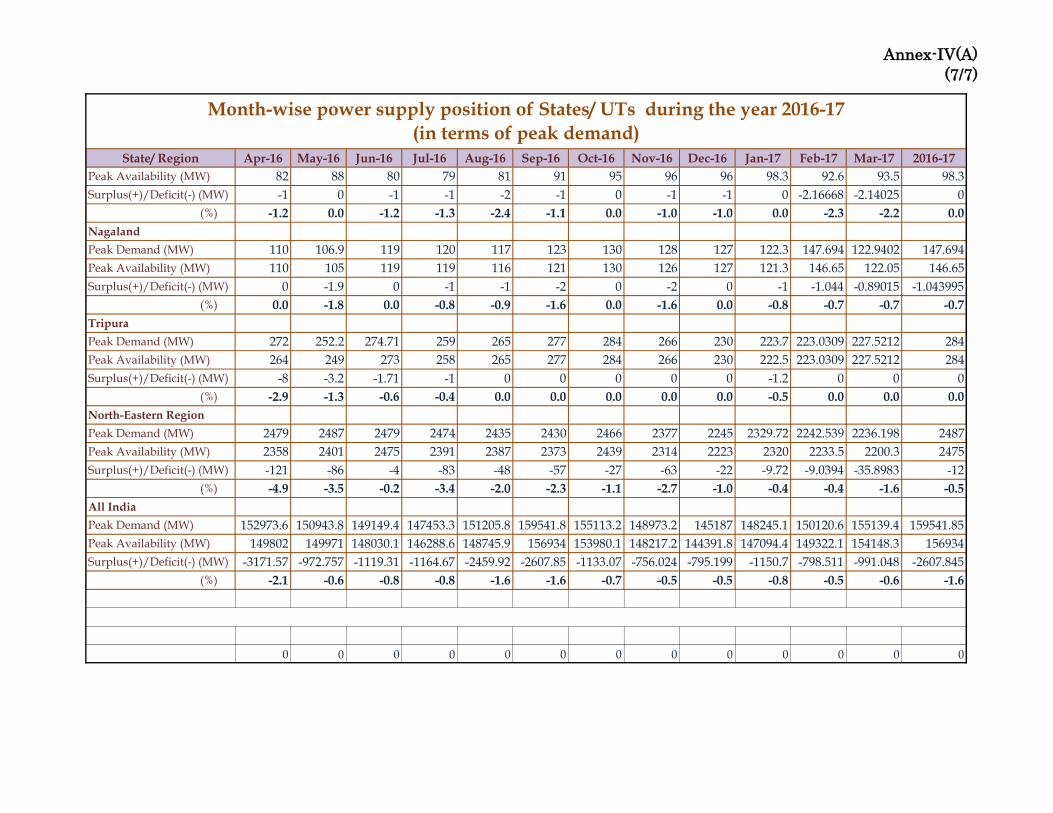
Annex–IV(A) Month-wise power supply position of States/ UTs during the
year 2016-17 (in terms of energy)
Annex–IV(B) Month-wise power supply position of States/ UTs during the
year 2016-17 (in terms of peak)
Annex-V Scheduled energy drawal by the States/ UTs vis-à-vis their
entitlement from Central Generating Stations during the year
2016-17
Annex-VI(A) Comparison of the constituent-wise forecast vis-à-vis actual
power supply position for the year 2016-17 (in terms of peak)
Annex-VI(B) Comparison of the constituent-wise forecast vis-à-vis actual
power supply position for the year 2016-17 (in terms of
energy)
Annex-VII Maintenance schedule of Nuclear/ Thermal/ Hydro based
power generating stations for the year 2017-18
Annex-VIII Generating Schemes Expected to be commissioned during
2017-18
Annex-IX Allocation of power from Central Generating Stations as on
31.03.2016 of the Northern, Western, Southern, Eastern and
North Eastern Regions
Annex-X Anticipated month-wise power supply position of All India
during the year 2017-18
Annex-XI(A) Anticipated month-wise power supply position of Northern
Region during the year 2017-18

Central Electricity Authority LGBR: 2017-18
Annex-XI(B) Anticipated month-wise power supply position of Western
Region during the year 2017-18
Annex-XI(C) Anticipated month-wise power supply position of Southern
Region during the year 2017-18
Annex-XI(D) Anticipated month-wise power supply position of Eastern
Region during the year 2017-18
Annex-XI(E) Anticipated month-wise power supply position of North
Eastern Region during the year 2017-18
Annex-XII Anticipated annual power supply position in each State/ UT
for 2017-18
Annex-XIII Anticipated month-wise power supply position of various
States/ UTs for 2017-18
EXHIBIT
Exhibit - I
Pattern of Peak Demand & Energy Requirement of the
country and five Regions during 2012-13, 2013-14, 2014-
15, 2015-16 and 2016-17 along with forecasted demand
pattern for 2017-18

Central Electricity Authority LGBR: 2017-18
EXECUTIVE SUMMARY

Central Electricity Authority LGBR: 2017-18
i
1. The assessment of the anticipated power supply position in the country
during the year 2017-18 has been made taking into consideration the power
availability from various stations in operation, including non-conventional
energy sources, fuel availability, and anticipated water availability at hydro-
electric stations. A capacity addition of 13,405 MW during the year 2017-18
comprising 11,366 MW of thermal, 1,539 MW of hydro and 500 MW of
nuclear power stations has been considered. The gross energy generation in
the country has been assessed as 1229.4 BU from the conventional power
plants in operation and those expected to be commissioned during the year
in consultation with generating companies/ SEBs and taking into
consideration the proposed maintenance schedule of the units during the
year. The monthly power requirements for all States/ UTs in terms of peak
demand and energy requirement have been assessed considering the past
trend and have been finalized in consultation with the concerned authorities
taking into consideration the specific factors, if any. The anticipated power
supply position of each state has been worked out and the assessment of
anticipated surplus/ shortages has been made which has been discussed at
the fora of Regional Power Committees. Based on the studies carried out as
above, the anticipated power supply position of the country, region-wise
emerges as presented in the Table below:
Anticipated All India Power Supply Position for the year 2017-18
State /
Region
Energy Peak
Requiremen
t Availability
Surplus (+)/
Deficit (-) Demand
Availabilit
y
Surplus (+)/
Deficit (-)
(MU) (MU) (MU) (%) (MW) (MW) (MW) (%)
Northern 373,301 409,715 36,415 9.8 56,800 60,600 3,800 6.7
Western 366,956 414,595 47,639 13.0 48,842 57,224 8,382 17.2
Southern 323,146 347,051 23,905 7.4 44,908 45,355 447 1.0
Eastern 150,151 149,871 -280 -0.2 21,577 23,743 2,166 10.0
North-
Eastern 16,106 16,595 488 3.0 2,727 2,802 75 2.7
All India 1,229,661 1,337,828 108,167 8.8 169,130 180,601 11,471 6.8

Central Electricity Authority LGBR: 2017-18
ii
2. The net energy availability and demand met includes anticipated injection
from non-conventional energy sources, surplus power from CPPs and tied up
capacity from IPPs.
3. The above anticipated All India power supply position indicates that the
country is likely to have a peak surplus of 6.8% and energy surplus of 8.8 %.
4. Surplus energy is anticipated of the order of 7.4%, 13.0%, 9.8% and 3.0% in
the Southern, Western, Northern and North-Eastern Regions respectively.
Eastern region is likely to face minor energy shortage of 0.2% which can be
met from surplus power in other regions. The peaking surplus is likely to
prevail in all the regions viz. Northern, Western, Southern, Eastern and
North-Eastern Regions to the tune of 6.7%, 17.2%, 1.0%, 10.0% and 2.7%
respectively.
5. The anticipated State-wise power supply position for the year is given in the
Table below. The month-wise power supply position in various states/
regions has also been given in the Report. There would be surplus energy in
a number of states of Southern and Western regions while some demand-
supply gap is likely to be experienced by some states, mostly in Northern,
Eastern and North-Eastern region. This information may be useful for the
utilities which are likely to experience demand-supply gap, to tie-up bilateral
exchanges/ purchase of power from the states having surplus power.

Central Electricity Authority LGBR: 2017-18
iii
Anticipated Power Supply Position in the Country during 2017-18
State / Region
ENERGY PEAK
Require
ment
Availabi
lity
Surplus(+)/
Deficit (-)
Requir
ement
Availa
bility
Surplus(+)/
Deficit(-)
(MU) (MU) (MU) (%) (MW) (MW) (MW) (%)
Chandigarh 1,707 1,665 -43 -2.5 390 365 -25 -6.4
Delhi 32,396 38,346 5,950 18.4 6,560 6,657 97 1.5
Haryana 51,353 56,029 4,676 9.1 9,890 8,880 -1,010 -10.2
Himachal
Pradesh 9,740 12,869 3,130 32.1 1,570 2,333 763 48.6
Jammu &
Kashmir 18,133 14,724 -3,409 -18.8 2,770 2,393 -377 -13.6
Punjab 55,935 58,165 2,230 4.0 12,130 11,502 -628 -5.2
Rajasthan 72,535 77,291 4,756 6.6 11,490 12,382 892 7.8
Uttar Pradesh 117,072 136,419 19,346 16.5 17,720 17,866 146 0.8
Uttarakhand 14,428 14,207 -221 -1.5 2,240 2,167 -73 -3.3
Northern
Region 373,301 409,715 36,415 9.8 56,800 60,600 3,800 6.7
Chhattisgarh 26,728 31,209 4,481 16.8 4,186 4,370 184 4.4
Gujarat 102,983 116,897 13,913 13.5 14,610 15,213 602 4.1
Madhya
Pradesh 74,386 84,183 9,797 13.2 11,595 12,537 941 8.1
Maharashtra 144,266 163,053 18,787 13.0 20,700 23,765 3,065 14.8
Daman & Diu 2,388 2,437 49 2.0 330 344 14 4.3
D.N. Haveli 5,760 6,176 416 7.2 720 737 17 2.4
Goa 4,100 4,295 195 4.8 590 598 8 1.4
Western
Region 366,956 414,595 47,639 13.0 48,842 57,224 8,382 17.2
Andhra
Pradesh 56,953 63,079 6,126 10.8 8,202 8,447 245 3.0
Karnataka 71,562 77,384 5,822 8.1 11,138 10,534 -605 -5.4
Kerala 25,504 24,879 -625 -2.5 4,387 3,928 -458 -10.4
Tamil Nadu 109,108 117,771 8,663 7.9 15,165 17,392 2,227 14.7
Telangana 56,307 59,847 3,540 6.3 9,196 8,265 -931 -10.1

Central Electricity Authority LGBR: 2017-18
iv
Puducherry 2,659 3,039 380 14.3 398 393 -5 -1.3
Southern
Region 323,146 347,051 23,905 7.4 44,908 45,355 447 1.0
Bihar 26,600 21,207 -5,393 -20.3 4,000 3,494 -506 -12.7
DVC 20,041 24,562 4,521 22.6 2,800 4,286 1,486 53.1
Jharkhand 9,485 7,005 -2,480 -26.1 1,300 1,106 -194 -14.9
Orissa 29,715 31,081 1,366 4.6 4,450 4,745 295 6.6
West Bengal 52,432 53,662 1,230 2.3 8,570 9,061 491 5.7
Sikkim 423 967 543 128.
3 90 179 89 99.1
Eastern
Region 150,151 149,871 -280 -0.2 21,577 23,743 2,166 10.0
Arunachal
Pradesh 1,696 1,674 -22 -1.3 158 152 -5 -3.4
Assam 9,628 8,434 -1,194 -12.4 1,831 1,379 -452 -24.7
Manipur 1,032 1,176 144 14.0 210 189 -21 -10.1
Meghalaya 1,720 2,355 635 36.9 346 572 227 65.6
Mizoram 531 636 105 19.8 108 165 57 52.9
Nagaland 785 821 36 4.6 149 162 13 8.4
Tripura 1,364 2,408 1,044 76.6 312 325 13 4.1
North-Eastern
Region 16,106 16,595 488 3.0 2,727 2,802 75 2.7
All India 1,229,661 1,337,828 108,167 8.8 169,130 180,601 11,471 6.8

LOAD GENERATION
BALANCE REPORT
2017-18

Central Electricity Authority LGBR: 2017-18
1
1. INTRODUCTION
The Load Generation Balance Report (LGBR) brings out the likely month-wise
position of power in terms of requirement and availability while simultaneously
identifying the States with surplus power, which could be procured/ contracted by
the States facing deficit. The LGBR, brought out by CEA, also presents a review
of the actual power supply position during the previous year in the country. Most
importantly, it makes an assessment of the power requirement of various states
during the upcoming year, as well as an assessment of power availability from
generating stations either owned by them or through their shares in the common/
central sector projects or based on long term and medium term contracts.
2. ACTUAL POWER SUPPLY POSITION DURING 2016-17
2.1 All India
During the year 2016-17, total ex-bus energy availability increased by 4.1% over
the previous year and the peak met increased by 5.7%. The energy requirement
registered a growth of 2.6% during the year against the projected growth of 9.0%
and Peak demand registered a growth of 4.0% against the projected growth of
7.8%.
2015-16 2016-17 2016-17
(Projected)
Actual
Growth
(%)
Projected
Growth
(%)
Energy Requirement
(MU) 1,114,408 1,142,929 1,214,642 2.6 9.0
Peak Demand
(MW) 153,366 159,542 165,292 4.0 7.8
Energy Availability
(MU) 1,090,851 1,135,334 1,230,677 4.1 12.8
Peak Met
(MW) 148,463 156,934 171,440 5.7 15.5
Overall, the country recorded the lowest ever demand-supply gap both in terms of
energy and peaking as given below. Even this demand-supply gap was due to
factors other than non-availability of power in the country.

Central Electricity Authority LGBR: 2017-18
2
Energy (MU) Peak (MW)
Requirement 1,142,929 159,542
Availability 1,135,334 156,934
Shortage -7,595 -2,608
(%) -0.7 -1.6
The month-wise power supply position in the Country during the year is given in
Annexure–I.
2.2 Region-wise Actual Power Supply Position
Western, Southern & Eastern Regions met the demand almost in full with
insignificant demand-supply gap both in terms of energy and peaking. Northern &
North-Eastern Regions experienced minor demand-supply gap in terms of energy
and/or peaking, on an overall basis. The demand-supply gap was on account of
the factors other than non-availability of power e.g. transmission & distribution
constraints. However, there were short-term surpluses in most of the states at some
point of time or the other depending on the season or time of the day. The surplus
power was sold to deficit states or consumers either through bilateral contracts,
Power Exchanges or traders. Region-wise picture with regard to actual power
supply position in the country during the year 2016-17 in terms of energy and peak
is given below:
Region
Energy Peak
Require
ment
Availabil
ity
Surplus /
Deficit (-) Demand
Availa
bility
Surplus /
Deficit (-)
(MU) (MU) (MU) (%) (MW) (MW) (MW) (%)
Northern 349,172 343,513 -5,659 -1.6 53,372 52,612 -760 -1.4
Western 345,247 345,127 -120 0.0 48,531 48,313 -218 -0.4
Southern 305,586 305,107 -480 -0.2 42,232 42,232 0 0.0
Eastern 127,783 126,868 -916 -0.7 18,908 18,788 -120 -0.6
North-
Eastern 15,140 14,720 -420 -2.8 2,487 2,475 -12 -0.5

Central Electricity Authority LGBR: 2017-18
3
2.3 State-wise Actual Power Supply Position
The details of annual power supply position in terms of energy requirement vis-à-
vis energy availability of various States/ Systems during the year 2016-17 are given
in Annexure – II. As already mentioned above, demand-supply gap experienced
in any State/UT was due to factors other than inadequate availability of power.
It may be seen that in Northern Region, Chandigarh, Delhi, Punjab and Haryana
met the electricity demand almost in full. Rajasthan, Himachal Pradesh,
Uttarakhand and Uttar Pradesh experienced energy shortages in the range of 0.6-
1.7%. The maximum energy shortage in Northern Region viz. 18.4%, was in
Jammu & Kashmir.
In Western Region, all the states i.e. Gujarat, Goa, Maharashtra, Madhya
Pradesh & Chhattisgarh met the demand almost in full.
In Southern Region also, all the states/UT viz. Tamil Nadu, Telangana, Andhra
Pradesh, Puducherry and Kerala met the demand almost in full., with minor
demand-supply gap in some cases being on account of the reasons other than non-
availability of power.
In Eastern Region, all the States except Bihar i.e. Sikkim, Odisha, West Bengal,
DVC and Jharkhand met the demand almost in full. The maximum energy
shortage of 2.3% was faced by Bihar.
In North-Eastern Region, Meghalaya faced no energy shortage. Arunachal
Pradesh, Mizoram, Nagaland and Tripura faced energy shortages in the range of
1.3—2.6%. The maximum energy shortage in North-Eastern Region was in
Assam and Manipur at 3.4% and 3.6%, respectively. The shortages witnessed were
partly on account of constraints in transmission, sub-transmission & distribution
system.
The constituent-wise details of actual peak demand vis-à-vis peak met during the
year 2016-17 are shown in Annexure–III. It may also be seen that the Northern,

Central Electricity Authority LGBR: 2017-18
4
Western, Eastern and North Eastern Regions faced peaking shortage of 1.4%,
0.4%, 0.6% and 0.5% respectively, while Southern Region faced no peak shortage.
2.4 Month-wise Actual Power Supply Position
The month-wise power supply position of various states of the Country is given in
Annexure-IV (A) and IV (B).
2.5 Power Supply from Central Generating Stations
The scheduled energy drawal by the beneficiary States/ UTs vis-à-vis their
entitlement from Central Generating Stations during the year 2016-17 is given in
Annexure-V.
3. ACTUAL POWER SUPPLY POSITION VERSUS L.G.B.R. FOR THE
YEAR 2016-17
3.1 All India
As per LGBR, the forecast of all India energy requirement, energy availability,
peak demand and peak met for the year 2016-17 were greater than the actual
figures by 3.5 to 8.5%. Forecast vis-à-vis actual power supply position of the
country is given below:
Power Supply Position LGBR Actual Deviation
(%)
Energy Requirement (MU) 1,214,642 1,142,929 -5.9
Energy Availability (MU) 1,230,677 1,135,334 -7.7
Peak Demand (MW) 165,292 159,542 -3.5
Peak Demand Met (MW) 171,440 156,934 -8.5

Central Electricity Authority LGBR: 2017-18
5
3.2 Region-wise/ State-wise comparison of LGBR vs Actual Power Supply
Position
A comparison of the state-wise actual power supply position both in terms of peak
and energy as against the forecast in respect of various regions for the year 2016-
17 is given in Annexure –VI(A) & VI(B) respectively. Variation in energy
availability and peak met of the states were caused by changes in allocation from
central sector projects and bilateral energy contracts of the states, which were not
envisaged during the preparation of LGBR. Region-wise analysis of forecast vis-
à-vis actual power supply position is given below:
3.2.1 Northern Region
Forecast vis-à-vis actual power supply position of Northern Region is given below:
Power Supply Position LGBR Actual Deviation
(%)
Energy Requirement (MU) 357,459 349,172 -2.3
Energy Availability (MU) 351,009 343,513 -2.1
Peak Demand (MW) 55,800 53,372 -4.4
Peak Demand Met (MW) 54,900 52,612 -4.2
The actual energy requirement, energy availability, peak demand and peak met in
the Northern Region for 2016-17 were lower by 2.3%, 2.1%, 4.4% and 4.2%
respectively. The actual energy shortage witnessed was 1.6% against the projected
figure of 1.8%.
There was no energy shortage in Chandigarh against a forecasted shortage of
0.9%. Delhi had marginal shortage against projected surplus of 18.6%. Haryana
had no energy shortage against forecasted surplus of 2.5% on account of lower
energy requirement and lower energy availability as compared to the forecast. The
actual energy shortage in the case of Himachal Pradesh was 0.6% as against the
anticipated energy surplus of 3.2%. The actual shortage in case of Jammu &
Kashmir was 18.4% against anticipated shortage of 14.3% due to higher energy
requirement and lower energy availability than anticipated. In case of Punjab,

Central Electricity Authority LGBR: 2017-18
6
there was no energy shortage against a forecasted shortage of 7.3% on account of
higher energy availability. Rajasthan had energy shortage of 0.6% against a
forecasted shortage of 0.2%. Uttar Pradesh had energy shortage of 1.7% against
forecasted shortage of 6.4%. Uttarakhand experienced a shortage of 0.6% against
anticipated energy shortage of 2.5% during the year. States which were anticipated
to be surplus, sold their surplus power through bilateral/ collective power
transactions.
3.2.2 Western Region
Forecast vis-à-vis actual power supply position of Western Region is given below:
Power Supply Position LGBR Actual Deviation
(%)
Energy Requirement (MU) 379,087 345,247 -8.9
Energy Availability (MU) 405,370 345,127 -14.9
Peak Demand (MW) 51,436 48,531 -5.6
Peak Demand Met (MW) 56,715 48,313 -14.8
The actual energy requirement, energy availability, peak demand and peak
demand met in the Western Region were lower than the forecast by 8.9%, 14.9%,
5.6% and 14.8%. The actual energy shortage in the Region was negligible as
anticipated due to forecasted surplus of 6.9%.
All the states of Western Region experienced hardly any shortage as anticipated.
Chhattisgarh had negligible shortage of 0.2% against forecast surplus of 5.7%.
Gujarat did not face any energy shortage as anticipated i.e. forecast surplus of
4.2%. Madhya Pradesh also experienced no energy shortage against a forecast
surplus of 11.9%. The actual energy shortage in Maharashtra was also Nil, as
anticipated due to estimated energy surplus of 7.4%. In case of Goa, the actual
energy shortage was negligibly small i.e. 0.1% as anticipated. Daman & Diu and
Dadra & Nagar Haveli faced no energy shortages as anticipated (forecast of energy
surplus of 2.2% each).
Central Electricity Authority LGBR: 2017-18
7
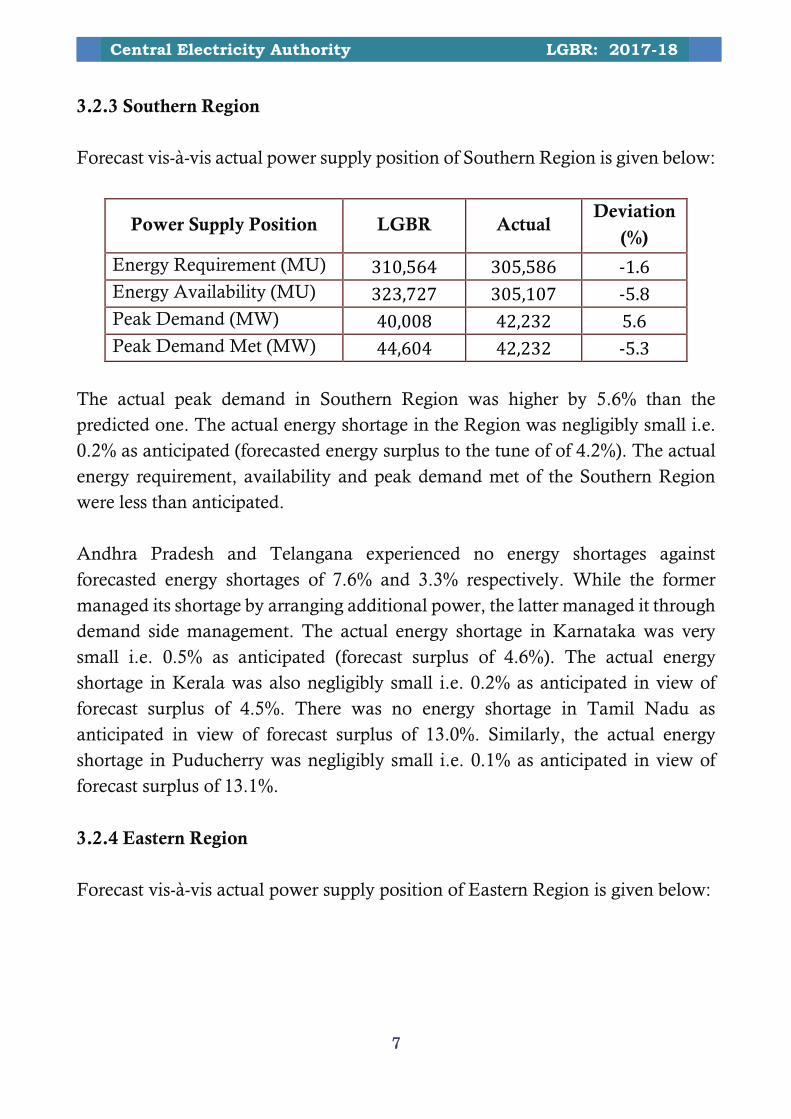
3.2.3 Southern Region
Forecast vis-à-vis actual power supply position of Southern Region is given below:
Power Supply Position LGBR Actual Deviation
(%)
Energy Requirement (MU) 310,564 305,586 -1.6
Energy Availability (MU) 323,727 305,107 -5.8
Peak Demand (MW) 40,008 42,232 5.6
Peak Demand Met (MW) 44,604 42,232 -5.3
The actual peak demand in Southern Region was higher by 5.6% than the
predicted one. The actual energy shortage in the Region was negligibly small i.e.
0.2% as anticipated (forecasted energy surplus to the tune of of 4.2%). The actual
energy requirement, availability and peak demand met of the Southern Region
were less than anticipated.
Andhra Pradesh and Telangana experienced no energy shortages against
forecasted energy shortages of 7.6% and 3.3% respectively. While the former
managed its shortage by arranging additional power, the latter managed it through
demand side management. The actual energy shortage in Karnataka was very
small i.e. 0.5% as anticipated (forecast surplus of 4.6%). The actual energy
shortage in Kerala was also negligibly small i.e. 0.2% as anticipated in view of
forecast surplus of 4.5%. There was no energy shortage in Tamil Nadu as
anticipated in view of forecast surplus of 13.0%. Similarly, the actual energy
shortage in Puducherry was negligibly small i.e. 0.1% as anticipated in view of
forecast surplus of 13.1%.
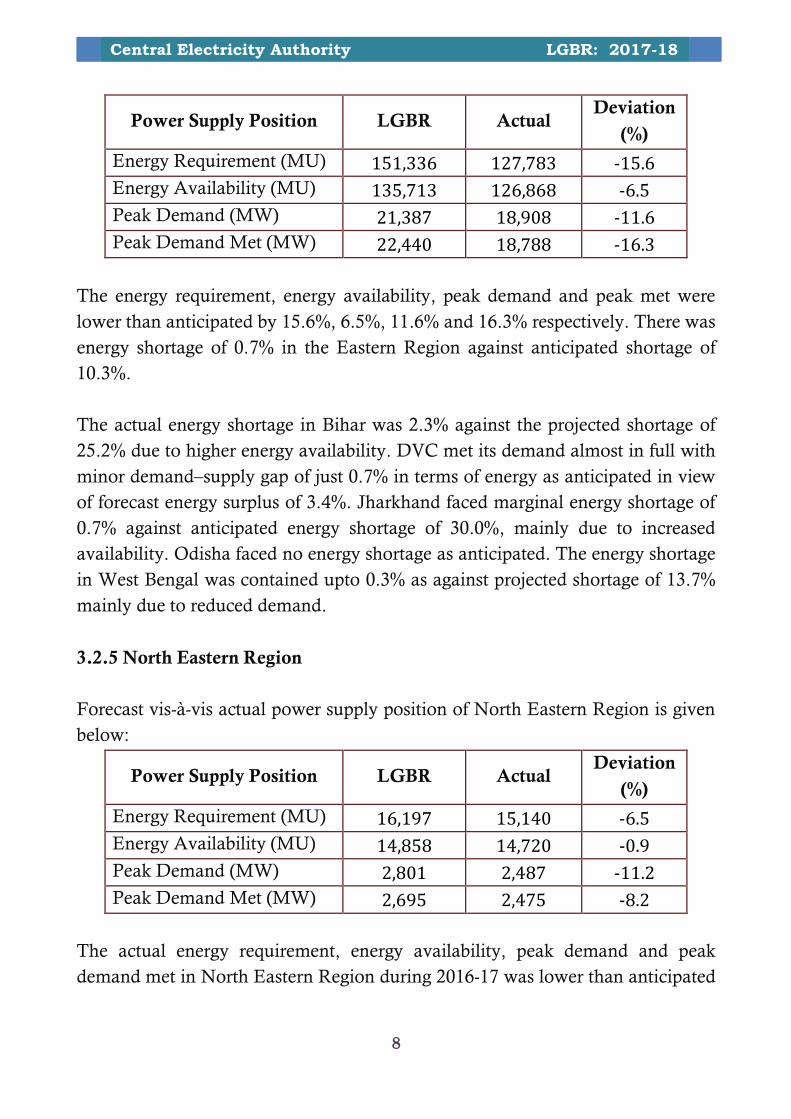
3.2.4 Eastern Region
Forecast vis-à-vis actual power supply position of Eastern Region is given below:
Central Electricity Authority LGBR: 2017-18
8
Power Supply Position LGBR Actual Deviation
(%)
Energy Requirement (MU) 151,336 127,783 -15.6
Energy Availability (MU) 135,713 126,868 -6.5
Peak Demand (MW) 21,387 18,908 -11.6
Peak Demand Met (MW) 22,440 18,788 -16.3
The energy requirement, energy availability, peak demand and peak met were
lower than anticipated by 15.6%, 6.5%, 11.6% and 16.3% respectively. There was
energy shortage of 0.7% in the Eastern Region against anticipated shortage of
10.3%.
The actual energy shortage in Bihar was 2.3% against the projected shortage of
25.2% due to higher energy availability. DVC met its demand almost in full with
minor demand–supply gap of just 0.7% in terms of energy as anticipated in view
of forecast energy surplus of 3.4%. Jharkhand faced marginal energy shortage of
0.7% against anticipated energy shortage of 30.0%, mainly due to increased
availability. Odisha faced no energy shortage as anticipated. The energy shortage
in West Bengal was contained upto 0.3% as against projected shortage of 13.7%
mainly due to reduced demand.
3.2.5 North Eastern Region
Forecast vis-à-vis actual power supply position of North Eastern Region is given
below:
Power Supply Position LGBR Actual Deviation
(%)
Energy Requirement (MU) 16,197 15,140 -6.5
Energy Availability (MU) 14,858 14,720 -0.9
Peak Demand (MW) 2,801 2,487 -11.2
Peak Demand Met (MW) 2,695 2,475 -8.2
The actual energy requirement, energy availability, peak demand and peak
demand met in North Eastern Region during 2016-17 was lower than anticipated

Central Electricity Authority LGBR: 2017-18
9
by 6.5%, 0.9%, 11.2% and 8.2% respectively. The actual energy shortage in the
Region was 2.8% as compared to forecast shortage of 8.3%.
The actual energy shortages in Arunachal Pradesh, Assam, Manipur and
Nagaland were 2.1%, 3.6%, 3.4% and 1.9% against the anticipated shortages of
8.9%, 22.4%, 3.6% and 15.0% respectively. The main reason for lower energy
shortages than the anticipated were lower actual energy requirement and higher
actual energy availability than the anticipated figures. The actual energy shortages
in the case of Mizoram and Tripura were 2.6% and 1.3% against anticipated
surplus of 10.6% and 73.9% respectively due to lower energy availability than the
forecast. The lower energy availability was due to net export of power by Mizoram
and Tripura through bilateral contracts or through traders. Meghalaya did not face
any energy shortage against an anticipated shortage of 6.8% due to lower energy
requirement.
4. LOAD GENERATION BALANCE REPORT FOR THE YEAR 2017-18
4.1 Overview
The exercise for formulating the anticipated power supply position in the country
for the next year 2017-18 involves (a) assessment of power requirements in each
State (month-wise) in terms of unrestricted energy requirement and peak demand
and (b) realistic estimate of electricity availability both in terms of energy and
capacity from various sources. While the peak demand and energy requirement in
the States are worked out on the basis of the trend analysis considering the actual
data for the preceding years as also the specific load requirements, if any, as per
established methodology; the energy availability is worked out on the basis of
generation targets set by CEA after detailed consultations with the generating
companies/ Utilities and approved by Ministry of Power. The Regional Power
Committees prepare the estimates of month-wise power requirement and
availability for each of its constituents and finalize the same in consultation with
them. The region-wise power supply position is coordinated by CEA to arrive at
the all India power supply position.
Central Electricity Authority LGBR: 2017-18
10
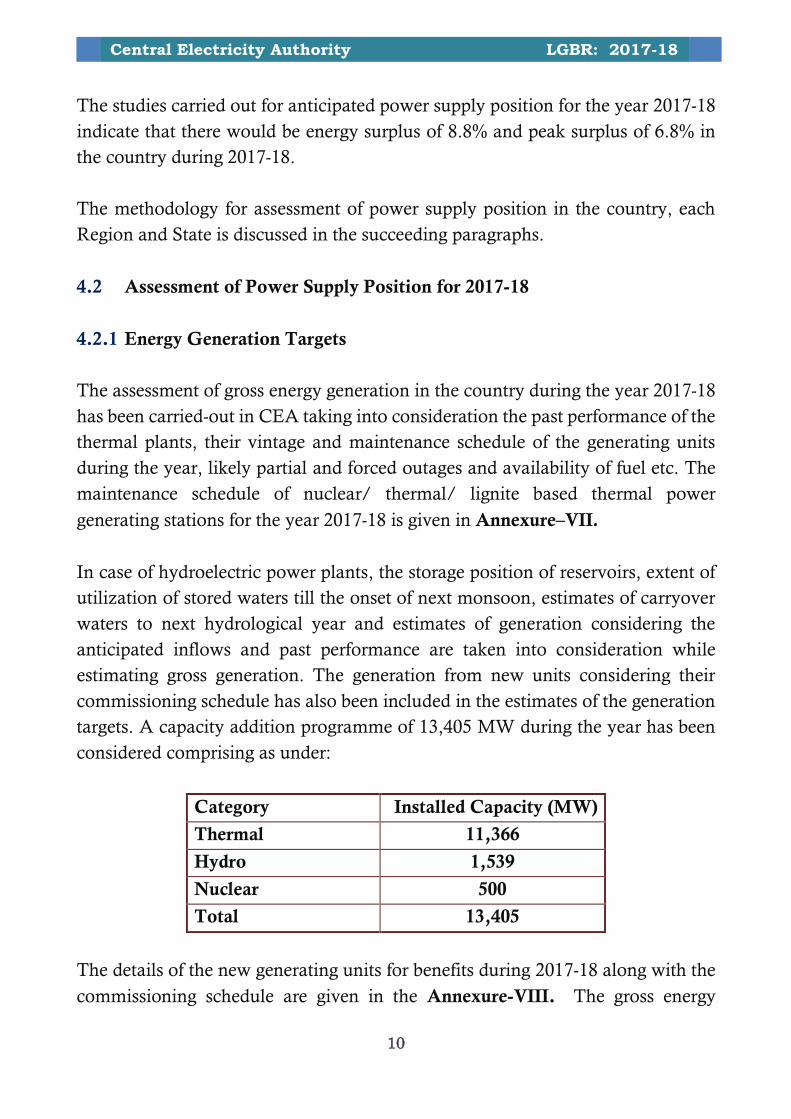
The studies carried out for anticipated power supply position for the year 2017-18
indicate that there would be energy surplus of 8.8% and peak surplus of 6.8% in
the country during 2017-18.
The methodology for assessment of power supply position in the country, each
Region and State is discussed in the succeeding paragraphs.
4.2 Assessment of Power Supply Position for 2017-18
4.2.1 Energy Generation Targets
The assessment of gross energy generation in the country during the year 2017-18
has been carried-out in CEA taking into consideration the past performance of the
thermal plants, their vintage and maintenance schedule of the generating units
during the year, likely partial and forced outages and availability of fuel etc. The
maintenance schedule of nuclear/ thermal/ lignite based thermal power
generating stations for the year 2017-18 is given in Annexure–VII.
In case of hydroelectric power plants, the storage position of reservoirs, extent of
utilization of stored waters till the onset of next monsoon, estimates of carryover
waters to next hydrological year and estimates of generation considering the
anticipated inflows and past performance are taken into consideration while
estimating gross generation. The generation from new units considering their
commissioning schedule has also been included in the estimates of the generation
targets. A capacity addition programme of 13,405 MW during the year has been
considered comprising as under:
Category Installed Capacity (MW)
Thermal 11,366
Hydro 1,539
Nuclear 500
Total 13,405
The details of the new generating units for benefits during 2017-18 along with the
commissioning schedule are given in the Annexure-VIII. The gross energy

Central Electricity Authority LGBR: 2017-18
11
generation target of 1229.4 BU for the year 2017-18, fixed in consultation with the
various generating companies and approved by Ministry of Power is detailed as
under:
Type Generation Target (BU)
Thermal 1042
Nuclear 41
Hydro 141.4
Bhutan Import 5
Total 1229.4
4.2.2 Assessment of Energy Availability
The net energy availability (ex-bus) corresponding to gross energy target as
finalized in CEA/ MoP (following the procedure as discussed above) is computed
for all generating plants taking into consideration the normative auxiliary
consumption. The energy availability in each State is worked out at respective
Regional Power Committee Secretariat as under:
(a) Generation from generating plants owned by the State,
(b) Share of Power from the common projects,
(c) Allocation of firm power from Central Generating Stations (CGSs),
(d) Allocation from unallocated quota of power from Central Generating
Stations as per the allocation in vogue.
(e) Energy import/ export under long term bilateral agreements including that
from IPPs.
(f) Generation from Non-conventional and renewable energy sources, support
from Captive Power Plants and generation from IPPs.
The allocation of power (firm as well as unallocated) from Central generating
stations as on 31.03.2016 is given in Annexure-IX. The short-term exchange as
per bilateral contracts and exchange of energy through exchanges is generally not
taken into consideration. Depending upon the actual exchanges and over-
drawals/ under-drawls of energy against schedule, the availability of power to a
State may change.

Central Electricity Authority LGBR: 2017-18
12
4.2.3 Assessment of Peak Availability
The estimated peak availability is calculated from the units available for generation
in the various utilities in different months after considering scheduled maintenance
in the RPC forum and auxiliary consumptions.
4.2.4 Assessment of Power Requirement
The assessment of the constituent-wise unrestricted peak demand and energy
requirement of each region is made using the past data and trend analysis in
consultation with the concerned state/ UTs and finalized after detailed discussions
at respective RPCs (for the forecast of the peak demand and energy requirement).
4.2.5 Assessment of Shortage/Surplus
The anticipated electricity shortage or surpluses are calculated as a difference
between the net unrestricted anticipated requirement and the net anticipated
availability in terms of energy and peak demand.
4.3 Consultations with States/ UTs
The exercise for arriving at the targets for anticipated energy generation during the
year 2017-18 has been carried out in CEA following a detailed consultation
process with the generating companies where the aspects like the maintenance
schedule are also discussed and finalized. The month-wise power requirements
and the net peak and energy availability have been discussed at RPC level with
their constituents and finalized based on the total energy availability target
finalized by CEA/ MoP.

Central Electricity Authority LGBR: 2017-18
13
4.4 Anticipated Power Supply Position during 2017-18
4.4.1 All India
During the year 2017-18, there would be anticipated energy surplus of 8.8% and
peak surplus of 6.8%. The annual energy requirement & energy availability and
peak demand & peak availability in the country are given in the Table below.
Particulars Energy ( MU) Peak (MW)
Requirement 1,229,661 169,130
Availability 1,337,828 180,601
Surplus(+)/ Shortage (-) 108,167 11,471
Surplus(+)/ Shortage(-) % 8.8 6.8
The month-wise power supply position of the country is given at Annexure-X.
4.4.2 Region-wise Power Supply Position
The region-wise anticipated month-wise power supply position for 2017-18 is
given at Annexure-XI and is summarized in the Table below:
State /
Region
Energy Peak
Requirement Availabilit
y
Surplus (+)/
Deficit (-) Demand
Availabi
lity
Surplus (+)/
Deficit (-)
(MU) (MU) (MU) (%) (MW) (MW) (MW) (%)
Northern 373,301 409,715 36,415 9.8 56,800 60,600 3,800 6.7
Western 366,956 414,595 47,639 13.0 48,842 57,224 8,382 17.2
Southern 323,146 347,051 23,905 7.4 44,908 45,355 447 1.0
Eastern 150,151 149,871 -280 -0.2 21,577 23,743 2,166 10.0
North-
Eastern 16,106 16,595 488 3.0 2,727 2,802 75 2.7

Central Electricity Authority LGBR: 2017-18
14
It may be seen that in terms of energy, while the Eastern Region would meet its
demand almost in full, other four regions would be surplus varying from 3 to 13%
with 3.0% in the North-Eastern Region, 7.4% in the Southern Region, 9.8% in the
Northern Region and 13.0% in the Western Region. In terms of peaking,
Northern, Western, Eastern, Southern and North-Eastern Regions are likely to
have peak surpluses of 6.7%, 17.2%, 1.0%, 10.0% and 2.7% respectively.
The pattern of peak demand and energy requirement in the country as well as in
Northern, Western, Southern, Eastern and North Eastern Regions during 2012-
13, 2013-14, 2014-15, 2015-16 and 2016-17 along with forecast demand patterns
for 2017-18 are given at Exhibit-1(A) to Exhibit -1(F) respectively.
4.5 State-wise Power Supply Position
The State/UT-wise annual power supply position in each State/ UT is given in
the Annexure-XII. It would be seen that 8 States/UTs would have energy deficit
and 14 States/UTs would have peak deficit of varying degrees. Further, 26 States/
UTs would have net surplus energy and 20 States/UTs would have peak surplus
on annual basis.
Range Number of States/ UTs
Energy Peak
DEFICIT
Above 20% 2 1
10% - 20% 2 7
5% - 10% 0 3
0% - 5% 4 3
Total 8 14
SURPLUS
Above 20% 5 5
10% - 20% 10 2
5% - 10% 6 5
0% - 5% 6 9
Total 27 21

Central Electricity Authority LGBR: 2017-18
15
The month-wise details of energy requirement and peak demand and
corresponding availability are given in the Annexure-XIII.
It would also be observed that Delhi, Himachal Pradesh, Rajasthan, Uttar
Pradesh, Chhattisgarh, Gujarat, Madhya Pradesh, Maharashtra, Daman & Diu,
Dadra & Nagar Haveli, Goa, Odisha, DVC, West Bengal, Mizoram, Meghalaya,
Nagaland, Tripura, Andhra Pradesh, Tamil Nadu and Sikkim are likely to have
both peaking and energy surplus on annual basis.
Haryana, Punjab, Karnataka, Telangana, Puducherry and Manipur are
anticipated to have surplus on annual basis, only in terms of energy. For meeting
peak deficit, these states may arrange power from surplus states.
All other States in the country are likely to have demand-supply gap of varying
degrees both in term of energy and peaking, which can be met by arranging power
from surplus states through various market mechanisms.
**********
ANNEXURES

Annex-I
Peak
DemandPeak Met
Surplus(+) /
Deficit(-)
(%) Surplus/
Deficit
Energy
requirementAvailability
Surplus(+) /
Deficit(-)
(%) Surplus/
Deficit
Apr-16 152,974 149,802 -3,172 -2.1 98,671 97,290 -1,381 -1.4
May-16 150,944 149,971 -973 -0.6 99,442 98,836 -606 -0.6
Jun-16 149,149 148,030 -1,119 -0.8 96,843 96,277 -566 -0.6
Jul-16 147,453 146,289 -1,165 -0.8 96,631 96,248 -383 -0.4
Aug-16 151,206 148,746 -2,460 -1.6 99,013 98,489 -524 -0.5
Sep-16 159,542 156,934 -2,608 -1.6 98,278 97,479 -799 -0.8
Oct-16 155,113 153,980 -1,133 -0.7 95,908 95,356 -551 -0.6
Nov-16 148,973 148,217 -756 -0.5 88,302 87,652 -650 -0.7
Dec-16 145,187 144,392 -795 -0.5 91,827 91,160 -667 -0.7
Jan-17 148,245 147,094 -1,151 -0.8 92,531 91,908 -623 -0.7
Feb-17 150,121 149,322 -799 -0.5 86,723 86,267 -455 -0.5
Mar-17 155,139 154,148 -991 -0.6 98,759 98,370 -389 -0.4
Annual 159,542 156,934 -2,608 -1.6 1,142,929 1,135,334 -7,595 -0.7
Year
Peak (MW) Energy (MU)
Month-wise power supply position of India in 2016-17

Annex-II
Requirement Availability
(MU) (MU) (MU) (%)
Chandigarh 1,645 1,645 0 0.0
Delhi 30,830 30,799 -31 -0.1
Haryana 48,894 48,894 0 0.0
Himachal Pradesh 8,832 8,779 -54 -0.6
Jammu & Kashmir 17,397 14,196 -3,201 -18.4
Punjab 53,098 53,098 0 0.0
Rajasthan 67,838 67,417 -421 -0.6
Uttar Pradesh 107,569 105,700 -1,869 -1.7
Uttarakhand 13,070 12,987 -83 -0.6
Northern Region 349,172 343,513 -5,659 -1.6
Chhattisgarh 23,750 23,699 -51 -0.2
Gujarat 103,704 103,703 -1 0.0
Madhya Pradesh 65,760 65,759 0 0.0
Maharashtra 139,294 139,229 -65 0.0
Daman & Diu 2,397 2,397 0 0.0
Dadra & Nagar Haveli 6,021 6,021 0 0.0
Goa 4,321 4,318 -2 -0.1
Western Region 345,247 345,127 -120 0.0
Andhra Pradesh 54,301 54,257 -44 -0.1
Karnataka 66,900 66,538 -362 -0.5
Kerala 24,297 24,261 -37 -0.2
Tamil Nadu 104,511 104,488 -24 0.0
Telangana 53,029 53,017 -12 0.0
Puducherry 2,548 2,546 -2 -0.1
Lakshadweep 48 48 0 0.0
Southern Region 305,586 305,107 -480 -0.2
Bihar 25,712 25,131 -580 -2.3
Damodar Valley Corporation 18,929 18,790 -138 -0.7
Jharkhand 7,960 7,906 -53 -0.7
Odisha 26,759 26,756 -3 0.0
West Bengal 47,949 47,809 -140 -0.3
Sikkim 474 474 0 0.0
Andaman & Nicobar 240 180 -60 -25.0
Eastern Region 127,783 126,868 -916 -0.7
Arunachal Pradesh 728 713 -15 -2.1
Assam 9,021 8,692 -329 -3.6
Manipur 764 738 -26 -3.4
Meghalaya 1,714 1,714 0 0.0
Mizoram 513 499 -13 -2.6
Nagaland 758 743 -15 -1.9
Tripura 1,642 1,621 -22 -1.3
North-Eastern Region 15,140 14,720 -420 -2.8
All India 1,142,929 1,135,334 -7,595 -0.7
Surplus(+) / Deficit(-)Region / State / System
Actual power supply position in terms of Energy Requirement vis-à-vis
Energy Availability of various States/ Systems during the year 2016-17

Annex-III
Peak Demand Peak Met
(MW) (MW) (MW) (%)
Chandigarh 361 361 0 0.0
Delhi 6,342 6,261 -81 -1.3
Haryana 9,262 9,262 0 0.0
Himachal Pradesh 1,499 1,499 0 0.0
Jammu & Kashmir 2,675 2,140 -535 -20.0
Punjab 11,408 11,408 0 0.0
Rajasthan 10,613 10,348 -265 -2.5
Uttar Pradesh 17,183 16,110 -1,073 -6.2
Uttarakhand 2,037 2,037 0 0.0
Northern Region 53,372 52,612 -760 -1.4
Chhattisgarh 3,875 3,851 -25 -0.6
Gujarat 14,724 14,719 -5 0.0
Madhya Pradesh 11,512 11,501 -11 -0.1
Maharashtra 22,516 22,207 -309 -1.4
Daman & Diu 334 334 0 0.0
Dadra & Nagar Haveli 784 784 0 0.0
Goa 546 531 -14 -2.6
Western Region 48,531 48,313 -218 -0.4
Andhra Pradesh 7,969 7,965 -4 -0.1
Karnataka 10,261 10,242 -19 -0.2
Kerala 4,132 3,996 -135 -3.3
Tamil Nadu 14,823 14,823 0 0.0
Telangana 9,187 9,187 0 0.0
Puducherry 371 368 -3 -0.7
Lakshadweep 8 8 0 0.0
Southern Region 42,232 42,232 0 0.0
Bihar 3,883 3,759 -125 -3.2
Damodar Valley Corporation 2,721 2,721 0 0.0
Jharkhand 1,498 1,498 0 0.0
Odisha 4,012 4,012 0 0.0
West Bengal 7,931 7,886 -45 -0.6
Sikkim 112 112 0 0.0
Andaman & Nicobar 40 32 -8 -20.0
Eastern Region 18,908 18,788 -120 -0.6
Arunachal Pradesh 148 140 -8 -5.4
Assam 1,673 1,633 -40 -2.4
Manipur 163 163 0 -0.2
Meghalaya 331 331 0 0.0
Mizoram 98 98 0 0.0
Nagaland 148 147 -1 -0.7
Tripura 284 284 0 0.0
North-Eastern Region 2,487 2,475 -12 -0.5
All India 159,542 156,934 -2,608 -1.6
Actual power supply position in terms of Peak Demand vis-à-vis Peak Met of
various States/ Systems during the year 2016-17
Region / State / System Surplus(+) / Deficit(-)

Annex-IV(A)
(1/7)
State/ Region Apr-16 May-16 Jun-16 Jul-16 Aug-16 Sep-16 Oct-16 Nov-16 Dec-16 Jan-17 Feb-17 Mar-17 2016-17
Chandigarh
Peak Demand (MW) 263 361 356 358 350 313 280 183 218 246 217 214 361
Peak Availability (MW) 263 361 356 358 350 313 280 183 218 246 217 214 361
Surplus(+)/Deficit(-) (MW) 0 0 0 0 0 0 0 0 0 0 0 0 0
(%) 0.0 0.0 0.0 0.0 0.0 0.0 0.0 0.0 0.0 0.0 0.0 0.0 0.0
Delhi
Peak Demand (MW) 4799 6308 6261 6342 5707 5305 5442 3510 3857 4168 3882 4139 6342
Peak Availability (MW) 4797 6188 6261 6261 5707 5301 5442 3510 3857 4168 3882 4139 6261
Surplus(+)/Deficit(-) (MW) -2 -120 0 -81 0 -4 0 0 0 0 0 0 -81
(%) 0.0 -1.9 0.0 -1.3 0.0 -0.1 0.0 0.0 0.0 0.0 0.0 0.0 -1.3
Haryana
Peak Demand (MW) 7477 7950 8763 9262 8984 9109 8181 6642 6561 6815 6556 6668 9262
Peak Availability (MW) 7477 7950 8763 9262 8984 9109 8181 6642 6561 6815 6556 6668 9262
Surplus(+)/Deficit(-) (MW) 0 0 0 0 0 0 0 0 0 0 0 0 0
(%) 0.0 0.0 0.0 0.0 0.0 0.0 0.0 0.0 0.0 0.0 0.0 0.0 0.0
Himachal Pradesh
Peak Demand (MW) 1272 1270 1330 1297 1293 1329 1342 1410 1408 1492 1479 1499 1499
Peak Availability (MW) 1272 1270 1330 1297 1293 1329 1342 1410 1408 1492 1479 1499 1499
Surplus(+)/Deficit(-) (MW) 0 0 0 0 0 0 0 0 0 0 0 0 0
(%) 0.0 0.0 0.0 0.0 0.0 0.0 0.0 0.0 0.0 0.0 0.0 0.0 0.0
Jammu & Kashmir
Peak Demand (MW) 2412 2478 2466 2385 2367 2469 2480 2480 2591 2675 2622 2542 2675
Peak Availability (MW) 2046 2102 2092 1950 2008 1975 1984 1984 2073 2140 2098 2033 2140
Surplus(+)/Deficit(-) (MW) -366 -376 -374 -435 -359 -494 -496 -496 -518 -535 -524 -509 -535
(%) -15.2 -15.2 -15.2 -18.2 -15.2 -20.0 -20.0 -20.0 -20.0 -20.0 -20.0 -20.0 -20.0
Punjab
Peak Demand (MW) 6283 7997 10997 11408 11204 10543 8408 5548 6266 5954 6475 6536 11408
Peak Availability (MW) 6283 7997 10997 11408 11204 10543 8408 5548 6266 5954 6475 6536 11408
Surplus(+)/Deficit(-) (MW) 0 0 0 0 0 0 0 0 0 0 0 0 0
(%) 0.0 0.0 0.0 0.0 0.0 0.0 0.0 0.0 0.0 0.0 0.0 0.0 0.0
Rajasthan
Peak Demand (MW) 9027 9690 9906 9288 7807 9816 9046 9902 10613 10348 10527 9859 10613
Month-wise power supply position of States/ UTs during the year 2016-17
(in terms of peak demand)

Annex-IV(A)
(2/7)
State/ Region Apr-16 May-16 Jun-16 Jul-16 Aug-16 Sep-16 Oct-16 Nov-16 Dec-16 Jan-17 Feb-17 Mar-17 2016-17
Month-wise power supply position of States/ UTs during the year 2016-17
(in terms of peak demand)
Peak Availability (MW) 9027 9690 9906 9168 7807 9816 9016 9902 10113 10348 10322 9859 10348
Surplus(+)/Deficit(-) (MW) 0 0 0 -120 0 0 -30 0 -500 0 -205 0 -265
(%) 0.0 0.0 0.0 -1.3 0.0 0.0 -0.3 0.0 -4.7 0.0 -1.9 0.0 -2.5
Uttar Pradesh
Peak Demand (MW) 14447 16498 16450 16123 15614.32 17183.17 15672.54 14424 13748 14344 14133 16110 17183.166
Peak Availability (MW) 14197 14970 15501 15154 14690 15457 15398 14424 13673 14344 14133 16110 16110
Surplus(+)/Deficit(-) (MW) -250 -1528 -949 -969 -924.317 -1726.17 -274.535 0 -75 0 0 0 -1073.166
(%) -1.7 -9.3 -5.8 -6.0 -5.9 -10.0 -1.8 0.0 -0.5 0.0 0.0 0.0 -6.2
Uttarakhand
Peak Demand (MW) 1911 2013 2020 1972 1963 1942 1972 1785 1857 2037 1973 1843 2037
Peak Availability (MW) 1911 1938 1945 1907 1888 1942 1972 1785 1857 2037 1973 1843 2037
Surplus(+)/Deficit(-) (MW) 0 -75 -75 -65 -75 0 0 0 0 0 0 0 0
(%) 0.0 -3.7 -3.7 -3.3 -3.8 0.0 0.0 0.0 0.0 0.0 0.0 0.0 0.0
Northern Region
Peak Demand (MW) 47520 50644 53372 52151 51426 52772.47 48963 41535 45782 44985 43827 46127 53372
Peak Availability (MW) 44934 49977 52612 51658 50081 51816.47 48514 41082 44389 44447 43098 45659 52612
Surplus(+)/Deficit(-) (MW) -2586 -667 -760 -493 -1345 -956 -449 -453 -1393 -538 -729 -468 -760
(%) -5.4 -1.3 -1.4 -0.9 -2.6 -1.8 -0.9 -1.1 -3.0 -1.2 -1.7 -1.0 -1.4
Chhattisgarh
Peak Demand (MW) 3875.413 3390.028 3292.563 3359.556 3848.347 3453.039 3247 3086.747 3502.402 3307.515 3397.317 3707.672 3875.4131
Peak Availability (MW) 3850.86 3387.51 3184.202 3320.516 3827.357 3449.219 3242 3057.933 3499.822 3110.235 3389.317 3642.292 3850.8598
Surplus(+)/Deficit(-) (MW) -24.5533 -2.5179 -108.36 -39.04 -20.99 -3.82 -5 -28.8143 -2.58 -197.28 -8 -65.38 -24.5533
(%) -0.6 -0.1 -3.3 -1.2 -0.5 -0.1 -0.2 -0.9 -0.1 -6.0 -0.2 -1.8 -0.6
Gujarat
Peak Demand (MW) 13533.08 14701.06 14724.16 12692.35 12563.88 14666 14134.21 12915.49 12919.95 13187.88 13359.23 14723.93 14724.16
Peak Availability (MW) 13513.4 14663.96 14708.27 12692 12563.88 14666 14134.21 12910.84 12882.67 13173.65 13354.24 14719.14 14719.143
Surplus(+)/Deficit(-) (MW) -19.6756 -37.0979 -15.8939 -0.34714 0 0 0 -4.65465 -37.2792 -14.2296 -4.99 -4.79 -5.017242
(%) -0.1 -0.3 -0.1 0.0 0.0 0.0 0.0 0.0 -0.3 -0.1 0.0 0.0 0.0
Madhya Pradesh
Peak Demand (MW) 8144.659 7980.045 7359.847 6671.183 6759.202 7910.075 8831.829 10893.88 11511.7 11352.99 10915.29 9848.065 11511.699
Peak Availability (MW) 8110.767 7975.254 7343.951 6659.503 6759.202 7893.075 8831.829 10866.82 11501.19 11352.99 10903.64 9830.515 11501.189
Surplus(+)/Deficit(-) (MW) -33.8929 -4.79196 -15.896 -11.68 0 -17 0 -27.0603 -10.51 0 -11.65 -17.55 -10.51

Annex-IV(A)
(3/7)
State/ Region Apr-16 May-16 Jun-16 Jul-16 Aug-16 Sep-16 Oct-16 Nov-16 Dec-16 Jan-17 Feb-17 Mar-17 2016-17
Month-wise power supply position of States/ UTs during the year 2016-17
(in terms of peak demand)
(%) -0.4 -0.1 -0.2 -0.2 0.0 -0.2 0.0 -0.2 -0.1 0.0 -0.1 -0.2 -0.1
Maharashtra
Peak Demand (MW) 20057.41 19916.38 19813.02 16014.27 18656.99 20239.5 20499.04 20305.13 19899.18 20314.89 21280.6 22515.76 22515.762
Peak Availability (MW) 20021.49 19909.23 19127.86 15996.95 18643.62 20232.25 20462.38 20297.85 19835.03 20300.22 21204.24 22206.76 22206.762
Surplus(+)/Deficit(-) (MW) -35.9135 -7.15785 -685.166 -17.32 -13.37 -7.25 -36.6642 -7.28175 -64.15 -14.67 -76.36 -309 -309
(%) -0.2 0.0 -3.5 -0.1 -0.1 0.0 -0.2 0.0 -0.3 -0.1 -0.4 -1.4 -1.4
Daman & Diu
Peak Demand (MW) 304.36 304.36 327.12 327 327.12 327.12 327.12 314.4 296.42 311.54 281.391 333.53 333.53
Peak Availability (MW) 304.36 304.36 327.12 327 327.12 327.12 327.12 314.4 296.42 311.54 281.391 333.53 333.53
Surplus(+)/Deficit(-) (MW) 0 0 0 0 0 0 0 0 0 0 0 0 0
(%) 0.0 0.0 0.0 0.0 0.0 0.0 0.0 0.0 0.0 0.0 0.0 0.0 0.0
Dadra & Nagar Haveli
Peak Demand (MW) 726 753 781 745 759 776 784 761 721 743 671.0968 753 784
Peak Availability (MW) 726 753 781 745 759 776 784 761 721 743 671.0968 753 784
Surplus(+)/Deficit(-) (MW) 0 0 0 0 0 0 0 0 0 0 0 0 0
(%) 0.0 0.0 0.0 0.0 0.0 0.0 0.0 0.0 0.0 0.0 0.0 0.0 0.0
Goa
Peak Demand (MW) 446.09 473 497.3888 456 492.72 468.33 487.3409 531.3717 461.7875 482.3 515.36 545.56 545.56
Peak Availability (MW) 446 473 496 456 491 468 487.3409 531.3717 411 432 515.36 530 531.3717
Surplus(+)/Deficit(-) (MW) -0.09 0 -1.3888 0 -1.72 -0.33 0 0 -50.7875 -50.3 0 -15.56 -14.1883
(%) 0.0 0.0 -0.3 0.0 -0.3 -0.1 0.0 0.0 -11.0 -10.4 0.0 -2.9 -2.6
Western Region
Peak Demand (MW) 45022.14 45369.27 44714.08 38998.57 40122.09 46110 46123.26 46897.86 47837.02 47880.58 47993.92 48530.91 48530.905
Peak Availability (MW) 44940.14 44957.32 43997.97 38708.57 39903.09 46010 46090.26 46864.86 47463.02 47843.58 47820.92 48312.91 48312.905
Surplus(+)/Deficit(-) (MW) -81.9927 -411.945 -716.108 -290 -219 -100 -33 -33 -374 -37 -173 -218 -218
(%) -0.2 -0.9 -1.6 -0.7 -0.5 -0.2 -0.1 -0.1 -0.8 -0.1 -0.4 -0.4 -0.4
Andhra Pradesh
Peak Demand (MW) 7576.089 7372.912 7037.606 7175 7969.492 7725.601 7404.946 7299.9 7141.472 7371.64 7541.154 7660.161 7969.4922
Peak Availability (MW) 7359 7361 7000 7175 7965 7714 7404 7296 7117 7367 7522 7660.161 7965
Surplus(+)/Deficit(-) (MW) -217.089 -11.9117 -37.6061 0 -4.4922 -11.6007 -0.94629 -3.89982 -24.4722 -4.64029 -19.1535 0 -4.492198
(%) -2.9 -0.2 -0.5 0.0 -0.1 -0.2 0.0 -0.1 -0.3 -0.1 -0.3 0.0 -0.1
Karnataka

Annex-IV(A)
(4/7)
State/ Region Apr-16 May-16 Jun-16 Jul-16 Aug-16 Sep-16 Oct-16 Nov-16 Dec-16 Jan-17 Feb-17 Mar-17 2016-17
Month-wise power supply position of States/ UTs during the year 2016-17
(in terms of peak demand)
Peak Demand (MW) 9979.585 9303.943 8183.273 8301.89 9324.174 9503.921 9850.775 10061.1 9343.932 9577.013 10260.97 10187.22 10260.969
Peak Availability (MW) 9551.235 9302.095 8183.273 8301.89 9218.453 9496.815 9574.258 9870.568 9330.575 9530 10242.2 10170.42 10242.2
Surplus(+)/Deficit(-) (MW) -428.35 -1.84807 0 0 -105.721 -7.10573 -276.518 -190.535 -13.3573 -47.0132 -18.7687 -16.7962 -18.76865
(%) -4.3 0.0 0.0 0.0 -1.1 -0.1 -2.8 -1.9 -0.1 -0.5 -0.2 -0.2 -0.2
Kerala
Peak Demand (MW) 4131.589 4058.839 3565.075 3371.732 3542.193 3504.813 3640.225 3637.519 3623.812 3594.332 3695.552 3807.276 4131.5888
Peak Availability (MW) 3996.432 3931.706 3493.789 3368.969 3528.467 3504.79 3597.512 3594.793 3525.845 3594.332 3688.488 3798.11 3996.4319
Surplus(+)/Deficit(-) (MW) -135.157 -127.133 -71.2865 -2.76378 -13.7268 -0.02303 -42.7134 -42.7252 -97.9673 0 -7.06358 -9.16654 -135.1569
(%) -3.3 -3.1 -2.0 -0.1 -0.4 0.0 -1.2 -1.2 -2.7 0.0 -0.2 -0.2 -3.3
Tamil Nadu
Peak Demand (MW) 14822.67 14705.97 14362.44 14517.37 14236.97 14462.6 14435.12 13902.44 13319.11 13704.8 13646.71 14249.52 14822.669
Peak Availability (MW) 14822.67 14668.02 14357.78 14467.48 14158.1 14385.22 14435.12 13893.25 13316.14 13685.1 13639.93 14222.68 14822.669
Surplus(+)/Deficit(-) (MW) 0 -37.9482 -4.65411 -49.8853 -78.869 -77.3826 0 -9.19674 -2.97268 -19.694 -6.78143 -26.847 0
(%) 0.0 -0.3 0.0 -0.3 -0.6 -0.5 0.0 -0.1 0.0 -0.1 0.0 -0.2 0.0
Telangana
Peak Demand (MW) 6934.654 6340.214 6113.591 6890 8235.542 8283.768 7799.684 7567.782 7847.583 8407.211 8947.809 9186.959 9186.9588
Peak Availability (MW) 6894 6290 6082 6890 8223 8283.768 7789 7561 7831 8391 8944 9186.959 9186.9588
Surplus(+)/Deficit(-) (MW) -40.654 -50.2136 -31.5914 0 -12.5418 0 -10.6837 -6.78186 -16.583 -16.2114 -3.80899 0 0
(%) -0.6 -0.8 -0.5 0.0 -0.2 0.0 -0.1 -0.1 -0.2 -0.2 0.0 0.0 0.0
Puducherry
Peak Demand (MW) 370.6192 368.0755 369.0736 358.1635 362.4934 358.7126 356.9396 359.6796 326.6403 328.9853 344.4589 354.3629 370.61922
Peak Availability (MW) 360 368.0755 367.1476 357.6476 360.6532 358.1447 345.8738 348.1575 326.2102 328.8314 344.4438 354.3629 368.07549
Surplus(+)/Deficit(-) (MW) -10.6192 0 -1.92596 -0.51585 -1.84017 -0.56791 -11.0658 -11.5221 -0.43012 -0.15394 -0.01507 0 -2.543729
(%) -2.9 0.0 -0.5 -0.1 -0.5 -0.2 -3.1 -3.2 -0.1 0.0 0.0 0.0 -0.7
Lakshadweep
Peak Demand (MW) 8 8 8 8 8 8 8 8 8 8 8 8 8
Peak Availability (MW) 8 8 8 8 8 8 8 8 8 8 8 8 8
Surplus(+)/Deficit(-) (MW) 0 0 0 0 0 0 0 0 0 0 0 0 0
(%) 0 0 0 0 0 0 0 0 0 0 0 0 0
Southern Region
Peak Demand (MW) 40752.2 39823.46 37079.21 36215.31 40923.06 41298 42051.81 40449.55 38541.9 40807.99 41188 42231.84 42231.835
Peak Availability (MW) 40471.85 39666.55 36816.91 36171.86 40531.97 41259 41610 40192 38528 40744 41155 42231.84 42231.835

Annex-IV(A)
(5/7)
State/ Region Apr-16 May-16 Jun-16 Jul-16 Aug-16 Sep-16 Oct-16 Nov-16 Dec-16 Jan-17 Feb-17 Mar-17 2016-17
Month-wise power supply position of States/ UTs during the year 2016-17
(in terms of peak demand)
Surplus(+)/Deficit(-) (MW) -280.354 -156.915 -262.308 -43.45 -391.085 -39 -441.81 -257.55 -13.9 -63.99 -33 0 0
(%) -0.7 -0.4 -0.7 -0.1 -1.0 -0.1 -1.1 -0.6 0.0 -0.2 -0.1 0.0 0.0
Bihar
Peak Demand (MW) 3541.72 3662.28 3590.6 3716.76 3403 3843.4 3883.16 3854.56 3728.72 3810.2 3810.16 3814.6 3883.16
Peak Availability (MW) 3520.72 3638.28 3440.6 3595.76 3403 3624.4 3702.16 3758.56 3533.72 3701.2 3543.16 3714.6 3758.56
Surplus(+)/Deficit(-) (MW) -21 -24 -150 -121 0 -219 -181 -96 -195 -109 -267 -100 -124.6
(%) -0.6 -0.7 -4.2 -3.3 0.0 -5.7 -4.7 -2.5 -5.2 -2.9 -7.0 -2.6 -3.2Damodar Valley
CorporationPeak Demand (MW) 2562.4 2477.95 2685.69 2458.85 2469.04 2523.72 2450.02 2357.22 2506.9 2721 2570.225 2662.75 2721
Peak Availability (MW) 2562.4 2477.95 2685.69 2458.85 2469.04 2523.72 2450.02 2357.22 2506.9 2721 2570.225 2662.75 2721
Surplus(+)/Deficit(-) (MW) 0 0 0 0 0 0 0 0 0 0 0 0 0
(%) 0.0 0.0 0.0 0.0 0.0 0.0 0.0 0.0 0.0 0.0 0.0 0.0 0.0
Jharkhand
Peak Demand (MW) 1177.27 1498.37 1118.92 1133.83 1142.31 1152.914 1171.51 1167.71 1193.71 1211.24 1165.42 1147.86 1498.37
Peak Availability (MW) 1177.27 1498.37 1118.92 1133.83 1142.31 1152.914 1171.51 1167.71 1193.71 1211.24 1165.42 1147.86 1498.37
Surplus(+)/Deficit(-) (MW) 0 0 0 0 0 0 0 0 0 0 0 0 0
(%) 0.0 0.0 0.0 0.0 0.0 0.0 0.0 0.0 0.0 0.0 0.0 0.0 0.0
Odisha
Peak Demand (MW) 4012.4 3897.9 3969.8 3988.6 3918.9 3864.62 3919.6 3787.6 3837 3720.3 3847 3989.2 4012.4
Peak Availability (MW) 4012.4 3897.9 3969.8 3988.6 3918.9 3864.62 3919.6 3787.6 3837 3720.3 3847 3989.2 4012.4
Surplus(+)/Deficit(-) (MW) 0 0 0 0 0 0 0 0 0 0 0 0 0
(%) 0.0 0.0 0.0 0.0 0.0 0.0 0.0 0.0 0.0 0.0 0.0 0.0 0.0
West Bengal
Peak Demand (MW) 7649 7665 7564 7453 7657 7709 7931 7416 6210 6630.1 7041 7864 7931
Peak Availability (MW) 7602 7641 7542 7434 7625 7653 7886 7402 6207 6604.1 7036 7840 7886
Surplus(+)/Deficit(-) (MW) -47 -24 -22 -19 -32 -56 -45 -14 -3 -26 -5 -24 -45
(%) -0.6 -0.3 -0.3 -0.3 -0.4 -0.7 -0.6 -0.2 0.0 -0.4 -0.1 -0.3 -0.6
Sikkim
Peak Demand (MW) 112 93 93 97 97 97 92 92 91 91 91 91 112
Peak Availability (MW) 112 93 93 97 97 97 92 92 91 91 91 91 112
Surplus(+)/Deficit(-) (MW) 0 0 0 0 0 0 0 0 0 0 0 0 0
(%) 0.0 0.0 0.0 0.0 0.0 0.0 0.0 0.0 0.0 0.0 0.0 0.0 0.0

Annex-IV(A)
(6/7)
State/ Region Apr-16 May-16 Jun-16 Jul-16 Aug-16 Sep-16 Oct-16 Nov-16 Dec-16 Jan-17 Feb-17 Mar-17 2016-17
Month-wise power supply position of States/ UTs during the year 2016-17
(in terms of peak demand)
Andaman & Nicobar
Peak Demand (MW) 40 40 40 40 40 40 40 40 40 40 40 40 40
Peak Availability (MW) 32 32 32 32 32 32 32 32 32 32 32 32 32
Surplus(+)/Deficit(-) (MW) -8 -8 -8 -8 -8 -8 -8 -8 -8 -8 -8 -8 -8
(%) -20 -20 -20 -20 -20 -20 -20 -20 -20 -20 -20 -20 -20
Eastern Region
Peak Demand (MW) 18410.43 18642.03 18378.75 18210.67 18055.31 18541.69 18789.65 18043.57 16973.27 17568.93 17898.36 18907.64 18907.643
Peak Availability (MW) 18344.72 18595.65 18212.57 18075.4 18024.4 18275.99 18571.29 17937.29 16781.96 17438.49 17635.56 18787.84 18787.836
Surplus(+)/Deficit(-) (MW) -65.7005 -46.3768 -166.184 -135.266 -30.9179 -265.7 -218.357 -106.28 -191.304 -130.435 -262.802 -119.807 -119.8068
(%) -0.4 -0.2 -0.9 -0.7 -0.2 -1.4 -1.2 -0.6 -1.1 -0.7 -1.5 -0.6 -0.6
Arunachal Pradesh
Peak Demand (MW) 141 118.7 131 136 148 143 128 127 131 122.072 138.9678 139.221 148
Peak Availability (MW) 139 118.7 130 135 140 136 126 127 129 120 134.806 138.014 140
Surplus(+)/Deficit(-) (MW) -2 0 -1 -1 -8 -7 -2 0 -2 -2.072 -4.16177 -1.20702 -8
(%) -1.4 0.0 -0.8 -0.7 -5.4 -4.9 -1.6 0.0 -1.5 -1.7 -3.0 -0.9 -5.4
Assam
Peak Demand (MW) 1446 1496.7 1511 1591 1661 1616 1673 1531 1388 1465.52 1398.476 1392.221 1673
Peak Availability (MW) 1356 1423 1458 1547 1633 1576 1615 1524 1388 1464.3 1395.5 1391.3 1633
Surplus(+)/Deficit(-) (MW) -90 -73.7 -53 -44 -28 -40 -58 -7 0 -1.22 -2.9762 -0.92088 -40
(%) -6.2 -4.9 -3.5 -2.8 -1.7 -2.5 -3.5 -0.5 0.0 -0.1 -0.2 -0.1 -2.4
Manipur
Peak Demand (MW) 146 144.6 152 141 145 151 145 152 161 163.2158 163.2916 160.3198 163.2916
Peak Availability (MW) 146 144.3 151 141 145 148 145 151 157 162.9 162 158.13 162.9
Surplus(+)/Deficit(-) (MW) 0 -0.3 -1 0 0 -3 0 -1 -4 -0.31582 -1.2916 -2.18976 -0.3916
(%) 0.0 -0.2 -0.7 0.0 0.0 -2.0 0.0 -0.7 -2.5 -0.2 -0.8 -1.4 -0.2
Meghalaya
Peak Demand (MW) 295 281.5 311 292 296 298 300 312 309 331.1249 300.1896 297.8678 331.12494
Peak Availability (MW) 295 281.5 311 292 296 298 300 312 309 331.1249 299.63 297.53 331.12494
Surplus(+)/Deficit(-) (MW) 0 0 0 0 0 0 0 0 0 0 -0.55956 -0.33778 0
(%) 0.0 0.0 0.0 0.0 0.0 0.0 0.0 0.0 0.0 0.0 -0.2 -0.1 0.0
Mizoram
Peak Demand (MW) 83 88 81 80 83 92 95 97 97 98.3 94.76668 95.64025 98.3
Annex-IV(A)
(7/7)
State/ Region Apr-16 May-16 Jun-16 Jul-16 Aug-16 Sep-16 Oct-16 Nov-16 Dec-16 Jan-17 Feb-17 Mar-17 2016-17
Month-wise power supply position of States/ UTs during the year 2016-17
(in terms of peak demand)
Peak Availability (MW) 82 88 80 79 81 91 95 96 96 98.3 92.6 93.5 98.3
Surplus(+)/Deficit(-) (MW) -1 0 -1 -1 -2 -1 0 -1 -1 0 -2.16668 -2.14025 0
(%) -1.2 0.0 -1.2 -1.3 -2.4 -1.1 0.0 -1.0 -1.0 0.0 -2.3 -2.2 0.0
Nagaland
Peak Demand (MW) 110 106.9 119 120 117 123 130 128 127 122.3 147.694 122.9402 147.694
Peak Availability (MW) 110 105 119 119 116 121 130 126 127 121.3 146.65 122.05 146.65
Surplus(+)/Deficit(-) (MW) 0 -1.9 0 -1 -1 -2 0 -2 0 -1 -1.044 -0.89015 -1.043995
(%) 0.0 -1.8 0.0 -0.8 -0.9 -1.6 0.0 -1.6 0.0 -0.8 -0.7 -0.7 -0.7
Tripura
Peak Demand (MW) 272 252.2 274.71 259 265 277 284 266 230 223.7 223.0309 227.5212 284
Peak Availability (MW) 264 249 273 258 265 277 284 266 230 222.5 223.0309 227.5212 284
Surplus(+)/Deficit(-) (MW) -8 -3.2 -1.71 -1 0 0 0 0 0 -1.2 0 0 0
(%) -2.9 -1.3 -0.6 -0.4 0.0 0.0 0.0 0.0 0.0 -0.5 0.0 0.0 0.0
North-Eastern Region
Peak Demand (MW) 2479 2487 2479 2474 2435 2430 2466 2377 2245 2329.72 2242.539 2236.198 2487
Peak Availability (MW) 2358 2401 2475 2391 2387 2373 2439 2314 2223 2320 2233.5 2200.3 2475
Surplus(+)/Deficit(-) (MW) -121 -86 -4 -83 -48 -57 -27 -63 -22 -9.72 -9.0394 -35.8983 -12
(%) -4.9 -3.5 -0.2 -3.4 -2.0 -2.3 -1.1 -2.7 -1.0 -0.4 -0.4 -1.6 -0.5
All India
Peak Demand (MW) 152973.6 150943.8 149149.4 147453.3 151205.8 159541.8 155113.2 148973.2 145187 148245.1 150120.6 155139.4 159541.85
Peak Availability (MW) 149802 149971 148030.1 146288.6 148745.9 156934 153980.1 148217.2 144391.8 147094.4 149322.1 154148.3 156934
Surplus(+)/Deficit(-) (MW) -3171.57 -972.757 -1119.31 -1164.67 -2459.92 -2607.85 -1133.07 -756.024 -795.199 -1150.7 -798.511 -991.048 -2607.845
(%) -2.1 -0.6 -0.8 -0.8 -1.6 -1.6 -0.7 -0.5 -0.5 -0.8 -0.5 -0.6 -1.6
0 0 0 0 0 0 0 0 0 0 0 0 0

Annex-IV(B)
(1/7)
State/ Region Apr-16 May-16 Jun-16 Jul-16 Aug-16 Sep-16 Oct-16 Nov-16 Dec-16 Jan-17 Feb-17 Mar-17 2016-17
Chandigarh
Requirement (MU) 131.336 172.75 184.886 185.131 172.069 163.783 125.199 95.569 104.129 113.15 93.24 103.502 1644.744
Availability (MU) 131.336 172.75 184.886 185.131 172.069 163.783 125.199 95.569 104.129 113.15 93.24 103.502 1644.744
Surplus(+)/Deficit(-) (MU) 0 0 0 0 0 0 0 0 0 0 0 0 0
(%) 0.0 0.0 0.0 0.0 0.0 0.0 0.0 0.0 0.0 0.0 0.0 0.0 0.0
Delhi
Requirement (MU) 2628.333 3286.834 3498.395 3311.258 3211.042 3109.045 2622.256 1751.266 1796.721 1938.181 1710.631 1966.036 30829.998
Availability (MU) 2625.724 3280.561 3491.32 3308.489 3207.814 3106.463 2620.191 1750.21 1795.772 1937.009 1709.894 1965.056 30798.503
Surplus(+)/Deficit(-) (MU) -2.609 -6.273 -7.075 -2.769 -3.228 -2.582 -2.065 -1.056 -0.949 -1.172 -0.737 -0.98 -31.495
(%) -0.1 -0.2 -0.2 -0.1 -0.1 -0.1 -0.1 -0.1 -0.1 -0.1 0.0 0.0 -0.1
Haryana
Requirement (MU) 3617.59 4195.89 4797.64 5302.54 5003.01 5062.48 4199.75 2875.6 3567.14 3449.12 3252.71 3570.6 48894.07
Availability (MU) 3617.59 4195.89 4797.64 5302.54 5003.01 5062.48 4199.75 2875.6 3567.14 3449.12 3252.71 3570.6 48894.07
Surplus(+)/Deficit(-) (MU) 0 0 0 0 0 0 0 0 0 0 0 0 0
(%) 0.0 0.0 0.0 0.0 0.0 0.0 0.0 0.0 0.0 0.0 0.0 0.0 0.0
Himachal Pradesh
Requirement (MU) 671.92 750.334 746.854 744.203 742.239 751.434 736.052 710.11 755.294 778.992 695.074 749.865 8832.371
Availability (MU) 664.92 747.674 743.384 737.563 735.958 748.872 734.262 709.23 751.704 764.232 692.85 747.889 8778.538
Surplus(+)/Deficit(-) (MU) -7 -2.66 -3.47 -6.64 -6.281 -2.562 -1.79 -0.88 -3.59 -14.76 -2.224 -1.976 -53.833
(%) -1.0 -0.4 -0.5 -0.9 -0.8 -0.3 -0.2 -0.1 -0.5 -1.9 -0.3 -0.3 -0.6
Jammu & Kashmir
Requirement (MU) 1432.2 1539.6 1431.1 1220.099 1320.5 1352.5 1440.4 1506.2 1617.9 1599 1468.8 1468.8 17397.099
Availability (MU) 1225.95 1231.46 1143.142 1001.494 1057.07 1083.159 1188.473 1187.06 1299.381 1283.947 1187.964 1306.85 14195.95
Surplus(+)/Deficit(-) (MU) -206.25 -308.14 -287.958 -218.605 -263.43 -269.341 -251.927 -319.14 -318.519 -315.053 -280.836 -161.95 -3201.149
(%) -14.4 -20.0 -20.1 -17.9 -19.9 -19.9 -17.5 -21.2 -19.7 -19.7 -19.1 -11.0 -18.4
Punjab
Requirement (MU) 3381.43 4733.76 5997.08 6598.13 6388.83 6225.52 4340.96 2842.28 3223.46 3012.6 2985.18 3368.75 53097.98
Availability (MU) 3381.43 4733.76 5997.08 6598.13 6388.83 6225.52 4340.96 2842.28 3223.46 3012.6 2985.18 3368.75 53097.98
Surplus(+)/Deficit(-) (MU) 0 0 0 0 0 0 0 0 0 0 0 0 0
(%) 0.0 0.0 0.0 0.0 0.0 0.0 0.0 0.0 0.0 0.0 0.0 0.0 0.0
Rajasthan
Requirement (MU) 5327.54 5940.82 5915.65 5283.51 4735.36 5801.42 5545.05 5747.34 6186.51 6109.69 5695.59 5549.05 67837.53
Month-wise power supply position of States/ UTs during the year 2016-17
(in terms of energy)

Annex-IV(B)
(2/7)
State/ Region Apr-16 May-16 Jun-16 Jul-16 Aug-16 Sep-16 Oct-16 Nov-16 Dec-16 Jan-17 Feb-17 Mar-17 2016-17
Month-wise power supply position of States/ UTs during the year 2016-17
(in terms of energy)
Availability (MU) 5318.89 5932.45 5910.29 5275.71 4713.4 5704.68 5507.3 5666.36 6108.82 6062.09 5669.45 5547.39 67416.83
Surplus(+)/Deficit(-) (MU) -8.65 -8.37 -5.36 -7.8 -21.96 -96.74 -37.75 -80.98 -77.69 -47.6 -26.14 -1.66 -420.7
(%) -0.2 -0.1 -0.1 -0.1 -0.5 -1.7 -0.7 -1.4 -1.3 -0.8 -0.5 0.0 -0.6
Uttar Pradesh
Requirement (MU) 9197.549 9312.45 9722.56 9268 9350.53 9736.153 9069.182 7963.121 8465.777 8747.407 7849.837 8886.084 107568.65
Availability (MU) 8565.549 9175.706 9592.557 9240.992 9223.782 9438.692 8959.114 7862.76 8358.531 8673.437 7787.747 8820.843 105699.71
Surplus(+)/Deficit(-) (MU) -632 -136.744 -130.003 -27.008 -126.748 -297.461 -110.068 -100.361 -107.246 -73.97 -62.09 -65.241 -1868.94
(%) -6.9 -1.5 -1.3 -0.3 -1.4 -3.1 -1.2 -1.3 -1.3 -0.8 -0.8 -0.7 -1.7
Uttarakhand
Requirement (MU) 1080.544 1159.202 1183.082 1148.561 1153.206 1139.189 1079.46 960.044 1027.481 1097.997 984.809 1056.413 13069.988
Availability (MU) 1071.801 1151.007 1174.858 1137.842 1146.097 1137.651 1079.46 958.475 1024.439 1076.984 978.928 1049.383 12986.925
Surplus(+)/Deficit(-) (MU) -8.743 -8.195 -8.224 -10.719 -7.109 -1.538 0 -1.569 -3.042 -21.013 -5.881 -7.03 -83.063
(%) -0.8 -0.7 -0.7 -0.9 -0.6 -0.1 0.0 -0.2 -0.3 -1.9 -0.6 -0.7 -0.6
Northern Region
Requirement (MU) 27468.44 31091.64 33477.25 33061.43 32076.79 33341.52 29158.31 24451.53 26744.41 26846.14 24735.87 26719.1 349172.43
Availability (MU) 26603.19 30621.26 33035.16 32787.89 31648.03 32671.3 28754.71 23947.54 26233.38 26372.57 24357.96 26480.26 343513.25
Surplus(+)/Deficit(-) (MU) -865.252 -470.382 -442.09 -273.541 -428.756 -670.224 -403.6 -503.986 -511.036 -473.568 -377.908 -238.837 -5659.18
(%) -3.1 -1.5 -1.3 -0.8 -1.3 -2.0 -1.4 -2.1 -1.9 -1.8 -1.5 -0.9 -1.6
Chhattisgarh
Requirement (MU) 2249.071 2042.386 1881.733 1870.624 2106.72 2060.79 1932 1657.037 1772.45 1939.42 1924.435 2313.59 23750.256
Availability (MU) 2237.828 2040.536 1865.343 1858.214 2101.45 2056.63 1932 1657.037 1772.45 1939.42 1924.435 2313.59 23698.933
Surplus(+)/Deficit(-) (MU) -11.2432 -1.85 -16.39 -12.41 -5.27 -4.16 0 0 0 0 0 0 -51.32317
(%) -0.5 -0.1 -0.9 -0.7 -0.3 -0.2 0.0 0.0 0.0 0.0 0.0 0.0 -0.2
Gujarat
Requirement (MU) 9187.14 9735.76 9368.834 8352.724 7758.679 9104.65 8178.114 7679.623 8448.196 8495.772 8054.908 9339.606 103704
Availability (MU) 9186.856 9735.76 9368.834 8352.724 7758.679 9104.65 8178.114 7679.623 8448.196 8495.285 8054.908 9339.606 103703.23
Surplus(+)/Deficit(-) (MU) -0.28333 0 0 0 0 0 0 0 0 -0.487 0 0 -0.770329
(%) 0.0 0.0 0.0 0.0 0.0 0.0 0.0 0.0 0.0 0.0 0.0 0.0 0.0
Madhya Pradesh
Requirement (MU) 5558.924 5238.96 4772.967 5196.143 5347.76 4624.39 5076.96 6272.642 6529.38 6295.01 5482.254 5364.113 65759.502
Availability (MU) 5558.436 5238.96 4772.967 5196.143 5347.76 4624.39 5076.96 6272.642 6529.38 6295.01 5482.254 5364.113 65759.014
Surplus(+)/Deficit(-) (MU) -0.48806 0 0 0 0 0 0 0 0 0 0 0 -0.488057

Annex-IV(B)
(3/7)
State/ Region Apr-16 May-16 Jun-16 Jul-16 Aug-16 Sep-16 Oct-16 Nov-16 Dec-16 Jan-17 Feb-17 Mar-17 2016-17
Month-wise power supply position of States/ UTs during the year 2016-17
(in terms of energy)
(%) 0.0 0.0 0.0 0.0 0.0 0.0 0.0 0.0 0.0 0.0 0.0 0.0 0.0
Maharashtra
Requirement (MU) 12624.16 12555.85 11469.72 10402.89 11112.93 10946.97 11551.32 11763.53 12157.72 10962.67 10971.87 12774.09 139293.72
Availability (MU) 12623.64 12538.76 11451.19 10402.75 11112.85 10946.94 11551.32 11763.04 12150.96 10952.85 10968.45 12766.07 139228.82
Surplus(+)/Deficit(-) (MU) -0.51715 -17.09 -18.53 -0.14 -0.08 -0.03 0 -0.49 -6.76 -9.819 -3.42 -8.02 -64.89615
(%) 0.0 -0.1 -0.2 0.0 0.0 0.0 0.0 0.0 -0.1 -0.1 0.0 -0.1 0.0
Daman & Diu
Requirement (MU) 199.5917 198.89 207.15 203 203.063 207.81 204.7 187.27 189.59 194.55 187.71 213.85 2397.1747
Availability (MU) 199.587 198.89 207.15 203 203.063 207.81 204.7 187.27 189.59 194.55 187.71 213.85 2397.17
Surplus(+)/Deficit(-) (MU) -0.00466 0 0 0 0 0 0 0 0 0 0 0 -0.004657
(%) 0.0 0.0 0.0 0.0 0.0 0.0 0.0 0.0 0.0 0.0 0.0 0.0 0.0
Dadra & Nagar Haveli
Requirement (MU) 495.2353 517.05 511.895 515 509.867 514.14 524.81 478.43 478.33 501.05 468.63 506.97 6021.4073
Availability (MU) 495.22 517.05 511.895 515 509.867 514.14 524.81 478.43 478.33 501.05 468.63 506.97 6021.392
Surplus(+)/Deficit(-) (MU) -0.01526 0 0 0 0 0 0 0 0 0 0 0 -0.015261
(%) 0.0 0.0 0.0 0.0 0.0 0.0 0.0 0.0 0.0 0.0 0.0 0.0 0.0
Goa
Requirement (MU) 422.5242 428.972 420.492 411 412.4652 309.78 320.232 306.6 313.466 318.765 309.054 347.38 4320.7304
Availability (MU) 422.502 426.512 420.492 411 412.4652 309.78 320.232 306.6 313.466 318.765 309.054 347.38 4318.2482
Surplus(+)/Deficit(-) (MU) -0.02218 -2.46 0 0 0 0 0 0 0 0 0 0 -2.482181
(%) 0.0 -0.6 0.0 0.0 0.0 0.0 0.0 0.0 0.0 0.0 0.0 0.0 -0.1
Western Region
Requirement (MU) 30736.64 30717.86 28632.79 26951.38 27451.49 27768.53 27788.14 28345.13 29889.13 28707.24 27398.86 30859.59 345246.79
Availability (MU) 30724.07 30696.46 28597.87 26938.83 27446.14 27764.34 27788.14 28344.64 29882.37 28696.93 27395.44 30851.57 345126.81
Surplus(+)/Deficit(-) (MU) -12.5738 -21.4 -34.92 -12.55 -5.35 -4.19 0 -0.49 -6.76 -10.306 -3.42 -8.02 -119.9798
(%) 0.0 -0.1 -0.1 0.0 0.0 0.0 0.0 0.0 0.0 0.0 0.0 0.0 0.0
Andhra Pradesh
Requirement (MU) 4728.645 4444.62 3940.412 4253.885 4834.881 4448.213 4820.928 4654.486 4259.628 4447.403 4409.756 5058.14 54300.998
Availability (MU) 4694.602 4444.62 3939.204 4253.885 4834.881 4447.716 4820.005 4652.426 4257.213 4447.403 4409.756 5055.724 54257.435
Surplus(+)/Deficit(-) (MU) -34.0436 0 -1.20768 0 0 -0.49728 -0.92352 -2.06016 -2.41536 0 0 -2.41536 -43.56297
(%) -0.7 0.0 0.0 0.0 0.0 0.0 0.0 0.0 -0.1 0.0 0.0 0.0 -0.1
Karnataka

Annex-IV(B)
(4/7)
State/ Region Apr-16 May-16 Jun-16 Jul-16 Aug-16 Sep-16 Oct-16 Nov-16 Dec-16 Jan-17 Feb-17 Mar-17 2016-17
Month-wise power supply position of States/ UTs during the year 2016-17
(in terms of energy)
Requirement (MU) 6329.718 5458.948 4408.386 4443.423 5263.488 5182.999 5989.102 5998.202 5571.827 5960.894 5713.307 6579.782 66900.076
Availability (MU) 6103.074 5458.948 4406.893 4443.423 5250.428 5182.384 5944.95 5931.818 5568.84 5960.894 5713.307 6572.965 66537.925
Surplus(+)/Deficit(-) (MU) -226.644 0 -1.49328 0 -13.06 -0.61488 -44.1519 -66.3844 -2.98656 0 0 -6.81656 -362.1512
(%) -3.6 0.0 0.0 0.0 -0.2 0.0 -0.7 -1.1 -0.1 0.0 0.0 -0.1 -0.5
Kerala
Requirement (MU) 2342.428 2181.018 1795.615 1883.033 1991.102 1915.861 2033.424 1987.998 2003.984 2014.001 1921.309 2227.403 24297.174
Availability (MU) 2326.702 2178.066 1794.701 1883.033 1989.512 1915.079 2031.415 1985.459 1996.908 2014.001 1920.231 2225.542 24260.65
Surplus(+)/Deficit(-) (MU) -15.7252 -2.95256 -0.91304 0 -1.59 -0.78184 -2.00856 -2.53848 -7.07608 0 -1.07726 -1.86108 -36.5241
(%) -0.7 -0.1 -0.1 0.0 -0.1 0.0 -0.1 -0.1 -0.4 0.0 -0.1 -0.1 -0.2
Tamil Nadu
Requirement (MU) 9622.608 9132.721 8729.195 9005.024 9263.686 8842.744 8945.199 7999.896 7863.192 8136.304 7734.823 9235.88 104511.27
Availability (MU) 9616.755 9132.721 8726.923 9005.024 9263.686 8841.808 8943.462 7996.02 7858.647 8136.304 7734.823 9231.335 104487.51
Surplus(+)/Deficit(-) (MU) -5.85312 0 -2.27256 0 0 -0.93576 -1.73784 -3.87672 -4.54512 0 0 -4.54512 -23.76624
(%) -0.1 0.0 0.0 0.0 0.0 0.0 0.0 0.0 -0.1 0.0 0.0 0.0 0.0
Telangana
Peak Demand (MW) 4495.082 3853.128 3608.548 4050.509 4911.538 4060.35 4482.272 4160.775 4442.974 4782.527 4728.185 5453.281 53029.168
Peak Availability (MW) 4492.074 3853.128 3607.41 4050.509 4911.538 4059.881 4481.401 4158.833 4440.697 4782.527 4728.185 5451.005 53017.188
Surplus(+)/Deficit(-) (MW) -3.00768 0 -1.13832 0 0 -0.46872 -0.87048 -1.94184 -2.27664 0 0 -2.27664 -11.98032
(%) -0.1 0.0 0.0 0.0 0.0 0.0 0.0 0.0 -0.1 0.0 0.0 0.0 0.0
Puducherry
Requirement (MU) 232.5253 229.289 217.5014 227.2636 223.2645 208.5864 216.6503 203.7551 192.3092 189.4618 181.7767 225.314 2547.6974
Availability (MU) 232.3156 229.289 217.3843 227.2636 223.2645 208.5629 216.2416 203.2927 192.195 189.4618 181.6434 225.1997 2546.1141
Surplus(+)/Deficit(-) (MU) -0.20976 0 -0.11712 0 0 -0.02352 -0.40868 -0.46244 -0.11424 0 -0.13328 -0.11424 -1.58328
(%) -0.1 0.0 -0.1 0.0 0.0 0.0 -0.2 -0.2 -0.1 0.0 -0.1 -0.1 -0.1
Lakshadweep
Requirement (MU) 4 4 4 4 4 4 4 4 4 4 4 4 48
Availability (MU) 4 4 4 4 4 4 4 4 4 4 4 4 48
Surplus(+)/Deficit(-) (MU) 0 0 0 0 0 0 0 0 0 0 0 0 0
(%) 0 0 0 0 0 0 0 0 0 0 0 0 0
Southern Region
Requirement (MU) 27751.01 25299.72 22699.66 23863.14 26487.96 24658.75 26487.58 25005.11 24333.91 25530.59 24689.16 28779.8 305586.39
Availability (MU) 27465.52 25296.77 22692.51 23863.14 26473.31 24655.43 26437.48 24927.85 24314.5 25530.59 24687.95 28761.77 305106.82

Annex-IV(B)
(5/7)
State/ Region Apr-16 May-16 Jun-16 Jul-16 Aug-16 Sep-16 Oct-16 Nov-16 Dec-16 Jan-17 Feb-17 Mar-17 2016-17
Month-wise power supply position of States/ UTs during the year 2016-17
(in terms of energy)
Surplus(+)/Deficit(-) (MU) -285.483 -2.95256 -7.142 0 -14.65 -3.322 -50.101 -77.264 -19.414 0 -1.21054 -18.029 -479.5681
(%) -1.0 0.0 0.0 0.0 -0.1 0.0 -0.2 -0.3 -0.1 0.0 0.0 -0.1 -0.2
Bihar
Requirement (MU) 2249.548 2474.635 2126.801 2198.617 2308.326 2261.277 2214.964 1954.412 2055.305 2018.555 1790.076 2059.097 25711.612
Availability (MU) 2137.052 2458.93 2111.651 2165.217 2299.876 2195.277 2172.834 1918.441 1980.125 1967.105 1741.486 1983.367 25131.36
Surplus(+)/Deficit(-) (MU) -112.496 -15.705 -15.15 -33.4 -8.45 -66 -42.13 -35.9715 -75.18 -51.45 -48.59 -75.73 -580.2524
(%) -5.0 -0.6 -0.7 -1.5 -0.4 -2.9 -1.9 -1.8 -3.7 -2.5 -2.7 -3.7 -2.3Damodar Valley
CorporationRequirement (MU) 1625.979 1465.695 1330.954 1647.325 1603.099 1555.591 1647.684 1435.466 1518.862 1698.435 1572.733 1827.1 18928.925
Availability (MU) 1614.431 1454.195 1318.864 1639.195 1595.979 1553.641 1631.274 1433.248 1506.942 1646.825 1572.733 1823.14 18790.468
Surplus(+)/Deficit(-) (MU) -11.5482 -11.5 -12.09 -8.13 -7.12 -1.95 -16.41 -2.21856 -11.92 -51.61 0 -3.96 -138.4568
(%) -0.7 -0.8 -0.9 -0.5 -0.4 -0.1 -1.0 -0.2 -0.8 -3.0 0.0 -0.2 -0.7
Jharkhand
Requirement (MU) 717.4989 708.3823 615.9467 636.0888 645.0831 651.1284 651.7012 631.3892 713.6811 692.402 611.6741 684.6624 7959.6381
Availability (MU) 711.7508 708.3823 613.4767 636.0888 645.0131 649.8764 650.5312 624.4526 695.1871 679.31 611.5251 680.6824 7906.2763
Surplus(+)/Deficit(-) (MU) -5.7481 0 -2.47 0 -0.07 -1.252 -1.17 -6.93664 -18.494 -13.092 -0.149 -3.98 -53.36174
(%) -0.8 0.0 -0.4 0.0 0.0 -0.2 -0.2 -1.1 -2.6 -1.9 0.0 -0.6 -0.7
Odisha
Requirement (MU) 2388.56 2489.341 2341.392 2365.973 2306.267 2080.958 2184.388 2013.236 2046.196 2208.967 1984.713 2349.367 26759.358
Availability (MU) 2386.589 2489.341 2341.392 2365.973 2305.667 2080.958 2184.388 2012.531 2046.196 2208.967 1984.713 2349.367 26756.083
Surplus(+)/Deficit(-) (MU) -1.97061 0 0 0 -0.6 0 0 -0.70439 0 0 0 0 -3.274998
(%) -0.1 0.0 0.0 0.0 0.0 0.0 0.0 0.0 0.0 0.0 0.0 0.0 0.0
West Bengal
Requirement (MU) 4594.586 3976.726 4251.497 4566.914 4632.042 4550.363 4389.117 3240.336 3267.554 3495.231 2761.9 4222.962 47949.226
Availability (MU) 4574.576 3949.864 4237.692 4557.339 4613.271 4535.819 4381.221 3236.237 3264.41 3486.453 2756.102 4216.05 47809.032
Surplus(+)/Deficit(-) (MU) -20.0103 -26.862 -13.805 -9.575 -18.771 -14.544 -7.896 -4.09916 -3.144 -8.778 -5.798 -6.912 -140.1944
(%) -0.4 -0.7 -0.3 -0.2 -0.4 -0.3 -0.2 -0.1 -0.1 -0.3 -0.2 -0.2 -0.3
Sikkim
Requirement (MU) 36.90639 42.817 36.35373 34.28269 41.19738 36.727 33.60145 37.73455 44.8494 44.45195 40.67719 44.83696 474.43568
Availability (MU) 36.88057 42.817 36.35373 34.28269 41.19738 36.727 33.60145 37.72134 44.8494 44.45195 40.67719 44.83696 474.39666
Surplus(+)/Deficit(-) (MU) -0.02582 0 0 0 0 0 0 -0.0132 0 0 0 0 -0.039019
(%) -0.1 0.0 0.0 0.0 0.0 0.0 0.0 0.0 0.0 0.0 0.0 0.0 0.0

Annex-IV(B)
(6/7)
State/ Region Apr-16 May-16 Jun-16 Jul-16 Aug-16 Sep-16 Oct-16 Nov-16 Dec-16 Jan-17 Feb-17 Mar-17 2016-17
Month-wise power supply position of States/ UTs during the year 2016-17
(in terms of energy)
Andaman & Nicobar
Requirement (MU) 20 20 20 20 20 20 20 20 20 20 20 20 240
Availability (MU) 15 15 15 15 15 15 15 15 15 15 15 15 180
Surplus(+)/Deficit(-) (MU) -5 -5 -5 -5 -5 -5 -5 -5 -5 -5 -5 -5 -60
(%) -25 -25 -25 -25 -25 -25 -25 -25 -25 -25 -25 -25 -25
Eastern Region
Requirement (MU) 11613.08 11157.6 10702.94 11449.2 11536.01 11136.04 11121.46 9312.574 9646.448 10158.04 8761.773 11188.03 127783.19
Availability (MU) 11461.28 11103.53 10659.43 11398.1 11501 11052.3 11053.85 9262.631 9537.71 10033.11 8707.236 11097.44 126867.62
Surplus(+)/Deficit(-) (MU) -151.799 -54.067 -43.515 -51.105 -35.011 -83.746 -67.606 -49.9434 -108.738 -124.93 -54.537 -90.582 -915.5794
(%) -1.3 -0.5 -0.4 -0.4 -0.3 -0.8 -0.6 -0.5 -1.1 -1.2 -0.6 -0.8 -0.7
Arunachal Pradesh
Requirement (MU) 54.38 54 56.51 56.95 62.07 59.56 63.04 60.933 65.80592 68.36927 61.66295 64.84588 728.12702
Availability (MU) 53.17 52 54.91 55.79 60.69 58.07 61.67 59.774 64.68392 67.2201 60.8187 63.96469 712.76141
Surplus(+)/Deficit(-) (MU) -1.21 -2 -1.6 -1.16 -1.38 -1.49 -1.37 -1.159 -1.12201 -1.14917 -0.84425 -0.88119 -15.36561
(%) -2.2 -3.7 -2.8 -2.0 -2.2 -2.5 -2.2 -1.9 -1.7 -1.7 -1.4 -1.4 -2.1
Assam
Requirement (MU) 634.1 733.3 853.96 814.66 970.62 888.09 834.99 677.481 662.1933 692.8938 600.0882 658.4277 9020.8041
Availability (MU) 578.78 689.9 822.74 778.51 938.61 858.16 812.85 665.526 646.3817 683.7861 585.7076 630.8224 8691.7738
Surplus(+)/Deficit(-) (MU) -55.32 -43.4 -31.22 -36.15 -32.01 -29.93 -22.14 -11.955 -15.8116 -9.10773 -14.3806 -27.6054 -329.0303
(%) -8.7 -5.9 -3.7 -4.4 -3.3 -3.4 -2.7 -1.8 -2.4 -1.3 -2.4 -4.2 -3.6
Manipur
Requirement (MU) 53.97 58.3 58.53 62.99 59.84 60.18 64.22 66.197 72.8332 76.06271 63.5399 67.19488 763.8577
Availability (MU) 50.76 55.3 57.02 57.93 57.73 57.79 61.72 64.655 71.53974 74.85026 62.63811 66.16803 738.10114
Surplus(+)/Deficit(-) (MU) -3.21 -3 -1.51 -5.06 -2.11 -2.39 -2.5 -1.542 -1.29346 -1.21246 -0.90179 -1.02685 -25.75656
(%) -5.9 -5.1 -2.6 -8.0 -3.5 -4.0 -3.9 -2.3 -1.8 -1.6 -1.4 -1.5 -3.4
Meghalaya
Requirement (MU) 119.57 130.1 141.78 148.91 138.11 140.95 149.79 137.329 147.5608 151.0728 142.0296 167.2127 1714.4149
Availability (MU) 119.57 130.1 141.78 148.91 138.11 140.95 149.79 137.287 147.5165 151.0275 141.987 167.1625 1714.1906
Surplus(+)/Deficit(-) (MU) 0 0 0 0 0 0 0 -0.042 -0.04425 -0.04531 -0.0426 -0.05015 -0.224308
(%) 0.0 0.0 0.0 0.0 0.0 0.0 0.0 0.0 0.0 0.0 0.0 0.0 0.0
Mizoram
Requirement (MU) 41.29 39 38.58 41.3 40.73 36.67 40.17 44.819 50.8026 50.03105 43.68777 45.60921 512.68963

Annex-IV(B)
(7/7)
State/ Region Apr-16 May-16 Jun-16 Jul-16 Aug-16 Sep-16 Oct-16 Nov-16 Dec-16 Jan-17 Feb-17 Mar-17 2016-17
Month-wise power supply position of States/ UTs during the year 2016-17
(in terms of energy)
Availability (MU) 39.97 37.6 37.75 40.1 39.7 35.43 38.9 43.585 49.56928 48.98365 43.02786 44.6833 499.2991
Surplus(+)/Deficit(-) (MU) -1.32 -1.4 -0.83 -1.2 -1.03 -1.24 -1.27 -1.234 -1.23332 -1.0474 -0.65991 -0.9259 -13.39053
(%) -3.2 -3.6 -2.2 -2.9 -2.5 -3.4 -3.2 -2.8 -2.4 -2.1 -1.5 -2.0 -2.6
Nagaland
Requirement (MU) 52.86 55.9 59.36 65.36 68.59 68.09 68.16 64.033 69.78121 66.49295 57.56465 61.48095 757.67276
Availability (MU) 51.21 54.4 58.23 64.08 67.28 66.89 66.71 62.759 68.54845 65.54389 56.75623 60.5046 742.91216
Surplus(+)/Deficit(-) (MU) -1.65 -1.5 -1.13 -1.28 -1.31 -1.2 -1.45 -1.274 -1.23276 -0.94906 -0.80843 -0.97635 -14.76061
(%) -3.1 -2.7 -1.9 -2.0 -1.9 -1.8 -2.1 -2.0 -1.8 -1.4 -1.4 -1.6 -1.9
Tripura
Requirement (MU) 145.37 104.65 121.75 115.95 121.1 119.72 131.88 137.28 144.5563 183.8221 168.5391 147.7541 1642.3717
Availability (MU) 142.32 98.74 120.05 114.81 118.64 118.67 130.59 136.197 143.8402 183.3984 167.9257 145.4995 1620.6809
Surplus(+)/Deficit(-) (MU) -3.05 -5.91 -1.7 -1.14 -2.46 -1.05 -1.29 -1.083 -0.71604 -0.42367 -0.61338 -2.25465 -21.69073
(%) -2.1 -5.6 -1.4 -1.0 -2.0 -0.9 -1.0 -0.8 -0.5 -0.2 -0.4 -1.5 -1.3
North-Eastern Region
Requirement (MU) 1101.55 1175.25 1330.47 1306.12 1461.06 1373.26 1352.25 1188.072 1213.533 1288.745 1137.112 1212.525 15139.948
Availability (MU) 1035.77 1118.04 1292.48 1260.13 1420.76 1335.95 1322.23 1169.783 1192.08 1274.81 1118.861 1178.805 14719.699
Surplus(+)/Deficit(-) (MU) -65.78 -57.21 -37.99 -45.99 -40.3 -37.31 -30.02 -18.289 -21.4534 -13.9348 -18.2509 -33.7205 -420.2486
(%) -6.0 -4.9 -2.9 -3.5 -2.8 -2.7 -2.2 -1.5 -1.8 -1.1 -1.6 -2.8 -2.8
All India
Requirement (MU) 98670.72 99442.07 96843.11 96631.27 99013.31 98278.11 95907.73 88302.42 91827.44 92530.75 86722.77 98759.05 1142928.8
Availability (MU) 97289.83 98836.06 96277.45 96248.09 98489.24 97479.32 95356.4 87652.44 91160.04 91908.01 86267.45 98369.86 1135334.2
Surplus(+)/Deficit(-) (MU) -1380.89 -606.012 -565.657 -383.186 -524.067 -798.792 -551.327 -649.972 -667.401 -622.739 -455.326 -389.188 -7594.556
(%) -1.4 -0.6 -0.6 -0.4 -0.5 -0.8 -0.6 -0.7 -0.7 -0.7 -0.5 -0.4 -0.7

Annex-V
Entitlement Scheduled Drawal
(MU) (MU)
Chandigarh 1,234.83 1,176.69
Delhi 32,719.23 19,323.10
Haryana 19,454.69 14,915.27
Himachal Pradesh 7,162.07 6,978.18
Jammu & Kashmir 12,198.66 10,627.99
Punjab 22,392.61 19,584.80
Rajasthan 21,276.47 18,187.45
Uttar Pradesh 42,022.36 37,021.07
Uttarakhand 6,269.43 5,443.20
Chhattisgarh 8,876.22 7,491.32
Gujarat 30,320.69 26,134.32
Madhya Pradesh 33,400.65 26,932.74
Maharashtra 39,464.48 33,100.10
Daman & Diu 2,147.61 1,586.63
Dadra & Nagar Haveli 5,274.98 3,412.69
Goa 3,477.38 3,292.07
Andhra Pradesh 12,872.02 11,598.87
Telangana 14,471.27 12,813.12
Karnataka 20,486.95 19,480.65
Kerala 13,550.61 10,574.77
Tamil Nadu 36,321.85 33,062.04
Puducherry 3,017.57 2,587.65
Bihar 19,002.56 18,252.19
Damodar Valley Corporation 1,341.13 1,168.35
Jharkhand 3,782.38 3,817.31
Odisha 9,675.69 8,280.89
West Bengal 8,652.72 7,108.90
Sikkim 1,053.07 817.89
Arunachal Pradesh 768.17 727.09
Assam 6,459.06 5,929.27
Manipur 1,102.29 968.36
Meghalaya 1,344.15 793.25
Mizoram 581.23 542.94
Nagaland 731.07 658.42
Tripura 1,781.08 1,624.03
Eastern Region
North-Eastern Region
Region / State / System
Scheduled Drawal of Energy by the States/ UTs vis-à-vis their
Entitlement from the Central Generating Stations during the
year 2016-17
Western Region
Northern Region
Southern Region

Annex-VI(A)
LGBR Actual%
DeviationLGBR Actual
%
DeviationLGBR Actual LGBR Actual
Chandigarh 350 361 3.1 343 361 5.2 -7 0 -2.0 0.0
Delhi 6,100 6,342 4.0 6,616 6,261 -5.4 516 -81 8.5 -1.3
Haryana 8,950 9,262 3.5 9,263 9,262 0.0 313 0 3.5 0.0
Himachal Pradesh 1,525 1,499 -1.7 1,645 1,499 -8.9 120 0 7.9 0.0
Jammu & Kashmir 2,650 2,675 0.9 2,231 2,140 -4.1 -419 -535 -15.8 -20.0
Punjab 11,200 11,408 1.9 10,525 11,408 8.4 -675 0 -6.0 0.0
Rajasthan 11,500 10,613 -7.7 11,610 10,348 -10.9 110 -265 1.0 -2.5
Uttar Pradesh 16,000 17,183 7.4 14,454 16,110 11.5 -1,546 -1,073 -9.7 -6.2
Uttarakhand 2,075 2,037 -1.8 2,058 2,037 -1.0 -17 0 -0.8 0.0
Northern Region 55,800 53,372 -4.4 54,900 52,612 -4.2 -900 -760 -1.6 -1.4
Chhattisgarh 4,190 3,875 -7.5 4,588 3,851 -16.1 398 -25 9.5 -0.6
Gujarat 14,860 14,724 -0.9 15,480 14,719 -4.9 620 -5 4.2 0.0
Madhya Pradesh 11,481 11,512 0.3 12,439 11,501 -7.5 958 -11 8.3 -0.1
Maharashtra 21,943 22,516 2.6 22,100 22,207 0.5 157 -309 0.7 -1.4
Daman & Diu 325 334 2.6 332 334 0.5 7 0 2.1 0.0
Dadra & Nagar Haveli 713 784 10.0 737 784 6.4 24 0 3.4 0.0
Goa 520 546 4.9 518 531 2.6 -2 -14 -0.4 -2.6
Western Region 51,436 48,531 -5.6 56,715 48,313 -14.8 5,279 -218 10.3 -0.4
Andhra Pradesh 7,859 7,969 1.4 6,558 7,965 21.5 -1,301 -4 -16.6 -0.1
Karnataka 11,152 10,261 -8.0 9,899 10,242 3.5 -1,253 -19 -11.2 -0.2
Kerala 4,100 4,132 0.8 3,886 3,996 2.8 -214 -135 -5.2 -3.3
Tamil Nadu 14,800 14,823 0.2 15,741 14,823 -5.8 941 0 6.4 0.0
Telangana 8,381 9,187 9.6 7,363 9,187 24.8 -1,018 0 -12.2 0.0
Puducherry 395 371 -6.2 387 368 -4.8 -8 -3 -2.1 -0.7
Southern Region 40,008 42,232 5.6 44,604 42,232 -5.3 4,596 0 11.5 0.0
Bihar 3,900 3,883 -0.4 3,183 3,759 18.1 -717 -125 -18.4 -3.2
Damodar Valley Corporation 2,855 2,721 -4.7 4,139 2,721 -34.3 1,284 0 45.0 0.0
Jharkhand 1,250 1,498 19.9 1,160 1,498 29.2 -90 0 -7.2 0.0
Odisha 4,400 4,012 -8.8 4,576 4,012 -12.3 176 0 4.0 0.0
West Bengal 8,439 7,931 -6.0 8,138 7,886 -3.1 -301 -45 -3.6 -0.6
Sikkim 90 112 24.3 164 112 -31.7 74 0 82.1 0.0
Eastern Region 21,387 18,908 -11.6 22,440 18,788 -16.3 1,053 -120 4.9 -0.6
Arunachal Pradesh 147 148 0.7 195 140 -28.2 48 -8 32.7 -5.4
Assam 1,560 1,673 7.2 1,306 1,633 25.1 -254 -40 -16.3 -2.4
Manipur 184 163 -11.3 196 163 -16.7 12 0 6.3 -0.2
Meghalaya 430 331 -23.0 482 331 -31.2 52 0 12.0 0.0
Mizoram 101 98 -2.7 123 98 -20.3 22 0 22.1 0.0
Nagaland 140 148 5.5 145 147 1.3 5 -1 3.4 -0.7
Tripura 321 284 -11.5 391 284 -27.4 70 0 21.8 0.0
North-Eastern Region 2,801 2,487 -11.2 2,695 2,475 -8.2 -106 -12 -3.8 -0.5
All India 165,292 159,542 -3.5 171,440 156,934 -8.5 6,148 -2,608 3.7 -1.6
Comparison of the constituent-wise forecast vis-à-vis actual power supply position for the year 2016-17
(in terms of peak)
Peak Demand Peak Met
(MW) (MW)Region / State /
System
Surplus / Deficit (-)
(%)(MW)

Annex-VI(B)
LGBR Actual%
DeviationLGBR Actual
%
DeviationLGBR Actual LGBR Actual
Chandigarh 1,705 1,645 -3.5 1,689 1,645 -2.6 -16 0 -0.9 0.0
Delhi 31,110 30,830 -0.9 36,884 30,799 -16.5 5,774 -31 18.6 -0.1
Haryana 49,800 48,894 -1.8 51,069 48,894 -4.3 1,269 0 2.5 0.0
Himachal Pradesh 9,209 8,832 -4.1 9,504 8,779 -7.6 295 -54 3.2 -0.6
Jammu & Kashmir 17,060 17,397 2.0 14,622 14,196 -2.9 -2,438 -3,201 -14.3 -18.4
Punjab 52,080 53,098 2.0 48,296 53,098 9.9 -3,784 0 -7.3 0.0
Rajasthan 72,070 67,838 -5.9 71,900 67,417 -6.2 -170 -421 -0.2 -0.6
Uttar Pradesh 110,850 107,569 -3.0 103,806 105,700 1.8 -7,044 -1,869 -6.4 -1.7
Uttarakhand 13,574 13,070 -3.7 13,239 12,987 -1.9 -336 -83 -2.5 -0.6
Northern Region 357,459 349,172 -2.3 351,009 343,513 -2.1 -6,450 -5,659 -1.8 -1.6
Chhattisgarh 27,176 23,750 -12.6 28,722 23,699 -17.5 1,546 -51 5.7 -0.2
Gujarat 104,845 103,704 -1.1 109,225 103,703 -5.1 4,380 -1 4.2 0.0
Madhya Pradesh 74,199 65,760 -11.4 83,052 65,759 -20.8 8,853 0 11.9 0.0
Maharashtra 154,169 139,294 -9.6 165,502 139,229 -15.9 11,333 -65 7.4 0.0
Daman & Diu 2,372 2,397 1.1 2,423 2,397 -1.1 51 0 2.2 0.0
Dadra & Nagar Haveli 5,615 6,021 7.2 5,737 6,021 5.0 121 0 2.2 0.0
Goa 4,367 4,321 -1.1 4,366 4,318 -1.1 -1 -2 0.0 -0.1
Western Region 379,087 345,247 -8.9 405,370 345,127 -14.9 26,283 -120 6.9 0.0
Andhra Pradesh 54,215 54,301 0.2 51,013 54,257 6.4 -3,202 -44 -5.9 -0.1
Karnataka 69,781 66,900 -4.1 73,027 66,538 -8.9 3,246 -362 4.7 -0.5
Kerala 24,179 24,297 0.5 25,277 24,261 -4.0 1,099 -37 4.5 -0.2
Tamil Nadu 103,806 104,511 0.7 117,291 104,488 -10.9 13,485 -24 13.0 0.0
Telangana # 55,001 53,029 -3.6 53,203 53,017 -0.3 -1,798 -12 -3.3 0.0
Puducherry 2,554 2,548 -0.2 2,888 2,546 -11.8 334 -2 13.1 -0.1
Southern Region 310,564 305,586 -1.6 323,727 305,107 -5.8 13,163 -480 4.2 -0.2
Bihar 26,369 25,712 -2.5 19,713 25,131 27.5 -6,656 -580 -25.2 -2.3
Damodar Valley Corporation 20,365 18,929 -7.1 21,062 18,790 -10.8 697 -138 3.4 -0.7
Jharkhand 9,320 7,960 -14.6 6,524 7,906 21.2 -2,796 -53 -30.0 -0.7
Odisha 29,805 26,759 -10.2 30,464 26,756 -12.2 659 -3 2.2 0.0
West Bengal 52,867 47,949 -9.3 45,610 47,809 4.8 -7,257 -140 -13.7 -0.3
Sikkim 423 474 12.0 954 474 -50.3 531 0 125.3 0.0
Eastern Region 151,336 127,783 -15.6 135,713 126,868 -6.5 -15,622 -916 -10.3 -0.7
Arunachal Pradesh 830 728 -12.3 756 713 -5.7 -74 -15 -8.9 -2.1
Assam 9,309 9,021 -3.1 7,227 8,692 20.3 -2,082 -329 -22.4 -3.6
Manipur 1,008 764 -24.2 971 738 -24.0 -37 -26 -3.6 -3.4
Meghalaya 2,215 1,714 -22.6 2,065 1,714 -17.0 -150 0 -6.8 0.0
Mizoram 533 513 -3.8 589 499 -15.3 56 -13 10.6 -2.6
Nagaland 849 758 -10.8 722 743 2.9 -127 -15 -15.0 -1.9
Tripura 1,453 1,642 13.0 2,526 1,621 -35.8 1,073 -22 73.9 -1.3
North-Eastern Region 16,197 15,140 -6.5 14,858 14,720 -0.9 -1,339 -420 -8.3 -2.8
All India 1,214,642 1,142,929 -5.9 1,230,677 1,135,334 -7.7 16,035 -7,595 1.3 -0.7
(%)
Comparison of the constituent-wise forecast vis-à-vis actual power supply position for the year 2016-17
(in terms of energy)
Region / State /
System
Requirement Availability Surplus / Deficit (-)
(MU) (MU) (MU)

Annex-VII
(1 / 20)
Station/ System/ StateUnit
Number
Capacit
y (MW)Start Date End Date
No. of
Maintenan
ce Days
Reason
Singrauli STPS 2 200 29.05.2017 01.06.2017 3 Boiler License Renewal Boiler OH etc
Singrauli STPS 2 200 01.07.2017 25.07.2017 25 Boiler License Renewal Boiler OH etc
Singrauli STPS 3 200 01.08.2017 04.09.2017 35 Boiler+Turbine+Gen+ESP bellows etc.
Singrauli STPS 6 500 28.10.2017 26.11.2017 30 Boiler OH/LPT
Singrauli STPS 7 500 10.09.2017 14.10.2017 35 Boiler OH
Rihand-II 3 500 09.05.2017 12.05.2017 3BLR Boiler LP Turbine GRP Relay
Replacement
Rihand-II 13.11.2017 12.12.2017 30BLR Boiler LP Turbine GRP Relay
Replacement
Rihand-III 6 500 12.05.2017 10.06.2017 30
Boiler & Aux Inspection of LPT outer 2
stage blade OH of HP/IP SV/CV & TG
Gov System
Unchahar -I 1 210 20.09.2017 14.10.2017 25Boiler OH Turbine Gen ESP R&M
DDCIMS Turbine Bearing Inspection
Unchahar -II 4 210 01.07.2017 25.07.2017 25 BoilerOH LPT Gen
Unchahar -III 5 210 25.04.2017 19.05.217 25 Boiler Turbine Gen
Tanda TPS 1 110 01.04.2017 05.05.2017 35GEN HP IP LPT Turbine Gen Rotor to be
Changed
Tanda TPS 3 110 01.07.2017 25.07.2017 25 Boiler
Dadri NCTPS 1 210 10.05.2017 12.05.2017 3 BLR
Dadri NCTPS 2 210 01.03.2018 20.03.2018 20 Boiler OH LPT Gen RLA
Dadri NCTPS 2 210 23.12.2017 25.12.2017 3 Boiler OH LPT Gen RLA
Dadri NCTPS 3 210 14.10.2017 16.10.2017 3 BLR
Dadri NCTPS 4 210 17.08.2017 10.09.2017 25 Boiler OH+IPT+ LPT+ Gen O/H
Dadri NCTPS 5 490 17.04.2017 21.04.2017 5 BLR
Dadri NCTPS 6 490 01.11.2017 05.12.2017 35 Capital + Gen.
Anta GPS GT 1 88.7 20.07.2017 25.07.2017 6 12000 VOH Inspection
Anta GPS GT 1 88.7 20.01.2018 23.01.2018 4 12001 VOH Inspection
Anta GPS GT 2 88.7 01.06.2017 04.06.2017 4 12002 VOH Inspection
Anta GPS GT 3 88.7 01.07.2017 04.07.2017 4 12003 VOH Inspection
Anta GPS GT 3 88.7 01.01.2018 06.01.2018 6 12004 VOH Inspection
Anta GPS ST G 153.2 16.03.2017 14.04.2017 30 Bearing Inspection
Auriya GPS GT 1 111.19 09.05.2017 09.05.2017 1WHRB License Renewal Turbine
Inspection
Auriya GPS GT 1 111.19 22.10.2017 05.11.2017 15WHRB License Renewal Turbine
Inspection
Auriya GPS GT 2 111.19 20.04.2017 01.05.2017 12 Duct repair WHRB License Renewal
Auriya GPS GT 2 111.19 10.07.2017 10.07.2017 1 Duct repair WHRB License Renewal
Auriya GPS GT 3 111.19 26.06.2017 27.06.2017 2 WHRB License Renewal AFR
Maintenance Schedule of Nuclear/Thermal/Hydro based power generating stations for the year 2017-18
NORTHERN REGION

Annex-VII
(2 / 20)
Station/ System/ StateUnit
Number
Capacit
y (MW)Start Date End Date
No. of
Maintenan
ce Days
Reason
Auriya GPS GT 3 111.19 13.12.2017 15.12.2017 3 WHRB License Renewal AFR
Auriya GPS GT 4 111.19 23.02.2018 23.02.2018 1 WHRB License Renewal
Auriya GPS ST 1 109.3 20.04.2017 01.05.2017 12 GT Replacement
Dadri GPS GT 1 130.19 20.02.2017 10.04.2017 50
Boiler License Renewal 8000EOH
Inspection Fleme Tube Inspection AFR
Compressor Washing
Dadri GPS GT 1 130.19 24.04.2017 25.04.2017 2
Boiler License Renewal 8000EOH
Inspection Fleme Tube Inspection AFR
Compressor Washing
Dadri GPS GT 1 130.19 15.08.2017 21.08.2017 7
Boiler License Renewal 8000EOH
Inspection Fleme Tube Inspection AFR
Compressor Washing
Dadri GPS GT 1 130.19 01.11.2017 10.11.2017 10
Boiler License Renewal 8000EOH
Inspection Fleme Tube Inspection AFR
Compressor Washing
Dadri GPS GT 1 130.19 02.01.2018 02.01.2018 1
Boiler License Renewal 8000EOH
Inspection Fleme Tube Inspection AFR
Compressor Washing
Dadri GPS GT 2 130.19 20.02.2017 10.04.2017 50
Boiler License Renewal 8000EOH
Inspection Fleme Tube Inspection AFR
Compressor Washing
Dadri GPS GT 2 130.19 20.06.2017 21.06.2017 2
Boiler License Renewal 8000EOH
Inspection Fleme Tube Inspection AFR
Compressor Washing
Dadri GPS GT 2 130.19 22.08.2017 26.08.2017 5
Boiler License Renewal 8000EOH
Inspection Fleme Tube Inspection AFR
Compressor Washing
Dadri GPS GT 2 130.19 08.02.2018 14.02.2018 7
Boiler License Renewal 8000EOH
Inspection Fleme Tube Inspection AFR
Compressor Washing
Dadri GPS GT 2 130.19 02.03.2018 02.03.2018 1
Boiler License Renewal 8000EOH
Inspection Fleme Tube Inspection AFR
Compressor Washing
Dadri GPS GT 3 130.19 02.07.2017 06.07.2017 54000 EOH Inspection Major+gen+C and
I R&M
Dadri GPS GT 3 130.19 15.01.2018 18.02.2018 354001 EOH Inspection Major+gen+C and
I R&M
Dadri GPS GT 4 130.19 20.06.2017 21.06.2017 2Boiler License Renewal 8000EOH
Inspection etc
Dadri GPS GT 4 130.19 11.08.2017 15.08.2017 5Boiler License Renewal 8000EOH
Inspection etc
Dadri GPS GT 4 130.19 15.01.2018 18.02.2018 35Boiler License Renewal 8000EOH
Inspection etc
Dadri GPS ST 1 154.51 20.02.2017 10.04.2017 50 Annual Inspection+C&I R&M
Dadri GPS ST 2 154.51 15.01.2018 18.02.2018 35 Annual Inspection+C&I R&M
Faridabad (GPS) GT 1 137.76 15.05.2017 19.05.2017 5 Major Inspection AFR
Faridabad (GPS) GT 1 137.76 15.12.2017 19.12.2017 5 Major Inspection AFR
Faridabad (GPS) GT 2 137.76 20.03.2017 03.05.2017 45Major Inspection Gen rewinding Minor
Inspection AFR
Faridabad (GPS) GT 2 137.76 01.01.2018 05.01.2018 5Major Inspection Gen rewinding Minor
Inspection AFR
IGSTPP, Jhajjar 1 500 23.01.2018 25.01.2018 3 BLR
IGSTPP, Jhajjar 2 500 03.05.2017 05.05.2017 3 BLR
NAPS 2 220 01.09.2017 30.09.2017 30 Biennial Shutdown
RAPS - B 4 220 01.10.2017 10.11.2017 41 BSD
RAPS - C 6 220 01.11.2017 10.12.2017 41 BSD

Annex-VII
(3 / 20)
Station/ System/ StateUnit
Number
Capacit
y (MW)Start Date End Date
No. of
Maintenan
ce Days
Reason
NHPC Baira Siul 1 60 13.01.2018 11.02.2018 30 CM
NHPC Baira Siul 2 60 10.11.2017 29.11.2017 20 AM
NHPC Baira Siul 3 60 12.12.2017 31.12.2017 20 AM
Salal 1 115 20.12.2017 29.03.2018 100 CM
Salal 2 115 01.10.2017 09.11.2017 40 AM
Salal 3 115 10.11.2017 19.12.2017 40 AM
Salal 4 115 29.01.2018 09.03.2018 40 AM
Salal 5 115 01.10.2017 28.01.2018 120 CM
Salal 6 115 20.12.2017 28.01.2018 40 AM
Chamera - I 1 180 05.12.2017 25.12.2017 21 AM
Chamera - I 2 180 27.12.2017 16.01.2018 21 AM
Chamera - I 3 180 18.01.2018 07.02.2018 21 AM
Chamera - II 1 100 15.11.2017 29.11.2017 15 AM
Chamera - II 2 100 01.12.2017 15.12.2017 15 AM
Chamera - II 3 100 18.12.2017 16.01.2018 30 CM
Chamera - III 1 77 01.02.2018 28.02.2018 28 CM
Chamera - III 2 77 02.01.2018 16.01.2018 15 AM
Chamera - III 3 77 17.01.2018 31.01.2018 15 AM
Uri 1 120 05.12.2017 04.01.2018 31 CM
Uri 2 120 10.01.2018 08.02.2018 30 CM
Uri 3 120 26.10.2017 10.11.2017 16 AM
Uri 4 120 16.11.2017 30.11.2017 15 AM
Tanakpur 1 31.4 15.11.2017 15.12.2017 31 AM
Tanakpur 2 31.4 21.12.2017 20.01.2018 30 AM
Tanakpur 3 31.4 26.01.2018 15.05.2018 110 CM
Uri II 1 60 01.11.2017 20.11.2017 20 AM
Uri II 2 60 24.11.2017 13.12.2017 20 AM
Uri II 3 60 17.12.2017 05.01.2018 20 AM
Uri II 4 60 09.01.2018 28.01.2018 20 AM
Dhauliganga 1 70 21.12.2017 09.01.2018 20 AM
Dhauliganga 2 70 15.01.2018 03.02.2018 20 AM
Dhauliganga 3 70 17.10.2017 15.11.2017 30 AM
Dhauliganga 4 70 18.11.2017 17.12.2017 30 AM
Dulhasti 1 130 01.12.2017 20.12.2017 20 AM

Annex-VII
(4 / 20)
Station/ System/ StateUnit
Number
Capacit
y (MW)Start Date End Date
No. of
Maintenan
ce Days
Reason
Dulhasti 2 130 22.12.2017 10.01.2018 20 AM
Dulhasti 3 130 12.01.2018 31.01.2018 20 AM
PARBATI-III 1 130 25.01.2018 18.02.2018 25 AM
PARBATI-III 2 130 29.12.2017 22.01.2018 25 AM
PARBATI-III 3 130 02.12.2017 26.12.2017 25 AM
PARBATI-III 4 130 16.10.2017 29.11.2017 45 CM
SEWA -- II 1 40 15.11.2017 04.12.2017 21 AM
SEWA -- II 2 40 06.12.2017 26.12.2017 21 AM
SEWA -- II 3 40 27.12.2017 16.01.2018 21 AM
BBMB Bhakra (L) 1 108 25.01.2018 18.02.2018 25 AM
BBMB Bhakra (L) 2 126 14.11.2017 05.12.2017 22 AM
BBMB Bhakra (L) 3 108 25.09.2017 14.10.2017 20 AM
BBMB Bhakra (L) 4 126 24.04.2017 10.06.2017 48
Runner Modification by Hitachi Ltd if
results of modified runner of unit
2found satisfactory joint inspection
tentatively during March 2017 after
6400hrs of running
BBMB Bhakra (L) 5 126 21.06.2016 31.03.2018 649For replacement of generator shaft and
spider
BBMB Bhakra (R) 6 157 03.01.2018 23.01.2018 21 AM
BBMB Bhakra (R) 7 157 23.10.2017 11.11.2017 20 AM
BBMB Bhakra (R) 7 157 20.02.2018 11.03.2018 20 AM
BBMB Bhakra (R) 8 157 16.10.2017 23.03.2018 159 CM
BBMB Bhakra (R) 9 157 06.12.2017 26.12.2017 21 AM
BBMB Bhakra (R) 10 157 12.03.2018 31.03.2018 20 AM
Ganguwal 1 27.99 19.06.2017 25.06.2017 7Half yearly maintenance quarterly
mtc.annual mtc.etc
Ganguwal 1 27.99 25.09.2017 28.09.2017 4Half yearly maintenance quarterly
mtc.annual mtc.etc
Ganguwal 1 27.99 18.12.2017 27.12.2017 10Half yearly maintenance quarterly
mtc.annual mtc.etc
Ganguwal 1 27.99 26.03.2018 29.03.2018 4Half yearly maintenance quarterly
mtc.annual mtc.etc
Ganguwal 2 24.2 01.04.2017 30.09.2017 183RM Works half yearly maintenance
quarterly mtc.
Ganguwal 2 24.2 28.12.2017 31.12.2017 4RM Works half yearly maintenance
quarterly mtc.
Ganguwal 2 24.2 12.03.2018 18.03.2018 7RM Works half yearly maintenance
quarterly mtc.
Ganguwal 3 24.2 19.04.2017 28.04.2017 10Half yearly maintenance quarterly
mtc.annual mtc.etc
Ganguwal 3 24.2 25.07.2017 28.07.2017 4Half yearly maintenance quarterly
mtc.annual mtc.etc
Ganguwal 3 24.2 23.10.2017 29.10.2017 7Half yearly maintenance quarterly
mtc.annual mtc.etc
Ganguwal 3 24.2 23.01.2017 26.01.2017 4Half yearly maintenance quarterly
mtc.annual mtc.etc
Kotla 1 28.94 22.05.2017 25.05.2017 4Half yearly maintenance quarterly
mtc.annual mtc.etc

Annex-VII
(5 / 20)
Station/ System/ StateUnit
Number
Capacit
y (MW)Start Date End Date
No. of
Maintenan
ce Days
Reason
Kotla 1 28.94 21.08.2017 26.08.2017 6Half yearly maintenance quarterly
mtc.annual mtc.etc
Kotla 1 28.94 15.11.2017 18.11.2017 4Half yearly maintenance quarterly
mtc.annual mtc.etc
Kotla 1 28.94 12.02.2018 21.02.2018 10Half yearly maintenance quarterly
mtc.annual mtc.etc
Kotla 2 24.2 29.05.2017 04.06.2017 7Half yearly maintenance quarterly
mtc.annual mtc.etc
Kotla 2 24.2 28.08.2017 31.08.2017 4Half yearly maintenance quarterly
mtc.annual mtc.etc
Kotla 2 24.2 20.11.2017 29.11.2017 10Half yearly maintenance quarterly
mtc.annual mtc.etc
Kotla 2 24.2 22.02.2018 25.02.2018 4Half yearly maintenance quarterly
mtc.annual mtc.etc
Kotla 3 24.2 01.04.2017 30.09.2017 183RM Works half yearly maintenance
quarterly mtc.
Kotla 3 24.2 13.12.2017 16.12.2017 4RM Works half yearly maintenance
quarterly mtc.
Kotla 3 24.2 19.03.2018 25.03.2018 7RM Works half yearly maintenance
quarterly mtc.
Dehar 1 165 05.03.2018 24.03.2018 20 AM
Dehar 2 165 11.01.2018 30.01.2018 20 AM
Dehar 3 165 23.10.2017 11.11.2017 20 AM
Dehar 4 165 08.01.2018 07.04.2018 90 CM
Dehar 5 165 03.10.2017 30.12.2017 90 CM
Dehar 6 165 20.11.2017 09.12.2017 20 AM
Pong 1 66 03.04.2017 17.04.2017 15 AM half yearly mtc etc.
Pong 1 66 02.10.2017 08.10.2017 7 AM half yearly mtc etc.
Pong 1 66 03.03.2018 02.04.2018 30 AM half yearly mtc etc.
Pong 2 66 01.04.2017 01.05.2017 31Capital mtc & replacement of governer
& half yearly maintenance
Pong 2 66 09.10.2017 15.10.2017 7Capital mtc & replacement of governer
& half yearly maintenance
Pong 3 66 18.04.2017 02.05.2017 15 AM half yearly mtc etc.
Pong 3 66 16.10.2017 22.10.2017 7 AM half yearly mtc etc.
Pong 4 66 23.10.2017 29.11.2017 38 Half yearly mtc etc.
Pong 5 66 03.05.2017 17.05.2017 15 AM half yearly mtc etc.
Pong 5 66 30.11.2017 06.12.2017 7 AM half yearly mtc etc.
Pong 6 66 07.11.2017 13.11.2017 7 Half yearly mtc
Rampur 1 68.67 01.12.2017 15.12.2017 15 Annual Planned Maintenance
Rampur 2 68.67 16.12.2017 30.12.2017 15 Annual Planned Maintenance
Rampur 3 68.67 31.12.2017 14.01.2018 15 Annual Planned Maintenance
Rampur 4 68.67 15.01.2018 29.01.2018 15 Annual Planned Maintenance
Rampur 5 68.67 30.01.2018 13.02.2018 15 Annual Planned Maintenance
Rampur 6 68.67 14.02.2018 28.02.2018 15 Annual Planned Maintenance
Nathpa-Jhakri 1 250 01.12.2017 15.12.2017 15 Annual Planned Maintenance
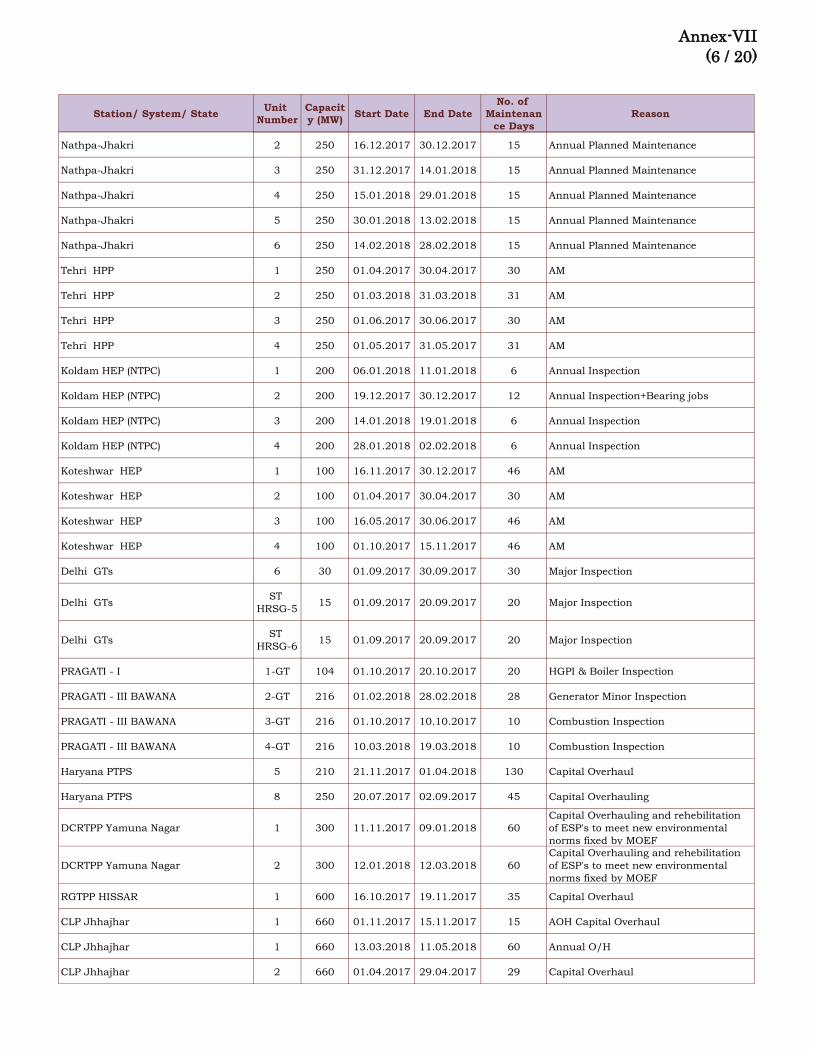
Annex-VII
(6 / 20)
Station/ System/ StateUnit
Number
Capacit
y (MW)Start Date End Date
No. of
Maintenan
ce Days
Reason
Nathpa-Jhakri 2 250 16.12.2017 30.12.2017 15 Annual Planned Maintenance
Nathpa-Jhakri 3 250 31.12.2017 14.01.2018 15 Annual Planned Maintenance
Nathpa-Jhakri 4 250 15.01.2018 29.01.2018 15 Annual Planned Maintenance
Nathpa-Jhakri 5 250 30.01.2018 13.02.2018 15 Annual Planned Maintenance
Nathpa-Jhakri 6 250 14.02.2018 28.02.2018 15 Annual Planned Maintenance
Tehri HPP 1 250 01.04.2017 30.04.2017 30 AM
Tehri HPP 2 250 01.03.2018 31.03.2018 31 AM
Tehri HPP 3 250 01.06.2017 30.06.2017 30 AM
Tehri HPP 4 250 01.05.2017 31.05.2017 31 AM
Koldam HEP (NTPC) 1 200 06.01.2018 11.01.2018 6 Annual Inspection
Koldam HEP (NTPC) 2 200 19.12.2017 30.12.2017 12 Annual Inspection+Bearing jobs
Koldam HEP (NTPC) 3 200 14.01.2018 19.01.2018 6 Annual Inspection
Koldam HEP (NTPC) 4 200 28.01.2018 02.02.2018 6 Annual Inspection
Koteshwar HEP 1 100 16.11.2017 30.12.2017 46 AM
Koteshwar HEP 2 100 01.04.2017 30.04.2017 30 AM
Koteshwar HEP 3 100 16.05.2017 30.06.2017 46 AM
Koteshwar HEP 4 100 01.10.2017 15.11.2017 46 AM
Delhi GTs 6 30 01.09.2017 30.09.2017 30 Major Inspection
Delhi GTsST
HRSG-515 01.09.2017 20.09.2017 20 Major Inspection
Delhi GTsST
HRSG-615 01.09.2017 20.09.2017 20 Major Inspection
PRAGATI - I 1-GT 104 01.10.2017 20.10.2017 20 HGPI & Boiler Inspection
PRAGATI - III BAWANA 2-GT 216 01.02.2018 28.02.2018 28 Generator Minor Inspection
PRAGATI - III BAWANA 3-GT 216 01.10.2017 10.10.2017 10 Combustion Inspection
PRAGATI - III BAWANA 4-GT 216 10.03.2018 19.03.2018 10 Combustion Inspection
Haryana PTPS 5 210 21.11.2017 01.04.2018 130 Capital Overhaul
Haryana PTPS 8 250 20.07.2017 02.09.2017 45 Capital Overhauling
DCRTPP Yamuna Nagar 1 300 11.11.2017 09.01.2018 60
Capital Overhauling and rehebilitation
of ESP's to meet new environmental
norms fixed by MOEF
DCRTPP Yamuna Nagar 2 300 12.01.2018 12.03.2018 60
Capital Overhauling and rehebilitation
of ESP's to meet new environmental
norms fixed by MOEF
RGTPP HISSAR 1 600 16.10.2017 19.11.2017 35 Capital Overhaul
CLP Jhhajhar 1 660 01.11.2017 15.11.2017 15 AOH Capital Overhaul
CLP Jhhajhar 1 660 13.03.2018 11.05.2018 60 Annual O/H
CLP Jhhajhar 2 660 01.04.2017 29.04.2017 29 Capital Overhaul

Annex-VII
(7 / 20)
Station/ System/ StateUnit
Number
Capacit
y (MW)Start Date End Date
No. of
Maintenan
ce Days
Reason
KTPS Rajasthan 1 110 25.04.2017 09.05.2017 15 Annual Overhaul
KTPS Rajasthan 2 110 25.05.2017 08.06.2017 15 Annual Overhaul
KTPS Rajasthan 3 210 09.06.2017 13.07.2017 35 Annual Capital Overhaul
KTPS Rajasthan 4 210 10.05.2017 24.05.2017 15 Annual Overhaul
KTPS Rajasthan 5 210 10.04.2017 24.04.2017 15 Annual Overhaul
KTPS Rajasthan 6 195 29.07.2017 12.08.2017 15 Annual Overhaul
KTPS Rajasthan 7 195 14.07.2017 28.07.2017 15 Annual Overhaul
RAMGARH GAS CCPP 2-GT 37.5 01.05.2017 15.05.2017 15 HGPI
RAMGARH GAS CCPP 3-GT 110 01.09.2017 15.09.2017 15 HGPI
RAMGARH GAS CCPP 1-ST 37.5 01.06.2017 22.06.2017 22 Capital OH
SURATGARH TPS 1 250 01.12.2017 21.12.2017 21 Annual O/H
SURATGARH TPS 2 250 02.01.2018 22.01.2018 21 Annual O/H
SURATGARH TPS 3 250 19.08.2017 08.09.2017 21 Annual O/H
SURATGARH TPS 4 250 01.02.2018 21.02.2018 21 Annual O/H
SURATGARH TPS 5 250 16.06.2017 15.07.2017 30 Annual O/H
SURATGARH TPS 6 250 16.01.2018 05.02.2018 21 Annual O/H
DHOLPUR GAS CCPP 1-GT 110 01.09.2017 04.11.2017 65 Major O/H
DHOLPUR GAS CCPP 3-ST 110 01.09.2017 20.10.2017 50 Major O/H
Kalisindh TPP 1 600 07.07.2017 21.07.2017 15 Annual O/H
Kalisindh TPP 2 600 07.08.2017 21.08.2017 15 Annual O/H
CHHABRA TPS 1 250 15.06.2017 14.07.2017 30Annual Mtc.& O/H of unit NFT & MPI of
Turbine
CHHABRA TPS 2 250 07.07.2017 21.07.2017 30 Annual Overhaul
CHHABRA TPS 3 250 16.08.2017 24.09.2017 21
Annual Overhaul and LP
Turbine,Bearing & Generator
Inspection.
CHHABRA TPS 4 250 08.08.2017 22.08.2017 30Annual O/H nad replacement of FD-14
Valve
NLC BARSINGSAR LTPS 1 125 05.07.2017 03.08.2017 30Annual Maintenance of boiler &
statutory inspectory
NLC BARSINGSAR LTPS 2 125 05.04.2017 04.05.2017 30Annual Maintenance of boiler &
statutory inspectory
KAWAI (adani-mundra) 8 660 01.12.2017 09.01.2018 40 Annual O/H
Adani-Rajasthan 1 660 01.06.2017 25.06.2017 25 Annual O/H
RAJWEST Power 1 135 12.04.2017 19.04.2017 8 Refractory Mtc.
RAJWEST Power 1 135 15.07.2017 27.07.2017 12 Refractory Mtc.
RAJWEST Power 1 135 07.03.2018 14.03.2018 8 Refractory Mtc.
RAJWEST Power 2 135 21.07.2017 28.07.2017 8 BLR,Refractory mtc & boiler inspection
RAJWEST Power 2 135 15.03.2018 30.03.2018 16 BLR,Refractory mtc & boiler inspection

Annex-VII
(8 / 20)
Station/ System/ StateUnit
Number
Capacit
y (MW)Start Date End Date
No. of
Maintenan
ce Days
Reason
RAJWEST Power 3 135 02.06.2017 09.06.2017 8 BLR,Refractory mtc & boiler inspection
RAJWEST Power 3 135 27.12.2017 03.01.2018 8 BLR,Refractory mtc & boiler inspection
RAJWEST Power 3 135 15.02.2018 22.02.2018 8 BLR,Refractory mtc & boiler inspection
RAJWEST Power 4 135 24.08.2017 31.08.2017 8 BLR,Refractory mtc & boiler inspection
RAJWEST Power 4 135 12.11.2017 19.11.2017 8 BLR,Refractory mtc & boiler inspection
RAJWEST Power 4 135 23.02.2018 02.03.2018 8 BLR,Refractory mtc & boiler inspection
RAJWEST Power 5 135 28.04.2017 05.05.2017 8 BLR,Refractory mtc & boiler inspection
RAJWEST Power 5 135 01.09.2017 25.09.2017 25 BLR,Refractory mtc & boiler inspection
RAJWEST Power 5 135 28.12.2017 04.01.2018 8 BLR,Refractory mtc & boiler inspection
RAJWEST Power 6 135 06.05.2017 13.05.2017 8 BLR,Refractory mtc & boiler inspection
RAJWEST Power 6 135 19.08.2017 26.08.2017 8 BLR,Refractory mtc & boiler inspection
RAJWEST Power 6 135 22.11.2017 29.11.2017 8 BLR,Refractory mtc & boiler inspection
RAJWEST Power 6 135 01.12.2017 25.12.2017 25 BLR,Refractory mtc & boiler inspection
RAJWEST Power 7 135 27.05.2017 03.06.2017 8 BLR,Refractory mtc & boiler inspection
RAJWEST Power 7 135 12.02.2018 27.02.2018 16 BLR,Refractory mtc & boiler inspection
RAJWEST Power 8 135 30.04.2017 07.05.2017 8 BLR,Refractory mtc & boiler inspection
RAJWEST Power 8 135 24.10.2017 08.11.2017 16 BLR,Refractory mtc & boiler inspection
ANPARA 1 210 05.07.2017 22.07.2017 18 Mini OH
ANPARA 2 210 01.04.2017 30.04.2017 30 OH
ANPARA 3 210 14.01.2018 31.01.2018 18 Mini OH
ANPARA 4 500 20.10.2017 03.12.2017 45 OH
ANPARA 5 500 14.03.2018 31.03.2018 18 Mini OH
ANPARA 6 500 01.10.2017 18.10.2017 18 Mini OH
OBRA 7 94 10.12.2017 27.12.2017 18 Mini OH
OBRA 9 200 11.02.2018 28.02.2018 18 Mini OH
OBRA 10 200 10.11.2017 27.11.2017 18 Mini OH
OBRA 11 200 01.03.2018 18.03.2018 18 Mini OH
PARICHHA 2 110 10.04.2017 27.04.2017 18 Mini OH
PARICHHA 3 210 01.01.2018 30.01.2018 30 OH
PARICHHA 4 210 20.01.2018 18.02.2018 30 OH
PARICHHA 5 250 01.02.2018 18.02.2018 18 Mini OH
PARICHHA 6 250 20.02.2018 05.04.2018 45 OH
H'GANJ 7 105 01.09.2017 30.09.2017 30 OH
H'GANJ 8 250 01.04.2017 30.04.2017 30 OH

Annex-VII
(9 / 20)
Station/ System/ StateUnit
Number
Capacit
y (MW)Start Date End Date
No. of
Maintenan
ce Days
Reason
H'GANJ 9 250 10.12.2017 27.12.2017 18 Mini OH
ROSA TPS ( IPP ) 3 300 15.12.2017 14.02.2018 60 OH
ROSA TPS ( IPP ) 4 300 01.11.2017 22.11.2017 22 Boiler OH
LANCO ANPARA - C( IPP ) 2 600 15.11.2017 05.12.2017 21 Annual Boiler OH
GUJARAT
UKAI TPS 1 120 01-11-17 30-11-17 30 AOH
UKAI TPS 2 120 01-12-18 30-12-18 30 AOH
UKAI TPS 3 200 18-06-17 08-07-17 21 AOH
UKAI TPS 4 200 01-03-18 21-03-18 21 AOH
UKAI TPS 6 500 01-08-17 30-08-17 30 AOH
GANDHINAGAR 3 210 05-11-17 04-12-17 30 AOH
GANDHINAGAR 4 210 29-03-17 07-05-17 40 COH
GANDHINAGAR 5 210 15-07-17 13-08-17 30 AOH
WANAKBORI 2 210 01-02-18 21-02-18 21 AOH
WANAKBORI 3 210 15-06-17 22-09-17 100Turbine Retrofitting / ESP
Refurbishment
WANAKBORI 5 210 01-08-17 21-08-17 21 AOH
WANAKBORI 6 210 01-04-17 21-04-17 21 AOH
SIKKA 1 120 01-07-17 21-07-17 21 AOH
SIKKA 2 120 25-07-17 14-08-17 21 AOH
SIKKA 3 250 20-08-17 09-09-17 21 AOH
SIKKA 4 250 15-07-17 04-08-17 21 AOH
KLTPS 1 70 01-09-17 21-09-17 21 AOH
KLTPS 2 70 01-03-18 21-03-18 21 AOH
KLTPS 3 75 15-11-17 05-12-17 21 AOH
KLTPS 4 75 01-07-17 21-07-17 21 AOH
DHUVRAN GAS Stage-I 106.62 01-07-17 15-07-17 15 HGPI
DHUVRAN GAS Stage-II 112.45 01-08-17 15-08-17 15 HGPI
UTRAN - IIGT &
STG374.57 15-07-17 21-07-17 7 A Inspection
GUJARAT IPP / PVT
AKRIMOTA 1 125 01-08-17 31-08-17 31 AOH
AKRIMOTA 2 125 01-11-17 30-11-17 30 AOH
TORRENT POWER LTD C 60 24-12-17 28-12-17 5 AOH / Boiler overhaul
TORRENT POWER LTD D 120 20-11-17 09-12-17 20 AOH / Boiler overhaul
TORRENT POWER LTD E 121 12-12-17 21-12-17 10 AOH / Boiler overhaul
TORRENT POWER LTD F 121 19-10-17 17-11-17 30 AOH / Boiler overhaul
SUGEN* 10 382.5 01-03-18 08-03-18 8 AOH
SUGEN* 20 382.5 01-01-18 10-02-18 41 AOH
SUGEN* 30 382.5 01-11-17 10-12-17 40 AOH
UNO SUGEN 40 382.5 06-07-17 13-07-17 8 AOH
CLPIL GT-11 138 10-02-18 12-02-18 3 Minor outage
CLPIL GT-12 138 13-02-18 15-02-18 3 Minor outage
CLPIL GT-13 138 15-09-17 17-09-17 3 Minor outage
GSEG - I GT-11 52 25-02-18 28-02-18 4 A inspection & Statutory Hydrotest
GSEG - I GT-12 52 01-02-18 18-02-18 18C inspection & Statutory Hydrotest
from 05.02.18 to 08.02.18
GSEG - I STG 52 01-02-18 28-02-18 28 Major inspection
GSEG - II GT 222.43 03-07-17 10-07-17 8
Statutory Hydrotest & GT off line water
wash from 8.7.17 to 10.7.17 &
14.11.17 to 16.11.17
GIPCL-I GT-1 32 04-08-17 10-08-17 7Water wash & HRSG-1 Annual
inspection
GIPCL-I GT-2 32 01-09-17 07-09-17 7CI & Water wash AND HRSG-2 Annual
inspection
GIPCL-II GT-3 32 08-09-17 14-09-17 7CI & Water wash AND HRSG-3 Annual
inspection
GIPCL-II STG-1 49 10-07-17 27-07-17 18 LP Guide Blade replacement
GIPCL-II GT-4 111 15-12-17 23-12-17 9Water wash & HRSG-4 Annual
inspection
SLPP 1 125 01-06-17 20-06-17 20 AOH
SLPP 2 125 01-06-17 30-06-17 30 COH
WESTERN REGION

Annex-VII
(10 / 20)
Station/ System/ StateUnit
Number
Capacit
y (MW)Start Date End Date
No. of
Maintenan
ce Days
Reason
SLPP 3 125 07-07-17 27-07-17 21 AOH
SLPP 4 125 04-08-17 24-08-17 21 AOH
APL 1 330 01-01-18 10-01-18 10 Boiler Licence Renewal
APL 6 660 20-07-17 05-09-17 48 COH
APL 8 660 01-12-17 25-12-17 25 AOH
ACBIL 2 135 07-01-18 31-01-18 25 AOH
CHHATISGARH
Korba East-1 1 50 16-04-17 01-05-17 15 AOH
Korba East-3 3 50 01-04-17 15-04-17 14 AOH
Korba East-4 4 50 08-06-17 23-06-17 15 AOH
Korba East-5 5 120 08-05-17 28-05-17 20 AOH
Korba West-1 1 210 16-08-17 08-09-17 23 AOH
Korba West-4 4 210 23-06-17 02-08-17 40 R&M proposed
DSPM-1 1 250 10-01-18 02-02-18 23 AOH
MADHYA PRADESH
SATPURA 6 200 01-09-17 15-09-17 15 A.O.H
SATPURA 7 210 15-08-17 29-08-17 15 A.O.H
SATPURA 8 210 01-07-17 25-07-17 25 A.O.H
SATPURA 9 210 01-08-17 25-08-17 25 A.O.H
SATPURA 11 250 01-07-17 19-08-17 50 A.O.H
SANJAY GANDHI 1 210 01-07-17 14-08-17 45 C.O.H
SANJAY GANDHI 3 210 15-07-17 08-08-17 25 A.O.H
SANJAY GANDHI 5 500 15-06-17 15-07-17 31 A.O.H
Indira Sagar Project Station (ISPS) 1 125 01-04-17 15-04-17 15 A.O.H
Indira Sagar Project Station (ISPS) 2 125 16-04-17 30-04-17 15 A.O.H
Indira Sagar Project Station (ISPS) 3 125 01-05-17 15-05-17 15 A.O.H
Indira Sagar Project Station (ISPS) 4 125 16-05-17 31-05-17 16 A.O.H
Indira Sagar Project Station (ISPS) 5 125 01-06-17 15-06-17 15 A.O.H
Indira Sagar Project Station (ISPS) 6 125 16-06-17 30-06-17 15 A.O.H
Indira Sagar Project Station (ISPS) 7 125 01-03-18 15-03-18 15 A.O.H
Indira Sagar Project Station (ISPS) 8 125 16-03-18 31-03-18 16 A.O.H
Omkareshwar Project (OSP) 1 54 01-04-17 15-04-17 15 A.O.H
Omkareshwar Project (OSP) 2 54 16-04-17 30-04-17 15 A.O.H
Omkareshwar Project (OSP) 3 54 01-05-17 15-05-17 15 A.O.H
Omkareshwar Project (OSP) 4 54 16-05-17 30-05-17 15 A.O.H
Omkareshwar Project (OSP) 5 54 01-06-17 15-06-17 15 A.O.H
Omkareshwar Project (OSP) 6 54 16-06-17 30-06-17 15 A.O.H
Omkareshwar Project (OSP) 7 54 01-03-18 15-03-18 15 A.O.H
Omkareshwar Project (OSP) 8 54 16-03-18 30-03-18 15 A.O.H
MAHARASHTRA
MSPGCL
Bhusawal Unit 5 500MW 01-07-17 26-07-17 26 AOH
Chandrapur Unit 4 210MW 01-08-17 26-08-17 26 AOH
Chandrapur Unit 5 500MW 05-07-17 30-07-17 26 AOH
Chandrapur Unit 6 500MW 05-08-17 30-08-17 26 AOH
Chandrapur Unit 8* 500MW 01-11-17 26-11-17 26 AOH
Chandrapur Unit 9* 500MW 01-12-17 26-12-17 26 AOH
Khaperkheda Unit 2 210MW 01-07-17 26-07-17 26 AOH
Koradi Unit 6 210MW 01-07-15 31-03-17 640 R&M
Koradi Unit 9* 660MW 01-11-17 01-12-17 31 AOH
Koradi Unit 10* 660MW 01-12-17 31-12-17 31 AOH
PARAS Unit 4 250MW 01-06-17 24-06-17 24 AOH
PARLI Unit 8 250MW 01-01-18 26-01-18 26 AOH
K'KHEDA Unit 4 210MW 01-08-17 05-09-17 36 COH
NASIK Unit 3 210MW 01-07-17 30-08-17 61 COH
WPCL Unit 1 135MW 03-08-17 14-08-17 12 AOH
WPCL Unit 2 135MW 03-09-17 14-09-17 12 AOH
WPCL Unit 3 135MW 03-06-17 14-06-17 12 AOH
WPCL Unit 4 135MW 03-07-17 14-07-17 12 AOH
RattanIndia Power Ltd Unit 1 270MW 10-08-17 17-08-17 8 AOH
RattanIndia Power Ltd Unit 2 270MW 15-02-18 22-02-18 8 AOH
RattanIndia Power Ltd Unit 5 270MW 25-10-17 02-11-17 9 AOH
DTPS Unit 2 250MW 10-07-17 08-08-17 30 AOH
DTPS Unit 1 250MW 20-12-17 26-12-17 7 Boiler Inspection
TATA Unit 5 500MW 06-01-18 12-01-18 7 AOH
TATA Unit 7 180MW 02-07-17 09-07-17 8 AOH
TATA Unit 8 250MW 26-11-17 20-12-17 25 AOH
APML Unit 1 660MW 28-07-17 21-08-17 25 AOH

Annex-VII
(11 / 20)
Station/ System/ StateUnit
Number
Capacit
y (MW)Start Date End Date
No. of
Maintenan
ce Days
Reason
APML Unit 2 660MW 25-05-17 18-06-17 25 AOH
APML Unit 4 660MW 01-07-17 25-07-17 25 AOH
JSW Unit 1 300MW 01-03-18 31-03-18 31 AOH
JSW Unit 4 300MW 17-11-17 27-12-17 41 COH
VIPL Unit 1 300MW 25-01-18 28-02-18 35 AOH
DHARIWAL 1 300 01-11-17 20-11-17 20 AOH
DHARIWAL 2 300 01-07-17 20-07-17 20 AOH
PIONEER GAS POWER LIMITED 1 388 04-07-17 06-07-17 3 Off line Compressor washing
PIONEER GAS POWER LIMITED 1 388 10-10-17 20-10-17 11Combustion inspection and compressor
offline wash
PIONEER GAS POWER LIMITED 1 388 17-03-18 19-03-18 3 Off line Compressor washing
PIONEER GAS POWER LIMITED STG+1 388 15-01-18 18-01-18 4HRSG annual statutory inspection and
hydrotest
CENTRAL SECTOR
KORBA ( KSTPS ) 1 200 05-04-17 29-04-17 25Boiler+LPT+Gen+TG+ Brg Ins+Boiler
RLA
KORBA ( KSTPS ) 1 200 05-10-17 08-10-17 4 ESP GD Test
KORBA ( KSTPS ) 2 200 27-08-17 23-09-17 28Boiler+Boiler RLA+TG Brg Ins+AVR to
DAVR+All HT Breaker replacement
KORBA ( KSTPS ) 5 500 27-07-17 24-08-17 29 Boiler+Boiler RLA+ESP GD Test
KORBA ( KSTPS ) 6 500 27-05-17 30-05-17 4 ESP GD Test
KORBA ( KSTPS ) 7 500 25-06-17 19-07-17 25Boiler+Retrofit of 100 KW and more
modules
VINDHYACHAL 1 210 23-04-17 29-04-17 7 BLR+APH Seal setting
VINDHYACHAL 3 210 01-05-17 04-06-17 35Boiler+Turbine+Gen+CW duct+ ESP-
R&M-Guillotine gate work
VINDHYACHAL 4 210 10-06-17 04-07-17 25 Boiler+CW Coasting
VINDHYACHAL 5 210 27-03-17 20-04-17 25 Boiler+ESP-R&M
VINDHYACHAL 6 210 01-01-18 25-01-18 25 Boiler
VINDHYACHAL 7 500 11-07-17 24-08-17 45 Boiler modification+CW duct+ESP
VINDHYACHAL 10 500 26-08-17 30-09-17 35 Boiler modification
VINDHYACHAL 12 500 20-11-17 13-12-17 25 Boiler+LPT+Generator
SIPAT 1 660 01-04-17 30-04-17 30 Boiler+LPT
SIPAT 5 500 21-07-17 14-08-17 25 Boiler
KAWAS GT-1A 106 13-02-18 04-03-18 20 HCPI +Gen. & WHRB-RLA
KAWAS GT-1A 106 30-04-17 02-05-17 3 WHRB license renewal
KAWAS GT-1B 106 18-12-17 20-12-17 3 WHRB license renewal
KAWAS GT-2A 106 01-09-17 09-09-17 10 CI + WHRB -RLA
KAWAS GT-2B 106 09-02-18 11-02-18 3AIF Replacement +WHRB license
Renewal
KAWAS ST-1C 58.05 13-02-18 19-03-18 35 Major inspection + Gen. & Turbine -RLA
JHANOR GT-1 144.3 01-02-18 02-02-18 2AIF Replacement, to be done in
oppurtunity shut down
JHANOR GT-1 144.3 06-06-17 08-06-17 3 WHRB license renewal
JHANOR GT-2 144.3 30-01-18 31-01-18 2AIF Replacement, to be done in
oppurtunity shut down
JHANOR GT-2 144.3 27-03-18 29-03-18 3 WHRB license renewal
JHANOR GT-3 144.3 01-07-17 07-07-17 7 A-Inspection + WHRB BLR
JHANOR GT-3 144.3 01-03-18 27-03-18 28C-Inspection + AIF repl, Based on EOH
inspection may be carried out
JHANOR STG 74.83 01-03-18 19-03-18 20 Minor Inspection
MAUDA 2 500 26-07-17 19-08-17 25
1. based on running hour Gen.
inspection to be carried out. 2. boiler +
LPT OH to be clubbed with Gen. 1st
inspection
KAPS 1 220 Already out Already out
KAPS 2 220 Already out Already out
CGPL 10 800 12-06-17 31-08-17 80 COH, RH modification, steam blowing
CGPL 10 20-10-17 18-11-17 29 CRV strainer removal
CGPL 20 800 26-05-17 09-06-17 14 HYDRO TEST
CGPL 30 800 15-04-17 05-05-17 20 CRV strainer removal
CGPL 40 800 20-11-17 08-02-18 80 Boiler Statutory Hydro test
SSP RBPH 1 200 20.01.2018 09.02.2018 21 Routine AOH work

Annex-VII
(12 / 20)
Station/ System/ StateUnit
Number
Capacit
y (MW)Start Date End Date
No. of
Maintenan
ce Days
Reason
SSP RBPH 2 200 14.02.2018 06.03.2018 21 Routine AOH work
SSP RBPH 3 200 09.03.2018 29.03.2018 21 Routine AOH work
SSP RBPH 4 200 04.04.2018 24.04.2018 21 Routine AOH work
SSP RBPH 5 200 01.12.2017 21.12.2017 21 Bearing Centering work
SSP RBPH 6 200 26.12.2017 16.01.2018 22 Bearing Centering work
SSP CHPH 1 50 16.01.2018 01.02.2018 17 Routine AOH work
SSP CHPH 2 50 06.02.2018 22.02.2018 17 Routine AOH work
SSP CHPH 3 50 27.02.2018 15.03.2018 17 Routine AOH work
SSP CHPH 4 50 10.04.2018 26.04.2018 17 Bearing Centering work if required
SSP CHPH 5 50 20.03.2018 05.04.2018 17 Routine AOH work
Sasan Power Ltd 1 660 10-07-17 08-08-17 30 Annual Overhaul/Boiler Overhaul
Sasan Power Ltd 2 660 15-06-17 14-07-17 31 Annual Overhaul/Boiler Overhaul
Sasan Power Ltd 3 660 05-08-17 19-08-17 15 Annual Overhaul/Boiler Overhaul
JPL 2 250 01-07-17 17-07-17 17 AOH
JPL 4 250 01-09-17 30-09-17 30 COH
VTPS-1 1 210 10-07-17 25-07-17 16 AOH
VTPS-2 2 210 01-06-17 15-07-17 45 AOH, R&M
VTPS-3 3 210 01-10-17 15-10-17 15 AOH
VTPS-4 4 210 01-08-17 15-08-17 15 COH
VTPS-5 5 210 01-06-17 15-06-17 15AOH. Original Plan during November
shifted to June
VTPS-6 6 210 01-09-17 15-09-17 15 AOH
VTPS-7 7 500 16-09-17 30-09-17 15 AOH
RTPP Stage 1 : Unit - 1 1 210 16-07-17 30-07-17 15 AOH
RTPP Stage 1 : Unit - 2 2 210 01-09-17 15-09-17 15 AOH
RTPP Stage 2 : Unit - 4 4 210 16-07-17 30-07-17 15AOH. Original Plan during November
shifted to July
RTPP Stage 3 : Unit - 5 5 210 01-08-17 15-08-17 15 AOH
Upper sileru-1 1 60
During
May &
June, 2017
15 Annual Maintenance
Upper sileru-2 2 60 16 Annual Maintenance
Upper sileru-3 3 60 15 Annual Maintenance
Upper sileru-4 4 60 15 Annual Maintenance
Donkarayi 1 25 May, 2017 20 Annual Maintenance
Lower sileru-1 1 115
During
May &
June, 2017
15 Annual Maintenance
Lower sileru-2 2 115 16 Annual Maintenance
Lower sileru-3 3 115 15 Annual Maintenance
Lower sileru-4 4 115 15 Annual Maintenance
Srisailam RB-1 1 110 April, 2017 12 Annual Maintenance
Srisailam RB-2 2 110 April, 2017 12 Annual Maintenance
Srisailam RB-3 3 110
During
April &
June, 2017
12 Annual Maintenance
Srisailam RB-4 4 110 May, 2017 12 Annual Maintenance
Srisailam RB-5 5 110 May, 2017 12 Annual Maintenance
Srisailam RB-6 6 110
During
May &
June, 2017
12 Annual Maintenance
The IPPs shown under central sector are either multistate share project or PPA with entities of other region.
SOUTHERN REGION

Annex-VII
(13 / 20)
Station/ System/ StateUnit
Number
Capacit
y (MW)Start Date End Date
No. of
Maintenan
ce Days
Reason
Srisailam RB-7 7 110 June, 2017 12 Annual Maintenance
Nagarjunsagar RH-1 1 30May &
June, 201720 Annual Maintenance
Nagarjunsagar RH-2 2 30 20 Annual Maintenance
Nagarjunsagar RH-3 3 30 20 Annual Maintenance
Vijjeswaram St I - GT1 1 33October,
20172 Boiler Inspection
Vijjeswaram St II - STG3 3 60February,
20182 Boiler Inspection
GT - 1 1 46.8December,
20173 Combustor Inspection
GT - 2 2 46.1February,
20183 Combustor Inspection
GT - 3 3 46.1February,
20183 Combustor Inspection
Reliance (BSES) 1 220 May, 2017 1 Compressor Offline Washing
Reliance (BSES) 2August,
20171 Compressor Offline Washing
Reliance (BSES) 1November,
20174 HRSG Inspection
Reliance (BSES) 2February,
20181 Compressor Offline Washing
GVK - II Extension HRSG 220 July, 2017 2 Boiler License
HNPCL, Unit 1 1 520 04-08-17 29-08-17 26 AOH (Boiler Overhaul)
HNPCL, Unit 2 2 520 17-01-18 11-02-18 26 AOH (Boiler Overhaul)
Gautami - 1 1 145 11-07-17 14-07-17 4 HRSG Inspection
एम.ई.पी.एल / MEPL : U-1 1 150 01-01-18 21-01-18 21 Boiler Overhaul
एम.ई.पी.एल / MEPL : U-2 2 150 10-11-17 30-11-17 21 Boiler Overhaul
एस.ई.पी.एल. / SEPL : Phase I : U-1 1 150 01-04-17 15-04-17 15 Annual Maintenance
एस.ई.पी.एल. / SEPL : Phase I : U-1 1 150 01-10-17 05-10-17 5 Annual Maintenance
एस.ई.पी.एल. / SEPL : Phase I : U-2 2 150 01-09-17 15-09-17 15 Annual Maintenance
एस.ई.पी.एल. / SEPL : Phase I : U-2 2 150 01-02-18 05-02-18 5 Annual Maintenance
एस.ई.पी.एल. / SEPL : Phase II : U-1 3 150 01-07-17 15-07-17 15 Annual Maintenance
एस.ई.पी.एल. / SEPL : Phase II : U-1 3 150 01-12-17 05-12-17 5 Annual Maintenance
एस.ई.पी.एल. / SEPL : Phase II : U-2 4 150 01-06-17 15-06-17 15 Annual Maintenance
एस.ई.पी.एल. / SEPL : Phase II : U-2 4 150 01-01-18 05-01-18 5 Annual Maintenance
KTPS-1 1 60 01-11-17 15-11-17 15 AOH
KTPS-2 2 60 16-12-17 30-12-17 15 AOH
KTPS-3 3 60 01-09-17 15-09-17 15 AOH
KTPS-4 4 60 16-10-17 30-10-17 15 AOH
KTPS-5 5 120 01-11-17 15-11-17 15 AOH
KTPS-6 6 120 21-09-17 04-11-17 45 COH
KTPS-7 7 120 16-11-17 30-11-17 15 AOH
KTPS-8 8 120 01-12-17 15-12-17 15 AOH
KTPS-9 9 250 01-06-17 15-06-17 15 AOH
KTPS-11 11 500 16-06-17 30-06-17 15 AOH
KTPP Unit - 1 1 500 01-09-17 20-09-17 20 AOH
KTPP Unit - 2 2 600 01-08-17 20-08-17 20 AOH
RTS - B 1 62.5 01-11-17 15-11-17 15 AOH
Srisailam LB-1 1 150
During
April &
May, 2017
15 Annual Maintenance
Srisailam LB-2 2 150 15 Annual Maintenance
Srisailam LB-3 3 150 15 Annual Maintenance
Srisailam LB-4 4 150 15 Annual Maintenance
Srisailam LB-5 5 150 15 Annual Maintenance
Srisailam LB-6 6 150 15 Annual Maintenance
Nagarjunsagar-1 1 110
During
May &
June, 2017
15 Annual Maintenance
Nagarjunsagar-2 2 100.8 15 Annual Maintenance
Nagarjunsagar-3 3 100.8 15 Annual Maintenance
Nagarjunsagar-4 4 100.8 15 Annual Maintenance
Nagarjunsagar-5 5 100.8 15 Annual Maintenance
Nagarjunsagar-6 6 100.8 15 Annual Maintenance
Nagarjunsagar-7 7 100.8 15 Annual Maintenance

Annex-VII
(14 / 20)
Station/ System/ StateUnit
Number
Capacit
y (MW)Start Date End Date
No. of
Maintenan
ce Days
Reason
Nagarjunsagar-8 8 100.8 15 Annual Maintenance
Nagarjunsagar LH-1 1 30
During
May &
June, 2017
20 Annual Maintenance
Nagarjunsagar LH-2 2 30 20 Annual Maintenance
Priyadarsini Jurala-1 1 39
During
April, May
& June,
2017
15 Annual Maintenance
Priyadarsini Jurala-2 2 39 15 Annual Maintenance
Priyadarsini Jurala-3 3 39 15 Annual Maintenance
Priyadarsini Jurala-4 4 39 15 Annual Maintenance
Priyadarsini Jurala-5 5 39 15 Annual Maintenance
Priyadarsini Jurala-6 6 39 15 Annual Maintenance
Raichur TPS U-1 1 210 25-08-17 24-09-17 31 AOH
Raichur TPS U-2 2 210 05-06-17 13-09-17 101 R&M Works, Boiler License
Raichur TPS U-3 3 210 21-12-17 08-01-18 19 AOH, Boiler License
Raichur TPS U-4 4 210 20-11-17 20-12-17 31 Turbine, Boiler License, RLA
Raichur TPS U-5 5 210 18-10-17 02-12-17 46 MOH, RLA, Boiler License
Raichur TPS U-6 6 210 06-07-17 26-07-17 21 AOH
Raichur TPS U-7 7 210 10-01-18 28-01-18 19 AOH, Boiler License
Raichur TPS U-8 8 250 01-07-17 21-07-17 21 AOH
Bellary TPS U-1 1 500 17-09-17 07-10-17 21AOH
(exact date not furnished)
Bellary TPS U-2 2 500 18-10-17 07-11-17 21AOH
(exact date not furnished)
Sharavati-1 1 103.5 06-11-17 19-11-17 14 AOH
Sharavati-2 2 103.5 04-12-17 17-12-17 14 AOH
Sharavati-3 3 103.5 07-08-17 20-08-17 14 AOH
Sharavati-4 4 103.5 03-10-17 16-10-17 14 AOH
Sharavati-5 5 103.5 04-09-17 17-09-17 14 AOH
Sharavati-6 6 103.5 02-01-18 15-01-18 14 AOH
Sharavati-7 7 103.5 05-02-18 18-02-18 14 AOH
Sharavati-8 8 103.5 04-03-18 17-03-18 14 AOH
Sharavati-9 9 103.5 02-05-17 15-05-17 14 AOH
Sharavati-10 10 103.5 03-07-17 16-07-17 14 AOH
Linganamakki-1 1 27.5 16-06-17 30-06-17 15 AOH
Linganamakki-2 2 27.5 16-07-17 31-07-17 16 AOH
Nagjhari-1 1 150 05-01-18 25-01-18 21 AOH
Nagjhari-2 2 150 15-08-17 05-09-17 22 AOH
Nagjhari-3 3 150 05-06-17 25-06-17 21 AOH
Nagjhari-4 4 150 15-11-17 05-12-17 21 AOH
Nagjhari-5 5 150 01-10-17 20-10-17 20 AOH
Nagjhari-6 6 135 10-11-17 30-11-17 21 AOH
Supa-1 1 50 05-07-17 04-08-17 31 AOH
Supa-2 2 50 05-08-17 30-08-17 26 AOH
VUGPH-1 1 115 01-02-18 15-02-18 15 AOH
VUGPH-2 2 115 01-05-17 15-05-17 15 AOH
VUGPH-3 3 115 15-09-17 30-09-17 16 AOH
VUGPH-4 4 115 01-11-17 15-11-17 15 AOH
Kadra-1 1 50 06-11-17 25-11-17 20 AOH
Kadra-2 2 50 04-12-17 23-12-17 20 AOH
Kadra-3 3 50 01-01-18 20-01-18 20 AOH
Kodasalli-1 1 40 20-11-17 04-12-17 15 AOH
Kodasalli-2 2 40 05-12-17 20-12-17 16 AOH
Kodasalli-3 3 40 15-01-18 30-01-18 16 AOH
Gerasoppa (STR)-1 1 60 01-12-17 15-12-17 15 AOH
Gerasoppa (STR)-2 2 60 16-12-17 30-12-17 15 AOH
Gerasoppa (STR)-3 3 60 31-12-17 14-01-18 15 AOH
Gerasoppa (STR)-4 4 60 15-01-18 29-01-18 15 AOH
Alamatti-1 1 15 24-05-17 08-06-17 16 AOH
Alamatti-3 3 55 21-03-17 05-04-17 16 AOH
Alamatti-4 4 55 06-04-17 21-04-17 16 AOH
Alamatti-5 5 55 22-04-17 07-05-17 16 AOH
Alamatti-6 6 55 08-05-17 23-05-17 16 AOH
UPCL Unit - 1 1 600 15-08-17 20-09-17 37 COH
UPCL Unit - 2 2 600 01-07-17 25-07-17 25 AOH
जे.एस.डबल्य.ूई.एल / JSWEL : SBU I, U-2 2 130 26-06-17 05-07-17 10 AOH

Annex-VII
(15 / 20)
Station/ System/ StateUnit
Number
Capacit
y (MW)Start Date End Date
No. of
Maintenan
ce Days
Reason
जे.एस.डबल्य.ूई.एल / JSWEL : SBU II, U-1 3 300 02-08-17 13-08-17 12 AOH
Brahampuram-1 1 21.32 01-06-17 31-07-17 61 AMW
Brahampuram-4 4 21.32 01-06-17 30-06-17 30 Boiler maintenance
Brahampuram-5 5 21.32 01-06-17 30-06-17 30 Boiler maintenance
Kozikode-6 6 16 01-12-17 15-12-17 15 Membrane Coupling Repacement
Kozikode-8 8 16 16-12-17 31-12-17 16 Membrane Coupling Repacement
Kuttiadi-1 1 25 01-12-17 31-12-17 31 A/M
Kuttiadi-2 2 25 01-04-17 30-04-17 30 A/M
Kuttiadi-3 3 25 01-05-17 31-05-17 31 A/M
KES (Kuttiadi-4) 4 50 01-11-17 30-11-17 30 A/M
KAES-1 (Kuttiadi-5) 5 50 01-01-18 31-01-18 31 A/M
KAES-2 (Kuttiadi-6) 6 50 01-02-18 28-02-18 28 A/M
Sholayar-1 1 18 01-07-17 31-07-17 31 A/M
Sholayar-2 2 18 01-08-17 31-08-17 31 A/M
Sholayar-3 3 18 01-06-17 31-01-18 245 A/M
PLBE 1 16 01-04-17 30 A/M
Neriamangalam-1 1 17.5 01-01-18 31-01-18 31 A/M
Neriamangalam-2 2 17.5 01-04-17 30-04-17 30 A/M
Neriamangalam-3 3 17.5 01-05-17 31-05-17 31 A/M
Neriamangalam Extn. 4 25 01-02-18 28-02-18 28 A/M
Sabarigiri-1 1 55 01-10-17 31-10-17 31 A/M
Sabarigiri-2 2 55 01-12-17 31-12-17 31 A/M
Sabarigiri-3 3 55 01-09-17 30-09-17 30 A/M
Sabarigiri-4 4 55 01-06-17 30-06-17 30 A/M
Sabarigiri-5 5 55 01-01-18 31-01-18 31 A/M
Sabarigiri-6 6 60 01-11-17 30-11-17 30 A/M
Idukki-1 1 130 16-06-17 15-02-18 245 A/M
Idukki-2 2 130 16-07-17 31-08-17 47 A/M
Idukki-3 3 130 16-07-17 31-08-17 47 A/M
Idukki-4 4 130 01-10-17 31-10-17 31 A/M
Idukki-5 5 130 01-11-17 30-11-17 30 A/M
Idukki-6 6 130 01-12-17 31-12-17 31 A/M
Idamalayar-1 1 37.5 16-06-17 15-07-17 30 A/M
Idamalayar-2 2 37.5 16-10-17 15-11-17 31 A/M
Sengulam - 1 1 12 01-01-18 31-01-18 31 A/M
Sengulam - 2 2 12 01-02-18 28-02-18 28 A/M
Sengulam - 3 3 12 01-04-17 30-04-17 30 A/M
Sengulam - 4 4 12 01-05-17 31-05-17 31 A/M
Panniyar - 1 1 16 01-04-17 30-04-17 30 A/M
Panniyar - 2 2 16 01-02-18 28-02-18 28 A/M
Lower Periyar-1 1 60 01-04-17 30-04-17 30 A/M
Lower Periyar-2 2 60 01-02-18 28-02-18 28 A/M
Lower Periyar-3 3 60 01-01-18 31-01-18 31 A/M
Kakkad-1 1 25 01-02-18 28-02-18 28 A/M
Kakkad-2 2 25 01-01-18 31-01-18 31 A/M
Tuticorin-1 1 210 06-06-17 20-07-17 45 COH
Tuticorin-2 2 210 16-09-17 27-09-17 12 AOH
Tuticorin-3 3 210 22-07-17 05-08-17 15 AOH
Tuticorin-4 4 210 16-05-17 04-06-17 20 AOH
Tuticorin-5 5 210 08-08-17 27-08-17 20 AOH
Mettur-1 1 210 24-07-17 07-08-17 15 AOH
Mettur-2 2 210 08-05-17 22-05-17 15 AOH
Mettur-3 3 210 05-07-17 19-07-17 15 AOH
Mettur-4 4 210 16-08-17 29-09-17 45 COH
Mettur-5 (Stage - III) 5 600 25-05-17 23-06-17 30 AOH
North Chennai-1 (Stage - I) 1 210 24-05-17 07-06-17 15 COH
North Chennai-2 (Stage - I) 2 210 08-07-17 22-07-17 15 AOH
North Chennai-3 (Stage - I) 3 210 24-06-17 08-07-17 15 AOH
North Chennai-4 (Stage - II) 4 600 28-07-17 27-08-17 31 AOH
North Chennai-5 (Stage - II) 5 600 01-09-17 30-09-17 30 AOH
Kunda-PH 3 Unit 1 1 60 15-09-17 24-09-17 10 AOH
Kunda-PH 3 Unit 2 2 60 02-07-17 11-07-17 10 AOH
Kunda-PH 3 Unit 3 3 60 05-10-17 14-10-17 10 AOH
Kunda-PH 4 Unit 1 1 50 01-07-17 15-07-17 15 AOH
Kunda-PH 4 Unit 2 2 50 08-04-17 22-04-17 15 AOH
Kadamparai-1 1 100 01-08-17 31-08-17 31 AOH
Kadamparai-2 2 100 01-06-17 30-06-17 30 AOH
Kadamparai-3 3 100 01-07-17 31-07-17 31 AOH
Kadamparai-4 4 100 01-11-17 30-11-17 30 AOH

Annex-VII
(16 / 20)
Station/ System/ StateUnit
Number
Capacit
y (MW)Start Date End Date
No. of
Maintenan
ce Days
Reason
Aliyar 1 60 01-05-17 30-05-17 30 AOH
PUSHEP PH 1 50 25-06-17 09-07-17 15 AOH
PUSHEP PH 2 50 02-11-17 16-11-17 15 AOH
PUSHEP PH 3 50 03-02-18 17-02-18 15 AOH
Mettur Tunnel PH-1 1 50 1 AOH
Mettur Tunnel PH-2 2 50 1 AOH
Mettur Tunnel PH-3 3 50 1 AOH
Mettur Tunnel PH-4 4 50 02-04-17 21-04-17 20 AOH
Kodayar-1 1 60 10-05-17 24-05-17 15 AOH
Kovilkalapal 1 108December,
201718 Hot Gas Path Inspection
Vazhudhur - I 1 95 July, 2017 6 Combustion Inspection
Vazhudhur - II 2 92.2August,
20176 Minor Inspection
Kuttalam 1 101 May, 2017 6 Combustion Inspection
IL & FS Unit - 1 1 600 01-07-17 22-07-17 22 AOH
IL & FS Unit - 2 2 600 01-12-17 15-12-17 15 AOH
ABAN Gas (LANCO) 1 113.21 April, 2017 15 Major Inspection
Arkey Energy CCPP (Pioneer) 1 52.8 01-09-17 30 Major Overhaul
P.P. Nallur-1 1 330.5 12-03-18 15-03-18 4 GT Inspection
Neyveli STCMS-1 (TAQA) 1 250 09-12-17 29-12-17 21 AOH
RSTPS-1 (Stage - I) 1 200 03-09-17 22-09-17 20Revised O/H Schedule
Original Plan : 20/7 - 8/8
RSTPS-2 2 200 01-06-17 05-07-17 35 Overhauling
RSTPS-3 3 200 01-04-17 30-04-17 30U-3 was not in original plan
Boiler License expires 31.03.2017
RSTPS-4 4 500 22-10-17 25-11-17 35Revised O/H Schedule
Original Plan : 20/9 - 24/10
Talcher Stage II -3 3 500 01-08-17 14-09-17 45 Overhauling
Talcher Stage II -4 4 500 01-06-17 15-07-17 45 Overhauling
Simhadri-3 3 500 25-08-17 28-09-17 35 Overhauling
Simhadri-2 2 500 15-06-17 28-07-17 44 Overhauling
Kayamkulam GT-1 * 1 117 30-05-17 05-06-17 7 HRSG License Renewal
Kayamkulam STG-3 3 126 30-05-17 03-07-17 35 Gen+STG Overhaul
MTPS (KBUNL) 2 110 15.07.17 15.08.17 32 Overhauling
BTPS 6 105 01.04.17 31.05.17 61
Under S/D since 18.03.12 for R&M
work (Exp. by Mar'17, Gen. cons. from
Jun'17)
BTPS 7 105 15.07.17 31.07.17 17Under S/D since 22.08.06. Presently
under trial run. Gen. cons. full year.
PTPS 4 40 Under Maintenance since long
PTPS 6 90 Under Maintenance since long
PTPS 7 105 Under Maintenance since long
PTPS 9 110 No information received
PTPS 10 110 No information received
TVNL, Tenughat 1 210 17.07.17 31.07.17 15 Annual Overhauling/Boiler Overhauling
TVNL, Tenughat 2 210 16.06.17 30.06.17 15 Annual Overhauling/Boiler Overhauling
MTPS 1 210 01.12.17 17.12.17 17 Burner Replacement
MTPS 3 210 25.08.17 14.09.17 21 AOH (Boiler)
MTPS 4 210 01.04.17 21.04.17 21 AOH (Boiler)
MTPS 5 210 05.03.18 25.03.18 21 AOH (Boiler)
MTPS 7 500 20.05.17 04.06.17 15 Burner Replacement
MTPS 8 500 24.12.17 08.01.18 16 Burner Replacement
BTPS - B 3 210 01.11.17 21.11.17 21 AOH (Boiler)
CTPS 2 130 01.04.17 21.04.17 21 Burner Replacement
CTPS 3 130 03.08.17 18.08.17 16 Burner Replacement
CTPS 8 250 17.01.18 26.02.18 41 COH
KTPS 2 500 15.09.17 10.10.17 26 AOH (Blr, TG Brgs, LPT Gen)
DSTPS 2 500 20.07.17 14.08.17 26 AOH (Blr, TG Brgs, LPT Gen)
TTPS 1 60 23.10.17 21.11.17 30 Capital Maintenance
TTPS 2 60 10.04.17 24.04.17 15 Boiler Overhaul
TTPS 3* 60 01.09.17 15.09.17 15 Boiler Overhaul
TTPS 4 60 26.06.17 10.07.17 15 Boiler Overhaul
EASTERN REGION

Annex-VII
(17 / 20)
Station/ System/ StateUnit
Number
Capacit
y (MW)Start Date End Date
No. of
Maintenan
ce Days
Reason
TTPS 5 110 20.07.17 23.08.17 35 Boiler Overhaul + HPT + IPT
TTPS 6* 110 03.12.17 22.12.17 20 Boiler Overhaul
IB TPS 1 210 05.06.17 25.06.17 21 Minor AOH
IB TPS 2 210 01.08.17 04.09.17 35 COH
KTPS 1 210 20.10.17 26.10.17 7 Boiler License
KTPS 2 210 02.01.18 21.01.18 20 Boiler Overhauling
KTPS 3 210 25.07.17 05.02.18 196 R&M
KTPS 4 210 27.01.18 15.02.18 20 BTG Overhauling
KTPS 5 210 17.12.17 23.12.17 7 Boiler License
KTPS 6 210 01.06.17 31.07.17 61BTG+DCS+Stator Replacement+HPC
Replacement
Bakreswar TPS 1 210 22.10.17 26.11.17 36BTG+TPR+(EHG+DAVR)
Upgradation+GT OH
Bakreswar TPS 4 210 09.07.17 29.07.17 21 Boiler Overhauling
Bakreswar TPS 5 210 13.08.17 02.09.17 21 Boiler Overhauling
Bandel TPS 2 60 01.11.17 28.02.18 120Capital Overhauling & Departmental
R&M
Bandel TPS 3 60 01.03.17 30.06.17 122Capital Overhauling & Departmental
R&M
Bandel TPS 4 60 01.07.17 31.10.17 123Capital Overhauling & Departmental
R&M
Bandel TPS 5** 210 01.12.17 30.12.17 30 Boiler Overhauling
Santaldih TPS 5 250 01.08.17 25.08.17 25 Boiler + LTP + Generator OH
Santaldih TPS 6 250 01.09.17 07.09.17 7 Boiler License
Sagarighi TPS 1 300 01.11.17 06.11.17 6 Boiler License
Sagarighi TPS 2 300 01.12.17 05.01.18 36 Capital Overhauling
BUDGE-BUDGE 1 250 19.12.17 08.01.18 21 Not Specified
BUDGE-BUDGE 2 250 12.12.17 18.12.17 7 Not Specified
BUDGE-BUDGE 3 250 18.11.17 24.11.17 7 Not Specified
TITAGARH 1 60 05.12.17 08.12.17 4 Not Specified
TITAGARH 2 60 18.01.18 01.02.18 15 Not Specified
TITAGARH 3 60 13.12.17 03.01.18 22 Not Specified
TITAGARH 4 60 15.11.17 18.11.17 4 Not Specified
SOUTHERN 1 67.5 21.11.17 05.12.17 15 Not Specified
SOUTHERN 2 67.5 11.01.18 14.01.18 4 Not Specified
HALDIA 1 300 17.01.17 31.01.17 15 Not Specified
HALDIA 2 300 No planned maintenance
DPPS 6 110 Under Maintenance since long
DPPS 7 300 15.12.17 31.12.17 17 Boiler License Renewal
DPPS 8 250 01.11.17 15.11.17 15 Boiler License Renewal
FSTPS 1 200 01.05.17 04.06.17 35 Boiler, Turbine, Gen., ESP R&M
FSTPS 3 200 01.07.17 04.08.17 35 Boiler, ESP R&M
FSTPS 4*** 500 01.10.17 04.11.17 35 Boiler, Turbine, Gen.
FSTPS 5 500 10.03.17 13.04.17 35 Boiler, Turbine, DDCMIS R&M
FSTPS 6*** 500 21.11.17 25.12.17 35 Boiler, Turbine
KhSTPS 1 210 01.06.17 05.07.17 35 Boiler, Gen., DDCMIS R&M
KhSTPS 2 210 03.02.18 27.02.18 25 Boiler, DAVR
KhSTPS 4 210 01.11.17 05.12.17 35 Boiler, Turbine, Gen., DDCMIS R&M
KhSTPS 6 500 13.07.17 16.08.17 35 Boiler, Turbine, Gen.
Barh 5 660 16.08.17 14.09.17 30 Boiler
TSTPS 1 500 21.10.17 14.11.17 25 Boiler+LPT+Gen.+CT Cell R&M
TSTPS 3 500 01.08.17 14.09.17 45Boiler Mod.+Capital+Gen.+ESP
R&M+Boiler RLA
TSTPS 4 500 01.06.17 15.07.17 45Boiler Mod.+LPT+Gen.+ESP
R&M+Boiler RLA
GMR 1 350 No information Received
GMR 2 350 01.11.17 25.11.17 25 Boiler Overhauling
GMR 3 350 No information received
JITPL 1 600 No information received
JITPL 2 600 No information received
MPL 1 525 14.08.17 14.09.17 32 Not Specified
APNRL 1 270 No planned maintenance
APNRL 2 270 No Planned Maintenance
* OPTCL proposed to swap the dates of maintenance between Unit # 3 & 6 but NTPC did not agree immediately and informed that they
will do the needful if situation permits as well as demand so. Subsequently, it would be finalised in OCC.
** WBSLDC did not agree for S/D of Bandel Unit#5 during Sep'17 as proposed and requested to shift it to Dec'17. WBPDCL assured to
check from their side and confirm it later. They will discuss bilaterally & finalize and would be approved in OCC.

Annex-VII
(18 / 20)
Station/ System/ StateUnit
Number
Capacit
y (MW)Start Date End Date
No. of
Maintenan
ce Days
Reason
NHPC
Loktak Unit 1 35 01-12-17 20-12-17 20 ANNUAL PLANNED MAINTENANCE
Loktak Unit 2 35 26-12-17 14-01-18 20 ANNUAL PLANNED MAINTENANCE
Loktak Unit 3 35 20-01-18 08-02-18 20 ANNUAL PLANNED MAINTENANCE
NTPC
BgTPP Unit 1 250 01-07-17 25-07-17 25 ANNUAL PLANNED MAINTENANCE
NEEPCO
AGBP GTG 3 33.5 01-04-17 05-05-17 35 MAJOR INSPECTION
AGBP GTG 4 33.5 15-10-17 09-11-17 25 TURBINE INSPECTION
AGBP GTG 5 33.5 15-07-17 09-08-17 25 HOT GAS PATH INSPECTION
AGBP STG 1 30 01-07-17 07-07-17 7
MAINTENANCE OF VALVE,
ELECTRICAL DRIVE & SYSTEM
INCLUDING SYSTEM C&I
AGBP STG 2 30 21-04-17 27-04-17 7
MAINTENANCE OF VALVE,
ELECTRICAL DRIVE & SYSTEM
INCLUDING SYSTEM C&I
AGBP STG 3 30 21-07-17 27-07-17 7
MAINTENANCE OF VALVE,
ELECTRICAL DRIVE & SYSTEM
INCLUDING SYSTEM C&I
AGTCCPP GTG 1 21 01-11-17 02-11-17 2 CI & BI
AGTCCPP 01-08-17 10-08-17 10 AVR REPLACEMENT
AGTCCPP GTG 2 21 03-11-17 04-11-17 2 CI & BI
AGTCCPP 20-08-17 30-08-17 10 AVR REPLACEMENT
AGTCCPP 26-10-17 30-10-17 4 BREAKER REPLACEMENT
AGTCCPP GTG 3 21 01-11-17 25-11-17 25REPLACEMENT OF MARK V CONTROL
SYSTEM
AGTCCPP 01-06-17 10-06-17 10 AVR REPLACEMENT
AGTCCPP GTG 4 21 01-05-17 25-05-17 25REPLACEMENT OF MARK V CONTROL
SYSTEM
AGTCCPP 20-06-17 30-06-17 10 AVR REPLACEMENT
AGTCCPP 15-12-17 19-12-17 4 TRANSFORMER REPLACEMENT
AGTCCPP STG 1 25.5 01-10-17 06-10-17 6 HYDROTEST FOR BOILER
AGTCCPP STG 2 25.5 01-05-17 06-05-17 6 HYDROTEST FOR BOILER
KOPILI I UNIT 1 50 01-03-18 20-03-18 21 ANNUAL PLANNED MAINTENANCE
KOPILI I UNIT 2 50 01-02-18 20-02-18 21 ANNUAL PLANNED MAINTENANCE
KOPILI I UNIT 3 50 02-01-18 20-01-18 19 ANNUAL PLANNED MAINTENANCE
KOPILI I UNIT 4 50 01-12-17 10-12-17 21 ANNUAL PLANNED MAINTENANCE
KOPILI IIKOPILI
II25 20-01-18 19-02-18 31
APM & UNDERWATER PART
REPAIRING
KHANDONG UNIT 1 25 01-11-17 30-11-17 30APM & UNDERWATER PART
REPAIRING
KHANDONG UNIT 2 25 10-12-17 09-01-18 31APM & UNDERWATER PART
REPAIRING
DOYANG UNIT 1 25 10-11-17 09-12-17 25 ANNUAL PLANNED MAINTENANCE
DOYANG UNIT 2 25 17-01-18 15-02-18 25 ANNUAL PLANNED MAINTENANCE
DOYANG UNIT 3 25 01-03-18 30-03-18 25 ANNUAL PLANNED MAINTENANCE
RANGANADI UNIT 1 135 01-12-17 21-12-17 21 ANNUAL PLANNED MAINTENANCE
RANGANADI UNIT 2 135 01-03-18 21-03-18 21 ANNUAL PLANNED MAINTENANCE
RANGANADI UNIT 3 135 01-02-18 21-02-18 21 ANNUAL PLANNED MAINTENANCE
OTPC
PALATANA Unit 1 363.3 26-08-17 18-09-17 25 ANNUAL PLANNED MAINTENANCE
PALATANA UNIT 2 363.3 26-08-17 02-09-17 7 ANNUAL PLANNED MAINTENANCE
ASSAM
KLHEP UNIT 1 50 10-02-18 31-03-18 50 MAJOR OVERHAULING
KLHEP UNIT 2 50 17-01-18 05-02-18 20 ANNUAL PLANNED MAINTENANCE
LTPS UNIT 2 15 01-07-17 02-07-17 2 AIR FILTER CLEANING
LTPS 01-10-17 10-10-17 10 ANNUAL PLANNED MAINTENANCE
LTPS 01-03-18 02-03-18 2 AIR FILTER CLEANING
LTPS UNIT 3 15 01-05-17 10-05-17 10 ANNUAL PLANNED MAINTENANCE
LTPS 01-11-17 30-11-17 30 MAJOR OVERHAULING
LTPS 01-03-18 02-03-18 2 AIR FILTER CLEANING
LTPS UNIT 4 15 01-05-17 02-05-17 2 AIR FILTER CLEANING
LTPS 01-08-17 10-08-17 10 ANNUAL PLANNED MAINTENANCE
LTPS 01-01-18 02-01-18 2 AIR FILTER CLEANING
*** Though FSTPS Unit#4 was proposed for S/D during Aug-Sep'17 by NTPC, after discussion it was decided to shift the same after Durga
Puja. Accordingly, their Unit#6 would also be shifted to Nov-Dec'17 after a gap of at least 7 days return of Unit#4.
NORTH-EASTERN REGION

Annex-VII
(19 / 20)
Station/ System/ StateUnit
Number
Capacit
y (MW)Start Date End Date
No. of
Maintenan
ce Days
Reason
LTPS UNIT 5 20 01-07-17 02-07-17 2 AIR FILTER CLEANING
LTPS 01-02-18 10-02-18 10 ANNUAL PLANNED MAINTENANCE
LTPS UNIT 6 20 01-04-17 10-04-17 10 ANNUAL PLANNED MAINTENANCE
LTPS 01-10-17 02-10-17 2 AIR FILTER CLEANING
LTPS 01-02-18 10-02-18 10 ANNUAL PLANNED MAINTENANCE
LTPS UNIT 7 20 01-07-17 02-07-17 2 AIR FILTER CLEANING
LTPS 01-02-18 10-02-18 10 ANNUAL PLANNED MAINTENANCE
LTPS UNIT 8 32.2 01-09-17 05-09-17 5 RAW WATER RESERVOIR CLEANING
LTPS 01-02-18 10-02-18 10 MINOR INSPECTION
NTPS UNIT 1 20 01-04-17 02-04-17 2 ANNUAL PLANNED MAINTENANCE
NTPS 01-07-17 02-07-17 2 ANNUAL PLANNED MAINTENANCE
NTPS 01-10-17 02-10-17 2 ANNUAL PLANNED MAINTENANCE
NTPS 01-02-18 01-02-18 2 ANNUAL PLANNED MAINTENANCE
NTPS UNIT 2 21 01-05-17 02-05-17 2 ANNUAL PLANNED MAINTENANCE
NTPS 01-08-17 02-08-17 2 ANNUAL PLANNED MAINTENANCE
NTPS 01-11-17 02-11-17 2 ANNUAL PLANNED MAINTENANCE
NTPS 01-02-18 02-02-18 2 ANNUAL PLANNED MAINTENANCE
NTPS UNIT 3 21 01-04-17 02-04-17 2 ANNUAL PLANNED MAINTENANCE
NTPS 01-07-17 02-07-17 2 ANNUAL PLANNED MAINTENANCE
NTPS 01-10-17 02-10-17 2 ANNUAL PLANNED MAINTENANCE
NTPS 01-01-18 02-01-18 2 ANNUAL PLANNED MAINTENANCE
NTPS UNIT 4 11 01-05-17 01-05-17 1 ANNUAL PLANNED MAINTENANCE
NTPS 01-07-17 01-07-17 1 ANNUAL PLANNED MAINTENANCE
NTPS 01-09-17 01-09-17 1 ANNUAL PLANNED MAINTENANCE
NTPS 01-11-17 01-11-17 1 ANNUAL PLANNED MAINTENANCE
NTPS 01-01-18 01-01-18 1 ANNUAL PLANNED MAINTENANCE
NTPS 01-03-18 01-03-18 1 ANNUAL PLANNED MAINTENANCE
NTPS UNIT 5 24 01-06-17 03-06-17 3 ANNUAL PLANNED MAINTENANCE
NTPS 01-09-17 10-09-17 10 ABI, CC, CCTB
NTPS 01-12-17 03-12-17 3 ANNUAL PLANNED MAINTENANCE
NTPS 01-03-18 03-03-18 3 ANNUAL PLANNED MAINTENANCE
NTPS UNIT 6 22 01-05-17 03-05-17 3 ANNUAL PLANNED MAINTENANCE
NTPS 01-07-17 10-07-17 10 ABI, CC, CCTB
NTPS 01-12-17 19-01-18 50 MAJOR OVERHAULING
MEGHALAYA
SONAPANI UNIT 1 1.5 01-04-17 06-04-17 6 ANNUAL PLANNED MAINTENANCE
STAGE I POWER SUMER UNIT 1 9 01-05-17 15-05-17 15 ANNUAL PLANNED MAINTENANCE
STAGE I POWER SUMER UNIT 2 9 01-06-17 15-06-17 15 ANNUAL PLANNED MAINTENANCE
STAGE I POWER SUMER UNIT 3 9 01-01-18 15-01-18 15 ANNUAL PLANNED MAINTENANCE
STAGE I POWER SUMER UNIT 4 9 01-03-18 15-03-18 15 ANNUAL PLANNED MAINTENANCE
STAGE II POWER UMSUMER UNIT 1 10 01-06-17 15-06-17 15 ANNUAL PLANNED MAINTENANCE
STAGE II POWER UMSUMER UNIT 2 10 01-03-18 15-03-18 15 ANNUAL PLANNED MAINTENANCE
STAGE III POWER KYRDEMKULAI UNIT 1 30 01-05-17 02-05-17 2 ANNUAL PLANNED MAINTENANCE
STAGE III POWER KYRDEMKULAI 01-11-17 02-11-17 2 ANNUAL PLANNED MAINTENANCE
STAGE III POWER KYRDEMKULAI UNIT 2 30 01-05-17 02-05-17 2 ANNUAL PLANNED MAINTENANCE
STAGE III POWER KYRDEMKULAI 01-11-17 02-11-17 2 ANNUAL PLANNED MAINTENANCE
STAGE IV, NONGKHYLLEM UNIT 1 30 01-05-17 02-05-17 2 PRE-MONSOON MAINTENANCE
STAGE IV, NONGKHYLLEM 01-12-17 15-12-17 15 INSTALLATION OF SOME AUXILIARIES
STAGE IV, NONGKHYLLEM 01-02-18 02-02-18 2 ANNUAL MAINTENANCE WORK
STAGE IV, NONGKHYLLEM UNIT 2 30 01-04-17 30-04-17 30 OVERHAULING
STAGE IV, NONGKHYLLEM 01-05-17 30-05-17 30 OVERHAULING
STAGE IV, NONGKHYLLEM 01-12-17 15-12-17 15 INSTALLATION OF SOME AUXILIARIES
STAGE IV, NONGKHYLLEM 01-02-18 02-02-18 2 ANNUAL MAINTENANCE WORK
UMTRU POWER STATION UNIT 1 2.8 01-05-17 02-05-17 2 ANNUAL PLANNED MAINTENANCE
UMTRU POWER STATION 01-11-17 02-11-17 2 ANNUAL PLANNED MAINTENANCE
UMTRU POWER STATION UNIT 2 2.8 01-05-17 02-05-17 2 ANNUAL PLANNED MAINTENANCE
UMTRU POWER STATION 01-11-17 02-11-17 2 ANNUAL PLANNED MAINTENANCE
UMTRU POWER STATION UNIT 3 2.8 01-05-17 02-05-17 2 ANNUAL PLANNED MAINTENANCE
UMTRU POWER STATION 01-11-17 02-11-17 2 ANNUAL PLANNED MAINTENANCE
UMTRU POWER STATION UNIT 4 2.8 01-05-17 02-05-17 2 ANNUAL PLANNED MAINTENANCE
UMTRU POWER STATION 01-11-17 02-11-17 2 ANNUAL PLANNED MAINTENANCE
MLHELP UNIT 1 42 01-04-17 10-05-17 40 Annual planned maintenance
MLHELP UNIT 2 42 11-05-17 20-06-17 40 Annual planned maintenance
MLHELP UNIT 3 42 20-02-18 31-03-18 40 Annual planned maintenance
NAGALAND
LIKIMRO UNIT 1 8 01-04-17 10-04-17 10 ANNUAL PLANNED MAINTENANCE
LIKIMRO UNIT 2 8 11-04-17 20-04-17 10 ANNUAL PLANNED MAINTENANCE
LIKIMRO UNIT 3 8 21-04-17 30-04-17 10 ANNUAL PLANNED MAINTENANCE
TRIPURA

Annex-VII
(20 / 20)
Station/ System/ StateUnit
Number
Capacit
y (MW)Start Date End Date
No. of
Maintenan
ce Days
Reason
ROKHIA UNIT 1 21 01-01-18 07-01-18 7 CI & BI
ROKHIA UNIT 2 21 01-12-17 07-12-17 7 CI & BI
ROKHIA UNIT 3 21 01-04-17 07-04-17 7 CI & BI
BARAMURA UNIT 1 21 01-07-17 7-17-17 7 CI & BI
BARAMURA UNIT 2 21 01-06-17 30-06-17 30 MAJOR INSPECTION
GUMTI UNIT 1 5 OUT OF BUS
GUMTI UNIT 2 5 01-04-17 10-04-17 10 ANNUAL PLANNED MAINTENANCE
GUMTI UNIT 3 5 01-05-17 10-05-17 10 ANNUAL PLANNED MAINTENANCE
AMP: Annual Maintenance Plan PG/Test: Performance Guarantee Test
AMW: Annual Maintenance Work R&M: Renovation and Modernization
AOH: Annual Overhaul RLA: Residual Life Assessment
BSD: Boiler Shutdown Static VR: Static Voltage Regulator/ Restorer
BTG: Boiler Turbine Generator
CI: Combustion Inspection
CI/BI: Combustion Inspection/ Borescope Inspection
Abbreviations used in respect of reasons for outage:
HRSG: Heat Recovery Steam Generator
HGPI: Hot Gas Path Inspection
HPT: High Pressure Turbine
MI: Major Inspection
IBR: Indian Boiler Regulations
IPT: Intermediate Pressure Turbine
LPT: Low Pressure Turbine

Annex-VIII
(1 / 2)
Scheme Implementing AgencyUnit
No. State
Capacity
(MW)
Commissioning
Schedule
Bongaigaon TPP NTPC 3 C 250 Dec-17
Nabi Nagar TPP JV of NTPC &Rly 2 C 250 Apr-17
New Nabi Nagar TPP JV of NTPC & BSPGCL 1 C 660 Aug-17
Kudgi STPP Ph-I NTPC 3 C 800 Aug-17
Solapur STPP NTPC 1 C 660 Apr-17
Meja STPP JV of NTPC & UPRVUNL 1 C 660 Oct-17
Lara TPP NTPC 1 C 800 Oct-17
Gadarwara STPP,St-I NTPC 1 C 800 Jan-18
Rayal seema TPP APGENCO 6 S 600 Aug-17
Shree Singaji TPP, St-II MPPGCL 3 S 660 Dec-17
Suratgarh TPS RRVUNL 7 S 660 Nov-17
Chhabra SCTPP RRVUNL 5 S 660 Apr-17
Chhabra SCTPP RRVUNL 6 S 660 Jan-18
Bhadradri TPP T.Genco 1 S 270 Mar-18
Namrup APGCL ST P 36.15 Feb-18
Akaltara (Naiyara) TPPKSK Mahandi Power Company
Ltd3 P 600 Nov-17
Binjkote TPPSKS Power Generation (
Chhattisgarh) Ltd1 P 300 May-17
Nawapara TPP TRN Energy 2 P 300 May-17
Lanco Amarkantak
TPS-IILAP Pvt. Ltd. 3 P 660 Nov-17
Nasik TPP Ph-I RattanIndia Nasik Power Ltd 3 P 270 May-17
Bara TPPPrayagraj Power Generation
Co.Ltd.3 P 660 Aug-17
India Power TPP (
Haldia), Indian Energy Ltd ( Haldia) 1 P 150 Apr-17
Tuirial NEEPCO 1 Mizoram 30 Oct-17
Tuirial NEEPCO 2 Mizoram 30 Nov-17
Kishanganga NHPC 1Jammu &
Kashmir110 Jan-18
Kishanganga NHPC 2Jammu &
Kashmir110 Feb-18
4,880 MW
1,100 MW
3,510 MW
Generating Schemes Expected to be commissioned during 2017-18
THERMAL
CENTRAL SECTOR
TOTAL THERMAL (CENTRAL + STATE + PRIVATE)
HYDRO
CENTRAL SECTOR
PRIVATE SECTOR
STATE SECTOR
11,366 MW
2,976 MW

Annex-VIII
(2 / 2)
Scheme Implementing AgencyUnit
No. State
Capacity
(MW)
Commissioning
Schedule
Generating Schemes Expected to be commissioned during 2017-18
Kishanganga NHPC 3Jammu &
Kashmir110 Mar-18
Kameng NEEPCO 1Arunachal
Pradesh150 Jan-18
Kameng NEEPCO 2Arunachal
Pradesh150 Feb-18
Kameng NEEPCO 3Arunachal
Pradesh150 Feb-18
Kameng NEEPCO 4Arunachal
Pradesh150 Mar-18
Pare NEEPCO 1Arunachal
Pradesh55 Jan-18
Pare NEEPCO 2Arunachal
Pradesh55 Feb-18
Uhl-III Beas Valley Power Corp. Ltd.
(BVPC)1
Himachal
Pradesh33.33 Jan-18
Uhl-III Beas Valley Power Corp. Ltd.
(BVPC)2
Himachal
Pradesh33.33 Feb-18
Uhl-III Beas Valley Power Corp. Ltd.
(BVPC)3
Himachal
Pradesh33.33 Mar-18
Sainj HPPCL 1Himachal
Pradesh50 May-17
Sainj HPPCL 2Himachal
Pradesh50 Jun-17
Pulichintala TSGENCO 2 Telengana 30 Oct-17
Pulichintala TSGENCO 3 Telengana 30 Oct-17
Pulichintala TSGENCO 4 Telengana 30 Nov-17
New Umtru MePGCL 1 Meghalaya 20 Apr-17
New Umtru MePGCL 2 Meghalaya 20 Jul-17
Chanju-I IA Energy 3Himachal
Pradesh12 May-17
Tashiding Shiga Energy Pvt. Ltd. 1 Sikkim 48.5 Jul-17
Tashiding Shiga Energy Pvt. Ltd. 2 Sikkim 48.5 Aug-17
Bhavini PFBR 1 Tamil Nadu 500 October'17
PRIVATE SECTOR
TOTAL NUCLEAR 500 MW
330 MW
109 MW
1,539 MW
TOTAL (THERMAL + HYDRO + NUCLEAR)
TOTAL HYDRO (CENTRAL + STATE + PRIVATE)
NUCLEAR
13,405 MW
STATE SECTOR

(All Figures in MW) (As on 31-03-2017)
To
tal
Sp
eci
fic
All
oca
tio
ns
Qu
an
tum
fo
r P
oo
lin
g
incl
ud
ing
u
na
llo
cate
d
fro
m o
the
r re
gio
ns
No
t in
co
mm
on
Po
ol
Northern 24,467 21,959 2,508 928 1261 319 0 Note (1)
Western 19,083 17,062 2,022 559 1,463 0 0
Southern 15,705 13,831 1,874 170 1704 0 0
Eastern 14,190 13,230 960 120 840 0 75
North-Eastern 2,410 2,016 394 5 389 0 0
Bangladesh 250 0 250 250 0 0 0
Total 76,105 68,098 8,007 2,032 5656 319 75
Non-DoCO Capacity (###)
4,425
Grand Total 80,530 *
(#) This is total share allocated to constituents of the Region from Central Generating Stations of that region or other regions.
(# #) includes dedicated stations , non-firm power and merchant power.
Notes :
Central Sector Generation - Firm and Unallocated Share
Region
All
oca
ted
Ca
pa
city
(#
)
Fir
m S
ha
re (
# #
) Unallocated Share
Me
rch
an
t P
ow
er
(in
clu
de
d i
n F
irm
sh
are
)
Remarks
(*): Includes 1350 MW from Bhutan
(# # #) Capacity commissioned but yet to be declared under commercial operation includes 15 MW each of 3 units of Nimmo Bazgo, 195 MW of Muzaffpur TPS (Unit-3), 600 MW
of Raghunathpur, Ph-I,40 MW of Teesta Low Dam Unit 2, 500 MW of Bokaro-A(DVC Project), and 35 MW of Monarchak CCGT (ST), 500 MW of Unchahar-III TPS (Unit-7), 195 MW
of Muzaffpur TPS (Unit-4), 800 MW of Kudgi STPP (Unit-1), 800 MW of Kudgi STPP (Unit-2), 250 MW of Bongaigaon Thermal PP (Unit 2), 660 MW of Mauda STPS-II (Unit-4)
1) Allocated Capacity includes 440 MW non-firm power of RAPP 3 and 4, Out of this, 374 MW (=440-66 MW unallocated power ) non-firm share of RAPP 3 and 4 is considered
as firm power . "Not in common pool" includes unallocated power of RAPP 3 and 4 (66 MW), 153 MW unallocated power from Tala HEP and 100 MW diverted power to J&K from
Unallocated power of Central Generating Stations of Western Region.
Changes During the Month :
1. CoD of Kudankulam NPP U# 2w.e.f. 31.03.2017 2.
Information for commissioning of 6 units was obtained: a. 500 MW of Unchahar-III TPS (Unit-7), b.195 MW of Muzaffpur TPS (Unit-4), c.800 MW of Kudgi STPP (Unit-
1), d.800 MW of Kudgi STPP (Unit-2), e.250 MW of Bongaigaon Thermal PP (Unit 2), f.660 MW of Mauda STPS-II (Unit-2)
Annexure-IX (Page 1 of 7)

MW MW % MW % MW % MW % MW % MW % MW % MW % MW % MW % MW % MW
A. FIRM SHARE
A1. NR CGSs
Singrauli STPS 2000 1700 0.0 0 7.5 150 10.0 200 0.0 0 0.0 0 10.0 200 15.0 300 37.7 754 4.8 96 0.0 0.0
Rihand STPS 1000 850 1.0 10 10.0 100 6.5 65 3.5 35 7.0 70 11.0 110 9.5 95 32.6 326 3.9 39 0.0 0.0
Rihand STPS Stg. - II 1000 850 0.8 8 12.6 126 5.7 57 3.3 33 9.4 94 10.2 102 10.0 100 29.6 296 3.4 34 0.0 0.0
Rihand STPS Stg. - III (Unit 5&6) 1000 850 0.5 5 13.2 132 5.6 56 3.4 34 6.6 66 8.3 83 11.5 115 32.0 320 3.9 39 0.0 0.0
Unchahar - I TPS 420 400 0.5 2 5.7 24 2.6 11 1.7 7 3.3 14 8.6 36 4.8 20 59.5 250 8.6 36 0.0 0.0
Unchahar - II TPS 420 357 0.7 3 11.2 47 5.5 23 2.9 12 7.1 30 14.3 60 9.1 38 30.7 129 3.6 15 0.0 0.0
Unchahar - III TPS (Unit 5) 210 179 0.5 1 13.8 29 5.7 12 3.8 8 6.2 13 8.1 17 11.0 23 30.0 63 6.2 13 0.0 0.0
Dadri NCTPS 840 840 0.0 0 90.0 756 0.0 0 0.0 0 0.0 0 0.0 0 0.0 0 10.0 84 0.0 0 0.0 0.0 0.0 0
Dadri NCTPS Stage-II 980 833 0.0 0 74.5 730 0.0 0 0.0 0 0.0 0 0.0 0 0.0 0 10.0 98 0.0 0 0.5 5 0.0 0
Dadri NCGPS 830 701 0.6 5 11.0 91 4.9 41 3.0 25 6.8 56 15.9 132 9.3 77 29.6 246 3.4 28 0.0 0.0
Anta GPS 419 356 1.2 5 10.5 44 5.7 24 3.6 15 6.9 29 11.7 49 19.8 83 21.8 91 3.8 16 0.0 0.0
Auraiya GPS 663 564 0.8 5 10.9 72 5.9 39 3.3 22 6.6 44 12.5 83 9.2 61 32.1 213 3.8 25 0.0 0.0
Indira Gandhi STPS (Jhajjar) (Unit 1,2&3) 1500 1386 0.0 0 46.2 693 46.2 693 0.0 0 0.0 0 0.0 0 0.0 0 0.0 0 0.0 0 0.0 0.0 0.0 0
Narora Atomic Power Station(NAPS) 440 376 1.1 5 10.7 47 6.4 28 3.2 14 7.5 33 11.6 51 10.0 44 31.3 138 3.7 16 0.0 0.0
Rajasthan Atomic Power Plant(RAPP U-5 & 6)
440 333 0.7 3 12.7 56 5.7 25 3.4 15 0.0 0 10.2 45 20.0 88 19.6 86 3.4 15 0.0 0.0
Salal HPS 690 690 0.3 2 11.6 80 15.0 104 1.0 7 34.4 237 26.6 184 3.0 20 7.0 48 1.2 8 0.0 0.0
Chamera HPS- I 540 540 3.9 21 7.9 43 15.8 85 14.9 81 3.9 21 10.2 55 19.6 106 20.3 109 3.5 19 0.0 0.0
Chamera HPS- II 300 246 0.7 2 13.3 40 5.7 17 15.7 47 6.3 19 10.0 30 9.7 29 20.7 62 0.0 0 0.0 0.0
Chamera HPS- III 231 196 0.6 1 12.7 29 8.7 20 13.0 30 6.9 16 7.9 18 10.9 25 20.1 47 4.1 9 0.0 0.0
Tanakpur HPS 94 94 1.3 1 12.8 12 6.4 6 3.8 4 7.7 7 17.9 17 11.5 11 22.6 21 15.9 15 0.0 0.0
Bairasiul HPS 180 180 0.0 0 11.0 20 30.5 55 12.0 21 0.0 0 46.5 84 0.0 0 0.0 0 0.0 0 0.0 0.0
Uri-I HPS 480 480 0.6 3 11.0 53 5.4 26 2.7 13 34.0 163 13.8 66 9.0 43 20.1 96 3.5 17 0.0 0.0
Uri-II HPS ( unit 1,2 ,3&4) 240 204 0.6 2 13.5 32 6 13 0 0 20 49 8 20 11 27 21 51 4 10 0.0 0.0
Dhauliganga HEP 280 238 0.7 2 13.2 37 5.7 16 3.6 10 6.1 17 10.0 28 9.7 27 20.0 56 16.1 45 0.0 0.0
Nathpa Jhakri HPS $ 1500 1351 0.5 8 9.5 142 4.3 64 36.5 547 7.0 105 10.1 152 7.5 112 14.7 221 0.0 0 0.0 0.0
Dulhasti HEP 390 332 0.5 2 12.8 50 6 21 0 0 21 82 8 32 11 42 22 85 4 16 0.0 0.0
Tehri Stage - I (4 Units)## 1000 901 4.6 46 6.3 63 7.1 71 0.0 0 4.8 48 7.7 77 7.5 75 37.4 374 14.7 147 0.0 0.0
Sewa - II HEP (3 units) 120 102 0.8 1 13.3 16 5.8 7 0.0 0 19.2 23 8.3 10 10.8 13 22.5 27 4.2 5 0.0 0.0
Koteshwar HEPS (Unit 1,2,3 & 4) 400 360 0.4 1 9.9 39 4.2 17 0.0 0 4.5 18 6.4 25 8.4 33 38.8 155 17.7 71 0.0 0.0
Parbati-III HEP(Unit-1,2,3,4) 520 442 0.6 3 12.7 66 8.7 45 13.0 68 6.9 36 7.9 41 10.9 57 20.1 105 4.1 21 0.0 0.0
Rampur HEP (Unit#1,2,3,4,5,6) 412 374 0.0 0 0.0 0 4.2 17 41.9 173 7.1 29 5.6 23 7.7 32 13.8 57 10.6 44 0.0 0.0
Koldam HEP (800 MW) 800 744 0.8 6 0.0 0 9.8 78 28.0 224 11.1 89 7.7 62 10.7 86 18.9 151 6.0 48 0.0 0.0
Sub-Total A1 (NR CGSs) 20339 18050 154 3821 1938 1444 1408 1892 1783 4758 848 5 0
A2. CGSs of other regions
Farakka STPS (1600 MW) 1600 113 0.0 0 1.4 22 0.7 11 0.0 0 0.9 14 1.4 22 0.7 11 2.1 33 0.0 0 0.0 0.0
Kahalgaon - I (840 MW) 840 262 0.0 0 6.1 51 3.0 26 0.0 0 3.7 31 6.1 51 3.0 26 9.1 77 0.0 0 0.0 0.0
Mezia unit 6 (250 MW) 250 150 0.0 0 19.6 29 9.8 15 0.0 0 11.8 18 19.6 29 9.8 15 29.4 44 0.0 0 0.0 0.0
Kahalgaon - II (1500 MW) [498 MW firm+ 343 MW in lieu of Tala]
1500 840 0.2 2 10.5 157 4.6 69 1.5 23 5.6 83 8.0 120 7.1 107 16.7 251 1.9 28 0.0 0.0
Sub-Total A2 (CGSs other regions) 4190 1365 2 259 121 23 146 222 159 405 28 0 0
Sub-Total (A) 24529 19415 156 4080 2059 1467 1554 2114 1942 5163 876 5 0
B. NON-FIRM ALLOCATION
Rajasthan Atomic Power Station U-3 & 4 440 374 0 0 0 0 10.9 48 0 0 7.95 35 22.7 100 28.4 125 15 66 0 0 0 0 0
C. DEDICATED STATIONS
Badarpur TPS 705 100 705
Tanda TPS 440 100 440
Faridabad CCGT 431 100 431
Rajasthan Atomic Power Station (RAPS U-1 & 2)
300 100 300
Chutak(H) 4*11 44 100 44
Barsingsar Lignite(T) 2*125 250 100 250
Sub-Total (C) 2170 0 705 431 0 44 0 550 440 0 0 0
D. TOTAL ALLOCATION [=A+B+C] 21959 156 4785 2538 1467 1633 2214 2617 5669 876 5 0
E. TOTAL UNALLOCATED POWER OF NRCGSs EXCLUDING RAPS 3 & 4
2289
E1. Specific allocation to other regions/countries from E above
100 @ 100
E2. Balance Unallocated Power of NR CGSs excluding RAPs 3 & 4 [=E-E1]
2189
E2.1. Specific Allocations from E2 above
To Power Grid (HVDC) $ 4 4
To Railways $$ 100
To J&K** 77 77
For bundling with Solar power (under JNNSM)%
447 15 37 310 85
To UP (due to drought) 300 300
Sub-Total (E2.1) 928 0 0 0 15 77 37 310 385 0
PO
WE
R
GR
ID
ALLOCATION OF POWER FROM CENTRAL GENERATING STATIONS TO NORTHERN REGION(As on 31-03-2017)
ST
AT
ION
S
INS
TA
LL
ED
C
AP
AC
ITY
#A
LL
OC
AT
ED
C
AP
AC
ITY
Within the region
OT
HE
R
RE
GIO
N/
C
OU
NT
RY
CH
AN
DIG
AR
H
DE
LH
I
HA
RY
AN
A
HIM
AC
HA
L
PR
AD
ES
H
JAM
MU
&
KA
SH
MIR
PU
NJA
B
RA
JAS
TH
AN
UT
TA
R
PR
AD
ES
H
UT
TA
RA
KH
AN
D
øø
Annexure-IX (Page 2 of 7)

MW MW % MW % MW % MW % MW % MW % MW % MW % MW % MW % MW % MW
PO
WE
R
GR
ID
ALLOCATION OF POWER FROM CENTRAL GENERATING STATIONS TO NORTHERN REGION(As on 31-03-2017)
ST
AT
ION
S
INS
TA
LL
ED
C
AP
AC
ITY
#A
LL
OC
AT
ED
C
AP
AC
ITY
Within the region
OT
HE
R
RE
GIO
N/
C
OU
NT
RY
CH
AN
DIG
AR
H
DE
LH
I
HA
RY
AN
A
HIM
AC
HA
L
PR
AD
ES
H
JAM
MU
&
KA
SH
MIR
PU
NJA
B
RA
JAS
TH
AN
UT
TA
R
PR
AD
ES
H
UT
TA
RA
KH
AN
D
E2.2. Balance Unallocated Power of NR CGSs in the pool excluding RAPS 3&4 [=E2-E2.1]**
1261 6 76 0 0 0 0 0 0 30 378 0 0 16.5 208 34.5 435 13 164
F. Unallocated Power RAPS 3 & 4 (440-374)
66 21.2 14 0.0 0 0.0 0 0 0 0.0 0 0.0 0 56.1 37 22.7 15 0 0
G. Unallocated Power of Tala HEP (Bhutan)
153 0.0 0 19.6 30 9.8 15 0 0 11.8 18 19.6 30 9.8 15 29.4 45 0 0
H. Unallocated Power from WR 100 100
I. TOTAL UNALLOCATED IN NR [= E2.1+E2.2+F+G+H]
2508 90 30 15 15 573 67 570 880 164 4
J. NET POWER OF NR EXCLUDING BANGLADESH BPDB POWER [=D+I]
24467 246 4815 2553 1482 2206 2281 3187 6549 1040 9
K. COMMISSIONED BUT NON-CoD UNITS 545
Nimmo Bazgo unit 2 15
Nimmo Bazgo unit 3 15
Nimmo Bazgo unit 1 15
Unchhar-III TPS 500
L. TOTAL POWER [=J+K] 25012
Commisioned on 31.10.2013
Commisioned on 31.10.2013
Commisioned on 02.11.2013
(#) This is total share of the Region in Central Generating Stations( including CGS located in other regions)
Ø This comprises 1.01 MW (0.103%), 1.01 MW (0.103%) and 2.72 MW (0.278%) from NCTPS Dadri-II to HVDC Balia, Bhiwadi and Kurukshetra respectively.
$ This comprises 0.8 MW (0.08%) from Rihand STPS, 0.83 MW (0.10%) from Dadri (G) and 2.5 MW (0.255%) from NCTPS Dadri-II to HVDC Rihand, Dadri and Agra respectively.
$$ This comprises 70 MW (8.43%) from Dadri GPS and 30 MW (4.53%) from Auraiya GPS
@ Allocated to Bangladesh
The shares as given in % may be taken, the MW values are indicative
*Details available in the allocation sheet of respective region.
Commisioned on 31.03.2017
Changes during the month: Commissioning of Unchhar-III TPS
Annexure-IX (Page 3 of 7)

RA
ILW
AY
S
HW
P o
f D
AE
BA
RC
BS
PH
CL
JAM
MU
&
KA
SH
MIR
BA
NG
LA
DE
SH
MW MW % MW % MW % MW % MW % MW % MW % MW % MW MW MW MW MW MW MW
A. FIRM SHARE
Korba STPS 2100 1790 10.0 210 17.1 360 19.1 400 29.1 610 0.0 0 0.0 0 10.0 210
Korba STPS U# 7 500 350 30.0 75 19.2 96 12.5 63 21.6 108 0.3 2 0.4 2 0.9 5
Vindhyachal STPS - I 1260 1070 0.0 0 18.3 230 30.5 385 32.5 410 0.4 5 0.4 5 2.8 35
Vindhyachal STPS - II 1000 850 0.0 0 23.9 239 27.3 273 31.9 319 0.3 3 0.4 4 1.2 12
Vindhyachal STPS - III 1000 850 10.5 105 26.6 266 20.0 200 25.8 258 0.5 5 0.6 6 1.0 10
Vindhyachal STPS - IV 1000 850 6.3 63 24.0 240 25.6 256 27.0 270 0.4 4 0.6 6 1.1 11
Vindhyachal STPS - V 500 425 8.0 40 18.7 93 25.6 128 29.8 149 0.8 4 1.1 6 1.0 5
Sipat STPS Stage - I (3 Units) 1980 1683 15.8 313 27.3 540 14.3 283 25.8 510 0.4 8 0.5 9 1.0 20
Sipat STPS Stage - II 1000 850 15.8 158 27.3 273 14.3 143 25.8 258 0.4 4 0.4 4 1.0 10
Kawas GBS 656 558 0.0 0 28.5 187 21.2 140 31.1 204 0.3 2 3.8 25 0.0 0
Bhilai TPS ($) 500 220 20.7 50 37.8 70 41.5 100
Ratnagiri GPS 1967 1967 63.5 1299 2.0 39 2.0 39 1.0 20 570
Kakrapar APS 440 374 0.0 0 28.4 125 21.1 93 31.1 137 0.5 2 0.5 2 3.4 15
Tarapur APS 320 320 0.0 0 50.0 160 0.0 0 50.0 160 0.0 0 0.0 0 0.0 0
Tarapur APS U# 3 & 4 1080 918 4.4 48 25.4 274 16.7 180 36.4 393 0.5 5 0.6 7 1.0 11
Gandhar GBS 657 558 0.0 0 36.1 237 18.0 117 30.4 200 0.3 2 0.3 2 0.0 0
Mouda STPS-I 1000 850 6.3 63 24.0 240 15.6 154 37.0 370 0.4 4 0.6 6 1.1 11 2.72
Mouda STPS-II U#1 660 561 6.6 44 22.3 147 16.0 106 37.9 250 0.4 3 0.7 4 1.1 7
Sub-Total (A) 15044 1169 3707 2920 5905 162 226 382 2.72 570
B. DEDICATED STATIONS
Omkareshwar HEP 520 520 100 520
Indira Sagar HEP 1000 1000 100 1000
Sub-Total (B) 1520 1520
C. FIRM SHARE FROM/ TOOTHER REGIONS
From ER-Kahalgaon STPS-II 398 398 2 30 9.4 141 4.9 74 9.9 148 0.1 2 0.2 3 0 0
From SR-Ramagundam STPS 100 100 0 0 0 0 4.8 100
Merchant Power of Korba STPS U#7
75 0 0
Sub-Total (C) 498 30 141 74 148 2 3 100
D. TOTAL FIRM SHARE [=A+B+C] 17062 1199 3848 4514 6053 164 229 482 2.72 570
E. UNALLOCATED POWER OF WR CGSs
2222
E1. Unallocated Power to J&K 100 0 100
E2. Bangladesh (NVVN A/c BPDB) 100 0 100
E3. Unallocated Power in WR Pool [=E-E1-E2]
2022
E3.1. Specific Allocation From E3 above
559
(i) For bundling with Solar power(under JNNSM)
96 25 50 21
(ii) DD, DNH and Goa 250 102 122 25
(iii) HVDC-BHD Station 3 0.2 2.52
(iv) HVDC-VIN Station 1 0.1 0.76
(v) BARC facilities from TAPS (3&4)
10 10
(vi) MP(Bundelkhand) 200 200
(vii) HWP of DAE 0 0
E3.2. Balance Unallocated Power in WR Pool [=E3-E3.1]
1463 0 0 0 0 17 269 38 589 2.5 40 36 559 0.4 6
Sub-Total (E) (*) 2022 25 0 519 610 142 682 31 3 0 0 10
F. TOTAL POWER TO WR BENEFICIARIES [=D+E]
19083 1224 3848 5033 6663 306 911 513 6 570 0 10
G. COMMISSIONED BUT NON-CoD UNITS
660
1. Mouda STPS-II U#2 660
H. TOTAL POWER [=F+G] 19743 1224 3848 5033 6663 306 911 513 6 570 0 10
Note:
ALLOCATION OF POWER FROM CENTRAL GENERATING STATIONS TO WESTERN REGION
(As on 31-03-2017)
ST
AT
ION
S
INS
TA
LL
ED
C
AP
AC
ITY
#A
LL
OC
AT
ED
CA
PA
CIT
Y
Within the region
CH
AT
TIS
GA
RH
GU
JAR
AT
MA
DH
YA
P
RA
DE
SH
MA
HA
RA
ST
HR
A
DA
MA
N &
DIU
DA
DR
A &
N
AG
AR
H
AV
EL
I
GO
A
PO
WE
RG
RID
Changes During the Month: Commissioning of Mouda STPS-II U#2
* Subtotal doesn't include power to J&K and Bangladesh
2. The shares as given in % may be taken, the MW values are indicative.
Other region/ Country
# This is total share of the region in Central Generating Stations (including CGS located in other regions).
$ Out of total 500 MW capacity of Bhilai Power Station, 280 MW is being supplied to SAIL
1. The % allocations shown are during peak hours (18-22 hrs). During other hours (00 to 18 and 22 to 24 hrs), % are different.
(Commissioned on 18.03.2017)
Annexure-IX (Page 4 of 7)

Other Region/Country
#A
LL
OC
AT
ED
CA
PA
CIT
YMW MW % MW % MW % MW % MW % MW % MW % MW % MW % MW % MW
##Ramagundam St. I & II 2100 1690 12.7 267 16.4 345 11.7 245 22.4 470 14.9 313 2.4 50 0.0 0 4.8 100
Ramagundam St. III 500 425 13.5 67 17.4 87 12.2 61 23.6 118 15.7 79 2.6 13 0.0 0$Talcher St. II 2000 1500 8.6 173 17.5 350 12.4 247 23.9 477 10.1 202 2.6 51 10.0 200
Simhadri STPS St.II U#1,2 1000 850 17.7 177 17.6 176 8.1 81 19.8 198 20.7 207 1.1 11
NLC TPS-II St. I 630 535 7.1 45 13.3 84 10.0 63 27.9 176 8.3 52 10.3 65 7.9 50
NLC TPS-II St. II 840 715 9.9 83 13.7 115 10.7 90 31.5 265 11.5 97 1.8 15 6.0 50
NLC TPS-I Exp. 420 357 0.0 0 22.0 92 14.0 59 46.0 193 0.0 0 3.0 13
NLC TPS-II Exp. U#1,2 500 425 0.0 0 22.0 110 14.0 70 46.0 230 0.0 0 3.0 15
Vallur STPS U# 1, 2 & 3 1500 1387.5 5.5 82 7.4 112 3.3 50 69.4 1041 6.4 96 0.4 7
NTPL Tuticorin U# 1,2 1000 881.5 11.7 117 15.8 158 7.3 73 38.7 387 13.7 137 1.0 10
Madras APS 440 422 4.0 18 6.6 29 5.2 23 74.3 327 4.7 20 1.1 5
Kaiga APS U# 1 & 2 440 374 12.1 53 24.5 108 8.6 38 23.9 105 14.1 62 1.8 8
Kaiga APS U# 3 & 4 440 374 12.9 57 27.0 119 8.0 35 20.7 91 15.1 66 1.4 6
Kudankulam NPP U# 1 1000 850 0.0 0 22.1 221 13.3 133 46.3 463 0.0 0 3.4 34
Kudankulam NPP U# 2* 1000 850 0.0 0 22.1 221 13.3 133 46.3 463 0.0 0 3.4 34
Sub-Total (A) 13810 11636 1140 2327 1400 5003 1332 334 100
Simhadri 1000 1000 46.11 461 53.89 539
Kayamkulam CCGT 360 360 100.0 360
NLC TPS-I 600 600 100.0 600
4x50 NP Kunta Ultra Mega Solar Power Project stage-I
200 200 200
Sub-Total (B) 2160 2160 661 360 600 539
1874
170 45 70 5 50
1703.7 5.3 90 29.1 495 12.6 215 34.3 584 9.6 164 8.7 148 0.4 6
1874 135 565 215 589 214 148 6
15670 12.4 1936 18.5 2893 12.6 1975 39.5 6192 13.3 2085 3.1 483 0.6 100 0.0 6
35 100.0 35
0 0.0 0 0.0 0 0.0 0
35 0 0 35 0
15705 1936 2893 1975 6227 2085 483 100 6 0 0
1600
800800
17305 1936 2893 1975 6227 2085 483 100 6
Changes during the Month:
(As on 31-03-2017)
* CoD of Kudankulam NPP U# 2 wef 11:00 hrs of 31.03.2017. ** Kudgi STPP PH-I, Unit -I&2 of NTPC commissioned .
(#) This is total share of the region in Central Generating Stations excluding power to Orissa and Goa.
(##) Restoration of 100 MW share of Goa in Ramagundam STPS in SR vide MoP letter no. 3/4/2006-OM dated 10-02-06. This has been shown in WR allocation sheet.($) 200 MW firm power allocated to Orissa vide MoP letter no. 5/21/2006-Th.2 dated 19.4.2007. This has been shown in ER allocation sheet.
2. Kudgi STPP PH-I, U#2 NTPC**
(F) TOTAL ALLOCATION INCLUDING FROM OTHER REGIONS =D+E
(G) COMMISSIONED BUT NON-CoD UNITS
1. Kudgi STPP PH-I, U#I NTPC**
(H) TOTAL POWER ALLOCATION =F+G
Commissioned on 25.12.2016Commissioned on 23.03.2017
(A) FIRM SHARE
(B) DEDICATED STATIONS
(C) UNALLOCATED QUOTA
Sub-Total (E) =(i)+(ii)
(ii) NVVN Coal power for bundling with Solar power (under JNNSM)
(i) Power from DVC's share of ER
(ii) Diversion of firm share (0 MW) surrendered by Delhi & Haryana in IGSTPS, Jhajjar
(iii) Balance unallocated power (incl. specific allocation=(i)-(ii)
Sub-Total (C) =(ii)+(iii)
(D) Total Allocation from CGSs of ={A+B+C}
(E) ALLOCATION FROM OTHER REGIONS
(i) Unallocated Power of SR CGSs
ALLOCATION OF POWER FROM CENTRAL GENERATING STATIONS TO SOUTHERN REGION
ST
AT
ION
S
INS
TA
LL
ED
CA
PA
CIT
Y
With in the Region
AN
DH
RA
PR
AD
ES
H
KA
RN
AT
AK
A
KE
RA
LA
TA
MIL
NA
DU
OR
ISS
A
GO
A
TE
LA
NG
AN
A
PU
DU
CH
ER
RY
NL
C
PO
WE
RG
RID
Annexure-IX (Page 5 of 7)

RA
ILW
AY
PG
CIL
ASS
AM
TA
MIL
N
AD
U
NO
RT
H
EA
STE
RN
R
EG
ION
NO
RT
HE
RN
RE
GIO
WE
STE
RN
SOU
TH
ER
N
BA
NG
LA
DE
SH
MW MW % MW % MW % MW % MW % MW % MW MW MW MW MW MW MW MW MW MW
A. FIRM SHARE
NTPC Stations
Barh STPS Stage-II (U# 4 &5) 1320 1122 65.1 860 6.1 80 0.0 0 12.6 166 0.0 0 1.3 16
Farakka (U# 1 to 5) 1600 1214 23.7 379 6.4 102 0.0 0 13.6 218 30.5 489 1.6 26 12 21
Farakka (U# 6) 500 350 11.1 55 6.5 33 6.4 32 16.6 83 29.4 147 0.0 0
Kahalgaon 840 444 34.9 293 1.2 10 0.0 0 15.2 128 0.0 0 1.6 13 3 6
Kahalgaon-II (3 units) 1500 36 2.1 31 0.3 5 498 398
Nabinagar TPS -JV(Unit #1) 250 225 225
Talcher 1000 837 34.4 344 5.7 57 0.3 3 31.8 318 9.1 91 2.4 24 5 8
Talcher Stage-II 2000 200 10.0 200 1500
NHPC Stations
Rangit HPS 60 51 30.0 18 11.7 7 8.3 5 0.0 0 23.3 14 11.7 7
Teesta-V HPS (3 units) 510 434 18.0 92 10.6 54 7.5 38 17.5 89 20.4 104 11.2 57
Bhutan Stations
Tala HPS (Bhutan) * 1020 867 25.5 260 11.5 117 5.6 57 4.3 43 38.3 390 0.0 0
Chukha HPS (270MW out of 336 MW allocated to India)
270 229 25.2 68 8.9 24 8.9 24 13.0 35 27.0 73 1.9 5
Kurichu HPS 60 51 0.0 0 0.0 0 43.3 26 0.0 0 41.7 25 0.0 0
Sub-Total (A) 6060 2369 484 185 1311 1333 153 225
B. DEDICATED STATIONS
Muzaffurpur TPS U# 1 & 2 220 220 100 220
Talcher TPS 460 460 100 460
DVC** 6433 6283 ++ 6283
Teesta Low Dam 132 132 100 132
Sub-Total (B) 7095 220 6283 460 132C. FIRM POWER FROM/ TO OTHER REGIONS
C1. DVC's surrendered share## 100 20 35
C2. Merchant Power of Farakka U# 6 75 75 75
C3. Merchant Power of Korba U# 7 75 0 0
C4. Allocation to NR in lieu of Tala power 1020
(i) Farakka (Unit 1 to 5) 1600 113
(ii) Kahalgaon 840 261
(iii) Kahalgaon-II (3 units) 1500 343
(iv) DVC Mejia U#6 (150 MW) 150
(v) Unallocated Power of Tala (15% of 1020 MW)*
153
Sub-Total (C) 75 75
D. TOTAL FIRM POWER [=A+B+C] 13230 2664 484 6468 1771 1465 153 225
E. UNALLOCATED POWER OF ER CGSs
E1. Unallocated Power of NHPC Stations+ 85 85 20 10 7 16 21 11
E2. Unallocated Power of Bhutan HPSs+ 50 50 12 5 8 6 18 1
E3. Unallocated Power of NTPC stations 1038
E3.1. Specific Allocation from E3 above
(i) Bundling with Dadri Solar Power 5 5 5
(ii) Bundling with JNNSM Solar power 95 90 35 20 35 5
(iii)Nabinagar TPS -JV(Unit #1 250MW) 25 25 25
E3.2. Balance Unallocated Share of NTPC Stations [=E3-E3.1]
913
(i) Barh STPS Stage-II (U# 4 & 5) 1320 200 11.5 152 1.1 14 0.0 0 2.2 30 0.0 0 0.2 4
(ii) Farakka (U# 1 to 5) 1600 166 7.5 120 2.9 46 0.0 0 0.0 0 0.0 0 0.0 0 39 5
(iii) Farakka (U# 6) 500 66 10.9 55 0.4 2 0.0 0 0.0 0 1.8 9 0.0 0
(iv) Kahalgaon 840 81 6.8 57 2.7 23 0.0 0 0.0 0 0.0 0 0.0 0 1 20 10
(v) Kahalgaon-II (3 units) 1500 97 5.2 78 1.3 19 0.0 0 0.0 0 0.0 0 0.0 0 79 20
(vii) Talcher 1000 94 6.7 67 2.6 27 0.0 0 0.0 0 0.0 0 0.0 0 23 15
Sub-Total (E3) [=E3.1+E3.2] 825 554 132 35 55 44 4 1 166 50
Sub-Total (E) [=E1+E2+E3] 960 61.0 586 15.3 147 5.2 50 8.0 77 8.7 83 1.7 16 1
F. TOTAL ALLOCATION TO ER BENEFICIARIES [=D+E]
14190 3250 631 6518 1848 1548 169 225 1
G. COMMISSIONED BUT NON-CoD UNITS 1335
1. Muzaffpur TPS U# 3 195
3. Raghunathpur, Ph-I, U# 1 600
4. Teesta Low Dam U#2, Stg. IV(40 MW) 40
5. Bokaro-A(DVC Project) 1x500 MW 500
6. Muzaffarpur TPS U# 4% 195
H. TOTAL POWER [=F+G] 15525
Note:
4. 100 MW power through open access from RGPPL(WR) allocated to Jharkhand Railways w.e.f.16.01.2016.
# This is total share of the region in Central Generating Stations (including CGS located in other regions).## Out of DVC's surrendered share of 100 MW; 20 MW, 35 MW and 45 MW allocated to Assam, Tamil Nadu and Bihar
respectively. In the Sheet, Bihar's 45 MW is already included in Firm Power allocation from Farakka, Kahalgaon &
+ 15% Unallocated Power of these stations (amounting to 288 MW) is not in Unallocated Pool
* Out of 1020 MW Capacity of Tala HEP, 85% allocated to ER and 15% (153 MW) to NR.
+ + 150 MW from Mejia U# 6 allocated to NR in lieu of Tala Power. Details shown against item C4(iv) below.
** DVC includes Bokaro(630MW), Chandrapur(890MW), Durgapur(1340MW), Maithon-G(90MW), Maithon-
H(63MW), Mejia(2340MW), Panchet(80MW), Koderma(2*500MW).1. The % allocations shown are during peak hours (18-22 hrs). During other hours (00 to 18 and 22 to 24 hrs),
% are different.
2. The shares as given in % may be taken, the MW values are indicative.
3. 50 MW ER unallocated power allocated to Bangladesh.
OD
ISH
A
WE
ST
B
EN
GA
L
SIK
KIM
(Commissioned on 31.03.2015)
(Commissioned on 24.08.2014)
(Commissioned on 16.03.2016)
(Commissioned on 22.03.2016)
Changes during the month: Commissioning of Muzaffarpur TPS U#4
(Commissioned on 24.03.2017)
ALLOCATION OF POWER FROM CENTRAL GENERATING STATIONS AND BHUTAN STATIONS TO EASTERN REGION(As on 31-03-2017)
ST
AT
ION
INS
TA
LL
ED
C
AP
AC
ITY
AL
LO
CA
TE
D
CA
PA
CIT
Y# Within the region Other region/ Country
BIH
AR
JHA
RK
HA
ND
D.V
.C.
Annexure-IX (Page 6 of 7)
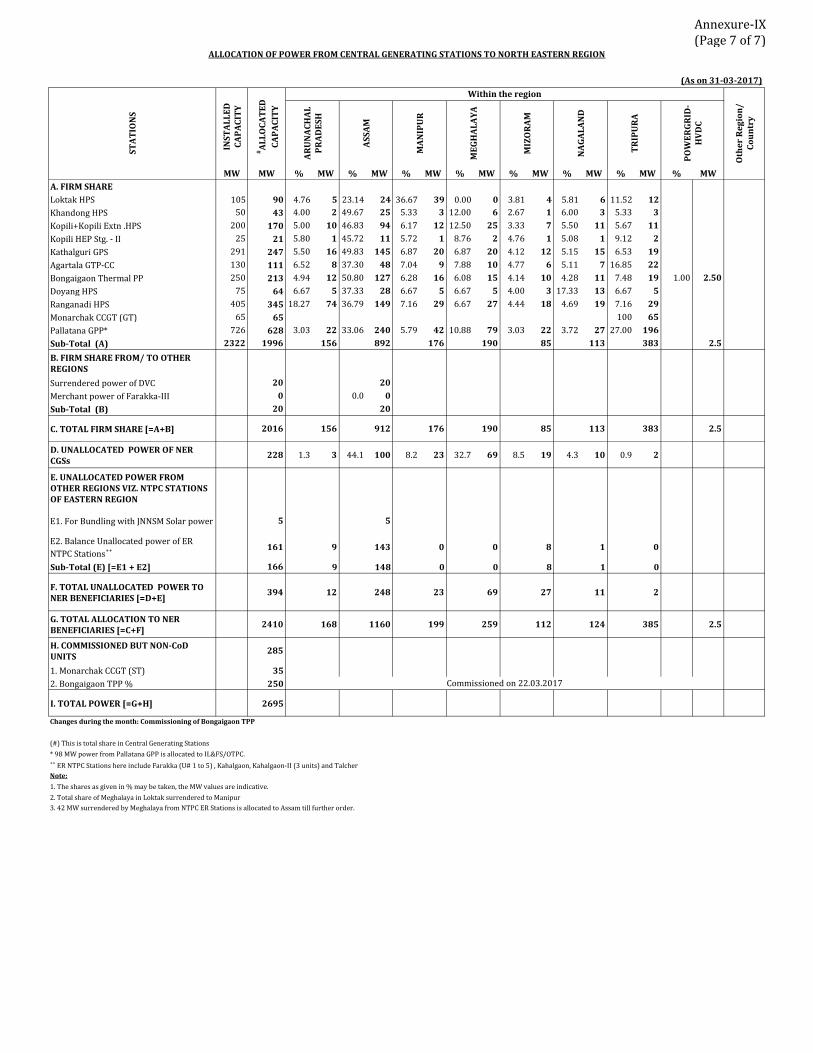
MW MW % MW % MW % MW % MW % MW % MW % MW % MW
A. FIRM SHARE
Loktak HPS 105 90 4.76 5 23.14 24 36.67 39 0.00 0 3.81 4 5.81 6 11.52 12
Khandong HPS 50 43 4.00 2 49.67 25 5.33 3 12.00 6 2.67 1 6.00 3 5.33 3
Kopili+Kopili Extn .HPS 200 170 5.00 10 46.83 94 6.17 12 12.50 25 3.33 7 5.50 11 5.67 11
Kopili HEP Stg. - II 25 21 5.80 1 45.72 11 5.72 1 8.76 2 4.76 1 5.08 1 9.12 2
Kathalguri GPS 291 247 5.50 16 49.83 145 6.87 20 6.87 20 4.12 12 5.15 15 6.53 19
Agartala GTP-CC 130 111 6.52 8 37.30 48 7.04 9 7.88 10 4.77 6 5.11 7 16.85 22
Bongaigaon Thermal PP 250 213 4.94 12 50.80 127 6.28 16 6.08 15 4.14 10 4.28 11 7.48 19 1.00 2.50
Doyang HPS 75 64 6.67 5 37.33 28 6.67 5 6.67 5 4.00 3 17.33 13 6.67 5
Ranganadi HPS 405 345 18.27 74 36.79 149 7.16 29 6.67 27 4.44 18 4.69 19 7.16 29
Monarchak CCGT (GT) 65 65 100 65
Pallatana GPP* 726 628 3.03 22 33.06 240 5.79 42 10.88 79 3.03 22 3.72 27 27.00 196
Sub-Total (A) 2322 1996 156 892 176 190 85 113 383 2.5
B. FIRM SHARE FROM/ TO OTHER REGIONS
Surrendered power of DVC 20 20
Merchant power of Farakka-III 0 0.0 0
Sub-Total (B) 20 20
C. TOTAL FIRM SHARE [=A+B] 2016 156 912 176 190 85 113 383 2.5
D. UNALLOCATED POWER OF NER CGSs
228 1.3 3 44.1 100 8.2 23 32.7 69 8.5 19 4.3 10 0.9 2
E. UNALLOCATED POWER FROM OTHER REGIONS VIZ. NTPC STATIONS OF EASTERN REGION
E1. For Bundling with JNNSM Solar power 5 5
E2. Balance Unallocated power of ER
NTPC Stations++ 161 9 143 0 0 8 1 0
Sub-Total (E) [=E1 + E2] 166 9 148 0 0 8 1 0
F. TOTAL UNALLOCATED POWER TO NER BENEFICIARIES [=D+E]
394 12 248 23 69 27 11 2
G. TOTAL ALLOCATION TO NER BENEFICIARIES [=C+F]
2410 168 1160 199 259 112 124 385 2.5
H. COMMISSIONED BUT NON-CoD UNITS
285
1. Monarchak CCGT (ST) 35
2. Bongaigaon TPP % 250
I. TOTAL POWER [=G+H] 2695
3. 42 MW surrendered by Meghalaya from NTPC ER Stations is allocated to Assam till further order.
(#) This is total share in Central Generating Stations
* 98 MW power from Pallatana GPP is allocated to IL&FS/OTPC.++ ER NTPC Stations here include Farakka (U# 1 to 5) , Kahalgaon, Kahalgaon-II (3 units) and Talcher
Note:
1. The shares as given in % may be taken, the MW values are indicative.
2. Total share of Meghalaya in Loktak surrendered to Manipur
Changes during the month: Commissioning of Bongaigaon TPP
ME
GH
AL
AY
A
MIZ
OR
AM
NA
GA
LA
ND
TR
IPU
RA
PO
WE
RG
RID
-H
VD
C
Commissioned on 22.03.2017
ALLOCATION OF POWER FROM CENTRAL GENERATING STATIONS TO NORTH EASTERN REGION
(As on 31-03-2017)
ST
AT
ION
S
INS
TA
LL
ED
C
AP
AC
ITY
#A
LL
OC
AT
ED
CA
PA
CIT
Y
Within the region
Oth
er
Re
gio
n/
C
ou
ntr
y
AR
UN
AC
HA
L
PR
AD
ES
H
AS
SA
M
MA
NIP
UR
Annexure-IX (Page 7 of 7)

Annex-X
DemandAvaila-
bility
Require-
ment
Availa-
bility
(MW) (MW) (MW) (%) (MU) (MU) (MU) (%)
Apr-17 162,817 174,832 12,015 7.4 102,504 107,496 4,991 4.9
May-17 160,009 175,522 15,512 9.7 106,265 115,548 9,283 8.7
Jun-17 158,548 173,402 14,854 9.4 103,841 113,958 10,117 9.7
Jul-17 162,840 179,005 16,164 9.9 104,755 116,553 11,798 11.3
Aug-17 164,191 180,486 16,295 9.9 105,108 117,810 12,702 12.1
Sep-17 169,130 180,601 11,471 6.8 106,552 118,241 11,688 11.0
Oct-17 163,908 174,547 10,639 6.5 105,613 114,191 8,578 8.1
Nov-17 157,426 169,758 12,332 7.8 96,287 104,199 7,912 8.2
Dec-17 153,711 165,018 11,307 7.4 98,698 107,512 8,813 8.9
Jan-18 154,583 166,581 11,998 7.8 99,708 109,343 9,635 9.7
Feb-18 158,189 172,355 14,166 9.0 94,305 101,098 6,793 7.2
Mar-18 162,350 175,323 12,973 8.0 106,023 111,879 5,856 5.5
Annual 169,130 180,601 11,471 6.8 1,229,661 1,337,828 108,167 8.8
Anticipated month wise power supply position of India during the year 2017-18
All India
Month
Peak Energy
Surplus(+)/
Deficit(-)
Surplus(+)/
Deficit(-)
0
50,000
100,000
150,000
200,000
Peak (M
W)
Peak: Demand vs Availability
Demand Availability
0
20,000
40,000
60,000
80,000
100,000
120,000
140,000
En
erg
y (M
U)
Energy: Requirement vs Availability
Requirement Availability

Annex-XI
(1 / 5)
DemandAvailabili
ty
Requiremen
t Availability
(MW) (MW) (MW) (%) (MU) (MU) (MU) (%)
Apr-17 50,600 54,000 3,400 6.7 28,884 30,878 1,994 6.9
May-17 54,000 58,500 4,500 8.3 33,360 36,060 2,701 8.1
Jun-17 56,800 59,400 2,600 4.6 35,867 37,805 1,937 5.4
Jul-17 55,400 60,000 4,600 8.3 35,377 38,756 3,380 9.6
Aug-17 56,800 60,600 3,800 6.7 34,467 38,510 4,042 11.7
Sep-17 56,800 57,300 500 0.9 36,030 37,787 1,757 4.9
Oct-17 51,800 53,300 1,500 2.9 31,055 34,299 3,244 10.4
Nov-17 43,800 50,500 6,700 15.3 25,955 29,852 3,896 15.0
Dec-17 48,300 52,400 4,100 8.5 28,423 31,875 3,452 12.1
Jan-18 47,800 53,000 5,200 10.9 28,558 32,299 3,741 13.1
Feb-18 45,400 53,100 7,700 17.0 25,990 29,320 3,330 12.8
Mar-18 48,000 54,500 6,500 13.5 29,335 32,275 2,940 10.0
Annual 56,800 60,600 3,800 6.7 373,301 409,715 36,415 9.8
Anticipated month-wise power supply position of Region for 2017-18
Northern Region
Month
Peak Energy
Surplus(+)/
Deficit(-)
Surplus(+)/
Deficit(-)
0
10,000
20,000
30,000
40,000
50,000
60,000
70,000
Peak (M
W)
Peak: Demand vs Availability
Demand Availability
05,000
10,00015,00020,00025,00030,00035,00040,00045,000
En
erg
y (M
U)
Energy: Requirement vs Availability
Requirement Availability

Annex-XI
(2 / 5)
DemandAvailabili
ty
Requiremen
t Availability
(MW) (MW) (MW) (%) (MU) (MU) (MU) (%)
Apr-17 46,609 54,667 8,057 17.3 30,617 34,128 3,511 11.5
May-17 46,467 55,236 8,769 18.9 31,534 35,560 4,026 12.8
Jun-17 45,098 52,836 7,738 17.2 28,226 33,435 5,209 18.5
Jul-17 42,764 50,710 7,947 18.6 28,431 32,801 4,370 15.4
Aug-17 42,232 50,613 8,381 19.8 28,648 33,215 4,567 15.9
Sep-17 46,669 55,687 9,019 19.3 30,290 35,152 4,862 16.1
Oct-17 48,613 57,224 8,611 17.7 32,653 36,489 3,836 11.7
Nov-17 48,705 55,844 7,139 14.7 31,552 34,707 3,155 10.0
Dec-17 48,223 54,814 6,591 13.7 31,960 35,210 3,250 10.2
Jan-18 48,134 55,403 7,269 15.1 31,396 35,505 4,109 13.1
Feb-18 48,842 55,446 6,604 13.5 29,574 32,841 3,267 11.0
Mar-18 48,684 55,621 6,937 14.2 32,076 35,552 3,477 10.8
Annual 48,842 57,224 8,382 17.2 366,956 414,595 47,639 13.0
Anticipated month-wise power supply position of Region for 2017-18
Western Region
Month
Peak Energy
Surplus(+)/
Deficit(-)
Surplus(+)/
Deficit(-)
0
10,000
20,000
30,000
40,000
50,000
60,000
70,000
Peak (M
W)
Peak: Demand vs Availability
Demand Availability
05,000
10,00015,00020,00025,00030,00035,00040,000
En
erg
y (M
U)
Energy: Requirement vs Availability
Requirement Availability

Annex-XI
(3 / 5)
DemandAvailabili
ty
Requiremen
t Availability
(MW) (MW) (MW) (%) (MU) (MU) (MU) (%)
Apr-17 43,355 42,381 -974 -2.2 28,797 28,682 -115 -0.4
May-17 41,995 43,006 1,011 2.4 26,933 29,521 2,588 9.6
Jun-17 40,347 41,557 1,210 3.0 25,341 28,300 2,960 11.7
Jul-17 40,652 42,869 2,217 5.5 26,267 29,876 3,609 13.7
Aug-17 42,859 45,355 2,496 5.8 27,423 31,045 3,621 13.2
Sep-17 43,292 45,276 1,984 4.6 26,033 30,272 4,239 16.3
Oct-17 42,877 42,263 -614 -1.4 27,742 28,822 1,080 3.9
Nov-17 42,191 39,495 -2,696 -6.4 25,885 26,850 965 3.7
Dec-17 41,074 39,670 -1,404 -3.4 25,364 27,820 2,456 9.7
Jan-18 42,462 41,448 -1,014 -2.4 26,507 28,606 2,099 7.9
Feb-18 44,305 43,106 -1,199 -2.7 26,480 27,033 553 2.1
Mar-18 44,908 43,271 -1,637 -3.6 30,374 30,224 -150 -0.5
Annual 44,908 45,355 447 1.0 323,146 347,051 23,905 7.4
Anticipated month-wise power supply position of Region for 2017-18
Southern Region
Month
Peak Energy
Surplus(+)/
Deficit(-)
Surplus(+)/
Deficit(-)
0
10,000
20,000
30,000
40,000
50,000
Peak (M
W)
Peak: Demand vs Availability
Demand Availability
0
5,000
10,000
15,000
20,000
25,000
30,000
35,000
En
erg
y (M
U)
Energy: Requirement vs Availability
Requirement Availability

Annex-XI
(4 / 5)
DemandAvailabili
ty
Requiremen
t Availability
(MW) (MW) (MW) (%) (MU) (MU) (MU) (%)
Apr-17 21,533 23,038 1,505 7.0 13,089 12,653 -436 -3.3
May-17 21,397 23,181 1,784 8.3 13,181 13,086 -95 -0.7
Jun-17 21,504 23,743 2,239 10.4 12,887 12,918 31 0.2
Jul-17 21,460 22,799 1,339 6.2 13,121 13,426 304 2.3
Aug-17 21,281 22,929 1,648 7.7 12,974 13,318 345 2.7
Sep-17 21,460 23,228 1,768 8.2 12,730 13,333 603 4.7
Oct-17 21,261 22,495 1,234 5.8 12,718 13,051 333 2.6
Nov-17 20,329 21,344 1,015 5.0 11,649 11,504 -145 -1.2
Dec-17 19,796 20,641 846 4.3 11,705 11,360 -345 -3.0
Jan-18 19,858 20,895 1,037 5.2 11,925 11,726 -199 -1.7
Feb-18 20,417 21,790 1,373 6.7 11,101 10,839 -262 -2.4
Mar-18 21,577 22,972 1,395 6.5 13,071 12,659 -412 -3.2
Annual 21,577 23,743 2,166 10.0 150,151 149,871 -280 -0.2
Anticipated month-wise power supply position of Region for 2017-18
Eastern Region
Month
Peak Energy
Surplus(+)/
Deficit(-)
Surplus(+)/
Deficit(-)
0
5,000
10,000
15,000
20,000
25,000
Peak (M
W)
Peak: Demand vs Availability
Demand Availability
02,0004,0006,0008,000
10,00012,00014,00016,000
En
erg
y (M
U)
Energy: Requirement vs Availability
Requirement Availability

Annex-XI
(5 / 5)
DemandAvailabili
ty
Requiremen
t Availability
(MW) (MW) (MW) (%) (MU) (MU) (MU) (%)
Apr-17 2,348 2,494 146 6.2 1,118 1,155 38 3.4
May-17 2,551 2,620 69 2.7 1,258 1,321 63 5.0
Jun-17 2,727 2,802 75 2.7 1,520 1,500 -20 -1.3
Jul-17 2,564 2,626 62 2.4 1,560 1,694 134 8.6
Aug-17 2,661 2,794 134 5.0 1,597 1,722 126 7.9
Sep-17 2,601 2,722 121 4.7 1,470 1,697 227 15.5
Oct-17 2,635 2,756 121 4.6 1,445 1,530 86 5.9
Nov-17 2,401 2,575 174 7.3 1,245 1,287 42 3.3
Dec-17 2,467 2,443 -23 -0.9 1,246 1,247 1 0.1
Jan-18 2,512 2,498 -14 -0.6 1,322 1,207 -115 -8.7
Feb-18 2,389 2,361 -28 -1.2 1,160 1,065 -95 -8.2
Mar-18 2,427 2,465 38 1.6 1,167 1,169 2 0.2
Annual 2,727 2,802 75 2.7 16,106 16,595 488 3.0
Anticipated month-wise power supply position of Region for 2017-18
North-Eastern Region
Month
Peak Energy
Surplus(+)/
Deficit(-)
Surplus(+)/
Deficit(-)
0
500
1,000
1,500
2,000
2,500
3,000
Peak (M
W)
Peak: Demand vs Availability
Demand Availability
0
500
1,000
1,500
2,000
En
erg
y (M
U)
Energy: Requirement vs Availability
Requirement Availability

Annex-XII
Require-
ment
Availa-
bilityDemand
Availa-
bility
(MU) (MU) (MU) (%) (MW) (MW) (MW) (%)
Chandigarh 1,707 1,665 -43 -2.5 390 365 -25 -6.4
Delhi 32,396 38,346 5,950 18.4 6,560 6,657 97 1.5
Haryana 51,353 56,029 4,676 9.1 9,890 8,880 -1,010 -10.2
Himachal Pradesh 9,740 12,869 3,130 32.1 1,570 2,333 763 48.6
Jammu & Kashmir 18,133 14,724 -3,409 -18.8 2,770 2,393 -377 -13.6
Punjab 55,935 58,165 2,230 4.0 12,130 11,502 -628 -5.2
Rajasthan 72,535 77,291 4,756 6.6 11,490 12,382 892 7.8
Uttar Pradesh 117,072 136,419 19,346 16.5 17,720 17,866 146 0.8
Uttarakhand 14,428 14,207 -221 -1.5 2,240 2,167 -73 -3.3
Northern Region 373,301 409,715 36,415 9.8 56,800 60,600 3,800 6.7
Chhattisgarh 26,728 31,209 4,481 16.8 4,186 4,370 184 4.4
Gujarat 102,983 116,897 13,913 13.5 14,610 15,213 602 4.1
Madhya Pradesh 74,386 84,183 9,797 13.2 11,595 12,537 941 8.1
Maharashtra 144,266 163,053 18,787 13.0 20,700 23,765 3,065 14.8
Daman & Diu 2,388 2,437 49 2.0 330 344 14 4.3
Dadra & Nagar Haveli 5,760 6,176 416 7.2 720 737 17 2.4
Goa 4,100 4,295 195 4.8 590 598 8 1.4
Western Region 366,956 414,595 47,639 13.0 48,842 57,224 8,382 17.2
Andhra Pradesh 56,953 63,079 6,126 10.8 8,202 8,447 245 3.0
Karnataka 71,562 77,384 5,822 8.1 11,138 10,534 -605 -5.4
Kerala 25,504 24,879 -625 -2.5 4,387 3,928 -458 -10.4
Tamil Nadu 109,108 117,771 8,663 7.9 15,165 17,392 2,227 14.7
Telangana 56,307 59,847 3,540 6.3 9,196 8,265 -931 -10.1
Puducherry 2,659 3,039 380 14.3 398 393 -5 -1.3
Southern Region 323,146 347,051 23,905 7.4 44,908 45,355 447 1.0
Bihar 26,600 21,207 -5,393 -20.3 4,000 3,494 -506 -12.7
Damodar Valley Corporation 20,041 24,562 4,521 22.6 2,800 4,286 1,486 53.1
Jharkhand 9,485 7,005 -2,480 -26.1 1,300 1,106 -194 -14.9
Odisha 29,715 31,081 1,366 4.6 4,450 4,745 295 6.6
West Bengal 52,432 53,662 1,230 2.3 8,570 9,061 491 5.7
Sikkim 423 967 543 128.3 90 179 89 99.1
Eastern Region 150,151 149,871 -280 -0.2 21,577 23,743 2,166 10.0
Arunachal Pradesh 1,696 1,674 -22 -1.3 158 152 -5 -3.4
Assam 9,628 8,434 -1,194 -12.4 1,831 1,379 -452 -24.7
Manipur 1,032 1,176 144 14.0 210 189 -21 -10.1
Meghalaya 1,720 2,355 635 36.9 346 572 227 65.6
Mizoram 531 636 105 19.8 108 165 57 52.9
Nagaland 785 821 36 4.6 149 162 13 8.4
Tripura 1,364 2,408 1,044 76.6 312 325 13 4.1
North-Eastern Region 16,106 16,595 488 3.0 2,727 2,802 75 2.7
All India 1,229,661 1,337,828 108,167 8.8 169,130 180,601 11,471 6.8
Anticipated annual power supply position in each State/ UT for 2017-18
State / Region
Energy Peak
Surplus(+)/ Deficit(-
)
Surplus(+)/ Deficit(-
)

Annex-XIII
(1/35)
DemandAvaila-
bility
Require-
ment
Availa-
bility
(MW) (MW) (MW) (%) (MU) (MU) (MU) (%)
Apr-17 280 274 -6 -2.1 138 133 -5 -3.7
May-17 390 363 -27 -6.9 179 174 -5 -2.9
Jun-17 390 365 -25 -6.4 192 186 -6 -3.1
Jul-17 380 348 -32 -8.4 188 181 -7 -3.9
Aug-17 370 361 -9 -2.4 176 176 0 -0.1
Sep-17 340 330 -10 -2.9 169 168 -1 -0.6
Oct-17 300 281 -19 -6.3 129 129 0 -0.1
Nov-17 200 187 -13 -6.5 100 99 -1 -1.3
Dec-17 240 221 -19 -7.9 108 104 -4 -4.0
Jan-18 260 245 -15 -5.8 118 112 -6 -5.0
Feb-18 230 220 -10 -4.3 98 96 -2 -1.7
Mar-18 220 211 -9 -4.1 112 107 -5 -4.1
Annual 390 365 -25 -6.4 1,707 1,665 -43 -2.5
Anticipated month wise power supply position for the year 2017-18
Chandigarh
Month
Peak Energy
Surplus(+)/
Deficit(-)
Surplus(+)/
Deficit(-)
050100150200250300350400450
Peak (M
W)
Peak: Demand vs Availability
Demand Availability
0
50
100
150
200
250
En
erg
y (M
U)
Energy: Requirement vs Availability
Requirement Availability

Annex-XIII
(2/35)
DemandAvaila-
bility
Require-
ment
Availa-
bility
(MW) (MW) (MW) (%) (MU) (MU) (MU) (%)
Apr-17 5,000 5,952 952 19.0 2,787 3,152 365 13.1
May-17 6,560 6,657 97 1.5 3,415 3,770 355 10.4
Jun-17 6,400 6,492 92 1.4 3,630 3,860 229 6.3
Jul-17 6,500 6,550 50 0.8 3,518 3,764 246 7.0
Aug-17 6,000 6,280 280 4.7 3,429 3,830 401 11.7
Sep-17 5,600 6,378 778 13.9 3,264 3,650 386 11.8
Oct-17 5,600 6,321 721 12.9 2,767 3,347 580 21.0
Nov-17 3,700 5,147 1,447 39.1 1,827 2,387 559 30.6
Dec-17 4,200 5,573 1,373 32.7 1,881 2,669 788 41.9
Jan-18 4,400 5,782 1,382 31.4 2,019 2,889 870 43.1
Feb-18 4,000 5,533 1,533 38.3 1,783 2,394 610 34.2
Mar-18 4,000 5,401 1,401 35.0 2,075 2,636 561 27.0
Annual 6,560 6,657 97 1.5 32,396 38,346 5,950 18.4
Anticipated month wise power supply position for the year 2017-18
Delhi
Month
Peak Energy
Surplus(+)/
Deficit(-)
Surplus(+)/
Deficit(-)
0
1,000
2,000
3,000
4,000
5,000
6,000
7,000
Peak (M
W)
Peak: Demand vs Availability
Demand Availability
0500
1,0001,5002,0002,5003,0003,5004,0004,500
En
erg
y (M
U)
Energy: Requirement vs Availability
Requirement Availability

Annex-XIII
(3/35)
DemandAvaila-
bility
Require-
ment
Availa-
bility
(MW) (MW) (MW) (%) (MU) (MU) (MU) (%)
Apr-17 7,740 8,432 692 8.9 3,732 4,203 471 12.6
May-17 8,430 8,351 -79 -0.9 4,311 4,731 421 9.8
Jun-17 9,340 8,880 -460 -4.9 4,986 5,253 267 5.4
Jul-17 9,740 8,821 -919 -9.4 5,573 5,857 284 5.1
Aug-17 9,890 8,849 -1,041 -10.5 5,424 5,658 234 4.3
Sep-17 9,610 8,766 -844 -8.8 5,391 5,758 366 6.8
Oct-17 8,490 7,922 -568 -6.7 4,389 4,921 532 12.1
Nov-17 7,040 7,835 795 11.3 3,117 3,466 349 11.2
Dec-17 6,870 7,951 1,081 15.7 3,765 4,194 429 11.4
Jan-18 7,370 7,911 541 7.3 3,708 4,181 473 12.8
Feb-18 6,950 7,889 939 13.5 3,417 3,787 370 10.8
Mar-18 7,000 7,941 941 13.4 3,539 4,019 480 13.6
Annual 9,890 8,880 -1,010 -10.2 51,353 56,029 4,676 9.1
Anticipated month wise power supply position for the year 2017-18
Haryana
Month
Peak Energy
Surplus(+)/
Deficit(-)
Surplus(+)/
Deficit(-)
0
2,000
4,000
6,000
8,000
10,000
12,000
Peak (M
W)
Peak: Demand vs Availability
Demand Availability
0
1,000
2,000
3,000
4,000
5,000
6,000
7,000
En
erg
y (M
U)
Energy: Requirement vs Availability
Requirement Availability
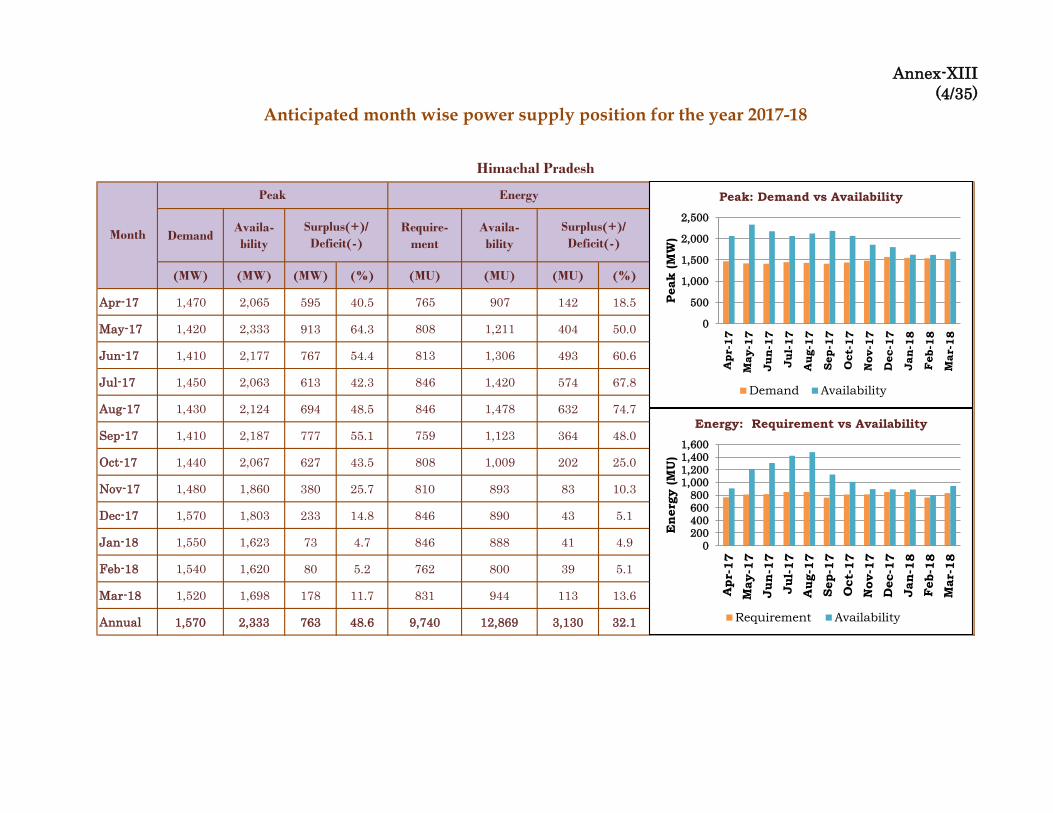
Annex-XIII
(4/35)
DemandAvaila-
bility
Require-
ment
Availa-
bility
(MW) (MW) (MW) (%) (MU) (MU) (MU) (%)
Apr-17 1,470 2,065 595 40.5 765 907 142 18.5
May-17 1,420 2,333 913 64.3 808 1,211 404 50.0
Jun-17 1,410 2,177 767 54.4 813 1,306 493 60.6
Jul-17 1,450 2,063 613 42.3 846 1,420 574 67.8
Aug-17 1,430 2,124 694 48.5 846 1,478 632 74.7
Sep-17 1,410 2,187 777 55.1 759 1,123 364 48.0
Oct-17 1,440 2,067 627 43.5 808 1,009 202 25.0
Nov-17 1,480 1,860 380 25.7 810 893 83 10.3
Dec-17 1,570 1,803 233 14.8 846 890 43 5.1
Jan-18 1,550 1,623 73 4.7 846 888 41 4.9
Feb-18 1,540 1,620 80 5.2 762 800 39 5.1
Mar-18 1,520 1,698 178 11.7 831 944 113 13.6
Annual 1,570 2,333 763 48.6 9,740 12,869 3,130 32.1
Anticipated month wise power supply position for the year 2017-18
Himachal Pradesh
Month
Peak Energy
Surplus(+)/
Deficit(-)
Surplus(+)/
Deficit(-)
0
500
1,000
1,500
2,000
2,500
Peak (M
W)
Peak: Demand vs Availability
Demand Availability
0200400600800
1,0001,2001,4001,600
En
erg
y (M
U)
Energy: Requirement vs Availability
Requirement Availability

Annex-XIII
(5/35)
DemandAvaila-
bility
Require-
ment
Availa-
bility
(MW) (MW) (MW) (%) (MU) (MU) (MU) (%)
Apr-17 2,510 2,177 -333 -13.3 1,503 1,140 -364 -24.2
May-17 2,650 2,143 -507 -19.1 1,618 1,256 -362 -22.4
Jun-17 2,520 2,163 -357 -14.2 1,509 1,320 -190 -12.6
Jul-17 2,450 2,207 -243 -9.9 1,256 997 -259 -20.6
Aug-17 2,410 2,198 -212 -8.8 1,364 1,189 -175 -12.8
Sep-17 2,590 2,273 -317 -12.2 1,426 1,146 -280 -19.6
Oct-17 2,600 2,180 -420 -16.2 1,505 1,177 -328 -21.8
Nov-17 2,550 2,229 -321 -12.6 1,563 1,269 -294 -18.8
Dec-17 2,650 2,357 -293 -11.1 1,674 1,323 -351 -21.0
Jan-18 2,770 2,393 -377 -13.6 1,663 1,384 -279 -16.8
Feb-18 2,720 2,385 -335 -12.3 1,530 1,294 -236 -15.4
Mar-18 2,550 2,279 -271 -10.6 1,522 1,229 -293 -19.3
Annual 2,770 2,393 -377 -13.6 18,133 14,724 -3,409 -18.8
Anticipated month wise power supply position for the year 2017-18
Jammu & Kashmir
Month
Peak Energy
Surplus(+)/
Deficit(-)
Surplus(+)/
Deficit(-)
0
500
1,000
1,500
2,000
2,500
3,000
Peak (M
W)
Peak: Demand vs Availability
Demand Availability
0200400600800
1,0001,2001,4001,6001,800
En
erg
y (M
U)
Energy: Requirement vs Availability
Requirement Availability
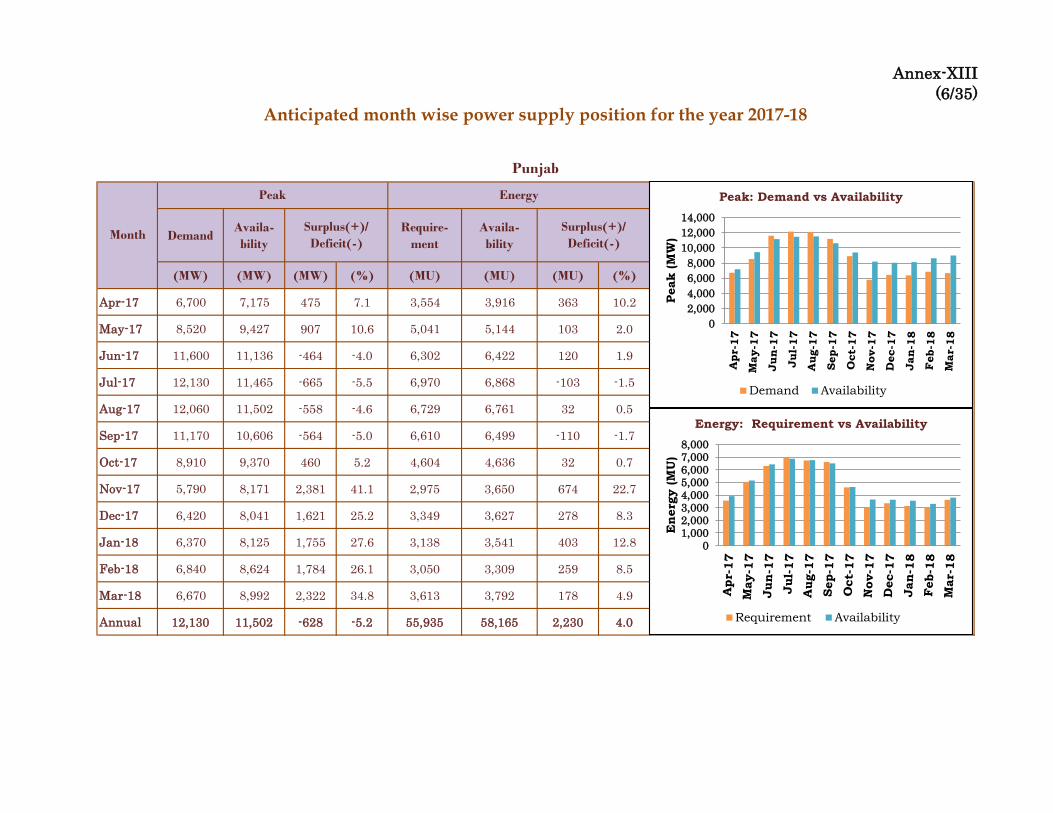
Annex-XIII
(6/35)
DemandAvaila-
bility
Require-
ment
Availa-
bility
(MW) (MW) (MW) (%) (MU) (MU) (MU) (%)
Apr-17 6,700 7,175 475 7.1 3,554 3,916 363 10.2
May-17 8,520 9,427 907 10.6 5,041 5,144 103 2.0
Jun-17 11,600 11,136 -464 -4.0 6,302 6,422 120 1.9
Jul-17 12,130 11,465 -665 -5.5 6,970 6,868 -103 -1.5
Aug-17 12,060 11,502 -558 -4.6 6,729 6,761 32 0.5
Sep-17 11,170 10,606 -564 -5.0 6,610 6,499 -110 -1.7
Oct-17 8,910 9,370 460 5.2 4,604 4,636 32 0.7
Nov-17 5,790 8,171 2,381 41.1 2,975 3,650 674 22.7
Dec-17 6,420 8,041 1,621 25.2 3,349 3,627 278 8.3
Jan-18 6,370 8,125 1,755 27.6 3,138 3,541 403 12.8
Feb-18 6,840 8,624 1,784 26.1 3,050 3,309 259 8.5
Mar-18 6,670 8,992 2,322 34.8 3,613 3,792 178 4.9
Annual 12,130 11,502 -628 -5.2 55,935 58,165 2,230 4.0
Anticipated month wise power supply position for the year 2017-18
Punjab
Month
Peak Energy
Surplus(+)/
Deficit(-)
Surplus(+)/
Deficit(-)
0
2,000
4,000
6,000
8,000
10,000
12,000
14,000
Peak (M
W)
Peak: Demand vs Availability
Demand Availability
01,0002,0003,0004,0005,0006,0007,0008,000
En
erg
y (M
U)
Energy: Requirement vs Availability
Requirement Availability

Annex-XIII
(7/35)
DemandAvaila-
bility
Require-
ment
Availa-
bility
(MW) (MW) (MW) (%) (MU) (MU) (MU) (%)
Apr-17 9,640 11,839 2,199 22.8 5,588 5,963 375 6.7
May-17 10,390 11,528 1,138 11.0 6,381 6,746 365 5.7
Jun-17 10,610 10,972 362 3.4 6,386 6,489 103 1.6
Jul-17 9,880 10,671 791 8.0 5,685 6,353 668 11.8
Aug-17 10,180 11,027 847 8.3 5,219 5,998 778 14.9
Sep-17 11,490 12,274 784 6.8 6,236 6,647 411 6.6
Oct-17 9,650 11,479 1,829 19.0 5,837 6,486 650 11.1
Nov-17 10,200 12,193 1,993 19.5 6,002 6,271 269 4.5
Dec-17 10,950 11,803 853 7.8 6,455 6,590 135 2.1
Jan-18 10,920 12,137 1,217 11.1 6,419 6,768 349 5.4
Feb-18 10,760 12,277 1,517 14.1 5,882 6,140 258 4.4
Mar-18 11,320 12,382 1,062 9.4 6,447 6,840 393 6.1
Annual 11,490 12,382 892 7.8 72,535 77,291 4,756 6.6
Anticipated month wise power supply position for the year 2017-18
Rajasthan
Month
Peak Energy
Surplus(+)/
Deficit(-)
Surplus(+)/
Deficit(-)
0
2,000
4,000
6,000
8,000
10,000
12,000
14,000
Peak (M
W)
Peak: Demand vs Availability
Demand Availability
01,0002,0003,0004,0005,0006,0007,0008,000
En
erg
y (M
U)
Energy: Requirement vs Availability
Requirement Availability

Annex-XIII
(8/35)
DemandAvaila-
bility
Require-
ment
Availa-
bility
(MW) (MW) (MW) (%) (MU) (MU) (MU) (%)
Apr-17 16,390 16,185 -205 -1.3 9,681 10,342 661 6.8
May-17 17,160 17,313 153 0.9 10,391 11,793 1,402 13.5
Jun-17 17,220 17,821 601 3.5 10,806 11,752 946 8.8
Jul-17 17,170 17,786 616 3.6 10,069 12,082 2,013 20.0
Aug-17 16,830 17,866 1,036 6.2 9,998 12,146 2,148 21.5
Sep-17 17,720 17,660 -60 -0.3 10,914 11,605 691 6.3
Oct-17 16,880 16,820 -60 -0.4 9,843 11,439 1,596 16.2
Nov-17 13,030 16,359 3,329 25.5 8,448 10,694 2,246 26.6
Dec-17 16,780 16,483 -297 -1.8 9,083 11,265 2,182 24.0
Jan-18 17,080 16,575 -505 -3.0 9,412 11,308 1,896 20.1
Feb-18 16,330 16,904 574 3.5 8,369 10,406 2,037 24.3
Mar-18 15,210 16,984 1,774 11.7 10,060 11,587 1,527 15.2
Annual 17,720 17,866 146 0.8 117,072 136,419 19,346 16.5
Anticipated month wise power supply position for the year 2017-18
Uttar Pradesh
Month
Peak Energy
Surplus(+)/
Deficit(-)
Surplus(+)/
Deficit(-)
0
5,000
10,000
15,000
20,000
Peak (M
W)
Peak: Demand vs Availability
Demand Availability
0
2,000
4,000
6,000
8,000
10,000
12,000
14,000
En
erg
y (M
U)
Energy: Requirement vs Availability
Requirement Availability

Annex-XIII
(9/35)
DemandAvaila-
bility
Require-
ment
Availa-
bility
(MW) (MW) (MW) (%) (MU) (MU) (MU) (%)
Apr-17 1,930 2,002 72 3.7 1,136 1,122 -14 -1.2
May-17 2,110 2,082 -28 -1.3 1,216 1,234 18 1.5
Jun-17 2,050 1,973 -77 -3.8 1,242 1,217 -25 -2.0
Jul-17 2,220 2,107 -113 -5.1 1,272 1,235 -37 -2.9
Aug-17 2,070 2,070 0 0.0 1,283 1,275 -8 -0.6
Sep-17 2,060 2,101 41 2.0 1,261 1,191 -70 -5.6
Oct-17 1,960 1,850 -110 -5.6 1,174 1,154 -20 -1.7
Nov-17 1,960 1,895 -65 -3.3 1,113 1,123 10 0.9
Dec-17 2,240 2,167 -73 -3.3 1,261 1,213 -48 -3.8
Jan-18 2,210 2,156 -54 -2.4 1,235 1,228 -7 -0.6
Feb-18 2,080 2,014 -66 -3.2 1,099 1,094 -5 -0.5
Mar-18 1,930 1,860 -70 -3.6 1,137 1,122 -15 -1.3
Annual 2,240 2,167 -73 -3.3 14,428 14,207 -221 -1.5
Anticipated month wise power supply position for the year 2017-18
Uttarakhand
Month
Peak Energy
Surplus(+)/
Deficit(-)
Surplus(+)/
Deficit(-)
0
500
1,000
1,500
2,000
2,500
Peak (M
W)
Peak: Demand vs Availability
Demand Availability
0
200
400
600
800
1,000
1,200
1,400
En
erg
y (M
U)
Energy: Requirement vs Availability
Requirement Availability

Annex-XIII
(10/35)
DemandAvaila-
bility
Require-
ment
Availa-
bility
(MW) (MW) (MW) (%) (MU) (MU) (MU) (%)
Apr-17 3,919 4,153 235 6.0 2,387 2,660 273 11.4
May-17 3,597 3,836 238 6.6 2,251 2,558 307 13.6
Jun-17 3,539 3,729 190 5.4 2,010 2,312 302 15.0
Jul-17 3,716 3,874 158 4.3 2,130 2,445 315 14.8
Aug-17 3,763 3,970 207 5.5 2,172 2,556 383 17.7
Sep-17 3,803 4,029 226 5.9 2,204 2,541 337 15.3
Oct-17 3,950 4,037 87 2.2 2,457 2,792 335 13.6
Nov-17 3,711 3,887 176 4.7 2,160 2,609 449 20.8
Dec-17 3,878 4,115 237 6.1 2,190 2,643 453 20.7
Jan-18 3,910 3,994 85 2.2 2,165 2,581 416 19.2
Feb-18 4,161 4,370 209 5.0 2,152 2,641 489 22.7
Mar-18 4,186 4,270 84 2.0 2,449 2,872 422 17.2
Annual 4,186 4,370 184 4.4 26,728 31,209 4,481 16.8
Anticipated month wise power supply position for the year 2017-18
Chhattisgarh
Month
Peak Energy
Surplus(+)/
Deficit(-)
Surplus(+)/
Deficit(-)
0
1,000
2,000
3,000
4,000
5,000
Peak (M
W)
Peak: Demand vs Availability
Demand Availability
0
500
1,000
1,500
2,000
2,500
3,000
3,500
En
erg
y (M
U)
Energy: Requirement vs Availability
Requirement Availability

Annex-XIII
(11/35)
DemandAvaila-
bility
Require-
ment
Availa-
bility
(MW) (MW) (MW) (%) (MU) (MU) (MU) (%)
Apr-17 13,694 14,734 1,041 7.6 8,885 9,717 832 9.4
May-17 14,610 15,213 602 4.1 9,352 10,634 1,282 13.7
Jun-17 14,610 15,111 501 3.4 8,194 10,084 1,890 23.1
Jul-17 14,352 15,006 654 4.6 8,464 9,901 1,437 17.0
Aug-17 12,777 13,732 954 7.5 8,403 9,411 1,009 12.0
Sep-17 14,469 14,747 278 1.9 8,932 9,861 929 10.4
Oct-17 14,140 14,670 530 3.7 9,451 10,055 605 6.4
Nov-17 13,318 14,333 1,015 7.6 8,227 9,592 1,365 16.6
Dec-17 12,989 13,407 419 3.2 8,197 9,172 976 11.9
Jan-18 13,200 13,692 492 3.7 8,234 9,553 1,319 16.0
Feb-18 13,247 13,663 416 3.1 7,857 8,783 926 11.8
Mar-18 14,117 14,670 553 3.9 8,788 10,132 1,344 15.3
Annual 14,610 15,213 602 4.1 102,983 116,897 13,913 13.5
Anticipated month wise power supply position for the year 2017-18
Gujarat
Month
Peak Energy
Surplus(+)/
Deficit(-)
Surplus(+)/
Deficit(-)
0
2,000
4,000
6,000
8,000
10,000
12,000
14,000
16,000
Peak (M
W)
Peak: Demand vs Availability
Demand Availability
0
2,000
4,000
6,000
8,000
10,000
12,000
En
erg
y (M
U)
Energy: Requirement vs Availability
Requirement Availability

Annex-XIII
(12/35)
DemandAvaila-
bility
Require-
ment
Availa-
bility
(MW) (MW) (MW) (%) (MU) (MU) (MU) (%)
Apr-17 8,411 9,936 1,525 18.1 5,441 6,580 1,138 20.9
May-17 8,028 10,487 2,459 30.6 5,743 6,862 1,119 19.5
Jun-17 7,413 9,524 2,111 28.5 5,078 6,180 1,102 21.7
Jul-17 6,841 8,887 2,046 29.9 4,891 5,780 890 18.2
Aug-17 6,886 9,185 2,298 33.4 4,974 6,064 1,090 21.9
Sep-17 8,203 10,983 2,780 33.9 5,848 7,199 1,351 23.1
Oct-17 9,738 12,332 2,594 26.6 7,300 8,088 788 10.8
Nov-17 11,290 12,473 1,184 10.5 7,633 7,919 286 3.8
Dec-17 11,595 12,537 941 8.1 7,842 8,065 224 2.9
Jan-18 10,960 12,523 1,564 14.3 7,302 7,901 599 8.2
Feb-18 10,482 11,856 1,374 13.1 6,199 6,730 531 8.6
Mar-18 9,214 10,961 1,748 19.0 6,136 6,815 679 11.1
Annual 11,595 12,537 941 8.1 74,386 84,183 9,797 13.2
Anticipated month wise power supply position for the year 2017-18
Madhya Pradesh
Month
Peak Energy
Surplus(+)/
Deficit(-)
Surplus(+)/
Deficit(-)
0
2,000
4,000
6,000
8,000
10,000
12,000
14,000
Peak (M
W)
Peak: Demand vs Availability
Demand Availability
01,0002,0003,0004,0005,0006,0007,0008,0009,000
En
erg
y (M
U)
Energy: Requirement vs Availability
Requirement Availability

Annex-XIII
(13/35)
DemandAvaila-
bility
Require-
ment
Availa-
bility
(MW) (MW) (MW) (%) (MU) (MU) (MU) (%)
Apr-17 20,140 23,505 3,365 16.7 12,377 13,605 1,228 9.9
May-17 19,780 23,372 3,592 18.2 12,648 13,914 1,266 10.0
Jun-17 19,000 22,101 3,101 16.3 11,404 13,261 1,857 16.3
Jul-17 17,300 20,642 3,342 19.3 11,450 13,119 1,669 14.6
Aug-17 18,250 21,431 3,181 17.4 11,600 13,638 2,038 17.6
Sep-17 19,780 23,590 3,810 19.3 11,800 13,994 2,194 18.6
Oct-17 20,350 23,765 3,415 16.8 11,850 13,908 2,058 17.4
Nov-17 19,960 22,728 2,768 13.9 11,970 12,966 996 8.3
Dec-17 19,330 22,370 3,040 15.7 12,155 13,692 1,537 12.6
Jan-18 19,600 22,767 3,167 16.2 12,095 13,825 1,730 14.3
Feb-18 20,500 23,109 2,609 12.7 11,829 13,086 1,257 10.6
Mar-18 20,700 23,266 2,566 12.4 13,088 14,044 956 7.3
Annual 20,700 23,765 3,065 14.8 144,266 163,053 18,787 13.0
Anticipated month wise power supply position for the year 2017-18
Maharashtra
Month
Peak Energy
Surplus(+)/
Deficit(-)
Surplus(+)/
Deficit(-)
0
5,000
10,000
15,000
20,000
25,000
Peak (M
W)
Peak: Demand vs Availability
Demand Availability
02,0004,0006,0008,00010,00012,00014,00016,000
En
erg
y (M
U)
Energy: Requirement vs Availability
Requirement Availability

Annex-XIII
(14/35)
DemandAvaila-
bility
Require-
ment
Availa-
bility
(MW) (MW) (MW) (%) (MU) (MU) (MU) (%)
Apr-17 320 332 12 3.6 198 199 1 0.7
May-17 325 333 8 2.5 206 209 3 1.7
Jun-17 325 337 12 3.5 206 209 3 1.7
Jul-17 320 332 12 3.6 203 206 3 1.7
Aug-17 325 342 17 5.1 205 207 2 1.2
Sep-17 330 344 14 4.3 208 210 2 1.2
Oct-17 330 339 9 2.7 205 206 1 0.7
Nov-17 320 329 9 2.8 190 195 5 2.8
Dec-17 315 324 9 2.9 190 198 8 4.4
Jan-18 315 326 11 3.4 195 196 1 0.7
Feb-18 325 334 9 2.8 188 195 7 3.9
Mar-18 330 339 9 2.7 194 202 8 4.3
Annual 330 344 14 4.3 2,388 2,437 49 2.0
Anticipated month wise power supply position for the year 2017-18
Daman & Diu
Month
Peak Energy
Surplus(+)/
Deficit(-)
Surplus(+)/
Deficit(-)
0
50
100
150
200
250
300
350
400
Peak (M
W)
Peak: Demand vs Availability
Demand Availability
0
50
100
150
200
250
En
erg
y (M
U)
Energy: Requirement vs Availability
Requirement Availability

Annex-XIII
(15/35)
DemandAvaila-
bility
Require-
ment
Availa-
bility
(MW) (MW) (MW) (%) (MU) (MU) (MU) (%)
Apr-17 710 721 11 1.6 480 506 26 5.3
May-17 710 718 8 1.1 470 505 35 7.5
Jun-17 715 731 16 2.3 470 507 37 7.8
Jul-17 720 731 11 1.6 475 504 29 6.0
Aug-17 700 731 31 4.5 475 507 32 6.7
Sep-17 700 737 37 5.3 475 511 36 7.5
Oct-17 710 737 27 3.8 485 516 31 6.3
Nov-17 710 737 27 3.8 480 514 34 7.2
Dec-17 705 716 11 1.6 485 523 38 7.9
Jan-18 710 733 23 3.2 485 516 31 6.5
Feb-18 715 737 22 3.1 490 529 39 7.9
Mar-18 715 737 22 3.1 490 538 48 9.9
Annual 720 737 17 2.4 5,760 6,176 416 7.2
Anticipated month wise power supply position for the year 2017-18
Dadra & Nagar Haveli
Month
Peak Energy
Surplus(+)/
Deficit(-)
Surplus(+)/
Deficit(-)
0
100
200
300
400
500
600
700
800
Peak (M
W)
Peak: Demand vs Availability
Demand Availability
0
100
200
300
400
500
600
En
erg
y (M
U)
Energy: Requirement vs Availability
Requirement Availability

Annex-XIII
(16/35)
DemandAvaila-
bility
Require-
ment
Availa-
bility
(MW) (MW) (MW) (%) (MU) (MU) (MU) (%)
Apr-17 580 585 5 0.9 345 357 12 3.5
May-17 585 588 3 0.5 350 363 13 3.8
Jun-17 580 583 3 0.5 345 363 18 5.3
Jul-17 575 588 13 2.3 335 362 27 8.1
Aug-17 570 573 3 0.5 335 347 12 3.6
Sep-17 580 588 8 1.4 340 353 13 4.0
Oct-17 580 584 4 0.7 340 358 18 5.2
Nov-17 585 597 12 2.1 345 364 19 5.4
Dec-17 585 589 4 0.7 340 354 14 4.2
Jan-18 585 588 3 0.5 340 352 12 3.5
Feb-18 585 595 10 1.8 335 353 18 5.4
Mar-18 590 598 8 1.4 350 368 18 5.3
Annual 590 598 8 1.4 4,100 4,295 195 4.8
Anticipated month wise power supply position for the year 2017-18
Goa
Month
Peak Energy
Surplus(+)/
Deficit(-)
Surplus(+)/
Deficit(-)
0
100
200
300
400
500
600
700
Peak (M
W)
Peak: Demand vs Availability
Demand Availability
050100150200250300350400
En
erg
y (M
U)
Energy: Requirement vs Availability
Requirement Availability

Annex-XIII
(17/35)
DemandAvaila-
bility
Require-
ment
Availa-
bility
(MW) (MW) (MW) (%) (MU) (MU) (MU) (%)
Apr-17 7,814 7,678 -136 -1.7 4,895 4,956 61 1.3
May-17 7,586 7,671 85 1.1 4,600 5,169 569 12.4
Jun-17 7,275 7,466 191 2.6 4,531 4,882 351 7.7
Jul-17 7,461 7,464 3 0.0 4,635 5,073 438 9.4
Aug-17 8,202 8,415 213 2.6 5,004 5,588 584 11.7
Sep-17 7,970 8,400 430 5.4 4,648 5,420 772 16.6
Oct-17 7,709 8,147 438 5.7 4,990 5,479 489 9.8
Nov-17 7,555 7,988 433 5.7 4,841 5,143 302 6.2
Dec-17 7,443 8,088 645 8.7 4,430 5,417 987 22.3
Jan-18 7,578 8,111 533 7.0 4,623 5,400 777 16.8
Feb-18 7,725 8,325 600 7.8 4,620 4,978 358 7.7
Mar-18 7,935 8,447 512 6.5 5,136 5,573 437 8.5
Annual 8,202 8,447 245 3.0 56,953 63,079 6,126 10.8
Anticipated month wise power supply position for the year 2017-18
Andhra Pradesh
Month
Peak Energy
Surplus(+)/
Deficit(-)
Surplus(+)/
Deficit(-)
01,0002,0003,0004,0005,0006,0007,0008,0009,000
Peak (M
W)
Peak: Demand vs Availability
Demand Availability
0
1,000
2,000
3,000
4,000
5,000
6,000
En
erg
y (M
U)
Energy: Requirement vs Availability
Requirement Availability
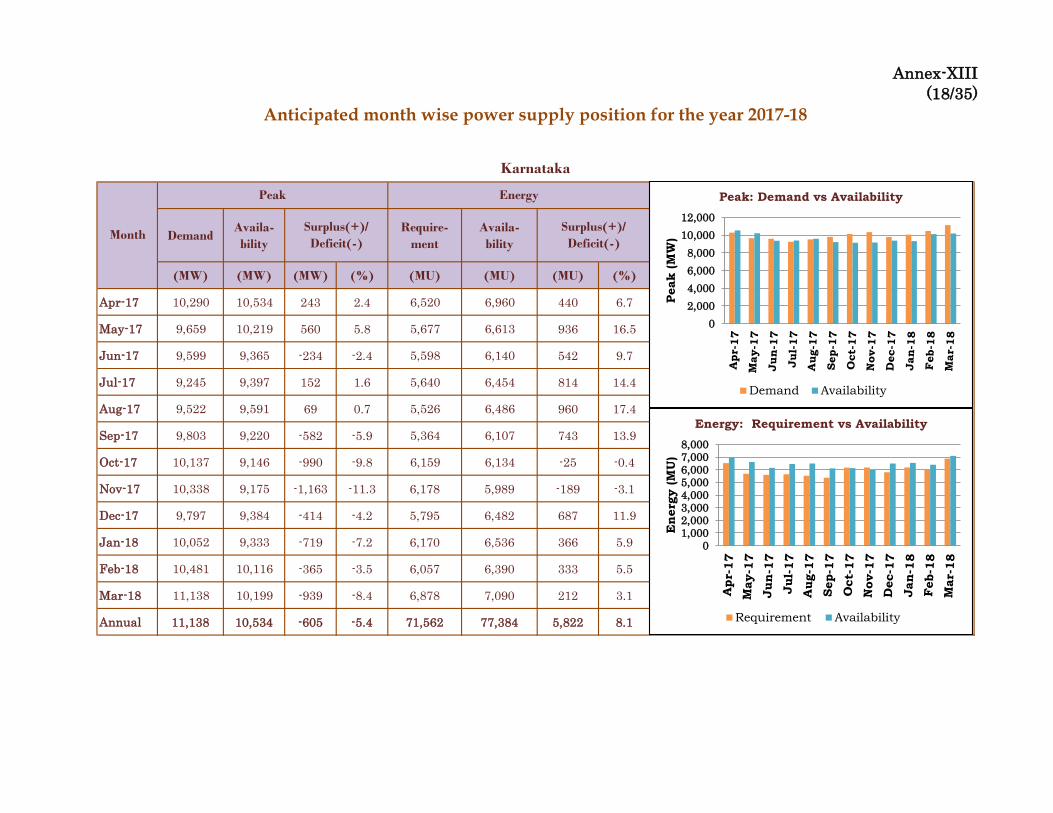
Annex-XIII
(18/35)
DemandAvaila-
bility
Require-
ment
Availa-
bility
(MW) (MW) (MW) (%) (MU) (MU) (MU) (%)
Apr-17 10,290 10,534 243 2.4 6,520 6,960 440 6.7
May-17 9,659 10,219 560 5.8 5,677 6,613 936 16.5
Jun-17 9,599 9,365 -234 -2.4 5,598 6,140 542 9.7
Jul-17 9,245 9,397 152 1.6 5,640 6,454 814 14.4
Aug-17 9,522 9,591 69 0.7 5,526 6,486 960 17.4
Sep-17 9,803 9,220 -582 -5.9 5,364 6,107 743 13.9
Oct-17 10,137 9,146 -990 -9.8 6,159 6,134 -25 -0.4
Nov-17 10,338 9,175 -1,163 -11.3 6,178 5,989 -189 -3.1
Dec-17 9,797 9,384 -414 -4.2 5,795 6,482 687 11.9
Jan-18 10,052 9,333 -719 -7.2 6,170 6,536 366 5.9
Feb-18 10,481 10,116 -365 -3.5 6,057 6,390 333 5.5
Mar-18 11,138 10,199 -939 -8.4 6,878 7,090 212 3.1
Annual 11,138 10,534 -605 -5.4 71,562 77,384 5,822 8.1
Anticipated month wise power supply position for the year 2017-18
Karnataka
Month
Peak Energy
Surplus(+)/
Deficit(-)
Surplus(+)/
Deficit(-)
0
2,000
4,000
6,000
8,000
10,000
12,000
Peak (M
W)
Peak: Demand vs Availability
Demand Availability
01,0002,0003,0004,0005,0006,0007,0008,000
En
erg
y (M
U)
Energy: Requirement vs Availability
Requirement Availability
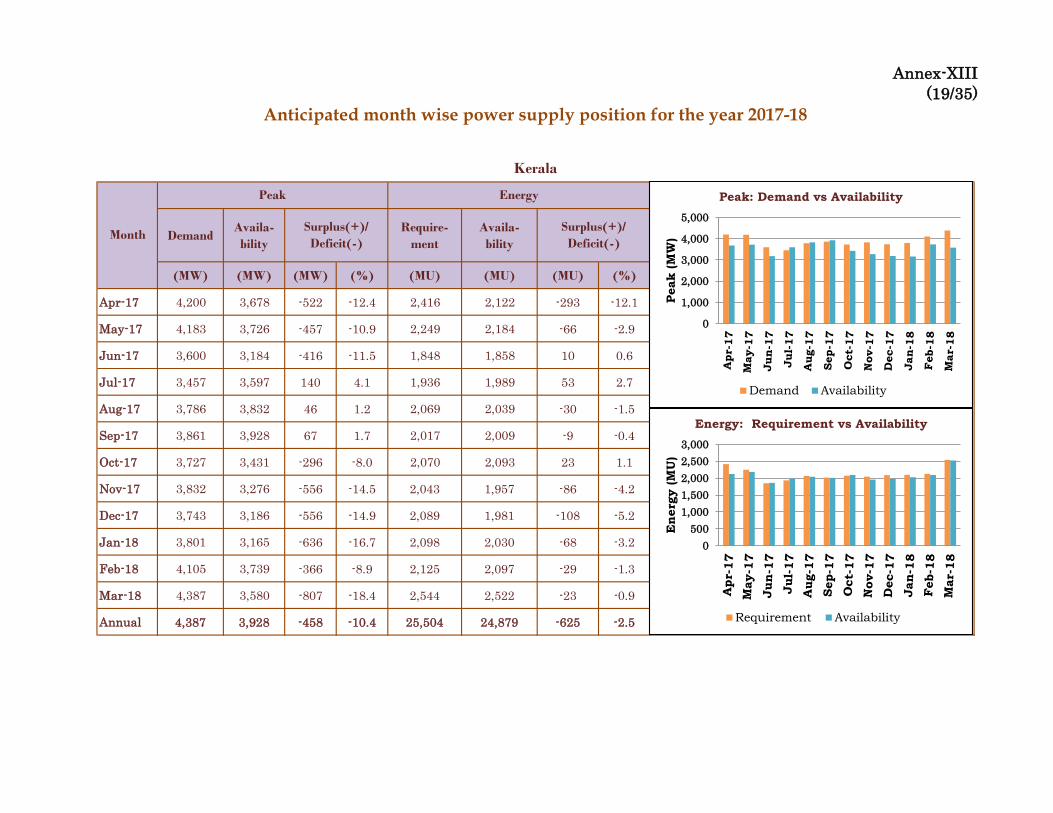
Annex-XIII
(19/35)
DemandAvaila-
bility
Require-
ment
Availa-
bility
(MW) (MW) (MW) (%) (MU) (MU) (MU) (%)
Apr-17 4,200 3,678 -522 -12.4 2,416 2,122 -293 -12.1
May-17 4,183 3,726 -457 -10.9 2,249 2,184 -66 -2.9
Jun-17 3,600 3,184 -416 -11.5 1,848 1,858 10 0.6
Jul-17 3,457 3,597 140 4.1 1,936 1,989 53 2.7
Aug-17 3,786 3,832 46 1.2 2,069 2,039 -30 -1.5
Sep-17 3,861 3,928 67 1.7 2,017 2,009 -9 -0.4
Oct-17 3,727 3,431 -296 -8.0 2,070 2,093 23 1.1
Nov-17 3,832 3,276 -556 -14.5 2,043 1,957 -86 -4.2
Dec-17 3,743 3,186 -556 -14.9 2,089 1,981 -108 -5.2
Jan-18 3,801 3,165 -636 -16.7 2,098 2,030 -68 -3.2
Feb-18 4,105 3,739 -366 -8.9 2,125 2,097 -29 -1.3
Mar-18 4,387 3,580 -807 -18.4 2,544 2,522 -23 -0.9
Annual 4,387 3,928 -458 -10.4 25,504 24,879 -625 -2.5
Anticipated month wise power supply position for the year 2017-18
Kerala
Month
Peak Energy
Surplus(+)/
Deficit(-)
Surplus(+)/
Deficit(-)
0
1,000
2,000
3,000
4,000
5,000
Peak (M
W)
Peak: Demand vs Availability
Demand Availability
0
500
1,000
1,500
2,000
2,500
3,000
En
erg
y (M
U)
Energy: Requirement vs Availability
Requirement Availability

Annex-XIII
(20/35)
DemandAvaila-
bility
Require-
ment
Availa-
bility
(MW) (MW) (MW) (%) (MU) (MU) (MU) (%)
Apr-17 15,165 14,595 -570 -3.8 9,936 9,344 -592 -6.0
May-17 14,948 15,652 704 4.7 9,453 10,131 678 7.2
Jun-17 14,661 16,201 1,540 10.5 9,078 10,477 1,399 15.4
Jul-17 14,750 16,963 2,213 15.0 9,273 11,199 1,926 20.8
Aug-17 14,551 17,392 2,841 19.5 9,500 11,408 1,908 20.1
Sep-17 14,823 17,226 2,402 16.2 9,100 11,145 2,045 22.5
Oct-17 14,798 15,267 470 3.2 9,150 9,486 336 3.7
Nov-17 14,221 13,159 -1,062 -7.5 8,250 8,699 449 5.4
Dec-17 13,600 13,006 -594 -4.4 8,217 8,565 348 4.2
Jan-18 13,974 14,850 877 6.3 8,421 9,201 780 9.3
Feb-18 14,469 14,930 461 3.2 8,508 8,617 109 1.3
Mar-18 14,934 14,965 31 0.2 10,222 9,500 -722 -7.1
Annual 15,165 17,392 2,227 14.7 109,108 117,771 8,663 7.9
Anticipated month wise power supply position for the year 2017-18
Tamil Nadu
Month
Peak Energy
Surplus(+)/
Deficit(-)
Surplus(+)/
Deficit(-)
0
5,000
10,000
15,000
20,000
Peak (M
W)
Peak: Demand vs Availability
Demand Availability
0
2,000
4,000
6,000
8,000
10,000
12,000
En
erg
y (M
U)
Energy: Requirement vs Availability
Requirement Availability
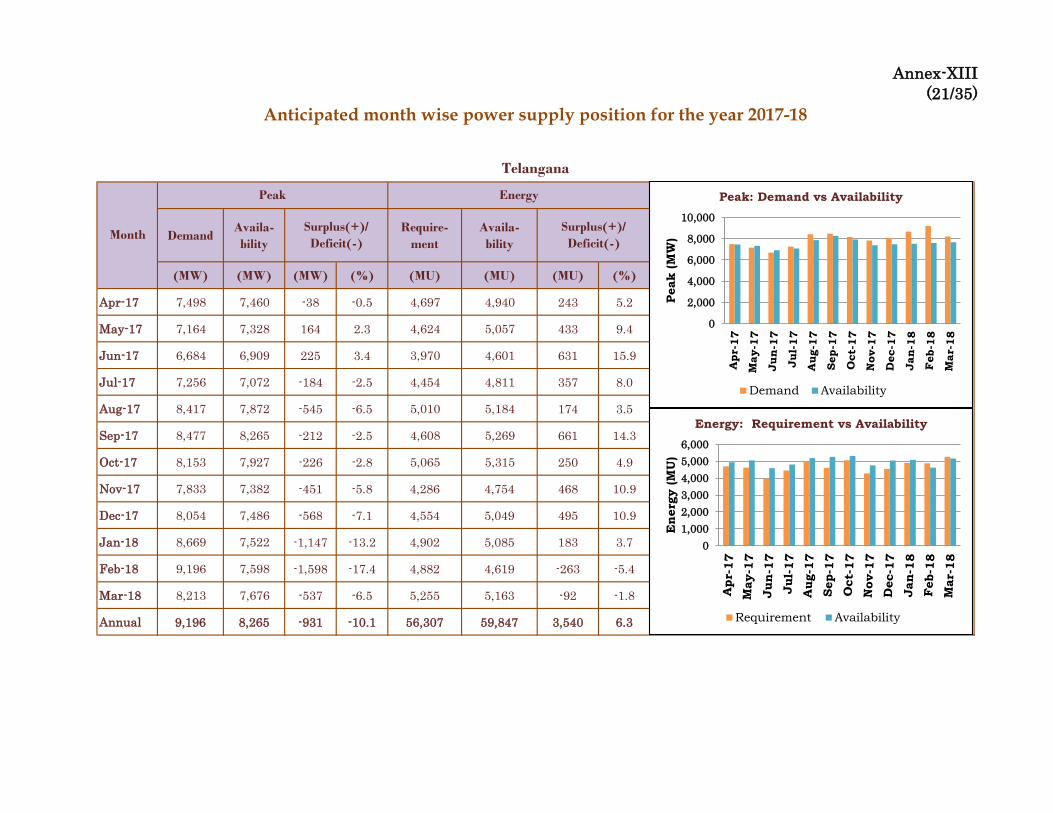
Annex-XIII
(21/35)
DemandAvaila-
bility
Require-
ment
Availa-
bility
(MW) (MW) (MW) (%) (MU) (MU) (MU) (%)
Apr-17 7,498 7,460 -38 -0.5 4,697 4,940 243 5.2
May-17 7,164 7,328 164 2.3 4,624 5,057 433 9.4
Jun-17 6,684 6,909 225 3.4 3,970 4,601 631 15.9
Jul-17 7,256 7,072 -184 -2.5 4,454 4,811 357 8.0
Aug-17 8,417 7,872 -545 -6.5 5,010 5,184 174 3.5
Sep-17 8,477 8,265 -212 -2.5 4,608 5,269 661 14.3
Oct-17 8,153 7,927 -226 -2.8 5,065 5,315 250 4.9
Nov-17 7,833 7,382 -451 -5.8 4,286 4,754 468 10.9
Dec-17 8,054 7,486 -568 -7.1 4,554 5,049 495 10.9
Jan-18 8,669 7,522 -1,147 -13.2 4,902 5,085 183 3.7
Feb-18 9,196 7,598 -1,598 -17.4 4,882 4,619 -263 -5.4
Mar-18 8,213 7,676 -537 -6.5 5,255 5,163 -92 -1.8
Annual 9,196 8,265 -931 -10.1 56,307 59,847 3,540 6.3
Anticipated month wise power supply position for the year 2017-18
Telangana
Month
Peak Energy
Surplus(+)/
Deficit(-)
Surplus(+)/
Deficit(-)
0
2,000
4,000
6,000
8,000
10,000
Peak (M
W)
Peak: Demand vs Availability
Demand Availability
0
1,000
2,000
3,000
4,000
5,000
6,000
En
erg
y (M
U)
Energy: Requirement vs Availability
Requirement Availability
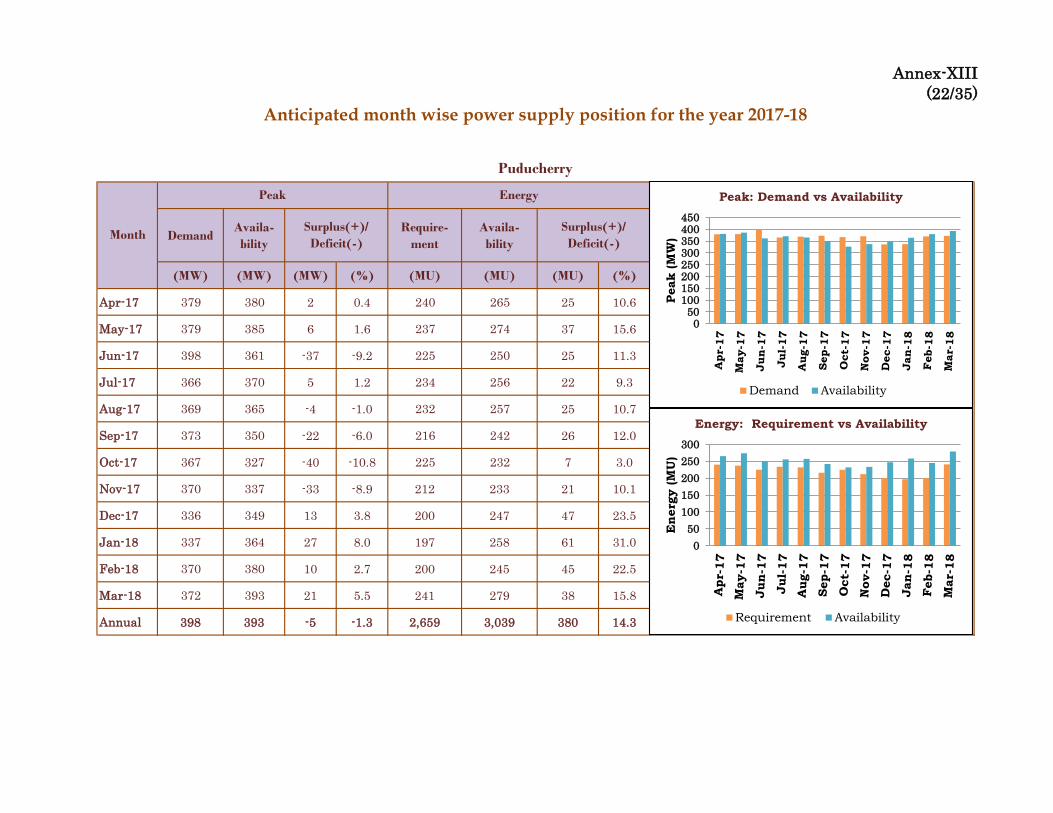
Annex-XIII
(22/35)
DemandAvaila-
bility
Require-
ment
Availa-
bility
(MW) (MW) (MW) (%) (MU) (MU) (MU) (%)
Apr-17 379 380 2 0.4 240 265 25 10.6
May-17 379 385 6 1.6 237 274 37 15.6
Jun-17 398 361 -37 -9.2 225 250 25 11.3
Jul-17 366 370 5 1.2 234 256 22 9.3
Aug-17 369 365 -4 -1.0 232 257 25 10.7
Sep-17 373 350 -22 -6.0 216 242 26 12.0
Oct-17 367 327 -40 -10.8 225 232 7 3.0
Nov-17 370 337 -33 -8.9 212 233 21 10.1
Dec-17 336 349 13 3.8 200 247 47 23.5
Jan-18 337 364 27 8.0 197 258 61 31.0
Feb-18 370 380 10 2.7 200 245 45 22.5
Mar-18 372 393 21 5.5 241 279 38 15.8
Annual 398 393 -5 -1.3 2,659 3,039 380 14.3
Anticipated month wise power supply position for the year 2017-18
Puducherry
Month
Peak Energy
Surplus(+)/
Deficit(-)
Surplus(+)/
Deficit(-)
050100150200250300350400450
Peak (M
W)
Peak: Demand vs Availability
Demand Availability
0
50
100
150
200
250
300
En
erg
y (M
U)
Energy: Requirement vs Availability
Requirement Availability

Annex-XIII
(23/35)
DemandAvaila-
bility
Require-
ment
Availa-
bility
(MW) (MW) (MW) (%) (MU) (MU) (MU) (%)
Apr-17 3,800 3,149 -651 -17.1 2,150 1,683 -467 -21.7
May-17 3,800 3,196 -604 -15.9 2,200 1,805 -395 -18.0
Jun-17 3,900 3,494 -406 -10.4 2,250 1,864 -386 -17.1
Jul-17 3,900 3,170 -730 -18.7 2,250 1,941 -309 -13.7
Aug-17 3,900 3,134 -766 -19.6 2,250 1,894 -356 -15.8
Sep-17 3,900 3,206 -694 -17.8 2,250 1,868 -382 -17.0
Oct-17 4,000 3,106 -894 -22.4 2,300 1,817 -483 -21.0
Nov-17 3,900 3,024 -876 -22.5 2,250 1,599 -651 -28.9
Dec-17 3,800 2,988 -812 -21.4 2,200 1,700 -500 -22.7
Jan-18 3,800 3,034 -766 -20.2 2,200 1,736 -464 -21.1
Feb-18 3,900 3,065 -835 -21.4 2,000 1,543 -457 -22.8
Mar-18 4,000 3,201 -799 -20.0 2,300 1,758 -542 -23.6
Annual 4,000 3,494 -506 -12.7 26,600 21,207 -5,393 -20.3
Anticipated month wise power supply position for the year 2017-18
Bihar
Month
Peak Energy
Surplus(+)/
Deficit(-)
Surplus(+)/
Deficit(-)
0500
1,0001,5002,0002,5003,0003,5004,0004,500
Peak (M
W)
Peak: Demand vs Availability
Demand Availability
0
500
1,000
1,500
2,000
2,500
En
erg
y (M
U)
Energy: Requirement vs Availability
Requirement Availability

Annex-XIII
(24/35)
DemandAvaila-
bility
Require-
ment
Availa-
bility
(MW) (MW) (MW) (%) (MU) (MU) (MU) (%)
Apr-17 2,760 4,030 1,270 46.0 1,656 2,005 349 21.1
May-17 2,760 4,144 1,384 50.1 1,681 2,082 401 23.8
Jun-17 2,770 4,286 1,516 54.7 1,658 2,119 461 27.8
Jul-17 2,780 4,210 1,430 51.5 1,726 2,155 429 24.8
Aug-17 2,640 3,996 1,356 51.3 1,634 2,058 424 25.9
Sep-17 2,720 3,995 1,275 46.9 1,631 2,005 374 22.9
Oct-17 2,720 4,211 1,491 54.8 1,687 2,169 482 28.6
Nov-17 2,750 4,110 1,360 49.4 1,652 2,054 402 24.4
Dec-17 2,760 3,913 1,153 41.8 1,712 2,022 310 18.1
Jan-18 2,770 3,921 1,151 41.6 1,717 2,006 289 16.9
Feb-18 2,770 4,080 1,310 47.3 1,553 1,816 263 16.9
Mar-18 2,800 4,049 1,249 44.6 1,734 2,071 337 19.4
Annual 2,800 4,286 1,486 53.1 20,041 24,562 4,521 22.6
Anticipated month wise power supply position for the year 2017-18
Damodar Valley Corporation
Month
Peak Energy
Surplus(+)/
Deficit(-)
Surplus(+)/
Deficit(-)
0
1,000
2,000
3,000
4,000
5,000
Peak (M
W)
Peak: Demand vs Availability
Demand Availability
0
500
1,000
1,500
2,000
2,500
En
erg
y (M
U)
Energy: Requirement vs Availability
Requirement Availability

Annex-XIII
(25/35)
DemandAvaila-
bility
Require-
ment
Availa-
bility
(MW) (MW) (MW) (%) (MU) (MU) (MU) (%)
Apr-17 1,220 958 -262 -21.5 800 551 -249 -31.1
May-17 1,250 990 -260 -20.8 810 599 -211 -26.0
Jun-17 1,280 1,018 -262 -20.5 815 579 -236 -29.0
Jul-17 1,300 1,050 -250 -19.2 790 611 -179 -22.7
Aug-17 1,280 1,102 -178 -13.9 770 644 -126 -16.3
Sep-17 1,280 1,106 -174 -13.6 760 644 -116 -15.2
Oct-17 1,300 1,047 -253 -19.4 800 616 -184 -23.0
Nov-17 1,280 986 -294 -23.0 780 553 -227 -29.1
Dec-17 1,250 911 -339 -27.1 800 554 -246 -30.8
Jan-18 1,250 908 -342 -27.4 800 566 -234 -29.3
Feb-18 1,250 941 -309 -24.7 750 511 -239 -31.9
Mar-18 1,260 982 -278 -22.1 810 578 -232 -28.7
Annual 1,300 1,106 -194 -14.9 9,485 7,005 -2,480 -26.1
Anticipated month wise power supply position for the year 2017-18
Jharkhand
Month
Peak Energy
Surplus(+)/
Deficit(-)
Surplus(+)/
Deficit(-)
0
200
400
600
800
1,000
1,200
1,400
Peak (M
W)
Peak: Demand vs Availability
Demand Availability
0100200300400500600700800900
En
erg
y (M
U)
Energy: Requirement vs Availability
Requirement Availability

Annex-XIII
(26/35)
DemandAvaila-
bility
Require-
ment
Availa-
bility
(MW) (MW) (MW) (%) (MU) (MU) (MU) (%)
Apr-17 4,400 4,408 8 0.2 2,520 2,579 59 2.3
May-17 4,450 4,506 56 1.3 2,641 2,725 84 3.2
Jun-17 4,400 4,444 44 1.0 2,520 2,549 29 1.1
Jul-17 4,350 4,386 36 0.8 2,567 2,818 251 9.8
Aug-17 4,350 4,682 332 7.6 2,567 2,805 238 9.3
Sep-17 4,300 4,745 445 10.3 2,484 2,960 476 19.2
Oct-17 4,200 4,258 58 1.4 2,492 2,778 286 11.5
Nov-17 4,200 4,206 6 0.1 2,412 2,379 -33 -1.4
Dec-17 4,000 4,154 154 3.8 2,418 2,320 -98 -4.1
Jan-18 4,000 4,088 88 2.2 2,418 2,422 4 0.2
Feb-18 4,000 4,132 132 3.3 2,184 2,222 38 1.8
Mar-18 4,200 4,307 107 2.5 2,492 2,525 33 1.3
Annual 4,450 4,745 295 6.6 29,715 31,081 1,366 4.6
Anticipated month wise power supply position for the year 2017-18
Odisha
Month
Peak Energy
Surplus(+)/
Deficit(-)
Surplus(+)/
Deficit(-)
0
1,000
2,000
3,000
4,000
5,000
Peak (M
W)
Peak: Demand vs Availability
Demand Availability
0
500
1,000
1,500
2,000
2,500
3,000
3,500
En
erg
y (M
U)
Energy: Requirement vs Availability
Requirement Availability

Annex-XIII
(27/35)
DemandAvaila-
bility
Require-
ment
Availa-
bility
(MW) (MW) (MW) (%) (MU) (MU) (MU) (%)
Apr-17 8,570 9,061 491 5.7 4,989 4,827 -162 -3.3
May-17 8,350 8,892 542 6.5 4,843 4,818 -25 -0.5
Jun-17 8,365 9,022 657 7.9 4,669 4,769 100 2.1
Jul-17 8,340 8,520 180 2.2 4,780 4,826 46 1.0
Aug-17 8,315 8,551 236 2.8 4,746 4,842 96 2.0
Sep-17 8,470 8,714 244 2.9 4,628 4,814 186 4.0
Oct-17 8,245 8,432 187 2.3 4,430 4,612 182 4.1
Nov-17 7,375 7,601 226 3.1 3,575 3,918 343 9.6
Dec-17 7,140 7,291 151 2.1 3,563 3,744 181 5.1
Jan-18 7,200 7,560 360 5.0 3,781 3,977 196 5.2
Feb-18 7,675 8,172 497 6.5 3,702 3,823 121 3.3
Mar-18 8,530 9,006 476 5.6 4,726 4,693 -33 -0.7
Annual 8,570 9,061 491 5.7 52,432 53,662 1,230 2.3
Anticipated month wise power supply position for the year 2017-18
West Bengal
Month
Peak Energy
Surplus(+)/
Deficit(-)
Surplus(+)/
Deficit(-)
0
2,000
4,000
6,000
8,000
10,000
Peak (M
W)
Peak: Demand vs Availability
Demand Availability
0
1,000
2,000
3,000
4,000
5,000
6,000
En
erg
y (M
U)
Energy: Requirement vs Availability
Requirement Availability

Annex-XIII
(28/35)
DemandAvaila-
bility
Require-
ment
Availa-
bility
(MW) (MW) (MW) (%) (MU) (MU) (MU) (%)
Apr-17 85 132 47 55.8 34 72 38 110.8
May-17 85 153 68 79.9 35 91 56 162.3
Jun-17 85 179 95 111.5 32 102 70 214.5
Jul-17 85 163 78 92.0 34 109 75 217.1
Aug-17 85 164 79 92.9 33 110 77 237.1
Sep-17 85 162 78 91.5 34 106 72 210.7
Oct-17 85 140 56 65.7 35 91 56 161.5
Nov-17 85 118 33 39.4 37 66 28 75.8
Dec-17 90 85 -5 -5.3 38 53 14 38.0
Jan-18 90 84 -6 -6.5 38 52 14 35.6
Feb-18 90 99 9 10.3 35 50 15 42.4
Mar-18 90 127 37 40.9 38 67 29 75.9
Annual 90 179 89 99.1 423 967 543 128.3
Anticipated month wise power supply position for the year 2017-18
Sikkim
Month
Peak Energy
Surplus(+)/
Deficit(-)
Surplus(+)/
Deficit(-)
0
50
100
150
200
Peak (M
W)
Peak: Demand vs Availability
Demand Availability
0
20
40
60
80
100
120
En
erg
y (M
U)
Energy: Requirement vs Availability
Requirement Availability

Annex-XIII
(29/35)
DemandAvaila-
bility
Require-
ment
Availa-
bility
(MW) (MW) (MW) (%) (MU) (MU) (MU) (%)
Apr-17 155 140 -15 -9.9 155 140 -15 -9.9
May-17 129 147 18 13.8 129 147 18 13.8
Jun-17 144 152 8 5.7 144 152 8 5.7
Jul-17 150 143 -7 -4.6 150 143 -7 -4.6
Aug-17 151 152 1 0.5 151 152 1 0.5
Sep-17 144 150 6 4.1 144 150 6 4.1
Oct-17 129 151 22 16.7 129 151 22 16.7
Nov-17 128 144 16 12.2 128 144 16 12.2
Dec-17 132 123 -10 -7.2 132 123 -10 -7.2
Jan-18 123 138 14 11.7 123 138 14 11.7
Feb-18 153 111 -42 -27.5 153 111 -42 -27.5
Mar-18 158 125 -32 -20.6 158 125 -32 -20.6
Annual 158 152 -5 -3.4 1,696 1,674 -22 -1.3
Anticipated month wise power supply position for the year 2017-18
Arunachal Pradesh
Month
Peak Energy
Surplus(+)/
Deficit(-)
Surplus(+)/
Deficit(-)
020406080100120140160180
Peak (M
W)
Peak: Demand vs Availability
Demand Availability
020406080100120140160180
En
erg
y (M
U)
Energy: Requirement vs Availability
Requirement Availability

Annex-XIII
(30/35)
DemandAvaila-
bility
Require-
ment
Availa-
bility
(MW) (MW) (MW) (%) (MU) (MU) (MU) (%)
Apr-17 1,516 1,260 -255 -16.9 658 613 -45 -6.9
May-17 1,512 1,322 -190 -12.5 777 681 -96 -12.3
Jun-17 1,662 1,379 -283 -17.0 927 762 -165 -17.8
Jul-17 1,626 1,266 -361 -22.2 829 835 5 0.7
Aug-17 1,831 1,370 -461 -25.2 1,068 844 -224 -20.9
Sep-17 1,653 1,347 -306 -18.5 945 832 -113 -12.0
Oct-17 1,702 1,355 -347 -20.4 882 764 -118 -13.4
Nov-17 1,678 1,295 -382 -22.8 746 656 -90 -12.1
Dec-17 1,513 1,238 -275 -18.2 711 645 -66 -9.3
Jan-18 1,613 1,252 -361 -22.4 752 631 -121 -16.1
Feb-18 1,538 1,169 -369 -24.0 647 555 -93 -14.3
Mar-18 1,565 1,221 -344 -22.0 686 617 -69 -10.1
Annual 1,831 1,379 -452 -24.7 9,628 8,434 -1,194 -12.4
Anticipated month wise power supply position for the year 2017-18
Assam
Month
Peak Energy
Surplus(+)/
Deficit(-)
Surplus(+)/
Deficit(-)
0
500
1,000
1,500
2,000
Peak (M
W)
Peak: Demand vs Availability
Demand Availability
0
200
400
600
800
1,000
1,200
En
erg
y (M
U)
Energy: Requirement vs Availability
Requirement Availability

Annex-XIII
(31/35)
DemandAvaila-
bility
Require-
ment
Availa-
bility
(MW) (MW) (MW) (%) (MU) (MU) (MU) (%)
Apr-17 170 174 4 2.6 83 75 -9 -10.3
May-17 130 178 48 36.5 73 93 19 26.3
Jun-17 130 188 58 44.9 70 103 33 46.5
Jul-17 140 175 35 25.3 74 122 48 64.5
Aug-17 140 189 49 34.9 75 124 49 65.4
Sep-17 150 185 35 23.3 80 120 41 51.1
Oct-17 160 187 27 16.6 86 112 26 30.1
Nov-17 170 178 8 4.8 91 97 6 6.4
Dec-17 200 156 -44 -22.0 102 92 -10 -9.7
Jan-18 210 163 -47 -22.6 108 88 -20 -18.2
Feb-18 200 158 -42 -21.1 93 74 -19 -20.6
Mar-18 190 169 -21 -11.2 96 76 -20 -20.4
Annual 210 189 -21 -10.1 1,032 1,176 144 14.0
Anticipated month wise power supply position for the year 2017-18
Manipur
Month
Peak Energy
Surplus(+)/
Deficit(-)
Surplus(+)/
Deficit(-)
0
50
100
150
200
250
Peak (M
W)
Peak: Demand vs Availability
Demand Availability
0
20
40
60
80
100
120
140
En
erg
y (M
U)
Energy: Requirement vs Availability
Requirement Availability

Annex-XIII
(32/35)
DemandAvaila-
bility
Require-
ment
Availa-
bility
(MW) (MW) (MW) (%) (MU) (MU) (MU) (%)
Apr-17 311 468 157 50.5 121 130 9 7.9
May-17 310 486 176 56.7 131 174 43 32.8
Jun-17 339 572 233 68.9 143 217 74 51.6
Jul-17 319 552 233 73.2 150 275 124 82.5
Aug-17 298 571 273 91.8 139 293 154 110.0
Sep-17 301 563 262 87.1 142 296 153 107.6
Oct-17 330 567 237 71.8 151 240 89 58.7
Nov-17 319 477 157 49.3 138 172 33 24.2
Dec-17 324 463 140 43.2 146 154 7 5.0
Jan-18 346 471 126 36.3 153 142 -11 -7.4
Feb-18 330 456 126 38.3 160 129 -31 -19.3
Mar-18 328 467 138 42.2 144 134 -9 -6.5
Annual 346 572 227 65.6 1,720 2,355 635 36.9
Anticipated month wise power supply position for the year 2017-18
Meghalaya
Month
Peak Energy
Surplus(+)/
Deficit(-)
Surplus(+)/
Deficit(-)
0
100
200
300
400
500
600
700
Peak (M
W)
Peak: Demand vs Availability
Demand Availability
0
50
100
150
200
250
300
350
En
erg
y (M
U)
Energy: Requirement vs Availability
Requirement Availability

Annex-XIII
(33/35)
DemandAvaila-
bility
Require-
ment
Availa-
bility
(MW) (MW) (MW) (%) (MU) (MU) (MU) (%)
Apr-17 91 158 67 73.0 45 46 0 0.7
May-17 97 157 60 62.0 41 51 10 25.1
Jun-17 87 164 77 88.6 40 58 18 45.7
Jul-17 88 155 67 76.4 43 65 21 48.9
Aug-17 91 165 73 80.5 43 65 22 50.9
Sep-17 101 154 53 52.5 37 63 26 68.9
Oct-17 105 160 55 52.9 41 57 17 40.5
Nov-17 107 155 49 45.6 44 49 6 12.8
Dec-17 107 152 45 42.3 52 48 -4 -8.6
Jan-18 108 156 48 44.8 52 47 -6 -11.1
Feb-18 105 149 44 42.3 45 41 -4 -8.4
Mar-18 100 154 54 53.9 46 46 -1 -1.5
Annual 108 165 57 52.9 531 636 105 19.8
Anticipated month wise power supply position for the year 2017-18
Mizoram
Month
Peak Energy
Surplus(+)/
Deficit(-)
Surplus(+)/
Deficit(-)
020406080100120140160180
Peak (M
W)
Peak: Demand vs Availability
Demand Availability
0
10
20
30
40
50
60
70
En
erg
y (M
U)
Energy: Requirement vs Availability
Requirement Availability

Annex-XIII
(34/35)
DemandAvaila-
bility
Require-
ment
Availa-
bility
(MW) (MW) (MW) (%) (MU) (MU) (MU) (%)
Apr-17 117 107 -11 -9.2 58 51 -7 -11.5
May-17 110 151 41 37.1 60 60 0 0.5
Jun-17 131 162 31 23.8 65 77 12 18.9
Jul-17 132 153 21 15.6 72 90 18 25.4
Aug-17 125 161 36 29.0 75 92 17 22.1
Sep-17 131 159 28 21.4 75 89 14 19.2
Oct-17 134 160 26 19.7 75 80 5 6.4
Nov-17 129 148 18 14.3 64 64 0 0.1
Dec-17 140 130 -10 -7.4 66 60 -7 -10.3
Jan-18 126 134 8 6.3 70 56 -14 -20.2
Feb-18 149 131 -18 -12.1 49 49 -1 -1.3
Mar-18 136 140 3 2.5 55 53 -2 -4.4
Annual 149 162 13 8.4 785 821 36 4.6
Anticipated month wise power supply position for the year 2017-18
Nagaland
Month
Peak Energy
Surplus(+)/
Deficit(-)
Surplus(+)/
Deficit(-)
020406080100120140160180
Peak (M
W)
Peak: Demand vs Availability
Demand Availability
0
20
40
60
80
100
En
erg
y (M
U)
Energy: Requirement vs Availability
Requirement Availability

Annex-XIII
(35/35)
DemandAvaila-
bility
Require-
ment
Availa-
bility
(MW) (MW) (MW) (%) (MU) (MU) (MU) (%)
Apr-17 299 312 13 4.4 91 187 96 104.7
May-17 277 311 34 12.1 116 200 84 71.8
Jun-17 303 324 21 7.0 121 205 84 69.4
Jul-17 285 314 29 10.2 122 219 97 79.6
Aug-17 292 325 34 11.6 128 219 91 70.8
Sep-17 305 299 -5 -1.8 125 213 88 70.0
Oct-17 312 314 1 0.5 140 210 69 49.4
Nov-17 269 307 38 14.1 100 195 95 95.6
Dec-17 253 304 51 20.1 102 198 95 93.0
Jan-18 246 310 63 25.7 115 195 80 69.2
Feb-18 245 305 60 24.5 102 174 72 69.9
Mar-18 280 313 33 11.9 99 193 94 94.8
Annual 312 325 13 4.1 1,364 2,408 1,044 76.6
Anticipated month wise power supply position for the year 2017-18
Tripura
Month
Peak Energy
Surplus(+)/
Deficit(-)
Surplus(+)/
Deficit(-)
0
50
100
150
200
250
300
350
Peak (M
W)
Peak: Demand vs Availability
Demand Availability
0
50
100
150
200
250
En
erg
y (M
U)
Energy: Requirement vs Availability
Requirement Availability

EXHIBIT

*Anticipated
Exhibit - I(A)
Pattern of Peak Demand & Energy Requirement
All India
110,000
120,000
130,000
140,000
150,000
160,000
170,000
180,000
Pe
ak (
MW
)
Peak Demand
2012-13
2013-14
2014-15
2015-16
2016-17
2017-18*
60,000
65,000
70,000
75,000
80,000
85,000
90,000
95,000
100,000
105,000
110,000
En
ergy (
MU
)
Energy Requirement
2012-13
2013-14
2014-15
2015-16
2016-17
2017-18*
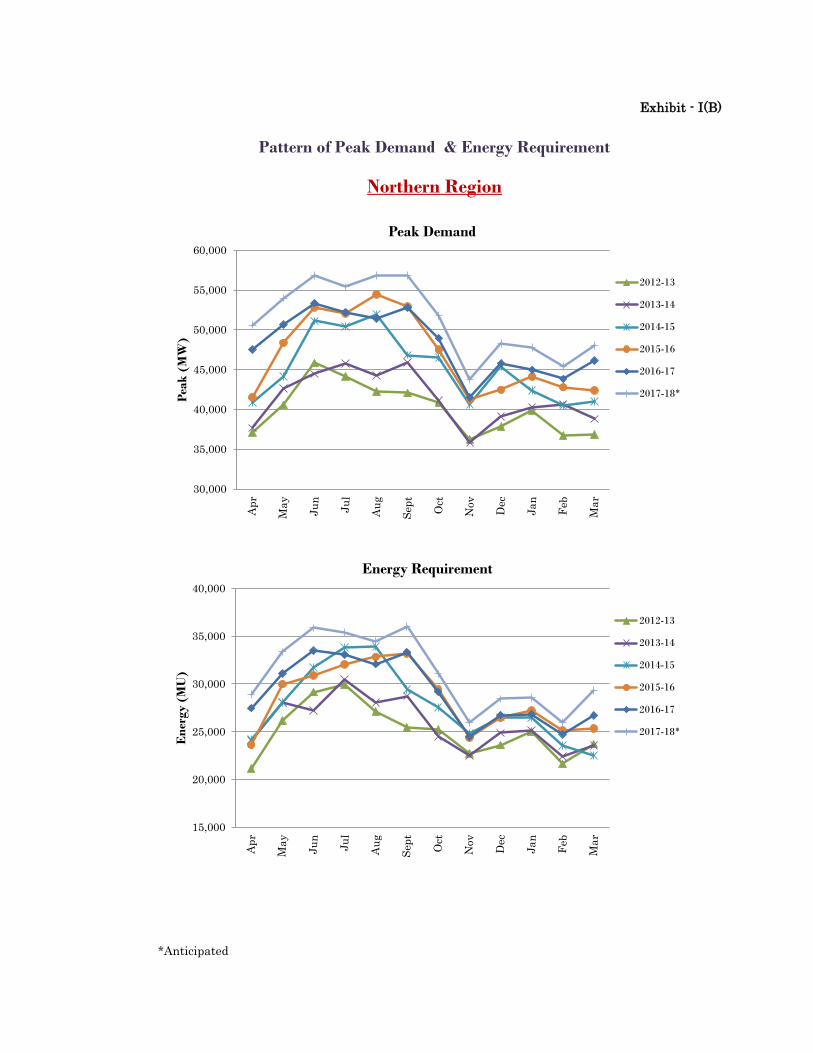
*Anticipated
Exhibit - I(B)
Pattern of Peak Demand & Energy Requirement
Northern Region
30,000
35,000
40,000
45,000
50,000
55,000
60,000
Pea
k (
MW
)
Peak Demand
2012-13
2013-14
2014-15
2015-16
2016-17
2017-18*
15,000
20,000
25,000
30,000
35,000
40,000
En
ergy (
MU
)
Energy Requirement
2012-13
2013-14
2014-15
2015-16
2016-17
2017-18*

*Anticipated
Exhibit - I(C)
Pattern of Peak Demand & Energy Requirement
Western Region
30,000
32,000
34,000
36,000
38,000
40,000
42,000
44,000
46,000
48,000
50,000
Pea
k (
MW
)
Peak Demand
2012-13
2013-14
2014-15
2015-16
2016-17
2017-18*
15,000
17,000
19,000
21,000
23,000
25,000
27,000
29,000
31,000
33,000
35,000
En
ergy (
MU
)
Energy Requirement
2012-13
2013-14
2014-15
2015-16
2016-17
2017-18*

*Anticipated
Exhibit - I(D)
Pattern of Peak Demand & Energy Requirement
Southern Region
25,000
30,000
35,000
40,000
45,000
50,000
Pea
k (
MW
)
Peak Demand
2012-13
2013-14
2014-15
2015-16
2016-17
2017-18*
15,000
17,000
19,000
21,000
23,000
25,000
27,000
29,000
31,000
33,000
En
ergy (
MU
)
Energy Requirement
2012-13
2013-14
2014-15
2015-16
2016-17
2017-18*

*Anticipated
Exhibit - I(E)
Pattern of Peak Demand & Energy Requirement
Eastern Region
10,000
12,000
14,000
16,000
18,000
20,000
22,000
24,000
Pea
k (
MW
)
Peak Demand
2012-13
2013-14
2014-15
2015-16
2016-17
2017-18*
6,000
7,000
8,000
9,000
10,000
11,000
12,000
13,000
14,000
En
ergy (
MU
)
Energy Requirement
2012-13
2013-14
2014-15
2015-16
2016-17
2017-18*

*Anticipated
Exhibit - I(F)
Pattern of Peak Demand & Energy Requirement
Northern-Eastern Region
1,500
1,700
1,900
2,100
2,300
2,500
2,700
2,900
Pea
k (
MW
)
Peak Demand
2012-13
2013-14
2014-15
2015-16
2016-17
2017-18*
600
800
1,000
1,200
1,400
1,600
1,800
En
ergy (
MU
)
Energy Requirement
2012-13
2013-14
2014-15
2015-16
2016-17
2017-18*