the lng industry - giignl.org · we hope you will find our report a helpful tool in your ......
TRANSCRIPT

The LNG Industry
2014

The LNG Industry in 2014Editorial
Dear Colleagues,
As we have been commemorating in 2014 the 50th anniversary of commercial LNG deliveries, our
industry is facing more opportunities and challenges than ever.
In the main, the global LNG industry can look back on 2014 as another year of relative stagnation with LNG trade reaching 239.2 MMT, a 1% increase over 2013, but just below 2011 levels. Although one new liquefaction plant came on stream in May in Papua New Guinea and one expansion train started producing in Algeria , disappointments in Angola and Egypt and slowdown in Qatar limited the volume of additional LNG supply. Low demand in South Korea as well as slower than expected growth in China contributed to loosen the market tightness observed in recent years, foreboding the return of a buyers’ market as the year progressed.
Other highlights in the past year’s review of LNG imports are the remarkable gain in India, ahead of the U.K and Japan’s demand increase , and the arrival of Lithuania as the world’s 30th importer with a floating storage and regasification unit (FSRU). On the supply side, Queensland Curtis was on the brink at year-end of joining the producers’ rank and managed to load its first cargo in December. Nigeria showed the second largest addition of supply (after PNG) attributable to a much improved feed-gas supply.
During the second half of the year a sharp decrease in crude oil prices combined with a looser supply situation in the Pacific drove down prices in Asia, where spot prices were halved between March and October of last year. On the supply side, this price drop in Asia will inevitably slow down or defer development of expensive new supply projects. On the demand side, it has begun to translate into the return of flexible LNG cargoes to Europe, where spot prices have been disconnected from oil prices for some time.
In this context of demand and price uncertainty, traditional procurement models are changing , as new players with different business models emerge, new procurement alliances are being formed and new commercial offerings are being structured; all mainly in the pursuit of enhanced flexibility both in terms of destination and pricing. LNG players’ quest for flexible volumes and volume risk mitigation has contributed to a multiplication of portfolio deals last year, mainly for short to medium-term durations. In parallel, the addition of flexible quantities with a lengthening of trade voyages and the entry of new players results in the need for an expansion of the LNG fleet - with 77 new orders
placed in 2014 - compared to a total fleet of 421 at year-end.
Meanwhile, the Ukraine-Russia crisis and the start-up of six new regasification terminals worldwide reminds us that LNG is an effective tool to ensure security of supply. In this regard FSRUs are continuing to expand worldwide, with 20 units on the water at the end of 2014 and several more to come in 2015.
3 FIDs have been taken in 2014, namely Cameron and Freeport in the USA and Rotan FLNG in Malaysia, for a combined capacity of about 25 mtpa. Although not formally announced at the time of this writing, Cove Point is reported to have started construction work on site. Prospects for LNG demand throughout the world remain strong, and the industry is waiting for the wave of new exports from the United States and from Australia, who will likely top the producers’ list by 2020. Noteworthy is also that the dominant market share and role of Middle East producers will diminish.
The structure of demand should also evolve, mainly driven by the emergence of new importers from fast growing economies in South East Asia and in India.
China’s appetite for gas will significantly influence the global LNG market, although several uncertainties remain concerning the price elasticity of demand, the policy changes promoting cleaner fuels and the competition of large gas pipeline projects .
Finally, stricter legislation on shipping emissions starting in January 2015 in the Atlantic basin will help stimulating the development of small scale LNG, offering new opportunities of growth as well as new challenges.
We hope you will find our report a helpful tool in your daily activities and remain committed to facilitate LNG trade and, foremost, improve the safety and reliability of our industry.
Yours sincerely,
Domenico Dispenza
LNG Trade in 2014 4
Contracts concluded in 2014 6
Long-term and medium-term contracts in force 8
LNG Characteristics 12
LNG Tankers 13
LNG Carrier Fleet 15
Liquefaction plants + tables 19
Regasification plants + tables 25
Sea transportation routes 32
Contents
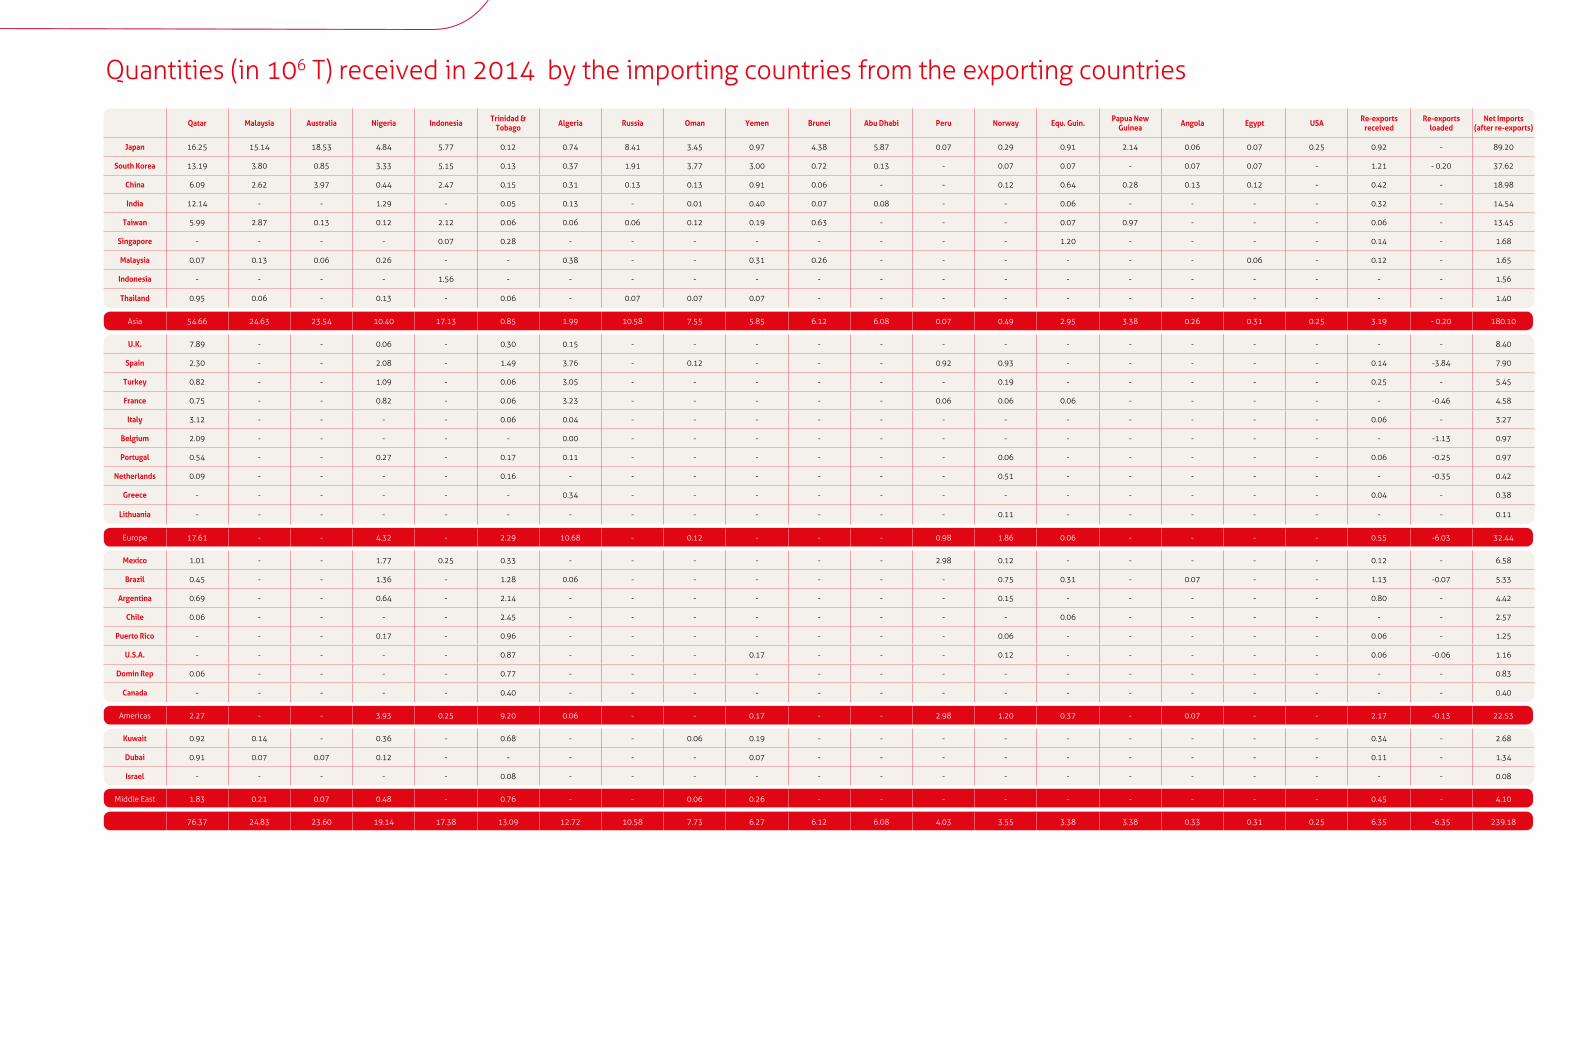
2014 Imports / Exports Matrix

Key figures 2014
239.2 million tons imported or a 1% increase vs.2013
69.6 million tons traded on a spot or short-term basis or
29% of total trade
75% of global LNG demand in Asia
40% of global LNG volumes supplied from the Middle-East
38% of global LNG volumes supplied from Asia-Pacific
110 LNG receiving terminals
30 importing countries
751 mtpa total regasification capacity
19 exporting countries
298 mtpa nameplate liquefaction capacity

4 - GIIGNL / THE LNG INDUSTRY GIIGNL / THE LNG INDUSTRY - 5
several exporting countries : In the Asia-Pacific Basin, incremental volumes from Papua New Guinea (+3.4 Mt) and Australia (+1.2 Mt) were partly counterbalanced by a lower output from all other countries, in particular from Indonesia (-1 Mt), Brunei (-0.9 Mt) and Malaysia (-0.3 Mt). In the Middle East, maintenance work on the Ras Laffan facilities curtailed Qatar’s annual output by 1.7 Mt. Lower than expected volumes from Oman (-0.6 Mt) and Yemen (-0.6 Mt) largely offset additional supplies from Abu Dhabi (+ 1 Mt). In Egypt (-2.4 Mt), exports were further reduced due to growing domestic demand. Supply from the Atlantic Basin nevertheless progressed for the first time since 2010, driven by improved
In 2014, global LNG imports reached 239.2 Mt, a 1% increase compared to 2013, but still below 2011 levels (240.8 Mt).
A SLIGHT UPTURN IN SUPPLY
In 2014, global LNG imports increased by about 2.3 Mt. One new supply source came on-stream with the start-up of a two-train liquefaction plant in Papua New Guinea, which quickly reached full production capacity.Taking into account the restart of the Kenai plant in Alaska, 19 countries produced LNG in 2014. For the third year in a row, the increase in supply was however partly offset by a reduction in production from
performance in Nigeria (+2.7 Mt) as well as in Algeria (+1.9 Mt) thanks to the start-up of an expansion train (GL3Z) at Algeria’s Arzew plant. These gains in production must not conceal the fact that both countries are still only recovering their 2011 production level, with respectively 19.1 Mt and 12.7 Mt exported in 2014. Noteworthy, Norway reached its record export level, with close to 3.6 Mt marketed in 14 countries last year.
LOWER THAN EXPECTED GROWTH IN ASIA
Asian imports remained the main growth driver in 2014. The region represents more than 75% of global LNG demand. After a year of stagnation in 2013, the largest increase in demand came from India
LNG Trade in 2014(+1.5 Mt), mainly due to reduced availability of hydropower. The biggest variation came from sluggish demand in South Korea, where a mild weather combined with several nuclear restarts induced a -2.8 Mt decline in LNG imports (-6.9%). Unsurprisingly, Japan remains the world’s leading importer. With no nuclear restarts in 2014, LNG consumption in Japan continued to rise (+1.2 Mt) and exceeded 89 Mt, which represents more volumes than Asia’s total imports ten years ago. Despite the start-up of two new terminals in China last year, Chinese imports recorded a lower than expected growth (+2%, representing 0.4 Mt) due to the economic slowdown and to stronger fuel competition in the country. In total, Asian LNG demand growth nevertheless outpaced the global growth rate of around 1%, which translated into 2 Mt of additional LNG consumption. Looking back over recent years, the development of LNG in the Asian region has been impressive. Asian LNG imports have doubled over the last decade, and so has the number of importing countries in the region.
EUROPEAN IMPORTS STILL DEPRESSED
In 2014, despite growth in the U.K (+1.5 Mt) due to an increase in Qatari deliveries and in Turkey (+1 Mt) where LNG demand continues to be driven by power generation, European LNG import activity overall further declined (-1.5 Mt) and allmost all European countries recorded double-digit drops in LNG demand. As an example, no European country is listed in the world’s top 5 importers, and France is no longer part of the top 10 importing nations. Several European terminal operators took special measures in order to operate in low send-out conditions to accommodate this new environment.Consequently, Europe’s share of global imports decreased from 14.3% in 2013 to 13.6% in 2014. With 8.4 Mt imported last year The U.K came back as Europe’s leading LNG importer, with a large part of the volumes delivered into South Hook as a consequence of low demand in Asia and of the redirection of Qatari volumes. Second to the U.K, Spain imported a total of about 11.7 Mt last year, but re-exported more than 3.8 Mt. On the same pattern, more than half of the volumes imported in Belgium during the year (2.1 Mt) were eventually re-exported (1.1 Mt). The same applies to the Netherlands, where 0.35 Mt were reloaded out of Rotterdam.Unlike Europe, Latin America recorded a strong increase in demand (+1.8 Mt). Two thirds of incremental demand came from Brazil, who imported a record 5.3 Mt due to the dry weather conditions and to the low level of hydropower. Mexico remains the leading importer in the region, with 6.6 Mt in 2014.
SPOT & SHORT-TERM TRADING ON THE RISE
Spot and short-term LNG trading - volumes delivered under contracts of four years or less - continued to increase last year, reaching 69.6 Mt, a 4.6 Mt increase over 2013 (+7%). The share of spot and short-term trades reached 29% of total flows, compared with 27% in 2013 and 25% in 2012.Asian buyers attracted around 74% of spot and short-term volumes, with Japan alone accounting for 37% of the total (25.8 Mt). Japan imported 4.1 Mt of additional spot & short-term volumes compared with 2013. These additional volumes were mostly supplied from Papua New Guinea and Australia. The Middle East remains the main source of spot and short-term LNG, representing 43% of total supply, followed by Atlantic Basin exporters (36%) and Asia Pacific (21%).Reloaded quantities jumped 51% last year, reaching 6.4 Mt. About 108 cargoes were re-exported and delivered to 19 countries, compared with 14 in 2013. With close to 6 Mt, Europe accounted for 95% of global re-exports. Spain was the main source accounting for about 60%. Despite a reduced Atlantic/Asian price differential compared to 2013, more than half of the total re-exports were absorbed by Asia (3.2 Mt). One-third of the reloaded quantities were delivered into Latin America, with Brazil and Argentina accounting for the largest share (1.9 Mt).Generally speaking, “non-conventional” trades are on the rise, with several occurrences of two and sometimes three-port loadings and unloadings observed last year.
Major LNG Flows
between 3 and 5 Mt
between 2 and 3 Mt
between 5 and 10 Mt
> 10 Mt
Major LNG Flows
between 3 and 5 Mt
between 5 and 10 Mt
> 10 Mt
Major LNG Flows
between 3 and 5 Mt
between 5 and 10 Mt
> 10 Mt
Major LNG Flows
between 3 and 5 Mt
between 5 and 10 Mt
> 10 Mt
Major LNG Flows
between 3 and 5 Mt
between 5 and 10 Mt
> 10 Mt
Major LNG Flows
between 3 and 5 Mt
between 2 and 3 Mt
between 5 and 10 Mt
> 10 Mt

Origin Exportcountry / Exporter Buyer Import
countryAmount(mtpa)
Duration (years) Comments Start Delivery
format
Long & Medium Term Sales
ALGERIA/Sonatrach Botas TURKEY 3 10 Extension of existing contract 2015 DES
BP Tokyo Electric JAPAN 1.2 18 2017 DES
BP CNOOC CHINA 1 20 2019 DES
BP CNOOC CHINA 0.5 15 2019 FOB
BP Pavilion N/A 0.4 20 2019BP Indonesia (Tangguh´s
Trains 1, 2, 3) Perusahaan Listrik Negara (PLN) 1,5 19 2015
BP KPC KUWAIT 6-8 shipments per year 5 2014
COLOMBIA/ Pacific Rubiales Gazprom Marketing & Trading Singapore GM&T Portfolio 0.5 4 2015 FOB
Gas Natural Fenosa BHP Billiton CHILE (Mejillones) 0.5 6 2016 DES
Osaka Gas Hiroshima Gas JAPAN 0.05 ~ 0.13 15 2016 DES
MALAYSIA/Malaysia LNG JX Nippon Oil & Energy JAPAN 0.4 10 2015 DES
MALAYSIA/Malaysia LNG Tohoku Electric JAPAN 0.4 10 2016 DESMALAYSIA/Malaysia LNG
Sdn. Bhd.(SPA Amendment)
Saibu Gas Co., Ltd. JAPAN0.39 (2014)0.45 (2015-
2028)15 2014 DES/FOB
MALAYSIA/Petronas CPC TAIWAN 2 5 2015 DES
NORWAY/Statoil Litgas LITHUANIA 0.4 5 2014 DES
QATAR/Qatargas 3 Tohoku Electric JAPAN 0.1 ~ 0.18 15 2016 DES
RUSSIA/Yamal CNPC CHINA 3 DES
RUSSIA/Yamal LNG Gazprom Marketing & Trading Singapore GM&T Portfolio
HoA: ‘Up to 3 mtpa’
NOTE: SPA signed 23-Jan-15 (i.e.
not concluded in 2014). Volume
2.9 mtpa
FOB at a transshipment
point in Western Europe
Shell KPC KUWAIT 1 ~ 1.2 5 to 6 years 2014 DES
Shell Chubu Electric JAPAN up to 12 cargoes/year 20 2014 DES
Shell GDF SUEZ GDF SUEZ Portfolio 0.4 20 2014 DES
Total Gas & Power Pavilion Energy ASIA including Singapore 0.7 10 2018 DESUSA/ Cheniere/Corpus
Christi Trains 1-3 Endesa Endesa Portfolio 1.5 20 Option to extend for 10 years 2018 FOB
USA/ Cheniere/Corpus Christi Trains 1-3 Endesa Endesa Portfolio 0.75 20 Option to extend for
10 years 2018 FOB
USA/Cheniere/Corpus Christi Train 2 Iberdrola Iberdrola Portfolio 0.76 20
In addition to exis-ting 0.4 mtpa from Train 1. Option to
extend for 10 years 2019 FOB
USA/Cheniere/Corpus Christi Train 2 Gas Natural Aprovisionamentos Gas Natural Fenosa
Portfolio1.5 20 Option to extend for
10 years 2019 FOB
USA/ Cheniere/Corpus Christi Train 2 Woodside Woodside Portfolio 0.85 20 Option to extend for
10 years 2019 FOB
USA/Cheniere/Corpus Christi Train 2 Pertamina INDONESIA 0.76 20
In addition to existing 0.76 mtpa contract
signed in 20132020 FOB
USA/Cheniere/Corpus Christi Trains 3 EDF EDF Portfolio 0.77 20
In addition to existing 0,38 mtpa
from Train 2. Option to extend for 10
years
2019 FOB
USA/Cheniere/Corpus Christi Train 3 EDP EDF Portfolio 0.77 20 Option to extend for
10 years 2019 FOB
USA/GDF SUEZ/Cameron LNG CPC TAIWAN 0.8 20 2018 DES
USA/Mitsui & Co., Ltd./Cameron LNG Kansai Electric JAPAN 0.4 20 2017 DES
USA/Mitsui & Co., Ltd./Cameron LNG Toho Gas JAPAN 0.3 20 2017 DES
USA/Mitsui & Co., Ltd./Cameron LNG Tokyo Gas JAPAN 8 cargoes 20 2020 DES
USA/Cameron LNG Pavilion ASIA 0.4
Short Term Contracts (< 4 yrs)
ALGERIA/Sonatrach EGAS EGYPT 6 cargoes 6 months 2015 DES
AUSTRALIA/Woodside/Pluto KOGAS KOREA 2.2 3 Option to extend for 3 years
April 2014 DES
ENI KOGAS KOREA 0.4 2 Option to extend for 2 years
January 2014 DES
ENI Mitsubishi JAPAN 0.2(3 cargoes) 1 2015 DES
GDF SUEZ Tohoku Electric JAPAN between 0.214 and 0.27 mtpa
2 years and 5 months 2014 DES
GDF SUEZ GSPC INDIA between 0.3 and 0.33 mtpa
5 months (until end of March
2015)2014 DES
GDF SUEZ Marubeni JAPAN between 0.2 and 0.28 mtpa
7 months (until end of March
2016)2016 DES
GDF SUEZ Chubu Electric JAPAN between 1.04 and 1.47 mtpa
2 years and 3 months (until end of March
2017)2015 DES
Petronas LNG CPC TAIWAN 0.6 6 2014 DES
QATAR/RasGas E.ON Global Commodities UK 0.5 3 Option to extend for 1 year 2014 DES
QATAR/RasGas Petronet LNG Ltd. INDIA 0.5 1 2014 CFR
Origin Exportcountry/exporter Purchaser Import
countryAmount(mtpa)
Duration (years) Comments Start Delivery
format
Short Term Contracts (< 4 yrs)
QATAR (Qatargas 2 - Train 4) KPC KUWAIT 8 cargoes 2014
QATAR Botas TURKEY 9 cargoes 2014/2015
Heads of Agreement (H.O.As)
AUSTRALIA/ Prelude Tokyo Electric JAPAN 0.56 8 2017 DES
AUSTRALIA/ Prelude Shizuoka Gas JAPAN 0.07 8 2017 DES
GDF SUEZ Chubu Electric JAPAN 1.2 (20 cargoes)
2 years and three months 2015 DES
INDONESIA PT Pertamina (Persero) INDONESIA 0.7 7 2017 FOB
Petronas LNG Keppel Gas Pte Ltd SINGAPORE 1 10 2017 FOBUSA/Diamond Gas
International/Cameron LNG Tokyo Electric JAPAN 0.8 20 2017 FOB
USA/GDF SUEZ/Cameron LNG Tohoku Electric JAPAN 0.3 20 2018 DESUSA/Diamond Gas
International/Cameron LNG Tohoku Electric JAPAN 0.2 16 2022 DES
USA/Mitsui & Co., LTD./Cameron LNG
CNOOC Gas & Power Trading and Marketing Ltd. CHINA 0.2 20 2019 FOB
Memorandums Of Understanding (M.O.Us) CANADA/Woodfibre LNG Guangzhou Gas CHINA 1 25 2017
6 - GIIGNL / THE LNG INDUSTRY GIIGNL / THE LNG INDUSTRY - 7
Contracts concluded in 2014

8 - GIIGNL / THE LNG INDUSTRY GIIGNL / THE LNG INDUSTRY - 9
Long-term and medium-term LNG contracts in force in 2014*
Export Country Loading Point Seller BuyerNominal quantity
ACQ 106 t/year
Duration Type of contract Comments
ATLANTIC BASIN
Algeria Skikda-Bethioua Sonatrach
GDF SUEZ 3.70 1976/2019 FOB
GDF SUEZ 2.50 1972/2019 FOB Extension to 2019
GDF SUEZ 1.30 1992/2019 FOB
Eni 1.33 1997/2017 FOB
Iberdrola 1.15 2002/2021 DES
Botas 3.02 1994/2014 DES Extended until 2024 with a higher volume of up to 3.2 mtpa
Enel 0 1999/2022 DESDelivery under the "GDF SUEZ/Enel" swap agreement. In 2014 no delivery
accounted under this contractCepsa 0.77 2002/ 2022 DES
Statoil 0.75 2003/2009 DES Extension to 2014
Endesa 0.75 2002/2017 DES
DEPA S.A. 0.50 2000/2021 CIF
Egypt
IdkuELNG T1 GDF SUEZ 3.60 2005/2025 FOB Currently under Force Majeure
ELNG T2 BG 3.60 2006/2026 FOB Currently under Force Majeure
DamiettaSEGAS BP 1 2005/2025 FOB Currently under Force Majeure
SEGAS Union Fenosa gas 3.30 2005/2030 FOB Currently under Force Majeure
Equatorial Guinea Punta Europa EGLNG BG 3.30 2006/2023 FOB
Nigeria Bonny Island
Nigeria LNG T1 & 2
Enel 2.57 1999/2022 DES
Gas Natural Aprovisionamientos 1.17 1999/2021 DES
Botas 0.91 1999/2021 DES
GDF SUEZ 0.33 1999/2022 DES
Galp Energia 0.26 1999/2022 DES
Nigeria LNG T3Gas Natural sdg 1.99 2002/2024 DES
Galp Energia 0.73 2002/2022 DES
Nigeria LNG T4Eni 1.15 2006/2026 DES
Iberdrola 0.38 2006/2026 DES
Nigeria LNG T4 & 5
BG 2.30 2006/2026 DES
Galp Energia 1.42 2006/2026 DES
Shell International Trading Middle East 1.13 2006/2026 DES Contract novated to Shell Middle East from Shell Western
Endesa 0.75 2006/2026 DES
Total 0.23 2006/2026 DES
Nigeria LNG T6Total 0.90 2008/2027 DES
Shell Western LNG 3.10 2008/2027 DES
Norway Hammerfest
StatoilStatoil ≈1.75 2007/2021 DES
Iberdrola 1.13 2006/2025 DES
Total Total 0.70 2007/depletion FOB
GDF SUEZ GDF SUEZ 0.50 2007/depletion FOB
Statoil Petronas 0.10 2012/depletion FOB
Trinidad & Tobago Point Fortin
Atlantic LNG T1GDF SUEZ 1.98 1999/2018 FOB
Gas Natural Aprovisionamentos 1.06 1999/2018 FOB
Atlantic LNG T2 & 3
BG 1.70 2004/2023 FOB
BG 0.40 2004/2026 DES
Shell 1.60 2006/2023 FOB Former Repsol contract
BP 0.85 2002/2021 FOB
Naturgas Energia 0.70 2003/2023 FOB GNF/Naturgas swap. GNF buys 0.74 mtpa on a FOB basis until 2023
Gas Natural sdg 0.65 2002/2023 FOB
Atlantic LNG T4
BP 2.50 2006/2025 FOB
BG 1.50 2007/2027 FOB
Shell 1 2014 /2024 FOB As part of Repsol LNG Acquisition
BP AES 0.75 2003/2023 DES Related to BP/ALNG T2 & 3 contract
GDF SUEZ Ecoelectrica 0.60 2000/2020 DES Related to GDF SUEZ/ALNG T1 contract
PACIFIC BASIN
Australia Withnell Bay
Woodside, Shell,BHP Billiton, BP, Chevron, Japan Australia LNG Pty Ltd (Mitsubishi & Mitsui)
The Chugoku Electric 1.43 2009/2021 DES
Tokyo Gas, Toho Gas 1.37 2004/2029 FOB
Kyushu Electric 0.70 2009/2023 FOB
Osaka Gas 1 2004/2033 FOB
Tohoku Electric 1 2010/2019 DES
Toho Gas 0.76 2009/2019 DES
Chubu Electric 0.60 2009/2029 DES
Tokyo Gas 0.50 2009/2017 DES
Osaka Gas 0.50 2009/2015 DES
Export Country Loading Point Seller BuyerNominal quantity
ACQ 106 t/year
Duration Type of contract Comments
Australia
Withnell Bay
Woodside, Shell,BHP Billiton, BP, Chevron, Japan Australia LNG Pty Ltd (Mitsubishi & Mitsui)
The Kansai Electric 0.50 - 0.93 2009/2024 DES
Chubu Electric 0.50 2009/2016 DES
The Kansai Electric 0.20 - 0.44 2009/2017 DES
Tokyo Electric 0.30 2009/2017 DES
Kyushu Electric 0.50 2006/2021 DES
Shizuoka Gas 0.13 2004/2029 FOB
KOGAS 0.50 2003/2016 DES
GDLNG 3.30 2006/2030 FOB
Darwin Conocophillips, ENI, Santos, Inpex,TTSR
Tokyo Electric 2 2006/2022 FOB
Tokyo Gas 1 2006/2022 FOB
PlutoPluto LNG The Kansai Electric 1.75 - 2 2011/2025 FOB
Pluto LNG Tokyo Gas 1.50 - 1.75 2011/2025 FOB
Curtis IslandQCLNG BG up to 4.25 2014/2034 FOB
BG CNOOC 3.60 2014/2034 DES
Brunei Lumut Brunei LNG
Tokyo Gas, Osaka Gas, Tokyo Electric 3.40 2013/2023 DES Extended to 2023
KOGAS 1 1997/2018 DES
Shell 0.80 2013/2023 FOB
Indonesia
Bontang Pertamina, Total E&P Indonesia, INPEX
Kansai Electric, Chubu Electric, Kyushu Electric, Osaka Gas, Toho Gas, Nippon
Steel & Sumitomo Metal3 2011/2020 FOB/DES
Nominal quantity (ACQ) 2011/2015 : 3 mtpa2016/2020 : 2 mtpa
Hiroshima Gas, Nippon Gas, Osaka Gas 0.39 1996/2015 DES
KOGAS 2 1994/2014 FOB Expired in 2014
KOGAS 1 1998/2017 FOB
CPC 1.84 1998/2017 DES
Tangguh Tangguh PSC Contractor Parties
Sempra LNG 3.70 2008/2029 DES 1.7 mtpa divertible
CNOOC 2.60 2009/2033 FOB
Kansai Electric 1 2014/2035 DES
SK E&S 0.60 2006/2026 DES
Posco 0.55 2005/2024 DES
Tohoku Electric 0.12 2010/2024 DES
Malaysia Bintulu
Malaysia LNG Satu
Tokyo Gas, Tokyo Electric 7.40 1983/20031.8 mtpa FOB/ 5.6 mtpa DES
Extended to 2018
Saibu Gas0.39 (until 2014)
0.45 (2015 onward)
2014/2028 DES
Shikoku Electric 0.36 2010/2025 DES Complex contract
Hiroshima Gas 0.008~0.016 2005/2012 FOB Extended to 2015
Malaysia LNG Dua
The Kansai Electric, Toho Gas, Tokyo Gas, Osaka Gas 2.10 1995/2015 DES
Gas Bureau, City of Sendai 0.15 1997/2016 DES
Chubu Electric ≈ 0.54 2011/2031 DES
Tohoku Electric 0.50 1996/2016 DES
Shizuoka Gas 0.45 1996/2016 DES
KOGAS 1~2 1995/2018 FOB
CPC 2.25 1995/2015 DES
Malaysia LNG Tiga
Tokyo Gas, Toho Gas, Osaka Gas 0.68 2004/2024 DES
Toho Gas 0.52 2007/2027 DES
Tohoku Electric 0.50 2005/2025 DES
Japan Petroleum Exploration co. 0.48 2002/2021 DES
CNOOC 3 2009/2029 DES
KOGAS 2 2008/2028 DES
Papua New Guinea Port Moresby PNG LNG
Sinopec 2 2014/2034 DES
Tokyo Electric 1.80 2014/2034 DES/FOB
Osaka Gas 1.50 2014/2034 DES
CPC 1.20 2014/2034 DES
Peru Pampa Melchorita Peru LNG Shell 3.89 2014/2028 FOB Contract novated to Shell Middle East from Shell Western
Russia Prigorodnoye Sakhalin Energy Invest-ment
Shell 1.60 2009/2028 DES Initially linked to Costa Azul / Destination flexible
Tokyo Electric 1.50 2007/2029 FOB
KOGAS 1.50 2008/2028 FOB
Tokyo Gas 1.10 2007/2031 FOB
Gazprom Global LNG 1 2009/2028 DES
Kyushu Electric 0.50 2009/2031 DES
Toho Gas 0.50 2009/2033 DES
Chubu Electric 0.50 2011/2026 DES
Tohoku Electric 0.42 2010/2030 FOB
Hiroshima Gas 0.21 2008/2028 FOB
Osaka Gas 0.20 2008/2031 FOB
Saibu Gas 0.07 2014/2027 DES
(*) Duration above four years

10 - GIIGNL / THE LNG INDUSTRY GIIGNL / THE LNG INDUSTRY - 11
Long-term and medium-term LNG contracts in force in 2014*
Export Country Loading Point Seller BuyerNominal
quantity ACQ 106 t/year
Duration Type of contract Comments
Mitsubishi Mitsubishi Shizuoka Gas 0.30 ~ 0.70 2010/2015 DES
Shell Portfolio Shell Gas Natural Fenosa 1.16 2006/2023 DES Related to the Shell (ex- Repsol) Atlantic LNG Train 2 & 3 contract of 2.05 mtpa
Shell Portfolio (Nigeria, Russia, Australia) Shell JX Nippon Oil & Energy Corporation 0.20 2015/2032 DES
Total quantity of LNG during contract duration: 46 cargoes of about
66,000 tonnes each)Shell Portfolio Shell Osaka Gas ~≈ 0.80 2012/2038 DES
Shell Portfolio Shell KOGAS 1 ~ 3.64 2013/2035 DES
Shell Portfolio Shell GDF SUEZ 0.40 2014/2034 DES
Shell Portfolio Shell Chubu Electric * 2014/2034 DES *Maximum 12 cargoes per year
Tokyo Gas Portfolio Tokyo Gas Hokkaido Gas 0.30~0.40 2012/2023 DES
Tokyo Gas Portfolio Tokyo Gas Saibu Gas 0.30 2014/2029 DES
Total Portfolio Total KOGAS Up to 2 mtpa 2014/2031 DES
Total Portfolio Total CNOOC 1 2010/2024 DES
Export Country Loading Point Seller BuyerNominal quantity
ACQ 106 t/year
Duration Type of contract Comments
MIDDLE EAST
Abu Dhabi Das Island Adgas Tokyo Electric 4.30 1994/2019 DES
Qatar Ras Laffan
Qatargas I
Chubu Electric 4 1997/2021 DESTohoku Electric, Tokyo Gas, Osaka Gas,
The Kansai Electric, Tokyo Electric, Toho Gas, Chugoku Electric
2 1998/2021 DES
Tokyo Electric 1 2012/2021 DES
Gas Natural sdg 0.75 2005/2024 DES
Gas Natural sdg 0.75 2006/2025 FOB
Qatargas II T1 ExxonMobil 7.80 2009/2034 DES
Qatargas II T2
CNOOC 2 2009/2034 DES
Total 1.85 2009/2034 DES
Total 1.50 2009/2034 DES
Total 1.15 2009/2034 DES
Total 0.70 2009/2034 DES
ExxonMobil 0.60 2009/2033 DES
Qatargas III
ConocoPhillips 7.80 2010/2035 DES
Centrica 3 2014/2018 DES Extension of the previous 3 year contract ending in 2014
CNOOC 2 2011/2035 DES
Chubu Electric 1 2013/2028 DESNominal quantity (ACQ)
2013/2017: 1 mtpa2018/2028: 0.7 mtpa
The Kansai Electric 0.50 2013/2027 DES
Qatargas IV
Shell 3.60 2011/2036 DES Quantity and total years amended
Petrochina 3 2011/2036 DES
Marubeni 1 2011/2031 DES
RasGas I KOGAS 4.92 1999/2024 FOB
RasGas II T1 Petronet LNG 5 2004/2028 FOB
RasGas II T2Edison 4.60 2009/2034 DES
Endesa 0.74 2005/2025 DES
RasGas II T3
EDF Trading 3.40 2007/2012 DES Extended to 2027
CPC 3.08 2008/2032 FOB
ENI 2.05 2007/2027 DES Former Distrigas contract
RasGas III T1
ExxonMobil 7.80 2009/2034 DES
Petronet LNG 2.50 2009/2029 FOB
KOGAS 2.10 2007/2026 DES
KOGAS 2 2012/2032 DES
RasGas III T2 ExxonMobil 7.80 2010/2035 DES New LT contract
Rasgas III CPC 1.50 2013/2032 DES
Oman Qalhat
Oman LNGKOGAS 4.06 2000/2024 FOB
Osaka Gas 0.66 2000/2024 FOB
Qalhat LNG
Union Fenosa Gas 1.65 2006/2025 DES
Mitsubishi Corp. 0.80 2006/2020 FOB
Osaka Gas 0.80 2009/2026 FOB
Itochu Corp. 0.77 2006/2020 FOB
Yemen Balhaf
Yemen LNG T1 KOGAS 2 2008/2028 FOB
Yemen LNG T2 GDF SUEZ 2.55 2009/2029 FOB
Yemen LNG T1 & 2 Total 2 2009/2029 DES
OTHER
BG Portfolio BG CNOOC3.60
8.60 (2015 onward)
2014/2034 DES
BG Portfolio BG Quintero LNG 3 2009/2030 DES
BG Portfolio BG Singapore LNG 3 2013/2033 DES
BG Portfolio BG KOGAS 1.30 2008/2016 DES
BG Portfolio BG Chubu Electric up to 0.40 2014/2035 DES Total quantity of LNG during contract duration : maximum 122 cargoes
BP Portfolio BP Chubu Electric 0.50 2012/2028 DES
Chubu Electric Portfolio Chubu Electric INPEX * 2013/2018 DES *Total quantity of LNG during contract duration : 17 cargoes
ENI Portfolio Eni Tokyo Electric 1.04 2011/2015 DES
ENI Portfolio Eni Iberdrola 0.92 2002/2018 DES
ENI Portfolio Eni E.ON Global Commodities 0.65 2007/2022 DES
ENI Portfolio Eni Hidrocantabrico + EDP 0.36 2005/2016 DES
ENI Portfolio Eni KOGAS/Chubu Electric * 2013/2017 DES*Total quantity of LNG during contract duration: 28 cargoes
(approx. 1.68 mtpa)Iberdrola Portfolio Iberdrola DONG 0.72 2011/2021 DES
(*) Duration above four years

12 - GIIGNL / THE LNG INDUSTRY GIIGNL / THE LNG INDUSTRY - 13
LNG CHARACTERISTICS
LNG Characteristics
The average composition is chosen as being representative among compositions reported by the different receiving terminals.
LNG tankers
OriginNitrogen
N2 %Methane
C1 %Ethane C2 %
Propane C3 %
C4+ % TOTALLNG Density (1)
kg/m3
Gas Density (2) kg/m3(n)
Expansion ratio m3(n)/
m3 liq
Gas GCV (2) MJ/m3(n)
Wobbe Index (2) MJ/m3(n)
Australia - NWS 0.04 87.33 8.33 3.33 0.97 100 467.35 0.83 562.46 45.32 56.53
Australia - Darwin 0.10 87.64 9.97 1.96 0.33 100 461.05 0.81 567.73 44.39 56.01
Algeria - Skikda 0.63 91.40 7.35 0.57 0.05 100 446.65 0.78 575.95 42.30 54.62
Algeria - Bethioua 0.64 89.55 8.20 1.30 0.31 100 454.50 0.80 571.70 43.22 55.12
Algeria - Arzew 0.71 88.93 8.42 1.59 0.37 100 457.10 0.80 570.37 43.48 55.23
Brunei 0.04 90.12 5.34 3.02 1.48 100 461.63 0.82 564.48 44.68 56.18
Egypt - Idku 0.02 95.31 3.58 0.74 0.34 100 437.38 0.76 578.47 41.76 54.61
Egypt - Damietta 0.02 97.25 2.49 0.12 0.12 100 429.35 0.74 582.24 40.87 54.12
Equatorial Guinea 0.00 93.41 6.52 0.07 0.00 100 439.64 0.76 578.85 41.95 54.73
Indonesia - Arun 0.08 91.86 5.66 1.60 0.79 100 450.96 0.79 571.49 43.29 55.42
Indonesia - Badak 0.01 90.14 5.46 2.98 1.40 100 461.07 0.82 564.89 44.63 56.17
Indonesia - Tangguh 0.13 96.91 2.37 0.44 0.15 100 431.22 0.74 581.47 41.00 54.14
Libya 0.59 82.57 12.62 3.56 0.65 100 478.72 0.86 558.08 46.24 56.77
Malaysia 0.14 91.69 4.64 2.60 0.93 100 454.19 0.80 569.15 43.67 55.59
Nigeria 0.03 91.70 5.52 2.17 0.58 100 451.66 0.79 571.14 43.41 55.50
Norway 0.46 92.03 5.75 1.31 0.45 100 448.39 0.78 573.75 42.69 54.91
Oman 0.20 90.68 5.75 2.12 1.24 100 457.27 0.81 567.76 43.99 55.73
Peru 0.57 89.07 10.26 0.10 0.01 100 451.80 0.79 574.30 42.90 55.00
Qatar 0.27 90.91 6.43 1.66 0.74 100 453.46 0.79 570.68 43.43 55.40
Russia - Sakhalin 0.07 92.53 4.47 1.97 0.95 100 450.67 0.79 571.05 43.30 55.43
Trinidad 0.01 96.78 2.78 0.37 0.06 100 431.03 0.74 581.77 41.05 54.23
USA - Alaska 0.17 99.71 0.09 0.03 0.01 100 421.39 0.72 585.75 39.91 53.51
Yemen 0.02 93.17 5.93 0.77 0.12 100 442.42 0.77 576.90 42.29 54.91
(1) Calculated according to ISO 6578 [T = -160ºC]. (2) Calculated according to ISO 6976 [0°C / 0°C. 1.01325 bar].
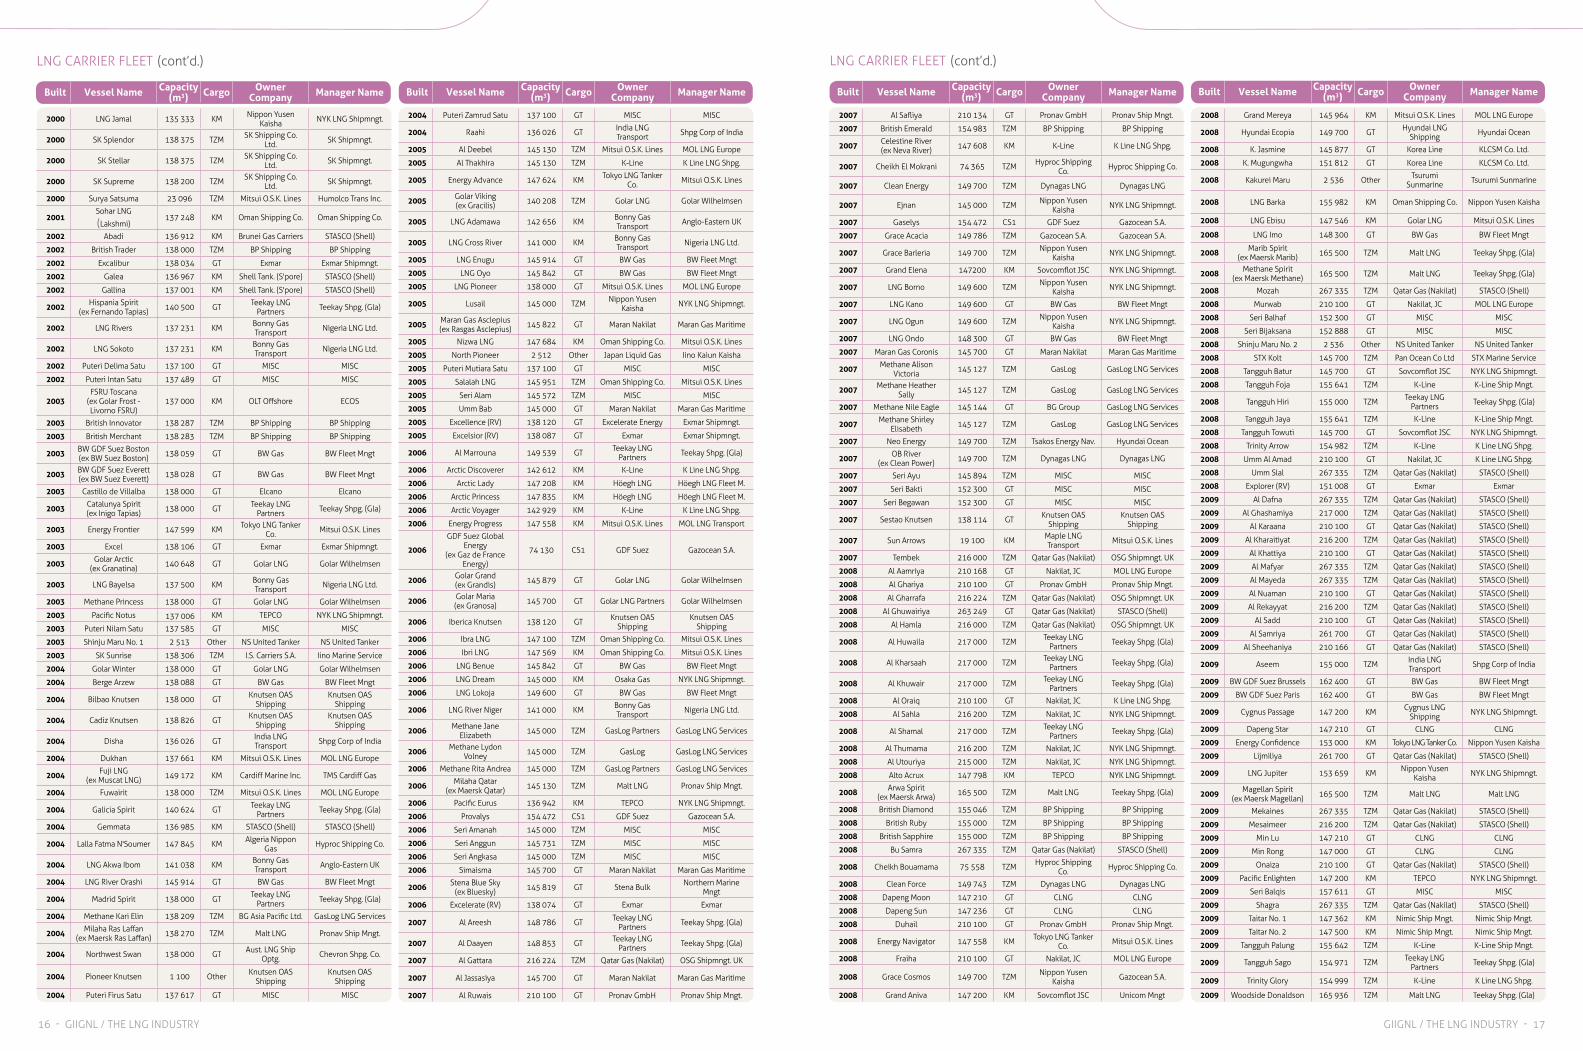
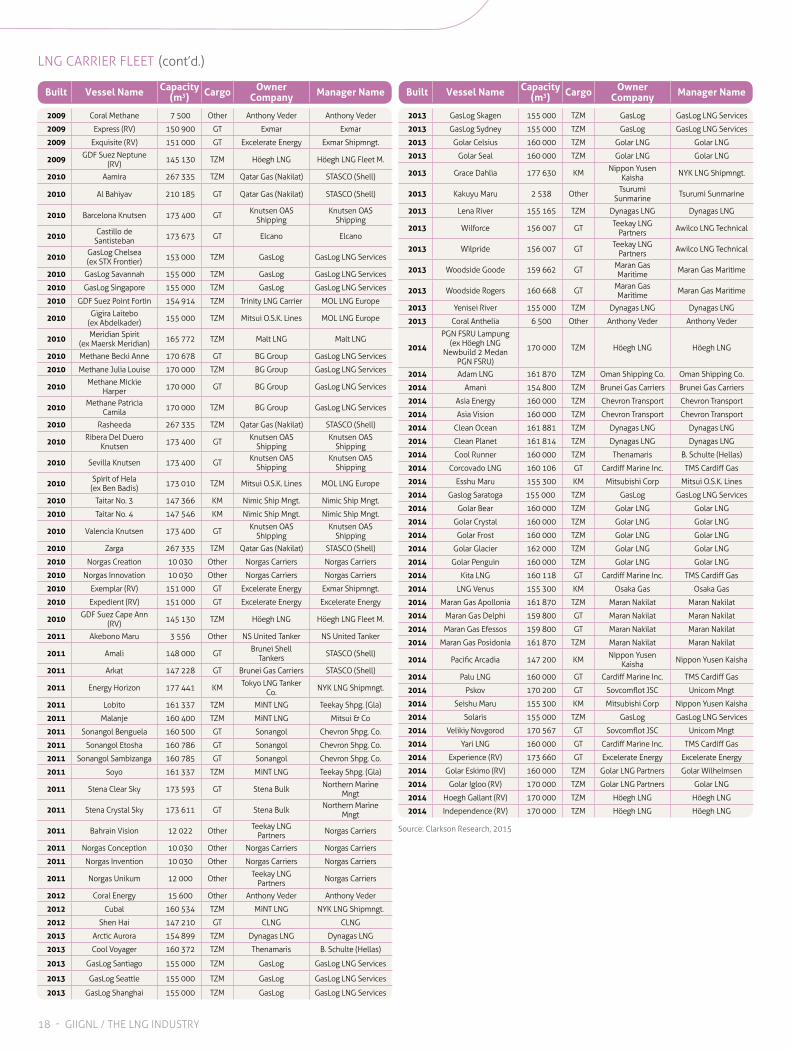
The total LNG tanker fleet consisted of 421 vessels at the end of 2014.
LNG tankers
New ships delivered in 2014 added 5.48 million cubic meters to the existing fleet capacity, a 10% increase.The average capacity of new vessels delivered in 2014 amounted to 161 278 m3, compared to an average 145 091 m3 for the total fleet at year-end.
In all, about 4 023 loaded vessels were delivered in 2014 (compared to 3998 in 2013):
1 524 » to Japan (1 532 in 2013)559 » to South Korea (616 in 2013)273 » to China (260 in 2013)219 » to Taiwan (204 in 2013)210 » to India (195 in 2013)660 » to Europe (661 in 2013)241 » to Argentina, Brazil and Chile (224 in 2013)175 » to North America (171 in 2013)101 » to Indonesia, Malaysia, Singapore and Thailand (82 in 2013)61 » to Israel, Kuwait and Dubai (53 in 2013)
Since the first commercial deliveries in 1964, close to 80 000 cargoes have been delivered without loss.
It included 5 Floating Storage Regasification Units (FSRUs), 15 Regasification Vessels (RVs) and 24 ships of less than 50,000 cubic meters.
Built Vessel Name Ex Name IMO
NumberDemolition
DateCapacity
(m3)
Cargo Containment
System
Owner Company
1969 SCF Arctic Methane Arctic 6910702 Oct-14 71 500 GT Sovcomflot JSC
1969 Aris SCF Polar 6901892 Feb-14 71 500 GT Unknown
1977 LNG Aries 7390193 Feb-14 126 300 KM BGT Ltd.
Built Vessel Name Ex Name IMO
NumberCapacity
(m3)
Cargo Containment
System
Owner Company
Manager Name
1977 Gandria Hoegh Gandria 7361934 125 820 KM Golar LNG Golar Wilhelmsen
1984 Koto Kotowaka Maru 8210209 125 454 KM BW Gas BW Fleet Mngt
1981 Tenaga Dua 7428469 130 000 GT MISC MISC
1981 Tenaga Tiga 7428471 130 000 GT MISC MISC
1983 Wilpower Bishu Maru 8013950 125 929 KM Awilco LNG V. Ships (UK) Ltd
LNG CARRIER DEMOLITION 2014
LNG CARRIERS LAID UP END 2014
• 3 ships were scrapped during the year :
• 5 ships were laid-up at the end of 2014 :
Source: Clarkson Research, 2015
Source: Clarkson Research, 2015

14 - GIIGNL / THE LNG INDUSTRY GIIGNL / THE LNG INDUSTRY - 15
Built Vessel Name Capacity (m3) Cargo Owner
Company Manager Name
1972 Bebatik (ex Gadinia) 75 060 TZM Brunei Shell
Tankers STASCO (Shell)
1974Seagas - Bunkering
Vessel (ex Fjalir)
170 Other Aga Gas AB Aga Gas AB
1975 Belanak(ex Gouldia) 75 000 TZM Brunei Shell
Tankers STASCO (Shell)
1975 Bilis(ex Geomitra) 77 731 GT Brunei Shell
Tankers STASCO (Shell)
1975 Bubuk(ex Genota) 77 670 GT Brunei Shell
Tankers STASCO (Shell)
1976 Gimi 126 277 KM Golar LNG Golar Wilhelmsen
1976 LNG Lagos(ex Gastor) 122 000 GT Bonny Gas
Transport STASCO (Shell)
1976 Mostefa Ben Boulaid 125 260 TZM Hyproc Shipping Co. Hyproc Shipping Co.
1977 Golar Freeze - FSRU 125 000 KM Golar LNG Partners Golar Wilhelmsen
1977Nusantara Regas Satu
FSRU Jawa (ex Khannur)
125 000 KM Golar LNG Golar Wilhelmsen
1977 Gandria(ex Hoegh Gandria) 125 820 KM Golar LNG Golar Wilhelmsen
1977 Larbi Ben M'Hidi 129 767 GT Hyproc Shipping Co. Hyproc Shipping Co.
1977 LNG Aquarius 126 300 KM Hanochem Shpg. MOL LNG Europe
1977 LNG Port Harcourt(ex Nestor) 122 000 GT Bonny Gas
Transport STASCO (Shell)
1978 LNG Capricorn 126 300 KM Nova Shpg & Logist. Nova Shpg & Logist.
1978 LNG Gemini 126 300 KM General Dynamics Pronav Ship Mngt.
1978 LNG Leo 126 400 KM General Dynamics Pronav Ship Mngt.
1978 Methania 131 235 GT Distrigas S.A. Exmar Shipmngt.
1979 Bachir Chihani 129 767 GT Hyproc Shipping Co. Hyproc Shipping Co.
1979 LNG Libra 126 400 KM Höegh LNG Höegh LNG Fleet M.
1979 LNG Taurus 126 300 KM Nova Shpg & Logist. Nova Shpg & Logist.
1979 LNG Virgo 126 400 KM General Dynamics Pronav Ship Mngt.
1979 Matthew(ex Suez Matthew) 126 540 TZM Suez LNG N.A. Höegh LNG Fleet M.
1980 LNG Abuja(ex Louisiana) 126 530 KM Bonny Gas
Transport Anglo-Eastern UK
1980 LNG Edo(ex Lake Charles) 126 530 KM Bonny Gas
Transport Anglo-Eastern UK
1980 Mourad Didouche 126 130 GT Hyproc Shipping Co. Hyproc Shipping Co.
1981 Golar Spirit - FSRU 129 000 KM Golar LNG Golar Wilhelmsen
1981 LNG Bonny(ex LNG 559) 135 293 GT Bonny Gas
Transport STASCO (Shell)
1981 Ramdane Abane 126 130 GT Hyproc Shipping Co. Hyproc Shipping Co.
1981 Tenaga Dua 130 000 GT MISC MISC
1981 Tenaga Lima 130 000 GT MISC MISC
1981 Tenaga Tiga 130 000 GT MISC MISC
1983 Echigo Maru 125 568 KM Nippon Yusen Kaisha NYK LNG Shipmngt.
1983 Wilenergy(ex Banshu Maru) 125 542 KM Awilco LNG V. Ships (UK) Ltd
1983 Wilpower(ex Bishu Maru) 125 929 KM Awilco LNG V. Ships (UK) Ltd
1984 Koto(ex Kotowaka Maru) 125 454 KM BW Gas BW Fleet Mngt
1984 LNG Finima(ex LNG 564) 133 000 GT Bonny Gas
Transport Nigeria LNG Ltd.
1984 Senshu Maru 125 835 KM Mitsui O.S.K. Lines MOL LNG Transport
1984 Wilgas(ex Dewa Maru) 125 877 KM Awilco LNG V. Ships (UK) Ltd
1985 Wakaba Maru 125 877 KM Mitsui O.S.K. Lines MOL LNG Transport
1988 Kayoh Maru 1 517 IHI Daiichi Tanker Co. Daiichi Tanker Co.
1989 LNG Maleo (Northwest Swallow) 127 708 KM Mitsui O.S.K. Lines MOL LNG Transport
1989 LNG Swift(Northwest Swift) 127 590 KM Nippon Yusen
Kaisha NYK LNG Shipmngt.
1989 Northwest Sanderling 127 525 KM Aust. LNG Ship Optg. STASCO (Shell)
1990 Ekaputra 137 012 KM P.T. Humpuss Humolco Trans Inc.
1990 Northwest Snipe 127 747 KM Aust. LNG Ship Optg. STASCO (Shell)
1991 Northwest Shearwater 127 500 KM Aust. LNG Ship Optg. BP Shipping
At the end of 2014, the fleet could be classified as follows :
According to containment system
According to cargo capacity
98
171
62
2917 5
39
According to the delivery date or the age of the ships
0 5 10 15 20 25 30 Age (years)
24 0 11
320
66
Volume (m3)25 000 50 000 90 000 170 000
MossRosenberg
Membrane Other
112
289
20
LNG tankers (cont’d.)
1992 Northwest Seaeagle 127 452 KM Aust. LNG Ship Optg. STASCO (Shell)
1993 Aman Bintulu 18 928 TZM MISC MISC
1993 Arctic Spirit(ex Arctic Sun) 89 880 IHI Teekay LNG
Partners Teekay Shpg. (Gla)
1993 LNG Flora 127 705 KM Nippon Yusen Kaisha NYK LNG Shipmngt.
1993 Northwest Sandpiper 127 500 KM Aust. LNG Ship Optg. STASCO (Shell)
1993 Polar Spirit(ex Polar Eagle) 89 880 IHI Teekay LNG
Partners Teekay Shpg. (Gla)
1994 Al Khaznah 135 496 KM National Gas Shpg. National Gas Shpg.
1994 Dwiputra 127 386 KM Mitsui O.S.K. Lines Humolco Trans Inc.
1994 Hyundai Utopia 125 182 KM Hyundai LNG Shipping Hyundai Ocean
1994 LNG Vesta 127 547 KM Mitsui O.S.K. Lines MOL LNG Transport
1994 Northwest Stormpetrel 127 606 KM Aust. LNG Ship
Optg. STASCO (Shell)
1994 Puteri Intan 130 405 GT MISC MISC
1994 Shahamah 135 496 KM National Gas Shpg. National Gas Shpg.
1994 YK Sovereign 127 125 KM SK Shipping Co. Ltd. SK Shipmngt.
1995 Ghasha 137 514 KM National Gas Shpg. National Gas Shpg.
1995 Hanjin Pyeong Taek 130 600 GT Hanjin Shipping Eusu ShipManagement
1995 Ish 137 540 KM National Gas Shpg. National Gas Shpg.
1995 Puteri Delima 130 405 GT MISC MISC
1995 Puteri Nilam 130 405 GT MISC MISC
1996 Al Khor 137 354 KM Nippon Yusen Kaisha NYK LNG Shipmngt.
1996 Al Zubarah 137 573 KM Mitsui O.S.K. Lines MOL LNG Transport
1996 Hyundai Greenpia 125 000 KM Hyundai LNG Shipping Hyundai Ocean
1996 Mraweh 137 000 KM National Gas Shpg. National Gas Shpg.
1996 Mubaraz 137 000 KM National Gas Shpg. National Gas Shpg.
1996 Puteri Zamrud 130 405 GT MISC MISC
1996 Surya Aki 19 474 KM P.T. Humpuss Mitsui O.S.K. Lines
1997 Al Hamra 137 000 KM National Gas Shpg. National Gas Shpg.
1997 Al Rayyan 135 358 KM K-Line K-Line Ship Mngt.
1997 Al Wajbah 137 354 KM Mitsui O.S.K. Lines MOL LNG Transport
1997 Aman Sendai 18 928 TZM MISC MISC
1997LNG Portovenere
(ex SNAM Portovenere)
65 000 GT SNAM S.P.A. Carbofin S.P.A.
1997 Puteri Firus 130 405 GT MISC MISC
1997 Umm Al Ashtan 137 000 KM National Gas Shpg. National Gas Shpg.
1998 Al Wakrah 135 358 KM Mitsui O.S.K. Lines MOL LNG Transport
1998 Aman Hakata 18 800 TZM MISC MISC
1998 Broog 135 466 KM Nippon Yusen Kaisha NYK LNG Shipmngt.
1998 LNG Lerici 65 000 GT SNAM S.P.A. Carbofin S.P.A.
1998 Zekreet 135 420 KM K-Line K-Line Ship Mngt.
1999 Al Bidda 135 279 KM Mitsui O.S.K. Lines MOL LNG Transport
1999 Doha 137 354 KM Nippon Yusen Kaisha NYK LNG Shipmngt.
1999 Hanjin Muscat 138 200 GT Hanjin Shipping Eusu ShipManagement
1999 Hyundai Technopia 135 000 KM Hyundai LNG Shipping Hyundai Ocean
1999 SK Summit 138 000 GT SK Shipping Co. Ltd. SK Shipmngt.
2000 Al Jasra 137 100 KM Nippon Yusen Kaisha NYK LNG Shipmngt.
2000 Golar Mazo 136 867 KM Golar LNG Golar Wilhelmsen
2000 Hanjin Ras Laffan 138 214 GT Hanjin Shipping Eusu ShipManagement
2000 Hanjin Sur 138 333 GT Hanjin Shipping Eusu ShipManagement
2000 Hyundai Aquapia 135 000 KM Hyundai LNG Shipping Hyundai Ocean
2000 Hyundai Cosmopia 135 000 KM Hyundai LNG Shipping Hyundai Ocean
2000 Hyundai Oceanpia 135 000 KM Hyundai LNG Shipping Hyundai Ocean
2000 K. Acacia 138 017 GT Korea Line KLCSM Co. Ltd.
2000 K. Freesia 135 256 GT Korea Line KLCSM Co. Ltd.
Built Vessel Name Capacity (m3) Cargo Owner
Company Manager Name
LNG CARRIER FLEET AT THE START OF 2015
LNG CARRIER DELIVERIES 2014
Vessel Name Type Built Date Capacity (m3) Owner Company Manager NameContainment
SystemIMO Number
Adam LNG LNG Carrier September 2014 161 870 Oman Shipping Co. Oman Shipping Co. TZM 9501186
Amani LNG Carrier November 2014 154 800 Brunei Gas Carriers Brunei Gas Carriers TZM 9661869
Asia Energy LNG Carrier September 2014 160 000 Chevron Transport Chevron Transport TZM 9606950
Asia Vision LNG Carrier June 2014 160 000 Chevron Transport Chevron Transport TZM 9606948
Clean Ocean LNG Carrier June 2014 161 881 Dynagas LNG Dynagas LNG TZM 9637492
Clean Planet LNG Carrier August 2014 161 814 Dynagas LNG Dynagas LNG TZM 9637507
Cool Runner LNG Carrier March 2014 160 000 Thenamaris B. Schulte (Hellas) TZM 9636797
Corcovado LNG LNG Carrier April 2014 160 106 Cardiff Marine Inc. TMS Cardiff Gas GT 9636711
Esshu Maru LNG Carrier December 2014 155 300 Mitsubishi Corp Mitsui O.S.K. Lines KM 9666560
Experience (RV) LNG/Regasification April 2014 173 660 Excelerate Energy Excelerate Energy GT 9638525
Gaslog Saratoga LNG Carrier December 2014 155 000 GasLog GasLog LNG Services TZM 9638903
Golar Bear LNG Carrier September 2014 160 000 Golar LNG Golar LNG TZM 9626039
Golar Crystal LNG Carrier May 2014 160 000 Golar LNG Golar LNG TZM 9624926
Golar Eskimo (RV) LNG/Regasification December 2014 160 000 Golar LNG Partners Golar Wilhelmsen TZM 9624940
Golar Frost LNG Carrier October 2014 160 000 Golar LNG Golar LNG TZM 9655042
Golar Glacier LNG Carrier October 2014 162 000 Golar LNG Golar LNG TZM 9654696
Golar Igloo (RV) LNG/Regasification February 2014 170 000 Golar LNG Partners Golar LNG TZM 9633991
Golar Penguin LNG Carrier September 2014 160 000 Golar LNG Golar LNG TZM 9624938
Hoegh Gallant (RV) LNG/Regasification November 2014 170 000 Höegh LNG Höegh LNG TZM 9653678
Independence (RV) LNG/Regasification March 2014 170 000 Höegh LNG Höegh LNG TZM 9629536
Kita LNG LNG Carrier July 2014 160 118 Cardiff Marine Inc. TMS Cardiff Gas GT 9636723
LNG Venus LNG Carrier November 2014 155 300 Osaka Gas Osaka Gas KM 9645736
Maran Gas Apollonia LNG Carrier January 2014 161 870 Maran Nakilat Maran Nakilat TZM 9633422
Maran Gas Delphi LNG Carrier February 2014 159 800 Maran Nakilat Maran Nakilat GT 9633173
Maran Gas Efessos LNG Carrier June 2014 159 800 Maran Nakilat Maran Nakilat GT 9627497
Maran Gas Posidonia LNG Carrier May 2014 161 870 Maran Nakilat Maran Nakilat TZM 9633434
Pacific Arcadia LNG Carrier October 2014 147 200 Nippon Yusen Kaisha Nippon Yusen Kaisha KM 9621077
Palu LNG LNG Carrier October 2014 160 000 Cardiff Marine Inc. TMS Cardiff Gas GT 9636735
PGN FSRU Lampung FSRU April 2014 170 000 Höegh LNG Höegh LNG TZM 9629524
Pskov LNG Carrier August 2014 170 200 Sovcomflot JSC Unicom Mngt GT 9630028
Seishu Maru LNG Carrier September 2014 155 300 Mitsubishi Corp Nippon Yusen Kaisha KM 9666558
Solaris LNG Carrier June 2014 155 000 GasLog Gaslog LNG Services TZM 9634098
Velikiy Novgorod LNG Carrier January 2014 170 567 Sovcomflot JSC Unicom Mngt GT 9630004
Yari LNG LNG Carrier November 2014 160 000 Cardiff Marine Inc. TMS Cardiff Gas GT 9636747
• 34 ships were delivered in 2014 including one Floating Storage Regasification Unit (FSRU) and 5 Regasification Vessels (RVs) :
Source: Clarkson Research, 2015
• In 2014, 77 new orders were placed, including 2 FSRUs.
• At the end of 2014, the orderbook comprised of 163 vessels, 144 of which were above 50,000 cubic meters. 47 of these vessels were scheduled for delivery in 2015.
• The orderbook included 3 FSRUs and 5 RVs, 5 of which were scheduled for delivery in 2015.
16 - GIIGNL / THE LNG INDUSTRY
LNG CARRIER FLEET (cont’d.)
GIIGNL / THE LNG INDUSTRY - 17
2000 LNG Jamal 135 333 KM Nippon Yusen Kaisha NYK LNG Shipmngt.
2000 SK Splendor 138 375 TZM SK Shipping Co. Ltd. SK Shipmngt.
2000 SK Stellar 138 375 TZM SK Shipping Co. Ltd. SK Shipmngt.
2000 SK Supreme 138 200 TZM SK Shipping Co. Ltd. SK Shipmngt.
2000 Surya Satsuma 23 096 TZM Mitsui O.S.K. Lines Humolco Trans Inc.
2001Sohar LNG
(Lakshmi) 137 248 KM Oman Shipping Co. Oman Shipping Co.
2002 Abadi 136 912 KM Brunei Gas Carriers STASCO (Shell)
2002 British Trader 138 000 TZM BP Shipping BP Shipping
2002 Excalibur 138 034 GT Exmar Exmar Shipmngt.
2002 Galea 136 967 KM Shell Tank. (S'pore) STASCO (Shell)
2002 Gallina 137 001 KM Shell Tank. (S'pore) STASCO (Shell)
2002 Hispania Spirit(ex Fernando Tapias) 140 500 GT Teekay LNG
Partners Teekay Shpg. (Gla)
2002 LNG Rivers 137 231 KM Bonny Gas Transport Nigeria LNG Ltd.
2002 LNG Sokoto 137 231 KM Bonny Gas Transport Nigeria LNG Ltd.
2002 Puteri Delima Satu 137 100 GT MISC MISC
2002 Puteri Intan Satu 137 489 GT MISC MISC
2003FSRU Toscana
(ex Golar Frost - Livorno FSRU)
137 000 KM OLT Offshore ECOS
2003 British Innovator 138 287 TZM BP Shipping BP Shipping
2003 British Merchant 138 283 TZM BP Shipping BP Shipping
2003 BW GDF Suez Boston(ex BW Suez Boston) 138 059 GT BW Gas BW Fleet Mngt
2003 BW GDF Suez Everett(ex BW Suez Everett) 138 028 GT BW Gas BW Fleet Mngt
2003 Castillo de Villalba 138 000 GT Elcano Elcano
2003 Catalunya Spirit(ex Inigo Tapias) 138 000 GT Teekay LNG
Partners Teekay Shpg. (Gla)
2003 Energy Frontier 147 599 KM Tokyo LNG Tanker Co. Mitsui O.S.K. Lines
2003 Excel 138 106 GT Exmar Exmar Shipmngt.
2003 Golar Arctic(ex Granatina) 140 648 GT Golar LNG Golar Wilhelmsen
2003 LNG Bayelsa 137 500 KM Bonny Gas Transport Nigeria LNG Ltd.
2003 Methane Princess 138 000 GT Golar LNG Golar Wilhelmsen
2003 Pacific Notus 137 006 KM TEPCO NYK LNG Shipmngt.
2003 Puteri Nilam Satu 137 585 GT MISC MISC
2003 Shinju Maru No. 1 2 513 Other NS United Tanker NS United Tanker
2003 SK Sunrise 138 306 TZM I.S. Carriers S.A. Iino Marine Service
2004 Golar Winter 138 000 GT Golar LNG Golar Wilhelmsen
2004 Berge Arzew 138 088 GT BW Gas BW Fleet Mngt
2004 Bilbao Knutsen 138 000 GT Knutsen OAS Shipping
Knutsen OAS Shipping
2004 Cadiz Knutsen 138 826 GT Knutsen OAS Shipping
Knutsen OAS Shipping
2004 Disha 136 026 GT India LNG Transport Shpg Corp of India
2004 Dukhan 137 661 KM Mitsui O.S.K. Lines MOL LNG Europe
2004 Fuji LNG(ex Muscat LNG) 149 172 KM Cardiff Marine Inc. TMS Cardiff Gas
2004 Fuwairit 138 000 TZM Mitsui O.S.K. Lines MOL LNG Europe
2004 Galicia Spirit 140 624 GT Teekay LNG Partners Teekay Shpg. (Gla)
2004 Gemmata 136 985 KM STASCO (Shell) STASCO (Shell)
2004 Lalla Fatma N'Soumer 147 845 KM Algeria Nippon Gas Hyproc Shipping Co.
2004 LNG Akwa Ibom 141 038 KM Bonny Gas Transport Anglo-Eastern UK
2004 LNG River Orashi 145 914 GT BW Gas BW Fleet Mngt
2004 Madrid Spirit 138 000 GT Teekay LNG Partners Teekay Shpg. (Gla)
2004 Methane Kari Elin 138 209 TZM BG Asia Pacific Ltd. GasLog LNG Services
2004 Milaha Ras Laffan(ex Maersk Ras Laffan) 138 270 TZM Malt LNG Pronav Ship Mngt.
2004 Northwest Swan 138 000 GT Aust. LNG Ship Optg. Chevron Shpg. Co.
2004 Pioneer Knutsen 1 100 Other Knutsen OAS Shipping
Knutsen OAS Shipping
2004 Puteri Firus Satu 137 617 GT MISC MISC
2004 Puteri Zamrud Satu 137 100 GT MISC MISC
2004 Raahi 136 026 GT India LNG Transport Shpg Corp of India
2005 Al Deebel 145 130 TZM Mitsui O.S.K. Lines MOL LNG Europe
2005 Al Thakhira 145 130 TZM K-Line K Line LNG Shpg.
2005 Energy Advance 147 624 KM Tokyo LNG Tanker Co. Mitsui O.S.K. Lines
2005 Golar Viking(ex Gracilis) 140 208 TZM Golar LNG Golar Wilhelmsen
2005 LNG Adamawa 142 656 KM Bonny Gas Transport Anglo-Eastern UK
2005 LNG Cross River 141 000 KM Bonny Gas Transport Nigeria LNG Ltd.
2005 LNG Enugu 145 914 GT BW Gas BW Fleet Mngt
2005 LNG Oyo 145 842 GT BW Gas BW Fleet Mngt
2005 LNG Pioneer 138 000 GT Mitsui O.S.K. Lines MOL LNG Europe
2005 Lusail 145 000 TZM Nippon Yusen Kaisha NYK LNG Shipmngt.
2005 Maran Gas Asclepius(ex Rasgas Asclepius) 145 822 GT Maran Nakilat Maran Gas Maritime
2005 Nizwa LNG 147 684 KM Oman Shipping Co. Mitsui O.S.K. Lines
2005 North Pioneer 2 512 Other Japan Liquid Gas Iino Kaiun Kaisha
2005 Puteri Mutiara Satu 137 100 GT MISC MISC
2005 Salalah LNG 145 951 TZM Oman Shipping Co. Mitsui O.S.K. Lines
2005 Seri Alam 145 572 TZM MISC MISC
2005 Umm Bab 145 000 GT Maran Nakilat Maran Gas Maritime
2005 Excellence (RV) 138 120 GT Excelerate Energy Exmar Shipmngt.
2005 Excelsior (RV) 138 087 GT Exmar Exmar Shipmngt.
2006 Al Marrouna 149 539 GT Teekay LNG Partners Teekay Shpg. (Gla)
2006 Arctic Discoverer 142 612 KM K-Line K Line LNG Shpg.
2006 Arctic Lady 147 208 KM Höegh LNG Höegh LNG Fleet M.
2006 Arctic Princess 147 835 KM Höegh LNG Höegh LNG Fleet M.
2006 Arctic Voyager 142 929 KM K-Line K Line LNG Shpg.
2006 Energy Progress 147 558 KM Mitsui O.S.K. Lines MOL LNG Transport
2006
GDF Suez Global Energy
(ex Gaz de France Energy)
74 130 CS1 GDF Suez Gazocean S.A.
2006 Golar Grand(ex Grandis) 145 879 GT Golar LNG Golar Wilhelmsen
2006 Golar Maria(ex Granosa) 145 700 GT Golar LNG Partners Golar Wilhelmsen
2006 Iberica Knutsen 138 120 GT Knutsen OAS Shipping
Knutsen OAS Shipping
2006 Ibra LNG 147 100 TZM Oman Shipping Co. Mitsui O.S.K. Lines
2006 Ibri LNG 147 569 KM Oman Shipping Co. Mitsui O.S.K. Lines
2006 LNG Benue 145 842 GT BW Gas BW Fleet Mngt
2006 LNG Dream 145 000 KM Osaka Gas NYK LNG Shipmngt.
2006 LNG Lokoja 149 600 GT BW Gas BW Fleet Mngt
2006 LNG River Niger 141 000 KM Bonny Gas Transport Nigeria LNG Ltd.
2006 Methane Jane Elizabeth 145 000 TZM GasLog Partners GasLog LNG Services
2006 Methane Lydon Volney 145 000 TZM GasLog GasLog LNG Services
2006 Methane Rita Andrea 145 000 TZM GasLog Partners GasLog LNG Services
2006 Milaha Qatar(ex Maersk Qatar) 145 130 TZM Malt LNG Pronav Ship Mngt.
2006 Pacific Eurus 136 942 KM TEPCO NYK LNG Shipmngt.
2006 Provalys 154 472 CS1 GDF Suez Gazocean S.A.
2006 Seri Amanah 145 000 TZM MISC MISC
2006 Seri Anggun 145 731 TZM MISC MISC
2006 Seri Angkasa 145 000 TZM MISC MISC
2006 Simaisma 145 700 GT Maran Nakilat Maran Gas Maritime
2006 Stena Blue Sky(ex Bluesky) 145 819 GT Stena Bulk Northern Marine
Mngt
2006 Excelerate (RV) 138 074 GT Exmar Exmar
2007 Al Areesh 148 786 GT Teekay LNG Partners Teekay Shpg. (Gla)
2007 Al Daayen 148 853 GT Teekay LNG Partners Teekay Shpg. (Gla)
2007 Al Gattara 216 224 TZM Qatar Gas (Nakilat) OSG Shipmngt. UK
2007 Al Jassasiya 145 700 GT Maran Nakilat Maran Gas Maritime
2007 Al Ruwais 210 100 GT Pronav GmbH Pronav Ship Mngt.
2007 Al Safliya 210 134 GT Pronav GmbH Pronav Ship Mngt.
2007 British Emerald 154 983 TZM BP Shipping BP Shipping
2007 Celestine River(ex Neva River) 147 608 KM K-Line K Line LNG Shpg.
2007 Cheikh El Mokrani 74 365 TZM Hyproc Shipping Co. Hyproc Shipping Co.
2007 Clean Energy 149 700 TZM Dynagas LNG Dynagas LNG
2007 Ejnan 145 000 TZM Nippon Yusen Kaisha NYK LNG Shipmngt.
2007 Gaselys 154 472 CS1 GDF Suez Gazocean S.A.
2007 Grace Acacia 149 786 TZM Gazocean S.A. Gazocean S.A.
2007 Grace Barleria 149 700 TZM Nippon Yusen Kaisha NYK LNG Shipmngt.
2007 Grand Elena 147 200 KM Sovcomflot JSC NYK LNG Shipmngt.
2007 LNG Borno 149 600 TZM Nippon Yusen Kaisha NYK LNG Shipmngt.
2007 LNG Kano 149 600 GT BW Gas BW Fleet Mngt
2007 LNG Ogun 149 600 TZM Nippon Yusen Kaisha NYK LNG Shipmngt.
2007 LNG Ondo 148 300 GT BW Gas BW Fleet Mngt
2007 Maran Gas Coronis 145 700 GT Maran Nakilat Maran Gas Maritime
2007 Methane Alison Victoria 145 127 TZM GasLog GasLog LNG Services
2007 Methane Heather Sally 145 127 TZM GasLog GasLog LNG Services
2007 Methane Nile Eagle 145 144 GT BG Group GasLog LNG Services
2007 Methane Shirley Elisabeth 145 127 TZM GasLog GasLog LNG Services
2007 Neo Energy 149 700 TZM Tsakos Energy Nav. Hyundai Ocean
2007 OB River(ex Clean Power) 149 700 TZM Dynagas LNG Dynagas LNG
2007 Seri Ayu 145 894 TZM MISC MISC
2007 Seri Bakti 152 300 GT MISC MISC
2007 Seri Begawan 152 300 GT MISC MISC
2007 Sestao Knutsen 138 114 GT Knutsen OAS Shipping
Knutsen OAS Shipping
2007 Sun Arrows 19 100 KM Maple LNG Transport Mitsui O.S.K. Lines
2007 Tembek 216 000 TZM Qatar Gas (Nakilat) OSG Shipmngt. UK
2008 Al Aamriya 210 168 GT Nakilat, JC MOL LNG Europe
2008 Al Ghariya 210 100 GT Pronav GmbH Pronav Ship Mngt.
2008 Al Gharrafa 216 224 TZM Qatar Gas (Nakilat) OSG Shipmngt. UK
2008 Al Ghuwairiya 263 249 GT Qatar Gas (Nakilat) STASCO (Shell)
2008 Al Hamla 216 000 TZM Qatar Gas (Nakilat) OSG Shipmngt. UK
2008 Al Huwaila 217 000 TZM Teekay LNG Partners Teekay Shpg. (Gla)
2008 Al Kharsaah 217 000 TZM Teekay LNG Partners Teekay Shpg. (Gla)
2008 Al Khuwair 217 000 TZM Teekay LNG Partners Teekay Shpg. (Gla)
2008 Al Oraiq 210 100 GT Nakilat, JC K Line LNG Shpg.
2008 Al Sahla 216 200 TZM Nakilat, JC NYK LNG Shipmngt.
2008 Al Shamal 217 000 TZM Teekay LNG Partners Teekay Shpg. (Gla)
2008 Al Thumama 216 200 TZM Nakilat, JC NYK LNG Shipmngt.
2008 Al Utouriya 215 000 TZM Nakilat, JC NYK LNG Shipmngt.
2008 Alto Acrux 147 798 KM TEPCO NYK LNG Shipmngt.
2008 Arwa Spirit(ex Maersk Arwa) 165 500 TZM Malt LNG Teekay Shpg. (Gla)
2008 British Diamond 155 046 TZM BP Shipping BP Shipping
2008 British Ruby 155 000 TZM BP Shipping BP Shipping
2008 British Sapphire 155 000 TZM BP Shipping BP Shipping
2008 Bu Samra 267 335 TZM Qatar Gas (Nakilat) STASCO (Shell)
2008 Cheikh Bouamama 75 558 TZM Hyproc Shipping Co. Hyproc Shipping Co.
2008 Clean Force 149 743 TZM Dynagas LNG Dynagas LNG
2008 Dapeng Moon 147 210 GT CLNG CLNG
2008 Dapeng Sun 147 236 GT CLNG CLNG
2008 Duhail 210 100 GT Pronav GmbH Pronav Ship Mngt.
2008 Energy Navigator 147 558 KM Tokyo LNG Tanker Co. Mitsui O.S.K. Lines
2008 Fraiha 210 100 GT Nakilat, JC MOL LNG Europe
2008 Grace Cosmos 149 700 TZM Nippon Yusen Kaisha Gazocean S.A.
2008 Grand Aniva 147 200 KM Sovcomflot JSC Unicom Mngt
2008 Grand Mereya 145 964 KM Mitsui O.S.K. Lines MOL LNG Europe
2008 Hyundai Ecopia 149 700 GT Hyundai LNG Shipping Hyundai Ocean
2008 K. Jasmine 145 877 GT Korea Line KLCSM Co. Ltd.
2008 K. Mugungwha 151 812 GT Korea Line KLCSM Co. Ltd.
2008 Kakurei Maru 2 536 Other Tsurumi Sunmarine Tsurumi Sunmarine
2008 LNG Barka 155 982 KM Oman Shipping Co. Nippon Yusen Kaisha
2008 LNG Ebisu 147 546 KM Golar LNG Mitsui O.S.K. Lines
2008 LNG Imo 148 300 GT BW Gas BW Fleet Mngt
2008 Marib Spirit(ex Maersk Marib) 165 500 TZM Malt LNG Teekay Shpg. (Gla)
2008 Methane Spirit(ex Maersk Methane) 165 500 TZM Malt LNG Teekay Shpg. (Gla)
2008 Mozah 267 335 TZM Qatar Gas (Nakilat) STASCO (Shell)
2008 Murwab 210 100 GT Nakilat, JC MOL LNG Europe
2008 Seri Balhaf 152 300 GT MISC MISC
2008 Seri Bijaksana 152 888 GT MISC MISC
2008 Shinju Maru No. 2 2 536 Other NS United Tanker NS United Tanker
2008 STX Kolt 145 700 TZM Pan Ocean Co Ltd STX Marine Service
2008 Tangguh Batur 145 700 GT Sovcomflot JSC NYK LNG Shipmngt.
2008 Tangguh Foja 155 641 TZM K-Line K-Line Ship Mngt.
2008 Tangguh Hiri 155 000 TZM Teekay LNG Partners Teekay Shpg. (Gla)
2008 Tangguh Jaya 155 641 TZM K-Line K-Line Ship Mngt.
2008 Tangguh Towuti 145 700 GT Sovcomflot JSC NYK LNG Shipmngt.
2008 Trinity Arrow 154 982 TZM K-Line K Line LNG Shpg.
2008 Umm Al Amad 210 100 GT Nakilat, JC K Line LNG Shpg.
2008 Umm Slal 267 335 TZM Qatar Gas (Nakilat) STASCO (Shell)
2008 Explorer (RV) 151 008 GT Exmar Exmar
2009 Al Dafna 267 335 TZM Qatar Gas (Nakilat) STASCO (Shell)
2009 Al Ghashamiya 217 000 TZM Qatar Gas (Nakilat) STASCO (Shell)
2009 Al Karaana 210 100 GT Qatar Gas (Nakilat) STASCO (Shell)
2009 Al Kharaitiyat 216 200 TZM Qatar Gas (Nakilat) STASCO (Shell)
2009 Al Khattiya 210 100 GT Qatar Gas (Nakilat) STASCO (Shell)
2009 Al Mafyar 267 335 TZM Qatar Gas (Nakilat) STASCO (Shell)
2009 Al Mayeda 267 335 TZM Qatar Gas (Nakilat) STASCO (Shell)
2009 Al Nuaman 210 100 GT Qatar Gas (Nakilat) STASCO (Shell)
2009 Al Rekayyat 216 200 TZM Qatar Gas (Nakilat) STASCO (Shell)
2009 Al Sadd 210 100 GT Qatar Gas (Nakilat) STASCO (Shell)
2009 Al Samriya 261 700 GT Qatar Gas (Nakilat) STASCO (Shell)
2009 Al Sheehaniya 210 166 GT Qatar Gas (Nakilat) STASCO (Shell)
2009 Aseem 155 000 TZM India LNG Transport Shpg Corp of India
2009 BW GDF Suez Brussels 162 400 GT BW Gas BW Fleet Mngt
2009 BW GDF Suez Paris 162 400 GT BW Gas BW Fleet Mngt
2009 Cygnus Passage 147 200 KM Cygnus LNG Shipping NYK LNG Shipmngt.
2009 Dapeng Star 147 210 GT CLNG CLNG
2009 Energy Confidence 153 000 KM Tokyo LNG Tanker Co. Nippon Yusen Kaisha
2009 Lijmiliya 261 700 GT Qatar Gas (Nakilat) STASCO (Shell)
2009 LNG Jupiter 153 659 KM Nippon Yusen Kaisha NYK LNG Shipmngt.
2009 Magellan Spirit(ex Maersk Magellan) 165 500 TZM Malt LNG Malt LNG
2009 Mekaines 267 335 TZM Qatar Gas (Nakilat) STASCO (Shell)
2009 Mesaimeer 216 200 TZM Qatar Gas (Nakilat) STASCO (Shell)
2009 Min Lu 147 210 GT CLNG CLNG
2009 Min Rong 147 000 GT CLNG CLNG
2009 Onaiza 210 100 GT Qatar Gas (Nakilat) STASCO (Shell)
2009 Pacific Enlighten 147 200 KM TEPCO NYK LNG Shipmngt.
2009 Seri Balqis 157 611 GT MISC MISC
2009 Shagra 267 335 TZM Qatar Gas (Nakilat) STASCO (Shell)
2009 Taitar No. 1 147 362 KM Nimic Ship Mngt. Nimic Ship Mngt.
2009 Taitar No. 2 147 500 KM Nimic Ship Mngt. Nimic Ship Mngt.
2009 Tangguh Palung 155 642 TZM K-Line K-Line Ship Mngt.
2009 Tangguh Sago 154 971 TZM Teekay LNG Partners Teekay Shpg. (Gla)
2009 Trinity Glory 154 999 TZM K-Line K Line LNG Shpg.
2009 Woodside Donaldson 165 936 TZM Malt LNG Teekay Shpg. (Gla)
Built Vessel Name Capacity (m3) Cargo Owner
Company Manager Name Built Vessel Name Capacity (m3) Cargo Owner
Company Manager Name Built Vessel Name Capacity (m3) Cargo Owner
Company Manager Name Built Vessel Name Capacity (m3) Cargo Owner
Company Manager Name
LNG CARRIER FLEET (cont’d.)
18 - GIIGNL / THE LNG INDUSTRY
LNG CARRIER FLEET (cont’d.)
2009 Coral Methane 7 500 Other Anthony Veder Anthony Veder
2009 Express (RV) 150 900 GT Exmar Exmar
2009 Exquisite (RV) 151 000 GT Excelerate Energy Exmar Shipmngt.
2009 GDF Suez Neptune (RV) 145 130 TZM Höegh LNG Höegh LNG Fleet M.
2010 Aamira 267 335 TZM Qatar Gas (Nakilat) STASCO (Shell)
2010 Al Bahiyav 210 185 GT Qatar Gas (Nakilat) STASCO (Shell)
2010 Barcelona Knutsen 173 400 GT Knutsen OAS Shipping
Knutsen OAS Shipping
2010 Castillo de Santisteban 173 673 GT Elcano Elcano
2010 GasLog Chelsea(ex STX Frontier) 153 000 TZM GasLog GasLog LNG Services
2010 GasLog Savannah 155 000 TZM GasLog GasLog LNG Services
2010 GasLog Singapore 155 000 TZM GasLog GasLog LNG Services
2010 GDF Suez Point Fortin 154 914 TZM Trinity LNG Carrier MOL LNG Europe
2010 Gigira Laitebo(ex Abdelkader) 155 000 TZM Mitsui O.S.K. Lines MOL LNG Europe
2010 Meridian Spirit(ex Maersk Meridian) 165 772 TZM Malt LNG Malt LNG
2010 Methane Becki Anne 170 678 GT BG Group GasLog LNG Services
2010 Methane Julia Louise 170 000 TZM BG Group GasLog LNG Services
2010 Methane Mickie Harper 170 000 GT BG Group GasLog LNG Services
2010 Methane Patricia Camila 170 000 TZM BG Group GasLog LNG Services
2010 Rasheeda 267 335 TZM Qatar Gas (Nakilat) STASCO (Shell)
2010 Ribera Del Duero Knutsen 173 400 GT Knutsen OAS
ShippingKnutsen OAS
Shipping
2010 Sevilla Knutsen 173 400 GT Knutsen OAS Shipping
Knutsen OAS Shipping
2010 Spirit of Hela(ex Ben Badis) 173 010 TZM Mitsui O.S.K. Lines MOL LNG Europe
2010 Taitar No. 3 147 366 KM Nimic Ship Mngt. Nimic Ship Mngt.
2010 Taitar No. 4 147 546 KM Nimic Ship Mngt. Nimic Ship Mngt.
2010 Valencia Knutsen 173 400 GT Knutsen OAS Shipping
Knutsen OAS Shipping
2010 Zarga 267 335 TZM Qatar Gas (Nakilat) STASCO (Shell)
2010 Norgas Creation 10 030 Other Norgas Carriers Norgas Carriers
2010 Norgas Innovation 10 030 Other Norgas Carriers Norgas Carriers
2010 Exemplar (RV) 151 000 GT Excelerate Energy Exmar Shipmngt.
2010 Expedient (RV) 151 000 GT Excelerate Energy Excelerate Energy
2010 GDF Suez Cape Ann (RV) 145 130 TZM Höegh LNG Höegh LNG Fleet M.
2011 Akebono Maru 3 556 Other NS United Tanker NS United Tanker
2011 Amali 148 000 GT Brunei Shell Tankers STASCO (Shell)
2011 Arkat 147 228 GT Brunei Gas Carriers STASCO (Shell)
2011 Energy Horizon 177 441 KM Tokyo LNG Tanker Co. NYK LNG Shipmngt.
2011 Lobito 161 337 TZM MiNT LNG Teekay Shpg. (Gla)
2011 Malanje 160 400 TZM MiNT LNG Mitsui & Co
2011 Sonangol Benguela 160 500 GT Sonangol Chevron Shpg. Co.
2011 Sonangol Etosha 160 786 GT Sonangol Chevron Shpg. Co.
2011 Sonangol Sambizanga 160 785 GT Sonangol Chevron Shpg. Co.
2011 Soyo 161 337 TZM MiNT LNG Teekay Shpg. (Gla)
2011 Stena Clear Sky 173 593 GT Stena Bulk Northern Marine Mngt
2011 Stena Crystal Sky 173 611 GT Stena Bulk Northern Marine Mngt
2011 Bahrain Vision 12 022 Other Teekay LNG Partners Norgas Carriers
2011 Norgas Conception 10 030 Other Norgas Carriers Norgas Carriers
2011 Norgas Invention 10 030 Other Norgas Carriers Norgas Carriers
2011 Norgas Unikum 12 000 Other Teekay LNG Partners Norgas Carriers
2012 Coral Energy 15 600 Other Anthony Veder Anthony Veder
2012 Cubal 160 534 TZM MiNT LNG NYK LNG Shipmngt.
2012 Shen Hai 147 210 GT CLNG CLNG
2013 Arctic Aurora 154 899 TZM Dynagas LNG Dynagas LNG
2013 Cool Voyager 160 372 TZM Thenamaris B. Schulte (Hellas)
2013 GasLog Santiago 155 000 TZM GasLog GasLog LNG Services
2013 GasLog Seattle 155 000 TZM GasLog GasLog LNG Services
2013 GasLog Shanghai 155 000 TZM GasLog GasLog LNG Services
2013 GasLog Skagen 155 000 TZM GasLog GasLog LNG Services
2013 GasLog Sydney 155 000 TZM GasLog GasLog LNG Services
2013 Golar Celsius 160 000 TZM Golar LNG Golar LNG
2013 Golar Seal 160 000 TZM Golar LNG Golar LNG
2013 Grace Dahlia 177 630 KM Nippon Yusen Kaisha NYK LNG Shipmngt.
2013 Kakuyu Maru 2 538 Other Tsurumi Sunmarine Tsurumi Sunmarine
2013 Lena River 155 165 TZM Dynagas LNG Dynagas LNG
2013 Wilforce 156 007 GT Teekay LNG Partners Awilco LNG Technical
2013 Wilpride 156 007 GT Teekay LNG Partners Awilco LNG Technical
2013 Woodside Goode 159 662 GT Maran Gas Maritime Maran Gas Maritime
2013 Woodside Rogers 160 668 GT Maran Gas Maritime Maran Gas Maritime
2013 Yenisei River 155 000 TZM Dynagas LNG Dynagas LNG
2013 Coral Anthelia 6 500 Other Anthony Veder Anthony Veder
2014
PGN FSRU Lampung(ex Höegh LNG
Newbuild 2 Medan PGN FSRU)
170 000 TZM Höegh LNG Höegh LNG
2014 Adam LNG 161 870 TZM Oman Shipping Co. Oman Shipping Co.
2014 Amani 154 800 TZM Brunei Gas Carriers Brunei Gas Carriers
2014 Asia Energy 160 000 TZM Chevron Transport Chevron Transport
2014 Asia Vision 160 000 TZM Chevron Transport Chevron Transport
2014 Clean Ocean 161 881 TZM Dynagas LNG Dynagas LNG
2014 Clean Planet 161 814 TZM Dynagas LNG Dynagas LNG
2014 Cool Runner 160 000 TZM Thenamaris B. Schulte (Hellas)
2014 Corcovado LNG 160 106 GT Cardiff Marine Inc. TMS Cardiff Gas
2014 Esshu Maru 155 300 KM Mitsubishi Corp Mitsui O.S.K. Lines
2014 Gaslog Saratoga 155 000 TZM GasLog GasLog LNG Services
2014 Golar Bear 160 000 TZM Golar LNG Golar LNG
2014 Golar Crystal 160 000 TZM Golar LNG Golar LNG
2014 Golar Frost 160 000 TZM Golar LNG Golar LNG
2014 Golar Glacier 162 000 TZM Golar LNG Golar LNG
2014 Golar Penguin 160 000 TZM Golar LNG Golar LNG
2014 Kita LNG 160 118 GT Cardiff Marine Inc. TMS Cardiff Gas
2014 LNG Venus 155 300 KM Osaka Gas Osaka Gas
2014 Maran Gas Apollonia 161 870 TZM Maran Nakilat Maran Nakilat
2014 Maran Gas Delphi 159 800 GT Maran Nakilat Maran Nakilat
2014 Maran Gas Efessos 159 800 GT Maran Nakilat Maran Nakilat
2014 Maran Gas Posidonia 161 870 TZM Maran Nakilat Maran Nakilat
2014 Pacific Arcadia 147 200 KM Nippon Yusen Kaisha Nippon Yusen Kaisha
2014 Palu LNG 160 000 GT Cardiff Marine Inc. TMS Cardiff Gas
2014 Pskov 170 200 GT Sovcomflot JSC Unicom Mngt
2014 Seishu Maru 155 300 KM Mitsubishi Corp Nippon Yusen Kaisha
2014 Solaris 155 000 TZM GasLog GasLog LNG Services
2014 Velikiy Novgorod 170 567 GT Sovcomflot JSC Unicom Mngt
2014 Yari LNG 160 000 GT Cardiff Marine Inc. TMS Cardiff Gas
2014 Experience (RV) 173 660 GT Excelerate Energy Excelerate Energy
2014 Golar Eskimo (RV) 160 000 TZM Golar LNG Partners Golar Wilhelmsen
2014 Golar Igloo (RV) 170 000 TZM Golar LNG Partners Golar LNG
2014 Hoegh Gallant (RV) 170 000 TZM Höegh LNG Höegh LNG
2014 Independence (RV) 170 000 TZM Höegh LNG Höegh LNG
Built Vessel Name Capacity (m3) Cargo Owner
Company Manager Name Built Vessel Name Capacity (m3) Cargo Owner
Company Manager Name
Source: Clarkson Research, 2015
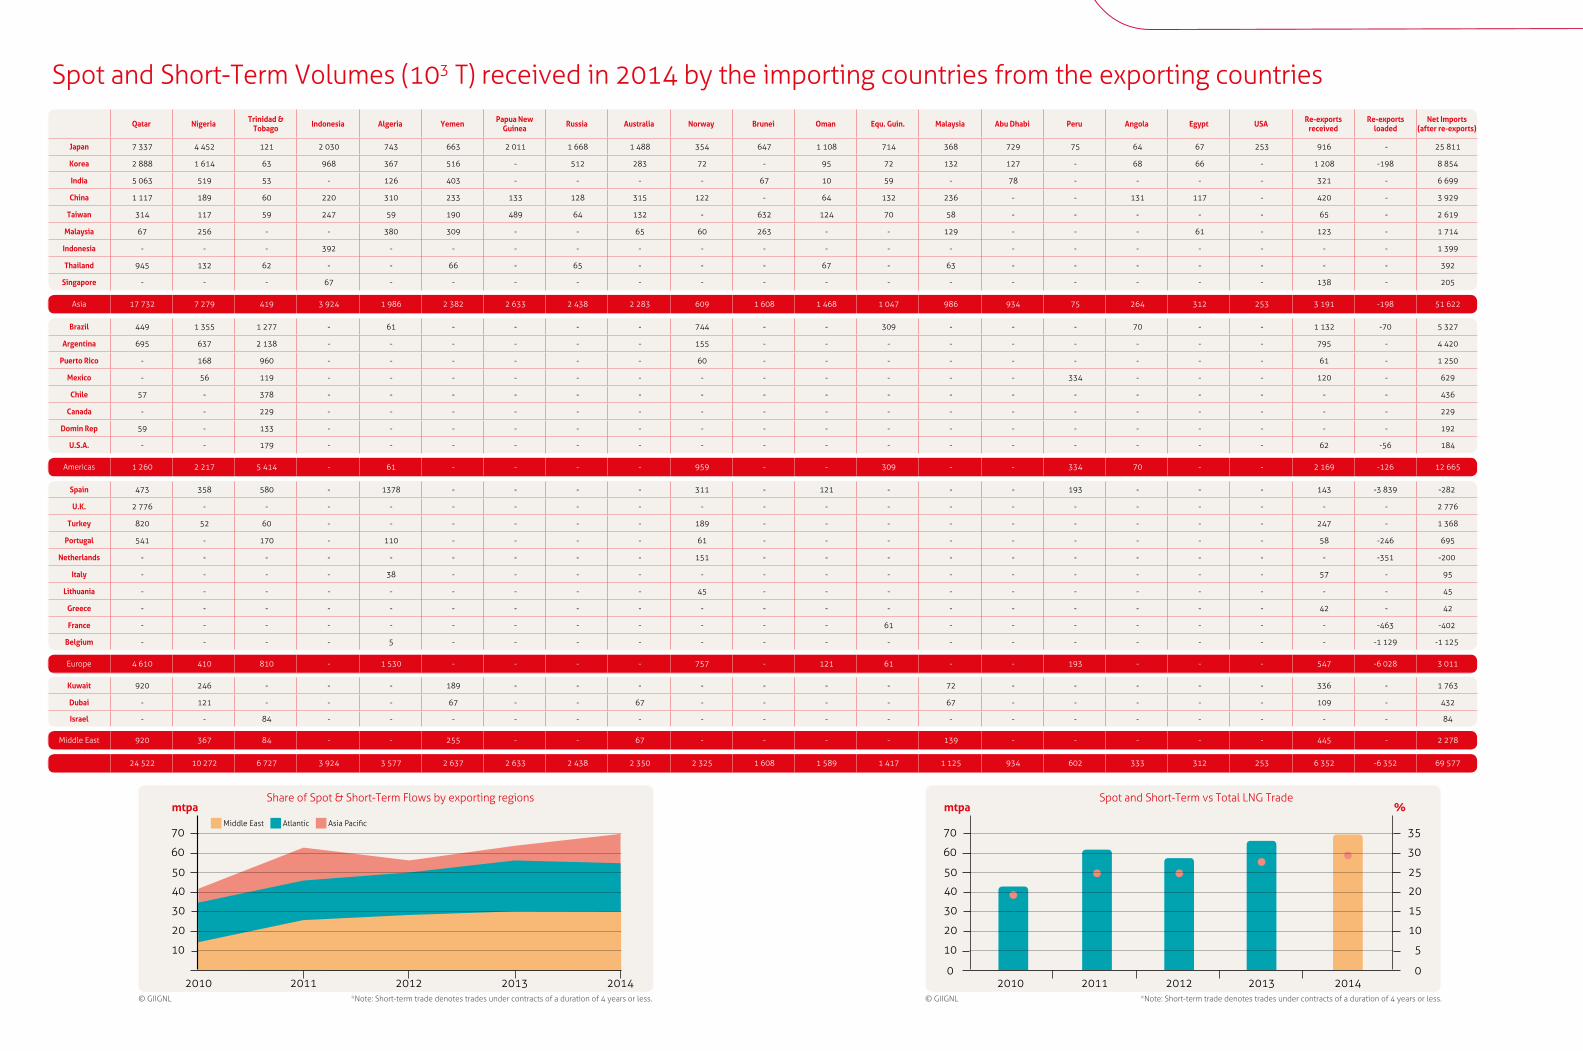
Spot and Short-Term Volumes (103 T) received in 2014 by the importing countries from the exporting countries
Qatar Nigeria Trinidad & Tobago Indonesia Algeria Yemen Papua New
Guinea Russia Australia Norway Brunei Oman Equ. Guin. Malaysia Abu Dhabi Peru Angola Egypt USA Re-exports received
Re-exports loaded
Net Imports(after re-exports)
Japan 7 337 4 452 121 2 030 743 663 2 011 1 668 1 488 354 647 1 108 714 368 729 75 64 67 253 916 - 25 811
Korea 2 888 1 614 63 968 367 516 - 512 283 72 - 95 72 132 127 - 68 66 - 1 208 -198 8 854
India 5 063 519 53 - 126 403 - - - - 67 10 59 - 78 - - - - 321 - 6 699
China 1 117 189 60 220 310 233 133 128 315 122 - 64 132 236 - - 131 117 - 420 - 3 929
Taiwan 314 117 59 247 59 190 489 64 132 - 632 124 70 58 - - - - - 65 - 2 619
Malaysia 67 256 - - 380 309 - - 65 60 263 - - 129 - - - 61 - 123 - 1 714
Indonesia - - - 392 - - - - - - - - - - - - - - - - - 1 399
Thailand 945 132 62 - - 66 - 65 - - - 67 - 63 - - - - - - - 392
Singapore - - - 67 - - - - - - - - - - - - - - - 138 - 205
Asia 17 732 7 279 419 3 924 1 986 2 382 2 633 2 438 2 283 609 1 608 1 468 1 047 986 934 75 264 312 253 3 191 -198 51 622
Brazil 449 1 355 1 277 - 61 - - - - 744 - - 309 - - - 70 - - 1 132 -70 5 327
Argentina 695 637 2 138 - - - - - - 155 - - - - - - - - - 795 - 4 420
Puerto Rico - 168 960 - - - - - - 60 - - - - - - - - - 61 - 1 250
Mexico - 56 119 - - - - - - - - - - - - 334 - - - 120 - 629
Chile 57 - 378 - - - - - - - - - - - - - - - - - - 436
Canada - - 229 - - - - - - - - - - - - - - - - - - 229
Domin Rep 59 - 133 - - - - - - - - - - - - - - - - - - 192
U.S.A. - - 179 - - - - - - - - - - - - - - - - 62 -56 184
Americas 1 260 2 217 5 414 - 61 - - - - 959 - - 309 - - 334 70 - - 2 169 -126 12 665
Spain 473 358 580 - 1 378 - - - - 311 - 121 - - - 193 - - - 143 -3 839 -282
U.K. 2 776 - - - - - - - - - - - - - - - - - - - - 2 776
Turkey 820 52 60 - - - - - - 189 - - - - - - - - - 247 - 1 368
Portugal 541 - 170 - 110 - - - - 61 - - - - - - - - - 58 -246 695
Netherlands - - - - - - - - - 151 - - - - - - - - - - -351 -200
Italy - - - - 38 - - - - - - - - - - - - - - 57 - 95
Lithuania - - - - - - - - - 45 - - - - - - - - - - - 45
Greece - - - - - - - - - - - - - - - - - - - 42 - 42
France - - - - - - - - - - - - 61 - - - - - - - -463 -402
Belgium - - - - 5 - - - - - - - - - - - - - - - -1 129 -1 125
Europe 4 610 410 810 - 1 530 - - - - 757 - 121 61 - - 193 - - - 547 -6 028 3 011
Kuwait 920 246 - - - 189 - - - - - - - 72 - - - - - 336 - 1 763
Dubai - 121 - - - 67 - - 67 - - - - 67 - - - - - 109 - 432
Israel - - 84 - - - - - - - - - - - - - - - - - - 84
Middle East 920 367 84 - - 255 - - 67 - - - - 139 - - - - - 445 - 2 278
24 522 10 272 6 727 3 924 3 577 2 637 2 633 2 438 2 350 2 325 1 608 1 589 1 417 1 125 934 602 333 312 253 6 352 -6 352 69 577
10
20
30
40
50
60
70
mtpa
2010 2011 2012 2013 2014
Middle East Atlantic Asia Pacific
Share of Spot & Short-Term Flows by exporting regions
10
0
5
0
20 10
30 15
40 20
50 25
60 30
70 35
mtpa %
2010 2011 2012 2013 2014
Spot and Short-Term vs Total LNG Trade
*Note: Short-term trade denotes trades under contracts of a duration of 4 years or less.© GIIGNL © GIIGNL *Note: Short-term trade denotes trades under contracts of a duration of 4 years or less.
Quantities (in 106 T) received in 2014 by the importing countries from the exporting countries
Qatar Malaysia Australia Nigeria Indonesia Trinidad & Tobago Algeria Russia Oman Yemen Brunei Abu Dhabi Peru Norway Equ. Guin. Papua New
Guinea Angola Egypt USA Re-exports received
Re-exports loaded
Net Imports(after re-exports)
Japan 16.25 15.14 18.53 4.84 5.77 0.12 0.74 8.41 3.45 0.97 4.38 5.87 0.07 0.29 0.91 2.14 0.06 0.07 0.25 0.92 - 89.20
South Korea 13.19 3.80 0.85 3.33 5.15 0.13 0.37 1.91 3.77 3.00 0.72 0.13 - 0.07 0.07 - 0.07 0.07 - 1.21 - 0.20 37.62
China 6.09 2.62 3.97 0.44 2.47 0.15 0.31 0.13 0.13 0.91 0.06 - - 0.12 0.64 0.28 0.13 0.12 - 0.42 - 18.98
India 12.14 - - 1.29 - 0.05 0.13 - 0.01 0.40 0.07 0.08 - - 0.06 - - - - 0.32 - 14.54
Taiwan 5.99 2.87 0.13 0.12 2.12 0.06 0.06 0.06 0.12 0.19 0.63 - - - 0.07 0.97 - - - 0.06 - 13.45
Singapore - - - - 0.07 0.28 - - - - - - - - 1.20 - - - - 0.14 - 1.68
Malaysia 0.07 0.13 0.06 0.26 - - 0.38 - - 0.31 0.26 - - - - - - 0.06 - 0.12 - 1.65
Indonesia - - - - 1.56 - - - - - - - - - - - - - - - - 1.56
Thailand 0.95 0.06 - 0.13 - 0.06 - 0.07 0.07 0.07 - - - - - - - - - - - 1.40
Asia 54.66 24.63 23.54 10.40 17.13 0.85 1.99 10.58 7.55 5.85 6.12 6.08 0.07 0.49 2.95 3.38 0.26 0.31 0.25 3.19 - 0.20 180.10
U.K. 7.89 - - 0.06 - 0.30 0.15 - - - - - - - - - - - - - - 8.40
Spain 2.30 - - 2.08 - 1.49 3.76 - 0.12 - - - 0.92 0.93 - - - - - 0.14 -3.84 7.90
Turkey 0.82 - - 1.09 - 0.06 3.05 - - - - - - 0.19 - - - - - 0.25 - 5.45
France 0.75 - - 0.82 - 0.06 3.23 - - - - - 0.06 0.06 0.06 - - - - - -0.46 4.58
Italy 3.12 - - - - 0.06 0.04 - - - - - - - - - - - - 0.06 - 3.27
Belgium 2.09 - - - - - 0.00 - - - - - - - - - - - - - -1.13 0.97
Portugal 0.54 - - 0.27 - 0.17 0.11 - - - - - - 0.06 - - - - - 0.06 -0.25 0.97
Netherlands 0.09 - - - - 0.16 - - - - - - - 0.51 - - - - - - -0.35 0.42
Greece - - - - - - 0.34 - - - - - - - - - - - - 0.04 - 0.38
Lithuania - - - - - - - - - - - - - 0.11 - - - - - - - 0.11
Europe 17.61 - - 4.32 - 2.29 10.68 - 0.12 - - - 0.98 1.86 0.06 - - - - 0.55 -6.03 32.44
Mexico 1.01 - - 1.77 0.25 0.33 - - - - - - 2.98 0.12 - - - - - 0.12 - 6.58
Brazil 0.45 - - 1.36 - 1.28 0.06 - - - - - - 0.75 0.31 - 0.07 - - 1.13 -0.07 5.33
Argentina 0.69 - - 0.64 - 2.14 - - - - - - - 0.15 - - - - - 0.80 - 4.42
Chile 0.06 - - - - 2.45 - - - - - - - - 0.06 - - - - - - 2.57
Puerto Rico - - - 0.17 - 0.96 - - - - - - - 0.06 - - - - - 0.06 - 1.25
U.S.A. - - - - - 0.87 - - - 0.17 - - - 0.12 - - - - - 0.06 -0.06 1.16
Domin Rep 0.06 - - - - 0.77 - - - - - - - - - - - - - - - 0.83
Canada - - - - - 0.40 - - - - - - - - - - - - - - - 0.40
Americas 2.27 - - 3.93 0.25 9.20 0.06 - - 0.17 - - 2.98 1.20 0.37 - 0.07 - - 2.17 -0.13 22.53
Kuwait 0.92 0.14 - 0.36 - 0.68 - - 0.06 0.19 - - - - - - - - - 0.34 - 2.68
Dubai 0.91 0.07 0.07 0.12 - - - - - 0.07 - - - - - - - - - 0.11 - 1.34
Israel - - - - - 0.08 - - - - - - - - - - - - - - - 0.08
Middle East 1.83 0.21 0.07 0.48 - 0.76 - - 0.06 0.26 - - - - - - - - - 0.45 - 4.10
76.37 24.83 23.60 19.14 17.38 13.09 12.72 10.58 7.73 6.27 6.12 6.08 4.03 3.55 3.38 3.38 0.33 0.31 0.25 6.35 -6.35 239.18

106 m3 liquid 106 t 109 m3 (n) gaseous Share (%) Var.2014/2013(%)
Belgium 2.13 0.97 1.21 0.4% -18.9%France 10.13 4.58 5.80 1.9% -22.9%Greece 0.84 0.38 0.48 0.2% -16.8%
Italy 7.23 3.27 4.13 1.4% -19.1%Lithuania 0.24 0.11 0.14 0.0% N/A
Netherlands 0.95 0.42 0.55 0.2% 15.7%Portugal 2.15 0.97 1.23 0.4% -35.4%
Spain 17.65 7.90 10.13 3.3% -13.5%Turkey 12.05 5.45 6.90 2.3% 24.0%
U.K. 18.55 8.40 10.60 3.5% 21.5%
Europe 71.93 32.44 41.16 13.6% -4.4%
Argentina 10.00 4.42 5.77 1.8% -6.4%Brazil 11.96 5.33 6.87 2.2% 28.5%Chile 5.95 2.57 3.46 1.1% -1.7%
Dominican Rep 1.91 0.83 1.11 0.3% -1.0%Mexico 14.61 6.58 8.37 2.8% 16.0%
Puerto Rico 2.87 1.25 1.66 0.5% 7.4%Canada 0.93 0.40 0.54 0.2% -47.1%
USA 2.67 1.16 1.55 0.5% -38.9%
Americas 50.90 22.53 29.34 9.4% 3.3%
China 41.77 18.98 23.83 7.9% 2.0%India 32.11 14.54 18.34 6.1% 11.4%
Indonesia 3.48 1.56 1.99 0.7% 9.0%Japan 195.18 89.20 111.07 37.3% 1.4%
South Korea 83.09 37.62 47.44 15.7% -6.8%Malaysia 3.66 1.65 2.09 0.7% 9.9%
Singapore 3.83 1.68 2.21 0.7% 84.8%Taiwan 29.63 13.45 16.91 5.6% 5.8%
Thailand 3.10 1.40 1.77 0.6% -3.2%
Asia 395.84 180.10 225.65 75.3% 1.2%
Dubai 2.95 1.34 1.69 0.6% 16.0%Israel 0.19 0.08 0.11 0.0% -79.2%
Kuwait 6.00 2.68 3.44 1.1% 69.1%
Middle East 9.15 4.10 5.24 1.7% 30.6%
Total 527.81 239.18 301.39 100% 1.0%
106 m3 liquid 106 t 109 m3 (n) gaseous Share (%) Var.2014/2013(%)
Algeria 28.10 12.72 16.09 5.3% 17.7%Angola 0.74 0.33 0.42 0.1% 1.3%Egypt 0.72 0.31 0.42 0.1% -88.3%
Equatorial Guinea 7.69 3.38 4.45 1.4% -10.4%Nigeria 42.37 19.14 24.19 8.0% 16.2%Norway 7.92 3.55 4.54 1.5% 16.3%
Trinidad & Tobago 30.38 13.09 17.67 5.5% -4.2%
Atlantic Basin 117.91 52.53 67.79 22.0% 3.5%
Abu Dhabi 13.01 6.08 7.37 2.5% 19.6%Oman 16.91 7.73 9.60 3.2% -7.5%Qatar 168.45 76.37 96.13 31.9% -2.1%
Yemen 14.18 6.27 8.18 2.6% -8.1%
Middle East 212.55 96.45 121.28 40.3% -1.9%
Australia 50.87 23.60 28.75 9.9% 5.3%Brunei 13.26 6.12 7.48 2.6% -12.6%
USA (Alaska) 0.60 0.25 0.35 0.1% N/AIndonesia 38.83 17.38 22.24 7.3% -5.3%Malaysia 53.87 24.83 30.66 10.4% -1.2%
Papua New Guinea 7.50 3.38 4.29 1.4% N/APeru 8.94 4.03 5.13 1.7% -5.2%
Russia 23.49 10.58 13.41 4.4% -1.0%
Pacific Basin 197.36 90.20 112.32 37.7% 2.7%
Total 527.81 239.18 301.39 100% 1.0%
LNG imports 2014 (net of re-exports)
Source of imports 2014
Export country Import country Re-exported volumes (Mt) Total (Mt)
Belgium
ARGENTINA 0.11
1.13
BRAZIL 0.09DUBAI 0.32
ITALY 0.23JAPAN 0.05
KOREA (SOUTH) 0.01PORTUGAL 0.12SINGAPORE 0.14
SPAIN 0.06
France
MEXICO 0.06
0.46
INDIA 0.07MALAYSIA 0.06
JAPAN 0.06KOREA (SOUTH) 0.11
BRAZIL 0.11
Netherlands*
ARGENTINA 0.08
0.35
BRAZIL 0.05ITALY 0.06
JAPAN 0.05KUWAIT 0.05SPAIN 0.06
Portugal ARGENTINA 0.06
0.25BRAZIL 0.18
Spain
ARGENTINA 0.47
3.84
BRAZIL 0.50CHINA 0.35DUBAI 0.06
GREECE 0.04INDIA 0.19JAPAN 0.62
KOREA (SOUTH) 0.78KUWAIT 0.27
MALAYSIA 0.06MEXICO 0.06
PUERTO RICO 0.06TAIWAN 0.06TURKEY 0.25
USA 0.06
Europe 6.03 6.03
Brazil ARGENTINA 0.070.13
USA BRAZIL 0.06
Americas 0.13 0.13
KOREA (SOUTH)CHINA 0.07
0.20INDIA 0.06JAPAN 0.07
Asia 0.20 0.20
World 6.35 6.35
International Re-exports
*Also re-exported 13 small-scale cargoes to Sweden for a total volume of 0.05 Mt
South KoreaSpain
BrazilBelgium
JapanFrance
ArgentinaNetherlands
ChinaPortugal
KuwaitSouth Korea
IndiaUSA
TurkeyBrazil
Other (11 countries)
19%
18%
14%13%
7%
5%
5%
4%
15%
Re-exports received by receiving country in 2014 (6.4 Mt) Re-exports loaded by reloading country in 2014 (6.4 Mt)
19 receiving countries 8 reloading countries
6%60%
7%
18%
4%1%1%3%
© GIIGNL

LNG Imports: 2014 vs 2013
-3.0
-2.5
-2.0
-1.5
-1.0
-0.5
0.0
0.5
1.0
1.5
2.0 Total: +2.3 MtEurope . . . . . . . . . . . . . . . . . . . . . . . . . . . . . . . . . . . . . . . . . . . . . . . . . . . . . . . . . -1.5US/Canada . . . . . . . . . . . . . . . . . . . . . . . . . . . . . . . . . . . . . . . . . . . . . . . . . . -1.1Latin America . . . . . . . . . . . . . . . . . . . . . . . . . . . . . . . . . . . . . . . . . . . +1.9Middle East . . . . . . . . . . . . . . . . . . . . . . . . . . . . . . . . . . . . . . . . . . . . . . . +1.0 Japan . . . . . . . . . . . . . . . . . . . . . . . . . . . . . . . . . . . . . . . . . . . . . . . . . . . . . . . . . . +1.2South Korea . . . . . . . . . . . . . . . . . . . . . . . . . . . . . . . . . . . . . . . . . . . . . . . -2.8Other Asia . . . . . . . . . . . . . . . . . . . . . . . . . . . . . . . . . . . . . . . . . . . . . . . . . +3.6
2013: 236.9 Mt2014: 239.2 Mt
Mt
Sout
h Ko
rea
Fran
ce
Chi
le
Mex
ico
Spai
n
Dom
inic
an R
ep
Turk
ey
Italy Net
herl
ands
Kuw
ait
USA Pu
erto
Ric
o
Braz
il
Port
ugal Li
thua
nia
Japa
n
Cana
da
Indo
nesi
a
U.K
.
Isra
el
Mal
aysi
a
Indi
a
Arge
ntin
a Dub
ai
Belg
ium Chi
na
Gre
ece
Taiw
an
Thai
land
Sing
apor
e
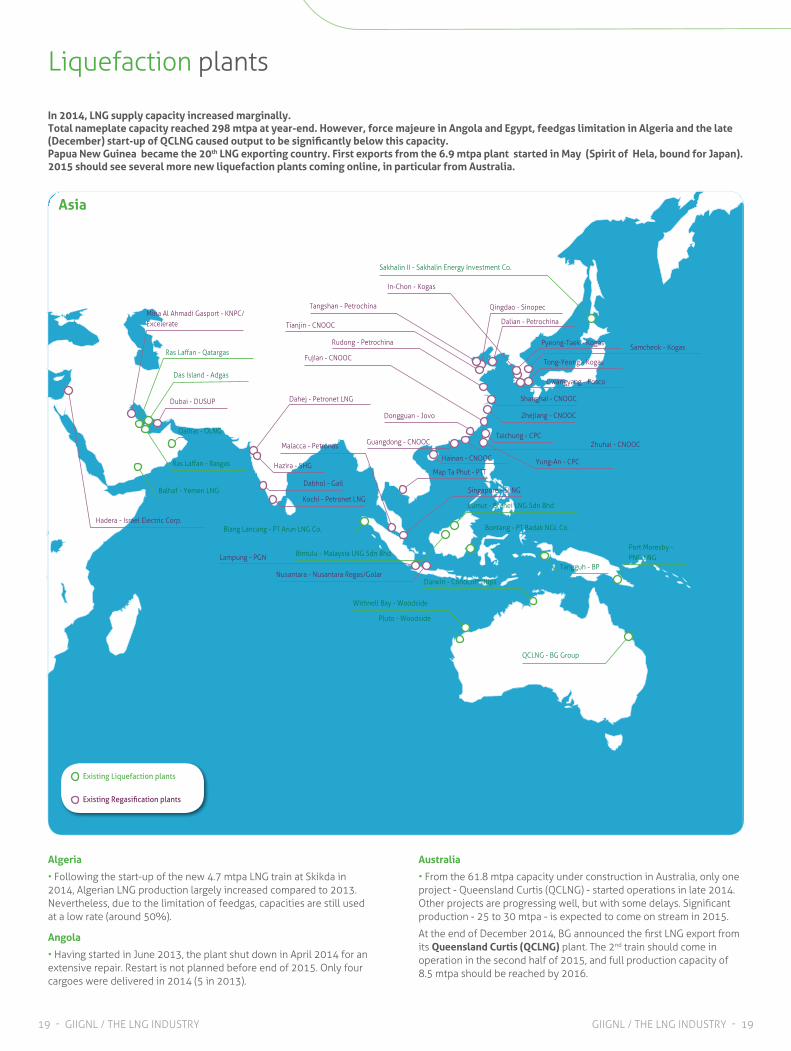
19 - GIIGNL / THE LNG INDUSTRY
Algeria
• Following the start-up of the new 4.7 mtpa LNG train at Skikda in 2014, Algerian LNG production largely increased compared to 2013. Nevertheless, due to the limitation of feedgas, capacities are still used at a low rate (around 50%).
Angola
• Having started in June 2013, the plant shut down in April 2014 for an extensive repair. Restart is not planned before end of 2015. Only four cargoes were delivered in 2014 (5 in 2013).
Australia
• From the 61.8 mtpa capacity under construction in Australia, only one project - Queensland Curtis (QCLNG) - started operations in late 2014. Other projects are progressing well, but with some delays. Significant production - 25 to 30 mtpa - is expected to come on stream in 2015.
At the end of December 2014, BG announced the first LNG export from its Queensland Curtis (QCLNG) plant. The 2nd train should come in operation in the second half of 2015, and full production capacity of 8.5 mtpa should be reached by 2016.
Liquefaction plants
In 2014, LNG supply capacity increased marginally.Total nameplate capacity reached 298 mtpa at year-end. However, force majeure in Angola and Egypt, feedgas limitation in Algeria and the late (December) start-up of QCLNG caused output to be significantly below this capacity.Papua New Guinea became the 20th LNG exporting country. First exports from the 6.9 mtpa plant started in May (Spirit of Hela, bound for Japan).2015 should see several more new liquefaction plants coming online, in particular from Australia.
Pyeong-Taek - KogasSamcheok - Kogas
Dalian - Petrochina
Qingdao - Sinopec
In-Chon - Kogas
Tangshan - Petrochina
Tianjin - CNOOC
Rudong - Petrochina
Tong-Yeong - Kogas
Gwangyang - Posco
Shanghai - CNOOC
Dabhol - Gail
Malacca - Petronas
Kochi - Petronet LNG
Zhejiang - CNOOC
Fujian - CNOOC
Guangdong - CNOOC
Dongguan - Jovo
Map Ta Phut - PTT
Singapore - SLNG
Zhuhai - CNOOCTaichung - CPC
Yung-An - CPC
Dahej - Petronet LNG
Hazira - SHG
Sakhalin II - Sakhalin Energy Investment Co.
Lumut - Brunei LNG Sdn Bhd
Bintulu - Malaysia LNG Sdn Bhd
Nusantara - Nusantara Regas/Golar
Bontang - PT Badak NGL Co.
Tangguh - BP
Port Moresby - PNG LNG
Darwin - ConocoPhillips
Withnell Bay - Woodside
Pluto - Woodside
Blang Lancang - PT Arun LNG Co.
Ras Laffan - Qatargas
Das Island - Adgas
Dubai - DUSUP
Mina Al Ahmadi Gasport - KNPC/Excelerate
Hadera - Israel Electric Corp.
Qalhat - OLNG
Ras Laffan - Rasgas
Balhaf - Yemen LNG
Existing Liquefaction plants
Existing Regasification plants
Asia
QCLNG - BG Group
Lampung - PGN
GIIGNL / THE LNG INDUSTRY - 19
Hainan - CNOOC
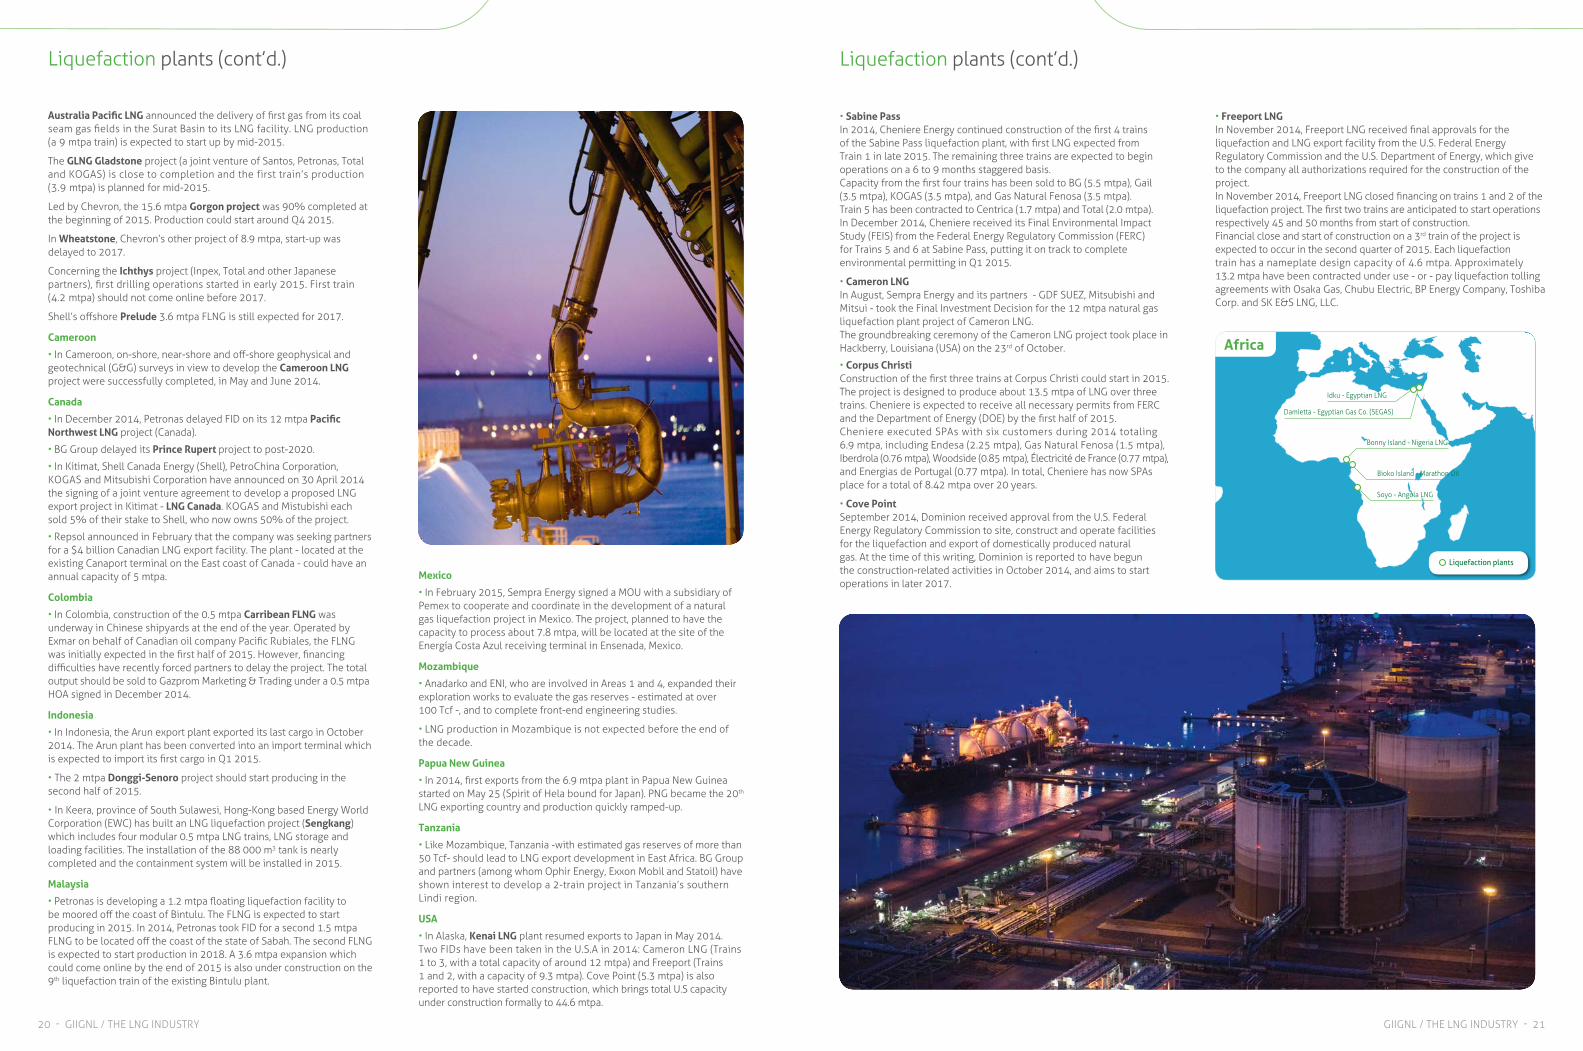
Australia Pacific LNG announced the delivery of first gas from its coal seam gas fields in the Surat Basin to its LNG facility. LNG production (a 9 mtpa train) is expected to start up by mid-2015.
The GLNG Gladstone project (a joint venture of Santos, Petronas, Total and KOGAS) is close to completion and the first train’s production (3.9 mtpa) is planned for mid-2015.
Led by Chevron, the 15.6 mtpa Gorgon project was 90% completed at the beginning of 2015. Production could start around Q4 2015.
In Wheatstone, Chevron’s other project of 8.9 mtpa, start-up was delayed to 2017.
Concerning the Ichthys project (Inpex, Total and other Japanese partners), first drilling operations started in early 2015. First train (4.2 mtpa) should not come online before 2017.
Shell’s offshore Prelude 3.6 mtpa FLNG is still expected for 2017.
Cameroon
• In Cameroon, on-shore, near-shore and off-shore geophysical and geotechnical (G&G) surveys in view to develop the Cameroon LNG project were successfully completed, in May and June 2014.
Canada
• In December 2014, Petronas delayed FID on its 12 mtpa Pacific Northwest LNG project (Canada).
• BG Group delayed its Prince Rupert project to post-2020.
• In Kitimat, Shell Canada Energy (Shell), PetroChina Corporation, KOGAS and Mitsubishi Corporation have announced on 30 April 2014 the signing of a joint venture agreement to develop a proposed LNG export project in Kitimat - LNG Canada. KOGAS and Mistubishi each sold 5% of their stake to Shell, who now owns 50% of the project.
• Repsol announced in February that the company was seeking partners for a $4 billion Canadian LNG export facility. The plant - located at the existing Canaport terminal on the East coast of Canada - could have an annual capacity of 5 mtpa.
Colombia
• In Colombia, construction of the 0.5 mtpa Carribean FLNG was underway in Chinese shipyards at the end of the year. Operated by Exmar on behalf of Canadian oil company Pacific Rubiales, the FLNG was initially expected in the first half of 2015. However, financing difficulties have recently forced partners to delay the project. The total output should be sold to Gazprom Marketing & Trading under a 0.5 mtpa HOA signed in December 2014.
Indonesia
• In Indonesia, the Arun export plant exported its last cargo in October 2014. The Arun plant has been converted into an import terminal which is expected to import its first cargo in Q1 2015.
• The 2 mtpa Donggi-Senoro project should start producing in the second half of 2015.
• In Keera, province of South Sulawesi, Hong-Kong based Energy World Corporation (EWC) has built an LNG liquefaction project (Sengkang) which includes four modular 0.5 mtpa LNG trains, LNG storage and loading facilities. The installation of the 88 000 m3 tank is nearly completed and the containment system will be installed in 2015.
Malaysia
• Petronas is developing a 1.2 mtpa floating liquefaction facility to be moored off the coast of Bintulu. The FLNG is expected to start producing in 2015. In 2014, Petronas took FID for a second 1.5 mtpa FLNG to be located off the coast of the state of Sabah. The second FLNG is expected to start production in 2018. A 3.6 mtpa expansion which could come online by the end of 2015 is also under construction on the 9th liquefaction train of the existing Bintulu plant.
Mexico
• In February 2015, Sempra Energy signed a MOU with a subsidiary of Pemex to cooperate and coordinate in the development of a natural gas liquefaction project in Mexico. The project, planned to have the capacity to process about 7.8 mtpa, will be located at the site of the Energía Costa Azul receiving terminal in Ensenada, Mexico.
Mozambique
• Anadarko and ENI, who are involved in Areas 1 and 4, expanded their exploration works to evaluate the gas reserves - estimated at over 100 Tcf -, and to complete front-end engineering studies.
• LNG production in Mozambique is not expected before the end of the decade.
Papua New Guinea
• In 2014, first exports from the 6.9 mtpa plant in Papua New Guinea started on May 25 (Spirit of Hela bound for Japan). PNG became the 20th LNG exporting country and production quickly ramped-up.
Tanzania
• Like Mozambique, Tanzania -with estimated gas reserves of more than 50 Tcf- should lead to LNG export development in East Africa. BG Group and partners (among whom Ophir Energy, Exxon Mobil and Statoil) have shown interest to develop a 2-train project in Tanzania’s southern Lindi region.
USA
• In Alaska, Kenai LNG plant resumed exports to Japan in May 2014. Two FIDs have been taken in the U.S.A in 2014: Cameron LNG (Trains 1 to 3, with a total capacity of around 12 mtpa) and Freeport (Trains 1 and 2, with a capacity of 9.3 mtpa). Cove Point (5.3 mtpa) is also reported to have started construction, which brings total U.S capacity under construction formally to 44.6 mtpa.
Liquefaction plants (cont’d.)
• Sabine PassIn 2014, Cheniere Energy continued construction of the first 4 trains of the Sabine Pass liquefaction plant, with first LNG expected from Train 1 in late 2015. The remaining three trains are expected to begin operations on a 6 to 9 months staggered basis.Capacity from the first four trains has been sold to BG (5.5 mtpa), Gail (3.5 mtpa), KOGAS (3.5 mtpa), and Gas Natural Fenosa (3.5 mtpa).Train 5 has been contracted to Centrica (1.7 mtpa) and Total (2.0 mtpa). In December 2014, Cheniere received its Final Environmental Impact Study (FEIS) from the Federal Energy Regulatory Commission (FERC) for Trains 5 and 6 at Sabine Pass, putting it on track to complete environmental permitting in Q1 2015.
• Cameron LNGIn August, Sempra Energy and its partners - GDF SUEZ, Mitsubishi and Mitsui - took the Final Investment Decision for the 12 mtpa natural gas liquefaction plant project of Cameron LNG.The groundbreaking ceremony of the Cameron LNG project took place in Hackberry, Louisiana (USA) on the 23rd of October.
• Corpus ChristiConstruction of the first three trains at Corpus Christi could start in 2015. The project is designed to produce about 13.5 mtpa of LNG over three trains. Cheniere is expected to receive all necessary permits from FERC and the Department of Energy (DOE) by the first half of 2015.Cheniere executed SPAs with six customers during 2014 totaling 6.9 mtpa, including Endesa (2.25 mtpa), Gas Natural Fenosa (1.5 mtpa), Iberdrola (0.76 mtpa), Woodside (0.85 mtpa), Électricité de France (0.77 mtpa), and Energias de Portugal (0.77 mtpa). In total, Cheniere has now SPAs place for a total of 8.42 mtpa over 20 years.
• Cove PointSeptember 2014, Dominion received approval from the U.S. Federal Energy Regulatory Commission to site, construct and operate facilities for the liquefaction and export of domestically produced natural gas. At the time of this writing, Dominion is reported to have begun the construction-related activities in October 2014, and aims to start operations in later 2017.
• Freeport LNGIn November 2014, Freeport LNG received final approvals for the liquefaction and LNG export facility from the U.S. Federal Energy Regulatory Commission and the U.S. Department of Energy, which give to the company all authorizations required for the construction of the project.In November 2014, Freeport LNG closed financing on trains 1 and 2 of the liquefaction project. The first two trains are anticipated to start operations respectively 45 and 50 months from start of construction.Financial close and start of construction on a 3rd train of the project is expected to occur in the second quarter of 2015. Each liquefaction train has a nameplate design capacity of 4.6 mtpa. Approximately 13.2 mtpa have been contracted under use - or - pay liquefaction tolling agreements with Osaka Gas, Chubu Electric, BP Energy Company, Toshiba Corp. and SK E&S LNG, LLC.
GIIGNL / THE LNG INDUSTRY - 2120 - GIIGNL / THE LNG INDUSTRY
Liquefaction plants (cont’d.)
Idku - Egyptian LNG
Damietta - Egyptian Gas Co. (SEGAS)
Bioko Island - Marathon Oil
Soyo - Angola LNG
Bonny Island - Nigeria LNG
Africa
Liquefaction plants

Liquefaction plants at the end of 2014
Country Site
Liquefaction Storage
Owner(s) Operator LT Buyer(s) Start-up date
Number of
trains
Nominal capacity106 t per
year
Number of
tanks
Totalcapacity
m3
Atlantic Basin
Algeria
Arzew-Bethioua
GL 1Z6 7.90 3 300 000 Sonatrach Sonatrach
GDF SUEZ, Botaş, ENI, Iberdrola, Depa, Cepsa
Gas, Statoil, Endesa1978
Arzew-Bethioua
GL 2Z6 8.20 3 300 000 Sonatrach Sonatrach
GDF SUEZ, Botaş, ENI, Iberdrola, Depa, Cepsa
Gas, Statoil, Endesa1981
Arzew-Bethioua
GL 3Z1 4.70 2 320 000 Sonatrach Sonatrach
GDF SUEZ, Botaş, ENI, Iberdrola, Depa, Cepsa
Gas, Statoil, Endesa2014
Skikda - GL1K/GL2K 3 3.20 5 308 000 Sonatrach Sonatrach
GDF SUEZ, Botaş, ENI, Iberdrola, Depa, Cepsa
Gas, Statoil, Endesa1972-1981
Angola Soyo 1 5.20 2 320 000
Angola LNG (Chevron 36.40%,
Sonangol 22.80%, BP 13.60%, ENI 13.60%,
Total 13.60%)
Chevron Angola LNG 2013
Egypt
Damietta 1 5 2 300 000Union Fenosa Gas
(80%), EGPC (10%), EGAS (10%)
SEGAS SERVICES BP, Union Fenosa Gas 2005
Idku 2 7.20 2 280 000
T1: BG (35.50%), Petronas (35.50%), GDF
SUEZ (5%), Egyptian LNG
(EGPC 12%, EGAS 12%)
LNOC Gas Natural Fenosa 2005
Equatorial Guinea Bioko Island 1 3.70 2 272 000
Marathon (60%), Sonagas (25%), Mitsui (8.50%),
Marubeni (6.50%)
EG LNG BG 2007
Libya (stopped) Marsa-el-Brega 4 3.20 2 96 000 LNOC LNOC Gas Natural Fenosa 1970
Nigeria
Bonny Island (NLNG T1-3) 3 9.60
3 336 800
Nigeria LNG (NNPC 49%), Shell (25.60%),
Total (15%), ENI (10.40%)
ShellEnel, Gas Natural
Fenosa, Botas, GDF SUEZ, GALP
1999-2002
Bonny Island (NLNG T4 & 5) 2 8.10
Nigeria LNG (NNPC 49%), Shell (25.60%),
Total (15%), ENI (10.40%)
Shell BG, Shell, Iberdrola, Endesa, GALP, Total, ENI 2006
Bonny Island (NLNG T6) 1 4.10 1 84 200
Nigeria LNG (NNPC 49%), Shell (25.60%),
Total (15%), ENI (10.40%)
Shell Total, Shell 2008
Norway Hammerfest 1 4.30 2 250 000
Statoil (36.79%), Petoro (30%), TOTAL (18.40%), GDF SUEZ (12%), RWE (2.81%)
Atlantic LNG 2007
Trinidad & Tobago
Point Fortin 4 15.50 4 524 000 Atlantic LNG 1999
Atlantic LNG T1 1 3.30 2 204 000
BP (34%), BG (26%), Shell (20%), CIC (10%),
NGC Trinidad (10%)
Atlantic LNG GDF SUEZ, Gas Natural Fenosa 1999
Atlantic LNG T2 & 3 2 7 1 160 000 BP (42.50%), BG
(32.50%), Shell (25%) Atlantic LNG BG, BP, Gas Natural Fenosa, Naturgas, Shell 2002-2003
Atlantic LNG T4 1 5.20 1 160 000
BP (37.80%), BG (28.90%),
Shell (22.20%) NGC Trinidad (11.10%)
Atlantic LNG BG, BP, Shell 2006
Middle-East
Abu Dhabi Das Island 3 5.80 3 240 000ADNOC (70%), Mitsui
(15%), BP (10%), Total (5%)
Adgas The Tokyo Electric Power Co. 1977
Oman Qalhat
2 7.10
2 240 000
Omani gvt (51%), Shell (30%), Total (5.50%),
Korea LNG (5%), Mitsubishi (2.80%),
Mitsui (2.80%), Partex (2%), Itochu (0.90%)
Oman LNG KOGAS, Shell, Osaka Gas, BP, Itochu 2000
1 3.60
Omani gvt (46.80%), Oman LNG (36.80%),
Union Fenosa Gas (7.40%), Osaka Gas
(3%), Mitsubishi (3%), Itochu (3%)
Qalhat LNGMitsubishi, Osaka Gas,
Union Fenosa Gas, Itochu
2006
GIIGNL / THE LNG INDUSTRY - 2322 - GIIGNL / THE LNG INDUSTRY
Country Site
Liquefaction Storage
Owner(s) Operator LT Buyer(s) Start-up date
Number of
trains
Nominal capacity106 t per
year
Number of
tanks
Totalcapacity
m3
Qatar
Ras Laffan (Qatargas 1 -
T1 & 2)2 6.40
4 340 000
Qatar Petroleum (65%), ExxonMobil (10%),
Total (10%), Marubeni (7.50%),
Mitsui (7.50%)
Qatargas I
Chubu Electric, The Chugoku Electric, The Kansai Electric, Osaka Gas, Toho Gas, Tohoku
Electric, Tokyo Gas, Tokyo Electric, Gas Natural Fenosa, PTT
1999
Ras Laffan (Qatargas
1 - T3)1 3.10
Qatar Petroleum (65%), ExxonMobil (10%),
Total (10%), Marubeni (7.50%),
Mitsui (7.50%)
Qatargas I Tokyo Gas 1999
Ras Laffan (Qatargas
2 - T1)1 7.80
8 1 160 000
Qatar Petroleum (70%), ExxonMobil (30%) Qatargas II ExxonMobil, Chubu 2009
Ras Laffan (Qatargas
2 - T2)1 7.80
Qatar Petroleum (65%),ExxonMobil
(18.30%),Total (16.70%)
Qatargas II ExxonMobil, Total, CNOOC 2009
Ras Laffan (Qatargas
3 - T1)1 7.80
Qatar Petroleum (68.50%),
ConocoPhillips (30%), Mitsui (1.5%)
Qatargas III ConocoPhilips, Shell, Centrica 2010
Ras Laffan (Qatargas
4 - T1)1 7.80 Qatar Petroleum (70%),
Shell (30%) Qatargas IV Shell, Petrochina, Marubeni 2011
Ras Laffan (Rasgas 1 -
T1 & 2)2 6.60
6 840 000
Qatar Petroleum (63%), ExxonMobil (25%), KOGAS (5%), Itochu
(4%), LNG Japan (3%)
RasGas I KOGAS, ENI 1999-2000
Ras Laffan (Rasgas 2 - T1) 1 4.70 Qatar Petroleum (70%),
ExxonMobil (30%) RasGas II Petronet LNG 2004
Ras Laffan (Rasgas 2 - T2) 1 4.70 Qatar Petroleum (70%),
ExxonMobil (30%) RasGas II Endesa, Edison 2005
Ras Laffan (RasGas 2 - T3) 1 4.70 Qatar Petroleum (70%),
ExxonMobil (30%) RasGas II Petronet, EDF, ENI, CPC March 2007
Ras Laffan (Rasgas 3 - T1) 1 7.80 Qatar Petroleum (70%),
ExxonMobil (30%) RasGas III Petronet, KOGAS August 2009
Ras Laffan (Rasgas 3 - T2) 1 7.80 Qatar Petroleum (70%),
ExxonMobil (30%) RasGas III ExxonMobil April 2010
Yemen Balhaf - T1 & 2 2 6.70 2 280 000
Yemen LNG (Total 39.60%, Hunt Oil
Co. 17.20%, SK Corp. 9.60%, KOGAS 6%,
Yemen Gas Co. 16.70%, Hyundai 5.90%,
GASSP 5%)
Yemen LNG KOGAS, GDF SUEZ, TotalOctober 2009 &
April 2010
Pacific Basin
Australia
Withnell Bay - Trains 1 - 4 4 12.10 4 260 000
Woodside, Shell, BHP, BP Australia,
Chevron (17% each) Mitsubishi ,
Mitsui (8% each)
Woodside
Tokyo Electric, Chubu Electric, Kansai Electric, The Chugoku
Electric, Kyushu Electric, Tokyo Gas, Osaka Gas, Shizuoka Gas, Tohoku Electric, Nippon Gas,
KOGAS, Shell, CNOOC
Trains 1 & 2: 1989; Train
3: 1992, Train 4: 2004
Withnell Bay - Train 5 1 4.30 1 65 000
Woodside, Shell, BHP, BP Australia,
Chevron (17% each) Mitsubishi,
Mitsui (8% each)
Woodside
Tokyo Electric., Chubu Electric, Kansai Electric, The Chugoku
Electric, Kyushu Electric, Tokyo Gas, Osaka Gas, Shizuoka Gas, Tohoku Electric, Nippon Gas, KOGAS, Shell Hazira
Gas, CNOOC
2008
Darwin 1 3.40 1 188 000
ConocoPhillips (57%), ENI, Santos, Inpex
(11% each) The Tokyo Electric Power Co. (6%),
Tokyo Gas (3%)
ConocoPhillips Tokyo Electric, Tokyo Gas 2006
Pluto 1 4.30 2 240 000Woodside (90%), The Kansai Electric (5%),
Tokyo Gas (5%)Woodside The Kansai Electric,
Tokyo Gas, Petronas 2012
Curtis Island 1 4.30 2 280 000 BG (50%), CNOOC (50%) BG BG, CNOOC 2014
Brunei Lumut 5 7.10 3 195 000Brunei gvt (50%),
Shell (25%), Mitsubishi (25%)
Brunei LNG Sdn BhdTokyo Gas, The Tokyo
Electric Power Co., Osaka Gas, KOGAS
1973
Liquefaction plants 2014 (cont’d.)

Country Site
Liquefaction Storage
Owner(s) Operator LT Buyer(s) Start-up dateNumber of
trains
Nominal capacity106 t per
year
Number of
tanks
Totalcapacity
m3
U.S.A. Kenai 1 0.40 3 108 000 ConocoPhillips ConocoPhillips Tokyo Gas, Tokyo Electric 1969
Indonesia
Blang LancangArun (ceased operations in October
2014)
5 636 000 Pertamina
PT Arun NGL Co. (Pertamina 55%, ExxonMobil 30%,
JILCO 15%)
KOGAS 1978-2014 (decommissioned)
Bontang - Badak (Total
capacity)8 22.30
6 630 000 PertaminaPertamina (55%), VICO
(BP, ENI, 20%), JILCO (15%), Total (10%)
Badak A & B 2
Kansai Electric, Chubu Electric, Kyushu Electric,
Osaka Gas, Toho Gas, Nippon Steel Co.
1977
Badak C & D 2Kansai Electric,
Chubu Electric, Osaka Gas, Toho Gas
1983
Badak E 1 CPC 1990
Badak F 1Tokyo Gas, Osaka Gas, Toho Gas, Hiroshima
Gas, Nippon Gas1994
Badak G 1 KOGAS 1998
Badak H 1 CPC 1998
Tangguh 2 7.60 2 340 000
Tangguh LNG (BP 37.16%, CNOOC 13.90%, JX Nippon 13.50%, Mitsubishi
9.90%, INPEX 7.80%, LNG Japan 7.40%, KG Berau 5%, Talisman
3.10%, Mitsui 2.30%)
Tangguh LNG
KOGAS, Posco, SK E&S, CNOOC, Chubu
Electric, Kansai Electric, Tohoku
Electric, Sempra LNG
2009
Malaysia
Bintulu MLNG 1 (Satu) 3 8.10
6 390 000
Petronas (90%), Mitsubishi (5%),
Sarawak state gvt (5%)Petronas
Tokyo Gas, Tokyo Electric., Saibu Gas,
Shikoku Electric, Hiroshima Gas
1983
Bintulu MLNG 2 (Dua) 3 7.80
Petronas (60%), Shell (15%),
Mitsubishi (15%), Sarawak state gvt (10%)
Malaysia LNG Dua
Chubu Electric, Tokyo Gas, Osaka Gas,
Toho Gas, The Kansai Electric, Shizuoka
Gas, Tohoku Electric, Sendai City Gas,
KOGAS, CPC
1995
Bintulu MLNG 2 (Dua) - debottleneck
1 1.50
Petronas (60%), Shell (15%),
Mitsubishi (15%), Sarawak state gvt
(10%)
Malaysia LNG Dua
Chubu Electric, Tokyo Gas, Osaka Gas,
Toho Gas, The Kansai Electric, Shizuoka
Gas, Tohoku Electric, Sendai City Gas,
KOGAS, CPC
2010
Bintulu MLNG 3 (Tiga) 2 6.80
Petronas (60%), Shell (15%), JX Nippon Oil (10%), Sarawak state
gvt (10%), Mitsubishi (5%)
Malaysia LNG Tiga
Tokyo Gas, Osaka Gas, Toho Gas,
Tohoku Electric, Japex, KOGAS,
CNOOC
2003
Papua New Guinea PNG LNG 2 6.90 2 320 000
Exxon Mobil (33.20%), Oil Search (29%),
Indep Public Business Corp (16.60%), Santos (13.50%), JX Nippon
(3.70%), MRDC (2.80%), Marubeni
(1%), Petromin PNG (0.20%)
PNG LNG CPC, Sinopec, Tokyo Electric, Osaka Gas 2014
Peru Peru LNG 1 4.45 2 260 000
Hunt Oil (50%), Shell (20%),
SK Energy (20%), Marubeni (10%)
Hunt Oil Shell 2010
Russia Sakhalin 2 2 9.55 2 200 000
Sakhalin Energy Invest Co. (Gazprom 50%,
Shell 27.50%, Mitsui 12.50%,
Mitsubishi 10%)
Sakhalin Energy Invest Co. (Gazprom 50%,
Shell 27.50%, Mitsui 12.50%,
Mitsubishi 10%)
Gazprom, Shell, KOGAS, Chubu
Electric, Hiroshima Gas, Kyushu Electric,
Osaka Gas, Saibu Gas, Toho Gas,
Tohoku Electric, Tokyo Electric., Tokyo
Gas
2009
Total 92 298 10 807 000
Liquefaction plants 2014 (cont’d.)
GIIGNL / THE LNG INDUSTRY - 2524 - GIIGNL / THE LNG INDUSTRY
Bangladesh
• The authorities have launched a tender to build a 3.5 mtpa onshore import terminal in Moheshkhali Island or in Anwara. The terminal would be set up on the build-own-operate basis and would supply gas to power plants. State company Petrobangla is also planning to install an FSRU in the Bay of Bengal.
Bahrain
• In 2014, Bahrain has revived its imports schemes by issuing a request for proposal for a 3 mtpa import terminal which would be located in Khalifa Bin Salman Port, on the North-Eastern coast.The project would be in the form of an LNG floating storage unit (FSU) combined with an onshore regasification plant. Start-up is expected the second half of 2017.
Belgium
• A second jetty is currently under construction at Zeebrugge. Commissioning is expected in 2015. The small scale LNG-infrastructure investment at the second jetty is co-financed by the European Union and will enable LNG ships as small as 2 000 m³ to berth whereas the minimum size is 7 500 m3 currently. Following a contract between ENI and Skangass, in 2015 and 2016 two small scale ship loadings shall take place per month, in order to transport LNG from Zeebrugge to Lysekill, Sweden.
Brazil
• In Brazil, the FSRU Golar Winter was moved from Guanabara Bay to the port of Baia de Todos os Santos in February. In Guanabara Bay, Excelerate’s FSRU Experience was delivered in April. The new terminal has a storage capacity of 173 400 m3 and a send-out capacity of around 8 Bcm/y.
Chile
• In Mejillones, a 187 000 m3 onshore tank is now operational and replaces the FSU. In Quintero, the Truck Loading Facility was expanded from 2 to 4 bays, or
Montoir - Elengy
Isle of Grain - National Grid Grain LNG, Ltd
Snohvit - Statoil
Milford Haven - South Hook LNG
Milford Haven - Dragon LNG
Teesside - Excelerate Energy
Bilbao - BBG
Sines - REN Atlantico
Huelva - Enagas
Mugardos - Reganosa
Sagunto - Saggas
Cartagena - Enagas
Barcelona - Enagas
Arzew - Sonatrach
Skikda - Sonatrach
Zeebrugge - Fluxys
Gate - Gate Terminal
Marsa-el-Brega - Sirte Oil Co.
Fos Tonkin - Elengy
Fos Cavaou - FosMax LNG
Panigaglia - GNL Italia
Porto Levante - Adriatic LNGOLT - Offshore LNG Toscana
Marmara Ereglisi - Botas
Aliaga - Egegaz
Revithoussa - DESFA
Liquefaction plants
Regasification plants
Mina Al Ahmadi Gasport - KPC
Europe
Klaipeda – Klaipeda LNG
Six new terminals with a combined capacity of 25.5 Bcm/y (20 mtpa) started receiving LNG in 2014. Five new terminals are located in Asia: in China (Qingdao and Hainan) , Japan (Hibiki), South Korea (Samcheok) and Indonesia (PGN FSRU Lampung) and one terminal in Europe: in Lithuania (Klaipeda). At the end of the year, 21 projects worldwide were under construction, with 15 of them located in Asia. 7 expansion projects were also underway.
from 1 250 m3 (per day) to 2 500 m3 per day, allowing the company to load up to 50 LNG trucks per day. With the installation of a new third vaporizer, Phase I Expansion Project will expand total capacity to about 15 millions m3 per day in early 2015. In 2014, President Michelle Bachelet announced that Chile would build a new liquefied natural gas terminal in the central-south region.
China
• China is currently adding massive regasification capacity. Two new terminals came online in 2014 :- The 3 mtpa Qingdao import terminal developed by Sinopec was commissioned in December with a cargo from Papua New Guinea. Sinopec has a 2mtpa long-term contract with PNG LNG.- The Hainan LNG terminal (CNOOC’s 7th terminal) which received a commissioning cargo from Qatar in August. The FSRU has a nameplate capacity of 3 mtpa and is the second terminal in China after Dalian to have reloading capabilities. Three terminals are being expanded:
• In Guangdong, a 4th tank with a capacity of 160 000 m3 is being constructed and is scheduled to be commissioned by September 2015.
• Jiangsu (Rudong) terminal: construction of a 4th storage tank of 200 000 m3, planned to be completed at the end of December. The terminal has
a send-out capacity of 3.5 mtpa.
• In Tianjin, currently operated with the FSRU Cape Ann, a land-based expansion project will increase the capacity to 6 mtpa.Six new terminals (Beihai, Shenzhen, Tianjin, Yantai, Yuedong and Zhangzhou) are also under construction, for a combined capacity of around 16 mtpa.
Colombia
• In November, Höegh signed a twenty year charter to provide a 5 Bcm/y FSRU to Colombia’s Sociedad Portuaria El Cayao (Spec). At the end of the year, the project was subject to environmental approval. Höegh LNG plans to employ FSRU#7 / HN2551 scheduled for delivery in May 2015.
Dominican Republic
• Construction work started on a new 1 mtpa receiving terminal developed by BW Gas. The terminal will use an FSRU or an FSU and it will supply a local power plant.
Egypt
• In Egypt, Höegh LNG signed a five year FSRU time charter contract with state company Egas. With a capacity of around 5 Bcm/y, the Höegh Gallant FSRU is expected to start operating in 2015.
Emirates
• The United Arab Emirates are planning to develop a 9 mtpa terminal in Fujairah with possible start-up in 2018.
France
• In Dunkirk, the construction of the 13 Bcm/y regasification plant was 83.7% complete at the end of 2014, on time and in line with budget. The terminal will include 3 storage tanks of 190 000 m3 and it will be able to accommodate Q-Max vessels.The 1st LNG commissioning vessel is planned during the summer 2015 and commercial start-up date remains scheduled for November 2015.
Regasification plants
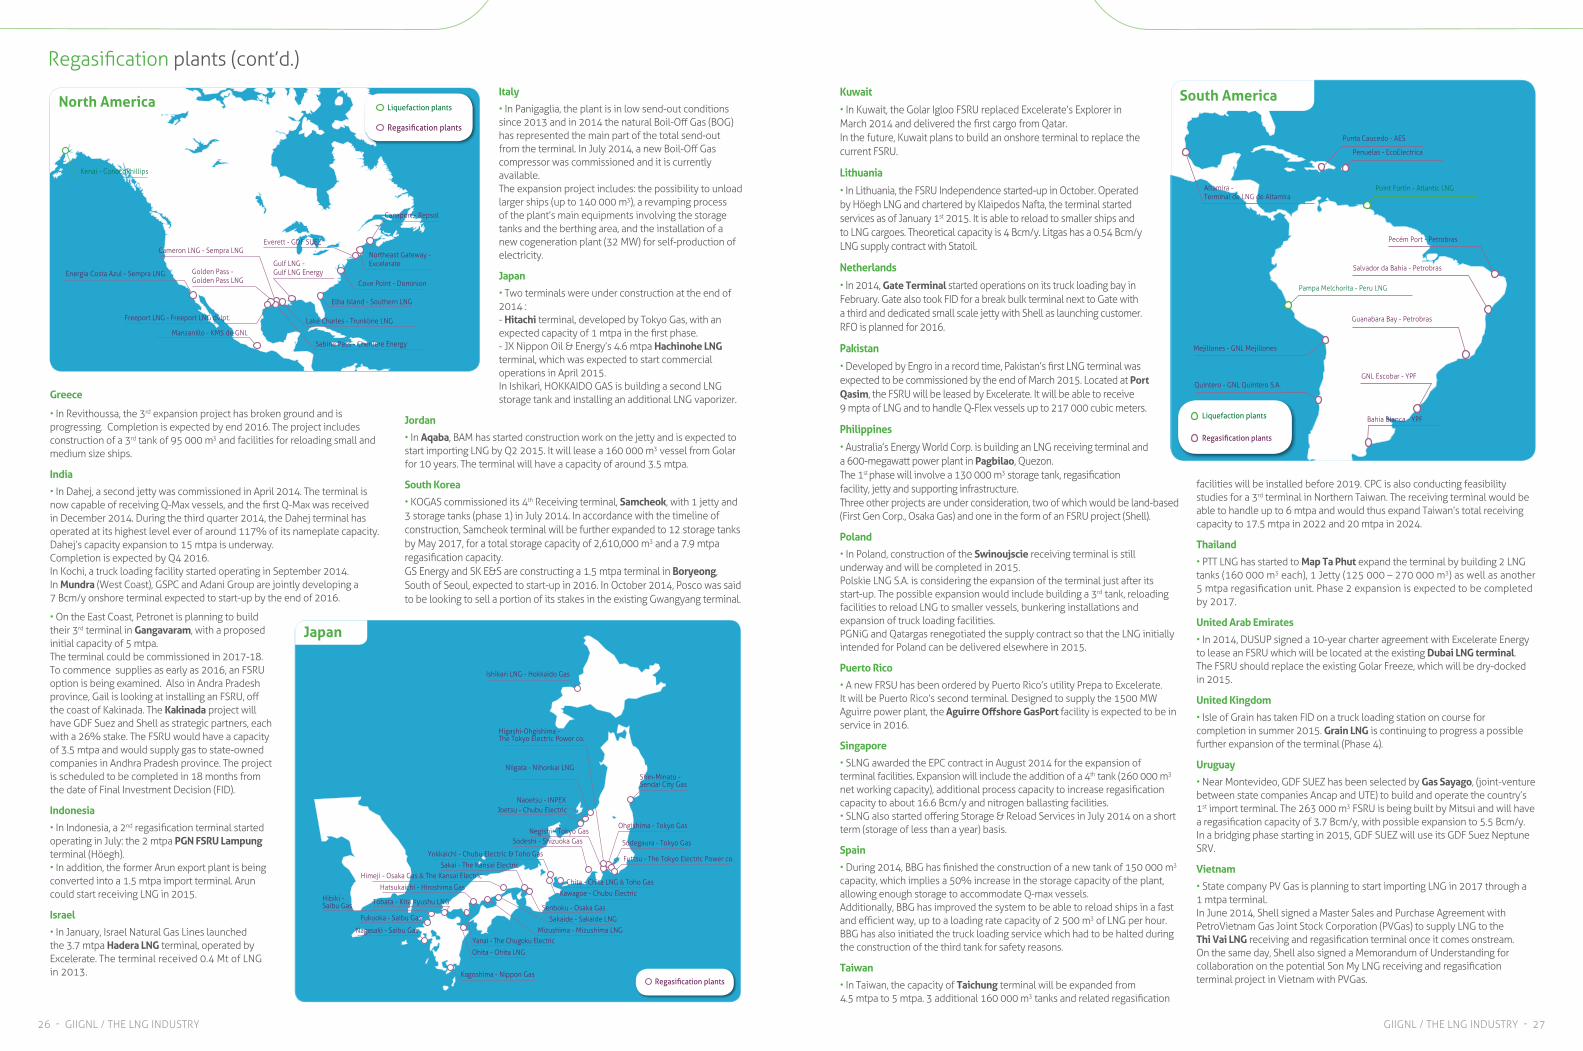
26 - GIIGNL / THE LNG INDUSTRY GIIGNL / THE LNG INDUSTRY - 27
Regasification plants (cont’d.)
Greece
• In Revithoussa, the 3rd expansion project has broken ground and is progressing. Completion is expected by end 2016. The project includes construction of a 3rd tank of 95 000 m3 and facilities for reloading small and medium size ships.
India
• In Dahej, a second jetty was commissioned in April 2014. The terminal is now capable of receiving Q-Max vessels, and the first Q-Max was received in December 2014. During the third quarter 2014, the Dahej terminal has operated at its highest level ever of around 117% of its nameplate capacity.Dahej’s capacity expansion to 15 mtpa is underway. Completion is expected by Q4 2016. In Kochi, a truck loading facility started operating in September 2014. In Mundra (West Coast), GSPC and Adani Group are jointly developing a 7 Bcm/y onshore terminal expected to start-up by the end of 2016.
• On the East Coast, Petronet is planning to build their 3rd terminal in Gangavaram, with a proposed initial capacity of 5 mtpa. The terminal could be commissioned in 2017-18. To commence supplies as early as 2016, an FSRU option is being examined. Also in Andra Pradesh province, Gail is looking at installing an FSRU, off the coast of Kakinada. The Kakinada project will have GDF Suez and Shell as strategic partners, each with a 26% stake. The FSRU would have a capacity of 3.5 mtpa and would supply gas to state-owned companies in Andhra Pradesh province. The project is scheduled to be completed in 18 months from the date of Final Investment Decision (FID).
Indonesia
• In Indonesia, a 2nd regasification terminal started operating in July: the 2 mtpa PGN FSRU Lampung terminal (Höegh). • In addition, the former Arun export plant is being converted into a 1.5 mtpa import terminal. Arun could start receiving LNG in 2015.
Israel
• In January, Israel Natural Gas Lines launched the 3.7 mtpa Hadera LNG terminal, operated by Excelerate. The terminal received 0.4 Mt of LNG in 2013.
Italy
• In Panigaglia, the plant is in low send-out conditions since 2013 and in 2014 the natural Boil-Off Gas (BOG) has represented the main part of the total send-out from the terminal. In July 2014, a new Boil-Off Gas compressor was commissioned and it is currently available.The expansion project includes: the possibility to unload larger ships (up to 140 000 m3), a revamping process of the plant’s main equipments involving the storage tanks and the berthing area, and the installation of a new cogeneration plant (32 MW) for self-production of electricity.
Japan
• Two terminals were under construction at the end of 2014 :- Hitachi terminal, developed by Tokyo Gas, with an expected capacity of 1 mtpa in the first phase.- JX Nippon Oil & Energy’s 4.6 mtpa Hachinohe LNG terminal, which was expected to start commercial operations in April 2015.In Ishikari, HOKKAIDO GAS is building a second LNG storage tank and installing an additional LNG vaporizer.
Jordan
• In Aqaba, BAM has started construction work on the jetty and is expected to start importing LNG by Q2 2015. It will lease a 160 000 m3 vessel from Golar for 10 years. The terminal will have a capacity of around 3.5 mtpa.
South Korea
• KOGAS commissioned its 4th Receiving terminal, Samcheok, with 1 jetty and 3 storage tanks (phase 1) in July 2014. In accordance with the timeline of construction, Samcheok terminal will be further expanded to 12 storage tanks by May 2017, for a total storage capacity of 2,610,000 m3 and a 7.9 mtpa regasification capacity. GS Energy and SK E&S are constructing a 1.5 mtpa terminal in Boryeong, South of Seoul, expected to start-up in 2016. In October 2014, Posco was said to be looking to sell a portion of its stakes in the existing Gwangyang terminal.
Point Fortin - Atlantic LNGAltamira - Terminal de LNG de Altamira
Pampa Melchorita - Peru LNG
Punta Caucedo - AES
Penuelas - EcoElectrica
Pecém Port - Petrobras
Salvador da Bahia - Petrobras
Guanabara Bay - Petrobras
Bahia Blanca - YPF
GNL Escobar - YPFQuintero - GNL Quintero S.A.
Mejillones - GNL Mejillones
South America
Liquefaction plants
Regasification plants
Kuwait
• In Kuwait, the Golar Igloo FSRU replaced Excelerate’s Explorer in March 2014 and delivered the first cargo from Qatar.In the future, Kuwait plans to build an onshore terminal to replace the current FSRU.
Lithuania
• In Lithuania, the FSRU Independence started-up in October. Operated by Höegh LNG and chartered by Klaipedos Nafta, the terminal started services as of January 1st 2015. It is able to reload to smaller ships and to LNG cargoes. Theoretical capacity is 4 Bcm/y. Litgas has a 0.54 Bcm/y LNG supply contract with Statoil.
Netherlands
• In 2014, Gate Terminal started operations on its truck loading bay in February. Gate also took FID for a break bulk terminal next to Gate with a third and dedicated small scale jetty with Shell as launching customer. RFO is planned for 2016.
Pakistan
• Developed by Engro in a record time, Pakistan’s first LNG terminal was expected to be commissioned by the end of March 2015. Located at Port Qasim, the FSRU will be leased by Excelerate. It will be able to receive 9 mpta of LNG and to handle Q-Flex vessels up to 217 000 cubic meters.
Philippines
• Australia’s Energy World Corp. is building an LNG receiving terminal and a 600-megawatt power plant in Pagbilao, Quezon.The 1st phase will involve a 130 000 m3 storage tank, regasification facility, jetty and supporting infrastructure. Three other projects are under consideration, two of which would be land-based (First Gen Corp., Osaka Gas) and one in the form of an FSRU project (Shell).
Poland
• In Poland, construction of the Swinoujscie receiving terminal is still underway and will be completed in 2015.Polskie LNG S.A. is considering the expansion of the terminal just after its start-up. The possible expansion would include building a 3rd tank, reloading facilities to reload LNG to smaller vessels, bunkering installations and expansion of truck loading facilities.PGNiG and Qatargas renegotiated the supply contract so that the LNG initially intended for Poland can be delivered elsewhere in 2015.
Puerto Rico
• A new FRSU has been ordered by Puerto Rico’s utility Prepa to Excelerate. It will be Puerto Rico’s second terminal. Designed to supply the 1500 MW Aguirre power plant, the Aguirre Offshore GasPort facility is expected to be in service in 2016.
Singapore
• SLNG awarded the EPC contract in August 2014 for the expansion of terminal facilities. Expansion will include the addition of a 4th tank (260 000 m3 net working capacity), additional process capacity to increase regasification capacity to about 16.6 Bcm/y and nitrogen ballasting facilities. • SLNG also started offering Storage & Reload Services in July 2014 on a short term (storage of less than a year) basis.
Spain
• During 2014, BBG has finished the construction of a new tank of 150 000 m3 capacity, which implies a 50% increase in the storage capacity of the plant, allowing enough storage to accommodate Q-max vessels. Additionally, BBG has improved the system to be able to reload ships in a fast and efficient way, up to a loading rate capacity of 2 500 m3 of LNG per hour. BBG has also initiated the truck loading service which had to be halted during the construction of the third tank for safety reasons.
Taiwan
• In Taiwan, the capacity of Taichung terminal will be expanded from 4.5 mtpa to 5 mtpa. 3 additional 160 000 m3 tanks and related regasification
facilities will be installed before 2019. CPC is also conducting feasibility studies for a 3rd terminal in Northern Taiwan. The receiving terminal would be able to handle up to 6 mtpa and would thus expand Taiwan’s total receiving capacity to 17.5 mtpa in 2022 and 20 mtpa in 2024.
Thailand
• PTT LNG has started to Map Ta Phut expand the terminal by building 2 LNG tanks (160 000 m3 each), 1 Jetty (125 000 – 270 000 m3) as well as another 5 mtpa regasification unit. Phase 2 expansion is expected to be completed by 2017.
United Arab Emirates
• In 2014, DUSUP signed a 10-year charter agreement with Excelerate Energy to lease an FSRU which will be located at the existing Dubai LNG terminal. The FSRU should replace the existing Golar Freeze, which will be dry-docked in 2015.
United Kingdom
• Isle of Grain has taken FID on a truck loading station on course for completion in summer 2015. Grain LNG is continuing to progress a possible further expansion of the terminal (Phase 4).
Uruguay
• Near Montevideo, GDF SUEZ has been selected by Gas Sayago, (joint-venture between state companies Ancap and UTE) to build and operate the country’s 1st import terminal. The 263 000 m3 FSRU is being built by Mitsui and will have a regasification capacity of 3.7 Bcm/y, with possible expansion to 5.5 Bcm/y. In a bridging phase starting in 2015, GDF SUEZ will use its GDF Suez Neptune SRV.
Vietnam
• State company PV Gas is planning to start importing LNG in 2017 through a 1 mtpa terminal.In June 2014, Shell signed a Master Sales and Purchase Agreement with PetroVietnam Gas Joint Stock Corporation (PVGas) to supply LNG to the Thi Vai LNG receiving and regasification terminal once it comes onstream. On the same day, Shell also signed a Memorandum of Understanding for collaboration on the potential Son My LNG receiving and regasification terminal project in Vietnam with PVGas.
Manzanillo - KMS de GNL
Sabine Pass - Cheniere Energy
Energia Costa Azul - Sempra LNG
Freeport LNG - Freeport LNG dvlpt.
Cameron LNG - Sempra LNG
Lake Charles - Trunkline LNG
Golden Pass - Golden Pass LNG
Elba Island - Southern LNG
Cove Point - Dominion
Everett - GDF SUEZ
Canaport - Repsol
Gulf LNG -Gulf LNG Energy
Northeast Gateway - Excelerate
Kenai - ConocoPhillips
Liquefaction plants
Regasification plants
North America
Nagasaki - Saibu Gas
Fukuoka - Saibu Gas
Tobata - Kita Kyushu LNG
Kagoshima - Nippon Gas
Ohita - Ohita LNG
Yanai - The Chugoku Electric
Hatsukaichi - Hiroshima Gas
Ishikari LNG - Hokkaido Gas
Mizushima - Mizushima LNG
Sakaide - Sakaide LNG
Himeji - Osaka Gas & The Kansai ElectricSakai - The Kansai Electric
Senboku - Osaka Gas
Yokkaichi - Chubu Electric & Toho Gas
Kawagoe - Chubu Electric
Chita - Chita LNG & Toho Gas
Sodeshi - Shizuoka GasNegishi - Tokyo Gas
Ohgishima - Tokyo Gas
Naoetsu - INPEX
Sodegaura - Tokyo Gas
Futtsu - The Tokyo Electric Power co.
Shin-Minato - Sendai City Gas
Niigata - Nihonkai LNG
Joetsu - Chubu Electric
Higashi-Ohgishima - The Tokyo Electric Power co.
Regasification plants
Japan
Hibiki -Saibu Gas
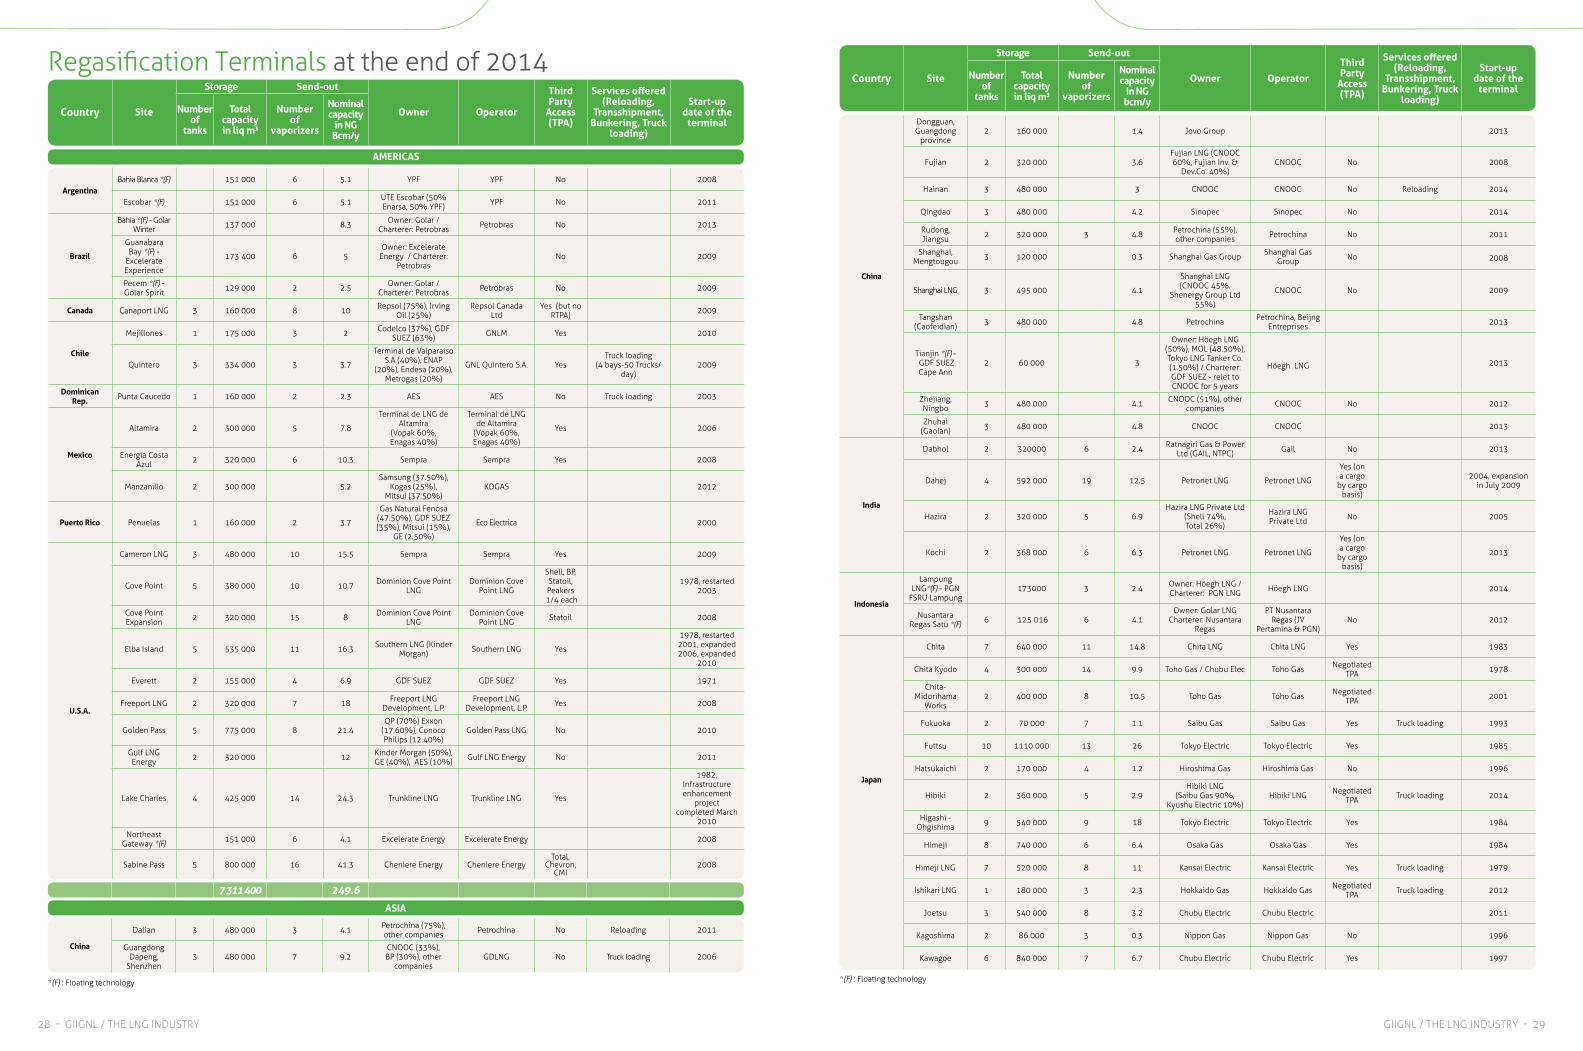
28 - GIIGNL / THE LNG INDUSTRY GIIGNL / THE LNG INDUSTRY - 29
China
Dongguan, Guangdong
province2 160 000 1.4 Jovo Group 2013
Fujian 2 320 000 3.6Fujian LNG (CNOOC 60%, Fujian Inv. &
Dev.Co. 40%)CNOOC No 2008
Hainan 3 480 000 3 CNOOC CNOOC No Reloading 2014
Qingdao 3 480 000 4.2 Sinopec Sinopec No 2014
Rudong, Jiangsu 2 320 000 3 4.8 Petrochina (55%),
other companies Petrochina No 2011
Shanghai, Mengtougou 3 120 000 0.3 Shanghai Gas Group Shanghai Gas
Group No 2008
Shanghai LNG 3 495 000 4.1
Shanghai LNG (CNOOC 45%,
Shenergy Group Ltd 55%)
CNOOC No 2009
Tangshan (Caofeidian) 3 480 000 4.8 Petrochina Petrochina, Beijng
Entreprises 2013
Tianjin *(F) - GDF SUEZ Cape Ann
2 60 000 3
Owner: Höegh LNG (50%), MOL (48.50%), Tokyo LNG Tanker Co. (1.50%) / Charterer: GDF SUEZ - relet to CNOOC for 5 years
Höegh LNG 2013
Zhejiang, Ningbo 3 480 000 4.1 CNOOC (51%), other
companies CNOOC No 2012
Zhuhai (Gaolan) 3 480 000 4.8 CNOOC CNOOC 2013
India
Dabhol 2 320 000 6 2.4 Ratnagiri Gas & Power Ltd (GAIL, NTPC) Gail No 2013
Dahej 4 592 000 19 12.5 Petronet LNG Petronet LNG
Yes (on a cargo
by cargo basis)
2004, expansion in July 2009
Hazira 2 320 000 5 6.9Hazira LNG Private Ltd
(Shell 74%, Total 26%)
Hazira LNG Private Ltd No 2005
Kochi 2 368 000 6 6.3 Petronet LNG Petronet LNG
Yes (on a cargo
by cargo basis)
2013
Indonesia
Lampung LNG*(F) - PGN
FSRU Lampung173 000 3 2.4 Owner: Höegh LNG /
Charterer: PGN LNG Höegh LNG 2014
Nusantara Regas Satu *(F) 6 125 016 6 4.1
Owner: Golar LNG Charterer: Nusantara
Regas
PT Nusantara Regas (JV
Pertamina & PGN)No 2012
Japan
Chita 7 640 000 11 14.8 Chita LNG Chita LNG Yes 1983
Chita Kyodo 4 300 000 14 9.9 Toho Gas / Chubu Elec Toho Gas Negotiated TPA 1978
Chita-Midorihama
Works2 400 000 8 10.5 Toho Gas Toho Gas Negotiated
TPA 2001
Fukuoka 2 70 000 7 1.1 Saibu Gas Saibu Gas Yes Truck loading 1993
Futtsu 10 1 110 000 13 26 Tokyo Electric Tokyo Electric Yes 1985
Hatsukaichi 2 170 000 4 1.2 Hiroshima Gas Hiroshima Gas No 1996
Hibiki 2 360 000 5 2.9Hibiki LNG
(Saibu Gas 90%, Kyushu Electric 10%)
Hibiki LNG Negotiated TPA Truck loading 2014
Higashi - Ohgishima 9 540 000 9 18 Tokyo Electric Tokyo Electric Yes 1984
Himeji 8 740 000 6 6.4 Osaka Gas Osaka Gas Yes 1984
Himeji LNG 7 520 000 8 11 Kansai Electric Kansai Electric Yes Truck loading 1979
Ishikari LNG 1 180 000 3 2.3 Hokkaido Gas Hokkaido Gas Negotiated TPA Truck loading 2012
Joetsu 3 540 000 8 3.2 Chubu Electric Chubu Electric 2011
Kagoshima 2 86 000 3 0.3 Nippon Gas Nippon Gas No 1996
Kawagoe 6 840 000 7 6.7 Chubu Electric Chubu Electric Yes 1997
Country Site
Storage Send-out
Owner Operator
Third Party
Access(TPA)
Services offered (Reloading,
Transshipment, Bunkering, Truck
loading)
Start-up date of the
terminalNumber
of tanks
Total capacity in liq m3
Number of
vaporizers
Nominal capacity
in NG bcm/y
Country Site
Storage Send-out
Owner Operator
Third Party
Access(TPA)
Services offered (Reloading,
Transshipment, Bunkering, Truck
loading)
Start-up date of the
terminalNumber
of tanks
Total capacity in liq m3
Number of
vaporizers
Nominal capacity
in NG Bcm/y
AMERICAS
ArgentinaBahia Blanca *(F) 151 000 6 5.1 YPF YPF No 2008
Escobar *(F) 151 000 6 5.1 UTE Escobar (50% Enarsa, 50% YPF) YPF No 2011
Brazil
Bahia *(F) - Golar Winter 137 000 8.3 Owner: Golar /
Charterer: Petrobras Petrobras No 2013
Guanabara Bay *(F) -
Excelerate Experience
173 400 6 5Owner: Excelerate
Energy / Charterer: Petrobras
No 2009
Pecem *(F) - Golar Spirit 129 000 2 2.5 Owner: Golar /
Charterer: Petrobras Petrobras No 2009
Canada Canaport LNG 3 160 000 8 10 Repsol (75%), Irving Oil (25%)
Repsol Canada Ltd
Yes (but no RTPA) 2009
Chile
Mejillones 1 175 000 3 2 Codelco (37%), GDF SUEZ (63%) GNLM Yes 2010
Quintero 3 334 000 3 3.7
Terminal de Valparaiso S.A (40%), ENAP
(20%), Endesa (20%), Metrogas (20%)
GNL Quintero S.A. YesTruck loading
(4 bays-50 Trucks/day)
2009
Dominican Rep. Punta Caucedo 1 160 000 2 2.3 AES AES No Truck loading 2003
Mexico
Altamira 2 300 000 5 7.8
Terminal de LNG de Altamira
(Vopak 60%, Enagas 40%)
Terminal de LNG de Altamira
(Vopak 60%, Enagas 40%)
Yes 2006
Energia Costa Azul 2 320 000 6 10.3 Sempra Sempra Yes 2008
Manzanillo 2 300 000 5.2Samsung (37.50%),
Kogas (25%), Mitsui (37.50%)
KOGAS 2012
Puerto Rico Penuelas 1 160 000 2 3.7
Gas Natural Fenosa (47.50%), GDF SUEZ (35%), Mitsui (15%),
GE (2.50%)
Eco Electrica 2000
U.S.A.
Cameron LNG 3 480 000 10 15.5 Sempra Sempra Yes 2009
Cove Point 5 380 000 10 10.7 Dominion Cove Point LNG
Dominion Cove Point LNG
Shell, BP, Statoil, Peakers
1/4 each
1978, restarted 2003
Cove Point Expansion 2 320 000 15 8 Dominion Cove Point
LNGDominion Cove
Point LNG Statoil 2008
Elba Island 5 535 000 11 16.3 Southern LNG (Kinder Morgan) Southern LNG Yes
1978, restarted 2001, expanded 2006, expanded
2010
Everett 2 155 000 4 6.9 GDF SUEZ GDF SUEZ Yes 1971
Freeport LNG 2 320 000 7 18 Freeport LNG Development, L.P.
Freeport LNG Development, L.P. Yes 2008
Golden Pass 5 775 000 8 21.4QP (70%) Exxon
(17.60%), Conoco Philips (12.40%)
Golden Pass LNG No 2010
Gulf LNG Energy 2 320 000 12 Kinder Morgan (50%),
GE (40%), AES (10%) Gulf LNG Energy No 2011
Lake Charles 4 425 000 14 24.3 Trunkline LNG Trunkline LNG Yes
1982, Infrastructure enhancement
project completed March
2010
Northeast Gateway *(F) 151 000 6 4.1 Excelerate Energy Excelerate Energy 2008
Sabine Pass 5 800 000 16 41.3 Cheniere Energy Cheniere EnergyTotal,
Chevron, CMI
2008
Regasification Terminals at the end of 2014
7 311 400 249.6
*(F) : Floating technology *(F) : Floating technology
ASIA
China
Dalian 3 480 000 3 4.1 Petrochina (75%), other companies Petrochina No Reloading 2011
Guangdong Dapeng,
Shenzhen 3 480 000 7 9.2
CNOOC (33%), BP (30%), other
companiesGDLNG No Truck loading 2006
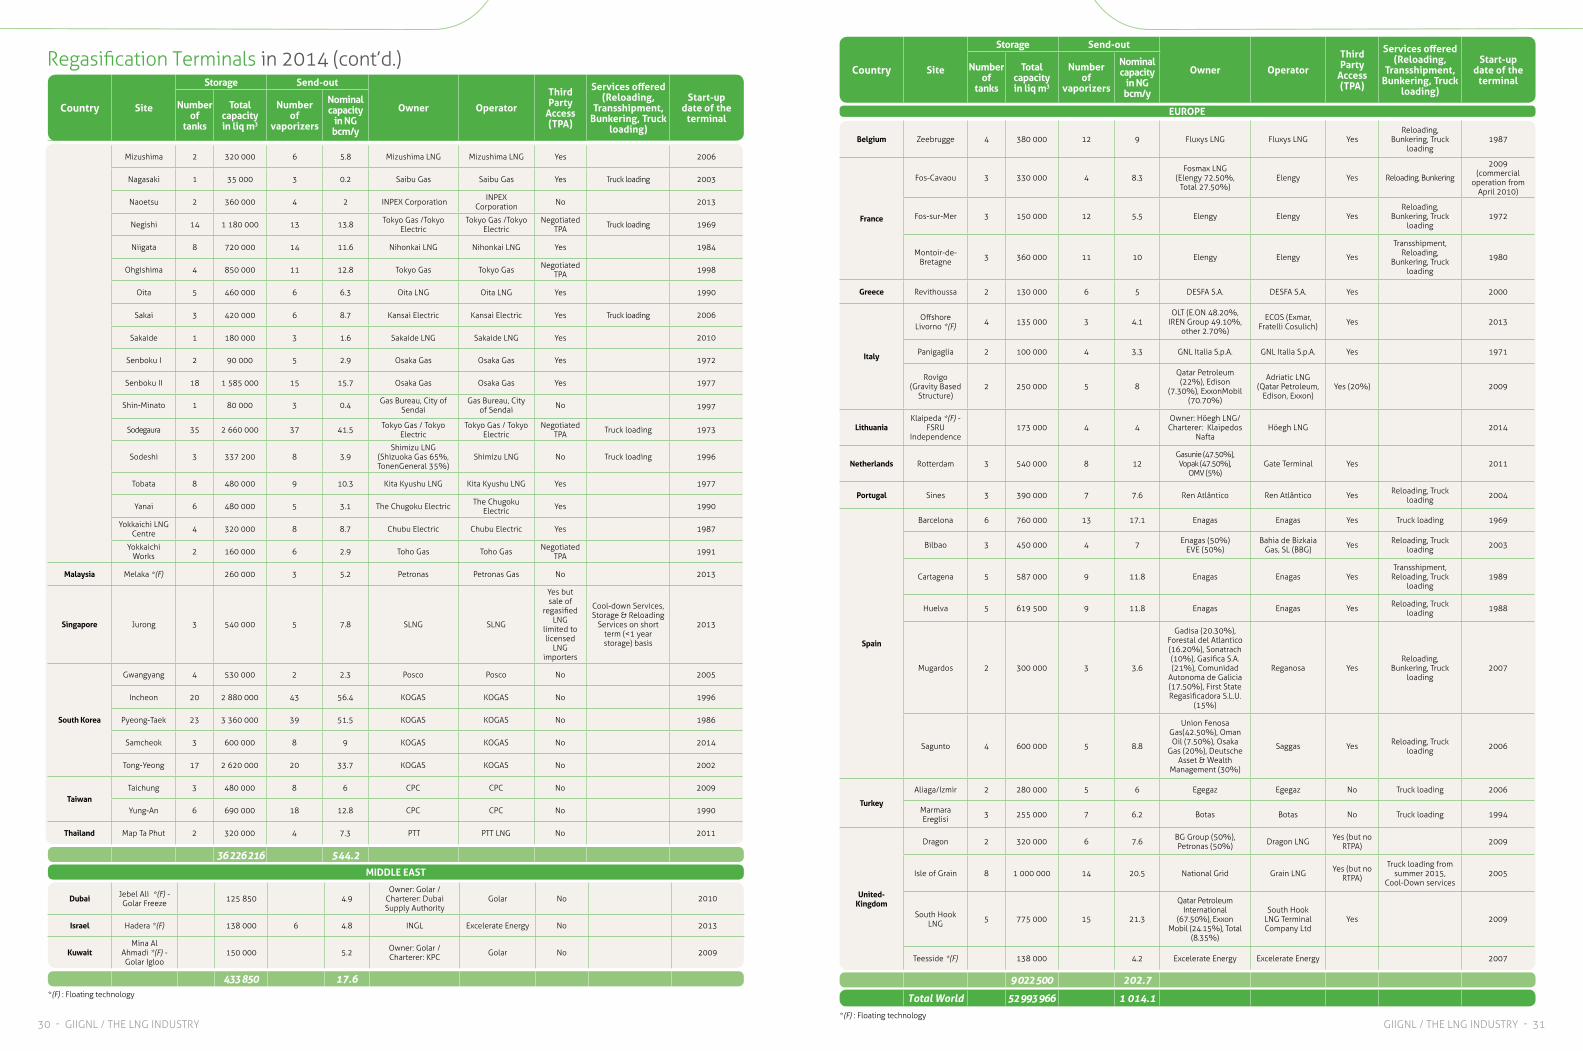
30 - GIIGNL / THE LNG INDUSTRY GIIGNL / THE LNG INDUSTRY - 31
9 022 500 202.7
Total World 52 993 966 1 014.1
EUROPE
Belgium Zeebrugge 4 380 000 12 9 Fluxys LNG Fluxys LNG YesReloading,
Bunkering, Truck loading
1987
France
Fos-Cavaou 3 330 000 4 8.3Fosmax LNG
(Elengy 72.50%, Total 27.50%)
Elengy Yes Reloading, Bunkering
2009 (commercial
operation from April 2010)
Fos-sur-Mer 3 150 000 12 5.5 Elengy Elengy YesReloading,
Bunkering, Truck loading
1972
Montoir-de-Bretagne 3 360 000 11 10 Elengy Elengy Yes
Transshipment, Reloading,
Bunkering, Truck loading
1980
Greece Revithoussa 2 130 000 6 5 DESFA S.A. DESFA S.A. Yes 2000
Italy
Offshore Livorno *(F) 4 135 000 3 4.1
OLT (E.ON 48.20%, IREN Group 49.10%,
other 2.70%)
ECOS (Exmar, Fratelli Cosulich) Yes 2013
Panigaglia 2 100 000 4 3.3 GNL Italia S.p.A. GNL Italia S.p.A. Yes 1971
Rovigo (Gravity Based
Structure)2 250 000 5 8
Qatar Petroleum (22%), Edison
(7.30%), ExxonMobil (70.70%)
Adriatic LNG (Qatar Petroleum,
Edison, Exxon)Yes (20%) 2009
LithuaniaKlaipeda *(F) -
FSRU Independence
173 000 4 4Owner: Höegh LNG/ Charterer: Klaipedos
NaftaHöegh LNG 2014
Netherlands Rotterdam 3 540 000 8 12Gasunie (47.50%), Vopak (47.50%),
OMV (5%)Gate Terminal Yes 2011
Portugal Sines 3 390 000 7 7.6 Ren Atlântico Ren Atlântico Yes Reloading, Truck loading 2004
Spain
Barcelona 6 760 000 13 17.1 Enagas Enagas Yes Truck loading 1969
Bilbao 3 450 000 4 7 Enagas (50%)EVE (50%)
Bahia de Bizkaia Gas, SL (BBG) Yes Reloading, Truck
loading 2003
Cartagena 5 587 000 9 11.8 Enagas Enagas YesTransshipment,
Reloading, Truck loading
1989
Huelva 5 619 500 9 11.8 Enagas Enagas Yes Reloading, Truck loading 1988
Mugardos 2 300 000 3 3.6
Gadisa (20.30%), Forestal del Atlantico (16.20%), Sonatrach (10%), Gasifica S.A. (21%), Comunidad
Autonoma de Galicia (17.50%), First State Regasificadora S.L.U.
(15%)
Reganosa YesReloading,
Bunkering, Truck loading
2007
Sagunto 4 600 000 5 8.8
Union Fenosa Gas(42.50%), Oman Oil (7.50%), Osaka
Gas (20%), Deutsche Asset & Wealth
Management (30%)
Saggas Yes Reloading, Truck loading 2006
Turkey
Aliaga/Izmir 2 280 000 5 6 Egegaz Egegaz No Truck loading 2006
Marmara Ereglisi 3 255 000 7 6.2 Botas Botas No Truck loading 1994
United-Kingdom
Dragon 2 320 000 6 7.6 BG Group (50%), Petronas (50%) Dragon LNG Yes (but no
RTPA) 2009
Isle of Grain 8 1 000 000 14 20.5 National Grid Grain LNG Yes (but no RTPA)
Truck loading from summer 2015,
Cool-Down services2005
South Hook LNG 5 775 000 15 21.3
Qatar Petroleum International
(67.50%), Exxon Mobil (24.15%), Total
(8.35%)
South Hook LNG Terminal Company Ltd
Yes 2009
Teesside *(F) 138 000 4.2 Excelerate Energy Excelerate Energy 2007
Regasification Terminals in 2014 (cont’d.)Country Site
Storage Send-out
Owner Operator
Third Party
Access(TPA)
Services offered (Reloading,
Transshipment, Bunkering, Truck
loading)
Start-up date of the
terminalNumber
of tanks
Total capacity in liq m3
Number of
vaporizers
Nominal capacity
in NG bcm/y
Mizushima 2 320 000 6 5.8 Mizushima LNG Mizushima LNG Yes 2006
Nagasaki 1 35 000 3 0.2 Saibu Gas Saibu Gas Yes Truck loading 2003
Naoetsu 2 360 000 4 2 INPEX Corporation INPEX Corporation No 2013
Negishi 14 1 180 000 13 13.8 Tokyo Gas /Tokyo Electric
Tokyo Gas /Tokyo Electric
Negotiated TPA Truck loading 1969
Niigata 8 720 000 14 11.6 Nihonkai LNG Nihonkai LNG Yes 1984
Ohgishima 4 850 000 11 12.8 Tokyo Gas Tokyo Gas Negotiated TPA 1998
Oita 5 460 000 6 6.3 Oita LNG Oita LNG Yes 1990
Sakai 3 420 000 6 8.7 Kansai Electric Kansai Electric Yes Truck loading 2006
Sakaide 1 180 000 3 1.6 Sakaide LNG Sakaide LNG Yes 2010
Senboku I 2 90 000 5 2.9 Osaka Gas Osaka Gas Yes 1972
Senboku II 18 1 585 000 15 15.7 Osaka Gas Osaka Gas Yes 1977
Shin-Minato 1 80 000 3 0.4 Gas Bureau, City of Sendai
Gas Bureau, City of Sendai No 1997
Sodegaura 35 2 660 000 37 41.5 Tokyo Gas / Tokyo Electric
Tokyo Gas / Tokyo Electric
Negotiated TPA Truck loading 1973
Sodeshi 3 337 200 8 3.9Shimizu LNG
(Shizuoka Gas 65%, TonenGeneral 35%)
Shimizu LNG No Truck loading 1996
Tobata 8 480 000 9 10.3 Kita Kyushu LNG Kita Kyushu LNG Yes 1977
Yanai 6 480 000 5 3.1 The Chugoku Electric The Chugoku Electric Yes 1990
Yokkaichi LNG Centre 4 320 000 8 8.7 Chubu Electric Chubu Electric Yes 1987
Yokkaichi Works 2 160 000 6 2.9 Toho Gas Toho Gas Negotiated
TPA 1991
Malaysia Melaka *(F) 260 000 3 5.2 Petronas Petronas Gas No 2013
Singapore Jurong 3 540 000 5 7.8 SLNG SLNG
Yes but sale of
regasified LNG
limited to licensed
LNG importers
Cool-down Services, Storage & Reloading
Services on short term (<1 year storage) basis
2013
South Korea
Gwangyang 4 530 000 2 2.3 Posco Posco No 2005
Incheon 20 2 880 000 43 56.4 KOGAS KOGAS No 1996
Pyeong-Taek 23 3 360 000 39 51.5 KOGAS KOGAS No 1986
Samcheok 3 600 000 8 9 KOGAS KOGAS No 2014
Tong-Yeong 17 2 620 000 20 33.7 KOGAS KOGAS No 2002
TaiwanTaichung 3 480 000 8 6 CPC CPC No 2009
Yung-An 6 690 000 18 12.8 CPC CPC No 1990
Thailand Map Ta Phut 2 320 000 4 7.3 PTT PTT LNG No 2011
36 226 216 544.2
Country Site
Storage Send-out
Owner Operator
Third Party
Access(TPA)
Services offered (Reloading,
Transshipment, Bunkering, Truck
loading)
Start-up date of the
terminalNumber
of tanks
Total capacity in liq m3
Number of
vaporizers
Nominal capacity
in NG bcm/y
*(F) : Floating technology
*(F) : Floating technology
Dubai Jebel Ali *(F) - Golar Freeze 125 850 4.9
Owner: Golar / Charterer: Dubai Supply Authority
Golar No 2010
Israel Hadera *(F) 138 000 6 4.8 INGL Excelerate Energy No 2013
KuwaitMina Al
Ahmadi *(F) - Golar Igloo
150 000 5.2 Owner: Golar / Charterer: KPC Golar No 2009
433 850 17.6
MIDDLE EAST

GIIGNL / THE LNG INDUSTRY - 3332 - GIIGNL / THE LNG INDUSTRY
Sea transportation routes
Algeria
Bethioua Aliaga 1 500
Bethioua Bahia 355
Bethioua Barcelona 343
Bethioua Caofeidian 9 536
Bethioua Cartagena 113
Bethioua Chita 8 502
Bethioua Dahej 4 775
Bethioua Dalian 9 413
Bethioua Fos Cavaou 528
Bethioua Fujian 8 476
Bethioua Futtsu 9 604
Bethioua Higashi-Ohgishima 9 605
Bethioua Huelva 373
Bethioua Incheon 9 241
Bethioua Isle of Grain 1 676
Bethioua Joetsu 9 720
Bethioua Melaka 1 559
Bethioua Oita 9 351
Bethioua Pyeong Taek 9 283
Bethioua Reganosa 945
Bethioua Revithoussa 1 050
Bethioua Sagunto 243
Bethioua Sakai 9 462
Bethioua Shanghai 8 983
Bethioua Sines 504
Bethioua Yung-An 8 328
Skikda Barcelona 349
Skikda Cartagena 388
Skikda Fos Cavaou 435
Skikda Fos-sur-Mer 400
Skikda Huelva 1 330
Skikda Panigaglia 456
Skikda Reganosa 1 266
Skikda Revithoussa 920
Skikda Sagunto 384
Skikda Sines 870
Angola
Soyo Dapeng 8 866
Soyo Guanabara Bay 3 395
Soyo Ningbo 9 499
Soyo Senboku 10 002
Soyo Tong-Yeong 9 819
Australia
Darwin Futtsu 3 036
Darwin Higashi-Ohgishima 3 056
Darwin Negishi 3 017
Darwin Ohgishima 3 036
Darwin Sodegaura 3 045
NWS Caofeidian 3 816
Australia
NWS Chita 3 655
NWS Dapeng 2 745
NWS Futtsu 3 721
NWS Higashi-Ohgishima 3 738
NWS Himeji 3 629
NWS Incheon 3 650
NWS Jebel Ali 4 690
NWS Kagoshima 3 385
NWS Kawagoe 3 656
NWS Melaka 1 807
NWS Mizushima 3 579
NWS Negishi 3 719
NWS Niigata 4 048
NWS Ohgishima 3 734
NWS Oita 3 474
NWS Pyeong Taek 3 648
NWS Sakai 3 606
NWS Senboku 3 609
NWS Sodegaura 3 730
NWS Sodeshi 3 640
NWS Tobata 3 582
NWS Tong-Yeong 3 570
NWS Yanai 3 535
NWS Yokkaichi 3 656
NWS Yung-An 2 713
Pluto Himeji 3 673
Pluto Joetsu 3 962
Pluto Kawagoe 3 429
Pluto Niigata 4 071
Pluto Ohgishima 3 731
Pluto Oita 3 470
Pluto Pyeong Taek 3 681
Pluto Sakai 3 650
Pluto Sodegaura 3 775
Pluto Sodeshi 3 637
Pluto Tong-Yeong 3 602
Belgium
Zeebrugge Bahia 4 529
Zeebrugge Bahia Blanca 6 615
Zeebrugge Barcelona 1 890
Zeebrugge Escobar 6 378
Zeebrugge Guanabara Bay 5 219
Zeebrugge Huelva 1 222
Zeebrugge Incheon 10 909
Zeebrugge Jebel Ali 6 217
Zeebrugge Jurong Island 8 342
Zeebrugge Niigata 11 335
Zeebrugge Panigaglia 2 214
Belgium
Zeebrugge Senboku 11 054
Zeebrugge Sines 980
Zeebrugge Tong-Yeong 10 922
BrazilGuanabara Bay Escobar 1 200
Guanabara Bay Pecem 1 549
Brunei
Lumut Futtsu 2 390
Lumut Himeji 2 999
Lumut Incheon 2 854
Lumut Melaka 5 561
Lumut Negishi 2 416
Lumut Niigata 2 525
Lumut Oita 2 880
Lumut Pyeong Taek 2 082
Lumut Sakai 2 201
Lumut Senboku 2 405
Lumut Shanghai 1 792
Lumut Sodegaura 2 430
Lumut Tobata 2 058
Lumut Tong-Yeong 2 014
Lumut Yung-An 1 186
Egypt
Idku Fujian 7 188
Idku Melaka 5 125
Idku Ningbo 7 343
Idku Sodeshi 7 980
Equatorial Guinea
Bioko Island Bahia 3 011
Bioko Island Caofeidian 10 771
Bioko Island Chita 10 789
Bioko Island Dahej 7 127
Bioko Island Dapeng 9 516
Bioko Island Guanabara Bay 3 476
Bioko Island Himeji 10 781
Bioko Island Incheon 10 651
Bioko Island Jurong Island 8 000
Bioko Island Kawagoe 10 791
Bioko Island Montoir de Bretagne 4 135
Bioko Island Ningbo 10 105
Bioko Island Ohgishima 10 897
Bioko Island Oita 10 616
Bioko Island Pyeong Taek 10 567
Bioko Island Quintero 6 786
Bioko Island Sodeshi 10 833
Bioko Island Tobata 10 591
Bioko Island Tong-Yeong 10 578
Bioko Island Yung-An 9 657
Bioko Island Zhuhai 9 389
FranceFos Cavaou Bahia 4 214
Fos Cavaou Gwangyang 9 135
France
Fos Cavaou Pecem 3 725
Fos Cavaou Pyeong Taek 9 242
Montoir deBretagne Altamira 4 969
Montoir deBretagne Dahej 3 871
Montoir deBretagne Melaka 819
Montoir deBretagne Mizushima 10 680
Indonesia
Blang Lancang Incheon 3 149
Blang Lancang Pyeong Taek 3 149
Bontang Chita 2 500
Bontang Dongguan 1 587
Bontang Gwangyang 2 331
Bontang Hatsukaichi 2 412
Bontang Himeji 2 400
Bontang Incheon 2 493
Bontang Joetsu 2 755
Bontang Jurong Island 1 189
Bontang Kagoshima 2 211
Bontang Kawagoe 2 510
Bontang Negishi 2 453
Bontang Ohgishima 2 560
Bontang Oita 2 413
Bontang Pyeong Taek 2 493
Bontang Sakai 2 385
Bontang Senboku 2 385
Bontang Tobata 2 370
Bontang Tong-Yeong 2 043
Bontang Yokkaichi 2 510
Bontang Yung-An 1 455
Tangguh Energia Costa Azul 6 951
Tangguh Fujian 2 227
Tangguh Futtsu 2 623
Tangguh Gwangyang 2 548
Tangguh Himeji 2 258
Tangguh Incheon 2 736
Tangguh Joetsu 2 965
Tangguh Joetsu 2 965
Tangguh Kawagoe 2 573
Tangguh Niigata 3 036
Tangguh Oita 2 458
Tangguh Pyeong Taek 2 734
Tangguh Sakai 2 535
Tangguh Tong-Yeong 2 257
Tangguh Yung-An 1 972
Malaysia
Bintulu Chita 2 395
Bintulu Dahej 3 173
Bintulu Dongguan 1 243
Bintulu Fukuoka 2 160
Bintulu Futtsu 2 505
Bintulu Higashi-Ohgishima 2 492
Malaysia
Bintulu Himeji 2 400
Bintulu Incheon 2 124
Bintulu Ishikari 2 900
Bintulu Jebel Ali 4 103
Bintulu Kawagoe 2 433
Bintulu Map Ta Phut 933
Bintulu Melaka 6 402
Bintulu Mina Al-Ahmadi 4 484
Bintulu Mizushima 2 335
Bintulu Nagasaki 2 151
Bintulu Negishi 2 513
Bintulu Niigata 2 511
Bintulu Ohgishima 2 481
Bintulu Oita 2 191
Bintulu Pyeong Taek 2 124
Bintulu Senboku 2 376
Bintulu Shanghai 1 942
Bintulu Shanghai 1 942
Bintulu Shanghai 1 942
Bintulu Shin-Minato 2 603
Bintulu Sodegaura 2 515
Bintulu Sodeshi 2 460
Bintulu Tobata 2 210
Bintulu Tong-Yeong 1 674
Bintulu Yung-An 1 350
Bintulu Zhuhai 1 145
Nether-lands
Gate Bilbao 817
Gate Escobar 6 375
Gate Futtsu 11 275
Gate Guanabara Bay 5 291
Gate Mina Al-Ahmadi 6 693
Gate Pecem 4 016
Nigeria
Bonny Island Aliaga 5 042
Bonny Island Aliaga 5 042
Bonny Island Altamira 6 214
Bonny Island Bahia 3 815
Bonny Island Bahia Blanca 5 270
Bonny Island Barcelona 3 824
Bonny Island Bilbao 3 886
Bonny Island Caofeidian 10 802
Bonny Island Cartagena 3 574
Bonny Island Chita 10 602
Bonny Island Dabhol 7 120
Bonny Island Dahej 7 136
Bonny Island Dalian 10 682
Bonny Island Dapeng 9 328
Bonny Island Dragon 4 206
Bonny Island Escobar 4 995
Bonny Island Fos Cavaou 4 091
Nigeria
Bonny Island Fujian 10 054
Bonny Island Futtsu 10 914
Bonny Island Guanabara Bay 3 422
Bonny Island Gwangyang 10 542
Bonny Island Hazira 7 053
Bonny Island Higashi-Ohgishima 10 972
Bonny Island Himeji 10 790
Bonny Island Huelva 3 359
Bonny Island Incheon 10 599
Bonny Island Jebel Ali 7 529
Bonny Island Joetsu 11 167
Bonny Island Joetsu 11 167
Bonny Island Kawagoe 10 817
Bonny Island Kochi 7 120
Bonny Island Manzanillo 10 055
Bonny Island Map Ta Phut 8 708
Bonny Island Melaka 7 920
Bonny Island Mina Al-Ahmadi 7 588
Bonny Island Mizushima 10 743
Bonny Island Montoir de Bretagne 4 067
Bonny Island Niigata 11 014
Bonny Island Oita 10 600
Bonny Island Pecem 2 811
Bonny Island Penuelas 4 503
Bonny Island Pyeong Taek 10 598
Bonny Island Reganosa 3 746
Bonny Island Sagunto 3 686
Bonny Island Sakai 10 767
Bonny Island Senboku 10 767
Bonny Island Shanghai 10 328
Bonny Island Sines 3 361
Bonny Island Sodeshi 10 893
Bonny Island Tianjin 10 824
Bonny Island Tobata 10 600
Bonny Island Tong-Yeong 10 354
Bonny Island Yanai 10 597
Bonny Island Yung-An 9 475
Norway
Hammerfest Aliaga 4 287
Hammerfest Altamira 5 578
Hammerfest Bahia 5 687
Hammerfest Bahia Blanca 7 772
Hammerfest Barcelona 3 155
Hammerfest Bilbao 2 045
Hammerfest Cartagena 2 885
Hammerfest Cove Point 3 975
Hammerfest Dahej 7 665
Hammerfest Escobar 7 535
Hammerfest Fos Cavaou 3 349
Hammerfest Futtsu 10 966
Loading point Unloading point
Distance in nautical
miles
Loading point Unloading point
Distance in nautical
miles
Loading point Unloading point
Distance in nautical
miles
Loading point Unloading point
Distance in nautical
miles
Loading point Unloading point
Distance in nautical
miles
Loading point Unloading point
Distance in nautical
miles

34 - GIIGNL / THE LNG INDUSTRY GIIGNL / THE LNG INDUSTRY - 35
Loading point Unloading point
Distance in nautical
miles
Loading point Unloading point
Distance in nautical
miles
Loading point Unloading point
Distance in nautical
miles
Loading point Unloading point
Distance in nautical
miles
Loading point Unloading point
Distance in nautical
miles
Loading point Unloading point
Distance in nautical
milesSea transportation routes (cont’d.)
Norway
Hammerfest Gate 1 325
Hammerfest Guanabara Bay 6 404
Hammerfest Higashi-Ohgishima 12 529
Hammerfest Huelva 2 594
Hammerfest Klaipeda 1 701
Hammerfest Mejillones 10 754
Hammerfest Melaka 9 497
Hammerfest Montoir de Bretagne 1 958
Hammerfest Niigata 12 602
Hammerfest Pecem 5 145
Hammerfest Penuelas 4 556
Hammerfest Pyeong Taek 12 211
Hammerfest Reganosa 2 048
Hammerfest Revithoussa 4 132
Hammerfest Sagunto 3 065
Hammerfest Sines 2 398
Hammerfest Tianjin 12 401
Hammerfest Zhuhai 10 999
Oman
Qalhat Chita 6 032
Qalhat Dapeng 4 558
Qalhat Futtsu 5 980
Qalhat Gwangyang 5 595
Qalhat Hazira 760
Qalhat Higashi-Ohgishima 6 000
Qalhat Himeji 5 849
Qalhat Incheon 5 750
Qalhat Map Ta Phut 3 845
Qalhat Mina Al-Ahmadi 740
Qalhat Mizushima 5 873
Qalhat Oita 5 673
Qalhat Pyeong Taek 5 695
Qalhat Sagunto 4 259
Qalhat Senboku 5 812
Qalhat Sodegaura 6 045
Qalhat Tong-Yeong 5 300
Qalhat Yanai 5 700
Qalhat Yung-An 4 719
Qalhat Zhuhai 4 477
Papua New
Guinea
Port Moresby Caofeidian 3 965
Port Moresby Chita 3 344
Port Moresby Futtsu 3 322
Port Moresby Higashi-Ohgishima 3 286
Port Moresby Himeji 3 379
Port Moresby Qingdao 3 782
Port Moresby Senboku 3 358
Port Moresby Sodegaura 3 331
Port Moresby Sodeshi 3 272
Papua New
GuineaPort Moresby Yung-An 3 186
Peru
Pampa Melchorita Barcelona 9 566
Pampa Melchorita Bilbao 9 639
Pampa Melchorita Cartagena 9 292
Pampa Melchorita Fos Cavaou 9 835
Pampa Melchorita Manzanillo 2 585
Pampa Melchorita Oita 8 940
Pampa Melchorita Reganosa 9 405
Portugal
Sines Bahia 3 519
Sines Bahia Blanca 5 591
Sines Escobar 5 355
Sines Guanabara Bay 4 223
Qatar
Ras Laffan Aliaga 3 722
Ras Laffan Altamira 9 783
Ras Laffan Andres 8 567
Ras Laffan Bahia 4 683
Ras Laffan Bahia Blanca 8 630
Ras Laffan Barcelona 4 710
Ras Laffan Caofeidian 6 436
Ras Laffan Cartagena 4 817
Ras Laffan Chita 6 446
Ras Laffan Dabhol 1 504
Ras Laffan Dahej 1 290
Ras Laffan Dalian 6 313
Ras Laffan Dapeng 5 098
Ras Laffan Dongguan 5 147
Ras Laffan Dragon 6 184
Ras Laffan Escobar 9 023
Ras Laffan Fos Cavaou 4 684
Ras Laffan Fujian 5 625
Ras Laffan Futtsu 6 570
Ras Laffan Gate 6 468
Ras Laffan Guanabara Bay 8 197
Ras Laffan Hainan 4 998
Ras Laffan Hazira 1 236
Ras Laffan Higashi-Ohgishima 6 590
Ras Laffan Himeji 6 350
Ras Laffan Huelva 5 144
Ras Laffan Incheon 6 156
Ras Laffan Isle of Grain 6 428
Ras Laffan Jebel Ali 200
Ras Laffan Joetsu 6 620
Ras Laffan Kawagoe 6 448
Ras Laffan Kochi 1 799
Ras Laffan Map Ta Phut 4 326
Ras Laffan Melaka 3 553
Ras Laffan Mina Al-Ahmadi 354
Qatar
Ras Laffan Mizushima 6 428
Ras Laffan Negishi 6 550
Ras Laffan Niigata 6 640
Ras Laffan Ningbo 5 771
Ras Laffan Ohgishima 6 568
Ras Laffan Oita 6 250
Ras Laffan Pecem 8 621
Ras Laffan Pyeong Taek 6 156
Ras Laffan Quintero 10 188
Ras Laffan Reganosa 5 689
Ras Laffan Rovigo 4 405
Ras Laffan Sagunto 4 719
Ras Laffan Sakai 6 347
Ras Laffan Senboku 6 347
Ras Laffan Shanghai 5 901
Ras Laffan Sines 5 291
Ras Laffan Sodegaura 6 576
Ras Laffan South Hook 6 168
Ras Laffan Taichung 5 229
Ras Laffan Tobata 6 173
Ras Laffan Tong-Yeong 5 706
Ras Laffan Yanai 6 170
Ras Laffan Yokkaichi 6 448
Ras Laffan Yung-An 5 230
Ras Laffan Zeebrugge 6 277
Ras Laffan Zhuhai 5 054
Russia
Sakhalin II Caofeidian 1 645
Sakhalin II Chita 1 084
Sakhalin II Futtsu 951
Sakhalin II Hatsukaichi 1 105
Sakhalin II Hibiki 1 105
Sakhalin II Higashi-Ohgishima 956
Sakhalin II Himeji 1 196
Sakhalin II Incheon 1 380
Sakhalin II Ishikari 229
Sakhalin II Joetsu 605
Sakhalin II Kawagoe 1 085
Sakhalin II Map Ta Phut 3 356
Sakhalin II Mizushima 1 233
Sakhalin II Negishi 950
Sakhalin II Niigata 581
Sakhalin II Ohgishima 964
Sakhalin II Oita 1 060
Sakhalin II Pyeong Taek 1 377
Sakhalin II Sakai 1 176
Sakhalin II Senboku 1 233
Sakhalin II Shanghai 1 444
Russia
Sakhalin II Sodegaura 960
Sakhalin II Tobata 981
Sakhalin II Tong-Yeong 1 013
Sakhalin II Yanai 1 392
Sakhalin II Yung-An 1 967
South Korea
Gwangyang Hazira 5 043
Gwangyang Senboku 437
Gwangyang Shanghai 453
Spain
Barcelona Bahia 4 044
Barcelona Incheon 9 243
Barcelona Shanghai 8 865
Cartagena Aliaga 1 414
Cartagena Bahia Blanca 5 842
Cartagena Caofeidian 9 553
Cartagena Escobar 5 526
Cartagena Futtsu 9 671
Cartagena Guanabara Bay 4 474
Cartagena Incheon 9 350
Cartagena Joetsu 9 737
Cartagena Mina Al-Ahmadi 5 016
Cartagena Penuelas 3 669
Cartagena Pyeong Taek 9 350
Cartagena Revithoussa 1 283
Huelva Aliaga 1 758
Huelva Bahia Blanca 5 611
Huelva Chita 9 919
Huelva Dahej 5 127
Huelva Dapeng 8 598
Huelva Freeport 4 695
Huelva Incheon 9 693
Huelva Kawagoe 9 917
Huelva Manzanillo 11 351
Huelva Mina Al-Ahmadi 5 359
Huelva Niigata 10 119
Huelva Pecem 3 035
Huelva Shanghai 9 343
Huelva Tobata 9 659
Reganosa Bahia Blanca 5 933
Reganosa Dahej 5 661
Reganosa Hazira 5 649
Reganosa Jebel Ali 5 535
Reganosa Mina Al-Ahmadi 5 735
Reganosa Tong-Yeong 10 128
Reganosa Yung-An 9 287
Sagunto Aliaga 1 382
Sagunto Bahia 3 925
Sagunto Bahia Blanca 6 002
Sagunto Chita 9 543
Sagunto Escobar 5 765
Spain
Sagunto Futtsu 9 638
Sagunto Guanabara Bay 4 633
Sagunto Incheon 9 318
Sagunto Melaka 6 639
Sagunto Negishi 9 645
Sagunto Oita 9 335
Sagunto Pecem 3 435
Sagunto Pyeong Taek 9 317
Sagunto Tong-Yeong 9 218
Trinidad& Tobago
Point Fortin Aliaga 5 100
Point Fortin Altamira 2 220
Point Fortin Andres 683
Point Fortin Bahia 3 976
Point Fortin Bahia Blanca 4 628
Point Fortin Barcelona 3 975
Point Fortin Bilbao 3 669
Point Fortin Canaport 2 110
Point Fortin Cartagena 3 648
Point Fortin Chita 13 190
Point Fortin Cove Point 1 879
Point Fortin Dragon 4 360
Point Fortin Elba Island 1 690
Point Fortin Escobar 4 920
Point Fortin Everett 2 032
Point Fortin Freeport 2 272
Point Fortin Gate 4 061
Point Fortin Guanabara Bay 3 245
Point Fortin Hazira 8 428
Point Fortin Huelva 3 366
Point Fortin Incheon 9 706
Point Fortin Isle of Grain 3 974
Point Fortin Jurong Island 10 948
Point Fortin Manzanillo 10 299
Point Fortin Map Ta Phut 11 712
Point Fortin Mejillones 3 327
Point Fortin Mina Al-Ahmadi 8 673
Point Fortin Montoir de Bretagne 3 760
Point Fortin Ohgishima 13 928
Point Fortin Pecem 1 732
Point Fortin Penuelas 560
Point Fortin Qingdao 3 782
Point Fortin Quintero 6 999
Point Fortin Reganosa 3 452
Point Fortin Rovigo 5 180
Point Fortin Sabine Pass 2 247
Point Fortin Sagunto 3 858
Point Fortin Shanghai 3 858
Point Fortin Sines 3 315
Point Fortin Tong-Yeong 9 303
Trinidad& Trobago Point Fortin Yung-An 10 174
UAE
Das Island Futtsu 6 290
Das Island Gwangyang 6 089
Das Island Hazira 1 188
Das Island Higashi-Ohgishima 6 310
Das Island Incheon 6 112
USA
Freeport Bahia 4 646
Kenai Himeji 3 727
Kenai Sakai 3 696
Yemen
Balhaf Chita 6 433
Balhaf Dahej 1 693
Balhaf Dapeng 5 108
Balhaf Everett 6 373
Balhaf Fujian 5 634
Balhaf Hazira 1 703
Balhaf Himeji 6 373
Balhaf Incheon 6 243
Balhaf Jebel Ali 1 520
Balhaf Joetsu 6 433
Balhaf Kawagoe 6 435
Balhaf Map Ta Phut 4 235
Balhaf Melaka 3 366
Balhaf Mina Al-Ahmadi 1 767
Balhaf Niigata 6 650
Balhaf Ningbo 5 584
Balhaf Pyeong Taek 6 240
Balhaf Sakai 6 350
Balhaf Senboku 6 353
Balhaf Shanghai 5 720
Balhaf Tianjin 6 270
Balhaf Tobata 6 183
Balhaf Tong-Yeong 3 170
Balhaf Yung-An 5 268
Source: GIIGNL, Clarkson Research 2015
36 - GIIGNL / THE LNG INDUSTRY
©GIIGNL – International Group of Liquefied Natural Gas Importers.
All data and maps provided in this publication are for information purposes and shall be treated as indicative only.Under no circumstances shall they be regarded as data or maps intended for commercial use.
Reproduction of the contents of this publication in any manner whatsoever is prohibited without prior consent of the copyright owners.
Photo credits : Algirdas Kubaitis, Dunkerque LNG, Elengy, Fluxys, GDF SUEZ, Höegh LNG, Ole-Gunnar Rasmussen, Petrobras, TEPCO, Woodside
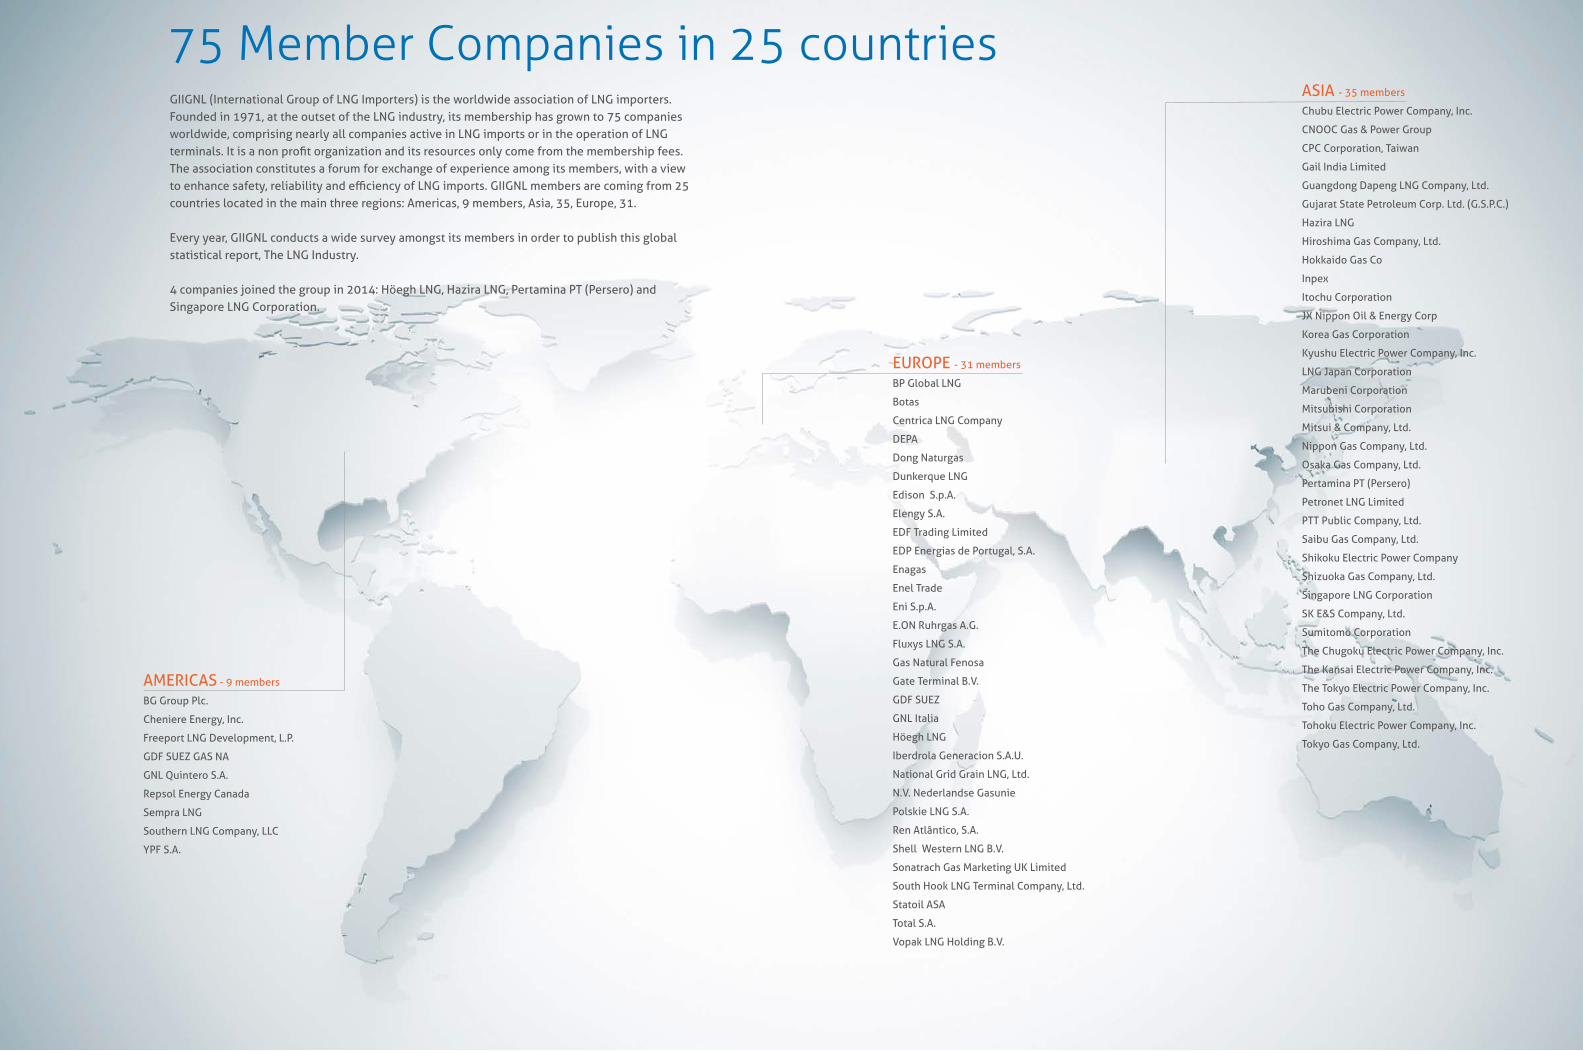
ASIA - 35 members
Chubu Electric Power Company, Inc.
CNOOC Gas & Power Group
CPC Corporation, Taiwan
Gail India Limited
Guangdong Dapeng LNG Company, Ltd.
Gujarat State Petroleum Corp. Ltd. (G.S.P.C.)
Hazira LNG
Hiroshima Gas Company, Ltd.
Hokkaido Gas Co
Inpex
Itochu Corporation
JX Nippon Oil & Energy Corp
Korea Gas Corporation
Kyushu Electric Power Company, Inc.
LNG Japan Corporation
Marubeni Corporation
Mitsubishi Corporation
Mitsui & Company, Ltd.
Nippon Gas Company, Ltd.
Osaka Gas Company, Ltd.
Pertamina PT (Persero)
Petronet LNG Limited
PTT Public Company, Ltd.
Saibu Gas Company, Ltd.
Shikoku Electric Power Company
Shizuoka Gas Company, Ltd.
Singapore LNG Corporation
SK E&S Company, Ltd.
Sumitomo Corporation
The Chugoku Electric Power Company, Inc.
The Kansai Electric Power Company, Inc.
The Tokyo Electric Power Company, Inc.
Toho Gas Company, Ltd.
Tohoku Electric Power Company, Inc.
Tokyo Gas Company, Ltd.
EUROPE - 31 members
BP Global LNG
Botas
Centrica LNG Company
DEPA
Dong Naturgas
Dunkerque LNG
Edison S.p.A.
Elengy S.A.
EDF Trading Limited
EDP Energias de Portugal, S.A.
Enagas
Enel Trade
Eni S.p.A.
E.ON Ruhrgas A.G.
Fluxys LNG S.A.
Gas Natural Fenosa
Gate Terminal B.V.
GDF SUEZ
GNL Italia
Höegh LNG
Iberdrola Generacion S.A.U.
National Grid Grain LNG, Ltd.
N.V. Nederlandse Gasunie
Polskie LNG S.A.
Ren Atlântico, S.A.
Shell Western LNG B.V.
Sonatrach Gas Marketing UK Limited
South Hook LNG Terminal Company, Ltd.
Statoil ASA
Total S.A.
Vopak LNG Holding B.V.
AMERICAS - 9 members
BG Group Plc.
Cheniere Energy, Inc.
Freeport LNG Development, L.P.
GDF SUEZ GAS NA
GNL Quintero S.A.
Repsol Energy Canada
Sempra LNG
Southern LNG Company, LLC
YPF S.A.
GIIGNL (International Group of LNG Importers) is the worldwide association of LNG importers.Founded in 1971, at the outset of the LNG industry, its membership has grown to 75 companies worldwide, comprising nearly all companies active in LNG imports or in the operation of LNG terminals. It is a non profit organization and its resources only come from the membership fees. The association constitutes a forum for exchange of experience among its members, with a view to enhance safety, reliability and efficiency of LNG imports. GIIGNL members are coming from 25 countries located in the main three regions: Americas, 9 members, Asia, 35, Europe, 31.
Every year, GIIGNL conducts a wide survey amongst its members in order to publish this global statistical report, The LNG Industry.
4 companies joined the group in 2014: Höegh LNG, Hazira LNG, Pertamina PT (Persero) and Singapore LNG Corporation.
75 Member Companies in 25 countries
© Algirdas Kubaitis
8, rue de l’Hôtel de Ville - 92200 Neuilly-sur-Seine - France Tel: + 33 1 56 65 51 60
E-mail: [email protected] - web site: www.giignl.org
Media/Industry Inquiries:Vincent Demoury
+33 1 56 65 51 [email protected]
International Group of Liquefied Natural Gas Importers
Groupe International des Importateurs de Gaz Naturel Liquéfié(G.I.I.G.N.L.)