the linux scheduler: a decade of wasted cores - …jplozi/wastedcores/files/submitted...the linux...
TRANSCRIPT
The Linux Scheduler: A Decade of Wasted CoresDraft submission. Not for public distribution.
Jean-Pierre LoziUniversite de Nice Sophia-Antipolis
Baptiste LepersEPFL
Fabien GaudUnafilliated
Alexandra FedorovaUniversity of British Columbia
Justin FunstonUniversity of British Columbia
Vivien QuemaGrenoble INP / [email protected]
AbstractAs a central part of resource management, the OS threadscheduler must maintain the following, simple, invariant:make sure that ready threads are scheduled on availablecores. As simple as it may seem, we found that this invari-ant is often broken in Linux. Cores may stay idle for sec-onds while ready threads are waiting in runqueues. In ourexperiments, these performance bugs caused many-fold per-formance degradation for synchronization-heavy scientificapplications, 13% higher latency for kernel make, and a 14-23% decrease in TPC-H throughput for a widely used com-mercial database. The main contribution of this work is thediscovery and analysis of these bugs and providing the fixes.Conventional testing techniques and debugging tools are in-effective at confirming or understanding this kind of bugs,because their symptoms are often evasive. To drive our in-vestigation, we built new tools that check for violation of theinvariant online and visualize scheduling activity. They aresimple, easily portable across kernel versions and run with anegligible overhead. We believe that making these tools partof the kernel developers’ tool belt can help keep this type ofbugs at bay.
[Copyright notice will appear here once ’preprint’ option is removed.]
1. Introduction“And you have to realize that there are not very manythings that have aged as well as the scheduler. Which isjust another proof that scheduling is easy.”
Linus Torvalds, 2001
The OS scheduler is responsible for sharing CPU cyclesamong threads in some fair fashion. Although recent re-search re-examined the role of the scheduler in managingthe system’s memory hierarchy, power and temperature, thecore mission of the scheduler—efficiently dividing CPU cy-cles among threads—was believed to be simple. Schedulingalgorithms, which determine exactly how the CPU cycles aredoled out to threads, do evolve, but the general consensus isthat efficiently sharing CPU cycles among threads, is, by andlarge, a solved problem.
Our recent experience with the Linux scheduler revealedthat allocating CPU cycles to threads is not so simple, af-ter all. We found that the mechanisms responsible for get-ting runnable threads to use available cores are broken. Evenif the kernel is not explicitly shutting down cores to savepower, which means that idle cores must be made availableto runnable threads, cores may remain idle for seconds whileready threads wait for their chance to run. The key reason isthat developers are working around the evolving complexi-ties of modern hardware, such as the overhead of synchro-nization and cache coherency, the non-uniform properties ofthe memory hierarchy (i.e., NUMA), high power consump-tion, and others. As a result, a simple scheduling policy re-sults in an incredibly complex implementation. The sched-uler maintains per-core runqueues (the structures trackingrunnable threads), which must be balanced to avoid cross-core communication on the critical path. However, balanc-ing the queues often is expensive, so the scheduler uses acomplex hierarchical load-balancing algorithm, which oftenfails to allocate idle cores to waiting threads.
CONFIDEN
TIAL

The main contribution of this work is the discovery andstudy of four performance bugs in the Linux scheduler.Since these bugs undermine a crucial kernel sub-system,cause substantial, sometimes massive, degradation of per-formance, and evade conventional testing and debuggingtechniques, understanding their nature and provenance isimportant.
These bugs have different root causes, but a commonsymptom. The scheduler unintentionally and for a long
time leaves cores idle while there are runnable threads
waiting in runqueues. Short-term occurrences of this condi-tion are acceptable: the system may temporarily enter such astate when, for instance, a thread exits or blocks or whena thread is created or becomes unblocked. Long-term oc-currences are not an expected behavior. Linux scheduler iswork-conserving, meaning that it should never leave coresidle if there is work to do. Long-term presence of this symp-tom is, therefore, unintentional: it is due to bugs and it hurtsperformance.
We provide fixes to these bugs, and observe substan-tial performance improvements. Synchronization-intensiveapplications experienced many-fold speedups; one barrier-heavy scientific application ended up running 138 timesfaster.1 Kernel make and a TPC-H workload on a widelyused commercial DBMS improved performance by 13% and14% respectively. The TPC-H query mostly affected by thebug sped up by 23%.
Detecting these bugs is difficult. They do not cause thesystem to crash or hang, but eat away at performance, oftenin ways that are difficult to notice with standard performancemonitoring tools. With the TPC-H workload, for example,the symptom occurred many times throughout the execution,but each time it lasted only a few hundreds of milliseconds– too short to detect with tools like htop, sar or perf. Yet,collectively these occurrences did enough damage to slowdown the most affected query by 23%. Even in cases wherethe symptom was present for a much longer duration, theroot cause was difficult to discover, because it was a resultof many asynchronous events in the scheduler.
We initially suspected scheduler bugs when we observedunexplained performance in the TPC-H database workload,which we were evaluating for a different project. Conven-tional tools were unhelpful to us in either confirming thebugs or understanding their root causes. To that end, we de-signed two new tools. The first tool, which we call a sanitychecker, periodically checks for the violation of the afore-mentioned invariant, catches the bugs on a live system andcollects a trace with relevant information for offline analy-sis. The second tool visualizes traces of scheduling activityto expedite debugging. These tools were easy to port be-tween kernel versions (from Linux 3.17 through 4.3), ranwith negligible overhead and consistently detected invariant
1 As we explain later in the paper, scheduling shortcomings exacerbatedlock contention.
violations. Keeping them in the standard tool belt can helpreduce future occurrence of this class of bugs.
The rest of the paper is organized as follows. Section 2describes the architecture of the Linux scheduler. Section 3introduces the bugs we discovered, analyzes their root causesand reports their effect on performance. Section 4 presentsthe tools. Section 5 reflects on related work and Section 6summarizes our findings.
2. The Linux SchedulerWe first describe how Linux’s Completely Fair Scheduling(CFS) algorithm works on a single-core single-user system(Section 2.1). From this perspective, the algorithm is quitesimple. Then, in (Section 2.2) we explain how limitations ofmodern multicore systems force developers to work-aroundpotential performance bottlenecks, which results in a sub-stantially more complex and bug-prone implementation.
2.1 On a single-CPU system, CFS is very simpleLinux’s CFS is an implementation of the weighted fairqueueing (WFQ) scheduling algorithm, wherein the avail-able CPU cycles are divided among threads in proportionto their weights. To support this abstraction, CFS (like mostother CPU schedulers) time-slices the CPU among the run-ning threads. The key decisions made in the scheduler are:how to determine a thread’s timeslice? and how to pick thenext thread to run?
The scheduler defines a fixed time interval during whicheach thread in the system must run at least once. The intervalis divided among threads proportionally to their weights.The resulting interval (after division) is what we call thetimeslice. A thread’s weight is essentially its priority, orniceness in UNIX parlance. Threads with lower nicenesshave higher weights and vice versa.
When a thread runs, it accumulates runtime. Once athread’s runtime exceeds its assigned timeslice, the thread ispre-empted from the CPU if there are other runnable threadsavailable. A thread might also get pre-empted if anotherthread with a smaller runtime is awoken.
Threads are organized in a runqueue, implemented as ared-black tree, in which the threads are sorted in the increas-ing order of their runtime. When a CPU looks for a newthread to run it picks the leftmost node in the red-black tree,which contains the thread with the smallest runtime.
2.2 On multi-core systems, CFS becomes quitecomplex
“I suspect that making the scheduler use per-CPUqueues together with some inter-CPU load balancinglogic is probably trivial . Patches already exist, and Idon’t feel that people can screw up the few hundred linestoo badly.”
Linus Torvalds, 2001
2 2015/10/26
CONFIDEN
TIAL

In multicore environments the implementation of thescheduler becomes substantially more complex. Scalabilityconcerns dictate using per-core runqueues. The motivationfor per-core runqueues is that upon a context switch the corewould access only its local runqueue, when it looks for athread to run. Context switches are on a critical path, so theymust be fast. Accessing only a core-local queue prevents thescheduler from making potentially expensive synchronizedaccesses, which would be required if it accessed a globallyshared runqueue.
However, in order for the scheduling algorithm to stillwork correctly and efficiently in the presence of per-corerunqueues, the runqueues must be kept balanced. Consider adual-core system with two runqueues that are not balanced.Suppose that one queue has one low-priority thread andanother has ten high-priority threads. If each core looked forwork only in its local runqueue, then high-priority threadswould get a lot less CPU time than the low-priority thread,which is not what we want. We could have each core checknot only its runqueue but also the queues of other cores,but this would defeat the purpose of per-core runqueues.Therefore, what Linux and most other schedulers do is toperiodically run a load-balancing algorithm that will keepthe queues roughly balanced.
Load balancing is an expensive procedure, bothcomputation-wise, because it requires iterating over manyrunqueues, and communication-wise, because it involvesmodifying remotely cached data structures and movingthreads between runqueues. So the scheduler goes to greatlengths to avoid running this algorithm often. At the sametime, not running it often enough may leave runqueues un-balanced. When that happens, cores might become idle whenthere is work to do, which hurts performance. So in addi-tion to periodic load-balancing, the scheduler also invokes“emergency” load balancing when a core becomes idle, andimplements some load-balancing logic upon placement ofnewly created or newly awoken threads. These mechanismsshould, in theory, ensure that the cores are kept busy if thereis work to do.
We next describe how load balancing works, first explain-ing the algorithm and then the optimizations that the sched-uler employs to maintain low overhead and to save power.Later we show that some of these optimizations make thecode more complex and cause bugs.
2.2.1 The load balancing algorithmCrucial for understanding the load balancing algorithm is themetric that the CFS scheduler uses to track load. We begin byexplaining the metric and then describe the actual algorithm.
The load tracking metric A strawman load-balancingalgorithm would simply ensure that each runqueue hasroughly the same number of threads. However, this is notnecessarily what we want. Consider a scenario with two run-queues, where one queue has some number of high-prioritythreads and another queue has the same number of low-
priority threads. Then high-priority threads would get thesame amount of CPU time as low-priority threads. That isnot what we want. One idea, then, is to balance the queuesbased on threads’ weights, not their number.
Unfortunately, balancing the load based solely on threadweights is not sufficient either. Consider a scenario withten threads in two runqueues: one thread is of high priorityand nine threads are of low priority. Let us assume that theweight of the high-priority thread is nine times higher thanthose of the low-priority threads. With the load balancedaccording to threads’ weights, one runqueue would containthe high-priority thread, while the other would contain thenine low-priority threads. The high-priority thread would getnine times more CPU than the low-priority threads, whichappears to be what we want. However, suppose that the high-priority thread often sleeps for short periods of time, so thefirst core often goes idle. This core would have to frequentlysteal work from the other core’s runqueue to keep itselfbusy. However, we do not want work stealing to become thecommon case, because this defeats the purpose of per-corerunqueues. What we really want is to balance the runqueuesin a smarter way, accounting for the fact that the high prioritythread does not need a whole core.
To achieve this goal, CFS balances runqueues not justbased on weights, but based on a metric called load, which isthe combination of the thread’s weight and its average CPUutilization. If a thread does not use much of a CPU, its loadwill be decreased accordingly.
Additionally, the load-tracking metric accounts for vary-ing levels of multithreading in different processes. Considera scenario where we have one process with lots of threads,and another process with few threads. Then the threads of thefirst process combined will receive a lot more CPU time thanthe threads of the second process. As a result, the first pro-cess would use most of the CPU cycles and starve the otherprocess. This would be unfair. So as of version 2.6.38 Linuxadded an autogroup feature, wherein the processes that runin different ttys are assigned to different groups. Then, eachthread’s load is further divided by the total number of threadsin its parent group.
The load-balancing algorithm A basic load balancingalgorithm would compare the load of all cores and thentransfer tasks from the most loaded core to the leastloaded core. Unfortunately this would result in threadsbeing migrated accross the machine without consideringcache locality or NUMA. Instead, the load balancer uses ahierarchical strategy.
The cores are logically organized in a hierarchy, at thebottom of which is a single core. How the cores are groupedin the next levels of the hierarchy depends on how theyshare the machine’s physical resources. In the example pro-vided here we describe the hierarchy on our experimentalmachine (see Table 5), where pairs of cores share functionalunits (e.g., FPU), and groups of eight cores share a last-level
3 2015/10/26
CONFIDEN
TIAL
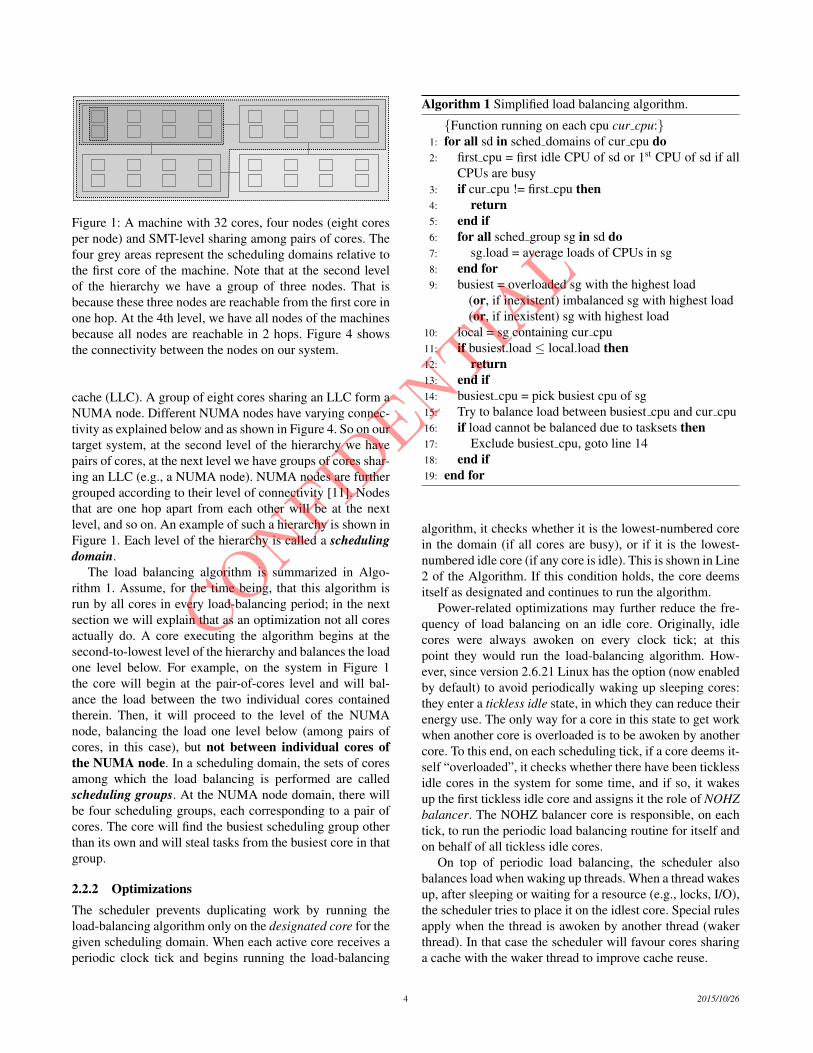
Figure 1: A machine with 32 cores, four nodes (eight coresper node) and SMT-level sharing among pairs of cores. Thefour grey areas represent the scheduling domains relative tothe first core of the machine. Note that at the second levelof the hierarchy we have a group of three nodes. That isbecause these three nodes are reachable from the first core inone hop. At the 4th level, we have all nodes of the machinesbecause all nodes are reachable in 2 hops. Figure 4 showsthe connectivity between the nodes on our system.
cache (LLC). A group of eight cores sharing an LLC form aNUMA node. Different NUMA nodes have varying connec-tivity as explained below and as shown in Figure 4. So on ourtarget system, at the second level of the hierarchy we havepairs of cores, at the next level we have groups of cores shar-ing an LLC (e.g., a NUMA node). NUMA nodes are furthergrouped according to their level of connectivity [11]. Nodesthat are one hop apart from each other will be at the nextlevel, and so on. An example of such a hierarchy is shown inFigure 1. Each level of the hierarchy is called a scheduling
domain.The load balancing algorithm is summarized in Algo-
rithm 1. Assume, for the time being, that this algorithm isrun by all cores in every load-balancing period; in the nextsection we will explain that as an optimization not all coresactually do. A core executing the algorithm begins at thesecond-to-lowest level of the hierarchy and balances the loadone level below. For example, on the system in Figure 1the core will begin at the pair-of-cores level and will bal-ance the load between the two individual cores containedtherein. Then, it will proceed to the level of the NUMAnode, balancing the load one level below (among pairs ofcores, in this case), but not between individual cores ofthe NUMA node. In a scheduling domain, the sets of coresamong which the load balancing is performed are calledscheduling groups. At the NUMA node domain, there willbe four scheduling groups, each corresponding to a pair ofcores. The core will find the busiest scheduling group otherthan its own and will steal tasks from the busiest core in thatgroup.
2.2.2 OptimizationsThe scheduler prevents duplicating work by running theload-balancing algorithm only on the designated core for thegiven scheduling domain. When each active core receives aperiodic clock tick and begins running the load-balancing
Algorithm 1 Simplified load balancing algorithm.
{Function running on each cpu cur cpu:}1: for all sd in sched domains of cur cpu do2: first cpu = first idle CPU of sd or 1st CPU of sd if all
CPUs are busy3: if cur cpu != first cpu then4: return5: end if6: for all sched group sg in sd do7: sg.load = average loads of CPUs in sg8: end for9: busiest = overloaded sg with the highest load
(or, if inexistent) imbalanced sg with highest load(or, if inexistent) sg with highest load
10: local = sg containing cur cpu11: if busiest.load local.load then12: return13: end if14: busiest cpu = pick busiest cpu of sg15: Try to balance load between busiest cpu and cur cpu16: if load cannot be balanced due to tasksets then17: Exclude busiest cpu, goto line 1418: end if19: end for
algorithm, it checks whether it is the lowest-numbered corein the domain (if all cores are busy), or if it is the lowest-numbered idle core (if any core is idle). This is shown in Line2 of the Algorithm. If this condition holds, the core deemsitself as designated and continues to run the algorithm.
Power-related optimizations may further reduce the fre-quency of load balancing on an idle core. Originally, idlecores were always awoken on every clock tick; at thispoint they would run the load-balancing algorithm. How-ever, since version 2.6.21 Linux has the option (now enabledby default) to avoid periodically waking up sleeping cores:they enter a tickless idle state, in which they can reduce theirenergy use. The only way for a core in this state to get workwhen another core is overloaded is to be awoken by anothercore. To this end, on each scheduling tick, if a core deems it-self “overloaded”, it checks whether there have been ticklessidle cores in the system for some time, and if so, it wakesup the first tickless idle core and assigns it the role of NOHZbalancer. The NOHZ balancer core is responsible, on eachtick, to run the periodic load balancing routine for itself andon behalf of all tickless idle cores.
On top of periodic load balancing, the scheduler alsobalances load when waking up threads. When a thread wakesup, after sleeping or waiting for a resource (e.g., locks, I/O),the scheduler tries to place it on the idlest core. Special rulesapply when the thread is awoken by another thread (wakerthread). In that case the scheduler will favour cores sharinga cache with the waker thread to improve cache reuse.
4 2015/10/26
CONFIDEN
TIAL

3. Bugs“The scheduler simply isn’t that important.”
Linus Torvalds, 2001
With so many rules about when the load balancing doesor does not occur, it becomes difficult to reason about howlong an idle core would remain idle if there is work to do andhow long a task might stay in a runqueue waiting for its turnto run when there are idle cores in the system. We now showhow this complexity leads to bugs. Understanding the bugs isnecessary to appreciate why they evade conventional testingand debugging tools. We therefore delay the presentation ofthe tools that we used to confirm and understand these bugsuntil Section 4. Table 4 summarizes the bugs described inthis section.
3.1 The Group Imbalance bugThe bug We encountered this bug on a multi-user machinewhich we used to perform kernel compilation and data anal-ysis using the R machine learning package. We suspectedthat this system, a 64-core eight-node NUMA server, did notuse all available cores for highly threaded computations, in-stead crowding all threads on a few nodes. We illustrate thisbug with the output from our visual tool, shown on Figure 2.
In the time period shown in the figure, the machinewas executing a compilation of the kernel (make with64 threads), and running two R processes (each with onethread). The make and the two R processes were launchedfrom 3 different ssh connections (i.e., 3 different ttys). Fig-ure 2a is a heatmap colour-coding the number of threads ineach core’s runqueue over time. The warmer the colour, themore threads a core hosts; white corresponds to an idle core.The chart shows that there are two nodes whose cores runeither only one thread or no threads at all, while the rest ofthe nodes are overloaded, with many of the cores having twothreads in the runqueue.
The reason is that the scheduler is not balancing loadbecause of (i) the complexity of the load-tracking metric,and (ii) the hierarchical design. Remember that a threads’load is a combination of its weight and how much CPU itneeds. With autogroups, the thread’s load is also divided bythe number of threads in the parent autogroup. In our case, athread in the 64-thread make process has a load roughly 64times smaller than a thread in a single-threaded R process.
Discrepancies between threads’ loads are illustrated inFigure 2b, which shows the combined load of threads in eachcore’s runqueue: a darker colour corresponds to a higherload. Nodes 0 and 4, the ones running the R processes, eachhave one core with a very high load. These are the cores thatrun the R threads. The Linux load balancer steals work fromother runqueues based on load; obviously the underloadedcores on Nodes 0 and 4 should not steal from the overloadedcore on their own node, because that core runs only a single
thread. However, they must be able to steal from the moreloaded cores on other nodes. Why is this not the case?
Remember that to limit algorithmic complexity, the loadbalancing algorithm uses a hierarchical design. When a coreattempts to steal work from another node, or, in other words,from another scheduling group, it does not examine the loadof every core in that group, it only looks at the group’saverage load (line 7 of Algorithm 1). If the average loadof the victim scheduling group is greater than that of itsown, it will attempt to steal from that group; otherwise itwill not. This is the exact reason why in our situation theunderloaded cores fail to steal from the overloaded coreson other nodes. They observe that the average load of thevictim node’s scheduling group is not any greater than theirown. The core trying to steal work runs on the same nodeas the high-load R thread; that thread skews up the averageload for that node and conceals the fact that some cores areactually idle. At the same time, cores on the victim node,with roughly the same average load, have lots of waitingthreads.
A valid question to ask is whether work stealing shouldoccur in this case, since theoretically we want threads witha higher load to get more CPU time than threads with alower load. The answer to that question is “yes”: Linux CFSscheduler is work-conserving in nature, so threads may getmore than their fair share of CPU cycles if there are idlecores in the system; in other words, idle cores should bealways given to waiting threads. As we have seen in thescenario illustrated here, this is not necessarily the case.
The fix To fix the bug, we changed the part of the algo-rithm that compares the load of scheduling groups. Insteadof comparing the average loads, we compare the minimumloads (lines 7 and 11 of Algorithm 1). The minimum load isthe load of the least loaded core in that group. If the mini-mum load of one scheduling group is lower than the mini-mum load of another scheduling group, it means that the firstscheduling group has a core that is less loaded than all coresin the other group, and thus a core in the first group muststeal from the second group. This algorithm ensures that nocore of the second group will remain overloaded while a coreof the first group has a smaller load, thus balancing the loadacross cores. Note that this fix works, because load is alsobalanced inside the groups (because of load balancing callsat lower levels of the hierarchy). Just as the original algo-rithm, we use the special cases of group imbalance (line 9of Algorithm 1) to deal with corner cases due to tasksets.These modifications add no algorithmic complexity to thescheduler as computing the minimum load of a schedulinggroup and its average have the same cost.
Impact on performance After we fixed the bug, the com-pletion time of the make job, in the make/R workload shownin Figure 2b, decreased by 13%. The completion time ofthe two R processes did not change. Performance impactcould be much higher in other circumstances. For example,
5 2015/10/26
CONFIDEN
TIAL

(a) Number of threads in each core’s runqueue over time (b) Load of each core’s runqueue over time
Figure 2: The Group Imbalance bug. Y-axis shows CPU cores. Nodes are numbered 0-7. Each node contains eight cores.
Figure 3: Several instances of the Overload-on-Wakeup bug.
in a workload running lu from the NAS benchmark with 60threads, and four single threaded R processes, lu ran 13⇥faster after fixing the Group Imbalance bug. Lu experienceda super-linear speedup, because the bug exacerbated lockcontention when multiple lu threads ran on the same core.
3.2 The Scheduling Group Construction bugThe bug Linux defines a command, called taskset, thatenables pinning applications to run on a subset of the avail-able cores. The bug we describe in this section occurs whenan application is pinned on nodes that are two hops apart.For example, in Figure 4, which demonstrates the topologyof our NUMA machine, Nodes 1 and 2 are two hops apart.The bug will prevent the load balancing algorithm from mi-grating threads between these two nodes. Since threads arecreated on the same node as their parent thread, the net ef-fect is that the pinned application runs only on one node, nomatter how many threads it has.
The bug is due to the way scheduling groups are con-structed, which is not adapted to modern NUMA machinessuch as the one we use in our experiments. In brief, thegroups are constructed from the perspective of a specificcore (e.g., Core 0), whereas they should be constructed from
the perspective of the core responsible for load balancing oneach node. We explain with an example.
Node 0
Node 6
Node 4
Node 2
Node 5 Node 1
Node 7Node 3
Figure 4: Topology of our 8-node AMD Bulldozer machine
In our machine, shown in Figure 4, the first schedulinggroup contains the cores of Node 0, plus the cores of all thenodes that are one hop apart from Node 0, namely Nodes 1,2, 4 and 6. The second scheduling group contains the coresof the first node not included into the first group (Node 3),plus cores of all nodes that are one hop apart from Node 3:Nodes 1, 2, 4, 5, 7. The first two scheduling groups are thus:
{0, 1, 2, 4, 6}, {1, 2, 3, 4, 5, 7}
Note that Nodes 1 and 2 are included in both schedulinggroups. Further note that these two nodes are actually twohops apart from one another. If the scheduling groups wereconstructed from the perspective of Node 1, Node 1 and 2
6 2015/10/26
CONFIDEN
TIAL
would not be together in all groups. Let us see what thisimplies for load balancing.
Suppose that an application is pinned on Nodes 1 and2 and that all of its threads are being created on Node 1(Linux spawns threads on the same core as their parentthread; when an application spawns multiple threads duringits initialization phase, they are likely to be created on thesame core – so this is what typically happens). Eventuallywe would like the load to be balanced between Nodes 1 and2. However, when a core on Node 2 looks for work to steal,it will compare the load between the two scheduling groupsshown earlier. Since each scheduling group contains bothNodes 1 and 2, the average loads will be the same, so Node2 will not steal any work!
The bug originates from an attempt to improve the per-formance of Linux on large NUMA systems. Before the in-troduction of the bug, Linux would balance the load insideNUMA nodes and then across all NUMA nodes. New lev-els of hierarchy (nodes 1 hop apart, nodes 2 hops apart, etc.)were introduced to increase the likelihood for threads to re-main close to their original NUMA node.
The fix We updated the construction of scheduling groupsso that cores use scheduling groups constructed from theirperspective when stealing. After the fix, when cores of Node1 and 2 try to steal tasks at the level of the machine, Nodes1 and 2 are no longer included in all scheduling groups. Thecores are thus able to detect an imbalance and to steal work.
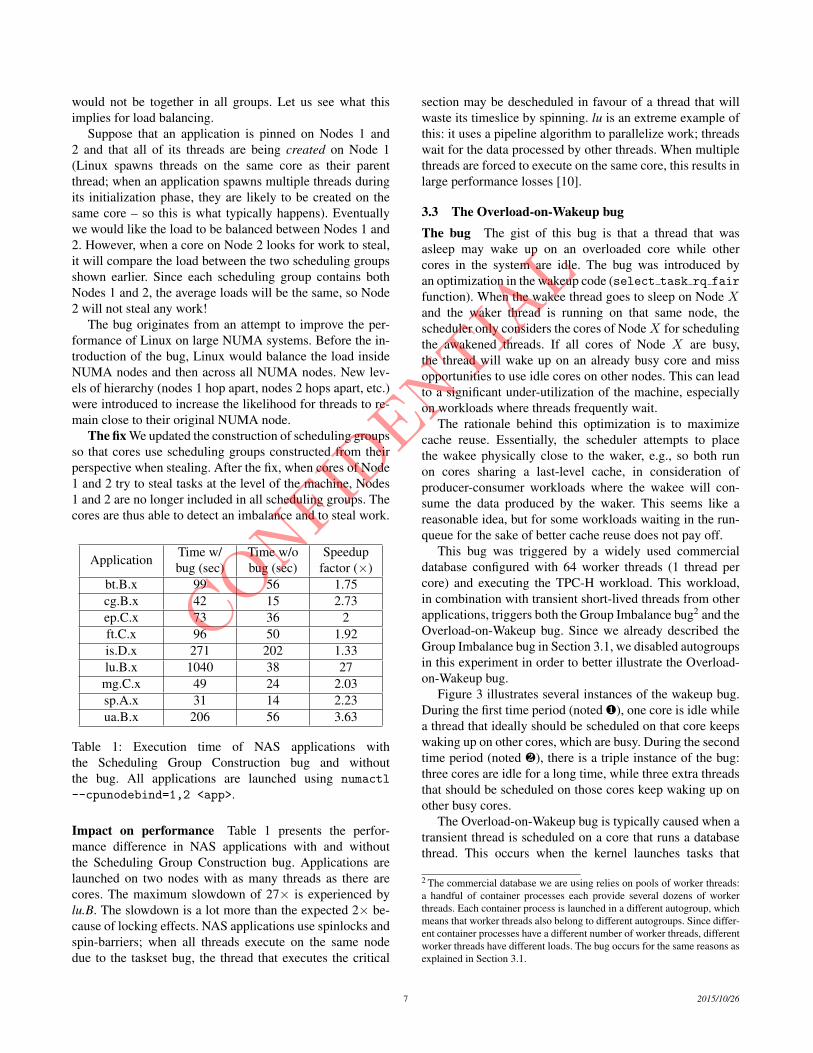
Application Time w/bug (sec)
Time w/obug (sec)
Speedupfactor (⇥)
bt.B.x 99 56 1.75cg.B.x 42 15 2.73ep.C.x 73 36 2ft.C.x 96 50 1.92is.D.x 271 202 1.33lu.B.x 1040 38 27mg.C.x 49 24 2.03sp.A.x 31 14 2.23ua.B.x 206 56 3.63
Table 1: Execution time of NAS applications withthe Scheduling Group Construction bug and withoutthe bug. All applications are launched using numactl
--cpunodebind=1,2 <app>.
Impact on performance Table 1 presents the perfor-mance difference in NAS applications with and withoutthe Scheduling Group Construction bug. Applications arelaunched on two nodes with as many threads as there arecores. The maximum slowdown of 27⇥ is experienced bylu.B. The slowdown is a lot more than the expected 2⇥ be-cause of locking effects. NAS applications use spinlocks andspin-barriers; when all threads execute on the same nodedue to the taskset bug, the thread that executes the critical
section may be descheduled in favour of a thread that willwaste its timeslice by spinning. lu is an extreme example ofthis: it uses a pipeline algorithm to parallelize work; threadswait for the data processed by other threads. When multiplethreads are forced to execute on the same core, this results inlarge performance losses [10].
3.3 The Overload-on-Wakeup bugThe bug The gist of this bug is that a thread that wasasleep may wake up on an overloaded core while othercores in the system are idle. The bug was introduced byan optimization in the wakeup code (select task rq fair
function). When the wakee thread goes to sleep on Node Xand the waker thread is running on that same node, thescheduler only considers the cores of Node X for schedulingthe awakened threads. If all cores of Node X are busy,the thread will wake up on an already busy core and missopportunities to use idle cores on other nodes. This can leadto a significant under-utilization of the machine, especiallyon workloads where threads frequently wait.
The rationale behind this optimization is to maximizecache reuse. Essentially, the scheduler attempts to placethe wakee physically close to the waker, e.g., so both runon cores sharing a last-level cache, in consideration ofproducer-consumer workloads where the wakee will con-sume the data produced by the waker. This seems like areasonable idea, but for some workloads waiting in the run-queue for the sake of better cache reuse does not pay off.
This bug was triggered by a widely used commercialdatabase configured with 64 worker threads (1 thread percore) and executing the TPC-H workload. This workload,in combination with transient short-lived threads from otherapplications, triggers both the Group Imbalance bug2 and theOverload-on-Wakeup bug. Since we already described theGroup Imbalance bug in Section 3.1, we disabled autogroupsin this experiment in order to better illustrate the Overload-on-Wakeup bug.
Figure 3 illustrates several instances of the wakeup bug.During the first time period (noted ∂), one core is idle whilea thread that ideally should be scheduled on that core keepswaking up on other cores, which are busy. During the secondtime period (noted ∑), there is a triple instance of the bug:three cores are idle for a long time, while three extra threadsthat should be scheduled on those cores keep waking up onother busy cores.
The Overload-on-Wakeup bug is typically caused when atransient thread is scheduled on a core that runs a databasethread. This occurs when the kernel launches tasks that
2 The commercial database we are using relies on pools of worker threads:a handful of container processes each provide several dozens of workerthreads. Each container process is launched in a different autogroup, whichmeans that worker threads also belong to different autogroups. Since differ-ent container processes have a different number of worker threads, differentworker threads have different loads. The bug occurs for the same reasons asexplained in Section 3.1.
7 2015/10/26
CONFIDEN
TIAL

last less than a millisecond to perform background opera-tions, such as logging or irq handling. When this happens,the load balancer observes a heavier load on the node thatruns the transient thread (Node A), and migrates one of thethreads to another node (Node B). This is not an issue ifthe transient thread is the one being migrated, but if it isthe database thread, then the Overload-on-Wakeup bug willkick in. Node B now runs an extra database thread, and thethreads, which often sleep and wake up, keep waking up onNode B, even if there are no idle cores on that node. Thisoccurs, because the wakeup code only considers cores fromthe local node for the sake of better cache reuse.
We now understand how a thread might wake up on aloaded core despite the presence of idle cores in the system.Note in Figure 3 that the system, actually, eventually recov-ers from the load imbalance: the load balancing algorithmfinally migrates threads from overloaded cores to idle cores.The question is, why does it take several milliseconds (oreven seconds) to recover?
Note that there are two kinds of idle cores in the system:short-term and long-term. Short-term idle cores go idle forshort periods, because the database thread running on thatcore intermittently sleeps due to a synchronization or I/Oevent. Ideally we want the load balancing events to migratea thread from an overloaded core to a long-term idle core.Migrating to a short-term idle core is of little help: a threadthat used to run on that core will shortly awaken, and as wehave seen, the scheduler may place it on another loaded corein the same node due to the cache locality optimization.3 Theimbalance will thus persist.
Unfortunately, when the scheduler considers where to mi-grate a thread from the overloaded core, it makes no distinc-tion between short-term and long-term idle cores. All it doesis to check whether the core is idle at the moment when theload-balancer is invoked. Remember from Section 2.2.1 thatthe load balancing algorithm is invoked at different levels ofthe hierarchy by the “designated core”. If there are multipleidle cores eligible to be “designated”, only one gets chosen.If we are lucky, the long-term idle core gets chosen, and thebalance gets restored. This is exactly what happens in Fig-ure 3, when the system eventually recovers from the imbal-ance. However, as we observed, pure luck is not enough tomaintain optimal performance.
The fix To fix this bug, we alter the code that is executedwhen a thread wakes up. We wake up the thread on the localcore—i.e., the core where the thread was scheduled last—if it is idle; otherwise, if there are idle cores in the system,we wake up the thread on the core that has been idle forthe longest amount of time. If there are no idle cores, wefall back to the original algorithm to find the core where thethread will wake up.
3 Actually, thread migrations to short-term idle cores explain why the extrathreads are not always located on the same cores in Figure 3.
Waking up the thread on a long-term idle core may haveimplications for power consumption. Cores that have beenidle for a long time usually go into a low-power mode. Wak-ing up a thread on that core will force the core to exit thatmode and run at full power. For that reason, we only en-force the new wakeup strategy if the system’s power man-agement policy does not allow cores to enter low-powerstates at all. Furthermore, our fix only matters for workloadswhere threads frequently go to sleep and awaken and wherethe system is intermittently oversubscribed (there are morethreads than cores). In these situations, waking up threads onlong-term idle cores makes sense. In other situations, sincethread wakeups are rare, our fix does not significantly alterthe behavior of the scheduler.
Looking for a long-term idle core in the system adds nooverhead to the wakeup function: the kernel already main-tains a list of all idle cores in the system, so picking the firstone (this is the one that has been idle the longest) takes con-stant time.
Bug fixes TPC-H request#18
Full TPC-Hbenchmark
None 55.9s 542.9sGroup Imbalance 48.6s (�13.1%) 513.8s (�5.4%)
Overload-on-Wakeup 43.5s (�22.2%) 471.1s (�13.2%)Both 43.3s (�22.6%) 465.6s (�14.2%)
Table 2: Impact of the bug fixes for the Overload-on-Wakeup and Group Imbalance bugs on a popular commer-cial database (values averaged over five runs).
Impact on performance This bug has a major impact onthe database TPC-H workload, because the threads oftenwait for each other, which means that any two threads thatare stuck on the same core end up slowing down all the re-maining threads. This effect is visible in Figure 3: during ∂and ∑: many threads have gaps in their execution, i.e., theyall sleep at the same time, waiting for “straggler” threads thatare sharing a core. When all instances of the bug are resolved(rightmost part of the graph), the gaps disappear.
Table 2 shows the performance impact of our bug fixesfor the Overload-on-Wakeup and Group Imbalance bugs onthe commercial database. We use two workloads: (1) the 18th
query of TPC-H, which is one of the queries that is most sen-sitive to the bug, and (2) the full TPC-H benchmark. Our bugfix for the Overload-on-Wakeup improves performance by22.2% on the 18th query of TPC-H, and by 13.2% on the fullTPC-H workload. Using the Group Imbalance bug fix in ad-dition to the Overload-on-Wakeup bug fix improves perfor-mance by 22.6% on the 18th query of TPC-H, and by 14.2%on the full TPC-H benchmark. The effect of the Group Im-balance bug fix is small in these experiments, because theGroup Imbalance bug only occurs at the level of a pair ofcores (i.e., one core is idle while another one is overloaded),and only during some parts of the experiments.
8 2015/10/26
CONFIDEN
TIAL

Figure 5: The Missing Scheduling Domains bug, from thepoint of view of Core 0. The vertical blue lines represent thecores considered by Core 0 for each (failed) load balancingcall. There is one load balancing call every 4ms. We can seethat Core 0 only considers its sibling core and cores on thesame node for load balancing, even though cores of Node 1are overloaded.
3.4 The Missing Scheduling Domains bugThe bug When a core is disabled and then re-enabled us-ing the /proc interface, load balancing between any NUMAnodes is no longer performed. The bug is due to an incor-rect update of a global variable representing the number ofscheduling domains in the machine. When a core is disabled,this variable is set to the number of domains inside a NUMAnode. As a consequence, the main scheduling loop (line 1 ofAlgorithm 1) exits earlier than expected.
As a result, threads can only run on the node on whichthey ran before the core had been disabled (even if the nodethey run on is not the same as that on which the core wasdisabled and then re-enabled). For processes created afterdisabling the core, all threads will run on the same node astheir parent process. Since all processes are usually createdfrom the same “root” process (e.g., sshd daemon and thessh processes it spawns), this bug usually results in all newlycreated threads executing on only one node of the machine,regardless of the number of threads.
Figure 5 shows a visualization of this bug. An applicationwith 16 threads is launched on the machine. After the threadshave been created, all cores on Node 1 run two threads(orange horizontal lines). The blue vertical lines originatingfrom Core 0 represent the cores considered by Core 0 whenit tries to steal work. Because the loop exits earlier than itshould, Core 0 only considers cores local to its node, andnot cores of Node 1.
The fix We traced the root cause of the bug to the code thatregenerates the machine’s scheduling domains. Linux regen-erates scheduling domains every time a core is disabled. Re-generating the scheduling domains is a two-step process: thekernel regenerates domains inside NUMA nodes, and thenacross NUMA nodes. Unfortunately, the call to the functiongenerating domains across NUMA nodes was dropped by
Linux developers during code refactoring. We added it back,and doing so fixed the bug.
Application Time w/bug (sec)
Time w/obug (sec)
Speedupfactor (⇥)
bt.B.x 122 23 5.24cg.B.x 134 5.4 24.90ep.C.x 72 18 4.0ft.C.x 110 14 7.69is.D.x 283 53 5.36lu.B.x 2196 16 137.59
mg.C.x 81 9 9.03sp.A.x 109 12 9.06ua.B.x 906 14 64.27
Table 3: Execution time (in seconds) of NAS applicationswith the Missing Scheduling Domains bug and without it.
Impact on performance Table 3 summarizes the impactof the Missing Scheduling Domains bug on several NAS ap-plications, after disabling and reenabling one core in the sys-tem. Applications are launched with 64 threads, the defaultconfiguration on our 64-core machine. The missing schedul-ing domain bug causes all threads of the applications torun on a single node instead of eight. In some cases, theperformance impact is greater than the 8⇥ slowdown thatone would expect, given that the threads are getting 8⇥ lessCPU time than they would without the bug (they run on onenode instead of eight). Lu.B, for example, runs 138⇥ faster!Super-linear slowdowns occur in cases where threads fre-quently synchronize using locks or barriers: if threads spinon a lock held by a descheduled thread, they will waste evenmore CPU time, causing cascading effects on the entire ap-plication’s performance. Some applications do not scale ide-ally to 64 cores and are thus a bit less impacted by the bug.The minimum slowdown is 4⇥.
CPUs 8 x 8-core Opteron 6272 CPUs(64 threads in total)
Clock frequency 2.1 GHzCaches 768 KB L1 cache, 16 MB L2 cache,(each CPU) 12 MB L3 cacheMemory 512 GB of 1.6 Ghz DDR-3Interconnect HyperTransport 3.0 (see Figure 4)
Table 5: Hardware of our AMD Bulldozer machine.
3.5 DiscussionThe first question to ask is whether these bugs could befixed with a new, cleaner scheduler design that is less error-prone and easier to debug, but still maintains the features wehave today. Historically though, this does not seem like itwould be a long-term solution, in addition to the fact that thenew design would need to be implemented and tested from
9 2015/10/26
CONFIDEN
TIAL

Name Description Kernelversion
Impactedapplications
Maximum measuredperformance impact
Group ImbalanceWhen launching multiple applications withdifferent thread counts, some CPUs are idlewhile other CPUs are overloaded.
2.6.38+ All 13⇥
Scheduling GroupConstruction
No load balancing between nodes that are 2-hops apart 3.9+ All 27⇥
Overload-on-Wakeup
Threads wake up on overloaded cores whilesome other cores are idle. 2.6.32+ Applications
that sleep or wait 22%
Missing SchedulingDomains
The load is not balanced between NUMAnodes 3.19+ All 138⇥
Table 4: Bugs found in the scheduler using our tools.
scratch. The Linux scheduler has gone through a couple ma-jor redesigns. The original scheduler had high algorithmiccomplexity, which resulted in poor performance when highlymultithreaded workloads became common. In 2001, it wasreplaced by a new scheduler with O(1) complexity and bet-ter scalability on SMP systems. It was initially successfulbut soon required modifications for new architectures likeNUMA and SMT. At the same time, users wanted bettersupport for desktop use cases such as interactive and audioapplications which required more changes to the scheduler.Despite numerous modifications and proposed heuristics, theO(1) scheduler was not able to meet expectations and wasreplaced by CFS in 2007. Interestingly, CFS sacrifices O(1)complexity for O(log n) but it was deemed worthwhile toprovide the desired features.
As the hardware and workloads became more complex,CFS too succumbed to bugs. The addition of autogroupscoupled with the hierarchical load balancing introducedthe Group Imbalance bug. Asymmetry in new, increasinglymore complex NUMA systems triggered the SchedulingGroup Construction bug. “NUMA-ness” of modern sys-tems was responsible for the Missing Scheduling Domainsbug. Cache-coherency overheads on modern multi-node ma-chines motivated the cache locality optimization that causedthe Overload-on-Wakeup bug.
The takeaway is that new scheduler designs come and go.However, a new design, even if clean and purportedly bug-free initially, is not a long-term solution. Linux is a largeopen-source system developed by dozens of contributors. Inthis environment, we will inevitably see new features and“hacks” retrofitted into the source base to address evolvinghardware and applications.
The upcoming Linux 4.3 kernel features a new imple-mentation of the load metric. This change is reported tobe “done in a way that significantly reduces complexity ofthe code” [1]. Simplifying the load metric could get rid ofthe Group Imbalance bug, which is directly related to it.However, we confirmed, using our tools, that the bug is stillpresent.
Kernel developers rely on mutual code review and testingto prevent the introduction of bugs. This could potentially beeffective for bugs like the Missing Scheduling Domains andScheduling Group Construction that are easier to spot in thecode (of course, it still was not effective in these cases), butit is unlikely to be reliable for the more arcane types of bugs.
Catching these bugs with testing or conventional perfor-mance monitoring tools is tricky. They do not cause thesystem to crash or to run out of memory, they silently eataway at performance. As we have seen with the Group Im-balance and the Overload-on-Wakeup bugs, they introduceshort-term idle periods that “move around” between dif-ferent cores. These microscopic idle periods cannot be no-ticed with performance monitoring tools like htop, sar orperf. Standard performance regression testing is also un-likely to catch these bugs, as they occur in very specific situa-tions (e.g., multiple applications with different thread countslaunched from distinct ttys). In practice, performance testingon Linux is done with only one application running at a timeon a dedicated machine – this is the standard way of limitingfactors that could explain performance differences.
In summary, conventional testing techniques and debug-ging tools were not helpful to us in either confirming thebugs, after we initially suspected them, or understandingtheir root causes. Our experience motivated us to build newtools, using which we could productively confirm the bugsand understand why they occur. The following section de-scribes the tools.
4. Tools4.1 Online Sanity CheckerSanity checker is a term we use to describe a mechanism forperiodically checking an invariant that must be maintainedby the software. The invariant verified by our sanity checkeris shown in Algorithm 2. It verifies that no core is idle whileanother core’s runqueue has waiting threads. We strived tokeep the code simple, perhaps at the expense of a higheralgorithmic complexity, to minimize the chance of bugs inthe sanity checker itself.
10 2015/10/26
CONFIDEN
TIAL

Algorithm 2 “No core remains idle while another core isoverloaded”
1: for all CPU1 in CPUs do2: if CPU1.nr running >= 1 {CPU1 is not idle} then3: continue4: end if5: for all CPU2 in CPUs do6: if CPU2.nr running >= 2 and can steal(CPU1,
CPU2) then7: Start monitoring thread operations8: end if9: end for
10: end for
Our sanity checker is different from an assertion or awatchdog in that, in our case, it must be specifically tailoredto check for conditions that are acceptable for a short pe-riod of time, but unacceptable if they persist. While an as-sert would fire as soon as the desired invariant is violated,a sanity checker must minimize the probability of flaggingshort-term transient violations, and catch long-term viola-tions with a high probability.
To meet this requirement we implement the sanitychecker as follows. The invariant check is invoked period-ically at an interval S. If the invariant violation is detected,we actively monitor additional scheduler events (describedbelow) for a short time period M to see if this is a “legal”short-term violation that is promptly fixed by the scheduler.If it is not fixed, we record profiling information (describedbelow) and flag a bug.
We set S and M to minimize the overhead and the prob-ability of false positives and to maximize the probability ofdetecting the actual bugs. Our setting for S is one second;this helps ensure that the invariant violation is detected forall but very short programs and keeps the overhead low. Wemeasured the overhead to be under 0.5% on our system forworkloads of as many as 10,000 threads when S = 1.
The load balancer runs every 4ms, but because of the hi-erarchical design multiple load balancing attempts might beneeded to recover from invariant violation in a bug-free sys-tem. We conservatively set M to 100ms to virtually elimi-nate the probability of false positives. The monitoring thatoccurs during that period tracks thread migrations, creationsand destructions, because it is these events that can help thesystem to recover. Tracking these events requires adding afunction call in the move thread, fork and exit functionsthat check where threads are migrated. The overhead of thisfunction call is negligible.
The probability of detecting the actual bugs, i.e., long-term invariant violations, depends on the frequency and du-ration of the invariant violation. In most cases we described,once the bug triggers an invariant violation, the system neverrecovers. Such invariant violations are trivially detected bythe sanity checker. In one case (the Overload-on-Wakeup
bug), invariant violations persisted for shorter periods, onthe order of 100s of milliseconds, then disappeared and reap-peared again. In this case, the probability of catching the vi-olation depends on the total fraction of time that the systemspends in the undesirable state. If the fraction is small, thechances of detecting the bug are also small, but so is the im-pact on performance. Longer-lasting and/or more frequentlyoccurring violations are detected with a higher probability.Furthermore, if the bug-triggering workload keeps running,the chances that the sanity checker detects the bug during atleast one of the checks keep increasing.
If the bug is detected, the sanity checker begins gather-ing profiling information to include in the bug report. Weuse systemtap to profile calls to all load balancing func-tions (e.g., load balance, select task rq fair) alongwith all the statements executed by these functions and thevalues of the variables they use. We used these profiles tounderstand how the load-balancing functions were executedand why they failed to balance the load. Monitoring withsystemtap has a high overhead (around 7% in our mea-surements), so we only begin profiling after detecting thebug and stop profiling after 20ms.
Thanks to its small size, the sanity checker is eas-ily portable between kernel versions, and does not con-flict with patches that modify the scheduler. We origi-nally implemented the sanity checker in Linux 3.17. Port-ing to 4.3 only required changing one line of code (thedo posix clock monotonic gettime function, that weused to get timing data, changed its name).
4.2 Scheduler Visualization toolThe visualization tool we are about to describe was tremen-dously helpful in gauging the nature of bug symptoms andfurther understanding their root causes.The tool illustratessalient scheduling activity over time (the charts from thistool were shown to illustrate the bugs in the previous sec-tion). These charts rely on additional instrumentation of thekernel, whose overhead is negligible . Our visual tool makesit possible to profile and to plot (1) the size of run queues,(2) the total load of run queues, and (3) the cores thatwere considered during periodic load balancing and threadwakeups. In order to provide maximum accuracy, it does notuse sampling, instead, it records every change in the size ofrun queues or load, as well as a set of considered cores ateach load rebalancing or thread wakeup event. To keep theoverhead low, we store all profiling information in a largeglobal array in memory of a static size. Each element of thisarray is an event that corresponds to either (1), (2), or (3):
• For (1), we instrument kernel functions add nr running
and sub nr running, which are the only functions thatdirectly alter the variables that stores the size of each runqueue. In these functions, we store an event in our globalarray that contains a timestamp, the core number, and thenew runqueue size.
11 2015/10/26
CONFIDEN
TIAL

• Similarly, for (2), we instrument kernel functionsaccount entity enqueue and account entity en-queue, which are the only functions that directly alter thevariables that store the load of each run queue. In thesefunctions, we store an event in our global array that con-tains a timestamp, the core number, and the new load.
• Finally, for (3), we instrument kernel functionsselect idle sibling, update sg lb stats, find -busiest queue and find idlest group. In thesefunctions, we store an event in our global array thatcontains a timestamp, as well as a bit field with 0’s forcores that were not considered during the operation, and1’s for cores that were.
Implementing these changes in the Linux kernel took lessthan 150 lines of code. In order to write an event, a threaduses an atomic increment instruction to find the position inthe array where to write the event; it then writes its event tomemory which may incur a cache miss. On our architecture,20 bytes are sufficient to store each event. In Section 3, theapplication that produced events at the highest frequencywas the commercial database: it produces around 60,200events of type (1) per second, 58,000 events of type (2)per second, and 68,000 events of type (3) per second, fora total of around 186,200 events per second. Consequently,when active our profiler uses 3.6 MB of RAM per secondon a machine with 64 cores. In practice the profiler is onlyactive when a bug is detected, and its impact on performancenegligible in the non-buggy case.
In addition to the changes in the Linux kernel, we alsowrote a kernel module that makes it possible to start andend a profiling session on demand, and to output the globalarray to a file. We also wrote scripts that plot the results.Figures 2, 4, and 5 are examples of these plots.
In our experience, confirming and understanding thetricky performance bugs described in this paper, and detect-ing them across kernel versions was substantially more pro-ductive after we developed these tools. Since the tools catchimportant bugs, while at the same time being simple, virtu-ally overhead-free and easy to port across kernel versions,we believe that it is a good idea to keep them as part of astandard kernel developers’ tool belt.
5. Related WorkPerformance bugs Performance bugs are a recurring prob-lem for operating systems. The Linux Kernel Performanceproject [5] was started in 2005 to combat performance re-gressions. Despite this effort, performance bugs are repeat-edly reported by OS researchers. Boyd et al. [2] reported avariety of scalability bugs, and Harji et al. [8] reported otherkinds performance bugs in 2.6 kernels.
To combat performance bugs, Perl et al. [15] proposedto add assertions to kernels to check that function calls fin-ish in a timely manner. Shen et al. [18] built a throughput
model for checking the performance of I/Os. These tech-niques detect performance bugs using assertions, which isnot applicable for detecting a problematic load imbalance inthe scheduler. Temporary load imbalances are expected andnot problematic. Therefore, our online sanity checker usesa different design to discriminate between problematic andnon-problematic invariant violations.
Kernel correctness A large body of work has also beendone on verifying system correctness. RacerX [6] andEraser [17] detect deadlocks and race conditions. Erickson etal. [7] detect data races in kernel modules. It would be idealto extend these systems to target performance bugs, whichdo not necessarily result in systems crash; however, this is adifficult problem because short-term invariant violations areacceptable in our environment.
D3S [12], Likely Invariants [16], and ExpressOS [13]use invariants and predicates to check correctness of sim-ple operations (e.g., ensure that a variable is within a certainrange). Our online sanity checker makes it possible to detectmore subtle incorrect states of the system (i.e., systems withcores that are idle for a long time while other cores are over-loaded), and it could be integrated into operating systems tovalidate higher-level design choices.
Model checking has also been used to detect bugs in ker-nels. CMC [14] inject states in the kernel to find implemen-tation bugs. Yang et al. [19] found errors in file systems (e.g.deadlocks) using model checking. Model checking is a use-ful approach to find bugs before they happen. The scheduleris particularly challenging to model check due to the largenumber of possible workloads and intricacies with hardwarebehavior (e.g., topology, behavior of sleeping cores). Modelcheckers could be used to find crash bugs in the scheduler,but to the best of our knowledge, none of these works couldbe used to detect more subtle performance bugs.
Formal verification is a method for proving software cor-rectness by analyzing the source code. Traditionally, formalverification was limited to small codebases and languagesother than C, but recently, through heroic efforts of severalOS researchers, formal verification was applied to OS ker-nels [3, 4, 9]. Even so, these state-of-the-art methods do notapply to the bugs described here, because they are limitedto single-threaded environments and do not have a way ofreasoning about time. Formal tools work by describing thesystem as series of state transitions, pre-conditions and post-conditions, and then reason whether any state transitionsmay lead to violation of post-conditions given the possiblepre-conditions. The problem is that in our environment, shortand intermittent violations of post-conditions (i.e., idle coresin the presence of waiting threads) are totally acceptable. It isthe long-term violations that are problematic. Unfortunately,existing tools do not have the mechanisms allowing to rea-son how timing affects transient violation of invariants. Ex-tending these tools to work in multithreaded environmentsand to reason about time could make them more suitable,
12 2015/10/26
CONFIDEN
TIAL
but having Linux developers write formal specifications willbe another hurdle for adoption of these tools.
6. ConclusionScheduling, as in dividing CPU cycles among threads wasthought to be a solved problem. We show that this is not thecase. Catering to complexities of modern hardware, a sim-ple scheduling policy resulted in a very complex bug-proneimplementation. We discovered that the Linux scheduler vi-olates a basic work-conserving invariant: scheduling waitingthreads onto idle cores. As a result, runnable threads maybe stuck in runqueues for seconds while there are idle coresin the system; application performance may degrade many-fold. The nature of these bugs makes it difficult to detectthem with conventional tools. We fix these bugs, understandtheir root causes and present tools, which make catching andfixing these bugs substantially easier. Our fixes and tools willbe available on Github.
References[1] Linux 4.3 scheduler change “potentially affects every
smp workload in existence”. http://www.phoronix.
com/scan.php?page=news_item&px=Linux-4.
3-Scheduler-SMP.[2] Silas Boyd-Wickizer, Austin T. Clements, Yandong Mao,
Aleksey Pesterev, M. Frans Kaashoek, Robert Morris, andNickolai Zeldovich. An analysis of linux scalability to manycores. In Proceedings of the 9th USENIX Conference on Op-erating Systems Design and Implementation, OSDI’10, pages1–8, Berkeley, CA, USA, 2010. USENIX Association.
[3] Haogang Chen, Daniel Ziegler, Tej Chajed, Adam Chlipala,M. Frans Kaashoek, and Nickolai Zeldovich. Using crashhoare logic for certifying the fscq file system. In Proceed-ings of the 25th Symposium on Operating Systems Principles,SOSP ’15, pages 18–37, New York, NY, USA, 2015. ACM.
[4] Haogang Chen, Daniel Ziegler, Adam Chlipala, M. FransKaashoek, Eddie Kohler, and Nickolai Zeldovich. Specify-ing crash safety for storage systems. In 15th Workshop on HotTopics in Operating Systems (HotOS XV), Kartause Ittingen,Switzerland, May 2015. USENIX Association.
[5] Tim Chen, Leonid I Ananiev, and Alexander V Tikhonov.Keeping kernel performance from regressions. In Linux Sym-posium, volume 1, pages 93–102, 2007.
[6] Dawson Engler and Ken Ashcraft. Racerx: Effective, staticdetection of race conditions and deadlocks. In Proceedingsof the Nineteenth ACM Symposium on Operating SystemsPrinciples, SOSP ’03, pages 237–252, New York, NY, USA,2003. ACM.
[7] John Erickson, Madanlal Musuvathi, Sebastian Burckhardt,and Kirk Olynyk. Effective data-race detection for the kernel.In OSDI, volume 10, pages 1–16, 2010.
[8] Ashif S. Harji, Peter A. Buhr, and Tim Brecht. Our troubleswith linux and why you should care. In Proceedings of theSecond Asia-Pacific Workshop on Systems, APSys ’11, pages2:1–2:5, New York, NY, USA, 2011. ACM.
[9] Gerwin Klein, Kevin Elphinstone, Gernot Heiser, June An-dronick, David Cock, Philip Derrin, Dhammika Elkaduwe,Kai Engelhardt, Rafal Kolanski, Michael Norrish, ThomasSewell, Harvey Tuch, and Simon Winwood. sel4: Formalverification of an os kernel. In Proceedings of the ACMSIGOPS 22Nd Symposium on Operating Systems Principles,SOSP ’09, pages 207–220, New York, NY, USA, 2009. ACM.
[10] David Koufaty, Dheeraj Reddy, and Scott Hahn. Bias schedul-ing in heterogeneous multi-core architectures. In Proceedingsof the 5th European Conference on Computer Systems, Eu-roSys ’10, pages 125–138, New York, NY, USA, 2010. ACM.
[11] Baptiste Lepers, Vivien Quema, and Alexandra Fedorova.Thread and memory placement on numa systems: Asymme-try matters. In 2015 USENIX Annual Technical Conference(USENIX ATC 15), Santa Clara, CA, July 2015. USENIX As-sociation.
[12] Xuezheng Liu, Zhenyu Guo, Xi Wang, Feibo Chen, XiaochenLian, Jian Tang, Ming Wu, M. Frans Kaashoek, and ZhengZhang. D3s: Debugging deployed distributed systems. NSDI,February 2008.
[13] Haohui Mai, Edgar Pek, Hui Xue, Samuel Talmadge King,and Parthasarathy Madhusudan. Verifying security invariantsin expressos. In Proceedings of the Eighteenth InternationalConference on Architectural Support for Programming Lan-guages and Operating Systems, ASPLOS ’13, pages 293–304,New York, NY, USA, 2013. ACM.
[14] Madanlal Musuvathi, David Y. W. Park, Andy Chou, Daw-son R. Engler, and David L. Dill. Cmc: A pragmatic ap-proach to model checking real code. SIGOPS Oper. Syst. Rev.,36(SI):75–88, December 2002.
[15] Sharon E. Perl and William E. Weihl. Performance assertionchecking. In Proceedings of the Fourteenth ACM Symposiumon Operating Systems Principles, SOSP ’93, pages 134–145,New York, NY, USA, 1993. ACM.
[16] Swarup Kumar Sahoo, John Criswell, Chase Geigle, andVikram Adve. Using likely invariants for automated softwarefault localization. In Proceedings of the Eighteenth Interna-tional Conference on Architectural Support for ProgrammingLanguages and Operating Systems, ASPLOS ’13, pages 139–152, New York, NY, USA, 2013. ACM.
[17] Stefan Savage, Michael Burrows, Greg Nelson, Patrick Sobal-varro, and Thomas Anderson. Eraser: A dynamic data racedetector for multithreaded programs. ACM Trans. Comput.Syst., 15(4):391–411, November 1997.
[18] Kai Shen, Ming Zhong, and Chuanpeng Li. I/o system per-formance debugging using model-driven anomaly character-ization. In Proceedings of the 4th Conference on USENIXConference on File and Storage Technologies - Volume 4,FAST’05, pages 23–23, Berkeley, CA, USA, 2005. USENIXAssociation.
[19] Junfeng Yang, Paul Twohey, Dawson Engler, and MadanlalMusuvathi. Using model checking to find serious file systemerrors. ACM Trans. Comput. Syst., 24(4):393–423, November2006.
13 2015/10/26
CONFIDEN
TIAL