the linear, non-linear measurements, analysis and ...€¦ · international journal of computer...
TRANSCRIPT
International Journal of Computer Applications (0975 – 8887)
Volume 158 – No 6, January 2017
22
The Linear, Non-linear Measurements, Analysis and
Evaluation for the Design of Ultra-Wideband Low Noise
Amplifier
Pramod K. B. PhD Student of JAIN University
Asst Prof. in EXTC Dept. at MCT’s RGIT, Mumbai
Kumaraswamy H. V. Dept of Telecommunication R. V. C. E, Bangalore, India
ABSTRACT
This paper exhibits an examination, configuration, design to
measure nonlinear characteristics of low noise
amplifier(LNA) furthermore investigation, assess those
estimations in the AWR microwave office Tool. A large
portion of the critical aspects of LNA will be in linear
measurements and which is composed, designed and
simulated for the ultra LNA from 3GHz to 10GHz. In this
proposed work the methodology has made to address
nonlinear and linear measurements to the restricted band LNA
which be working in 820-960 MHz ISM band. The work
provides the required information about LNA design by using
two different advance measurement techniques. First
techniques are by using two tone harmonic balance source
input and second one is uses just by two port 50Ω lossless
line. A simulation setup is made to measure the characteristics
of LNA by using spectrum rectangular display type with
power harmonic components. In this paper, three circuits
schematic of the designed LNA are discussed with
corresponding measurements. Finally, author designed ultra-
wideband LNA from the bandwidth 3GHz to 10GHz and
elaborates how nonlinear measurements changed the way of
LNA design to validate and construction at higher
frequencies.
Keywords
Nonlinear measurements, microwave circuits, two-tone
measurements, harmonic balance, Scattering parameters and
Low noise amplifier (LNA).
1. INTRODUCTION In the growth of communication world, the wireless sensor
networks (WSNs) have becoming highly seeking after in
extremely great in number of applications likely RADAR,
Defence, health-care, environmental monitoring, industrial
settings, and agriculture. LNA performance has a strong
impact with high interesting on the gain, bandwidth, Noise
figure and return loss in the receiver systems. The aim of this
proposed work is to have contradictions with regularly used
linear measurements and nonlinear measurements in LNA
circuit in ISM bands.
In this paper, the circuit design method of proposed ISM band
820-960MHz low-noise amplifier and also Ultra-wideband
LNA using AWR tool with non-linear measurement presented
in sections III Finally, the conclusion is summarized in section
IV and V.
2. RESEARCH BACKGROUND During the last decades, various LNA design circuits have
been proposed and presented. The most popular LNA design
is based on Hybrid Microwave Integrated Circuit (HMIC)
technology up to 10GHz frequency band. So in this section
various proposed designs are discussed with their benefits and
limitations with respect to measurement techniques.
Sombrin,[3] discussed two important measurements likely
NPR (noise power ratio) and EVM (error vector magnitude)
are characterize linear or non-linear distortions and
degradations in digital modulators, RF and microwave
amplifiers and transmission links. Also examines the
necessary conditions for these two measurements (or
simulations) to give the same value for this equivalent noise.
Teppati, Ferrero, Camarchia, Neri, & Pirola,[4], in their work
completes the sequence started with articles of Camarchia et
al. [1] previously work which presented the most important
aspects of RF and microwave linear and non-linear
measurements. In basic load-pull systems, the device under
test (DUT) is driven by a single tone microwave source while
the DUT performance metrics, typically output power and
power added efficiency (PAE), are monitored as a function of
the load and/or source terminations. Also describe two of the
most advanced measurement techniques that can provide the
required information for amplifier design are first technique is
the multi-tone/complex modulation load-pull and second
measurement technique is the time domain waveform load-
pull. (Camarchia, Teppati, Corbellini, & Pirola, [1] addresses
the problems in microwave non-linear measurements and
discusses techniques to synthesize loads, the most used non-
linear measurement techniques, and harmonic load-pulling.
The vector network analyzer (VNA) is the core instrument
used in the non-linear characterization scenario. Schreurs, [2],
discusses the capabilities of vector non-linear microwave
measurements. It starts off with a historical review on the
development of such instrumentation and elaborates on how
vector non-linear measurements changed the way in which
models for non-linear microwave devices are validated and
constructed, broadened physical understanding, and impacted
microwave circuit design.
3. DESIGN AND MEASUREMENTS This section gives the information about the importance of
nonlinear measurements in microwave amplifier especially
with respects to LNA and power amplifier. This proposed
work gives clear idea about how to make non-linear
measurements in AWR microwave tool.
For the successful non-linear measurements of the LNA
require to be designed three or more number of schematics
International Journal of Computer Applications (0975 – 8887)
Volume 158 – No 6, January 2017
23
because Nonlinearities model are prepared by a numerous
polynomial and clipping function. In which those functions
provide the correct saturation, harmonics and intermodulation
characteristics regardless of the relative values of IP3 and
P1dB. The controlled current source f(v) is modelled by a
polynomial:
𝑓 𝑣 = 𝑎1𝑣 + 𝑎2𝑣2 + 𝑎3𝑣
3 + 𝑎4𝑣4
+ ⋯… . . (1)
The above polynomial models describe intermodulation
distortion through N order. Generally polynomial will be
considered up to order 3. The values of the coefficients are
derived from the specified intercept points.
3.1 Schematic 1
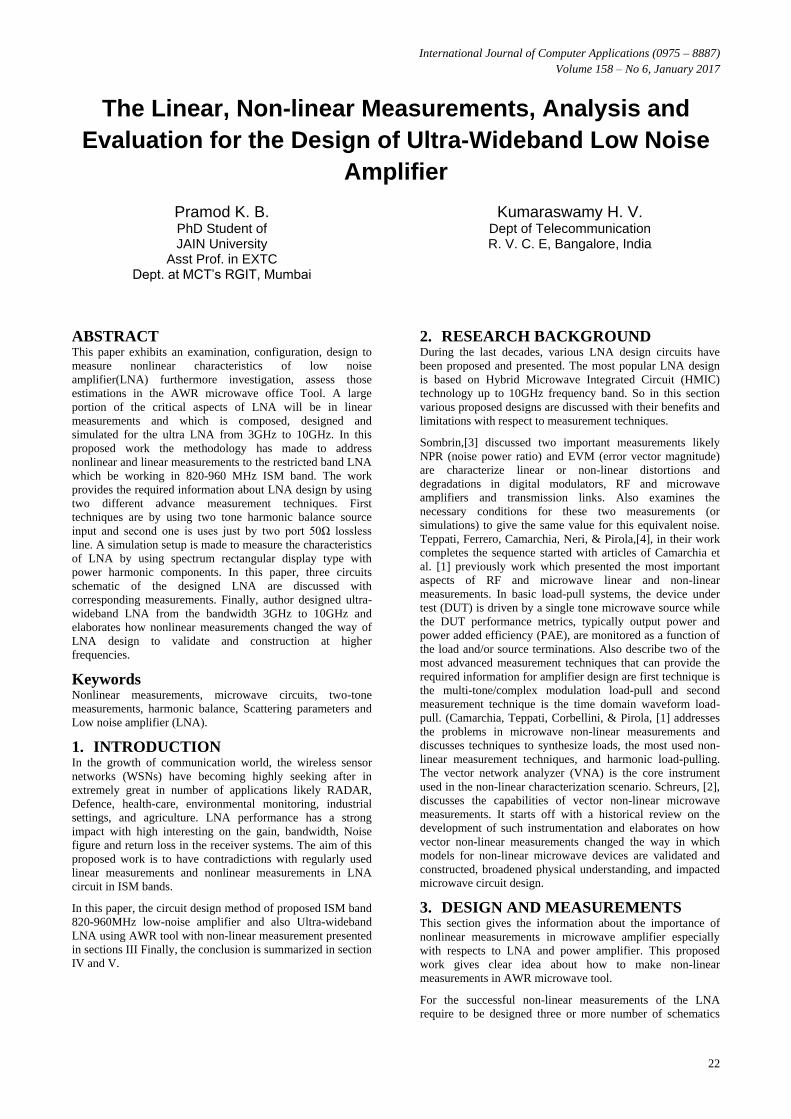
Fig 1. shows prepared schematic with components
NL_AMP, SWPVAR, Port2 and Port for the LNA module.
The one-dB compression point is thing that constitute more
problem to prepare model. One cause of compression in a
microwave LNA is clipping of the when DC bias power is
inadequate to provide output for corresponding input
waveforms power. Theoretically, even if the LNA is perfectly
linear for small signals which implies that a2 = 0, a3 = 0 so on
in the polynomial. The Compression are caused by the
inherent small-signal nonlinearities in f(v). In such cases, a
cubic polynomial is not acceptable in quality to model
compression, and unless other means are used, the model
becomes very poor and lacks with sufficient data above the 1-
dB compression point.
To avoid these state of difficulty, the amplifier model
calculates the 1 dB compression point according to both
criteria and uses the one that represents the lower of the two
compression levels. If the LNA's compression is caused by
clipping, a clipping function is used with the value set
appropriately. [9] Seems to contradict that if compression is
caused by the nonlinearities in f(v), those are allowed to
provide compression. The clipping level is then set somewhat
higher, to provide the correct behavior in hard saturation. The
transition between these two conditions is approximately 10
dB below the third-order intercept point, IP3. Therefore, if
P1DB < IP3 - 10, the amplifier saturates on clipping, while,
for higher values, the nonlinearities of f(v) dominate [10].
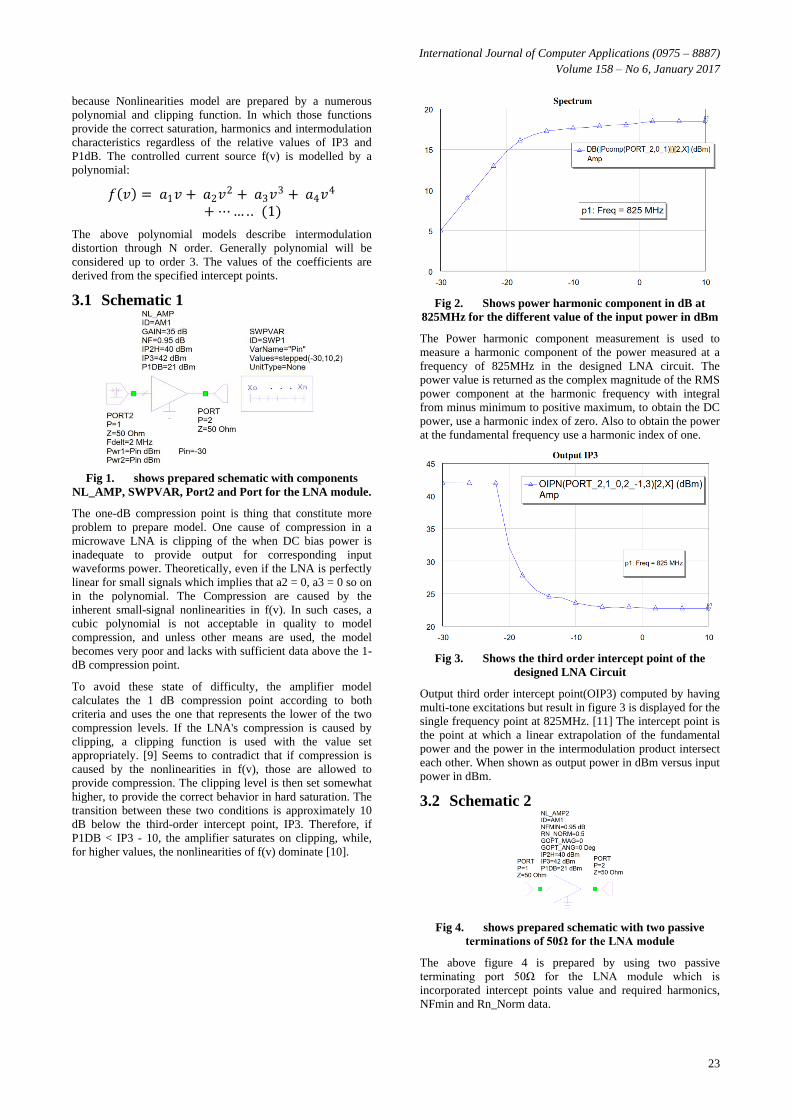
Fig 2. Shows power harmonic component in dB at
825MHz for the different value of the input power in dBm
The Power harmonic component measurement is used to
measure a harmonic component of the power measured at a
frequency of 825MHz in the designed LNA circuit. The
power value is returned as the complex magnitude of the RMS
power component at the harmonic frequency with integral
from minus minimum to positive maximum, to obtain the DC
power, use a harmonic index of zero. Also to obtain the power
at the fundamental frequency use a harmonic index of one.
Fig 3. Shows the third order intercept point of the
designed LNA Circuit
Output third order intercept point(OIP3) computed by having
multi-tone excitations but result in figure 3 is displayed for the
single frequency point at 825MHz. [11] The intercept point is
the point at which a linear extrapolation of the fundamental
power and the power in the intermodulation product intersect
each other. When shown as output power in dBm versus input
power in dBm.
3.2 Schematic 2
Fig 4. shows prepared schematic with two passive
terminations of 50Ω for the LNA module
The above figure 4 is prepared by using two passive
terminating port 50Ω for the LNA module which is
incorporated intercept points value and required harmonics,
NFmin and Rn_Norm data.
International Journal of Computer Applications (0975 – 8887)
Volume 158 – No 6, January 2017
24
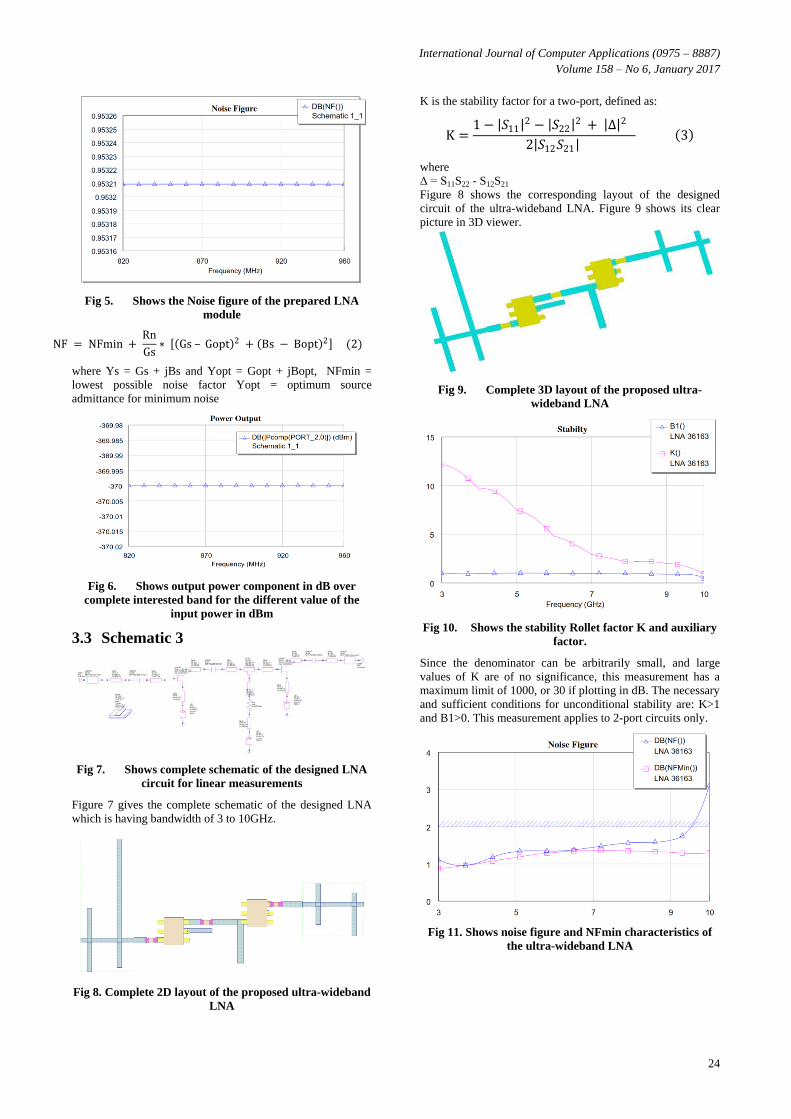
Fig 5. Shows the Noise figure of the prepared LNA
module
NF = NFmin + Rn
Gs∗ Gs – Gopt 2 + Bs − Bopt 2 (2)
where Ys = Gs + jBs and Yopt = Gopt + jBopt, NFmin =
lowest possible noise factor Yopt = optimum source
admittance for minimum noise
Fig 6. Shows output power component in dB over
complete interested band for the different value of the
input power in dBm
3.3 Schematic 3
Fig 7. Shows complete schematic of the designed LNA
circuit for linear measurements
Figure 7 gives the complete schematic of the designed LNA
which is having bandwidth of 3 to 10GHz.
Fig 8. Complete 2D layout of the proposed ultra-wideband
LNA
K is the stability factor for a two-port, defined as:
K =1 − 𝑆11
2 − 𝑆22 2 + Δ 2
2 𝑆12𝑆21
3
where
Δ = S11S22 - S12S21
Figure 8 shows the corresponding layout of the designed
circuit of the ultra-wideband LNA. Figure 9 shows its clear
picture in 3D viewer.
Fig 9. Complete 3D layout of the proposed ultra-
wideband LNA
Fig 10. Shows the stability Rollet factor K and auxiliary
factor.
Since the denominator can be arbitrarily small, and large
values of K are of no significance, this measurement has a
maximum limit of 1000, or 30 if plotting in dB. The necessary
and sufficient conditions for unconditional stability are: K>1
and B1>0. This measurement applies to 2-port circuits only.
Fig 11. Shows noise figure and NFmin characteristics of
the ultra-wideband LNA

International Journal of Computer Applications (0975 – 8887)
Volume 158 – No 6, January 2017
25
Fig 12. Shows input return loss(S11) and output return
loss(S22) characteristics of the ultra-wideband LNA
Fig 13. Shows transducer gain (S21) in dB of the ultra-
wideband LNA
4. SUMMARY Table 1. Comparison of the proposed work results to
recent published work
Reference Bandwidth
(GHz)
Noise
Figure
in dB
Gain
in dB
Return
Loss in
dB
[5] 0.5 - 6 <3 > 30 Not
considered
[6] 3-11 <3.37
± 0.15
>17.74
± 0.64
-8.2
[7] 3 -10 <5 >16.78 -14
[8] 2.8-10.6 <3.2 ±
0.2
>12.32
± 1.07
-7.45
This
Proposed
work
3-10 <2 >18 <-10dB
5. CONCLUSION The linear, non-linear characteristics estimations of which
been working in 820-960 MHz ISM band LNA clearly
discussed in this paper. All examinations, outline of low noise
amplifier, investigation and assessment are done in the
industrial standard AWR microwave office tool. In this
proposed work the endeavour has made to address nonlinear
and linear measurements to the narrow band low noise
amplifier with the assistance of rectangular display type with
essential estimations like Gain, NF, RL and PAE. The work
gave the required data about LNA design by utilizing two
diverse development estimation procedures and key
characteristics. The three circuits schematics of the outlined
LNA are examined with comparing estimations and
demonstrated deviations, changes in schematic level. At last,
author elaborates and explains the linear, nonlinear
estimations order of LNA configuration to accept and build at
higher frequencies.
6. ACKNOWLEDGMENT This work is supported by MCT's Rajiv Gandhi Institute of
Technology, Mumbai and also authors would like to thank Dr.
Udhav Bhosle, Principal of RGIT, Chairman, Board of
Studies in EXTC Engineering, University of Mumbai for
significant support and encouragement for this research work.
The authors would like to special thanks for Prof. K. T
Srirangaraj , Dr. TGS Moorthy, Prof. Chandrashekar K. CET,
Jain University, Bangalore and Mr. Manjunatha Reddy H. V
Technical Manager, RF and μW division, Icon Design
Automation Pvt. Ltd. for their valuable guidance.
7. REFERENCES [1] Camarchia, V., Teppati, V., Corbellini, S., & Pirola, M.
(2007). Microwave Measurements Part II Non-linear
Measurements. IEEE Instrumentation & Measurement
Magazine, vol. 10, no. 3, 34-39.
[2] Schreurs, D. (2010). Applications of vector non-linear
microwave measurements, IET Microwaves, Antennas &
Propagation, vol. 4, no. 4 doi: 10.1049/iet-
map.2009.0479, 421-425.
[3] Sombrin, J. B. (2011). On the formal identity of EVM
and NPR measurement methods: Conditions for identity
of error vector magnitude and noise power ratio.
Microwave Conference (EuMC), 2011 41st European,
Manchester, 337-340.
[4] Teppati, V., Ferrero, A., Camarchia, V., Neri, A., &
Pirola, M. (2008). Microwave measurements - Part III:
Advanced non-linear measurements. IEEE
Instrumentation & Measurement Magazine, vol. 11, no.
6, 17-22.
[5] B. R. Vidhale and M. M. Khanapurkar, "Design of ultra
wideband low noise amplifier with the negative feedback
using micro strip line matching structure for multiple
band application and its simulation based performance
analysis," 2016 International Conference on Wireless
Communications, Signal Processing and Networking
(WiSPNET), Chennai, India, 2016, pp. 1845-1848
[6] H. Karrari, H. F. Baghtash and E. N. Aghdam, "A 3-
11GHz current-reuse low noise amplifier for ultra-
wideband recievers," 2016 Eighth International
Conference on Ubiquitous and Future Networks
(ICUFN), Vienna, 2016, pp. 563-567. doi:
10.1109/ICUFN.2016.7537095
[7] H. Sathwara and K. Shah, "Design of low power CMOS
low noise amplifier using current reuse technique," 2015
5th Nirma University International Conference on
Engineering (NUiCONE), Ahmedabad, 2015, pp. 1-6.
doi: 10.1109/NUICONE.2015.7449628
[8] H. Karrari and E. N. Aghdam, "A 2.8???10.6GHz low-
power low-noise amplifier for ultra-wideband recivers,"
2015 2nd International Conference on Knowledge-Based

International Journal of Computer Applications (0975 – 8887)
Volume 158 – No 6, January 2017
26
Engineering and Innovation (KBEI), Tehran, 2015, pp.
908-911. doi: 10.1109/KBEI.2015.7436164
[9] C. k. Luo, P. S. Gudem and J. F. Buckwalter, "A 0.4–6-
GHz 17-dBm B1dB 36-dBm IIP3 Channel-Selecting
Low-Noise Amplifier for SAW-Less 3G/4G FDD
Diversity Receivers," in IEEE Transactions on
Microwave Theory and Techniques, vol. 64, no. 4, pp.
1110-1121, April 2016. doi:
10.1109/TMTT.2016.2529598
[10] W. Gao, Z. Chen, Z. Liu, W. Cui and X. Gui, "A Highly
Linear Low Noise Amplifier With Wide Range
Derivative Superposition Method," in IEEE Microwave
and Wireless Components Letters, vol. 25, no. 12, pp.
817-819, Dec. 2015. doi: 10.1109/LMWC.2015.2496793
[11] C. k. Luo, P. S. Gudem and J. F. Buckwalter, "0.4–6
GHz,17-dBm B1dB, 36-dBm IIP3 channel-selecting,
low-noise amplifier for SAW-less 3G/4G FDD
receivers," Radio Frequency Integrated Circuits
Symposium (RFIC), 2015 IEEE, Phoenix, AZ, 2015, pp.
299-302. doi: 10.1109/RFIC.2015.7337764.
8. AUTHOR PROFILE Mr. Pramod K B was born in Mysore, Karnataka, India in
1989. He is currently working as Assistant Professor in
MCT’s RGIT, Mumbai and also working towards PhD degree
at JAIN University, Bangalore in Electronics Engineering. He
received his B.E degree in Electronics and Communication
from Dr.Ambedkar Institute of Technology, Bangalore
Visvesvaraya Technological University in 2010, M.Tech
degree in R F Communication from Jain University,
Bangalore, in 2012 and He worked as R F Design trainee at
Icon Design and Automation Pvt LtD and as visiting research
scholar at University of Concordia, Montreal, Quebec,
Canada. His research includes Design, Characterization And
Optimization Of RF Passive Devices , Board Level Tuning
And Optimization Of Matching Networks, Low Noise
Amplifier , Power Amplifier, Circuit Linearization And High-
Efficiency Design Techniques, Circuit Instability And
Strategies.
Prof. Dr. Kumaraswamy H.V is currently working as
Professor & HOD in the Dept of Telecommunication
Engineering, RVCE, and Bangalore. His research interests are
Digital Signal Processing, Adaptive Signal Processing and
Communication. He has got PhD from Visvesvaraya
Technological University for the research work on Smart
Antenna System using Dielectric lens. He is the author of the
book titled "Signals & Systems" Published by: SciTech
Publication, Chennai.
IJCATM : www.ijcaonline.org