the law of demand - Állatorvostudományi egyetem · the law of demand 3 what is the law of demand?...
TRANSCRIPT

1
1
Market Supply and Demand
2019
University of Veterinary Medicine, BudapestDepartment of Veterinary Forensics and
Economics
2
The Law of Demand
3
What is thelaw of demand?
The principle that there is an inverse relationship between the price of a good and the quantity buyers are willing to purchase in a defined time period, ceteris paribus

2
4
What does “ceteris paribus” mean?
All else remains the same
5
What is a demand curve?
Depicts the relationship between price and quantity demanded
6
$20$15
$10
$5
4 8 12 16
AB
CD
Individual’s Demand Curve for Pet Food
Demand Curve
P
Q
7
A $20 4B $15 6
C $10 10D $5 16
Point Price Quantity demandedper Pet Food Bag (per year)
Individuals Buyer’s Demand Schedule for Pet Food

3
7
Why do demand curves have a negative slope?
At a higher price consumers will buy fewer units, and at a lower price they will buy more units
8
What is ademand schedule?
Shows the specific quantity of a good or service that people are willing and able to buy at different prices
9
What ismarket demand?
The summation of the individual demand schedules

4
10
$20$15
$10
$5
1 2 3 4
P
Q5 6 7 8 9
Fred’s Demand Curve
D1
11
$20$15
$10
$5
1 2 3 4
P
Q5 6 7 8 9
Mary’s Demand Curve
D2
12
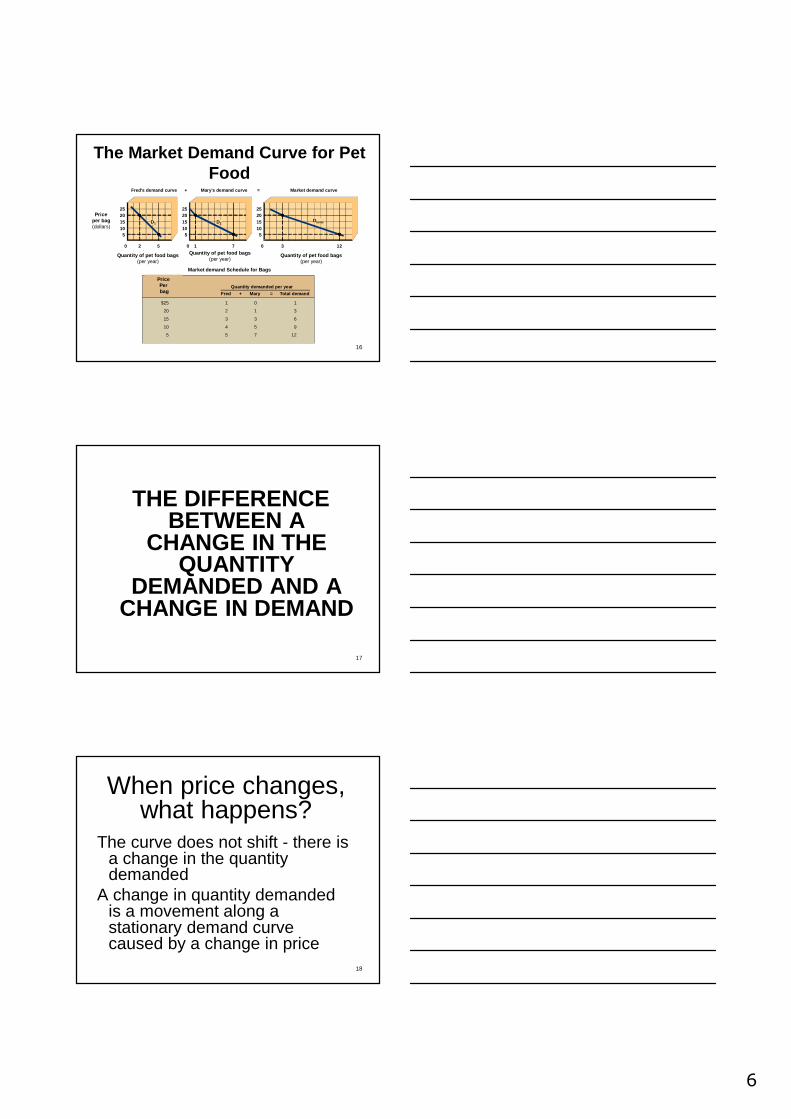
$25 1 + 0 = 1$20 2 1 3$15 3 3 6$10 4 5 9$5 5 7 12
Price Fred Mary Total Dem anded
Market Demand Schedule for Pet Food Bags

5
13
$20$15
$10
$5
3 4 5 6
P
Q7 8 9 1011
Market Demand Curve
D3
12
14
12
$20
$15
$10
$5
1 2 3 4
P
Q5 6 7 8 9
Fred’s Demand Curve
D1
13
$20
$15
$10
$5
1 2 3 4
P
Q5 6 7 8 9
Mary’s Demand Curve
D2
14
$20$15
$10
$5
3 4 5 6
P
Q7 8 9 1011
Market Demand Curve
D3
12
15
What ismarket demand
curve?
The horizontal summation of individual demand curves
6
16
5
0 1 7
10152025
5
0 3 12
10152025
5
Price percompact
disc(dollars)
0 2
10152025
Quantity of compact discs(per year)
Quantity of compact discs(per year)
Quantity f com ct iscs(per year)
Fred’s demand curve + Mary’s demand curve = Market demand cur ve
PriceperCD Fred Mary =+ Total demand
Market Demand Schedule for CDs
Quantity demanded per year
$25 1 0 1
20 2 1 3
15 3 3 6
10 4 5 9
5 5 7 12
D1
5
DtotalD2
3The Market Demand Curve for Pet Food
Quantity of pet food bags(per year)
Quantity of pet food bags(per year)
Quantity of pet food bags(per year)
Market demand Schedule for Bags
Price Perbag
Price per bag(dollars)
17
THE DIFFERENCE BETWEEN A
CHANGE IN THE QUANTITY
DEMANDED AND A CHANGE IN DEMAND
18
When price changes, what happens?
The curve does not shift - there is a change in the quantity demanded
A change in quantity demanded is a movement along a stationary demand curve caused by a change in price

7
19
$20$15
$10
$5
10 20 30 40
AB
A change in price causes a change in the quantity demanded
D
P
Q50
20
Decrease in Price
Increase in Quantity
Demanded
21
When something changes other than price, what happens?
The whole curve shifts, there is a change in demand
When any of the nonprice determinants of demand changes, the demand curve responds by shifting
An increase in demand (rightward shift) or a decrease in demand (leftward shift) is caused by a change in one of the nonprice determinants

8
22
$20$15
$10
$5
10 20 30 40
D1
D2
P
50
A
When the ceteris paribus assumption is relaxed, the whole curve can shift
Q
B
23
Change innonprice
determinant
Increase in demand
24
Price increases
Upward movement along the
demand curve
Decrease in quantity
demanded

9
25
Price decreases
Downward movement along the
demand curve
Increase in quantity
demanded
26
Nonprice determinant
Leftward or rightward shift in
the demand curve
Decrease or increase in
demand
27
Priceperunit
Quantity of good or service per unit of time
Effect
Upward movement alongthe demand curve
Downward movement along the demand curve
Leftward or rightward shift in the demand curve
Terminology
Decreasein the quantity demanded
Increasein the quantity demanded
Decreaseor increase in demand
Change
Price increases
Price decreases
Nonprice determinant
Change innonpricedeterminant
DD1 D2
Change innonpricedeterminant
3 Terminology for Changes in Priceand Nonprice Determinants of Demand

10
28
NONPRICE DETERMINANTS OF
DEMAND
29
What can cause a shift in a demand curve?
Nonprice determinants - Demand shifters
• Number of buyers in the market• Income (normal and inferior)• Tastes and preferences• Expectations of consumers (future
price and income changes)• Prices of related goods (substitutes
and complements)
30
Number of buyers inthe market
11
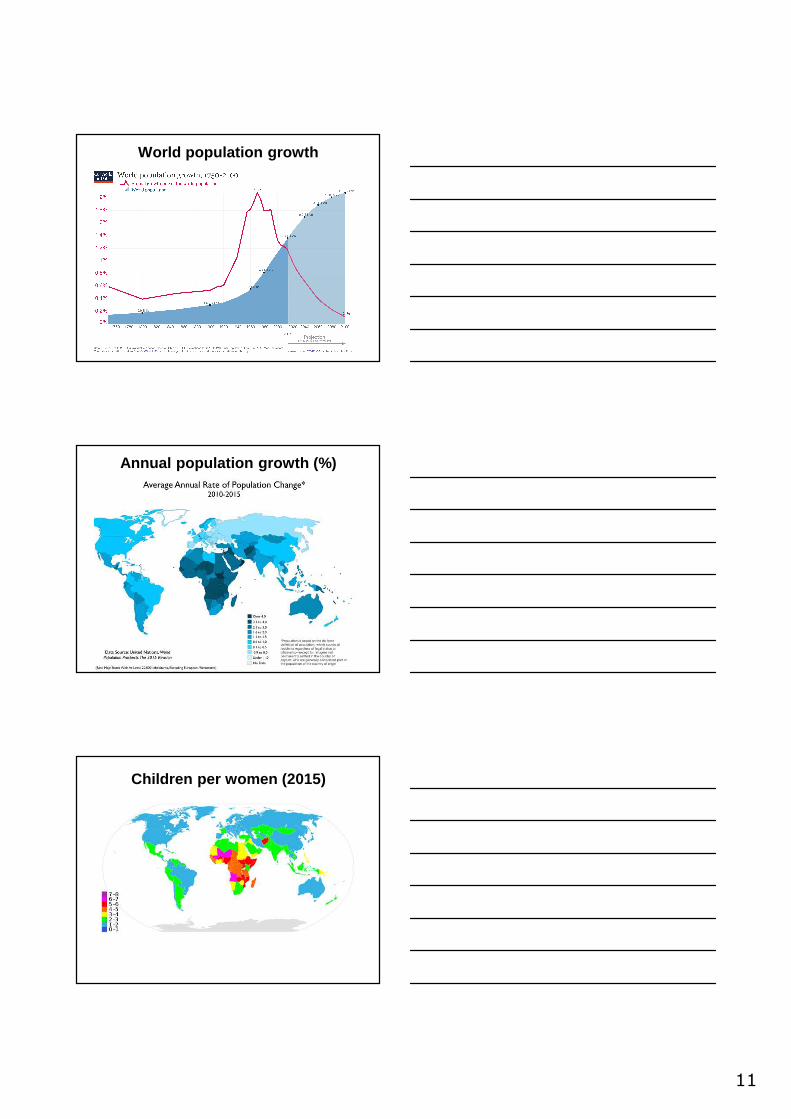
World population growth
Annual population growth (%)
Children per women (2015)

12
35
Income

13
GDP growth per capita (1990 to 2007)
Real GDP growth rate (2017)
GDP growth forecast (%, 2019)European Commission

14
40
What is a normal good?
Any good for which there is a direct relationship between changes in income and its demand curve
quantityO
Y1
D
Q t
inco
me
Engel curve for normal goods
Q t+1
Y t+1
41
42
What is aninferior good?
Any good for which there is an inverse relationship between changes in income and its demand curve

15
quantityO
Y1
D
Q t
inco
me
Engel curve for inferior goods
Y t+1
Q t+1
43
44
Tastes and preferences
45
Expectations of consumers(future price and income
changes)

16
FAO food price index
FAO Food Commodity Price Indeces
48
Prices of related goods

17
49
What aresubstitute goods?
Goods that compete with one another for consumer purchases
vs.
50
What happens when the price increases for a
good that has a substitute?
The demand curve for the substitute good increases
51
What happens when the price decreases for a
good that has a substitute?
The demand curve for the substitute good decreases
18
52
What does a direct relationship between
price and quantity mean?
The two move in the same direction
53
What are complementary goods?
Goods that are jointly consumed with another good
and
54
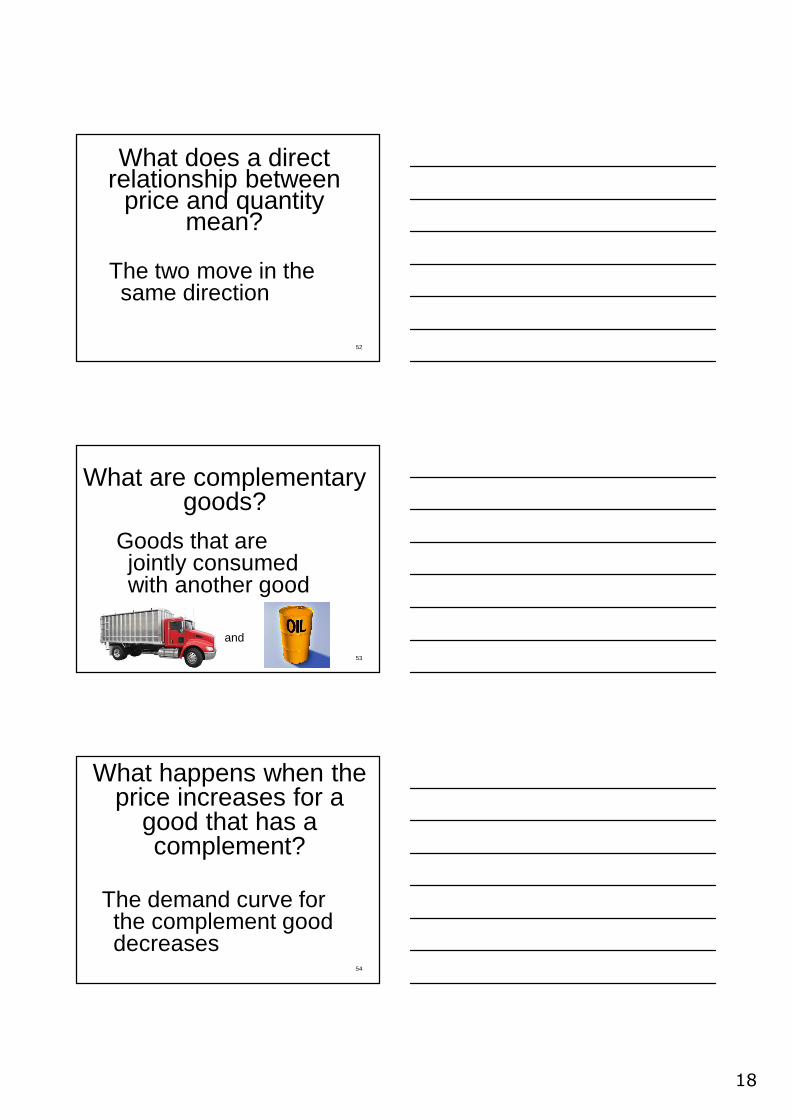
What happens when the price increases for a
good that has a complement?
The demand curve for the complement good decreases

19
55
What happens when the price decreases for a
good that has a complement?
The demand curve for the complement good increases
56
The Law of Supply
57
What is thelaw of supply?
The principle that there is a direct relationship between the price of a good and the quantity sellers are willing to offer for sale in a defined time period, ceteris paribus
20
58
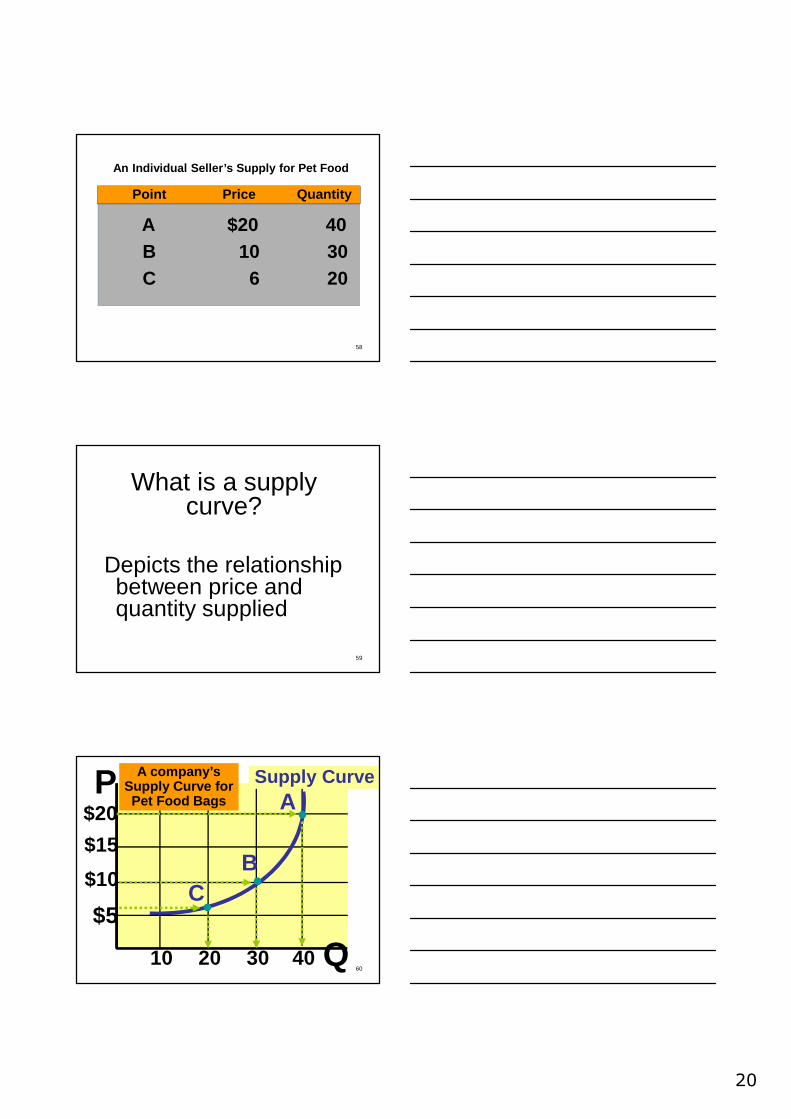
A $20 40B 10 30C 6 20
Point Price Quantity
An Individual Seller’s Supply for Pet Food
59
What is a supplycurve?
Depicts the relationship between price and quantity supplied
60
$20
$15
$10
$5
10 20 30 40
A
BC
Supply CurveA company’s Supply Curve for Pet Food Bags
P
Q

21
61
Why do supply curves have a positive slope?
Only at a higher price will it be profitable for sellers to incur the higher opportunity cost associated with supplying a larger quantity
62
What is asupply schedule?
Shows the specific quantity of a good or service that sellers are willing to produce and offer for sale at different prices
63
$25$20
$15$10
10
P
Q15 20
Super Canine Supply Curve
S1
25

22
64
$25$20
$15$10
20
P
Q25 30
Healthy Canine Supply Curve
S2
35
65
$25 25 + 35 = 60$20 20 30 50$15 15 25 40$10 10 20 30$5 5 15 20
Price Super Canine Healthy Canine Total
Market Supply Schedule for Pet Food
66
$25$20
$15$10
40
P
Q45 55
Market Supply Curve
60
S total

23
67
What is market supply?
The horizontal summation of all the quantities supplied at various prices that might prevail in the market
68
5
0 3525
10152025
5
0 40 60
10152025
5
Price percompact
disc(dollars)
0 15 25
10152025
Quantity of compact discs(thousands per year)
Quantity of compact discs(thousands per year)
Quantity of compact discs(thousands per year)
Super Sound supply curve + High Vibes supply curve = Market su pply curve
PriceperCD
SuperSound
HighVibes =+
Totalsupply
The Market Supply Schedule for CDs
Quantity supplied per year
$25 25 35 60
20 20 30 50
15 15 25 40
10 10 20 30
5 5 15 20
S1 S2 S total
3The Market Supply Curve for Bags
Quantity of pet food bags(thousands per year)
Super Canine supply curve
Healthy Canine supply curve
Price per bag (dollars)
Quantity of pet food bags(thousands per year)
Quantity of pet food bags(thousands per year)
The Market suplpy Schedule for Bags
Price Perbag
SuperCanine
HealthyCanine
69
THE DIFFERENCE BETWEEN A
CHANGE IN THE QUANTITY SUPLLIED
AND A CHANGE IN SUPPLY

24
70
When price changes, what happens?
The curve does not shift - there is a change in the quantity supplied
A change in quantity supplied is a movement along a stationary supply curve caused by a change in price
71
$20
$15
$10
$5
10 20 30 40
A
BC
Supply CurveA change in price causes a change
in the quantity supplied
P
Q
72
Increase in Price
Increase in Quantity Supplied

25
73
When something changes other than price, what happens?
The whole curve shifts, there is a change in supply
When any of the nonprice determinants of supply changes, the supply curve responds by shifting
An increase in supply (rightward shift) or a decrease in supply (leftward shift) is caused by a change in one of the nonprice determinants
74
$20
$15
$10
$5
10 20 30 40
S1S2
When the ceteris paribus assumption is relaxed, the
whole curve can shiftP
Q
75
Change innonprice
determinant
Increase in supply

26
76
Priceperunit
Quantity of good or service per unit of time
Effect
Upward movement along the supply curve
Downward movement along the supply curve
Leftward or rightward shift in the supply curve
Terminology
I ncreasein the quantity supplied
IDec reasein the quantity supplied
Decreaseor increase in supply
Change
Price increases
Price decreases
Nonprice determinant
Change innonpricedeterminant
Change innonpricedeterminant
S1 S S2
3 Terminology for Changes in Price and Nonprice Determinants of Supply
77
NONPRICE DETERMINANTS OF
SUPPLYSupply shifters
78
What can cause a shift in a supply curve?
1. Number of sellers in the market2. Technology3. Resource prices4. Taxes and subsidies5. Expectations of producers
(future prices)6. Prices of other goods the firm
could produce

27
79
Number of sellers inthe market
Pet Market, 2015
Number of Pet Stores in the US
81
Technology

28
82
Resource prices
83
84

29
Agricultural price scissor in Hungary
% (árszínvonal) 100 Mezőgazdasági termeléshez szükséges ipari termékekárszínvonala
80
50 Agrártermékek árszínvonala
30
0 1990 1993 1995 1998 2001 2003
85
Change in price level
Price level of industrial inputsin agriculture
Price level of agricultural products
86
Taxes and subsidies
87

30
88
Expectations of producers (future prices)
89
Prices of other goods the firm could produce
vs.
90
A MARKET SUPPLY AND DEMAND
ANALYSIS
31
91
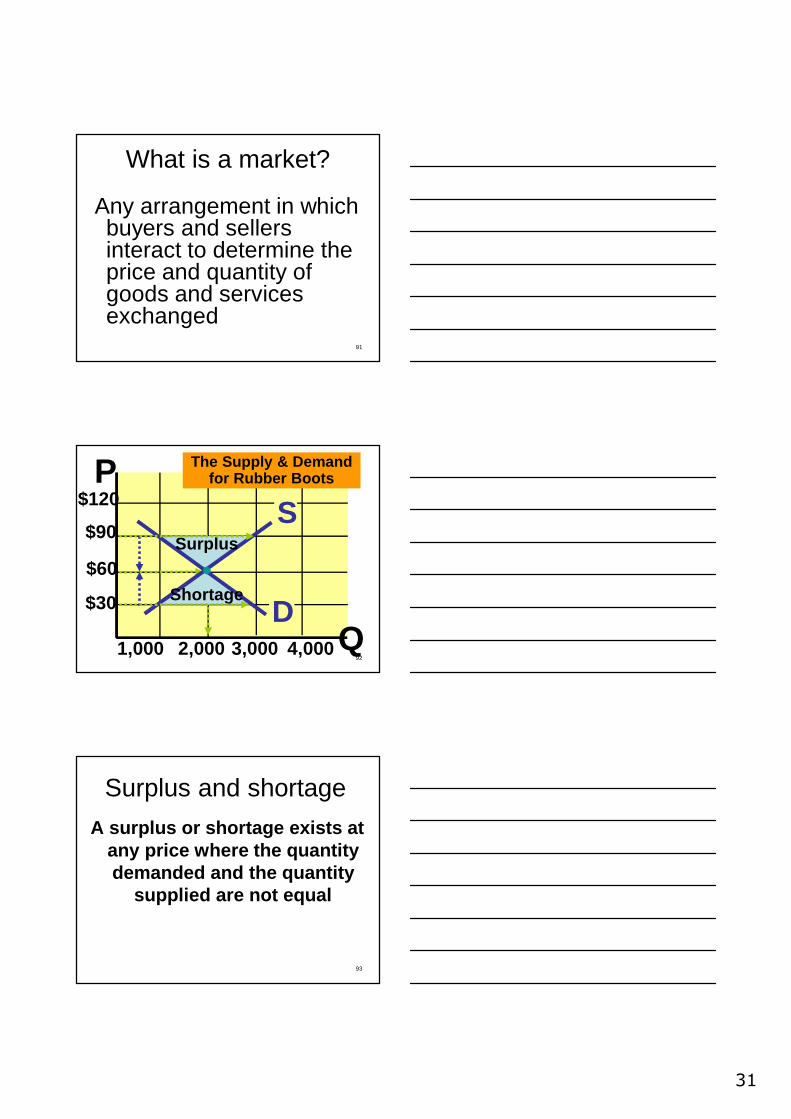
What is a market?
Any arrangement in which buyers and sellers interact to determine the price and quantity of goods and services exchanged
92
$120
$90
$60
$30
1,000 2,000 3,000 4,000
D
S
The Supply & Demand for Rubber BootsP
Q
Surplus
Shortage
93
Surplus and shortage
A surplus or shortage exists at any price where the quantity demanded and the quantity
supplied are not equal

32
94
What is a surplus?A market condition existing at any
price where the quantity supplied is greater than the quantity demanded
When the price of a good is greater than the equilibrium price, there is an excess quantity supplied called a surplus
95
What is a shortage?A market condition existing at any
price where the quantity supplied is less than the quantity demanded
When the price is less than the equilibrium price, there is an excess quantity demanded called a shortage
96
What is an equilibrium?A market condition that occurs at
any price for which the quantity demanded and the quantity supplied are equal
Equilibrium is the unique price and quantity established at the intersection of the supply and the demand curves

33
97
What is the price system?
A mechanism that uses the forces of supply and demand to create an equilibrium through rising and falling prices
98
604030 5010
Priceper pair(dollars)
Quantity of tennis shoes(thousands of pairs per year)
0
15
20 70 80 90 100
30
45
60
75
90
105
CAUSATION CHAINS
Quantitysuppliedexceeds quantitydemanded
Surplus
Pricedecreases toequilibriumprice
Quantitydemandedexceeds quantitysupplied
Shortage
Priceincreases toequilibriumprice
S
D
EEquilibrium
Shortage of60,000 pairs
Surplus of40,000 pairs
3The Supply and Demand for Rubber Boots
Quantity of gum boots(thousands of pairs per year)
GOOD/BAD paradoxon
S0
B
A
C
S1
Q0
P0
Q1
P1
P
Q0
D
Revenue for P 0 and Q0is rectangle B
If the supply shifts to S 1 the price will fall to P 1 and the
quantity demanded will grow to Q1. The relevant increase
in revenue is smaller (C) than the lost revenue (A).
99
………………………………………………………………
…………………..
………………………………………………………………
…………………..

34
100
Chicken market actions
Q
p
D
D’
S
Cheaper subs. good (turkey)
p
D
D’
S
Q
Fear from „mad cow” disease

35
Q
p
D
More expensive broiler meat
p
Cheaper input (forage)
D
S
S’
Q
Q
p
D
S’
S
New tax levied on producers

36
p
Increase in consumer income
D
D’
Q
S
p
S’
S
D
More broiler meat distributors
Q
p
D’ D
S
Movement of vegetarianism
Q

37
Q
p
D
S’
S
Increase in workers’ wage
110
END