the laboratory of mining design and planning - ttu.ee · pdf filethe purpose of the laboratory...
TRANSCRIPT

1
The laboratory of mining design and planning The purpose of the laboratory of mining design and planning is to apply mining software systems, test and develop them in scientific and teaching process. The laboratory consists of software, databases, methods, hardware with necessary equipment (scanners, printers, plotters, savers, presenters, computer servers), see the website http://mi.ttu.ee/mgislabor The most used mining modelling software in the world have been set up in the laboratory: 1. Gemcom Minex – modelling stratified deposits 2. Gemcom Surpac – modelling mining processing and work procedures 3. Visual ModFlow; AquaChem- groundwater flow and quality modelling 4. MapInfo Professional, Discovery, MapBasic - GIS 5. Vertical Mapper- spatial modelling 6. Encom Discover- spatial modelling for mining environment 7. AutoCAD Civil 3D- planning 8. FLAC – modelling of rock mechanics, dynamics and properties 9. PLAXIS – geotechnical spatial modelling 10. Mining specific software – parameters of pillars, productivity, mining equipment co-
operation and fleet calculations, (Caterpillar and Mining Department of TUT) 11. Ashtech GPS data management and analysing 12. GeoLab The laboratory of Mining Conditions The purpose of the laboratory of mining conditions is to conduct experiments in applied and engineering geology, mining enviroment and rock mechanics. Web page: http://mi.ttu.ee/maelabor. The laboratory is equipped with modern equipment as following 1. Press for determining compressive strength 2. Los Angeles Test for aggregate quality 3. Full set of sieves 4. Geotechnical shear strength measurer for soil and loos material
Preparation equipment 1. Rock saw 2. Drilling machine 3. Sander 4. Oven Field laboratory 1. Point load test

2
2. Schmidt hammer 3. Noise meter 4. Vibration meter 5. Dust meter 6. Stratoscope for mine roof analyses 7. Air speed meter
Hydrogeology ang mining water laboratory http://mi.ttu.ee/hydrolabor/
1. Chemical field laboratory
2. Water probe pump Grundfos MP1
3. Water level measurement devices
4. Water flow measurement propeller
Mining geodesy laboratory http://mi.ttu.ee/markseiderilabor/ 1. Tachymeter Trimbel M3Total Station
2. Distanc meters
3. Portable computers and palm computers
4. GPS and other land-surveying systems
Applied geology laboratory http://mi.ttu.ee/geoloogialabor/ 1. Polarisation Microscope
2. Radioactive radiation meter PAKRI-E
Video laboratory http://mi.ttu.ee/videolabor/ 1. Particulate online analyse system WipFrag
2. Online activity sampling

3
A press for determining compressive strength Cylinder or cubic samples are used for determining compressive strength and modulus of elasticity. Results are used for analysing inclination, stability and other strength properties of rock and pillars for developing rock breaking technology.
Figure 1 Press for uniaxial compressive strength tests
Figure 2 Brazilian method

4
Los Angeles Test for aggregate quality
For measuring aggregate (limestone, gravel, granite) strength with Los Angeles method.
Figure 3 Los Angeles testing machine
Shear strength measurer
Figure 4 Shear strength measurements Shear tests are used for analysing soil and earth stability and other properties
Full set of sieves
Sieve analyses are performed with set of sieves and shaker or with WipFrag sieving software.

5
Figure 5 Full set of sieves
Figure 6 Particulate analyse system WipFrag
Polarisation Microscope
6
Figure 7 Polarisation microscope Polarisation microscope is used for examining rocks and minerals.
Rock saw
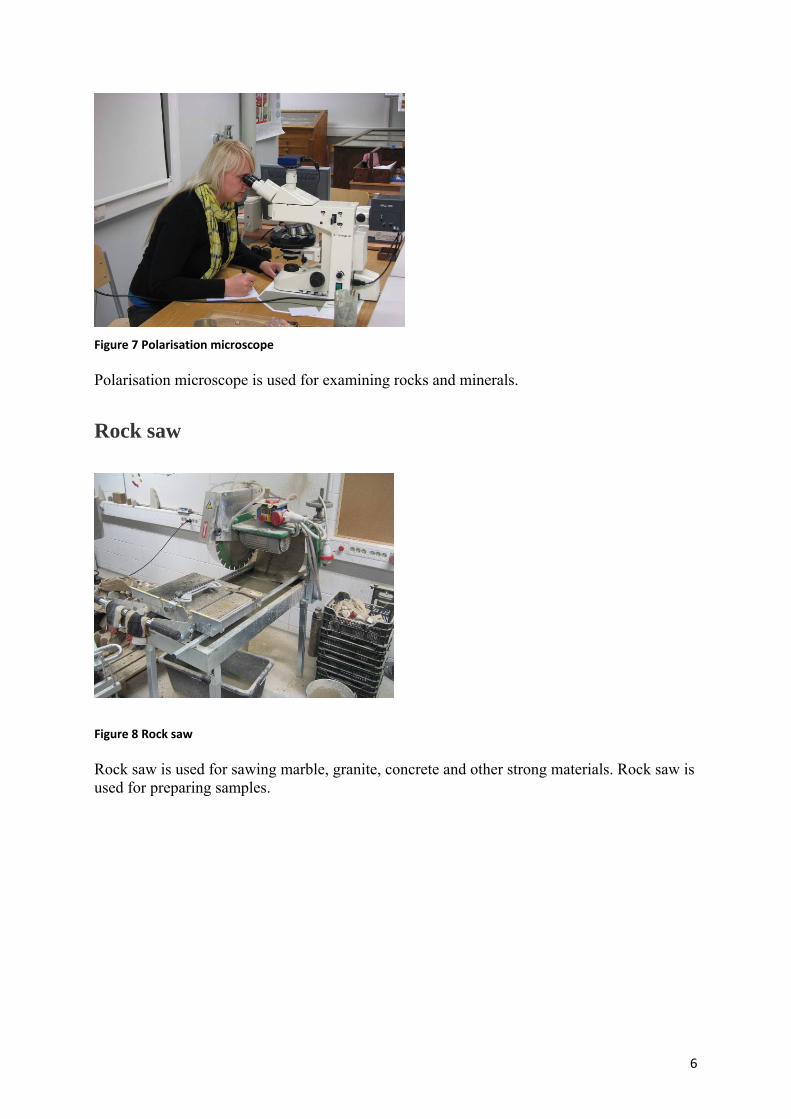
Figure 8 Rock saw Rock saw is used for sawing marble, granite, concrete and other strong materials. Rock saw is used for preparing samples.

7
Drilling machine
Figure 9 Drilling machine Drilling machine is used for boring core out of concrete, rock and building materials in laboratory.
Sander
Figure 10 Sander Sander is used for preparing samples.

8
Oven
Figure 11 Oven Oven is used for drying samples.
Point load test
Figure 12 Point load test Point load test is used for measuring rock modulus of elasticity, compressive‐ and tensile strength, cut‐ability on fieldwork. Testing samples do not need preparing.
Schmidt hammer

9
Figure 13 Schmidt hammer Schmidt hammer determinates compressive strength and breakability.
Dust meter
Figure 14 Dust meter Measuring dust content in air.

10
Stratoscope
Figure 15 Stratoscope Stratoscope is used for observing fractures, fissures and structure in layered deposits.
GPS systems
Figure 16 GPS GPS units are used for locating measuring locations

11
Water probe pump MP1
Figure 17 Water pumping Water pump is used for test pumping and determining filtration module.
Air speed measurer
Figure 18 Air speed measurer
Noise meter Noise meter is used for measuring noise of mining machinery.

12
Figure 19 Noise meter
Radioactive radiation meter PAKRI-E
Radioactive radiation meter Pakri-E is used for measuring γ-, α- and β- radiation rate.
Figure 20 Radioactive radiation meter Pakri‐E
Water level measurement device Water level is measured with mechanical and electronic meters.

13
Figure 21 Water level measuring device
Water flow measurement propeller Water flow is determined with propeller.
Figure 22 Water flow measurement propeller
Vibration meter
Vibration meter is used for measuring vibration of mining machinery and blasting.

14
Figure 23 Vibration meter
Distance measurements
Distances are measured with lasers, meters, and wheels.
Figure 24 Distance measurements
Fieldwork computer
Portable computers with GPS units are used for data capturing, 3D modelling and mapping field data

15
Figure 25 Portable computer
Tachymeter Trimble M3Total Station Survey is performed with help of tachymeter, lasers and GPS
Figure 26 Tachymeter Trimble M3 Total Station
Field laboratory Hach Drel 2800

16
Minewater quality is measured with field laboratory
Figure 27 Measuring chemical composition of water
Laboratory of mining design and planning Minex software is used for modelling and design of stratified deposits. Geological modelling and design for lignite, phosphorite, zinc, bouxite, iron ore and platinum deposits. Is mainly used for Estonian oil shale deposit planning. With Minex software it is possible to perform: Geological modelling taking into account breaks and water regime. To optimize mining with longwall, reconstruct ramps, overburden coefficient, economical ratio, to calculate volumes. Shortwall mining with blasting scheme, ramps, roads, heap, redirect pollution.
Figure 28 Statistics and histogram about seam D; Clockwise and anticlockwise ramp in mining with bench
Figure 29 Cross-section of layers with drillholes, geophysics and grid net
Minex homepage http://www.surpac.com/

17
Software Surpac Vision With Surpac Vision software it is possible to design and optimize: surfaces mines, underground mines, tunnels, design drillholes and blasting, model blocks, to make geodetic data request etc.
Figure 30 Granite underground mine project
Figure 31 Analysis of mining conditions Surpac Vision homepage and instructions http://www.surpac.com/

18
Software Visual ModFlow Professional Software is for constructing three-dimensional groundwater flow and contaminant transport modeling. With the ability to simulate groundwater and surface water interactions, and the added capability of calculating changes to groundwater chemistry, groundwater professionals now have a complete set of tools necessary for addressing water quality, groundwater supply, and source water protection initiatives. Modeling results help to make decisions about mining technology and mining operations. Visual MODFLOW has the tools necessary to:
• Graphically assign model grids, properties and boundaries • Visualize model input parameters (2D or 3D views) • Run the flow, pathline, and transport simulations • Automatically (WinPEST) or manually calibrate the model • Display and interpret the modeling results in full 3D • Produce professional reports
Model input parameters and results allow to visualize in two-dimensional cross-sections and schema and three-dimensional to visualize results. Using dynamic model it is possible to create new conditions adding new data and valuate water level, groundwater flow directions, volumes of pumping water in underground mines and surface mines using time. Cross-sections based on generated model Creating cross-sections it is possible to visualize in passant water level location in geological layers.
Figure 32 Cross-section and its location
Balance of the incoming and outgoing water Model gives the results of incoming and outgoing water volumes at certain moment of time in certain water level. Results can be viewed in graphs and as data tables (Figure 2).
Figure 33 Incoming and outgoing water volumes

19
Water flow directions Simulisation results reveal directions of the water which is shown in Figure 3.
Figure 34 Water flow direction at the moment of 50 days. Homepage http://www.modflow.com/

20
Software AquaChem AquaChem is software for water analysis. AquaChem enables to analyse water chemical contents and physical parameters, wide analysis, calculate, model, create graphics.
Figure 35 Map of water chemical contents
Figure 36 Water analysis illustration
AquaChem homepage http://www.waterloohydrogeologic.com/software/aquachem/aquachem_ov.htm
AquaChem users instructions siit

21
Software MapInfo Professional
MapIfo Professional is software based on GIS. It allows to manage GIS data, model and manipulate. MapInfo Professional allows to: Look map data and geographic coordinates analysis Carry out data to map create maps and plot create and refresh map database Functionality: Data visualisation: 3 different views: tables, map, graphs. Monitoring data in scale, create new map objects, to associate the map objects with the data in tables, thematic maps, 3D thematic maps, cartographic legend, to combine objects. Spatial analysis: do SQL-queries and saving, spatial queries and buffers.
Figure 37 Plan created with coordinates
Figure 38 Buffering mining influences MapInfo Vertical Mapper software which increases MapInfo analysing capabilities including more difficult functions based on statistic and raster-grid models. It allows to analyse and visualize height models, to create thematic maps revealing trends, to interpolate.

22
Figure 39 Pollution model. This model is illustrative and does not own real values.

23
AutoCAD
AutoCAD is software based on vector graphic. It is used in creating technological schemes, cross-sections and plans. With AutoCAD it is possible to create 2D and 3D spatial mechanical drawings. Suitable for creating drift, cross-sections schemes, supports in geological crush zones, anchor support schemes, ventilation schemes etc.
Figure 40 Bench properties
Figure 41 Mining with backfilling
Figure 42 Opencast mining
Figure 43 Breaking with hydraulic hammer

24
Figure 44 High selective surface oil shale mining technology modelled with AutoCad
AutoCAD homepage http://www.autodesk.com/

25
Plaxis
Plaxis is geotechnical modelling software. It allows to analyse deformations, stability, ground water flow, create quickly elements, nonlinear and time devolving models taking into account pore pressure in unisotrophic soils.
Figure 45 Situation before and after deformation
Figure 46 Pore pressure
Plaxis homepage http://www.plaxis.com/

26
WipFrag
Granulometry Analysis Software. It supplements screen analysis, helps to evaluate loose which cannot be screened.
Figure 47 Work in 3 phase
Figure 48 Explanation of the graph
WipFrag homepage http://www.wipware.com/wipfrag.php

27
FLAC Flac is used for calculating stability, deformations, pressure, crush and to visualize in plastic, elastic and rheologic environment. In addition it can be used for crack calculations using thermal and water flow data. The output is 2D and 3D models.
Figure 49 Joint system for the models
Figure 50 Cavern model in Maardu granite deposit

28
Caterpillar and Mining Department of TUT Mining specific software – parameters of pillars, productivity, mining equipment co-operation and fleet calculations,
Figure 51 Transport cost analises and fleet selection in Caterpillar FPA

29
Software laboratory is continuously testing and analisyng available software, applying it to local problems and updating licences Some of softwares being tested are:
1. Itasca Software
2. SoilVision Office 2009
3. ArcGIS 9.2
4. Plaxis 3D Foundation
5. Carlson Software 2009 For AutoCAD with built in ICAD
6. TranSim VS