the kinetics of acetylcholinesterase inhibition and the ... · allows, depending on demand, for...
TRANSCRIPT

The Kinetics of Acetylcholinesterase Inhibition and the Influence ofFluoride and Fluoride Complexes on the Permeability of
Erythrocyte Membranes
Dissertation to receive Ph.D. in Chemistry from the University of Hamburg
By Johannes Westendorf
Hamburg, Germany – 1975
Reviewer:Prof. Dr. A. Knappwost
Co-Reviewers:Prof. Dr. Malorny
Prof. Dr. Strehlow
Prof. Dr. Hilz
Prof. Dr. Gercken
1
The oral defense took place on 2/18/1975
Translation from German by:
Jakob von Moltke
Dartmouth College
December 2000*
*With proof corrections by MJ Coplan

2
Contents
I. Introduction …………………………………………………………………………….. 3
II. Presentation of the Problem……………………………………………………………… 8
III. Procedure and Results………………………………………………………………….... 9
A. Inhibition of Acetylcholinesterases………………………………………………… 9
1. General Information………………………………………………………… 9
2. Theoretical Treatment of the Enzymatic Kinetics………….……………….10
3. Procedure……………………………………………………………………16
a. Description of the Tracer Method……………………..…………….16
b. Equipment….. ……………...…….…………………………………18
4. Carrying out the Measurements……………………………………………..19
a. Acetylcholinesterase Inhibition by NaF……………………………..20
b. pH Dependence of the Inhibition………………...………………….26
c. Dissociation Behavior of Several Fluoride Complexes ……………. 30
d. Inhibition of Acetylcholinesterase by Complexed Fluorides ..…….. 37
B. Effect of Fluoride on the Permeability of Erythrocyte Membranes for Na+, K+,
Ca2+, F-, HPO42-, and Glucose…………………………………………………. 49
1. Description of the Isotopes Used……………………………………………
49
2. Presentation of the Permeability Experiments……………………………… 52
a. Potassium Permeability………………………………………..……..53
b. Calcium Permeability ………………………………………………..54
c. Sodium Permeability ……………………………………………….56
d. Fluoride Permeability ……………………………………………….59
e. Phosphate Uptake ..…………………………………………………..
60
IV. Conclusion………………………………..……………………………………………….. 64
V. Bibliography………………………………..…………………………………………..….. 65

3
I. Introduction
The element fluorine was discovered in ivory at the beginning of the 19th century by
Morodini, a student of Gay-Lussac's, and first purified in 1886 by Henri Moissan. Fluorine is, as
has only been known for a few years, a so called essential element, without which at least
vertebrates can not live. Knappwost(1) demonstrated this in humans after F analysis of urine
through the use of the well known curve for the dependence of the frequency of caries
formation on fluoride content of the drinking water. McClendon(2) proved that rats with F-free
nutrition do not thrive well. Hayek et al (3) found that under physiological conditions traces of
F are necessary to precipitate hydroxyapatite (Abbr. HA).
Research of the effects of small physiological F-doses was significantly spurred by the
observation that a regular uptake of about 1mg F per day served as an effective protection
against tooth-decay. (4) This protection is strongest when F administration is begun before the
teeth decay. This effect is due to an improvement of the mineralization density of the tooth
enamel. An evenly and densely mineralized enamel offers a visibly higher protection against the
corrosive influences of cariogenic microorganisms. The deciding factor is therefore not
formation of F-HA but rather the mineralization density. In vivo the concentration of F-HA only
reaches a level of a few ppm, at which, according to measurement by Knappwost and Raju (5),
only a few meaningless reductions in solubility are achieved.
However, a reduction in decay can even be achieved in teeth that have already begun to
decay, as long as a daily intake of at least 1 mg of fluoride is maintained. According to
Knappwost, the reduction in decay relies for the most part not on the presence of fluoride in the
saliva, but rather on an influence on the saliva quality and quantity. According to McClure(7),
the F-content of saliva, independent of the intake level, should never exceed 0.1 mg/l.
More recent experiments by K.Yao and P. Groen (8), which were carried out with the
help of an F-specific electrode, confirm these results. The F-content of the saliva secreted by the
parotid gland, which for test subjects drinking water with < 0.1ppm of F was 0.007ppm, rose to
0.009ppm upon transition to concentrations of 1ppm of F in the water.
Knappwost developed a model as part of his "resistance theory" (9) that describes a
correlation between cariogenic effects and the viscosity of the saliva. The pH-value of the saliva
also takes on an important role in this model. The physiologically efficient saliva can thereby be
viewed as a supersaturated solution of HA that has the task of stabilizing initial corrosive
defects on the enamel surface through remineralization.

4
The rate of the remineralization is, at a given supersaturation of HA ions, limited by the
level of diffusion across a boundary layer attached to the surface of the tooth. The relationship
between the remineralization rate vR and the viscosity η of the saliva can be expressed through
the following equation:
vR =1n+1
Where n>0 and depends on specific conditions like, for example, the flow velocity of the saliva.
The pH-level has an effect on the solubility of the HA, and therefore also on the level of
supersaturation. A correlation must therefore exist between oral uptake of fluoride and the
viscosity of the saliva. Experimental findings support this conclusion (10,11). Of all the factors
that might explain a possible effect of fluoride on the caries, disregarding the effect on the
mineralization density, Knappwost's theory is least questionable.
As has already been stated, the amount of fluoride that is incorporated into the tooth
enamel under physiological conditions is too small to cause a significant reduction in the
solubility of the HA. An antifermentative effect of F- on the glycolysis of bacteria in the mouth
only appears at F- concentrations above 0.5 ppm (12). The concentration of 0.0033 ppm (8) of F
that is reached when the F concentration in drinking water is 1 mg F/l, a level that was
recognized as sufficient for tooth decay prophylaxis, however lies well below the concentration
necessary to achieve this effect.
Knappwost's theory assumes an effect of fluoride on the salivary glands in the form of
an elevated secretion rate, a decrease in the viscosity, and an increase in the pH. These
symptoms can always be observed with large intakes of fluoride, both orally as well as
parenterally (11,13). Upon transition to physiological concentrations the effect is difficult to
observe because of a number of other variables that influence saliva secretion. In addition, it is
difficult to turn off inductive effects that arise in conjunction with this outcome. For this reason,
one must attempt to find an influence of the fluoride on the fundamental biochemical and
biophysical processes involved in saliva secretion.
The salivary glands are innervated by the autonomic nervous system (sympathetic and
parasympathetic), with the parasympathetic being of greater importance. The stimulation occurs
as a nervous reflex, the control center of which lies in the nucleus salivatorius of the medulla
oblangata. The composition of the saliva depends on the type of stimulus, which creates a
unique stimulatory pattern through the smell and taste receptors. This stimulatory mechanism

5
allows, depending on demand, for either a more serous secretion (stimulation of the parotis) or a
more viscous mucin rich secretion (stimulation of the sublingual glands) to be created.
For the resistance of the tooth's surface, however, the so called "resting-saliva" is of
great importance. Like all autonomic organs, the salivary glands have a basal level of activity,
which in this case serves to moisten the mouth and throat regions. This moisture is important for
maintenance of muculmembranes and the surfaces of teeth (by way of remineralization). A
general increase in the tone of the parasympathetic system has an effect on the composition of
the resting saliva in accordance with Knappwost's resistance theory, that is to say towards an
increased release of a watery and possibly also more alkaline saliva.
According to recent experiments, the mechanism of saliva secretion is the following
(14): After stimulation by the neurotransmitter acetylcholine (ACh), active transport of Cl- from
the interstice into the cell occurs as a result of hyperpolarization. Passive transport of Na+
follows the Cl- and is in turn followed by water, which results in an increase in osmotic pressure
within the gland-cell. As a result of the rising pressure, cellular fluid penetrates the membrane
bordering the lumen. Na+ is actively reabsorbed at the lumen wall and is followed by Cl- by way
of passive transport. Water penetrates the lumen wall slowly, which is the reason for the
hypotonia of the saliva. As a result of the delay in Cl- migration with respect to that of Na+, the
lumen wall becomes negatively charged on the inside, which causes a flow of K+ from the
inside of the cell into the lumen. The abnormally high potassium excess in the saliva results
from this influx. (The K+/Na+ ratio of the saliva is 1.3, compared to 0.05 in the serum.)
Figure 1 - Schematic Representation of Saliva Secretion

6
A possible effect of fluoride on the secretion of saliva could lie either in an influence on the
cholinergic system, or in a direct influence, perhaps on the membrane permeability for cations
and anions.
1. Fluoride and the Cholinergic System
Stimulus conduction takes place by way of the "complete ACh system" at the synapses of
the motor endplate as well as those of the target organs of the parasympathetic system. The ACh
is synthesized from "activated" acetic acid (in acetyl-CoA, the acetate is bound to the coenzyme
by a high energy thioester bond) and choline and is collected in small storage bubbles (vesicles),
from which it is released upon stimulation. The excitation is passed on by way of depolarizing
the bordering cell, which is the result of a change in Na+ permeability caused by the ACh. The
released ACh is quickly inactivated (saponified) by the enzyme acetylcholinesterase (AChE).
Inactivation is necessary for the reestablishment of excitability.
Drugs that inhibit AChE (Physostigmine, Neostigmine, Diisopropylfluorophosphate, E-605,
among others) cause the ACh, which is constantly released in small amounts, to collect in the
tissues. The build up of ACh leads to the appearance of parasympathetic stimulation (activation
of the intestinal tract, increased levels of glandular secretion, decreased blood pressure and heart
rate). In the progressed state a constant depolarization of the cholinergic membrane, and thereby
an un-excitability, is established. The effected organism dies as a consequence of this
depolarization.

7
These symptoms, which are typical of drugs influencing the parasympathetic nervous
system, are also observed when toxic amounts of fluoride are administered. MIYAZAKI (15)
found overabundant salivation when toxic amounts of NaF were given to rats. In 1872
RABOUTEAU (16) determined that ingesting 0.25g of NaF resulted in an increase in his
salivation. The increase began after 4.5 hours and lasted 1.5 hours. He could make the same
observation with dogs and rabbits. WEDDEL (17) induced diarrhea as well as increased
salivation in a dog by administering 0.5g of NaF. The salivation could not be inhibited by
atropine. This last finding suggests that in this case the fluoride must be influencing the salivary
glands directly. Otherwise, atropine would have inhibited the salivation by displacing the ACh,
collecting due to AChE, from its receptors. An anti-cholinesterase effect of fluoride at lower
concentrations than those applied here is thereby however not out of the question.
Inhibition of AChE by fluoride has been described often. E. HEILBRONN (18) and
R.M. KRUPKA (19) completed detailed studies. The authors describe the inhibition of AChE
by NaF, as well as the pH dependence of the inhibition. This dependence is, however, not traced
back to the un-dissociated HF molecule, in contrast to which we will, over the course of this
report, show that the inhibition of AChE by fluoride occurs in proportion to the concentration of
HF.
It follows from Heilbronn and Krupka's experiments that an inhibition of AChE by
fluoride only arises at concentrations that are acutely toxic and even lethal in vivo. If one shifts
to physiological concentrations (0.1-1 ppm) the inhibitions become so small that they lie below
the threshold for accurate measurement.
The inhibition of AChE by fluoride can be drawn into the discussion of a vagotonic
fluoride influence if effects are found that, in vivo, can lead to an increase of fluoride's normal
inhibitory influence. The inhibitory effect of fluoride was assigned to F- in all previous
investigations of the inhibition of AChE by fluoride. In our opinion, the inhibition does not
necessarily appear only in this form in the organism. For example, if one dissolves magnesium
hexafluorosilicate (MgSiF6) or cryolite (Na3AlF6) in a buffer at pH of 7.4, which corresponds to
that of human blood, only partial hydrolysis occurs, as we will show over the course of this
work. The residual complexes, at least in the case of (SiF6)2-, inhibit AChE more strongly than
fluoride. Therefore, if one postulates the existence of such complexes in the organism, the range
in which inhibition still appears shifts towards physiological F concentrations.
Due to the constant contact of natural waters with silicates as well as Fe and Al
compounds, one must expect that these compounds and silicates will form complexes with the
fluoride contained in the water. These complexes can then, by way of drinking water, enter the

8
body, where they persist and carry out their influences. New, and as of yet unreleased,
experiments by Knappwost and Rastaedter, suggest that fluoride is present in several mineral
springs as a Si complex. Taking such compounds into account one can easily imagine that
fluoride causes an AChE inhibition in vivo, which makes itself noticeable as a slight vagotonia.
2. Effect of Fluoride on Membrane Permeability
As Weddel describes (17), a strong saliva flow developed at high fluoride
concentrations. Since this flow could not be inhibited by atropine we assume a direct effect of
fluoride on the salivary glands in this case. In studying the influence of toxic F doses on the
nervous system and muscles, TAPPEINER (13) found that depression of the central nervous
system and stimulation of the motor endplate appeared initially. Uncontrolled fibrillary
twitches, which were removed by Curare, arose as well. It is true that these observations suggest
a cholinergic effect of F, since Curare blocks ACh from binding the receptor of the effected
membrane. This does not, however, necessarily contradict Weddel's observations of the salivary
glands, since the stimulatory processes of gland cells differ from those of the skeletal
musculature. (Stimulation at the motor endplate is preceded by a depolarization; at the gland
cells a hyperpolarization precedes stimulation).
After long term exposure, high doses of F eventually led to a blockage of all stimulus
conduction, which suggests a constant depolarization of nerve and muscle cells.It has long been
known that fluoride can affect (Na+-K+) distribution at cell membranes. (20) This influence was
first observed in red blood cells, which have a high intra-cellular K+ concentration together with
a low Na+ concentration. In serum, on the other hand, the relationship is reversed.
The unequal distribution of these ions, which is found in all bodily cells, can only be
maintained with constant energy use. This energy use can be clarified by the "Gibbs-Helmholtz"
equation.
∆G = ∆H − T • ∆S
Since the membrane is permeable to the cations, the T•∆ S term is positive when the distribution
is uneven. In the case of a quasi stationary equilibrium the change in free energy (∆ G) must
equal 0. This means that T•∆ S must be counteracted by an equal, but opposite, ∆ H, in this case
the enthalpy change (∆ H = -7 Cal./Mol.) that results from the splitting of ATP in the
membrane.
9
Fluoride can affect the (Na+-K+) distribution at cell membranes and, thereby for nerve
cells, also the resting potential, in three ways:
a) By inhibiting the enzymatic degradation of glucose, and therefore also ATP
synthesis.
b) By suppressing the splitting of ATP at the membrane, which normally provides
the energy for the active transport of cations, by inhibiting the membrane bound
(Na+- K+) activated ATPase.
c) By fluoride directly affecting the permeability of the membrane for the
aforementioned ions. This effect perhaps involves a reciprocal action by fluoride
with the membrane proteins by changing their spatial conformation.
There is evidence to support all of these possibilities. O. WARBURG (21) has already
reported on the inhibition of glycolysis by F-. He suggests that fluoride's effect is caused by an
inhibition of enolase by a Mg-fluorophosphate complex. We discovered a decline in ATP
formation in our own experiments at F- concentrations > 10-3 M.
L.J. OPIT (22) reports of an inhibition of the (Na+-K+) activated ATPase of kidney cells
(guinea pig). According to OPIT, 4 x 10⁻³ M NaF inhibits the enzyme up to 50%. S. LEPKE and
H. PASSOW (23) could determine a direct effect on the membrane in that they discovered K+
efflux in so called "Erythrocyte Ghosts" after action of 4 x 10⁻² M NaF.
Which of these effects dominates in vivo has not been determined. The concentrations
used here all lie above the physiological concentration. We must still investigate if similar
effects can be observed at smaller F concentrations. We must also determine which effects
become effective at which concentrations, when F- acts on the entire system. The possibilities
for a fluoride effect, possibly also a selective effect on the salivary glands, are very complex.
The possibilities can be divided into:
1. an effect on the cholinergic system, that is, on synthesis, storage, release, and
inactivation of ACh.
2. an effect on the (Na+-K+) distribution and thereby on the resting potential of nerve
cells, whereby the parasympathetically stimulated cells should be most sensitive.
10
3. a direct effect on the processes at the salivary gland, perhaps through activation of the
active ion transport, or through independent enlargement of the hyperpolarization
during the stimulatory phase.
II. Presentation of the Problem
According to a theory of KNAPPWOST's (9), watery vagotonic saliva causes an
increase in the rate of the natural processes that maintain the surface of teeth, known as
remineralization. The saliva functions as a supersaturated solution of HA in this process. The
level of supersaturation rises with the pH level, so that a watery and slightly alkaline saliva
possesses the best reparative properties.
Numerous findings show that vagotonic symptoms can be observed after administration
of fluoride. (10,11,13,15,17) We undertook the task of looking for a possible influence of
fluoride ions on the tone of the vagus nerve by measuring the inhibition of AChE, and at the
same time of studying the kinetics of this inhibition. We also felt it necessary to study the effect
of fluoride complexes on the ACh-AChE system, due to their frequent occurrence in nature.
Since it could be assumed that fluoride can also trigger vagotonic effects indirectly, we
were also interested in the effect of fluoride on the transport of ions and molecules through the
cell membrane. Furthermore, radioactive tracing methods, with the help of which biochemical
reactions and even entire chain reactions can be studied in a single procedure, were to be
applied for this experiment. The pathway of ions and molecules in the body and at cell
membranes can also be followed using this technique.

11
III. Procedure and Results
A. Acetylcholinesterase Inhibition
1. General Information
The nomenclature for ACh hyrdrolases initially presented great difficulties because
several enzymes that all catalyze the hydrolysis of ACh exist. Two enzymes exist that are
substrate-specific and only hydrolyze ACh (abbr. AChE). In addition, there are 11 enzymes that
can hydrolyze ACh as well as other esters. These enzymes have become known as pseudo-
cholinesterases (abbr. PChE). The two substrate-specific enzymes, also known as "real
cholinesterases", are found in the myelin sheath of nerves, at the motor endplate, in all
cholinergic organs, and in erythrocytes. The two enzymes that are not categorized as iso-
enzymes are differentiated only by their optimal pH (pH = 7.2 and pH = 8.6). W. PILZ (24) was
able to separate them using starch gel electrophoresis. The same author was also able to separate
the other 11 non-specific esterases, which are found in the serum. The characteristics of these
PChE vary greatly, so a singular kinetic behavior is not to be expected upon investigating their
inhibition. When using all of these enzymes together in the form of unpurified serum one must,
in the worst case scenario (ie when the affinities of the individual components for the substrate
or inhibitor are all different), deal with a function with 11 variables. We could, in fact, identify a
non-homogeneous relationship in such an enzyme test.
Several models of the course of the hydrolysis of ACh have recently been developed.
(25, 26) All of the models assume two binding sites, which are supposed to have a spacing of 7
Å, equivalent to the distance between the positive nitrogen and the carbonyl oxygen of the ester
group in the ACh.
According to this model, the ACh's quaternary nitrogen is bound to a negatively charged
phosphate group by way of an ionic bond. Meanwhile, dipole-dipole reciprocal attraction occurs
between the O atoms of the acetyl group and the OH group of a serine residue, as well as the N
atom of an imidazole ring, which are components of the AChE's esterase binding subunit. The
dipole-dipole interactions ultimately lead to the transfer of the acetyl residue onto the enzyme

12
(ester-formation with the serine residue). The enzyme is afterwards regenerated by saponifying
this ester bond.
2. Theoretical Treatment of the Enzymatic Kinetics
Enzymatically catalyzed reactions can often be represented by the following schema:
E + SK+ 1 →
K −1←
ESK +2 →
K −2←
E + P
E = enzyme, S = substrate, ES = enzyme-substrate complex, P = product
If the reaction is exergonic (∆ H < 0), which is usually the case, k-2 can be ignored with
respect to k+2. If one further assumes that the complex formation occurs far more quickly than
the transformation that follows it, then the complex formation is subject to the Rules of Mass
Action, which means that the complex formation leads to an equilibrium.
SKES
SE =][
][•][ (equation 1)
Since the velocity of the reaction (v) is dependent on the concentration of ES, it is, by way of
equation 1, also dependent on the substrate's concentration. At a given enzyme concentration, v
= f[S] can be plotted as follows:
Figure 2. Enzyme Reaction Rate vs. Substrate Concentration

13
The reaction rate reaches a maximum (Vm). This saturation occurs when all of the
enzyme is present as ES. The substrate concentration necessary for saturation can not be
precisely read off the graph due to the asymptotic nature of the curve. Therefore, the half-
maximal rate is used to characterize the enzyme. The substrate concentration at half-maximal
rate is known as the Michaelis constant (KM). It is constant for a given enzyme/substrate pair
held at constant reaction conditions. As can easily be shown from equation 1, the Michaelis
constant is numerically equal to the dissociation constant KS. For vm/2: [E] = [ES]. By
substituting into equation 1, one gets:
SMV KKSm
=≅2/
If v is limited by k+2, then:
v = k+2[ES] (equation 2)
If one sets [E] = [Et] - [ES] and substitutes into equation 1, one gets:
v =k2 • [Et][S]
KM +[S]
k2[Et] corresponds to the maximum reaction rate, so that finally:
v = Vm •[S]
KM +[S] (equation 3)
This relationship is also known as the MICHAELIS-MENTEN equation. It represents the
mathematical relationship of the plot in figure 2. If k+2 can not be ignored with respect to k-1 the
following is not equivalent to KS:
Km =K−1 + K+ 2
K+1
The linear rearrangement of equation 3 according to LINEWEAVER and BURK. offers one
possibility for the graphical representation of KM and Vm. Accordingly:
1
v=
KM
Vm
•1
[S]+
1
Vm
(equation 4)
If one depicts this equation graphically the plot of 1/v à 1/[s] runs as a straight line with y-
intercept 1/vm and x-intercept -1/KM.

14
Figure 3. Generalized Lineweaver-Burk Plot
Enzymatic Inhibition
A reduction in the reaction rate can occur if there is an additional substance present in an
enzyme-substrate system that reacts with the enzyme during complex formation. Such an
"inhibition" develops when the inhibitor reacts with the reactive center of the enzyme and
thereby displaces the substrate from the surface of the enzyme by way of a competitive reaction.
Inhibitor binding at another location on the enzyme molecule can also lead to inhibition by
causing a conformational change and/or shifting the charge distribution. The first case
represents a competitive inhibition and the second a non-competitive inhibition. If both forms of
inhibition arise at the same time it is known as a mixed-competitive inhibition.
The type of inhibition can be identified by analyzing the plot of the reaction in a
Lineweaver-Burk diagram (figure 3). For a competitive inhibitor the magnitude of the
maximum reaction rate is unchanged by addition of the inhibitor, since a constant increase in
substrate concentration can eventually displace all of the inhibitor from the reactive center. The
Michaelis constant, however, does change since the substrate concentration needed to reach half
of the maximum reaction rate is higher. If one examines the course of the reaction rate as a
function of substrate concentration, with and without inhibitor, a plot analogous to figure 3,
with two straight lines of equal y-intercept but different x-intercepts, results. Such a case is
diagrammed in figure 4.
Figure 4. L-B Plots Comparing Uninhibited And Competitive Inhibited Rates

15
In the case of 50% inhibition [ES] = [EI]. In this case the relation [S]/[I] is the same as the
relationship between the two constants KS/KI. The quantitative expression of the inhibited
reaction in figure 4 is:1
v= (1 +
[I]
KI
)KM
Vm
•1
[S]+
1
Vm
(equation 5)
Legend:
[I] = Inhibitor concentration
KI = Dissociation constant for the enzyme/inhibitor complex
KM = Michaelis constant for the uninhibited reaction
K’M = Michaelis constant for the inhibited reaction
The inhibitor constant can be calculated from:
)][
1('I
MM K
IKK += (equation 6)
The inhibitor constant is a measure of the affinity of the inhibitor for the enzyme and thereby of
the effectiveness of a substance that acts as an enzymatic inhibitor. Enzymatic inhibition is
described by the fraction:vo − v
vo
Under conditions of substrate saturation equation 3 becomes v= vm = vo, which means that:
[S]
KM + [S]= 1
That is to say, KM can be disregarded with respect to [S]. By inserting the expression for the
inhibition to rearrange equation 5 one gets:

16
vo − v
vo
= 1−[S]
KM (1 + I
K I
) + [S] (equation 7)
When I approaches 0, the inhibition also approaches 0, since [S] / KM + [S] approaches 1,
which is the case for the region of substrate saturation. Equation 7 describes the course of the
inhibition as a function of inhibitor concentration when a competitively inhibitory substance is
present. Once the values for KI and KM have been determined via a calculation based on figure
4, the inhibition can be calculated for any substrate and inhibitor concentration. However,
outside the region of substrate saturation, v no longer approaches vo , even in the absence of an
inhibitor.
Under conditions of a non-competitive inhibition the binding of substrate to enzyme is
unaffected, that is to say KM is not a function of I. The reaction rate, on the other hand, is
decreased. Similar to figure 4, the following results:
Figure 5. L-B Plots Comparing Uninhibited and Non-Competitive Inhibited Rates
The following equation holds for V'm:
V 'm =
Vm
1+ [I]
KI
The complete equation for the reaction rate is therefore:
v =Vm
1 + [I]
KI
•[S]
KM +[S] (equation 8)
(Translator’s note: There is no text for nor any equation numbered “9”)
17
The second term = 1 when there is substrate saturation and the equation becomes:
vo − v
vo
= 1−K I
KI + I (equation 10)
Equation 10 describes the dependence of the inhibition on the inhibitor concentration in
the case of a non-competitive inhibition and substrate saturation. If there is no substrate
saturation the second term must be multiplied by :
[S]
KM + [S]
In the case of 50% inhibition KI = [I].
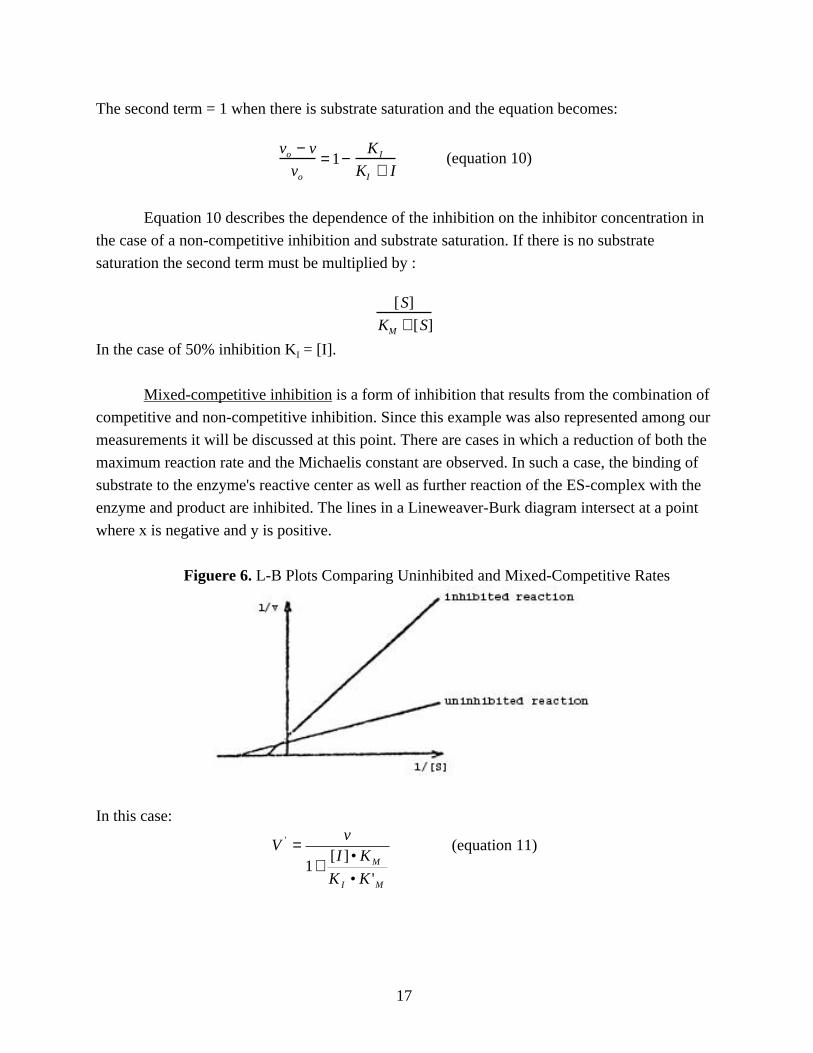
Mixed-competitive inhibition is a form of inhibition that results from the combination of
competitive and non-competitive inhibition. Since this example was also represented among our
measurements it will be discussed at this point. There are cases in which a reduction of both the
maximum reaction rate and the Michaelis constant are observed. In such a case, the binding of
substrate to the enzyme's reactive center as well as further reaction of the ES-complex with the
enzyme and product are inhibited. The lines in a Lineweaver-Burk diagram intersect at a point
where x is negative and y is positive.
Figuere 6. L-B Plots Comparing Uninhibited and Mixed-Competitive Rates
In this case:
MI
M
KK
KIv
V
'•
•][1
'
+= (equation 11)

18
Here K'M is the substrate concentration that yields half of the maximum reaction rate when there
is an excess of inhibitor present. The y-intercept of the inhibited reaction (K'M'') obeys the
following relationship:
K'M
' =KM(1 +
[I]
K I
)
1 + [I]• KM
K I • K 'M
(equation 12)
Substituting equation 11 and equation 12 into equation 3 yields the following expression for the
reaction rate of the inhibited reaction:
)•
•][1]([)
][1(
][•
'MI
M
IM
o
KK
KIS
K
IK
Svv
+++= (equation 13)
Finally, from equation 13 one derives the following equation for the inhibition:
)•
•][1]([)
][1(
][1
'MI
M
IM
o
o
KK
KIS
K
IK
S
v
vv
+++−=
− (equation 14)
Equation 14 describes the complete course of the dependence of the inhibition on inhibitor
concentration in the case of a mixed-competitive inhibition. If there is an excess of substrate KM
can be disregarded with respect to S, as long as the inhibitor concentration is not too large.
Equation 14 then becomes:
MMI
MIo
KIKK
KK
v
vv
•][•1
'
'
+−−=−
(equation 15)
If one solves equations 7, 10 and 15 for ((vo / v) - 1) one derives the following linear functions
when viewing these values as a function of the inhibitor concentration:
1. competitive inhibition:
][••][
1 IKS
K
v
v
I
Mo =− (equation 16)
2. non-competitive inhibition:

19
I
o
K
I
v
v ][1 =− (equation 17)
3. mixed-competitive inhibition:
][••
1 IKK
K
v
v
IM
Mo =− (equation 18)
Independent of the type of inhibition, plotting the left side vs. [I] results in a straight line
that intersects the origin, assuming that the conditions under which the equation was derived are
maintained. This means that KM can be disregarded with respect to [S] and that there is excess
substrate present, which further implies that no free enzyme is present. Furthermore, the enzyme
must use the same number of binding sites with respect to the inhibitor as it does with respect to
the substrate, since [I] would otherwise not take on a linear relationship. [I] would instead take
on the form [I]n, where n can be either smaller or greater than 1 depending on whether the
enzyme uses more or fewer binding sites with respect to the inhibitor than with respect to the
substrate. If n ≠ 1, but is constant within the observed concentration range, its value can be
derived from a double-logarithmic plot.
1. competitive inhibition:
]log[••][
log)1log( InKS
K
v
v
I
Mo +=− (equation 19)
2. non-competitive inhibition:
Io KInv
vlog]log[•)1log( −=− (equation 20)
3. mixed-competitive inhibition:
MI
Mo
KK
KIn
v
v
'•log]log[•)1log( +=− (equation 21)
If n changes within the observed concentration range the plot will follow a curved line, even
with this method of representation.
3. Procedure
a. Description of the Tracer Method

20
ACh hydrolysis can be followed by either determining the decrease in ACh
concentration or by measuring the increase in concentration of the reaction products, choline
and acetic acid.
A procedure described by H.U. BERGMEYER (27) uses the first of these methods. Initial and
final ACh concentrations are determined using the fact that hydroxylamine is converted to
acetylhydroxamic acid, which forms a red complex with Fe3+ that can be photometrically
followed. The large reaction volume (25ml) and the labor intensity are drawbacks of this
technique.
The majority of experiments cited in the literature are carried out using the second
approach. One can, for example, using a pressure gauge, determine the amount of C02 released
from a bicarbonate buffer by the formation of acetic acid. Because certain conditions that must
thereby be painstakingly maintained, this is also a rather laborious technique. Another
possibility consists of measuring the pH changes caused by the acetic acid with the help of a
glass electrode. The drawback of this method is that the enzymatic activity is affected by a pH
change that occurs during the measurement. A detailed description of these procedures can also
be found in H.U.Bergmeyer (27). To improve on the electrometric method one can immediately
neutralize the released acetic acid with NaOH using an automatic titrator controlled by the EMK
of the glass electrode. The amount of base used in titration then becomes a measure of the level
of reaction. E. Heilbronn (18) uses this procedure as well. The advantage of this technique is
that it is relatively easy to manage and can be carried out quickly. In addition, the hydrolysis
can be read off directly at any time. The drawback is that the number of ions in solution changes
over the course of the reaction, which can have an effect on the enzymatic activity. In addition,
the finite response duration of the regulatory cycle limits the lower boundary of the reaction
time. Measurement over small times does, however, become necessary when varying the
substrate concentration to record a "Lineweaver-Burk" diagram, since the substrate
concentration is not allowed to change noticeably over the course of the reaction.
To avoid the difficulties mentioned above, we developed a new procedure for measuring
the rate of ACh hydrolysis. The procedure relies on the use of a radioactive tracer method. We
used 1-C-14-ACh for this, which we obtained from the company Amersham-Buchler in
Braunschweig.
Principle:

21
The labeled ACh decomposes into radioactive acetic acid and non active choline when
hydrolysis occurs. After the reaction had run we precipitated the remaining ACh+choline by
adding an excess of sodium tetraphenylborate (Kalignost), a substance that forms highly
insoluble precipitates with many large monovalent cations. The solubilities of the salts are 3 x
10-5 g/ml for choline and 3 x 10⁻⁴ g/ml for ACh. (28)
After centrifugation we determined the radioactivity in the clear supernatant. The
radioactivity stems from the 14C Acetic acid that has formed and is proportional to the amount
of ACh that has been converted. The great sensitivity of this method is one of its important
advantages. The specific activity of the labeled ACh-specimen was 10 Ci/Mol. The unit 1 Curie
(Ci) is equal to 3.7 x 10¹⁰ impulses/sec.
When using a fluid scintillator, 103 Imp./min (abbr. Ipm), which corresponds to 4.5x10⁻¹⁰
Ci or 4.5x10⁻¹¹ Mol ACh (8.2x10⁻⁹ ACh-chloride), should be set as the lower boundary in order
to achieve sufficient accuracy. When using such ACh concentrations one would fall short of the
solubility product of the ACh-sodium tetraphenylborate compound. This difficulty can,
however, be circumvented, after the reaction is complete, by adding an excess of non-
radioactive ACh, which is precipitated out with an excess of Kalignost. Since the radioactivity
is evenly distributed among all of the ACh, both in solution and in the precipitate, in the
solution one basically only finds radioactive acetic acid that has not been precipitated out. A
disruptive absorption of tiny amounts of acetic acid into the precipitate can also be inhibited by
adding non-radioactive acetic acid. Upon measurement of different substrate concentrations, the
influence of the latter on the accuracy of the measurement can be eliminated by using stock
solutions with different concentrations but the same radioactivity. One therefore has a different
specific activity for each concentration.
With other methods the measured concentration level is proportional to the acetic acid,
which leads to very small concentrations yielding inaccurate values because the accuracy of the
measurement is generally of an absolute value. In our case the measured value, that is to say the
radioactivity, does not decrease with decreasing substrate concentration, but instead even

22
increases because the growth in specific activity is greater than the decrease in the rate of the
reaction resulting from the drop in substrate concentration.
b. Equipment
We used a LIQUID SCINTILLATION SPECTROMETER from the company
PACKARD-INSTRUMENTS with the classification: Model 3320, for measuring radioactivity.
The instrument had an automatic "sample changer" with 200 spaces to its disposal. The count
occurs by way of three independent channels. The count-time can be varied between 1 sec. and
100 min. The background can be automatically subtracted as a fixed value. Fluctuations are
thereby not taken into account. The numerical result is recorded through a printer. The counting
yield can be optimized for different isotopes by changing the width of the window and the
magnification. The measurements were done in 20ml disposable test tubes made of
polypropylene, which is resistant to dioxane and toluene. As a scintillation liquid we used so
called Bray's solution (29), which is composed of the following:
Naphthalene 60 g
Diphenyloxazole (Abbr. PPO) 4 g
1.4-Bis-(2-phenyl-oxazolyl)-benzene (Abbr. POPOP) 0.2 g
Methanol 100 ml
Ethylene glycol 20 ml
________________________________________________________________________
1.4 - dioxane ad 1,000 ml
PPO functions as primary scintillator (maximum fluorescence 3650 Å), POPOP as
secondary scintillator (maximum fluorescence 4180 Å). Up to 2 ml of aqueous test solution can
be measured in 15 ml of this solution. The lowest measurable value for C-14 is about 90% in
this case. Furthermore, we used a micro-liter system from the company EPPENDORF-
GERÄTEBAU in Hamburg to carry out the experimental procedures.
The system consists of 12 bulb pipettes with exchangeable disposable tips for extracting
volumes from 5 µl - 1ml, a thermal block for temperatures of 25o, 37o, 56o, and 95oC, as well as
a micro-centrifuge with a centrifugal force constant of 12,000 G with only 1-2 sec of startup
time. The thermal block and centrifuge were set up for disposable 1.5 ml polyethylene test
tubes.

23
4. Carrying out the Measurements
We ran the reactions in small 10ml measuring flasks, to which we added 5ml of the
respective buffer solution ahead of time. Next came 0.5ml of the appropriate enzyme solution.
We used a total of three different assays:
1). A purified enzyme preparation from bovine erythrocytes (produced by Serva Co of
Heidelberg), of which we dissolved 25mg ~ 50EU in 50ml of buffer solution (either
citrate-phosphate buffer of pH 7.4, or Veronal-HCl buffer of pH 8.6).
2). A suspension of human erythrocytes in Ringer's solution, which was used directly
without additional treatment.
3). Human serum, which, after dilution with an equal amount of Ringer's solution, was
also implemented without further treatment.
Next we added 0.5ml of the appropriate inhibitor solution (in the absence of inhibitor,
0.5ml of buffer), and lastly, after setting the temperature of these assays to 370C, 0.5ml of the
radioactively labeled ACh solution, whereby we simultaneously started the stop watch.
When the reaction period was completed, which in most cases took an hour, but when
determining the dependence of the reaction rate on substrate concentration only five minutes,
we stopped the reaction by adding 2ml of 0.1M sodium tetraphenylborate solution. After a
waiting period of one hour, which allowed for completion of precipitate formation, we filled the
small flasks to the mark with twice distilled water.
We transferred 1.2ml of solution into a plastic centrifugation vessel and after
centrifugation withdrew exactly 1ml of the supernatant, which was then measured directly in
Bray's solution. The measured impulse rate yielded a value that was proportional to the amount
of acetic acid released and thereby to the quantity of saponified ACh. We expressed the rate of
reaction in impulses/reaction time, or, after dividing by the specific activity of the substrate
stock solution, as µMol of released acetic acid/reaction time.
Each series of measurements consisted of:

24
1. a value to determine the self-saponification of the ACh, which was determined by
omitting the enzyme assay.
2. a value to determine vo, and therefore without addition of inhibitor, and
3. the values with addition of inhibitor, which served to determine the inhibition
of the enzyme.
The measured values were constantly corrected by subtracting the self-saponification
rate. The following equation gives another overview of the derivation of the measured values.
v =(Ib − IE − IU ) • 1 0
A •t (equation 22)
where:
v = Rate of reaction (in µMol acetic acid/minute)
Ib = Total impulse rate (in impulses/minute)
IE = impulse rate of the self-saponification (in impulses/minute)
IU = impulse rate of the natural radioactivity (in impulses/minute)
A = specific activity of the ACh stock solution (in impulses/minute and µMol)
t = reaction time (in minutes)
For the measurement of the pH dependence of the inhibition, the value of vo as well as
the self-saponification rate had to be determined separately for each pH, since both values are
pH dependent. For the measurements that served to determine the reaction rate as a function of
substrate concentration we used a different stock solution for each substrate concentration,
whereby the radioactivity per unit of volume remained constant while the ACh concentration
changed. In addition, in this case we added an excess of non-radioactively labeled ACh after the
reaction was completed, to avoid falling short of the solubility product of the ACh-sodium
tetraphenylborate compound.
a. AChE Inhibition by NaF

25
The following measurements where to be carried out in the concentration range
equivalent to substrate saturation, within which the reaction rate is independent of the ACh-
concentration. In order to determine this region we carried out a measurement in which we
examined the reaction rate as a function of the ACh concentration. The course of the recordings
is recreated in figure 7.
Figure 7 - Dependence of ACh Hydrolysis on ACh Concentration.

26
Phosphate-citrate buffer (following Mc.Ilvaine); pH = 7.7 ; T = 370C ;
purified AChE from bovine erythrocytes with concentration: 0.0343mg/ml
Saturation was reached at about 2 x 10⁻³M ACh. A further increase in ACh concentration
leads to a slight reduction in the reaction rate. This observation suggests that there is an
inhibition occurring due to excess substrate, which cannot, however, be determined with
certainty from this measurement. Since the reaction rate barely changes, even with significantly
greater ACh concentrations, we could still carry out the measurement at 1.4 x 10⁻²M ACh. A
measurement of the reaction rate as a function of time showed that the reaction rate remains
constant over an hour. Applied to equation 2 this means that in V = k+2 • [ES], becomes
independent of [S] (reaction of zeroth order). All of the enzyme is therefore present as ES.
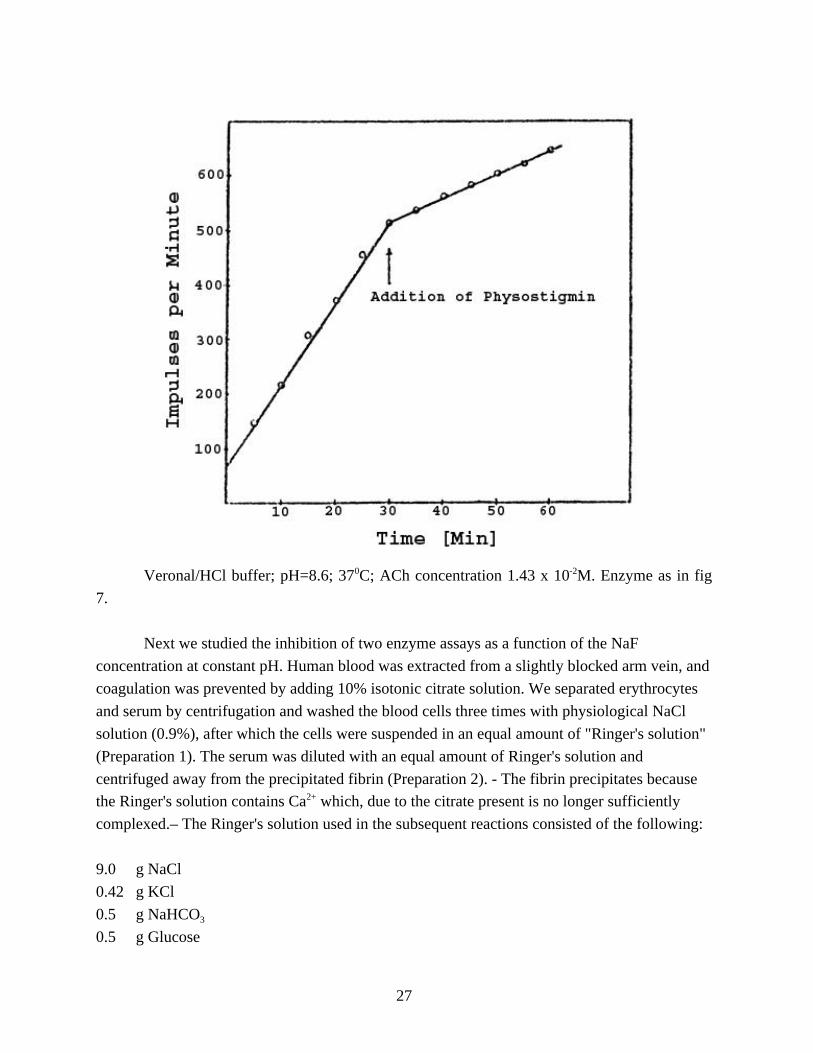
Figure 8 shows a plot of the reaction rate vs. time. 25 µMol (=5 x 10 -4M) of the AChE specific
inhibitor Physostigmine were added after 30 minutes. The curve bends off, but continues to run
linearly. The inhibition is 71.5%. The y-intercept (at t=0) represents the share of C-14 acetic
acid in the stock solution.
Figure 8 - Quantity of 14C Acetic Acid Released as a Function of Time.
27
Veronal/HCl buffer; pH=8.6; 370C; ACh concentration 1.43 x 10⁻²M. Enzyme as in fig
7.
Next we studied the inhibition of two enzyme assays as a function of the NaF
concentration at constant pH. Human blood was extracted from a slightly blocked arm vein, and
coagulation was prevented by adding 10% isotonic citrate solution. We separated erythrocytes
and serum by centrifugation and washed the blood cells three times with physiological NaCl
solution (0.9%), after which the cells were suspended in an equal amount of "Ringer's solution"
(Preparation 1). The serum was diluted with an equal amount of Ringer's solution and
centrifuged away from the precipitated fibrin (Preparation 2). - The fibrin precipitates because
the Ringer's solution contains Ca2+ which, due to the citrate present is no longer sufficiently
complexed.– The Ringer's solution used in the subsequent reactions consisted of the following:
9.0 g NaCl
0.42 g KCl
0.5 g NaHCO3
0.5 g Glucose

28
0.24 g CaCl2
0.025 g MgCl2
___________________
double-distilled water – 1,000ml
This solution, whose pH value was 7.4 and whose buffering capacity was relatively
limited, was used to offset hemolysis of the erythrocytes, and to create the most natural
conditions possible. We proceeded as was described in detail at the beginning of III,A,4. Figure
9 shows the plot of the inhibitory percentage as a function of NaF concentration.
Figure 9 – NaF Inhibition of AChE From Human Erythrocytes and PChE From Human Serum
ACh concentration 7.15 x 10⁻³M, Ringer's solution, T=370C.

29
The serum-cholinesterases are visibly more inhibited by the NaF than the AChE from
the erythrocytes. The non-monotonic course of PChE inhibition at lower concentrations is
probably the result of differing affinities of individual enzymes in the PChE mixture for the
inhibitor. According to equations 16,17 and 18, independent of the type of inhibition, a straight
line should arise when vo/v-1 is plotted against the inhibitor concentration, assuming that the
number of binding sites on the enzyme for the inhibitor is the same as for the substrate. If
several enzymes are simultaneously involved in the reaction, a linear dependence only develops
when the affinities (reciprocal inhibitor constants) of the individual components for the inhibitor
are equally large, which is rather unlikely given the number of PChEs. Figure 10 shows such a
plot for the two curves from figure 9.
Figure 10. Dependence of (vo/v) –1 on NaF Concentration
The course of the curves can, in the case of the serum preparation, be approximated by
two straight lines with different slopes. This suggests that the reaction rate is considerably
limited by just two components of the enzyme mixture, which have different affinities for the
fluoride. The AChE of the erythrocytes yields a linear course, which suggests that the controlled
variables of equations 16-18 are fulfilled here.

30
Next we determined the form of the inhibition from a plot in accordance with
Lineweaver and Burk. Purified AChE from bovine erythrocytes (obtained from the company
Serva in Heidelberg) again served as our enzyme specimen.
Figure 11 - Lineweaver-Burk Diagram of the Inhibition of AChE by NaF.
Curve 1: uninhibited reaction
Curve 2: 1.43 x 10⁻²M NaF measured in phosphate-citrate buffer, pH 7.7
The inhibition is competitive and the Michaelis constant of the uninhibited reaction is:
KM = 4.2 x 10⁻⁴Mol/l. From equation 6 one calculates the inhibitor constant to be: KI = 6.26 x

31
10-3Mol/l. The affinity of the substrate for the enzyme is therefore, in this case, 15 times as great
as that of the inhibitor. Using equation 16, the inhibitor constant can also be calculated from the
slopes of the lines in figure 10. The following applies:
KI =KM
[S]• n (equation 23)
The letter “n” stands for the slope of the lines and is graphically derived from figure 10.
We took the value for KM from the analysis of figure 11 (4.2 x 10⁻⁴M), and the substrate
concentration had a value of 7.15 x 10⁻³M. By substituting these values into equation 23 we
obtain, taking the value of the slope (n=1.08 x 10²) into account, the inhibitor constant for the
AChE of the erythrocytes: KI = 5.6 x 10⁻⁴Mol/l. This value, however, means that the
dissociation constants of the enzyme/substrate complex (KM) and of the enzyme/inhibitor
complex (KI) are roughly the same. A comparison with the constant (KI = 6.26 x 10⁻³M) derived
from figure 11 shows that upon shifting to physiological conditions the enzyme is more strongly
inhibited by the fluoride. Since a KM value for the PChE of the serum is not available to us, we
can not analogously analyze the serum curve which, due to its non-monotonic course, seems of
little purpose anyway. An inhibition of the AChE of the erythrocytes begins at fluoride
concentrations > 5 x 10⁻⁴M ~ 9.5 mg/l. The serum-cholinesterases are already inhibited at
concentrations > 7 x 10⁻⁵M ~1.3mg/l. These effects are not yet sufficient to lead to an
explanation of a vagotonic effect, as is shown by inhibition of caries at physiological fluoride
concentrations.
b. pH Dependence of the Inhibition
Heilbronn(18) and Krupka(19) already determined that, at constant fluoride
concentrations, the inhibition of AChE by fluoride rises with falling pH value. Because of the
low HF concentrations (10-6 - 10-8M) they did not, however, attribute this effect to the activity of
the HF molecule, which along with F- is always present in aqueous solution. We therefore
undertook the task of determining if the inhibition is always proportional to the given HF
concentration, which can be calculated from the dissociation equation for HF. This dissociation
equation approximately follows (replacing the activities by concentrations) the relationship:
[F− ][H+]
[HF]= KS = 5 . 4 • 1 0−4 Mol/ l (equation 24)
In a buffered system [H+] is constant. The HF concentration therefore depends on the
pH value of the buffer as well as the fluoride concentration. The concentration of NaF used in

32
the experiment can be used in place of [F-] in this equation, since its decrease due to HF
formation can be ignored. Since both the enzymatic activity as well as the self-saponification
rate of the ACh are pH dependent they must be separately determined for each pH value used.
The inhibition is then calculated, after subtraction of the self-saponification, by relating the
reaction rate at one pH value with the uninhibited reaction rate at the same pH value. The
strength of the pH dependence of the self-saponification becomes apparent in figure 12.
Figure 12- pH Dependence of the Self-Saponification of ACh in Phosphate-Citrate Buffer
A straight line arises when log v is plotted against the pH value. According to that line
the hydrolysis is catalyzed by OH-, which is understandable. A negatively charged intermediate
condition arises upon alkaline saponification of an ester.
This intermediate condition is stabilized by the positive charge on the quaternary nitrogen
atom in the ACh, since the molecule is now outwardly neutral. The saponification catalyzed by
H+ would, however, yield a positive intermediate condition, which in the case of ACh is
impractical because of the double positive charge. Due to this condition, the balance should lie
almost entirely on the left side here.

33
The change in enzymatic activity as a function of the pH value emerges in figure 13. The
pH optimum lies at 7.5 and thereby roughly corresponds to that of the blood.
Figure 13 - pH Dependence of the Enzymatic Activity
Purified AChE from bovine erythrocytes, phosphate-citrate buffer.
Next we carried out a series of measurements to determine, at a constant pH value each
time, the dependence of the AChE inhibition on the NaF concentration. Purified AChE from
bovine erythrocytes once again served as the enzyme. In addition we used a phosphate-citrate
buffer (following Mc.Ilvaine), whose pH value can be varied between pH 8 - 2.2 by mixing 0.1
M citric acid with 0.2M Na2HPO4. We used the region from pH 8 - 6.5. Figure 14 reproduces
the course of the inhibition of the enzyme by NaF in the described pH region.
Figure 14 - Enzymatic Inhibition vs. NaF Concentration at Different pH Values

34
pH = a) 8 , b) 7.5 , c) 7 , d) 6.5.
If the inhibition is caused by the HF molecule, then regions of equal inhibition on the
curves should correspond to regions of equal HF concentration. We therefore calculated the HF
concentrations for each measured point using equation 24 and compared them to the inhibition,
whereby we could determine an agreement, which can be seen in the following table:
Table 1 - F- Inhibition of AChE* at Different pH Values and Equivalent HF Concentration.
Parameters of the Segment NaF Concentrations
at the Intersections
Calculated HF
Concentrations
pH-value Inhibition (%) 10-3M 10-6M
7.5
7.0
52 28.6
9.0
1.67
1.67
7.5
7.0
45 19.8
6.2
1.16
1.15
7.5
7.0
39 12.5
3.9
0.73
0.73
7.5
7.0
33 6.8
2.1
0.40
0.38
7.0
6.5
66 27.5
8.7
5.10
5.10
7.0
6.5
60 20.0
6.4
3.70
3.72
35
7.0
6.5
45 6.2
2.0
1.16
1.16
*purified preparation from the company Serva
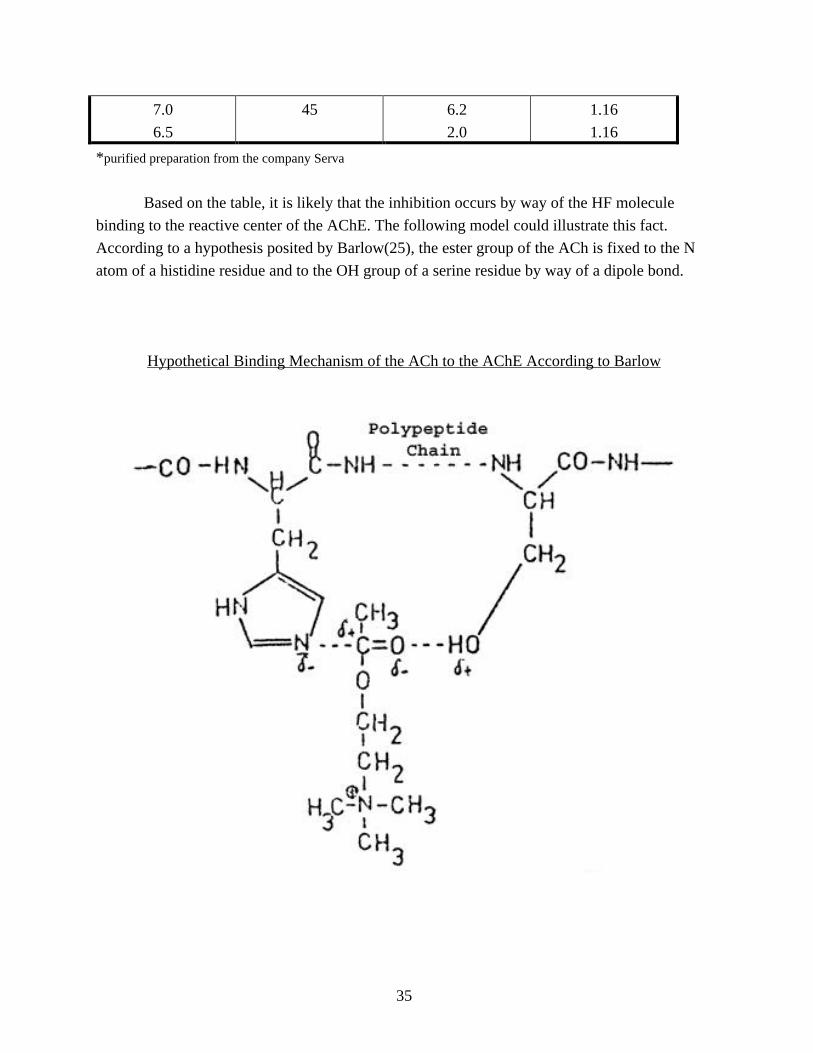
Based on the table, it is likely that the inhibition occurs by way of the HF molecule
binding to the reactive center of the AChE. The following model could illustrate this fact.
According to a hypothesis posited by Barlow(25), the ester group of the ACh is fixed to the N
atom of a histidine residue and to the OH group of a serine residue by way of a dipole bond.
Hypothetical Binding Mechanism of the ACh to the AChE According to Barlow

36
A strong dipole like the HF molecule should be able to block the acceptor site in
question by forming a strong hydrogen bridge. Since the binding is reversible, a competitive
inhibition of the AChE should result.
Hypothetical Binding Mechanism of the HF Molecule to the Reactive Center of the AChE.
If one relates the inhibitor constant of the fluoride (KI = 6.26 x 10⁻³M) to the
concentration of free HF one gets a value of KI = 3.2 x 10⁻⁷M, which demonstrates the great
affinity of the HF molecule for AChE. By decreasing the pH value it is possible, as we have
seen, to achieve a meaningful increase in the inhibitory effect of the fluoride on AChE. If the
pH value sinks below 7.4 anywhere in the organism, which is often the case, it can result in a
stronger inhibition of AChE by fluoride (by way of HF) than in other places with the same
fluoride concentration but a pH value of 7.4. The region of the fluoride's effect thereby expands
to include smaller concentrations, so that physiological concentrations could also possibly lead
to an effect in this direction.
c. Dissociation Behavior of Several Fluoride Complexes at pH 7.4
Fluoride is, in our opinion, not only found as F- in both the living and non-living realm
of nature, but often exists in complex bound form as well. It is still largely unknown if complex
fluorides are of biological importance. If, or to be precise in which form, they enter the
organism can be studied with the help of the radioactive isotopes 18F and 31Si (in the case of

37
fluorosilicates). Since these isotopes were until now rarely available to us, we could only use
them to carry out a few orienting preliminary tests.
We therefore now occupied ourselves with the following questions. Which of the named
complexes are stable at pH 7.4 (pH of the blood)? Is an influence on biochemical processes
possible? And in particular, can the AChE inhibition be increased through the use of complex
fluorides without thereby further raising the fluoride concentration? We studied the complexes
BF4-, AlF6
3-, SiF62- GeF6
2-, SnF62-, and PF6
-. Of these, only the Al, Si, and P complexes are of
natural importance, the latter however not in the form of PF6-, but instead as PO3F
2-. The
phosphoric acid residue may also be bound to organic residues (carbohydrates or adenosine).
The remaining complexes we only studied for the sake of completeness, in order to possibly
determine a relationship between the radius of the ion and the charge of the complex, and their
effectiveness as inhibitors of enzymes. We studied the dissociation behavior of the complex
fluorides by dissolving the complex salt in a buffer system and determining the free F_
concentration with the help of an ion selective electrode.
Properties of the Fluoride Electrode
The fluoride electrode is a solid membrane electrode. The active electrode phase forms a
single LaF3 crystal, which is doped with Eu2+ to diminish the electrical resistance. The crystal
can conduct fluoride. The external side contacts the test solution while the internal side contacts
a fixed ion solution, which closes the measurement chain by way of a Ag/AgCl half element.
The EMK of the measurement chain tracks the fluoride ion activity in the test solution. The
NERNST equation yields the mathematical expression for the EMK trace.
E = Eo −R • T
Fln a
F− (equation 25)
If one chooses pF value as an expression for the F- activity (analogous to the pH value; ie the
negative decadic logarithm of the F- concentration) equation 25 can be rewritten in the form:
PF =(E − Eo)• F
2.3RT
In our case the pF value was displayed directly by way of a digital voltmeter.
The fluoride electrode possesses an unusually large selectivity, so that even a 1000 times excess
of foreign ions does not bother it. Its functional region lies between 1-10-5M F-. Since the

38
display of the instrument is influenced by a number of controlled variables (kind of buffer, pH
value, temperature, stirring speed) it is necessary to record a calibration curve for each set of
measurements and to maintain the controlled variables as exactly as possible. We carried out
each of our measurements in 200ml Veronal/HCl buffer with a pH of 7.4 at 37o C. Figure 15
indicates the course of the calibration curve recorded under these conditions.
Figure 15 – pF Value as a Function of the F- Concentration in Veronal/HCl-Buffer of
PH 7.4 at 37o C.
Next we determined the level of hydrolysis of the individual complexes as a quotient of
the concentration of free F- (which can be derived from the calibration curve) and the total
concentration of the fluoride atoms bound to the complex before the hydrolysis.
=c
F−
n • cMeFn
m−
(equation 27)
In order to determine this value we first submerged the electrode in 200ml of buffer and waited
until a constant pF value was displayed, which was caused by the F- that had gone into solution
from the electrode. Then we added the complex salt as a solid and tracked the change in pF
value as a function of time until saturation. We determined the fluoride concentrations
corresponding to the measured pF values from the calibration curve and lastly calculated the
level of hydrolysis α using equation 27. (Translator’s note: There is no text for nor any equationnumbered “26 ”)

39
Hexafluorosilicate (as MgSiF6)
We tracked the speed of hydrolysis for two MgSiF6 concentrations.
Figure 16 - Dependence of the Level of Hydrolysis of SiF62- on Time.
1) c = 5.7 x 10⁻⁴M
2) c = 1.01 x 10⁻⁴M
The hydrolysis initially occurs very quickly. No more change occurred in the level of
hydrolysis after only 15 minutes. We observed the process for several hours. Since the smaller
concentration yielded a larger value for α we examined two further concentrations, for which
we however only recorded the saturation value and plotted the level of hydrolysis as a function
of MgSiF6 concentration.
Figure 17 - Level of Hydrolysis of SiF62- as a Function of the Concentration

40
The change in level of hydrolysis as a function of SiF62- concentration is relatively small.
Extrapolating the curve to even smaller concentrations should yield a level of hydrolysis for
physiological concentrations of not more than 0.67, which corresponds to the splitting of four
fluoride atoms from the complex.
If one assumes that a uniform product forms as a result of hydrolysis, complex ions of
the type [SiF2(OH)4]2- should be present under these conditions, which by way of the pH value
and temperature approximated physiological conditions. A coordination number other than 6 is
not to be expected for the Si in aqueous solution. The small concentration inhibits chain
formation, as it is often observed in silicon chemistry. Of course this possibility can nonetheless
not be ruled out.
Hexafluorogermanate (as K2GeF6)
We produced this compound for ourselves in the following way. We dissolved
germanium dioxide (GeO2) in a platinum dish while heating in an excess of 30% hydrofluoric
acid (H2F2). By adding the calculated amount of potassium carbonate (K2CO3) we precipitated
the highly insoluble (0.542g/100ml at 18o C) salt. We filtered out the precipitate, flushed it out
with 3% hydrofluoric acid, and dried it in the exsiccator over phosphorus pentoxide (P2O5).
Reactions:GeO2 + 6HF → H2GeF6 + H2O
H2GeF6 + K2CO3 → K2GeF6 ↓ + H2O + CO2 ↑

41
We then determined the hydrolytic behavior of the complex using the technique used for
MgSiF6.
Figure 18 - Hydrolysis of 1.1 x 10⁻³ M GeF62- as a Function of Time
The initial slow climb of hydrolysis is noteworthy. Since hydrolysis represents an ionic
reaction, one night expect equilibrium to be established quickly. But the course of this curve
may reflect dissolving speed of the salt, (a diffusion-dependent processon proportional to t 1/2
by. Fick's Rule). A plot of α vs. t1/2 is linear from t = 0 to t = 50, which speaks for this suspicion.

42
Figure 19 - Level of Hydrolysis of K2GeF6 as a Function of t1/2
The dissociation level of the saturation, at 0.83, corresponds exactly to the splitting of 5
F- out of the complex. If a complex of the form [GeF(OH)5]2- exists, or if higher molecular
aggregates form through condensation, can not be determined using the available materials.
Hexafluorstoannate (as K2SnF6 H2O)
The salt was produced using the procedure applied for K2GeF6. However, we used SnCl4
as the initial substance. Chlorine was expelled from this substance as HCl by way of repeated
steaming with 30% HF. The potassium salt crystallizes with one mole of crystal water. The
hydrolysis experiment yielded a complete breakdown of the substance after only five minutes.
Since nothing else special occurred a further representation of the experiment will be omitted.
Hexafluoroaluminate (as Na3AlF6)

43
This compound is of greater biological importance since it is widespread in nature in the
form of cryolite and can therefore be taken up by the human body. This compound appears at
elevated concentrations in the exhaust and wastewater near aluminum factories, which use this
substance as a fluxing material in melt-electrolysis, so that a burden for humans and animals
beyond the physiologically justifiable region can arise. The solubility of this compound in water
is minimal (0.042g/100ml). We studied a concentration of 0.03725 g/l = 1.78 x 10⁻⁴M.
Figure 20 - Hydrolysis of 1.78 x 10⁻⁴M AlF63- as a Function of Time

44
The rate of hydrolysis is slower than in the case of SiF62-, but faster than in the case of
GeF62-. A constant value of α = 0.695, which lies only slightly above the value for a separation
of 4 fluoride atoms (α = 0.67), is reached after 40 min. The hydrolytic behavior of the cryolites
is thereby similar, at this pH value of 7.4, to that of the hexafluorosilicates.
Hexafluorophosphate and Tetrafluoroborate (as KPF6 and KBF4)
We included these two substances in the study as representatives of monovalent
complexes. We used concentrations of: KPF6 = 1.67 x 10⁻⁴M and KBF4 = 2.34 x 10⁻⁴M
Figure 21 - Hydrolysis of PF6- and BF4
- as a Function of Time
These two substances are remarkably stable in comparison to those dealt with up to now.
The level of hydrolysis at saturation in both cases lies below the value for the separation of one
mole F- per mole of complex:
KPF6: αs = 0.0209 ; α1/6 = 0.17

45
KBF4: αs = 0.068 ; α1/4 = 0.25
To these considerations we also add an overview of the hydrolytic behaviors of the
studied complexes in the form of the following table.
Table 2. Degree of Complex Dissociation at Physiological Conditions, pH 7.4, T = 37o C
Complex Used Concentration [10-4M]
pH 7.4; T=370C
Level of Hydrolysis
at Saturation
Number of F Ions
Separated Per
Complex
MgSiF6 5.7 0.593 4
MgSiF6 1.01 0.622 4
MgSiF6 0.232 0.625 4
MgSiF6 0.116 0.630 4
K2GeF6 1.82 0.83 5
K2SnF6 1.42 1.00 6
Na3AlF6 1.76 0.659 4
KPF6 1.67 0.0209 0
KBF4 2.34 0.068 0
The experiments showed that several fluoride complexes, of which the
hexafluorosilicate and the cryolites are found in nature, do not fully hydrolyze under "quasi-
physiological" conditions. When these compounds are ingested as part of the nutrition, one must
expect the appearance of such partially hydrolyzed "intermediate complexes" in the body,
(assuming re-absorption). These complexes are most likely to appear when resorption occurs in
the acidic medium of the stomach, in which case hydrolysis only begins in the blood. If the
complexes first reach lower sections of the intestines they will be more extensively dissociated
because of the alkaline medium that prevails there. It will be possible to follow the resorption of
these compounds with the help of the isotopes 18F and 31Si.
d) Inhibition of AChE by Complexed Fluorides

46
Using the example of the inhibition of AChE we pursued the question of whether
complexed fluorides inhibit an enzyme more strongly than the fluoride amounts contained
within them if all the fluoride was in ionized form. If this is the case, and if the existence of
such compounds in the organism can be supported or even proven, then vagotonic fluoride
effects in a physiologically justifiable concentration range might possibly be understood in this
way.
We therefore studied the inhibitory effect of the complexes dealt with earlier using
AChE from human erythrocytes, PChE from human serum, and purified AChE from bovine
erythrocytes, obtainable commercially. We were initially interested in the dependence of the
inhibition on the concentration of the complexes and then, with the help of the remaining
processes discussed in section III,A,2, tried to make statements about the inhibition kinetics.
Hexafluorosilicate
First we investigated the inhibition by hexafluorosilicate of AChE from bovine
erythrocytes (Serva), AChE from human erythrocytes (using intact cells), and PChE from
human serum (using non-purified serum). The results are presented in figure 22. The inhibition
of PChE again depicts a non-monotonic course (see figure 9).
Figure 22 – Cholinesterase Inhibition as a Function of Hexafluorosilicate Concentration

47
1. Purified bovine erythrocyte AChE
2. AChE from human erythrocytes in Ringer's solution at pH 7.4;
AChE concentration 0.72 x 10⁻² M; inhibitor MgSiF6.
3. PChE from human serum; controlled variables otherwise as in 2.
To study whether the kinetics are homogeneous within the concentration range used in the
experiment, we plotted (vo/v)-1 against the concentration of inhibitor. The results are presented
in Figure 23. In the initial section the lines run linearly. Curve 2 has a critical start value and
therefore does not come out of the origin. A certain initial concentration of inhibitor is therefore
necessary for inhibition to begin. We could make this observation in all analogous
investigations of intact erythrocytes in a Ringer's solution.

48
Figure 23 - Dependence of (vo/v) -1 on the Concentration of Inhibitor.
(See Figure 22 for a legend for the curves)
In contrast to the analogous curves with NaF as the inhibitor (figure 10), these curves
leave the linear domain above a certain concentration, and thereby also leave the domain of
validity of equations 16-18 for n=1. In order to determine if a change occurs in the order of the
complex building reactions between enzyme and inhibitor within the concentration range of the
experiment we plotted the coordinates from figure 23 in double logarithmic form. According to
equations 19-21, sections of straight line should arise if the number of inhibitor binding regions

49
in the enzyme is constant within the concentration range of the experiment. The slope of these
lines should be a measure of the number of binding regions.
Figure 24 – Log-Log Plot of (vo/v) -1 vs. the Concentration of Inhibitor.
In the case of the purified enzyme (1), two straight lines can be drawn to approximate
the course of the curve. The SiF62- concentration at the bending point is 1.43 x 10⁻³ M. The
slopes have the following values:
in the region of lower concentration: n=0.81
in the region of higher concentration: n=1.23

50
According to these values, the number of binding sites spontaneously increased at the given
concentration.
Curves 2 and 3, which are derived from measurements of human erythrocytes and
serum, are curved across their entire length. One possibility is that the number of binding sites
on the enzyme is constantly changing, which would mean that in these functional groups, which
are frequently represented in the large protein molecule, accumulation occurs in a non-specific
way. The other possibility is that the relatively small buffering capacity of the Ringer's solution
does not hold its ground against the hydrolysis of the complex, so that the pH shifts, which
leads to an increase in the inhibitory capacity of the fluoride ions that arose from hydrolysis,
since the formation of free HF would increase. A clear kink in the curves, at least in the case of
the PChE from serum, is nonetheless visible here as well. Apparently, when a certain
concentration of hexafluorosilicate (that is to say its partially hydrolyzed product) is reached,
the form of the enzyme binding changes. This change blocks substrate binding. To uncover the
nature of this binding we investigated the dependence of inhibition on the concentration of
substrate in a double reciprocal plot.
Figure 25 - Lineweaver-Burk Diagram of the AChE-ACh System in a Phosphate-Citrate Buffer
at pH 7.7.
1. AChE-ACh
2. AChE-ACh + 0.71 x 10⁻³ M Na2SiF6

51
3. AChE-ACh + 1.42 x 10⁻³ M Na2SiF6
According to this figure, the inhibition is non-competitive. Using equation 8 we can
calculate the inhibitor-constant to be: KI = (1.82 +/- 0.06) x 10-3 M. The next figure shows the
same plot with human serum.
Figure 26 - Lineweaver-Burk Diagram of PChE-ACh system in Veronal/HCL Buffer, pH 7.4
1. PChE-ACh [not inhibited]
2. PChE-ACh + 0.2 x 10⁻³ M MgSiF6
3. PChE-ACh + 1 x 10⁻³ M MgSiF6

52
The course of the inhibition is mixed-competitive. In this case the inhibitor constant
derived from equation 11 is: KI = (1.53 +/- 0.07) x 10-3M. The kinks in curves 1 and 2 after
1/[S] = 3.25 or [S] = 0.31 x 10⁻³ M are particularly conspicuous. This situation probably again
arises from the individual enzymes' differing affinities for the substrate. The linear course of
curve 3 might be due to the components that caused a kink in the two lower curves already
being completely inhibited at this concentration of inhibitor. Only inhibitor concentrations of
[ACh] > 0.31 x 10⁻³ M were used to calculate the inhibitor constants. These "constants" are,
however, not real dissociation constants, but rather a cumulative value. One can only use them
to describe an inhibitory effect of a MgSiF6 solution on PchE, based on equation 15.
The mixed competitive characteristic stems from the fact that the F ions that were freed
during the partial hydrolysis of SiF62- cause a competitive inhibition of HF, with which they are
in equilibrium. Meanwhile, the residual complex causes a non-competitive inhibition. That this
observation did not appear in the measurement represented in Figure 25 is in and of itself
astonishing. It might be because the inhibitory effect of free fluoride on the PChE is of greater
importance in relation to the Si-complex than in the case of AChE from bovine erythrocytes,
where the inhibitory effect of the residual complex covers that of the free F-.
We made a very interesting observation when we simultaneously added the complex
from aqueous solution (in which the hydrolysis runs distinctly more slowly due to the low pH
level that develops) and the substrate to the buffered enzyme solution. At this moment the
hydrolysis must approach a constant end-value in a manner analogous to that depicted in figure
16. One can, however, assume that the solution will become saturated more quickly because the
complex is already in solution, while in the other case it would first have to dissolve. We
otherwise ran the measurement as described for figure 26.
Figure 27 - Lineweaver-Burk Diagram of the AChE-ACh System with the Addition of MgSiF6

53
1. AChE-ACh
2. AChE-ACh + 2 x 10⁻⁴ M MgSiF6
3. AChE-ACh + 10-3 M MgSiF6
The inhibition is competitive and unusually strong. The inhibitor constant has a value of
KI = 2.9 x 10⁻⁵ M and is thereby 52 times smaller than for the measurement given in figure 25,
in which the Na2SiF6 solution was added a half hour before the substrate was added. The
difference surely can not be solely explained by the use of different cations (Na+ and Mg2+
respectively) or different buffers (citrate-phosphate buffer - pH 7.7 and Veronal/HCl buffer - pH
7.4 respectively). Apparently there were ions present shortly after initiation of hydrolysis that
are highly active with regard to the AChE and can compete with the substrate at the active site
of the enzyme. Whereas after some time passes, during which an aging of the hydrolysis
product begins, a form develops, perhaps through chain elongation, that binds to the enzyme
outside of the active site. The inhibition capacity simultaneously diminishes significantly.
We must now also take into account that the enzymatic inhibitions, as they are
represented in figure 22, consist of two factors, one of which is triggered by free F- (which acts
by way of HF), and the other of which arises from the residual complex. Since we have
measured the degree of hydrolysis [dissociation] of SiF62- at pH 7.4 (see figures 16 and 17) and

54
also know the inhibition by fluoride of active ACh enzymes in human blood at pH 7.4 (see
figure 9) we can, through subtraction, determine the portion produced by the residual
complexes. This is shown in figures 28 and 29. The lower curves correspond to the portion of
the total inhibition represented by the residual complexes. We used a middle level of hydrolysis
of α = 0.6 as a basis.
Figure 28. Human Erythrocyte AChE Inhibition Due to MgSiF6 in Ringer’s Solution
(Total and Fraction Assigned to Residual Complex)
1. Total Inhibition of human erythrocyte AChE by fluosilicate in a Ringer's Solution
2. Difference curve after subtracting the portion inhibited by F-.

55
Figure 29. Human Serum AChE Inhibition Due to MgSiF6 in Ringer’s Solution
(Total and Fraction Assigned to Residual Complex)
1. Total inhibition of human serum PChE by fluosilicate in a Ringer’s Solution.
2. Difference curve after subtracting the portion inhibited by F-.
One can recognize that the inhibitory effect of a [SiF6]2- solution is stronger than the
corresponding amount of free F- that it releases. In the case of AChE the total inhibition by the
complex is nearly twice as large as that of the free fluoride ions. In the case of PChE the F ions
represent the larger portion; however, here too the residual complex accounts for a significant
portion of the total inhibition.
Inhibition of AChE by Additional Fluoride Complexes
In order to discover if other fluoride complexes could inhibit AChE and if there is a
relationship to the size as well as the charge of the complexes, we studied the effects of the

56
following complexes: BF4-, AlF6
3-, GeF62-, and PF6
-. We described the hydrolytic behavior of
these complexes in the previous chapter.
Hexafluorogermanate
The dissociation level of these compounds in veronal/HCl buffer at pH 7.4 was α =
0.83, which is exactly equivalent to five fluoride ions splitting from the complex. When we
performed the inhibition tests with AChE from human erythrocytes in Ringer's solution we
observed something that was unique to this complex. Since the buffering capacity of the
Ringer's solution was not sufficient to counteract the H+ ions set free by the hydrolysis, the pH
value shifted into the acidic region. This shift should, according to figure 12, result in a decrease
of the self-saponification rate of the ACh, since this ester is saponified from OH- through a
catalytic effect. We, however, observed the opposite. Despite a decrease in the OH-
concentration, the saponification rate increased with rising GeF62- in the absence of enzyme.
Figure 30 - Self Saponification Rate of ACh as a Function of GeF62- Concentration and the pH
Value in Ringer's Solution.

57
Reaction time = 0.5 hours.
The increase in the self saponification rate of the ACh could be brought about by the
catalytic effect of a germanium complex. GeF62- that is incompletely hydrolyzed in a more
acidic medium. Separated F- ions are not replaced by OH-, so that the end product of the
hydrolysis is GeF4 in this case.
GeF62 − + 2H+ →
← H2GeF6
→ ←
GeF4 + 2HF
Because of the two unoccupied d-orbitals, this compound has the characteristics of a strong
"Lewis acid", which can catalyze saponification reactions that run according to a SN2
mechanism through its polarizing effect. In this case it exerts an "electron pull" on the carbonyl
oxygen of the ACh and thereby strengthens the positive partial charge on the C atom. The
following schematic gives an overview of the probable course of the reaction:

58
The positive carbon reacts out of this transition state upon addition of an H2O molecule! An
intra-molecular rearrangement of the bonds then leads to the products of reaction, choline and
acetic acid, whereby the catalyst is reformed.
Because of the pH shift that arose when K2GeF6 dissolved in Ringer's solution, we could
not study the effect of this substance on the AChE of intact erythrocytes. We therefore used
PChE from human serum in a phosphate-citrate buffer. The next figure shows the course of the
enzymatic inhibition as well as the difference curve, which we derived by subtracting the F-
portion.
Figure 31. Human Serum PchE Inhibition by K2GeF6 in Phosphate-citrate Buffer

59
1. Total. Inhibition of the PChE of Human Serum by K2GeF6.
2. The Difference Curve after Subtracting the F- Portion .
As one can see, the inhibition is predominantly caused by the fluoride, which means that in this
case the residual complex is hardly in a position to cause an enzymatic inhibition.
Remaining Complexes
All the other complexes, BF4-, PF6
-, and AlF63-, only inhibit the enzymes as much as the
proportion of fluoride ions released by their hydrolysis. This means that only the bivalent
representatives of the fluoride complexes can cause an inhibition while the inhibition strongly
decreases upon transition from SiF62- to GeF6
2-.
The effect of fluoride on the cholinesterases can therefore be increased when fluoride is
used in a Si complex (e.g. as MgSiF6) instead of in ionized form (e.g. as NaF). The [SiF6] 2- ion
is particularly effective when it is not hydrolyzed until it reaches the place where it acts, since
apparently reactive intermediate products form that can cause a competitive inhibition of the
AChE. This can be the case when the substance was previously absorbed in the stomach, where
hydrolysis does not take place because of the acidic medium that is predominant there. But the
fact that the remaining fluoride complexes do not display such an effect does not mean that they

60
are of no biological importance. Especially in the case of AlF63-, which is widespread in nature,
comprehensive studies of its effects on many possible biological processes should be carried
out. This would probably contribute to an understanding that the role of fluoride in the nature of
organic life is not limited to just the effectiveness of free fluoride ions.
B. Effect of Fluoride on the Permeability of the Erythrocyte Membranes forNa+, K+, Ca2+, F-, HPO4
2-, and Glucose
Exerting an influence on the permeability for the cations and anions at the cell
membrane always has effects on the function of the effected cells. The effect can either support
or hinder their cellular function. In the case of nerve cells, for example, a depolarizing effect,
which is the result of affecting the (Na+-K+) permeability of the membrane, can increase the
excitability of the cell to a certain extent when the resting potential moves closer to the
threshold potential without exceeding it. If the latter arises it leads to a constant depolarization
and thereby un-excitability. The distribution of the (Na+-K+) ions is especially important
because the polarization of the cell is the result of an unequal distribution of these ions between
the intra- and extracellular spaces. We therefore tried, with the help of the radioactive isotopes
Na-24 and K-42, to study the influence of the smallest F concentrations possible on the
distribution of these ions across the cell membrane. The erythrocytes served as a model for the
large number of other cells on which studies can only be carried out with a considerably larger
experimental effort.
The separation of the (Na+-K+) ions at the membrane is an entropy reducing process.
The necessary energy is taken from the splitting of ATP. SEN and POST (30) found that per
split Mol of ATP, 3 Mol of Na+ are exported, and 2 Mol K+ are imported. The cell in turn
extracts the ATP from glycolysis (Embden-Meyerhoff degradation) as well as the following
respiratory chains. Erythrocytes are, however, because of missing sub-cellular particles, only
capable of glycolysis. Every effect on the metabolism of ATP can therefore also have effects on
active transport. Such an effect arises, for example
a) with an increase in the F- concentration (21)
b) with an increase in the Ca2+ concentration (31)
c) with a decrease in the Mg concentration
d) with a decrease in the glucose concentration
e) with a decrease in the potassium concentration (32)
f) with an increase in the sodium concentration (32)
Due to this variety of mechanisms one must study the effects of fluoride on as many
parameters of the cellular medium as possible, whereby one must take great pains to match the

61
remaining controlled variables as closely as possible to the natural conditions of the cell. We
therefore studied the effect of fluoride on the variables listed above.
Description of the Isotopes Used
We carried out all subsequent studies with the help of radioactively labeled substances.
The overwhelming portion of the tracers we used are commercially available (from Amersham-
Buchler, Braunschweig). The isotopes 18F and 31Si are, because of their short life spans, not sold.
We obtained the 18F in cooperation with the physics institute at the University of Hamburg
(Prof. H. Neuert’s study group kindly took charge of 18F for us) while we produced the 31Si with
the help of our institute's neutron generator. For now we could only study the production of 31Si
from which we developed the basis for further studies (eg, resorption of hexafluorosilicates).
The 18F was so far only twice available to us, because of which only a few orienting preliminary
experiments could be carried out with it. In the following table we give an overview of the most
important characteristics of the isotopes that were used.
Table 3. Radio-Isotopes Under Study
Isotope Half-Life Type of Radiation Max Energy
MeV
Production Process
14C 5730 years β- 0.156 14N(n,p) 14C18F 1.83 hours β+
γ0.65
0.51
16O(3He, p) 18F
24Na 15.5 hours β-
γ1.39
2.76
1.38
23 Na(n,γ) 24Na
31Si 2.62 hours β-
γ1.48
1.26
31P(n,p) 31Si
32P 14.3 days β- 1.74 31P(n,γ) 32P42K 12.4 hours β-
γ3.58; 2.04
1.51; 0.32
41K(n,γ) 42K
45Ca 165 days β- 0.25 44Ca(n,γ) 45Ca
Production of 31Si
62
Since we saw from the example of AChE that silicon compounds could be of biological
importance, and since Si, like F, is probably one of the essential elements (daily release in the
urine around 10mg), we undertook the task of developing a tracer method that would allow us
to follow the path of Si in the body. The processes involved in resorption of SiF62- were of
particular interest to us. Since radioactive isotopes of this element are not commercially sold,
we developed a method to obtain carrier-free 31Si. Using our institute's neutron generator, which
generates neutrons with an energy of 10-14 MeV at a maximum flow of 109 particles/sec and
cm2, we exposed the purest red phosphorus to the neutron beam for 15 hours. An analysis of the
γ-spectrum of the specimen showed that only 28Al (half-life 2.31 min.) and 31Si had formed.
31P(n,p) 31Si σ = 0.077b
31P(n, α) 28Al σ = 0.15 b
The 28Al isotope did not, however, disrupt the experiment because of its relatively short half-life
in comparison to 31Si. The following decay curve was derived by recording from a piece of the
activated specimen in the liquid scintillation counter.
Figure 32 - Decay Curve of a Phosphorus Specimen After 15 Hours of Activation

63
The mathematical expression for the curve in figure 32 forms the equation for the radioactive
decay. In logarithmic form it reads:
tNN o •lnln −= (equation 28)
The following relationship develops between the decay constant, which is identical to the slope
of the line here, and the half-life t1/2:
/2ln2/1 = (equation 29)
By inserting the value for the slope of the line from figure 32 one derives the half life as:
h62.22/1 =
This value agrees exactly with the half life for 31Si (see table 3), which is an additional proof
that only this radioactive isotope is present. Next we carried out a series of experiments to
separate the red phosphorus from the carrier. We would like to briefly describe two of these
experiments.
1.) We agitated a specimen of the activated phosphorus with 30% hydrofluoric acid. The
Si, which due to the high degree of dispersion could be oxidized to SiO2 using the
oxygen in the air, was supposed to react with the HF.
SiO2 + 6HF → H2SiF6 + 2H2O

64
The hexafluorosilicic acid thereby went into solution. After a reaction time of one hour we
separated the precipitates from the solution and determined the radioactivity in both the
precipitate and the solution. Result: 15.5% of the total radioactivity was found in the solution.
2.) We agitated another specimen together with a 1% solution of MgSiF6 in water.
Result: After one hour 67% of the 31Si had gone into solution. So, a relatively fast exchange
takes place on the phosphate carrier between the stable 30Si and the radioactive 31Si. This is,
therefore, a very convenient method for separating the 31Si from the carrier, whereby a labeled
SiF62- solution simultaneously forms and can be directly implemented in further experiments.
Unfortunately, the activities that can be derived in this way are too limited for many
studies on biological systems (especially for studies on living animals). For this reason, in
further studies we will have to rely on the production of this isotope from 30Si (over n, γ
reaction) in the reactor. The derived radioactivities (around 5 µCi) are, however, sufficient for
measuring the permeability characteristics of fluorosilicate complexes of various biological
membranes.
2. Presentation of the Permeability Experiments
We next carried out model experiments in which, with regard to the material being
examined, we limited ourselves to red blood cells because red blood cells are very easy to
obtain and require relatively small experimental effort to handle. If, for example, one wants to
track the distribution of a radioactive material between serum and erythrocytes, one lets the test
substance act on fresh whole blood, to which a material to prevent coagulation must be added
during extraction, and afterwards separates the cells from the serum by centrifugation. After
centrifuging one determines the radioactivity in both phases. One derives the distribution
gradient by examining the volumetric ratio of the two phases.
Of course the findings derived from these cells cannot simply be transferred to other cell
systems without due consideration. Since the underlying principles for these processes are,
however, the same throughout the body, valuable implications can be derived if, for example,
one considers the function of the active transport of Na+ and K+ as well as the influence of
fluoride on these processes. (Na+-K+) activated ATPases, for example, which are localized in the
cell membranes and are tightly coupled with the cation transport, can not be distinguished from
each other, no matter from which organ they originated(32). The same is true, although to a
lesser extent, for the enzymes of the glycolysis chain.

65
The erythrocytes' main assignment is the transport of O2 and CO2 as well as the
stabilization of the blood pH associated with this transport. Erythrocytes contain no sub cellular
particles, but therefore large amounts of hemoglobin. They derive energy for active cation
transport from glycolysis. The pentose-phosphate cycle supplies the cell with the redox catalyst
NADPH.
In terms of diffusion of substances through the cell membranes, we distinguish between
passive and facilitated diffusion as well as active transport. Na+, K+, Ca2+, and Mg2+ fall into the
latter category with certainty, glucose into the middle one. We first tried to determine the
concentration range in which an effect of fluoride on the diffusion processes is noticeable.
a. Potassium Permeability
The potassium content of the erythrocytes is around 10 times as large as that of the
serum. The permeability of the membrane for K+ is, however, small, but nonetheless clearly
present. If one supercools the erythrocytes, a potassium equalization occurs between the cell and
the serum, since the active transport mechanisms are inhibited. If the cells are afterwards
warmed back to 370C the original concentration gradient is reestablished. We made use of this
behavior when labeling the erythrocytes with 42K. First we produced a 42K labeled Ringer's
solution, which consisted of the following:
NaCl 0.9 g
CaCl2 • 4H2O 39.6 mg
NaHCO3 50 mg
Glucose 50 mg
MgCl2 5.4 mg
KCl 19.9 mg ~ 50µCi
_________________________________
double-distilled water 1,000ml
Next we withdrew blood from a lightly blocked arm vein (addition of 10% isotonic citrate
solution) and separated the cells and the serum by centrifugation. After removing the serum and
the leukocyte layer, which lies on the erythrocytes as a thin film, we washed the cells three
times with isotonic NaCl solution and then suspended them in Ringer's solution (as above,
however without 42K). The proportion of the cellular volume (hematocrit value) was now
40.2%.

66
We mixed 0.5ml of the suspension with 0.5ml of the radioactive Ringer's solution in each
of 10 test tubes. The specimens were then stored for half an hour at 2o C. After that they warmed
at 37o C, again for half an hour, during which time the re-exchange of K+ that had escaped in the
cold was supposed to occur. We freed the cells treated in this way by centrifuging and washing
two times to release the bound Ringer's solution, which we then replaced with an equal amount
of non-labeled solution.
Next we added two additional aliquots of 0.1ml of the solution and 0.1ml NaF solution to
each of the remaining specimens, so that the final concentration became 5 x 10⁻⁵ – 10-2 M. After
the specimens were held for half an hour longer at 37o C, we extracted 0.25ml of supernatant
from each after centrifugation, and determined the radioactivity in the liquid scintillation
counter on the basis of "Cerenkov radiation" We hemolyzed one of the fluoride free specimens
before the extraction by quickly dipping it in liquid oxygen in order to derive a value for the
saturation after complete equalization of the 42K. The following figure reproduces the course of
the change in the activity of the solution as a function of the F- concentration.
Figure 33. 42K Outflow From Erythrocytes as a Function of the NaF Concentration.

67
Reaction time 0.5 hours.
No effect can yet be observed at concentrations of less than 10-4M NaF. If the peak at 2.5
x 10-4M NaF is real or is only based on an error of measurement can not be determined from
these data. K-42 concentration increases linearly between 0.5 and 5 x 10⁻³M NaF, and then
slowly changes over into saturation. 87% saturation is reached at 10-2M NaF. So the K+
concentration of the cell begins to diminish at F- concentrations above 10-4 = 1.9 mg F/l. One
can therefore assume that an increase in the flow of potassium out of the cell is possible at the
upper boundaries of the physiological region. The reason for the fluoride dependent K+ efflux
can not be determined from this measurement.
b. Calcium Permeability
Erythrocytes have a relatively small Ca2+ concentration in comparison to the serum.
According to ROMERO and WHITTAM(31), Ca2+ takes on a regulatory role in the active
transport of Na+ and K+. The Ca2+ is itself supposedly "pumped" out of the cell by an ATP

68
dependent "Ca-pump". In the authors' opinion, fluoride can only influence the K+-Na+
permeability in the presence of Ca2+. Evidence has suggested that the calcium ions cause an
inhibition of the (Na+-K+) activated ATPase by way of a competitive reaction with magnesium
ions. (33) We again asked ourselves at which fluoride concentrations the intra-cellular
concentration begins to change.
We again used a suspension of erythrocytes in Ringer's solution, as described for the
potassium. We doped a series of specimens of different NaF concentrations with an incalculable
amount of 45Ca (as CaCl2) and incubated them for 18 hours at 370C. The 45Ca thereby distributed
itself evenly over the intra- and extra-cellular spaces in correspondence with the natural Ca2+
gradient. When the time was up we separated the cells by centrifugation, washed them once
with Ringer's solution, and after hemolysis determined the radioactivity of the cells using the
liquid scintillation counter. To prevent the disappearance of color we precipitated the
hemoglobin with trichloroacetic acid, whereby we assured ourselves that the precipitate did not
contain any Ca-45, which was the case after rinsing once with 10% trichloroacetic acid. Figure
34 plots the 45Ca content of the cells as a function of the NaF concentration.
Figure 34 - Intra-cellular 45Ca Concentration as a Function of the NaF Concentration.
Reaction time 18 hours

69
The plot shows great similarity to the respective potassium curve. Development of a
maximum can again be observed at 5 x 10⁻⁴M NaF, which is, however, significantly more
distinct in this case than with the potassium. After 2.5 x 10⁻³M NaF the Ca2+ concentration in the
cell linearly approaches the fluoride concentration. This behavior speaks for a direct relationship
between the Ca2+ and the F- concentrations in the cell.
Although the solubility product of CaF2 is exceeded at F- and Ca2+ concentrations > 2 x
10-4M, precipitate formation most likely does not occur immediately, since a large proportion of
the Ca2+ present is bound to proteins and other complex forming substances. On the other hand,
it is highly conceivable that the Ca2+ is present with one valence bound to an organic molecule
and the other bound to F-. This binding pattern would also explain the linear relationship
between of the Ca2+ and F- concentrations.
c. Sodium Permeability
The cell membranes of most animal organisms, as well as those of many plants, have the
ability to actively transport Na+. The movement of Na+ plays a role in, among others, excitation
of nerve cells, maintenance of the cell potential, protection of erythrocytes from hemolysis,
secretion in glandular cells, and in the kidney. Human erythrocytes build up and maintain
concentration gradients of 1:15 (between cell and serum). The corresponding value for
potassium is 30:1. The numbers relate to the volume claimed by water. The membrane
permeability for Na+ is smaller than for K+, which is perhaps due to the larger ionic radius of
Na+ when including the water of hydration.
Thanks to the numerous studies in this area, the processes surrounding the active
transport of Na+ have already been largely elucidated. One can find an overview in
SCHONER(32). The effect of fluoride on the Na+ transport has already been studied as well.
OPIT(22) found about a 50% inhibition of the (Na+-K+) activated ATPase, when he added 4 x
10-3M NaF. LEPKE and PASSOW(23) carried out measurement on so called "erythrocyte
ghosts" and found that a strong K+ efflux elicited by F- is accompanied by only a minimal Na+
influx. Unfortunately the F- concentrations used by the authors were, at 4 x 10⁻²M, much too
high to be able to draw conclusions about the effects of physiological F- concentrations. We
therefore carried out experiments at significantly smaller F concentrations. To be precise, we
studied the effect of different F- concentrations on the Na+ exchange at the cell membrane after
different times. We prepared the specimens for this experiment in a manner analogous to the
calcium studies.

70
It became evident that the relations were completely different from those for K+ and Ca2+
permeability. Figure 35 plots the dependence of the Na+ influx as a function of the NaF
concentration, after three different times. The x-axis is measured in logarithmic units for the
sake of a better overview.
Figure 35 - 24Na Content of Erythrocyte as a Function of the NaF Concentration
After 1) 2 min. ; 2) 4 min ; 3) 15 min.
Those cells that were exposed to a NaF concentration of 10-4M contain the most Na-24
after 2 minutes. Saturation seems to be reached above 10-3M NaF. The 24Na concentration is
smaller after 4 minutes, which means that a retrograde transport of the 24Na that penetrated the
cell must have started. After 15 minutes the maximum permeability has shifted to 5 x 10⁻⁴M

71
NaF. In addition, the intra-cellular 24Na concentration has increased with respect to the shorter
times. To elucidate these processes further, we depicted the course of the 24Na concentration in
the cell as a function of the time, with varying NaF concentrations.
Figure 36 - Rate of 24Na Erythrocyte Labeling vs NaF Concentration

72
a) 0 M; b) 5 x 10⁻⁵ M; c) 10-4 M; d) 5 x 10⁻⁴ M; e) 10-3 M
When no fluoride is added, the 24Na concentration in the cell initially rises slowly until,
after 10 minutes, it flattens out at saturation. The course is about the same at 5 x 10⁻⁵M NaF,
however a start up time of 6 minutes is needed, after which saturation quickly follows. A very
strong influx of 24Na into the cell occurs at 10-4M NaF. The influx is apparently very rapid, since
a retrograde transport had already occurred after the shortest time that we could record (2 min.).
The course of this curve has a certain similarity to the movement of Na+ at nerve cells
after a period of stimulation, although the processes take place significantly faster there.
Unfortunately, at this point we cannot draw any conclusions about the rate of the Na+ influx. In
the case of the nerve cells, a strong Na+ influx is induced by the depolarizing effect of the ACh.
The influx stops after a very short time (1 msec.), after which the Na+ that has penetrated is
pumped back out with the help of a Na+ pump. When applied to this situation, this would mean
that the Na+ permeability temporarily greatly increases due to the effect of the F-, which was
simultaneously added with the 24Na. The cell would next have to compensate for this influx with

73
some counter measure and following that pump the Na+ that has penetrated in back out. Oddly
this "Na+-kick" decreases with rising F- concentration.
Of course the conclusions drawn here are highly hypothetical. Further and more
differentiated recordings in this area might yield more information. It is, however, interesting
that F- concentrations of 10-4M, and even lower, can exert a clear influence, which because of
the central importance of Na+ permeability could possibly also be brought into connection with
the observed vagotonic effects of F.
d. Fluoride Permeability
Of great importance for the permeability experiments is the question, at what rate and to
what extent does fluoride penetrate into the cells? We therefore determined the distribution
gradient of fluoride between the cell and the extra-cellular fluid with the help of the 18F tracer
method. The absolute F concentration was 10-4M. We also determined if an addition of ATP to
the Serum (10-3M) has an effect on the 18F distribution in a parallel experiment.
This time we used a somewhat altered procedure. We again withdrew fresh blood from
our own arm vein, whereby we again added 10% isotonic citrate solution. The 18F stock solution
in twice distilled water was then brought to isotonicity with the serum by adding the
corresponding amount of NaCl + NaF. The NaF concentration was thereby controlled in such a
way that an end concentration of 10-4M resulted after addition of the labeled solution to the
blood (in the ratio 1:10). The erythrocyte volume of these specimens was now 38%. The two
test tubes were placed in a thermoblock at 370C. We started the stopwatch after addition of the
labeled solution and, with the help of a glass capillary (∅ = 1mm), withdrew a blood specimen
of 20 µl at different times. We quickly melted off one end of the capillary over the pilot flame
of a Bunsen burner and centrifuged the specimen at 12,000 G with the help of a centrifuge from
the "Eppendorf-Microliter" system. Maximal separation possible between the cells and the
serum was thereby achieved within a matter of seconds.
The time was recorded at the beginning of centrifugation. With the help of a glass cutter
we now directly separated the erythrocytes and serum at the interfacial boundary and transferred
the tubules into separate measuring vessels made of polyethylene with a length of 5 cm and a
width of 2 mm. We stuck these through the lid of a test flask filled with Bray's solution, so that
the radioactive specimen was completely below the surface of the liquid. This was possible
because the γ radiation of the 18F that arises from the annihilation of the positrons penetrated the
wall on the inside of the vessel without difficulty and generated photons by way of mutual
exchange with the Bray's solution. The photons were counted by the instrument. The yield was,

74
however, greatly reduced with respect to the ß- radiation. The advantage of this method was that
the test flasks filled with Bray's solution could always be reused by replacing the inner plastic
tubule. In addition, the need for elaborate specimen preparation was avoided. We then
determined the distribution gradient α from the ratio of the volumetric share of the erythrocytes
and of the serum, which in each case was derived by measuring the appropriate column length
as well as the ratio of the radioactivity in the two phases.
=Impulse Rate of Erythrocytes • Volume of Serum
Impulse Rate of Serum • Volume of Erythrocytes
The results of the measurements are reproduced in the following table.
Table 4. Erythrocyte/Serum Distribution of 18F vs Reaction Time
Reaction Time
[minutes]
Distribution Gradient
[α]
4.75 0.55
10.5 0.50
20.0 0.47
32.5 0.47
40.5 0.47
63.0 0.56
Addition of 10-3M ATP
7.5 0.81
13.5 0.77
23.25 0.75
35.75 0.77
55.0 0.88
67.5 0.87
The 18F distribution between the serum and the cell was not dependent on time, which
means that the equilibration must have occurred before we started to record elapsed time. The F
concentration in the serum remains twice as large as in the erythrocytes. Adding ATP to the
serum raises the intra-cellular fluoride concentration. We can not yet cite a reason for this.
Perhaps, however, the Ca2+ complexing characteristics of the ATP play a roll. The observation
75
of the rapid exchange of fluoride at the erythrocyte membrane fits well with the observations of
sodium exchange, which was influenced by the fluoride within very short times.
e. Phosphate Uptake
The conditions are different for phosphate ion uptake than for the ions considered so far,
since the overwhelming proportion of the intra-cellular phosphate is present in organically
bound form. At the pH of blood (7.4) about 75% of the phosphate is present as HPO42- and
about 25% as H2PO4-. In addition to the procedural technique used so far to determine the
distribution gradient of the radioactive substances between the serum and the erythrocytes, we
used a new technique that allowed us to separate and identify the different labeled phosphate
compounds in the erythrocytes in one procedure. We will dispense with a detailed
representation of these studies at this point in order not to breakup the framework of this study.
Instead, we are giving an overview of the most important results.
First we added 32P phosphate to fresh blood with added citrate and after a certain time
separated the erythrocytes from the plasma. After hemolysis (dipping in liquid oxygen) we
subjected the solution to high tension electrophoresis. We used a paper strip of 1 m in length
and 15 cm in width soaked in a Veronal/HCl buffer of pH 8.6 for this procedure. The field
strength was 40 V/cm. After one hour we developed the electrophorogram with the help of our
radiochromatogram scanner. We could thereby separate eight radioactive phosphate compounds
and identify them with the help of reference preparations, which we produced in radioactively
labeled form through directed enzymatic conversion.
If one labels blood by adding 32P phosphate, inorganic phosphate can hardly be found in
the cell, even after a short time. Instead, one finds 32P ATP, 32P-2, 3-Diphosphoglycerate
(abbreviated 2.3-DPG), 32P fructose-1, 6-diphospate (abbreviated FDP), as well as at least four
additional glycolysis intermediates, however in smaller concentrations. The uptake of phosphate
by the erythrocytes is therefore closely coupled with the glycolysis, just as the glucose uptake
is. The radioactive phosphate distributes itself over all phosphate compounds, which are in
equilibrium with each other. Once saturation is complete, the radioactivity of the individual
substances is proportional to their absolute concentration. One can observe the dynamic of the
incorporation of P-32 phosphate into the compounds in reference by tracking the labeling of the
individual substances as a function of time.
In order to study the rate of phosphate exchange between the plasma and the cell we
next tracked the distribution gradient over function of time, whereby we simultaneously studied

76
the influence of different fluoride concentrations. We determined the distribution gradient α
according to the method indicated for 18F. We measured the radioactivity after precipitating the
protein with trichloroacetic acid in aqueous solution using the "Cerenkov radiation" of the 32P.
Figure 37 - Distribution Gradient of 32P Phosphate Between the Erythrocytes and the Plasma as
a Function of Time
1). No added fluoride; 2). with 5 x 10⁻⁵M NaF; 3). with 2.5 x 10⁻⁴M NaF
The figure shows the temporal plot of phosphate uptake. Curve 1 describes the course as
HEVESY(34) has already reported. Our measurements thereby agree quite well with his
findings. Curves 2 and 3 show the same course in the presence of fluoride in concentrations
that, at least in the case of curve 2, can still be described as physiological. One can recognize
that the accumulation of 32P in the cell, after a short start up period, rises almost linearly with
time. After two hours the intra-cellular concentration is about the same as the extra-cellular
concentration, however saturation is by no means reached yet. The concentrations of the
phosphate compounds, which are in equilibrium with inorganic phosphate, must therefore be
greater in the cell than in the plasma. Adding fluoride increases the phosphate uptake of the cell.
After 7.5 minutes, however, this curve approaches the curve without added fluoride and then a
stronger rise begins again. Based on the shape of this curve, the effect of the fluoride on the

77
phosphate uptake by the erythrocytes seems to occur in two steps. At the same time one
recognizes that even small fluoride concentrations elicit an influence, so that such an effect is
possibly also present in physiological conditions.
Next we studied the influence of fluoride on the established equilibrium during
phosphate saturation. To do this we let erythrocytes in Ringer's solution come into contact with32P phosphate for 18 hours. After this time we separated the cells out and determined their
radioactivity after hemolysis and precipitation of the protein with trichloroacetic acid.
Figure 38 - Erythrocyte Uptake of 32P vs NaF Concentration After 18 Hours
The phosphate uptake passes through a maximum at 2.5 x 10⁻³M NaF. Otherwise, there
are two opposing tendencies. At fluoride concentrations below 2.5 x 10⁻³M, the effects that elicit
an accumulation of phosphate in the cell dominate. At lower concentrations those effects that
counteract this accumulation are dominant. A comparison with our glycolysis experiments
shows that phosphate labeling decreases with the decrease in glycolysis activity of the cell. The
formation of marked ATP also diminishes above 2.5 x 10⁻³M. Perhaps the course of the curve

78
means that at small F- concentrations only those reactions that lead to a breakdown of organic
phosphate are initially inhibited, while the formative reactions are hardly influenced yet. Upon
further increase of the fluoride concentration these reactions are eventually also inhibited. Since
inorganic phosphate is not stored in the cell, the distribution gradient can in this case take on at
most a value of α = 1. With the help of the electrophoretic separation technique we could show
that the concentration of labeled phosphoglycerate passes through the same maximum. The
enzyme that further degrades these compounds is enolase, whose inhibition by fluoride
WARBURG(21) has already described. Existence of the Mg fluorophosphate complex that he
postulated could, however, until now not be directly proven.
Upon examination of the glycolysis rate as a function of the fluoride concentration we
found a stimulation of glycolysis at 2.5 x 10⁻⁴ M NaF. Inhibition began only above this
concentration and then increased continuously with rising F concentrations.

79
IV. Conclusion
According to a theory of Knappwost's, fluoride's protection against tooth decay relies on
a vagotonic influence on saliva quantity and quality. Therefore, we looked for signs of a
vagotonic mechanism for the effect of fluoride. On the basis of the inhibition of
acetylcholinesterase by fluoride we could show that this inhibition increases when the pH is
shifted towards a more acidic level (up to pH 6-6.5). Elucidating this state of affairs showed that
the HF molecule is the actual inhibitory agent. From this it could be deduced that in those areas
of the organism where such pH shifts occur, an inhibition of AChE is possible at physiological
F concentrations.
We could show that fluoride complexes of Al and Si are only partially hydrolyzed under
"quasi physiological" conditions, and that in the case of Si the "residual complexes" have an
inhibitory effect on AChE. The inhibitory capacity of fluoride could be increased this way by
using fluorosilicates, which appear in the inanimate realm of nature and probably also in the
human body. Even so called physiological fluoride concentrations could now trigger vagotonic
effects.
With the help of model experiments on human red blood cells we could study the
influence of fluoride on the permeability of erythrocyte membranes to electrolytes. We found
that the permeability for K+ and Ca2+ increases at fluoride concentrations over 10-4M. In the case
of Na+ permeability we could already detect an impact at 5 x 10⁻⁵ M NaF. A spontaneous influx
of Na+, which showed a certain similarity to the circumstances at nerve cells upon stimulation
by acetylcholine, occurred upon contact of erythrocytes with fluoride concentrations of 10-4 M.
The Na+ that had penetrated began to be transported back out of the cell after only two minutes.
The dependence of Na+ permeability on fluoride concentrations after a reaction time of 2-4
minutes showed a maximum permeability at 10-4 M NaF. The exchange of radioactive
phosphate at the erythrocyte membrane was also already affected at concentrations between 5 x
10-5 M and 10-4 M NaF. Phosphoglycerate accumulation and a decline in ATP synthesis only
developed above 2.5 x 10⁻³ M NaF.
With the help of radioactive fluoride (18F) we could show that fluoride exchange occurs
very quickly at the erythrocyte membranes. At fluoride concentrations of 2.5 x 10⁻⁴ M the cells
received half as much 18F as the serum.
Altogether these studies suggest that an effect of fluoride on the membrane permeability
for the aforementioned cations can already develop at physiological F concentrations. This is

80
especially true for sodium. If these studies can also be applied to other body cells (for example
nerve cells), it would mean that fluoride could, by way of a slight rise in the "leaking flow" of
K+ and especially Na+, affect the resting potential, and thereby the overall excitability, of the
cells.

81
V. Bibliography
(1) A. Knappwost: D.Z.Z. 23, (1968), 2, 116
(2) J.F. Mc.Clendon and J. Cohn-Gershon: Nucl. Med. 71 (1954) 1017
(3) H.Hayek and Newesely: Mh. Chem. 91, (1960), 249
(4) H. T. Dean et al.: Publ. Health Rep. (Washington), 56, (1941), 761
(5) T. S. B. Narasa Raju: Dissertation zur Erlangung des Doktorgrades des Fachbereich
Chemie der Universität Hamburg
(6) A. Knappwost: D.Z.Z. 7, (1952) 670
(7) F. J. Mc.Clure: J. Dent. Res. 29, (3), (1950), 315-319
(8) K. Yao and P. Groen: Forsyth Dent. Cent. Boston (1970)
(9) A. Knappwost: d.Z.Z. 7, (1952), 670
(10) S. E. Eriksson: Tanläk. T. Stockholm, 48, (1955), 303
(11) T. Lammers and H. Hafer: Biologie der Zahnkaries, Dr. A. Hüthig Verlag,
Heidelberg (1956)
(12) D. E. Wright and G.N. Jenkins: Brit. Dent. J. 96. 1. (1954) 30
(13) H. Tappeiner: Arch. I. exp. Path. u. Pharmakol. 25, 203
(14) Rein, Schneider: Einführung in die Physiologie des Menschen, 16. Aufl. Springer
Verlag, Berlin. Heidelberg. New York, 1970
(15) Y. Miyazaki, G. Ishakowa: Utzino, S., Medizinisch, zahnärztliche Forschungen über
Fluoride, Tokyo, 89-93 (1957)
(16) Rabouteau; cited by Tappeiner (13)
(17) Weddel: Ralys. Ber. 14, (1884), 206
(18) E. Heilbronn: Acta Scandinavia, 19, (1965), 1333
(19) R. M. Krupka: Mol. Pharmakol. 2, (6), (1966), 558
(20) W. Wilbrandt: Tr. Farady Soc. 33, (1937), 956
(21) O. Warburg and W. Christian: Nat. Wiss. 29, (1941) 590
(22) L. J. Opit: Bioch. Biophys. Acta, 120 (1966) 159
(23) S. Lepke and H. Passow: J. Physiol. 191, (1967), 39P
(24) W. Pilz: Z. analyt. Chem. 243, (1968), 587
(25) R. B. Barlow: Introduction to chemical Pharmakol. 2. Aufl. Methuen, London
(1964)
(26) A. H. Beckett: Ann. N. Y. Acad. Sci. 144, (1967), 675, 17
(27) H. U. Bergmeyer: Methoden der enzym. Analyse, Verlag Weinheim/Bergstraße
(1970) 2. Aufl. S. 802
(28) P. Marquardt and G. Vogg: Z. für pysiol. Chemie, 219, (1952), 143
(29) Bray: Anal. Biochem. 1 (1960), 279

82
(30) A. K. Sen and R. L. Post: J. biol. Chem. 239, (1964), 345
(31) P. J. Romero and R. Whittam: J. Physiol. 214(3), (1971), 481
(32) W. Schoner: Angew. Chem. 83, (1972), 947-955
(33) R. L. Post: Bioch. Biophys. Acta, 25, (1957), 119
(34) G. Hevesy: Advances in Radioisotope Research Vol. I, 494 Pergamon Press London
(1964)