the kidney & statin therapy: friend or foe? - pace-cme kidney & statin therapy: friend or...
TRANSCRIPT

The kidney & statin therapy: Friend or Foe?
Raul Santos, MD Sao Paulo Medical School
Sao Paolo, Brazil

The kidney & Statin Therapy: Friend or Foe?
Raul D. Santos MD, PhD
Lipid Clinic InCor University of São Paulo
Brazil
2

Disclosure
• Consulting and speakers honoraria : Merck, Astra Zeneca, ISIS-Genzyme, Novo-Nordisk, BMS, Biolab, Pfizer, Lilly, Boehringer-Ingelheim, Amgen, Aegerion & Sanofi

Summary: The kidney & statin therapy: Friend or Foe?
• Friend
– Kidney disease and
CVD
– Prevention of CVD and death
– Reduction of CKD progression?
• Foe
– Can cause renal
failure?
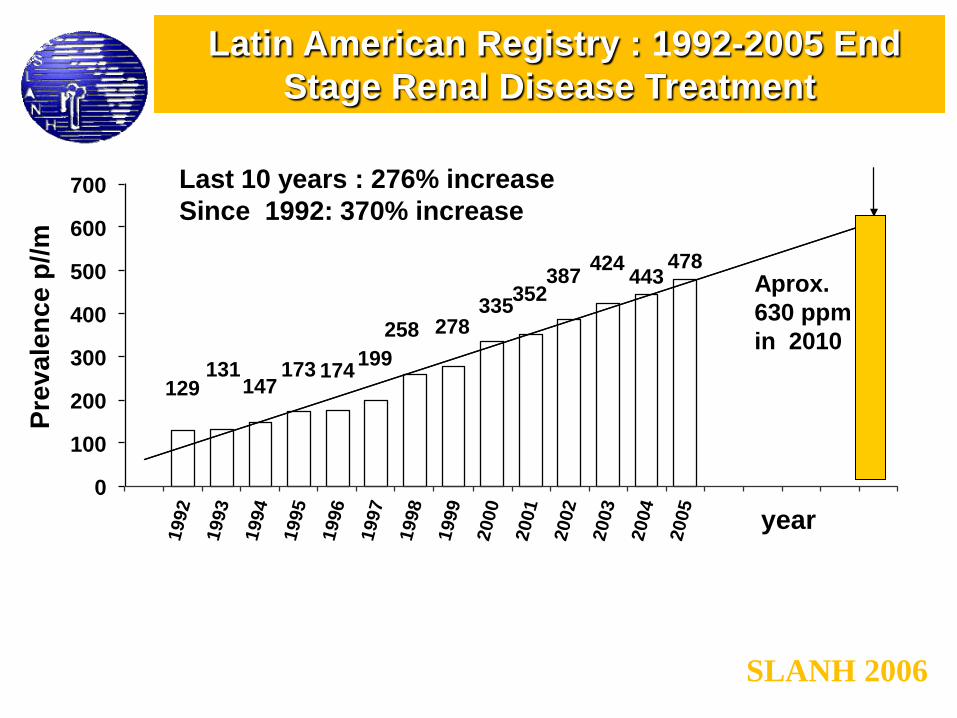
Latin American Registry : 1992-2005 End
Stage Renal Disease Treatment
SLANH 2006
129 131
147 173 174
199
258 278 335
352 387
424 443
478
0
100
200
300
400
500
600
700 1992
1993
1994
1995
1996
1997
1998
1999
2000
2001
2002
2003
2004
2005
Pre
va
len
ce p
//m
year
Last 10 years : 276% increase
Since 1992: 370% increase
Aprox.
630 ppm
in 2010

CKD Stages :
Stage Description GFR
(ml/min/1.73 m2)
1 Kidney Damage with
Normal or GFR 90
2 Kidney Damage with
Mild GFR 60-89
3 Moderate GFR 30-59
4 Severe GFR 15-29
5 Kidney Failure < 15 or Dialysis
* GFR estimated from serum creatinine using MDRD Study equation based on age, gender, race and calibration for serum
creatinine. For Stage 1 and 2, kidney damage estimated by spot albumin-to-creatinine ratio 17 mg/g in men or 25 mg/g in
women in two measurements.

Age-Standardized Rates of Death from Any Cause (Panel A) and Cardiovascular Events (Panel B),
According to the Estimated GFR among 1,120,295 Ambulatory Adults
Go A et al. NEJM 200; 351: 1296-305

Causes of death in renal failure patients : studies with statins
Lewis D et al. J Ren Care. 2010;36 Suppl 1:27-33

Clin J Am Soc Nephrol 6: 1456–1462, 2011

Friend: Can statins reduce CVD in subjects with CKD?

Wanner, C. et al. N Engl J Med 2005;353:238-248 Fellstrom et al. NEJM 2009;360:1395-407

Pro
po
rtio
nal
red
uct
ion
in
ath
ero
scle
roti
c ev
ent
rate
(9
5%
CI)
0%
5%
10%
15%
20%
25%
30% Statin vs control (21 trials)
Mean LDL cholesterol difference between treatment groups (mg/dL)
More vs Less (5 trials)
SHARP 32 mg/dL
0 20 40 10 30
SHARP 17% risk reduction
SHARP and CTT : Major atherosclerorotic events by LDL-C reduction
Lancet 2011; 377: 2181-2192

Summary of the effects of statin therapy on major
cardiovascular events stratified by kidney function.
Hou W et al. Eur Heart J 2013;34:1807-1817
Overall 23% reduction 18% per mmol/L
48 429 patients with CKD, including 6690 major
cardiovascular events and 6653 deaths.

Statins and cardiovascular outcomes in CKD according to
dialysis or not
Hou W et al. Eur Heart J 2013;34:1807-1817

Impact of Statin Treatment According to Renal Status
Hou W et al. Eur Heart J 2013;34:1807-1817

Friend: Can statins reduce renal function loss?

1
7 17
Effects of atorvastatin on kidney outcomes and cardiovascular disease in patients with diabetes
“A modest beneficial effect of atorvastatin on eGFR, particularly in those with albuminuria, was observed.
Atorvastatin did not influence albuminuria incidence. Atorvastatin was effective at decreasing CVD in those with and
without a moderately decreased eGFR and achieved a high absolute benefit.”
American Journal of Kidney Diseases 2009: 54: 810-819

This slide deck is intended for medical to medical communications and not for promotional use.
This slide deck is intended for medical to medical communications and not for promotional use.
Proportion of patients with decline or improvement from baseline eGFR:TNT
9.2%
37.8%
6.6%
45.6%
0%
10%
20%
30%
40%
50%
Atorvastatin 10mg Atorvastatin 80mg
eGFR improvement from
<60mL/min/1.73m2
eGFR decline from
≥60mL/min/1.73m2
P<0.0001
P<0.0001
% o
f p
atie
nts
with
ch
an
ge
in e
GF
R
(n = 3,324) (n = 3,225) (n = 1,505) (n = 1,602)
American Journal of Kidney Diseases 2009: 54: 810-819

Are all statins similar regarding renal function?

This slide deck is intended for medical to medical communications and not for promotional use.
This slide deck is intended for medical to medical communications and not for promotional use.
PLANET I: Prospective evaLuation of proteinuriA and reNal function in diabETic patients with progressive renal disease
Primary end point:
Change in urinary/creatinine ratio from
baseline to Week 52
Ongoing, report date unknown
Key secondary end points:
Assessment of relationship between renal
effects and lipid parameters from baseline to
weeks 26 and 52
Change in GFR from baseline to
weeks 26 and 52
Rosuvastatin 20mg
Atorvastatin 40mg
Rosuvastatin 10mg
Rosuvastatin 40mg
Atorvastatin 80mg
Weeks 0 4 52
353 patients
Type 1 or 2 diabetes
Mild hypercholesterolemia
Fasting LDL-C ≥90mg/dL
Moderate proteinuria
Receiving ACE inhibitor and/or
ARB treatment for >3 months Period 1 Period 2
de Zeeuw D. 2010European Renal Association-European Dialysis and Transplant Association Congress; June 27, 2010; Munich, Germany

This slide deck is intended for medical to medical communications and not for promotional use.
This slide deck is intended for medical to medical communications and not for promotional use.
Planet 1: change in eGFR
-2.73
-3.7
-5.46
-7.29
-10
-8
-6
-4
-2
0
Week 26 Week 52
RSV 10/10 RSV 20/40 ATV 40/80
*eGFR data not provided These results have not been published and have not been peer-reviewed
Ch
an
ge
in
eG
FR
(m
L/m
in)
Week 26 Week 52
Mean change in eGFR significantly different between RSV 20/40 and ATV 40/80 at Week 26 (P=0.04) and Week 52 (P=0.01)
P=0.03
P=0.0001
P=0.01
P=0.0002
NS NS
*
de Zeeuw D. 2010European Renal Association-European Dialysis and Transplant Association Congress; June 27, 2010; Munich, Germany

This slide deck is intended for medical to medical communications and not for promotional use.
This slide deck is intended for medical to medical communications and not for promotional use.
Planet II: prospective evaluation of proteinuria and renal function in non-
diabetic patients with progressive renal disease
Primary end point:
Change in urinary/creatinine ratio from
baseline to 52 weeks
Key secondary end points:
Assessment of relationship between renal
effects and lipid parameters from baseline to
26 and 52 weeks
Change in GFR from baseline to 26 and
52 weeks
Rosuvastatin 20mg
Atorvastatin 40mg
Rosuvastatin 10mg
Rosuvastatin 40mg
Atorvastatin 80mg
Weeks 0 4 52
237 patients
Mild hypercholesterolemia
Fasting LDL-C ≥90mg/dL
Moderate proteinuria
Receiving ACE inhibitor and/or
ARB treatment for >3 months
Period 1 Period 2
de Zeeuw D. 2010European Renal Association-European Dialysis and Transplant Association Congress; June 27, 2010; Munich, Germany

This slide deck is intended for medical to medical communications and not for promotional use.
This slide deck is intended for medical to medical communications and not for promotional use.
Planet 2: change in eGFR
-4
-3
-2
-1
0
1
2
Week 26 Week 52
RSV 10/10 RSV 20/40 ATV 40/80
*P 0.03, †P=NS vs. baseline
Cha
ng
e in
eG
FR
(m
L/m
in)
Week 26 Week 52
†NS
1.39
-3.41*
-1.61
†NS
-2.71
†NS -3.30*
-1.74
†NS
de Zeeuw D. 2010European Renal Association-European Dialysis and Transplant Association Congress; June 27, 2010; Munich, Germany

Foe: Can statins damage the kidney?

CTT meta-analysis: muscle damage with
statins
• Myopathy: 0.5/1,000
• Rhabdomyolysis :0.1/1,000
Lancet 2012;380:581-590

High dose statins increased hospitalization for acute renal damage in
non-CKD patients: retrospective analysis
Dormuth C R et al. BMJ 2013;346:bmj.f880
Admission within 120 days
and persists for 2 years
OR 1.34 ( 1.25 to 1.43)
NNH= 1/1,700
N=2,008,003 Admission Low dose: 1-4/1,000

Dormuth C R et al. BMJ 2013;346:bmj.f880
High dose statins did not increase hospitalization for acute renal
damage in CKD patients: retrospective analysis
HR 1.10 (0.99 to 1.23)
n=59,000 Admission : Low dose: 23-45/1,000

Adverse events of statin reported in the trials with chronic
kidney disease.
Hou W et al. Eur Heart J 2013;34:1807-1817

Conclusions: Friend of foe?
• CKD
– is increasing in Latin America
– raises CVD risk
• Statins reduce CVD and mortality in CKD
– Benefit proportional do LDL-C lowering
– Less benefit in those with more advanced disease
• Statins are safe in CKD
• Improvement in GFR (Atorva trials)