the keypoint report - · pdf fileeastern ma/greater boston retail ... redevelopment has much...
TRANSCRIPT

Property ManagementRetail Leasing & Tenant RepresentationInvestment SalesConstructionResearchFinancing & Consulting
Eastern MA/Greater Boston Retail Real Estate Trends & Analysis 2017
KeyPoint Partners, LLCOne Burlington Woods Drive, Burlington, MA 01803Tel 781.273.5555 Fax 781.272.8408
The KeyPoint Report
KeyPointPartners.com/Retail-Reports
©2017 KeyPoint Partners, LLC, Burlington, MA
KeyPoint Partners provides retail research consulting services ranging from preliminary desktop assessments to comprehensive evaluations which integrate fi eld investigation and quantitative analysis for a variety of retail location and store types. The heart of our research superiority is our powerful, proprietary GRIID™. Is there a custom retail market research project we can do for you? Call Bob Sheehan, Vice President of Research at 781.418.6248, or email him at [email protected].
Custom Retail Market Research
Methodology: The data for this study includes all public retail space in the study area except for a few exclusions discussed below. The information in our data-
base has been compiled from a variety of sources. A member of KeyPoint Partners’ research staff has visited each store/shopping center in order to verify and/
or acquire the necessary information. The area for each space is obtained from sources deemed reliable, such as the owner or leasing agent, is paced off by our
researchers or otherwise measured. Retail categories and SIC Codes are obtained from a leading business database, InfoUSA, when available. Each entry is fi eld
verifi ed or determined by our research staff. In general, public retail space is characterized as all space currently, or most recently, utilized in selling or renting retail
goods and/or services to the public. There are no size restrictions for stores or shopping centers. Certain retail classifi cations are excluded, including automobile
dealerships, gasoline service stations, automobile repair shops and quasi-retail services, such as stock brokers, real estate agents, insurance agents, etc., unless
such establishments are located in shopping centers containing typical retail tenants. In some cases wholesale or quasi-retail establishments have been included
in the database if information from InfoUSA or our fi eld research indicates that goods and/or services are being offered to the public from the location. Some
establishments available to the public but typically serving primarily the needs of other users of a facility, such as a cafeteria in an offi ce building or a beauty salon
located inside a hotel, may also be excluded. Demographic information used in this study was provided by Scan/US.
The KeyPoint Report
KeyPoint Reports are also available for:Southern New Hampshire & Greater Hartford, Connecticut
Read the daily retail news atKeyPoint Retail RoundUp
Read and subscribe to our monthly KeyPoints newsletter
Read our annual KeyPointReports on retail real estate
All are accessible at atKeyPointPartners.com
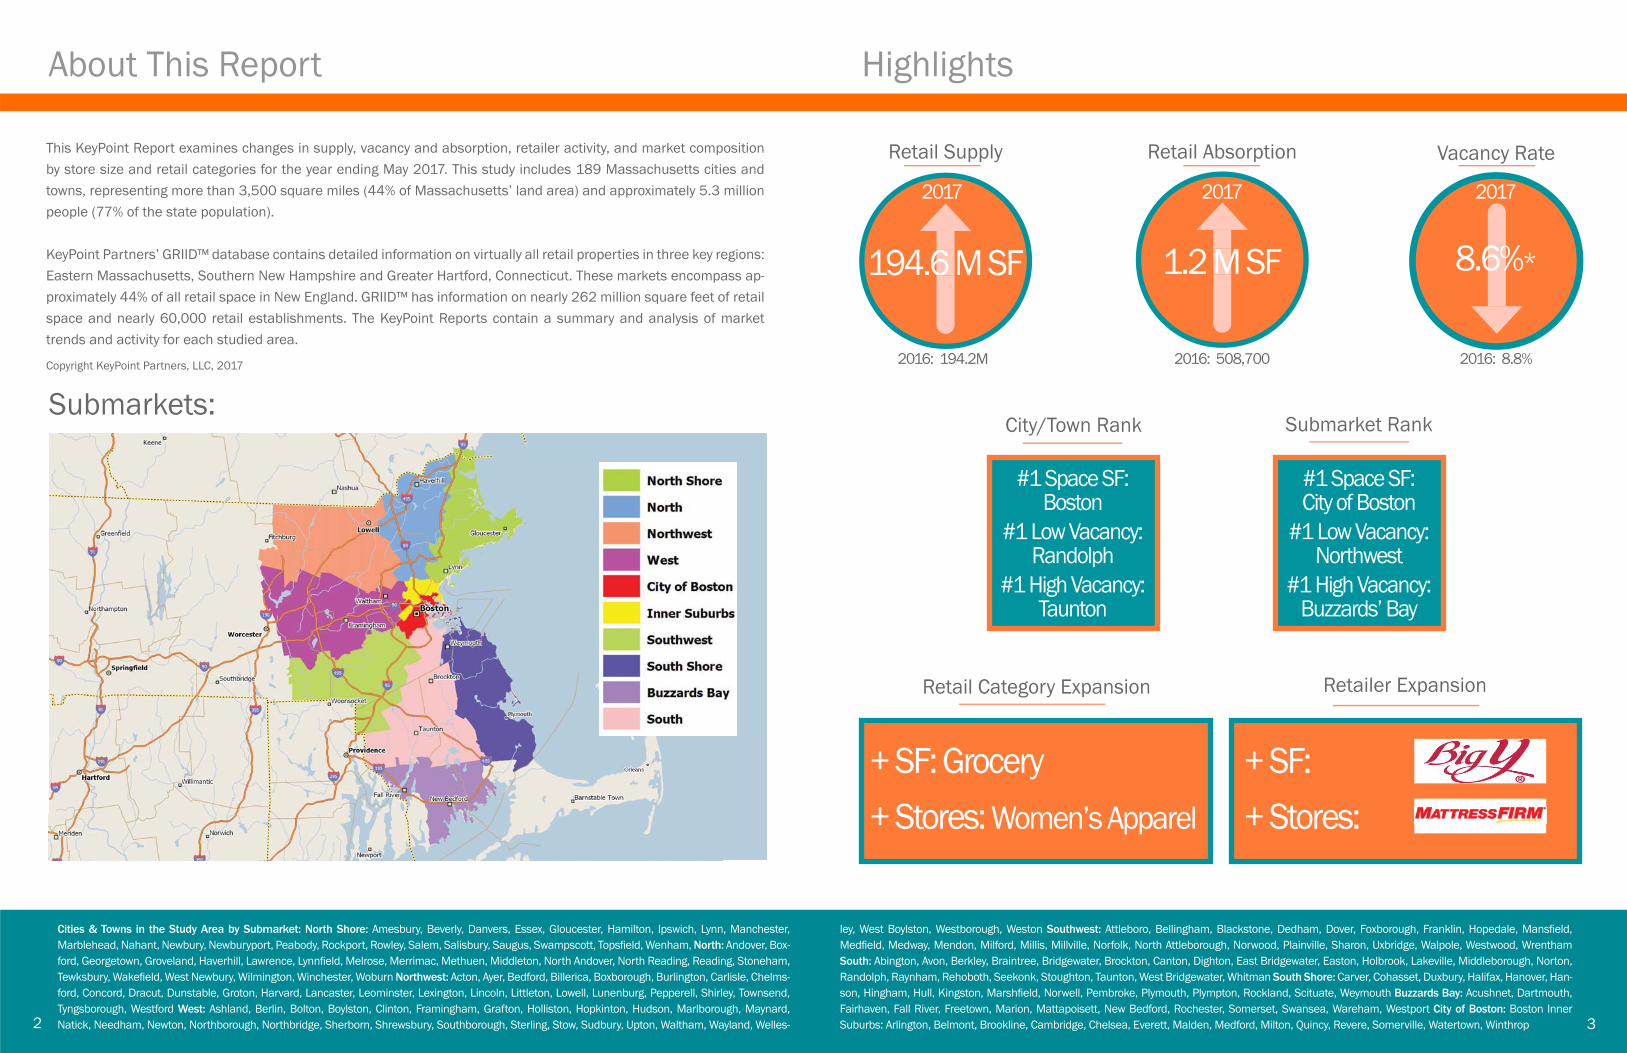
This KeyPoint Report examines changes in supply, vacancy and absorption, retailer activity, and market composition by store size and retail categories for the year ending May 2017. This study includes 189 Massachusetts cities and towns, representing more than 3,500 square miles (44% of Massachusetts’ land area) and approximately 5.3 million people (77% of the state population).
KeyPoint Partners’ GRIID™ database contains detailed information on virtually all retail properties in three key regions: Eastern Massachusetts, Southern New Hampshire and Greater Hartford, Connecticut. These markets encompass ap-proximately 44% of all retail space in New England. GRIID™ has information on nearly 262 million square feet of retail space and nearly 60,000 retail establishments. The KeyPoint Reports contain a summary and analysis of market trends and activity for each studied area.
Copyright KeyPoint Partners, LLC, 2017
Cities & Towns in the Study Area by Submarket: North Shore: Amesbury, Beverly, Danvers, Essex, Gloucester, Hamilton, Ipswich, Lynn, Manchester, Marblehead, Nahant, Newbury, Newburyport, Peabody, Rockport, Rowley, Salem, Salisbury, Saugus, Swampscott, Topsfi eld, Wenham, North: Andover, Box-ford, Georgetown, Groveland, Haverhill, Lawrence, Lynnfi eld, Melrose, Merrimac, Methuen, Middleton, North Andover, North Reading, Reading, Stoneham, Tewksbury, Wakefi eld, West Newbury, Wilmington, Winchester, Woburn Northwest: Acton, Ayer, Bedford, Billerica, Boxborough, Burlington, Carlisle, Chelms-ford, Concord, Dracut, Dunstable, Groton, Harvard, Lancaster, Leominster, Lexington, Lincoln, Littleton, Lowell, Lunenburg, Pepperell, Shirley, Townsend, Tyngsborough, Westford West: Ashland, Berlin, Bolton, Boylston, Clinton, Framingham, Grafton, Holliston, Hopkinton, Hudson, Marlborough, Maynard, Natick, Needham, Newton, Northborough, Northbridge, Sherborn, Shrewsbury, Southborough, Sterling, Stow, Sudbury, Upton, Waltham, Wayland, Welles-
2016: 194.2M
3
Submarkets:
2
HighlightsAbout This Report
194.6 M SF
Retail Supply
6
2016: 8.8%
8.6%*
Vacancy Rate
6%
2016: 508,700
1.2 M SF
Retail Absorption
M
City/Town Rank Submarket Rank
#1 Space SF:City of Boston
#1 Low Vacancy:Northwest
#1 High Vacancy:Buzzards’ Bay
Retail Category Expansion
+ SF: Grocery
+ Stores: Women’s Apparel
Retailer Expansion
+ SF:
+ Stores:
#1 Space SF:Boston
#1 Low Vacancy:Randolph
#1 High Vacancy:Taunton
ley, West Boylston, Westborough, Weston Southwest: Attleboro, Bellingham, Blackstone, Dedham, Dover, Foxborough, Franklin, Hopedale, Mansfi eld, Medfi eld, Medway, Mendon, Milford, Millis, Millville, Norfolk, North Attleborough, Norwood, Plainville, Sharon, Uxbridge, Walpole, Westwood, Wrentham South: Abington, Avon, Berkley, Braintree, Bridgewater, Brockton, Canton, Dighton, East Bridgewater, Easton, Holbrook, Lakeville, Middleborough, Norton, Randolph, Raynham, Rehoboth, Seekonk, Stoughton, Taunton, West Bridgewater, Whitman South Shore: Carver, Cohasset, Duxbury, Halifax, Hanover, Han-son, Hingham, Hull, Kingston, Marshfi eld, Norwell, Pembroke, Plymouth, Plympton, Rockland, Scituate, Weymouth Buzzards Bay: Acushnet, Dartmouth, Fairhaven, Fall River, Freetown, Marion, Mattapoisett, New Bedford, Rochester, Somerset, Swansea, Wareham, Westport City of Boston: Boston Inner Suburbs: Arlington, Belmont, Brookline, Cambridge, Chelsea, Everett, Malden, Medford, Milton, Quincy, Revere, Somerville, Watertown, Winthrop
2017 20172017

Eastern Massachusetts/Greater Boston 2017
Supply, Occupancy, & Absorption (Figure 1, Page 4): This year Eastern Massachusetts inventory grew moderately, reaching 194.6 million square feet, or an increase of 0.4%. No major shopping center development occurred in the region during the year, however. The largest gains came fromthe freestanding 136,000 square foot Life Time Athletic in Framingham and the 82,000 square foot Market Basket in Plymouth - this supermar-ket is the fi rst phase of the Cranberry Crescent project, which will include Marshalls, now under construction. Another notable addition was theexpanded retail area at Prudential Center, to accommodate the new 45,000 square foot Eataly food concept and an Under Armour fl agship store.
Despite all the news accounts, Eastern Massachusetts experienced a modest decrease in vacant space during the year, with demolitions andmixed-use redevelopment benefi cially impacting the vacancy rate. A number of large-space users that will be fi lling vacant space and are expected to open later this year have also contributed to the improvement in the vacancy rate. These include At Home in Seekonk and Primark in Braintree. Several obsolete buildings that once served as retail space were also removed from our year-end inventory. Adjusting for this same obsolescence,the vacancy rate in the region still improved versus last year from 8.8% to 8.6% (see the note on page 4). As a result of inventory gain and the de-crease in vacant space, the region fi nished the year with positive net absorption of 1.2 million square feet. While positive absorption is good news, we also have to keep in mind that a signifi cant number of announced store closings have not yet occurred.
Regional Submarkets (Figure 2, Page 4): The City of Boston experienced the largest percentage increase in square footage, gaining 2.0%. TheEataly/Under Armour openings at Prudential Center were partial contributors, but much of the gain came from non-retail conversions to retail space, including a signifi cant number of urban streetfront locations in Boston (often, the fi rst fl oors of offi ce buildings). The West gained 1.3%, attributable to the new Life Time Athletic in Framingham. The South Shore inventory increased 1.1%, largely a result of the new Market Basket in Plymouth.
Buzzards Bay continues to have the highest vacancy rate among submarkets in Eastern Massachusetts at 12.1%, although signifi cantly improved from a 13.4% rate last year. Cardi’s Furniture helped reduce the vacancy rate by occupying a large portion of the vacancy left behind when Walmartrelocated in Wareham. Also helping was Ocean State Job Lot, which will utilize most of the former Shaw’s space in Fairhaven later this year. TheSouth has the second highest vacancy rate in the region at 11.5%, an increase from the 11.0% rate a year ago and the result of two recent Macy’sclosings. Home décor retailer At Home, making its entry into the Eastern Massachusetts, will open soon in the former Sam’s Club space in Seekonk.
Individual Town Rankings (Figure 3, Page 6): The fi ve communities with the most amount of retail space remain the same as last year, with Boston and Cambridge maintaining their dominance in fi rst and second position. Natick, Brockton, and Burlington follow. Randolph now has the lowest vacancy rate in the region after ranking 65th last year; theopening of Brothers Supermarket, its third store in the region, as a grocery replacementfor the vacant Sudbury Farms was largely responsible for this jump to fi rst place. Taunton is again the community with the highest vacancy rate at 24.4%. Eight other towns have vacancy rates of 15% and higher.
The list of top 10 towns by retail square footage remains intact from a year ago, with one exception: Leominster replaces Fall River for the tenth spot. One through fi ve remain identical: Boston, Cambridge, Natick, Brockton, and Burling-ton. Framingham and Saugus moved ahead of Danvers into fi fth and sixth place while Braintree continues to hold the ninth position. As previously mentioned, among communities with at least 500,000 square feet of retail space, Randolph is the new frontrunner with the lowest vacancy rate at 1.4%. There are four other communities also moving to the top ten including Norwell, Everett, and Wareham, a position it has held since 2010. Five towns are new to the top ten this year, however, including Bedford, Lynnfi eld, North Andover, Raynham, and Burlington. All had vacancy rates of 3.5% or lower. Taunton, Fairhaven, and Lawrence had the highest vacancy rates in the region. Fairhaven is new to the top ten ranking this year because of a Kmart closing. Three other newcomers to the list include Swansea, Milford, and Tewksbury, all experiencing big-box closings by Searsat Swansea Mall, Sports Authority at Quarry Place in Milford, and Kmart in Tewksbury.
Vacancy by Tenant Size (Figure 4, Page 6): Redevelopment has much to do with lowering the vacancy rates in a few categories this year, but va-cancy rates in the 25,000-49,999 SF and the 100,000-199,999 SF segments increased. The ten-store liquidation of Sports Authority, which hadan average store size of 41,000 square feet in the region, was largely responsible for the rate rise in the 25,000-49,999 SF segment from 6.3% to 6.9%. Department store closings were responsible for the increase in the 100,000-199,999 SF range. While vacancy rates in the three smallest
Continued on page 7
Observations:
5
Boston retains #1 rank in retail supply
The KeyPoint Report
No warranty or representation, expressed or implied, is made as to the accuracy of the information contained herein, and same is submitted subject to errors, omissions, change in price, rental or other conditions, or withdrawal without notice.
Vacancy & Absorption:The year-end regional vacancy rate was 8.6%, a moderate improvement from a rate of 8.8% in 2016. Total vacancy in the region isapproximately 17.6 million square feet, a decline of 651,000 square feet of vacant retail space. Coupled with the retail inventory gain, the region experienced net positive absorption of 1.2 million square feet for the year.
Figure 2: SubmarketsThe City of Boston experienced the largest percentage gain in square footage among all submarkets, adding 379,600 squarefeet, or 2.0%. The West submarket also showed a signifi cant gain of 333,300 square feet, a 1.3% increase. New retail spacecreated at Prudential Center for Eataly and Under Armour was the most notable development in Boston while a new Life Time Athletic location in Framingham, at the site of the former Breyers and Sealtest ice cream manufacturing plant, boosted inventory in the West. The North, North Shore, and South Shore also added more than 100,000 square feet.
Figure 1: SummaryThis year, the total retail real estate inventory was 194.6 million square feet, a modest gain of 854,000 square feet, or 0.4%.
4
Category Total Market Size (Square Feet)
Total Number of Retail Properties
Total Number of Retail Establishments
Total Market Vacancy Square Feet
Vacant Stores
Vacancy Rate
Total Retail Space Per Capita
Retail Property Average Size
Retail Store Average Size
2017 194,570,600
19,300
46,100
16,738,400
5,900
8.6%
37.0
10,100
4,200
2016 193,716,900
19,500
46,100
17,093,700
6,100
8.8%
37.3
9,900
4,200
%Change0.4%
-1.0%
0.0%
-3.8%
-3.3%
-3.30%
-1.0%
2.0%
0.0%
RegionBuzzard’s Bay
City of Boston
Inner Suburbs
North
North Shore
Northwest
South
South Shore
Southwest
West
2017 SF14,304,700
19,603,600
22,317,000
16,146,100
19,876,500
17,873,100
23,321,000
13,662,500
20,866,900
26,599,000
%Change-1.2%
1.7%
-0.7%
0.9%
0.4%
-1.4%
-0.3%
0.9%
0.4%
1.0%
2017 Vacancy12.1%
8.7%
7.9%
9.2%
6.7%
6.4%
11.5%
8.5%
8.3%
7.6%
2016 Vacancy13.4%
8.8%
9.2%
9.8%
6.9%
6.4%
11.0%
10.2%
7.8%
8.3%
©2017 KeyPoint Partners, LLC, Burlington, MA
*NOTE: Our more observant readers may have noticed that we adjusted last year’s vacancy rate downward from 9.0% to 8.8%. We did so af-ter concluding that approximately 226,000 SF of chronically vacant supply had become obsolete andwas unlikely to be leased as retail in the foreseeable future.

size categories all remain above 10.0%, they did show moderate improve-ment from last year. Signifi cant redevelopment of antiquated properties (particularly in urban neighborhoods where a number of residential andmixed-use conversions took place), as well as property demolitions, helpedlower rates in these smaller tenant classifi cations. In the larger segments,numerous big-box vacancies have been fi lled or are in some phase of rede-velopment, which has offset much of the new department store vacancy.Notable redevelopment projects include South Coast Marketplace in FallRiver, previously New Harbour Mall, which included a vacant Walmart last year; a former Building 19 store and some adjacent vacancy in Burlingtonare being redeveloped as The Shoppes at Simonds Park, a mixed-use proj-ect; and similarly, a vacant Building 19 in Shrewsbury is the site of Lakeway Commons, another mixed-use project that is underway. Additionally, other large vacancies that have been fi lled or are under redevelopment include four Shaw’s, a Sam’s Club, a Macy’s, Stop & Shop, and a Mill Stores unit.
Retailer Activity (Figure 5, Page 8): The retailer adding the most retail spacein the region was Big Y, now a serious grocery player in Eastern Massachu-setts, by way of its acquisition of eight Hannaford locations. Big Y currentlyoccupies more than 500,000 square feet in the region. Runner-up was Life Time Athletic, which added a 136,000 square foot Framingham club. Mar-ket Basket is third with the addition of an 82,000 SF store in Plymouth.
Hannaford vacated the most retail space in the region by divesting eight stores in the merger between Ahold and Delhaize, and recently closing an-other in Hudson, for a total of 445,300 square feet. Sports Authority wasthe runner-up, closing 10 stores in the region, or 411,600 square feet; Sports Authority was the largest among the group of sporting goods retail-ers to close stores this year. Kmart ended in third place as a result of fourstore closings in Tewksbury, Attleboro, Fairhaven, and Fall River. The FallRiver store is part of the New Harbour Mall redevelopment.
With respect to store count - and aside from 2015 - early 2016 acquisitionsthat continued converting brands (Mattress Firm/Sleepy’s, 7-Eleven/Tedes-chi’s, Sprint/Radio Shack) Cricket Wireless, Metro PCS, and Starbucks add-ed 10 units each, the most among retailer expansions. Big Y, by way of theHannaford acquisition, and European Wax Center both added eight stores.
Figure 3: City & Town RankingsWith respect to total inventory, there was no change in the fi ve largest cities and towns this year. The City of Boston again leads theregion, followed by Cambridge, Natick, Brockton and Burlington. Aside from Boston, Natick/Framingham and Danvers/Peabody remain the largest retail hubs in the region, encompassing 7.2 million and 6.6 million square feet, respectively. Randolph has thelowest vacancy rate in the region, in large part from Brothers Supermarket fi lling the vacancy left behind by the Sudbury Farms closing more than a year ago. Bedford ranked second again while Abington slipped from the top spot to third. All three towns hadrates below 3.0% while none of the top ten had rates above 3.5%. The highest vacancy rate was found in Taunton, coming in at19.2%. Fairhaven and Lawrence tied for second at 18.0%. The Fairhaven rate is expected to improve when Ocean State Job Lottakes over the vacant Kmart store later this year.
Figure 4: Market Composition & Vacancy by Tenant SizeRedevelopment and demolitions contributed to lower vacancy rates in most size classifi cations this year. However, the vacancy rate in the 25,000-49,999 SF classifi cation increased, largely from the ten-store liquidation of Sports Authority, which had an aver-age store size of 41,000 square feet in the region. The 100,000-199,999 SF increased as a resut of department store closings.
Big Y Supermarket led expansion by SF in the region
*For cities and towns with 500,000 square feet or more of retail space. NOTE: For towns with supply close to the threshold, 1 large vacant space can account for high vacancy percentage, without necessarily indicating market health.
Most Space SF Highest Vacancy* Prior Rank Lowest Vacancy* Prior Rank
Boston
Cambridge
Natick
Brockton
Burlington
Framingham
Saugus
Danvers
Braintree
Leominster
19,603,600
4,452,500
3,696,400
3,631,400
3,539,500
3,510,200
3,421,000
3,386,700
3,301,000
3,273,700
Taunton
Fairhaven
Lawrence
New Bedford
Wrentham
Belmont
Swansea
West Bridgewater
Milford
Tewksbury
24.4%
18.0%
18.0%
16.7%
16.7%
16.4%
16.1%
15.6%
15.0%
14.5%
Randolph
Bedford
Abington
Lexington
Norwell
Everett
Wareham
Marshfi eld
Lynnfi eld
Burlington
1.4%
1.5%
2.2%
3.0%
3.1%
3.2%
3.3%
3.3%
3.4%
3.5%
51
2
1
6
52
47
72
28
4
10
1
15
5
9
7
3
13
6
21
27
Tenant Size Market Share 2017 Market Share 2016 Vacancy 2017 Vacancy 2016Less Than 2,500 SF
2,500 to 4,999 SF
5,000 to 9,999 SF
10,000 to 24,999 SF
25,000 to 49,999 SF
50,000 to 99,999 SF
100,000 to 199,999 SF
200,000 SF and above
19.9%
15.9%
12.7%
14.5%
10.6%
11.1%
13.6%
1.6%
20.0%
15.8%
12.7%
14.4%
10.6%
11.1%
13.6%
1.7%
14.0%
10.9%
10.1%
7.1%
6.9%
5.0%
3.4%
0.0%
14.5%
11.4%
10.5%
8.2%
6.2%
5.8%
2.7%
0.0%
Top 10 Expanding Retailers*
*By added square footageContinued on page 9
7No warranty or representation, expressed or implied, is made as to the accuracy of the information contained herein, and same is submitted subject to errors, omissions, change in price, rental or other conditions, or withdrawal without notice.6 ©2017 KeyPoint Partners, LLC, Burlington, MA
Eastern Massachusetts/Greater Boston 2017
Observations continued:
The KeyPoint Report

Closing the most stores was Radio Shack, which either vacated or converted toSprint 24 locations. The overstoring of fro-yo shops reared its head once againwith the closing of 13 Orange Leaf locations, not to mention another 5 closings byPinkberry, both prominent names in the category. Sports Authority and Hannafordclosed 10 and 8 units, respectively.
Retail Categories (Figure 6, Page 9): Grocery led all retail categories in squarefootage gain. The largest store opening in this category was Market Basket inPlymouth, an 82,000 square foot unit. Aldi also opened in Plymouth and bfreshadded a new store in Somerville. Health & Fitness followed in second place; LifeTime Athletic in Framingham contributed nearly half the gain. Restaurants endedthe year in third, a category that continues to expand. Ending the year with thelargest decline in space was Department Stores. With all the negative news sur-rounding this category, this should not be a surprise. Kmart closed four stores,Macy’s closed two, and Sears another. After leading all categories last year, Sport-ing Goods was hit hard again, the second largest drop, with Sports Authority clos-ings the notable cause. Family apparel came in third with Gap closing four storesand H&M vacating two units.
Beauty Salons & Services led the way in incremental store count. European WaxCenter, MiniLuxe, and Sport Clips all added multiple units. Health & Fitness fol-lowed with FitWorx, Planet Fitness, and Orangetheory Fitness among those tally-ing multi-unit growth. Medical & Dental Services also continued strong growth,becoming an increasing attractive alternative to traditional retail tenants. Thecategory losing the most stores was Womens Apparel, which should not be asurprise given the fallout of mall-based tenants such as Wet Seal, bebe, BCBG,and The Limited. Radio Shack closings largely resulted in Electronics ending theyear as runner-up. Family Apparel also was affected by mall tenants, including Gap and H&M. Conclusions: It was certainly another trying year for brick and mortar retailersand landlords. Amazon and other online retailers have created a sea change inthe way people shop. The fallout will continue as many of the store closings an-nounced this year are still months or even years away from occurring. When wecan expect to see stabilization in the spending shift to online is anyone’s guess,but it’s safe to assume we’re nowhere near the end. One can only imagine whatAmazon has planned following its newly-announced Whole Foods acquisition, butit has to be a top-of-mind concern for the rest of the grocery industry.
We’re also coping with a new generation of millennial shoppers that have grownup in a digital age and for whom shopping online is the norm. If retailers are un-able to offer them a satisfying omnichannel experience, they will in all likelihoodbe unable to retain them.
On the bright side, job growth and low unemployment have provided us with arelatively healthy economy which should result in increased spending potentialto help weather the storm. We have been seeing investors buying up distressedproperty and repurposing this space for mixed-use, residential, hotel, and other
Figure 6: Retail Category ActivityTenants in GRIID™ represent nearly 600 unique business classifi cations; we have aggregatedsimilar business types into larger retail categories, and summarized these by the degree of ex-pansion or contraction.
Figure 5: Retailer ActivityThe region encompasses approximately 46,100 retail establishments, representing approxi-mately 26,800 unique retailers. The following summarizes these by the degree of expansion orcontraction.
NOTE: All fi gures shown above are NET
Beauty Salons and Services
Health & Fitness Services
Medical & Dental Services
Telephone Equipment
Real Estate
Restaurants
Tobacco Stores and Stands
Food Stores - Grocery
Beauty Supplies and Cosmetics
Professional Services
Expansion by # Stores
Category New Total
Expansion by SF
Category New Total
Contraction by # Stores
Contraction by SF
Grocery
Health & Fitness Services
Restaurants
Medical & Dental Services
Beauty Salons and Services
Building Materials
Telephone Equipment
Beer, Wine & Liquor Stores
Variety Stores
Beauty Supplies/Cosmetics
327,000
287,200
286,800
173,500
162,100
116,100
91,900
82,400
74,900
61,900
69
55
52
40
28
26
26
22
18
12
21,299,600
8,110,700
23,234,800
1,980,100
6,199,600
8,901,700
989,100
3,368,500
2,933,200
686,500
Department Stores
Sporting Goods
Apparel - Family
Apparel - Women’s
Household Appliances
Auto Services
Hobby, Toy and Game Shops
Electronic Stores
Video Rental
Florists
-889,500
-571,400
-273,300
-165,400
-122,000
-116,900
-88,300
-79,600
-38,500
-32,500
21,189,900
2,483,000
6,598,100
2,646,800
469,200
663,500
1,859,200
856,000
30,800
556,700
Category Contracted Total
4,900
1,300
800
500
400
9,100
100
1,900
300
500
Apparel - Women’s
Electronic Stores
Apparel - Family
Jewelry
Sporting Goods
Florists
Photographic Services
Video Rental
Auto Services
Fabric & Sewing Goods Stores
-35
-29
-25
-24
-23
-17
-14
-13
-12
-11
733
75
593
458
358
319
115
13
200
100
Category Contracted Total
Mattress Firm
7-Eleven
Sprint
Cricket Wireless
Metro PCS
Starbucks
Big Y
European Wax Center
b.good
Caffe Nero
Expansion by # Stores
Retailer New Total
Expansion by SF
Retailer New Total
Contraction by # Stores
Contraction by SF
Big Y Supermarket
Mattress Firm
Life Time Athletic
7-Eleven Food Store
Market Basket
Cardi’s Furniture
Saks Fifth Avenue Off 5th
84 Lumber
Nordstrom Rack
Primark
406,400
392,500
136,000
97,000
81,800
80,000
54,100
53,800
53,400
53,000
69
29
13
10
10
10
8
8
7
5
526,800
392,500
264,000
379,500
2,648,000
271,500
101,700
53,800
246,100
130,000
Hannaford
Sleepy’s Mattresses
Sports Authority
KMart
Macy’s
Sears
GolfSmith
Tedeschi Food Shops
Sears Appliance & Hardware
Radio Shack
445,300
417,300
411,600
395,200
296,000
227,700
151,900
132,100
57,600
56,000
617,000
0
0
546,900
2,949,700
2,156,100
0
313,000
0
32,200
Retailer Contracted Total
69
137
53
16
97
157
10
18
20
10
Sleepy’s Mattresses
Tedeschi Food Shops
Radio Shack
Orange Leaf
Sports Authority
Hannaford
GolfSmith
Eastern Bank
Pinkberry
Sal’s Pizza
71
45
24
13
10
8
7
7
5
5
0
107
13
13
0
14
0
75
6
12
Retailer Contracted Total
9No warranty or representation, expressed or implied, is made as to the accuracy of the information contained herein, and same is submitted subject to errors, omissions, change in price, rental or other conditions, or withdrawal without notice.8 ©2017 KeyPoint Partners, LLC, Burlington, MA
Eastern Massachusetts/Greater Boston 2017
Observations continued:
The KeyPoint Report
Continued on page 10

11No warranty or representation, expressed or implied, is made as to the accuracy of the information contained herein, and same is submitted subject to errors, omissions, change in price, rental or other conditions, or withdrawal without notice.10 ©2017 KeyPoint Partners, LLC, Burlington, MA
Eastern Massachusetts/Greater Boston 2017The KeyPoint Report
KeyPoint Partners provides customized research from preliminary desktop assessments to comprehensive evaluations, which integrate fi eld investigation and quantitative analysis for a variety of retail location and store types.
The heart of our research superiority is GRIID™, which tracks all retail activity including supply, occupancy, demographics, and marketplace trends for nearly 262 million square feet of retail properties and nearly 60,000 retailers and tenants in key mar-kets within our territory - about 44% of the retail space in New England. We use this information in a host of research applica-tions.
Because of our superior research, we’re a market leader and a recognized information source. Our news digest, the KeyPoint Retail RoundUp (blog.keypointpartners.com), is updated daily. Our monthly KeyPoints retail newsletter is posted online and to thousands of subscribers. Our annual KeyPoint Reports present a thorough summary of retail real estate activity in key New England retail markets. Our data and insight are regularly solicited by the Boston Business Journal, Boston Globe, Hartford Business Journal, Shopping Centers Today, Shopping Center Business, Retail Traffi c, The Carlson Report, The New England Real Estate Journal and other industry publications. You can see all of our research at KeyPointPartners.com.
Is there a custom retail market research project we can do for you? Contact:Bob SheehanVice President of [email protected]
Retail Market Research®
KeyPointPartners.com
Observations continued:
non-retail projects. We also are seeing developers acquiring antiquated retail centers in quality locations and repositioning them into viable retailprojects. Examples include South Coast Marketplace in Fall River, Shoppes at Simonds Park in Burlington, and Lakeway Commons in Shrewsbury. All three projects are under construction and have not yet opened.
While no brick and mortar retailer is completely immune to online shopping, some have found a way to be more Amazon-proof than others. For the most part, beauty and cosmetics retailers have managed to stay out of harm’s way - Ulta Beauty is a perfect example of a retailer that has created a shopping experience unmatched by online retailers. Off price retailers have continued to weather the storm as well. Although none of the TJX divisions were able to add to their store count this year, TJX did announce that its new off price concept, Sierra Trading Post, will be open-ing soon in Framingham at Shoppers World and in Newton at Newton Nexus, a new project at the former site of Newton Technology Park. SaksOff Fifth and Nordstrom Rack also added new stores in Braintree. Dollar stores continue their march forward as well, with Dollar Tree and Family Dollar adding a combined seven new stores this year. Auto parts and supply, unlike auto services which showed a decline this year, are anothercategory in which brick and mortar locations do well in a digital world: both O’Reilly Auto Parts and Advance Auto added multiple units this year.
It goes without saying, though, that a number of retailers are approaching bankruptcy with little chance to recover. Department stores are underpressure to close more stores, and with several prognosticators aggressively predicting that many malls will close within fi ve years, we expect to see more bankruptcies occur among mall-based apparel retail chains as well. The bottom line is--survival of the fi ttest!
Bob SheehanVice President of Research

Property ManagementRetail Leasing & Tenant RepresentationInvestment SalesConstructionResearchFinancing & Consulting
Eastern MA/Greater Boston Retail Real Estate Trends & Analysis 2017
KeyPoint Partners, LLCOne Burlington Woods Drive, Burlington, MA 01803Tel 781.273.5555 Fax 781.272.8408
The KeyPoint Report
KeyPointPartners.com/Retail-Reports
©2017 KeyPoint Partners, LLC, Burlington, MA
KeyPoint Partners provides retail research consulting services ranging from preliminary desktop assessments to comprehensive evaluations which integrate fi eld investigation and quantitative analysis for a variety of retail location and store types. The heart of our research superiority is our powerful, proprietary GRIID™. Is there a custom retail market research project we can do for you? Call Bob Sheehan, Vice President of Research at 781.418.6248, or email him at [email protected].
Custom Retail Market Research
Methodology: The data for this study includes all public retail space in the study area except for a few exclusions discussed below. The information in our data-
base has been compiled from a variety of sources. A member of KeyPoint Partners’ research staff has visited each store/shopping center in order to verify and/
or acquire the necessary information. The area for each space is obtained from sources deemed reliable, such as the owner or leasing agent, is paced off by our
researchers or otherwise measured. Retail categories and SIC Codes are obtained from a leading business database, InfoUSA, when available. Each entry is fi eld
verifi ed or determined by our research staff. In general, public retail space is characterized as all space currently, or most recently, utilized in selling or renting retail
goods and/or services to the public. There are no size restrictions for stores or shopping centers. Certain retail classifi cations are excluded, including automobile
dealerships, gasoline service stations, automobile repair shops and quasi-retail services, such as stock brokers, real estate agents, insurance agents, etc., unless
such establishments are located in shopping centers containing typical retail tenants. In some cases wholesale or quasi-retail establishments have been included
in the database if information from InfoUSA or our fi eld research indicates that goods and/or services are being offered to the public from the location. Some
establishments available to the public but typically serving primarily the needs of other users of a facility, such as a cafeteria in an offi ce building or a beauty salon
located inside a hotel, may also be excluded. Demographic information used in this study was provided by Scan/US.
The KeyPoint Report
KeyPoint Reports are also available for:Southern New Hampshire & Greater Hartford, Connecticut
Read the daily retail news atKeyPoint Retail RoundUp
Read and subscribe to our monthly KeyPoints newsletter
Read our annual KeyPointReports on retail real estate
All are accessible at atKeyPointPartners.com