the job market in 2000: slowing down as the year ended labor review february 2001 3 the job market...
TRANSCRIPT

Monthly Labor Review February 2001 3
The Job Market in 2000
The job market in 2000:slowing down as the year ended
As the unemployment rate edged down to a 31-year low,the job market entered an unprecedented 10th yearof expansion, though job growth slowed a bitin the second half of the year
Jennifer L. MartelandDavid S. Langdon
Jennifer L. Martel is aneconomist in the Division ofLabor Force Statistics andDavid S. Langdon is aneconomist in the Division ofMonthly Industry Employ-ment Statistics, Bureau ofLabor Statistics.
The Nation’s current economic expan-sion entered its 10th year in 2000, be-coming the longest expansionary pe-
riod on record. However, by the end of theyear, signs emerged that the rate of expansionwas slowing.
In the first half of the year, the Federal Re-serve continued to raise interest rates as partof a policy designed to slow the economyand keep inflation in check.1 The Federal Re-serve aimed to bring the economy in for a“soft landing.” Real gross domestic product(GDP) was relatively strong during the firsthalf of the year, growing at an annual rate of4.8 percent in the first quarter and 5.6 percentin the second quarter. By the third quarter,however, the rate of growth slowed to 2.2 per-cent.2 The deceleration in real GDP primarilyreflected downturns in inventory investmentand in Federal Government spending, and adeceleration in nonresidential fixed invest-ment.3
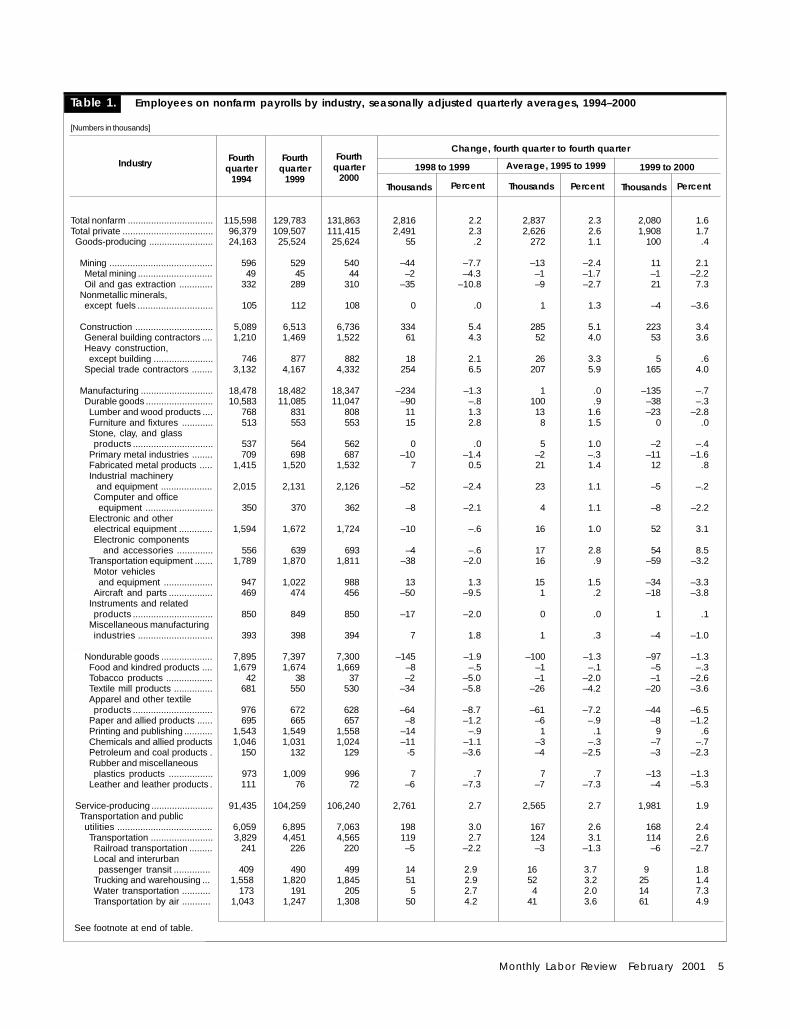
Nonfarm payroll employment continued togrow in 2000, at an average over-the-year rateof 2.3 percent in first half of the year, 2.0 per-cent in the third quarter, and 1.6 percent in thefourth quarter. Most of the job growth in 2000occurred in the service-producing industries.Mining employment also increased, in re-
sponse to rising oil prices. Employment in con-struction slowed over the year, affected by therise in interest rates. Manufacturing employ-ment fell overall, although some industries re-lated to information technology saw their pay-rolls increase. (See table 1.)
The unemployment rate was 4.0 percent inthe fourth quarter of 2000, the lowest rate since1969, and the proportion of the population thatwas employed remained at record-high levels.Workers in most major demographic groupsbenefited from the relatively healthy labor mar-ket in 2000, and the year was especially strongfor minorities. Blacks and Hispanics bothclosed slightly their unemployment rate gapbetween whites, and blacks closed slightly theirearnings gap between whites in 2000.
This article provides snapshots of several im-portant developments or issues related to theU.S. economy and labor market in 2000. The pri-mary sources of data are the Current Employ-ment Statistics (CES) survey and the Current Popu-lation Survey (CPS).4 Both of these surveys areconducted monthly (See box on page 4.); how-ever, quarterly averages are used in this analysisunless otherwise noted, and over-the-yearchanges are based on comparisons of fourthquarter 1999 and 2000 data, unless otherwisenoted.
4 Monthly Labor Review February 2001
The Job Market in 2000
Conceptual differences between employment estimatesfrom the Current Population Survey (household survey)
and the Current Employment Statistics Survey (establishment survey)
The Bureau of Labor Statistics maintains two monthlydata series on employment that are independently obtained:the estimate of total nonfarm jobs, derived from the CurrentEmployment Statistics (CES) survey and the estimate of totalemployment, derived from the Current Population Survey(CPS).
The CES survey is an employer-based survey that pro-vides data on the number of jobs within industries. The CPS
is a survey of households that provides data on the laborforce status (employed, unemployed, and not in the laborforce) of individuals, and includes information on their de-mographic as well as socioeconomic characteristics. Thesurveys are largely complementary.
Employment estimates from the CPS are for persons in anytype of work arrangement: wage and salary workers, self-em-ployed persons, and unpaid workers in family businesses. Tobe considered employed, an unpaid family worker must haveworked 15 hours or more in an enterprise operated by a memberof the family. Estimates from the CES survey refer only to per-sons on nonfarm payrolls. As a result, the count of employ-ment from the CPS is larger than from the CES survey.
are counted only once, regardless of the number of jobsthey hold. In contrast, the establishment survey is a countof jobs and includes each job for persons who work in morethan one establishment.
There are other differences in the surveys’ methodologyand coverage. For example, the reference period for the CPS
is the week that includes the 12th day of the month, while,for the CES survey, it is the pay period that includes the 12thof the month. Pay periods vary in length and can be longerthan 1 week. It is therefore possible for the CES surveyestimate of employment to reflect a longer reference periodthan that used for the CPS.
The “universe” for the CPS is the civilian noninstitutionalpopulation. This includes persons 16 years of age and olderresiding in the United States who are not inmates of institu-tions (for example, penal and mental facilities, homes for theaged), and who are not on active duty in the Armed Forces.In this regard, the coverage of the CES survey is broader:there is no age restriction in the CES, uniformed military per-sonnel who hold civilian jobs are covered because of theircivilian employment, and persons who commute into theUnited States from Mexico or Canada to work are countedas employed.
The price of oil, which had soared in 1999 and continued itsThe price of oil, which had soared in 1999 and continued itsThe price of oil, which had soared in 1999 and continued itsThe price of oil, which had soared in 1999 and continued itsThe price of oil, which had soared in 1999 and continued itsascent in 2000, did not seem to have a dramatic effect on indus-ascent in 2000, did not seem to have a dramatic effect on indus-ascent in 2000, did not seem to have a dramatic effect on indus-ascent in 2000, did not seem to have a dramatic effect on indus-ascent in 2000, did not seem to have a dramatic effect on indus-try employment trends in 2000.try employment trends in 2000.try employment trends in 2000.try employment trends in 2000.try employment trends in 2000.55555 Crude petroleum prices spentmuch of the year above $30 per barrel, or more than 2.5 timestheir 1998 level and nearly 2 times higher than 1999’s level.Their rise benefited some industries while hurting others.
Tracing job growth or losses to a rise in energy prices isproblematic in many industries, but it is relatively straightfor-ward for mining. After falling by 44,000 in 1999, mining em-ployment recovered partially last year.6 Its improvement camesolely from hiring in oil and gas extraction, which brought on21,000 workers, as rising oil prices spurred increased activityin this industry. The hiring halted in mid-summer, when crudepetroleum prices stabilized somewhat, only to pick up again inautumn as oil prices rose.7 Even with the recovery in oil prices,however, other factors worked to temper job gains in oil andgas extraction. For example, merger activity in 1998–99 re-sulted in more streamlined operations requiring fewer work-ers.8 In addition, many oil and gas companies considered thehigh price of crude petroleum to be a temporary development;consequently, they were wary to invest in projects that wouldbecome unprofitable if prices fell again.9 So, although the
price of crude oil spent much of the year at the highest levelssince the Gulf War, production and employment, while improv-ing, did not fully recover from their 1998–99 decline. (See chart 1.)
That situation contrasted sharply with petroleum refin-ing, in which production reached a record pace—while itsemployment slipped to its lowest level on record (this em-ployment series begins in 1947).10 Output per employee rosenearly 38 percent between 1991 and 1997, while employmentfell by 20 percent from a peak of 123,000 jobs. Refineries cutanother 11,000 positions between 1997 and 1999, but trimmedpayrolls by only 2,000 last year, possibly supported by thehigh price of oil.
Tracing the effects of the energy price hikes outside thepetroleum industry is less straightforward. Despite the surgein energy prices, the overall effect on prices paid by producersand consumers was minimal. Growth in the Consumer PriceIndex for All Urban Wage Earners and Clerical Workers (CPI-W)accelerated slightly, to 3.4 percent (December 1999 to Decem-ber 2000), and growth in average hourly earnings of produc-tion or nonsupervisory workers in the private economy notchedup to 4.2 percent for the same period. Nevertheless, relativelyflat real earnings and a 14-percent surge in gas prices did not
Partially offsetting the higher estimates from the CPS isthe fact that the CPS is a count of persons, and individuals
Monthly Labor Review February 2001 5
Table 1. Employees on nonfarm payrolls by industry, seasonally adjusted quarterly averages, 1994–2000
[Numbers in thousands]
Change, fourth quarter to fourth quarter
Total nonfarm ................................. 115,598 129,783 131,863 2,816 2.2 2,837 2.3 2,080 1.6Total private ................................... 96,379 109,507 111,415 2,491 2.3 2,626 2.6 1,908 1.7Goods-producing ......................... 24,163 25,524 25,624 55 .2 272 1.1 100 .4
Mining ........................................ 596 529 540 –44 –7.7 –13 –2.4 11 2.1Metal mining ............................. 49 45 44 –2 –4.3 –1 –1.7 –1 –2.2Oil and gas extraction ............. 332 289 310 –35 –10.8 –9 –2.7 21 7.3
Nonmetallic minerals,except fuels ............................. 105 112 108 0 .0 1 1.3 –4 –3.6
Construction .............................. 5,089 6,513 6,736 334 5.4 285 5.1 223 3.4General building contractors .... 1,210 1,469 1,522 61 4.3 52 4.0 53 3.6Heavy construction,except building ....................... 746 877 882 18 2.1 26 3.3 5 .6
Special trade contractors ........ 3,132 4,167 4,332 254 6.5 207 5.9 165 4.0
Manufacturing ............................ 18,478 18,482 18,347 –234 –1.3 1 .0 –135 –.7Durable goods .......................... 10,583 11,085 11,047 –90 –.8 100 .9 –38 –.3Lumber and wood products .... 768 831 808 11 1.3 13 1.6 –23 –2.8Furniture and fixtures ............ 513 553 553 15 2.8 8 1.5 0 .0Stone, clay, and glassproducts ............................... 537 564 562 0 .0 5 1.0 –2 –.4
Primary metal industries ........ 709 698 687 –10 –1.4 –2 –.3 –11 –1.6Fabricated metal products ..... 1,415 1,520 1,532 7 0.5 21 1.4 12 .8Industrial machinery
and equipment .................... 2,015 2,131 2,126 –52 –2.4 23 1.1 –5 –.2Computer and officeequipment .......................... 350 370 362 –8 –2.1 4 1.1 –8 –2.2
Electronic and otherelectrical equipment ............. 1,594 1,672 1,724 –10 –.6 16 1.0 52 3.1Electronic components
and accessories .............. 556 639 693 –4 –.6 17 2.8 54 8.5Transportation equipment ....... 1,789 1,870 1,811 –38 –2.0 16 .9 –59 –3.2Motor vehiclesand equipment ................... 947 1,022 988 13 1.3 15 1.5 –34 –3.3
Aircraft and parts ................. 469 474 456 –50 –9.5 1 .2 –18 –3.8Instruments and relatedproducts ............................... 850 849 850 –17 –2.0 0 .0 1 .1
Miscellaneous manufacturingindustries ............................. 393 398 394 7 1.8 1 .3 –4 –1.0
......................................................Nondurable goods .................... 7,895 7,397 7,300 –145 –1.9 –100 –1.3 –97 –1.3Food and kindred products .... 1,679 1,674 1,669 –8 –.5 –1 –.1 –5 –.3Tobacco products .................. 42 38 37 –2 –5.0 –1 –2.0 –1 –2.6Textile mill products ............... 681 550 530 –34 –5.8 –26 –4.2 –20 –3.6Apparel and other textileproducts ............................... 976 672 628 –64 –8.7 –61 –7.2 –44 –6.5
Paper and allied products ...... 695 665 657 –8 –1.2 –6 –.9 –8 –1.2Printing and publishing ........... 1,543 1,549 1,558 –14 –.9 1 .1 9 .6Chemicals and allied products 1,046 1,031 1,024 –11 –1.1 –3 –.3 –7 –.7Petroleum and coal products . 150 132 129 -5 –3.6 –4 –2.5 –3 –2.3Rubber and miscellaneousplastics products ................. 973 1,009 996 7 .7 7 .7 –13 –1.3
Leather and leather products . 111 76 72 –6 –7.3 –7 –7.3 –4 –5.3
Service-producing ........................ 91,435 104,259 106,240 2,761 2.7 2,565 2.7 1,981 1.9Transportation and publicutilities ..................................... 6,059 6,895 7,063 198 3.0 167 2.6 168 2.4Transportation ........................ 3,829 4,451 4,565 119 2.7 124 3.1 114 2.6Railroad transportation ......... 241 226 220 –5 –2.2 –3 –1.3 –6 –2.7Local and interurbanpassenger transit .............. 409 490 499 14 2.9 16 3.7 9 1.8
Trucking and warehousing ... 1,558 1,820 1,845 51 2.9 52 3.2 25 1.4Water transportation ........... 173 191 205 5 2.7 4 2.0 14 7.3Transportation by air ........... 1,043 1,247 1,308 50 4.2 41 3.6 61 4.9
See footnote at end of table.
Thousands Thousands ThousandsPercent Percent Percent
1998 to 1999 Average, 1995 to 1999 1999 to 2000Industry Fourthquarter
1994
Fourthquarter
2000
Fourthquarter
1999

6 Monthly Labor Review February 2001
The Job Market in 2000
Pipelines, except natural gas ... 16 13 12 –1 –7.1 –1 –4.1 –1 –7.7Transportation services ............ 388 465 476 6 1.3 15 3.7 11 2.4
Communications and publicutilities ...................................... 2,230 2,444 2,498 79 3.3 43 1.8 54 2.2Communications ..................... 1,306 1,580 1,645 79 5.3 55 3.9 65 4.1Electric, gas, and sanitaryservices ................................ 924 863 853 –1 –.1 –12 –1.4 –10 –1.2
Wholesale trade ............................ 6,261 6,988 7,091 153 2.2 145 2.2 103 1.5Durable goods .......................... 3,625 4,164 4,207 92 2.3 108 2.8 43 1.0Nondurable goods ..................... 2,636 2,824 2,884 62 2.2 38 1.4 60 2.1
Retail trade ................................... 20,827 22,897 23,220 434 1.9 414 1.9 323 1.4Building materials and gardensupplies .................................... 855 1,008 1,020 46 4.8 31 3.3 12 1.2
General merchandise stores ...... 2,650 2,757 2,752 –2 –.1 21 .8 –5 –.2Department stores ..................... 2,314 2,410 2,405 –25 –1.0 19 .8 –5 –.2Food stores ................................ 3,310 3,498 3,521 7 .2 38 1.1 23 .7Automotive dealers and servicestations ..................................... 2,151 2,381 2,430 36 1.5 46 2.1 49 2.1
New and used car dealers .......... 981 1,092 1,121 38 3.6 22 2.2 29 2.7Apparel and accessory stores ... 1,147 1,186 1,208 46 4.0 8 .7 22 1.9Furniture and homefurnishings stores ..................... 921 1,094 1,129 51 4.9 35 3.5 35 3.2
Eating and drinking places ......... 7,173 7,967 8,096 131 1.7 159 2.1 129 1.6Miscellaneous retailestablishments ......................... 2,620 3,006 3,065 118 4.1 77 2.8 59 2.0
Finance, insurance,and real estate ........................... 6,851 7,605 7,649 125 1.7 151 2.1 44 .6Finance ....................................... 3,265 3,707 3,742 64 1.8 88 2.6 35 .9Depository institutions .............. 2,051 2,061 2,035 8 .4 2 .1 –26 –1.3Commercial banks ................... 1,479 1,473 1,446 –1 –.1 –1 –.1 –27 –1.8Savings institutions ................ 292 249 237 –5 –2.0 –9 –3.1 –12 –4.8
Nondepository institutions ........ 468 705 690 13 1.9 47 8.5 –15 –2.1Security and commoditybrokers .................................... 522 708 768 45 6.8 37 6.3 60 8.5
Holding and otherinvestment offices .................. 224 233 249 –2 –.9 2 .8 16 6.9
Insurance ................................... 2,230 2,377 2,360 22 .9 29 1.3 –17 –.7Insurance carriers .................... 1,542 1,610 1,585 5 .3 14 .9 –25 –1.6Insurance agents, brokers,and service ............................. 687 767 775 17 2.3 16 2.2 8 1.0
Real estate ................................. 1,357 1,521 1,547 40 2.7 33 2.3 26 1.7
Services ..................................... 32,218 39,598 40,768 1,525 4.0 1,476 4.2 1,170 3.0Agricultural services ................. 576 779 808 47 6.4 41 6.2 29 3.7Hotels and other lodgingplaces ..................................... 1,639 1,866 1,934 56 3.1 45 2.6 68 3.6
Personal services ..................... 1,146 1,252 1,287 40 3.3 21 1.8 35 2.8Business services .................... 6,532 9,502 9,815 660 7.5 594 7.8 313 3.3Services to buildings .............. 872 997 1,005 37 3.9 25 2.7 8 .8Personnel supply services ..... 2,397 3,731 3,830 364 10.8 267 9.3 99 2.7Help supply services ............ 2,129 3,343 3,407 330 11.0 243 9.4 64 1.9Computer and dataprocessing services ............ 1,000 1,881 1,979 172 10.1 176 13.5 98 5.2
Auto repair, services,and parking ............................. 989 1,191 1,209 30 2.6 40 3.8 18 1.5
Miscellaneous repair services ................................. 346 380 385 4 1.1 7 1.9 5 1.3
Motion pictures ......................... 456 624 633 43 7.4 34 6.5 9 1.4Amusement and recreationservices .................................. 1,354 1,698 1,794 74 4.6 69 4.6 96 5.7
See footnote at end of table.
Table 1. Continued—Employees on nonfarm payrolls by industry, seasonally adjusted quarterly averages, 1994–2000
[Numbers in thousands]
Change, fourth quarter to fourth quarter
1998 to 1999 1999 to 2000Average, 1995 to 1999
Thousands Thousands Thousands PercentPercentPercent
Industry Fourthquarter
1994
Fourthquarter
1999
Fourthquarter
2000
1
1

Monthly Labor Review February 2001 7
Health services ......................... 9,079 10,040 10,209 133 1.3 192 2.0 169 1.7Offices and clinics of medicaldoctors ..................................... 1,567 1,898 1,953 63 3.4 66 3.9 55 2.9
Nursing and personal care facilities ..................................... 1,664 1,786 1,794 8 .4 24 1.4 8 .4Hospitals ..................................... 3,760 3,994 4,044 35 .9 47 1.2 50 1.3Home health care services ......... 588 637 644 -5 –.8 10 1.6 7 1.1
.........................................................Legal services .............................. 924 1,005 1,015 21 2.1 16 1.7 10 1.0Private schools and othereducational services ................... 1,906 2,304 2,372 88 4.0 80 3.9 68 3.0
Social services ............................. 2,265 2,866 3,035 166 6.1 120 4.8 169 5.9Child day care services .............. 541 719 788 70 10.8 36 5.9 69 9.6Residential care .......................... 621 795 840 42 5.6 35 5.1 45 5.7
Museums and botanicaland zoological gardens ............... 79 99 104 4 4.2 4 4.6 5 5.1
Membership organizations ............ 2,112 2,434 2,450 34 1.4 64 2.9 16 .7Engineering and management
services .................................... 2,633 3,312 3,474 138 4.3 136 4.7 162 4.9Engineering and architecturalservices .................................... 794 969 1,019 44 4.8 35 4.1 50 5.2
Management and publicrelations .................................... 743 1,060 1,134 51 5.1 63 7.4 74 7.0
Government .................................... 19,219 20,276 20,448 325 1.6 211 1.1 172 .8Federal .......................................... 2,854 2,646 2,615 –65 –2.4 –42 –1.5 –31 –1.2Federal, except PostalService ........................................ 2,024 1,780 1,761 –52 –2.8 -49 –2.5 -19 –1.1
State government ......................... 4,624 4,724 4,759 83 1.8 20 .4 35 .7State government,except education ...................... 2,717 2,743 2,771 40 1.5 5 .2 28 1.0
State government education ....... 1,907 1,981 1,989 43 2.2 15 .8 8 .4Local government ......................... 11,741 12,905 13,073 306 2.4 233 1.9 168 1.3Local government, except
education ................................... 5,220 5,581 5,686 117 2.1 72 1.3 105 1.9Local government education ....... 6,521 7,325 7,387 190 2.7 161 2.4 62 .8
1Includes other industries not shown separately.
Table 1. Continued—Employees on nonfarm payrolls by industry, seasonally adjusted quarterly averages, 1994–2000
[Numbers in thousands]
1998 to 1999 1999 to 2000
ThousandsThousands
Average, 1995 to 1999
Thousands PercentPercentPercent
1
1
Fourthquarter
1994
Fourthquarter
1999
Fourthquarter
2000
Change, fourth quarter to fourth quarter
Industry
keep consumers away from new cars and light trucks.11 Ameri-cans beat 1999’s sales record by purchasing 17.4 million ve-hicles.12 Moreover, consumers’ appetite for less fuel-efficienttrucks and sport utility vehicles (SUVs) did not seem to beaffected at all. For the 2000 model year, sales of pickup trucksremained very high, and for the first time ever, SUVs beat pickuptrucks in sales.13
Employment in motor vehicles and equipment manufactur-ing reflected that intensity during the first half of the year, butit plummeted in summer. Overall, motor vehicle manufacturersreduced their payrolls by 34,000 jobs last year. Part of the de-cline reflected the expanding competition from import cars and,especially, light trucks. Domestic manufacturers resorted tohefty incentives to move certain poor-selling, year-2000 mod-els; indeed, the CPI for new cars and trucks was about un-changed over the year. Although those programs “moved themetal,” they also dragged down profits, which led some com-panies to curtail production and employment. Yet, the real
drag on motor vehicle employment came not from cars andlight trucks, but rather from the heavyweights of the motorvehicle industry—heavy trucks and motor homes.
While rising fuel prices did not appear to adversely affectconsumers’ demand for light trucks, rising diesel prices did havea wide range of effects on the trucking industry. Intense compe-tition among trucking companies made it difficult for firms, espe-cially the smallest ones, to pass on the climbing fuel costs to theircustomers in the form of fuel surcharges. Indeed, the ProducerPrice Index (PPI) for motor freight transportation and warehous-ing increased by only 4.9 percent over the year, versus the 23.8-percent jump in retail on-highway diesel prices. At the sametime, interest rates, insurance payments, and the cost of recruit-ing long-haul drivers also pushed costs upwards, while a declinein truck tonnage cut into revenues.14 Together, these factorsdramatically slowed, but did not stop, hiring in trucking andwarehousing. (See chart 2.) The industry added 25,000 workerslast year, its weakest hiring level since 1992.
1

8 Monthly Labor Review February 2001
The Job Market in 2000
Not only did trucking firms cut back on hiring, but they alsodramatically reduced their orders for new rigs. These cutbackscame on the heels of 2 years of record sales, but the increasingcosts and lower demand for freight transport hastened an an-ticipated pullback in sales.15 As a result, sales of the biggestrigs plunged 20 percent from their 1999 level.16 Employment intruck tractor manufacturing took a similar turn. As a whole,employment declines among truck tractor manufacturers ac-counted for more than one-quarter of the job losses in motorvehicle manufacturing and also contributed to declines in mo-tor vehicle parts.17 Employment in truck and bus bodies andtruck trailers showed weaknesses as well. Both had shownstrong job growth in 1999, but employment in truck and busbodies was unchanged in 2000, while truck trailers lost 7,000jobs; a 16-percent decline.
Motor home manufacturing paralleled the decline in heavytrucks. As fuel prices surged, the cost of traveling in motorhomes rose. Interest rates also entered into the equation bothfor consumers and dealers. Since dealers generally financetheir inventories, higher interest rates and falling sales pushedup their inventory carrying costs. As much as higher dieselprices tied together the fortunes of recreational vehicles (RVs)and heavy trucks, higher interest rates tied together the for-tunes of these residences on wheels and of fixed residences, inother words, residential construction.
During the first part of the yearDuring the first part of the yearDuring the first part of the yearDuring the first part of the yearDuring the first part of the year, the Federal Reserve contin-, the Federal Reserve contin-, the Federal Reserve contin-, the Federal Reserve contin-, the Federal Reserve contin-ued to raise interest rates.ued to raise interest rates.ued to raise interest rates.ued to raise interest rates.ued to raise interest rates.1818181818 Construction was one area that Construction was one area that Construction was one area that Construction was one area that Construction was one area thatwas afwas afwas afwas afwas affected.fected.fected.fected.fected. For the year, the construction industry addedabout 223,000 jobs, a 33-percent drop from 1999’s gains.Although declining mortgage rates in the second half of theyear sparked some late-year hiring, this renewed strengthwas not sufficient to compensate for sluggish summer hiring.
In terms of real value put-in-place, residential constructionactivity decreased slightly in 2000, a marked pause after 1999’s6-percent growth.19 Slower home building translated into moremoderate hiring in residential building construction. Employ-ment in this industry expanded by 30,000 in 2000, a 42-percentreduction from its 1999 increase. Hiring in special trade con-tractors diminished as well, totaling 165,000 last year, versus254,000 in 1999. The value of public construction projects,though perhaps less sensitive to interest rate fluctuations,also moderated in 2000, as its growth notched down from 4percent in 1999 to 2 percent in 2000. That decline made its markon heavy construction, which added only 5,000 workers, ver-sus 18,000 in 1999. Yet, even as residential and public con-struction subsided, private nonresidential work expanded, withits real value put-in-place increasing by 7 percent or $12.0 bil-lion. Employment in nonresidential building construction didreflect this one area of strength, as it grew by 21,000, andexceeded its prior 5-year average annual gains of 16,000. In
Chart 1. Employment in oil and gas extraction and petroleum refining, January 1998 – December 2000
Refining (In thousands)
Extraction(In thousands)
280
300
320
340
360
80
85
90
95
100
Oil and gas extraction, seasonally adjustedPetroleum refining, not seasonally adjusted
Jan.1998
July1998
Jan.1999
July1999
Jan.2000
July2000
Dec.2000
SOURCE: Bureau of Labor Statistics, Current Employment Statistics survey.

Monthly Labor Review February 2001 9
short, as residential and building activity slackened, so did theemployment growth in construction, and this weakening wasonly partially offset by strength in nonresidential construc-tion.20
Real estate, like construction, sandwiched a weak springand summer between strong hiring early and late in the year—thus reflecting the rise and fall in mortgage rates. Overall,employment grew by 26,000, a substantial slowdown from1999’s increase of 40,000. Mortgage rates also made a visiblemark on employment in mortgage banks and brokerages (partof the finance industry), where the number of jobs slid by21,000. Layoffs resulted from the sharp decline in mortgagerefinancing. The value of refinance applications fell from 54percent of total mortgage applications in the first quarter of1999 to 17 percent in the third quarter of 2000.21 That declineoccurred while sales of new and existing homes fell onlyslightly.
The slowdown in residential construction was mild, com-pared with the decline in manufactured homes. Shipmentsfrom January to October 2000 plummeted 26.0 percent, withrespect to the same period in 1999. Loans for manufacturedhomes fall within the subprime lending market, which chargeshigher rates than conventional mortgages. Buyers of thesehomes tend to have relatively low incomes. As a result, rising
interest rates, together with tightening credit standards, hurtsales of manufactured homes particularly. Declining sales andrising inventories led the industry to cut production and em-ployment.22 Job losses in wood buildings and mobile homestotaled 13,000, accounting for more than half the decline inlumber and wood products manufacturing.
At first, the remaining job losses in lumber and wood prod-ucts seem to reflect the general slowing in residential con-struction. Indeed, demand for all construction supplies andmaterials peaked in March, and both domestic new orders andshipments decreased subsequently.23 This decline in orderscontrasts sharply with the prior year’s high demand for con-struction supplies and the resulting reports of building mate-rial shortages.24 Yet, the employment declines that appeared inlumber and wood products, and in primary metals, (two in-dustries closely tied to construction) reflected not only theweak demand for wood and steel, but also the particularlyweak demand for U.S.-produced wood and steel; for while theirdomestic output dropped, lumber imports remained steady,and primary metal imports sprang upwards.25 In terms of em-ployment, other construction-related manufacturing industriesdid not show as much weakening as lumber and primary met-als. Indeed, employment in stone, clay, and glass productsdeclined by only 2,000, after having been unchanged in 1999.
-10
-5
0
5
10
15
20
$0.75
$1.00
$1.25
$1.50
$1.75
Chart 2. Over-the-month changes in trucking employment and on-highway diesel prices, January 1998 – December 2000
6,000 average monthly job growth in 1998
4,000 average monthly growth in 1999
3,000 average monthly growth in 2000
SOURCE: Employment data are from the Bureau of Labor Statistics, Current Employment Statistics survey; diesel prices are from the U.S. Department of Energy, Energy Information Agency.
Jan.1998
July1998
Jan.1999
July1999
Jan.2000
July2000
Dec.2000
Diesel prices
Dollar per gallon
Employment change(In thousands, seasonally adjusted )
10 Monthly Labor Review February 2001
The Job Market in 2000
As home sales moderated, so did the growth in the demandfor furniture, appliances, and landscaping. Employment growthin landscaping and horticultural services fell to about one-third its 1999 rate. The “do-it-yourself” side of this market alsoweakened as sales growth in building materials and gardensupplies stores slowed to 3.0 percent, versus 10.6 percent in1999.26 The industry’s employment trend matched that weak-ening as its rate of expansion declined from 4.8 percent in 1999to 1.2 percent, with just 12,000 jobs added in 2000. The storywas similar for furniture and fixtures, with both manufacturersand retailers sharply cutting their prior year’s rate of job growth.As for household appliances manufacturing, employmentslipped by 6,000 in 2000, after having risen by 3,000 the yearbefore.
Aside from construction, real estate, and their related in-dustries, the other industries most directly affected by increas-ing interest rates were in finance. Although cross-industrymergers may have provoked some layoffs in these industries,their employment picture turned gray only once interest ratesbegan their ascent. Such was the case with depository institu-tions as well, in which employment plummeted by 26,000, thuserasing its growth of the prior 2 years.
Rising interest rates also affected the stock market, indi-rectly. Concern about the direction of the economy and theability of companies to post strong profits as operating costsrose contributed to large swings in stock prices and high vol-umes of daily trading. Although the market in no way matched1999’s boom, the high trading volumes and record profits atbrokerages spurred security and commodity brokers to ex-pand their ranks by 60,000—a notable hiring pace even for anindustry that added 37,000 workers a year, on average, be-tween 1994 and 1999.27
Increasing international trade affected several manufactur-Increasing international trade affected several manufactur-Increasing international trade affected several manufactur-Increasing international trade affected several manufactur-Increasing international trade affected several manufactur-ing industries.ing industries.ing industries.ing industries.ing industries. Aircraft and textiles saw their job losses di-minish as they benefited from improving foreign demand. Incontrast, rising imports contributed to employment declinesin logging, primary metals, and apparel.
Steel imports, particularly from the Ukraine, China, and In-dia, surged 9.1 percent last year, as the U.S. dollar gainedstrength against foreign currencies.28 These elements—alongwith the world steel industry’s overcapacity—hurt domesticproducers, as primary metals industries cut 11,000 workersfrom payrolls last year.29 Although that employment declineabout matched the 10,000 drop in 1999, their similarity merelyreflects the passing improvement in this industry in late 1999and early 2000. During that period, steel prices rose andbrought production and employment levels up also. Yet, thesegains were short-lived, as prices slid midyear and the job lossesresumed.30
In the logging industry, imports from January to Novem-ber 2000 rose 30.7 percent, compared with the same period in1999, even while residential construction slowed.31 Those two
factors contributed to the 5,000 workers cut from logging pay-rolls last year. This is a change from the normal pattern. Tradehas traditionally favored logging, which maintained a trade sur-plus and relatively steady payrolls throughout the 1990s.
Apparel, by contrast, has suffered from rising trade deficitsand falling employment during most of that period. In 2000,apparel’s job losses totaled 44,000. Although that decline wasmarkedly milder than the 64,000 jobs shed in 1999, it repre-sented the largest job losses among nondurable goods manu-facturing last year.32 Indeed, from 1994 to 1999, apparel em-ployment plunged by nearly one-third, or 304,000. Increasingimports pushed the industry’s trade deficit up 17.3 percentbetween January and November 2000, with respect to the sameperiod in 1999.
Unlike apparel, the textile industry benefited from actualgains in international trade last year. Exports increased to theAmericas and, to a lesser extent, Asia, and probably helpedslow the shedding of textiles jobs.33 Through November 2000,exports of fabric and yarn grew about 18 percent, with respectto the same period in 1999. Fabric even achieved a slight tradesurplus.34 Trade legislation that passed last year created in-centives for fabric and yarn exports to several regions.35 Inspite of the improvements in exports, textile employment con-tinued to fall. Its 20,000 decline, however, was mild, comparedwith the 34,000 drop in 1999. Furthermore, last year’s job losseswere concentrated in only three industries: knitting mills;textile finishing, except wool; and carpets and rugs (for whichlosses were related to the slowdown in residential construc-tion). In prior years, however, the declines tended to be morewidespread—much like they continue to be in the apparel in-dustry.36
U.S. trade with Asia benefited not only the textiles industry,but also the aircraft industry. Asia’s 1997 financial crisis hadhurt U.S. aerospace manufacturers significantly, as Asian air-lines delayed or canceled orders. In 2000, however, U.S. manu-facturers’ aircraft order books filled up again, thanks partly toAsia’s improving economies, which spurred renewed ordersfor commercial aircraft.37 U.S. carriers also contributed impor-tant bookings, and so unfilled orders for aircraft and partsreached their highest levels since 1998.38 As the backlog oforders increased, the aircraft industry’s job losses abated. Forthe year, employment fell by 18,000 jobs, or about one-third its1999 decline, with most of the declines coming in the first halfof the year. Data on aircraft’s average workweek provide an-other sign of the industry’s improvement. The average of totalweekly paid work hours, as well as those that are overtimehours, rose throughout the year for total gains of 1.1 and 1.6hours, respectively. Nonetheless, they still remained belowtheir 1997 levels, that is, below their levels prior to the reces-sion that affected many Asian economies.
Legislative changes factored into the employment develop-Legislative changes factored into the employment develop-Legislative changes factored into the employment develop-Legislative changes factored into the employment develop-Legislative changes factored into the employment develop-ments in health services and social services—industries inments in health services and social services—industries inments in health services and social services—industries inments in health services and social services—industries inments in health services and social services—industries in

Monthly Labor Review February 2001 11
which employment is closely tied to demographics and gov-which employment is closely tied to demographics and gov-which employment is closely tied to demographics and gov-which employment is closely tied to demographics and gov-which employment is closely tied to demographics and gov-ernment funding.ernment funding.ernment funding.ernment funding.ernment funding. Within health services, home health careservices and hospitals benefited from the implementation of(separate) medicare prospective payment systems. The tran-sition from the Job Training Partnership Act to the WorkforceInvestment Act shifted the seasonal hiring patterns in State,local, and private social services.
Higher medicare payments coincided with renewed hiringin the home health care industry. Home health’s ProspectivePayment System marked the end of the Interim Payment Sys-tem mandated by the 1997 Balanced Budget Act. Announcedin late June and effective October 1, 2000, the medicare pro-spective payment system reimburses home health agencies bya predetermined amount per 60-day treatment “episodes,” andthe reimbursement is adjusted for the level of patient care andregional wage differences.39
The move to the prospective payment system was the sec-ond significant funding increase for home health agencies sincethe cutbacks mandated by 1997’s Balanced Budget Act. Thefirst increase had come with the November 1999 passage of theBalanced Budget Refinement Act, which partially restored fund-ing that had been cut under the Balanced Budget Act.40 Aschart 3 illustrates, the moderate recovery in home health careemployment began about when the 1999 Balanced BudgetRefinement Act was passed. As further reimbursement in-
creases were provided in the prospective payment system,providers expanded their staffs last year by 7,000. This gainrepresented a modest recovery after the industry had lost 68,000jobs in 1998 and another 5,000 in 1999.
Hospitals also benefited from higher medicare reimburse-ments in both 1999 (for inpatient services) and 2000 (for outpa-tient services). Inpatient medicare reimbursements rose underthe Balanced Budget Refinement Act of 1999. On August 1,2000, the hospitals’ outpatient prospective payment systemtook effect, and, like its home health care cousin, it was ex-pected to result in increased medicare reimbursements.41
The impact of higher medicare payments on employment wasnot as clear in hospitals as in home health care, possibly becauseof factors such as decreased managed care and other privatesector payments, which hurt hospital operating margins through1999.42 Reports covering last year indicated that hospital profitsbegan to recover to some extent.43 Private hospitals kept ex-panding their payrolls last year, with employment rising by 50,000.That pace topped 1999’s increase of 35,000 jobs, as well as sur-passing the industry’s annual average gains between 1994 and1998. In contrast to private hospitals, local government hospi-tals had lost jobs each year from 1994 through 1998, and thenadded 4,000 workers in 1999 and 13,000 in 2000.
Social services also were affected by legislative changes in2000. The transition from the Job Training Partnership Act
Chart 3. Employment in hospitals and home health care services, seasonally adjusted, January 1998 – December 2000
Home health care (In thousands)
Hospitals(In thousands)
3,875
3,900
3,925
3,950
3,975
4,000
4,025
4,050
4,075
625
650
675
700
725
Private hospitalsHome health care services
Jan.1998
July1998
Jan.1999
July1999
Jan.2000
July2000
Dec.2000
SOURCE: Bureau of Labor Statistics, Current Employment Statistics survey.

12 Monthly Labor Review February 2001
The Job Market in 2000
(JTPA) to the Workforce Investment Act affected the typicalsummer hiring patterns in private, State, and local social ser-vices, although it is unlikely that the new legislation affectedannual employment growth rates. Historically, the JTPA’s sum-mer programs provided for about 8 weeks of part-time employ-ment for youth, who worked in government or private, non-profit agencies. Under the Workforce Investment Act (passedon August 7, 1998 and implemented in 2000), the summer youthprogram was integrated into the general youth services, whichfocus on a full year of training and activities, and not justsummer employment.44 In addition, not all States had com-pleted their transition by summer, which delayed the fundingand implementation of the new program even as the JTPA pro-gram funding had expired.45 Even States that were preparedfor the transition provided jobs for fewer youth, because thefull-year focus of the Workforce Investment Act requiredgreater funding per participant, although its budget did notrise.46 These factors translated into greatly reduced summerhiring in private, State, and local social services—the indus-tries in which employment of youth under JTPA had been con-centrated.
Although summer hiring fell, the overall employment trendsin these industries remained constant. In 2000, private socialservices employment grew by 169,000, or 6 percent, thus match-ing its 1999 growth rate. Employment in State social serviceswas unchanged in 2000, as in 1999, while local social servicesadded 4,000 workers.
Information technology (Information technology (Information technology (Information technology (Information technology (ITITITITIT) has created thousands of jobs,) has created thousands of jobs,) has created thousands of jobs,) has created thousands of jobs,) has created thousands of jobs,but not all but not all but not all but not all but not all ITITITITIT-related industries benefited during 2000.-related industries benefited during 2000.-related industries benefited during 2000.-related industries benefited during 2000.-related industries benefited during 2000. Ingeneral, industries dealing with semiconductors showed thestrongest gains while growth in computer manufacturing andtrade faltered.
The broadening scope of IT had mixed employment effectsin 2000. Employment in semiconductor manufacturing andtrade rose precisely because of the ever-widening range andsophistication of products incorporating information technol-ogy. At the same time, the most “classic” instrument of IT, thepersonal computer, showed signs of becoming a mature indus-try, as business and consumer PC sales dropped.47 Overallcomputer production did grow, but remained well below ca-pacity, and employment in the industry declined. Employmentrelated to the wholesale and retail sale of computers weak-ened. In short, “information technology” connections did notnecessarily translate into exceptional employment growth in2000.
Last year, employment in electronic components and ac-cessories—primarily, the semiconductor industry—surged by54,000. As the year progressed, industry news increasinglyannounced a slowdown in semiconductor sales, and cited apossible production overcapacity. Slowing demand, however,did not imply weak demand; indeed, the book-to-bill ratio, whichcompares orders to shipments, spent much of the year above
1999’s level.48 Instead of slowing, hiring accelerated duringthe year.
Other manufacturers of IT equipment also hired additionalstaff, albeit at a much slower pace than semiconductors. Com-munications equipment added 7,000 workers, mostly in tele-phone and telegraph apparatus and radio and television andcommunications equipment. The former produces equipmentused to provide land wiring for the Internet; the latter pro-duces cellular telephones.
Industrial machinery, which includes computers, also par-tially played a role in IT-related manufacturing, although itsrole did not translate into job growth. While production andexports of computers and office equipment maintained theirascent last year, the industry’s work force shrank by 8,000.Both semiconductor and computer manufacturers enjoyed ex-traordinary productivity gains in the 1990s.49 One key differ-ence between them—which underscores the strength in prod-uct demand in the semiconductor industry, compared with com-puter manufacturing—was that semiconductor plants oper-ated most of 2000 at or near their reported peak capacity,whereas computer plants operated at about 80 percent capac-ity.50 Acceleration or deceleration in employment growth insemiconductors consistently precedes similar changes in theindustry’s production capacity, and that was likely the caselast year, as this industry accelerated its hiring even after itsplants reached their estimated peak output levels.51
By cutting jobs, computers and office equipment acted prac-tically alone among IT-related manufacturers. In contrast, spe-cial industrial machinery and miscellaneous industrial andcommercial machinery each brought on 5,000 workers. As awhole, these industries may have benefited from semiconduc-tor industry’s acute need to expand, and thus purchase indus-trial equipment.52
Computer manufacturing demonstrates that not all IT indus-tries stood out in terms of job growth. The IT-related parts ofwholesale and retail trade provided even more evidence. (Seecharts 4 and 5.) In 2000, professional and commercial equip-ment distribution (which includes computers) cut 8,000 jobsafter having brought on 22,000 in 1999, and thus accountingfor some of the slowdown in wholesale trade. Employmentgrowth, however, continued in electrical goods distribution.Riding the strength of semiconductor trade, electrical goodswholesalers brought on 24,000 workers, thus exceeding theirprior 5-year average yearly gains of 18,000.
The only distinguishable IT component of retail trade isradio, TV, and computer stores. Between 1994 and 1999, em-ployment in these stores had surged by about 5 percent annu-ally, consistently above retail trade as a whole. In 2000, how-ever, that difference disappeared, as their growth rate droppedto about 1.8 percent. Although last year’s declining computersales would have hurt these stores, sales of other consumerelectronics increased by 14 percent.53 Outside competitionprobably best explains the employment slowdown in radio, TV,

Monthly Labor Review February 2001 13
Chart 4. Information technology in wholesale trade, over-the-year percent change in employment, 1991–2000
Percent change
SOURCE: Bureau of Labor Statistics, Current Employment Statistics survey.
Percent change
-10
-5
0
5
10
-10
-5
0
5
10
1991 1992 1993 1994 1995 1996 1997 1998 1999 2000
Wholesale trade, seasonally adjusted
Professional and commercial equipment,
not seasonally adjusted
Chart 5. Information technology in retail trade, over-the-year percent change in employment, 1991–2000
Percent change
SOURCE: Bureau of Labor Statistics, Current Employment Statistics survey.
Percent change
-10
-5
0
5
10
15
-10
-5
0
5
10
15
1991 1992 1993 1994 1995 1996 1997 1998 1999 2000
Retail trade, seasonally adjusted
Radio, TV, and computer stores,
not seasonally adjusted

14 Monthly Labor Review February 2001
The Job Market in 2000
and computer stores. Part of it came from discount departmentstores, which increasingly used electronics promotions to getcustomers in the door.54 Further competition came throughthe Internet, especially from computer companies that sell theirwares online.55
Like semiconductors in manufacturing, software was a pil-lar of employment growth among IT-related computer serviceindustries in 2000. Prepackaged software brought on 39,000workers, thus equaling its 1999 expansion. Other computerservice industries, such as programming, information retrieval,data processing, and consulting, did not fare as well, withemployment growth plummeting in many industries from their1999 rates. Demand for some IT services may have slackenedas work to ready systems for Y2K was completed. Nonethe-less, it is also likely that computer services may have beenconstrained less by demand than by the supply of labor.
Did labor shortages contribute to a slowdown in job growthDid labor shortages contribute to a slowdown in job growthDid labor shortages contribute to a slowdown in job growthDid labor shortages contribute to a slowdown in job growthDid labor shortages contribute to a slowdown in job growthin some industries?in some industries?in some industries?in some industries?in some industries? Last year, total nonfarm payrolls expandedby 2.1 million jobs, or 1.6 percent, an impressive figure, butthe weakest seen since 1992. The general economic factorsalready presented certainly justify the reduced hiring in manyindustries. Unemployment, nonetheless, remained lowthroughout the year, and anecdotal evidence suggested thatsome firms still had trouble recruiting.56 So, the questionemerges whether the slowdown was partly caused by a laborshortage.
What (indirect) evidence of shortages, then, can data fromthe establishment survey provide?57 At first look, it seemsimplausible that business services would have suffered fromrecruiting difficulties. In 2000, business services once againadded more jobs than any other industry, its payrolls expand-ing by 313,000 workers.58 Yet, its growth rate sank more thanmost industries and reached its lowest level since the 1991recession. Within business services, personnel supply ser-vices (which includes help supply services) and computer anddata processing services experienced sharp slowdowns. Jobgrowth in personnel supply slid from 11 percent in 1999 to 3percent in 2000; in computer services, it dropped from 10 per-cent to 5 percent. General economic factors—such as higherinterest rates and energy prices—certainly entered into theequation, particularly in personnel supply services, which cut39,000 jobs in the fourth quarter. Revenues of temporary helpagencies, as measured by sales of their services, saw theirsmallest percentage growth since the 1991 recession, althoughthey had begun to cool in 1999.59 But was this slowdown dueto less demand for temporary staff or a shortage of workers tofill positions?
Anecdotal evidence continued to point to the difficultiestemporary help firms had in recruiting.60 Hiring less-skilledworkers may not be an option for temporary staffing firms,which instead have witnessed the rise of the “portfolio work-ers,” independent professionals employed through staffing
services.61 That shifting demand toward higher-skilled work-ers may be leading firms into a “war for talent,” in which theweapons include training, health insurance, paid vacations,and money.62 Average hourly earnings growth in help supplyservices reached about 6.8 percent in 2000, after having in-creased 3.4 percent in 1999; for all services industries, earn-ings growth reached 4.4 percent, up from 3.7 percent in 1999.Help supply earnings remain, on average, relatively low, inspite of their rapid rate of growth. The same cannot be said forcomputer and data processing services, where earnings topped$23 an hour, growing by 4.4 percent last year. Thus, there issome evidence from both help supply and computer servicesthat worker shortages have served to bid up wages.
Engineering and management services also requires askilled work force, but unlike business services, its 4.9-percentrate of job growth exceeded 1999’s rate. Furthermore, anyrecruiting troubles this industry may have had did not trans-late into higher pay. Indeed, earnings growth in engineeringand management services decelerated to the point of fallingbelow the rate of inflation.
Although residential building slowed last year, worker short-ages still affected construction. Their influence, however, isunclear, and their effects may be offsetting. On the one hand,some firms that normally would have laid off employees whendemand began to slacken decided instead to retain workers sothey would be available when demand improved. On the otherhand, those firms that wished to expand may have been con-strained from hiring as many workers as necessary. Unlikebusiness services, construction companies can, and have, re-sorted to filling some posts with less skilled workers than thosetraditionally recruited.63 Such a “deskilling” of the construc-tion work force could help hold down the earnings growth ofconstruction workers, but that did not appear to take place lastyear. Earnings growth accelerated to 3.9 percent over the year,with higher growth rates throughout the year, compared with1999. In short, construction, like business services, dealt withmoderating employment growth, but accelerating wage gains.
Recruiting troubles are not necessarily restricted to indus-tries in expansion. Just as these troubles may have dimin-ished hiring in construction and business services, they mayhave led some manufacturing industries to diminish their lay-offs. When needing to increase production, manufacturershave traditionally used overtime before hiring additional work-ers. Last year, however, the flip side of this story unfolded.Coinciding with renewed layoffs, the manufacturing workweekdove to its lowest level since 1992.64 Furthermore, the indus-tries that reduced their workweek the most tended to be theones with a higher proportion of skilled production work-ers—just as they were the ones that increased their use ofovertime the most during the post-recession 1990s.65 Thehigh cost of recruiting and training such workers may havemade manufacturers wary to lay them off, especially givenany uncertainty about how long any downturn would last,
Monthly Labor Review February 2001 15
choosing instead to reduce their work hours.Although some evidence of skilled labor shortages emerges
in construction, business services, and manufacturing, thesame is not the case in several industries with a preponder-ance of low-paid, low-skilled positions. Hotels, amusementand recreation services, and eating and drinking places gen-erally maintained their hiring pace last year. Rising somewhatfrom their 1999 growth rates were hotels, where employmentrose by 3.6 percent, and amusement and recreation services,where it rose 5.7 percent. Eating and drinking places saw itshiring hold firm at 1.6 percent. Combined employment in theseindustries expanded by 293,000. Nonetheless, to find theseworkers, both lodging and dining establishments did have toresort to raising wage rates above 4.2 percent, the wage growthrate for all private industries. Earnings growth for workers inhotels rose to 4.8 percent over the year, versus 3.7 in 1999. Ineating and drinking places, earnings growth reached 4.7 per-cent in 2000, up from 1999’s strong 4.3 percent gain.
If a labor shortage were to emerge, it would most like occurduring the seasonal hiring period when hundreds of thou-sands of workers are needed for temporary jobs. To analyzethe amount of seasonal hiring that took place in these indus-tries, it is necessary to look at the total change in their not-seasonally-adjusted employment series in the months leadingup to the summer. For eating and drinking places, that buildupperiod lasts from February through June, while for hotels andamusement and recreation services, it lasts from Februarythrough July. In the latter industries, 2000’s summer buildupsurpassed every year of the 1990s. Hotels brought on 326,000workers; a 14.4-percent increase from their 1999 seasonal hir-ing, while in amusement and recreation services, 647,000 work-ers came on board—a 17.4-percent increase. Seasonal hiringfor eating and drinking places fell slightly from the levels in1999, but by very little; it totaled 671,000 workers in 2000, ver-sus 689,000 the year earlier. Although it is impossible to saywhether these industries fell short of their seasonal hiring goals,it is clear that, as a group, they were able to exceed their prioryears’ results—at a cost of having to accept relatively highwage growth.
Anecdotal evidence has suggested that firms across manyindustries are having to deal with shortages. Employment andearnings data from the establishment survey does providesome indirect, but not conclusive, evidence of labor short-ages, particularly of skilled workers, in business services, con-struction, and manufacturing. Yet, industries that rely on rela-tively low-skilled help did not appear to end up short-handedin 2000 either for year-round or summer workers, although theirrelatively high wage growth does indicate that firms did havesome difficulty in staffing.
In recent years, the unemployment rate has been at 3-decadeIn recent years, the unemployment rate has been at 3-decadeIn recent years, the unemployment rate has been at 3-decadeIn recent years, the unemployment rate has been at 3-decadeIn recent years, the unemployment rate has been at 3-decadelows and employment has continued to expand, leadinglows and employment has continued to expand, leadinglows and employment has continued to expand, leadinglows and employment has continued to expand, leadinglows and employment has continued to expand, leadingeconomists to look for signs of tightness in the labor market.economists to look for signs of tightness in the labor market.economists to look for signs of tightness in the labor market.economists to look for signs of tightness in the labor market.economists to look for signs of tightness in the labor market.
Concern has arisen as to whether the supply of workers wouldbe adequate to meet growing demand; in fact, the previoussection of this article suggests that supply may not have beenadequate in certain industries. However, as continued em-ployment growth did not result in accelerated wage gains,questions were once again raised as to where the supply ofworkers came from over the year. The CPS is able to provideinformation that can be used, in a limited way, as a measureof the potential supply of workers. It is also able to show, tosome degree, where the newly employed came from in 2000.
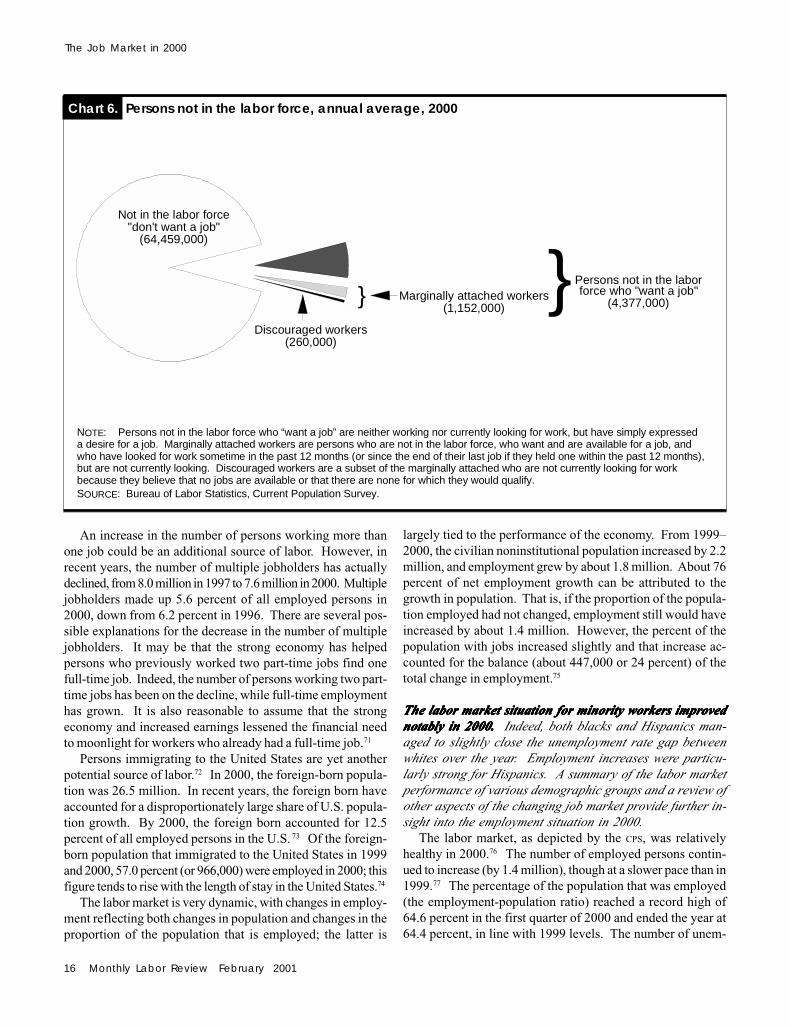
The CPS provides data that can be used to identify two maingroups of potential workers: unemployed individuals and per-sons not in the labor force who indicate that they currentlywant a job. There were 5.7 million unemployed persons and 4.4million who were not in the labor force, but reported that theyindeed wanted a job.66 Of this latter group of persons, 1.2million reported that they actually searched for work within thepast 12 months and were available to take a job if one wereoffered; this group is often referred to as “marginally attached”to the labor force. Among marginally attached workers, 260,000had looked for work in the previous 12 months, but were notcurrently looking, 67 because they believed that no jobs wereavailable for them or that there were none for which they wouldqualify; this group is known as discouraged workers.68 (Seechart 6.)
Since 1994, the number of persons outside the labor forcewho want a job has declined by 30 percent.69 The number whowere currently available, and actually looked, for work within12 months of being surveyed fell by 36 percent. The count ofdiscouraged workers declined even more dramatically, by 48percent between 1994 and 2000. These numbers suggest thatthere may have been significant movement into the labor forceby those previously not participating.
Other potential sources of labor include persons not in thelabor force who report that they do not want a job; an increasein the number of multiple jobholders; and population growth,including persons immigrating to the United States. In 2000,there were 64.5 million persons not in the labor force who, atthe time of the survey, indicated that they did not want a job.However, it is possible that certain persons in this group wouldenter the labor force under the right conditions. For example, aretired 65-year-old who, in 1999, reported that he did not wanta job because of concerns that his Social Security benefitswould decrease might have changed his mind with the repeal,in 2000, of the Social Security “earnings test.”70 Another ex-ample might be a mother who doesn’t want a job because sheis uncomfortable leaving her children with the child-care pro-viders in her area. If conditions were to change—a trustedrelative moved to the area and agreed to watch the children—she may then decide to look for employment. There are count-less scenarios in which changing conditions may induce per-sons to enter the labor force, though previously, they were notinterested.
16 Monthly Labor Review February 2001
The Job Market in 2000
An increase in the number of persons working more thanone job could be an additional source of labor. However, inrecent years, the number of multiple jobholders has actuallydeclined, from 8.0 million in 1997 to 7.6 million in 2000. Multiplejobholders made up 5.6 percent of all employed persons in2000, down from 6.2 percent in 1996. There are several pos-sible explanations for the decrease in the number of multiplejobholders. It may be that the strong economy has helpedpersons who previously worked two part-time jobs find onefull-time job. Indeed, the number of persons working two part-time jobs has been on the decline, while full-time employmenthas grown. It is also reasonable to assume that the strongeconomy and increased earnings lessened the financial needto moonlight for workers who already had a full-time job.71
Persons immigrating to the United States are yet anotherpotential source of labor.72 In 2000, the foreign-born popula-tion was 26.5 million. In recent years, the foreign born haveaccounted for a disproportionately large share of U.S. popula-tion growth. By 2000, the foreign born accounted for 12.5percent of all employed persons in the U.S. 73 Of the foreign-born population that immigrated to the United States in 1999and 2000, 57.0 percent (or 966,000) were employed in 2000; thisfigure tends to rise with the length of stay in the United States.74
The labor market is very dynamic, with changes in employ-ment reflecting both changes in population and changes in theproportion of the population that is employed; the latter is
largely tied to the performance of the economy. From 1999–2000, the civilian noninstitutional population increased by 2.2million, and employment grew by about 1.8 million. About 76percent of net employment growth can be attributed to thegrowth in population. That is, if the proportion of the popula-tion employed had not changed, employment still would haveincreased by about 1.4 million. However, the percent of thepopulation with jobs increased slightly and that increase ac-counted for the balance (about 447,000 or 24 percent) of thetotal change in employment.75
The labor market situation for minority workers improvedThe labor market situation for minority workers improvedThe labor market situation for minority workers improvedThe labor market situation for minority workers improvedThe labor market situation for minority workers improvednotably in 2000. notably in 2000. notably in 2000. notably in 2000. notably in 2000. Indeed, both blacks and Hispanics man-aged to slightly close the unemployment rate gap betweenwhites over the year. Employment increases were particu-larly strong for Hispanics. A summary of the labor marketperformance of various demographic groups and a review ofother aspects of the changing job market provide further in-sight into the employment situation in 2000.
The labor market, as depicted by the CPS, was relativelyhealthy in 2000.76 The number of employed persons contin-ued to increase (by 1.4 million), though at a slower pace than in1999.77 The percentage of the population that was employed(the employment-population ratio) reached a record high of64.6 percent in the first quarter of 2000 and ended the year at64.4 percent, in line with 1999 levels. The number of unem-
Chart 6. Persons not in the labor force, annual average, 2000
NOTE: Persons not in the labor force who “want a job” are neither working nor currently looking for work, but have simply expressed a desire for a job. Marginally attached workers are persons who are not in the labor force, who want and are available for a job, and who have looked for work sometime in the past 12 months (or since the end of their last job if they held one within the past 12 months), but are not currently looking. Discouraged workers are a subset of the marginally attached who are not currently looking for work because they believe that no jobs are available or that there are none for which they would qualify.SOURCE: Bureau of Labor Statistics, Current Population Survey.
Not in the labor force"don't want a job"
(64,459,000)
Discouraged workers(260,000)
Marginally attached workers(1,152,000)
} }Persons not in the labor force who "want a job"
(4,377,000)

Monthly Labor Review February 2001 17
Table 2. Employment status of the civilian noninstitutional population 16 years and older, by selected characteristics, quarterly averages, seasonally adjusted, 1999–2000
[Numbers in thousands]
Change, fourth-Fourth-quarter quarter 1999
1999 First Second Third Fourth to fourthquarter quarter quarter quarter quarter 20001
TOTAL
Civilian labor force ...................................... 140,003 140,737 140,815 140,706 141,208 1,328Participation rate ................................. 67.1 67.4 67.3 67 67.1 0.0
Employed ................................................ 134,263 135,036 135,181 135,049 135,593 1,447Employment-population ratio ............... 64.3 64.6 64.6 64.3 64.4 .1
Unemployed ............................................ 5,740 5,700 5,634 5,657 5,616 –118 Unemployment rate ............................. 4.1 4.1 4.0 4.0 4.0 –.1
Men, 20 years and older ...............
Civilian labor force ...................................... 70,453 70,834 70,741 70,955 71,193 788Participation rate ................................. 76.6 76.9 76.5 76.5 76.5 -.2
Employed ................................................ 68,076 68,487 68,426 68,644 68,768 739Employment-population ratio ............... 74.0 74.4 74.0 74.0 73.9 –.1
Unemployed ............................................ 2,377 2,347 2,315 2,310 2,425 49Unemployment rate .............................. 3.4 3.3 3.3 3.3 3.4 .0
Women, 20 years and older ...........
Civilian labor force ...................................... 61,140 61,508 61,666 61,429 61,657 583Participation rate ................................. 60.8 61.1 61.1 60.7 60.7 –.1
Employed ................................................ 58,925 59,273 59,399 59,203 59,546 684Employment-population ratio ............... 58.6 58.9 58.9 58.5 58.6 .0
Unemployed ............................................ 2,215 2,234 2,267 2,226 2,111 –102Unemployment rate .............................. 3.6 3.6 3.7 3.6 3.4 –.2
Both sexes, 16 to 19 years ........
Civilian labor force ...................................... 8,410 8,395 8,407 8,322 8,358 –42Participation rate ................................. 52.2 51.9 52.4 52.1 52.3 .1
Employed ................................................ 7,261 7,276 7,356 7,202 7,278 24Employment-population ratio ............... 45.1 45.0 45.9 45.1 45.5 .3
Unemployed ............................................ 1,148 1,119 1,051 1,121 1,080 –67Unemployment rate .............................. 13.7 13.3 12.5 13.5 12.9 –.8
.............................. White ..............................
Civilian labor force ...................................... 116,919 117,579 117,535 117,468 117,729 873Participation rate ................................. 67.3 67.6 67.5 67.3 67.3 –.1
Employed ................................................ 112,816 113,459 113,481 113,348 113,635 878Employment-population ratio ............... 64.9 65.2 65.1 64.9 64.9 .0
Unemployed ............................................ 4,103 4,120 4,054 4,121 4,095 –5Unemployment rate .............................. 3.5 3.5 3.4 3.5 3.5 .0
................................................................... Black .................................................................................................
Civilian labor force ...................................... 16,503 16,619 16,579 16,510 16,700 218Participation rate ................................. 66 66.3 65.9 65.4 65.8 –.2
Employed ................................................ 15,170 15,322 15,306 15,258 15,452 302Employment-population ratio ............... 60.6 61.1 60.8 60.4 60.9 .3
Unemployed ............................................ 1,333 1,297 1,273 1,252 1,248 –84Unemployment rate .............................. 8.1 7.8 7.7 7.6 7.5 –.6
................................................................... Hispanic origin ...........................................................................................
Civilian labor force ...................................... 14,918 15,215 15,314 15,356 15,596 693Participation rate ................................. 68.0 68.8 68.7 68.3 68.8 .8
Employed ................................................ 14,015 14,324 14,443 14,490 14,723 721Employment-population ratio ............... 63.9 64.8 64.8 64.4 64.9 1.0
Unemployed ............................................ 903 892 870 866 873 –28Unemployment rate .............................. 6.1 5.9 5.7 5.6 5.6 –.5
2000
1 Estimates of over-the-year changes have been adjusted to reflect revi-sions to population controls introduced in January 2000.
NOTE: Detail for race and Hispanic-origin groups will not sum to totals
Characteristic
because data for the “other races” group are not presented and Hispanics areincluded in both the white and black population groups.
SOURCE: Bureau of Labor Statistics, Current Population Survey.
18 Monthly Labor Review February 2001
The Job Market in 2000
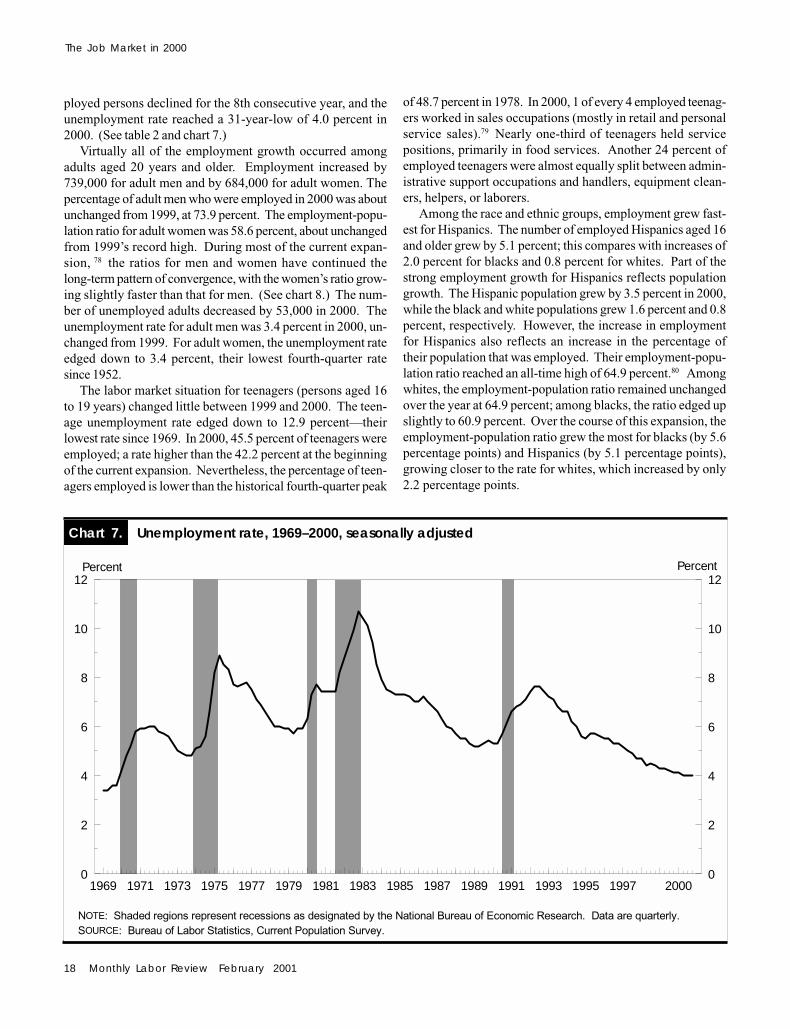
ployed persons declined for the 8th consecutive year, and theunemployment rate reached a 31-year-low of 4.0 percent in2000. (See table 2 and chart 7.)
Virtually all of the employment growth occurred amongadults aged 20 years and older. Employment increased by739,000 for adult men and by 684,000 for adult women. Thepercentage of adult men who were employed in 2000 was aboutunchanged from 1999, at 73.9 percent. The employment-popu-lation ratio for adult women was 58.6 percent, about unchangedfrom 1999’s record high. During most of the current expan-sion, 78 the ratios for men and women have continued thelong-term pattern of convergence, with the women’s ratio grow-ing slightly faster than that for men. (See chart 8.) The num-ber of unemployed adults decreased by 53,000 in 2000. Theunemployment rate for adult men was 3.4 percent in 2000, un-changed from 1999. For adult women, the unemployment rateedged down to 3.4 percent, their lowest fourth-quarter ratesince 1952.
The labor market situation for teenagers (persons aged 16to 19 years) changed little between 1999 and 2000. The teen-age unemployment rate edged down to 12.9 percent—theirlowest rate since 1969. In 2000, 45.5 percent of teenagers wereemployed; a rate higher than the 42.2 percent at the beginningof the current expansion. Nevertheless, the percentage of teen-agers employed is lower than the historical fourth-quarter peak
of 48.7 percent in 1978. In 2000, 1 of every 4 employed teenag-ers worked in sales occupations (mostly in retail and personalservice sales).79 Nearly one-third of teenagers held servicepositions, primarily in food services. Another 24 percent ofemployed teenagers were almost equally split between admin-istrative support occupations and handlers, equipment clean-ers, helpers, or laborers.
Among the race and ethnic groups, employment grew fast-est for Hispanics. The number of employed Hispanics aged 16and older grew by 5.1 percent; this compares with increases of2.0 percent for blacks and 0.8 percent for whites. Part of thestrong employment growth for Hispanics reflects populationgrowth. The Hispanic population grew by 3.5 percent in 2000,while the black and white populations grew 1.6 percent and 0.8percent, respectively. However, the increase in employmentfor Hispanics also reflects an increase in the percentage oftheir population that was employed. Their employment-popu-lation ratio reached an all-time high of 64.9 percent.80 Amongwhites, the employment-population ratio remained unchangedover the year at 64.9 percent; among blacks, the ratio edged upslightly to 60.9 percent. Over the course of this expansion, theemployment-population ratio grew the most for blacks (by 5.6percentage points) and Hispanics (by 5.1 percentage points),growing closer to the rate for whites, which increased by only2.2 percentage points.
Chart 7. Unemployment rate, 1969–2000, seasonally adjusted
Percent Percent
NOTE: Shaded regions represent recessions as designated by the National Bureau of Economic Research. Data are quarterly.SOURCE: Bureau of Labor Statistics, Current Population Survey.
1969 1971 1973 1975 1977 1979 1981 1983 1985 1987 1989 1991 1993 1995 1997 20000
2
4
6
8
10
12
0
2
4
6
8
10
12

Monthly Labor Review February 2001 19
The unemployment rates for Hispanics (5.6 percent) andblacks (7.5 percent) declined to record lows in 2000, whereasthe rate for whites (3.5 percent) was unchanged from the prioryear’s 3-decade low.81 Though the unemployment rate forwhites remained lower than that for blacks and Hispanics, thegaps between the unemployment rates for whites and blacksand for whites and Hispanics narrowed over the year.
Among workers aged 25 years and older, all of the employ-ment gains were for workers with at least some college experi-ence. Employment increased by 534,000 for workers with somecollege, and by 642,000 for workers with a bachelor’s degree ormore.82 For workers with a high school diploma or less, em-ployment declined. The unemployment rate was about un-changed for persons with less than a high school education(at 6.4 percent) and edged up for persons with a high schooldiploma (to 3.5 percent). The unemployment rate remainedabout unchanged for persons with some college experience (at2.6 percent) and among college graduates (at 1.6 percent).
The number of employed persons aged 16 and older work-ing usual full-time schedules (35 hours or more) increased to112.3 million in 2000, accounting for 83.1 percent of the workforce.83 The percentage of workers employed full time hasincreased steadily since 1994 when it was 81.1 percent.84 In2000, men were more likely to have usual full-time schedulesthan were women; 89.8 percent of all employed men, compared
with 75.3 percent of employed women. However, the numberof women working full-time schedules has been growing fasterthan that for men. Since 1994, the number of women workingfull-time increased by 15.7 percent; this compares with an in-crease of 10.4 percent for men.
Of the number of persons at work part time in 2000, 3.2million (or 10.8 percent) did so for economic reasons, such asonly being able to find part-time work. Since 1994, the numberof persons at work part time for economic reasons has de-clined by 31.0 percent. Among those at work part time in 2000,women were less likely (8.8 percent) than men (14.1 percent) towork part time for economic reasons.
Of the total number of employed persons in 2000, the vastmajority (93 percent) were wage and salary workers.85 Most ofthe remaining 7 percent were self-employed, a percentage thathas been on a long-term downward trend. In 1948, almost 1 in5 workers were self-employed, many of them as farmers. 86
(See charts 9 and 10.) In 2000, men were more likely to be self-employed than women; 8.3 percent of working men were self-employed, versus 5.9 percent of employed women.
In addition to the 9.7 million persons who were self-employedin 2000, there were 4.4 million wage and salary workers who ownedbusinesses that were incorporated.87 The number of incorpo-rated self-employed workers grew by 59,000 in 2000. Men weremore likely to own an incorporated business than were women;
Chart 8. Employment-population ratio of adults ages 20 and older, 1948–2000, seasonally adjusted
Percent Percent
0
10
20
30
40
50
60
70
80
90
100
0
10
20
30
40
50
60
70
80
90
100
MenWomen
1948 1952 1956 1960 1964 1968 1972 1976 1980 1984 1988 1992 1996 2000

20 Monthly Labor Review February 2001
The Job Market in 2000
Chart 9. Self-employed as percentage of total employed, seasonally adjusted, 1948–2000
Percent Percent
0
2
4
6
8
10
12
14
16
18
20
0
2
4
6
8
10
12
14
16
18
20
1948 1952 1956 1960 1964 1968 1972 1976 1980 1984 1988 1992 1996 2000
NOTE: Data are quarterly.SOURCE: Bureau of Labor Statistics, Current Population Survey.
Percent Percent
Chart 10. Share of total self-employed in agriculture, seasonally adjusted, fourth quarters, 1948–2000
1948 1952 1956 1960 1964 1968 1972 1976 1980 1984 1988 1992 1996 2000
0
20
40
60
80
100
0
20
40
60
80
100
SOURCE: Bureau of Labor Statistics, Current Population Survey.

Monthly Labor Review February 2001 21
of those business owners, almost two-thirds were men.Among all wage and salary workers, employment grew the
most in service occupations (811,000), followed by sales andadministrative support occupations (493,000), and managerialand professional specialty occupations (340,000). 88 Within thesebroad occupational categories, strong growth occurred in foodservices, finance and business service sales, and financial recordsprocessing. Strong employment growth also occurred for math-ematical and computer scientists, and schoolteachers.
Median usual weekly earnings increased faster than inflationMedian usual weekly earnings increased faster than inflationMedian usual weekly earnings increased faster than inflationMedian usual weekly earnings increased faster than inflationMedian usual weekly earnings increased faster than inflationin 2000, marking the fourth consecutive year of increases inin 2000, marking the fourth consecutive year of increases inin 2000, marking the fourth consecutive year of increases inin 2000, marking the fourth consecutive year of increases inin 2000, marking the fourth consecutive year of increases inreal earnings.real earnings.real earnings.real earnings.real earnings.8989898989 Earnings gains were widespread, growingparticularly fast for blacks. The earnings gaps between blacksand whites closed slightly in 2000. At the same time, the num-ber of hourly paid workers earning the minimum wage or lessdecreased.
Median usual weekly earnings of full-time wage and salaryworkers were $576 in 2000, up 4.9 percent from $549 in 1999.90
The earnings gain was larger than the 3.4-percent rise in pricesfrom 1999 to 2000, as measured by the Consumer Price Index forAll Urban Consumers (CPI-U). In 2000, median weekly earningsfor men who usually work full time were $646, compared with$491 for women. Since the Bureau of Labor Statistics began regu-larly collecting information on usual median weekly earnings inthe CPS in 1979, the ratio of women’s to men’s earnings has in-creased by 13.5 percentage points. 91 Women have gone frommaking 62.5 cents for every $1 earned by men in 1979, to making
76.0 cents for every dollar in 2000. There are many possiblefactors underlying the continuing disparity between the earn-ings of men and women. Among these factors are differ-ences in work schedules, educational attainment, length ofexperience in the work force, occupational and industrymakeup of each group, and discrimination.
Among the race and ethnic groups, median weekly earn-ings rose the fastest for blacks, up 5.2 percent to $468. Thiscompares with an increase of 3.1 percent to $591 for whitesand an increase of 2.9 percent to $396 for Hispanics. The gapin earnings between blacks and whites closed slightly in2000. Over the course of the expansion, earnings increasedby about 34 percent for whites and blacks; this compareswith an increase of 27 percent for Hispanics. The disparity inearnings between the race and ethnic groups may be tied tothe same factors as that for men and women: differences ineducational attainment, length of experience in the work force,occupational and industry makeup of the groups, and dis-crimination.
In 2000, median usual weekly earnings rose in all fourmajor educational groups. (See table 3.) Among personsaged 25 and older, earnings increased the most for workerswith a college degree, rising by 4.2 percent over the year to$896. Earnings for persons with some college experience oran associate’s degree increased by 3.1 percent to $598, whileearnings for persons with a high school diploma increasedby 3.3 percent to $506, and earnings for those with less thana high school diploma increased by 4.0 percent to $360.
Table 3. Quartiles and selected deciles of usual weekly earnings of full-time wage and salary workers, by educational attainment, annual averages 1999–2000
Upper limit of:
Educational attainment Number Secondof workers First First quartile Third Ninth
(in thousands) decile quartile (median) quartile decile
2000
Total, 25 years and older ............................................ 87,984 $294 $407 $611 $909 $1,344 Less than a high school diploma ............................ 8,523 225 280 360 508 706
High school graduates, no college .......................... 27,637 279 364 506 716 966Some college or associate degree .......................... 24,452 312 422 598 834 1,136College graduates, total .......................................... 27,372 448 625 896 1,325 1,870
1999
Total, 25 years and older ............................................ 86,352 $284 $393 $592 $872 $1,260Less than a high school diploma ............................. 8,459 215 267 346 494 680High school graduates, no college .......................... 27,314 270 349 490 688 932Some college or associate degree .......................... 23,949 300 404 580 798 1,079College graduates, total .......................................... 26,630 430 607 860 1,243 1,749
............................................................
SOURCE: Bureau of Labor Statistics, Current Population Survey.
NOTE: Ten percent of all full-time wage and salary workers earn less thanthe upper limit of the first decile; 25 percent earn less than the upper limit of the
first quartile; 50 percent earn less than the upper limit of the second quartile,or median; 75 percent earn less than the upper limit of the third quartile; and90 percent earn less than the upper limit of the ninth decile.

22 Monthly Labor Review February 2001
The Job Market in 2000
Among workers who had attained at least a high schooldiploma, earnings for the highest paid workers increased morethan earnings for the lowest paid. For high school graduateswith some college experience, earnings for the lowest paidworkers increased by 4.0 percent to $312, while the highestpaid graduates saw their earnings rise by 5.3 percent to $1,136.Among persons with a college degree, the difference in earn-ings growth for low and high paid workers was even morepronounced, 4.2 percent to $448 for the lowest paid and 6.9percent to $1,870 for the highest paid.
For the second consecutive year, earnings for workers withless than a high school diploma increased at a faster rate forthe lowest-paid workers than for the highest paid. Amongthese workers, earnings for the lowest paid workers increasedby 4.7 percent to $225, while the highest-paid workers sawtheir earnings increase by 3.8 percent to $706.
Of the 120.8 million wage and salary workers (aged 16 andolder) in 2000, 60.2 percent were paid hourly rates. Of thesehourly paid workers, 3.7 percent (or 2.7 million) earned theprevailing minimum wage or less; significantly lower than theseries peak of 15.1 percent in 1980.92 Part of the decrease overtime in the proportion of workers with earnings at or below theprevailing minimum reflect the fact that minimum wage increaseshave not kept up with overall wage growth. For example, from1981–90, median hourly earnings rose by 41.6 percent, whilethe minimum wage rate was unchanged. It is reasonable toassume that many of those who would have earned minimumwage benefited from the general rise in the market wages overthis period. The increase in earnings would bring these per-sons above the minimum wage, and hence, the percentage ofemployed persons earning the minimum wage would likelydecrease.
In 2000, women were more likely than men to be earningthe minimum wage or less; 4.8 percent of hourly paid women,compared with 2.6 percent of hourly paid men. However, thisgap closed a bit over the year, as the decrease in the number ofwomen earning minimum wage or less was greater than thedecrease in the number of men earning minimum wage or less.
Nine out of every ten families with children under the age ofNine out of every ten families with children under the age ofNine out of every ten families with children under the age ofNine out of every ten families with children under the age ofNine out of every ten families with children under the age of18 had an employed parent in 2000.18 had an employed parent in 2000.18 had an employed parent in 2000.18 had an employed parent in 2000.18 had an employed parent in 2000. A greater percentage ofwhite families with children had at least one employed par-ent than had Hispanic families. In turn, a greater percentageof Hispanic families with children had an employed parentthan had black families. In almost 2 out of every 3 married-couple households, both the mother and the father were em-ployed. However, the age of the youngest child appears tohave influenced the labor market activity of the parents.93
Of the 34.3 million families with children under the age of 18in 2000,94 73 percent (or 24.9 million) were married-couple fami-lies.95 Unmarried mothers maintained the majority of the re-maining families (7.6 million), while unmarried fathers main-tained 1.8 million families with children.96 Of the families main-
tained by an unmarried parent, the percentage maintained bythe father increased from 16 percent in 1994 to 19 percent in2000. Among families with children under the age of 18, white(77 percent) and Hispanic (71 percent) families were more likelyto be maintained by married couples than were black families(43 percent). However, since 1994, the proportion of black andHispanic families with children that are headed by marriedcouples has increased slightly. For whites, that proportionhas declined slightly.
The vast majority (92.0 percent) of all families with childrenunder the age of 18 had at least one parent who was employedin 2000.97 (See table 4.) Married-couple households were morelikely to have at least one employed parent than were familiesmaintained by an unmarried parent; 97.5 percent of married-couple families, compared with 75.5 percent of families main-tained by the mother and 86.5 percent of families maintainedby the father. Both the mother and father worked in 7 out ofevery 10 married-couple families whose youngest child wasaged 6 to 17. If the youngest child was under the age of 6, bothparents worked in slightly fewer than 6 out of every 10 married-couple families. The father, but not the mother, was employedin almost 2 in 5 married-couple families with children under theage of 6. It was relatively uncommon in 2000 for mothers ofchildren younger than 6 to be working and not the fathers; thisoccurred in only 3.0 percent of such families.
White families with children under the age of 18 were morelikely to have an employed parent (93.7 percent) than wereHispanic families (88.6 percent), who in turn were more likelythan black families, (82.8 percent).98 However, since 1994, thepercentage of families with at least one employed parent hasincreased by 11.2 percentage points for blacks and 9.5 per-centage points for Hispanics; this compares with an increaseof 3.1 percentage points for whites. In 2000, both the motherand father worked in 67.9 percent of black married-couple fami-lies and 64.2 percent of white families with children under theage of 18, compared with 51.3 percent of Hispanic families. Incontrast, the father worked, but not the mother in 40.1 percentof Hispanic families; this compares with 29.9 percent of whitefamilies and 20.2 percent of black families.
The average combined weekly hours at work for marriedcouples with children edged up to 65.5 hours in 2000.99 Since1969, total weekly hours have increased by 9.3 hours (to 68.1hours) for couples with children aged 6 to 17, by 10.3 hours (to63.9 hours) for couples with children aged 3 to 5, and by 11.7hours (to 60.7 hours) for couples with children under 3 years ofage. Most of the increase in average combined weekly hoursat work for married couples with children can be attributed toan increase in the labor force participation rate among marriedwomen, and to their trend toward year-round work.
In 1999, the latest year for which annual income data areavailable, the median yearly income of families with childrenunder 18 years old was $48,711. 100 Married-couple families inwhich both parents (and no other family members) worked had

Monthly Labor Review February 2001 23
Table 4. Families with children by employment status of parents, age of youngest child,1 and family type, annual averages, 1994–2000[Levels in thousands]
Characteristic1994 1995 1996 1997 1998 1999 2000
Families with children under 18
Total .......................................................... 33,189 33,544 33,980 34,129 34,232 34,340 34,340With employed parents ........................................... 29,086 29,659 30,296 30,761 31,100 31,493 31,600
Percent of total ................................................... 87.6 88.4 89.2 90.1 90.9 91.7 92.0...................................................................................
Married-couple families, total ...................................... 24,319 24,604 24,818 24,762 24,820 24,904 24,915Percent with: .............................................................. 100.0 100.0 100.0 100.0 100.0 100.0 100.0
Father employed, not mother .................................. 28.6 28.5 28.2 28.2 28.9 29.1 29.2Mother employed ..................................................... 67.3 67.6 68.3 68.7 68.1 68.2 68.3
Father and mother employed ............................... 62.6 63.0 63.9 64.5 64.1 64.1 64.2Mother employed, not father ............................... 4.7 4.6 4.4 4.2 4.0 4.2 4.1
Neither parent employed ......................................... 4.1 3.9 3.5 3.1 2.9 2.7 2.5...................................................................................
Families maintained by mother ................................... 7,414 7,433 7,469 7,623 7,573 7,653 7,613Percent with employed mother ................................ 61.6 64.0 65.9 69.2 71.8 74.7 75.5
Families maintained by father ..................................... 1,455 1,507 1,692 1,745 1,839 1,782 1,812Percent with employed father ................................. 82.4 83.7 83.7 85.8 85.5 86.3 86.5
................................................................................... Families with youngest child 6 to 17 ..........
Total .......................................................... 17,993 18,270 18,694 18,989 19,209 19,364 19,382With employed parents ........................................... 16,078 16,391 16,892 17,274 17,551 17,825 17,892
Percent of total ................................................... 89.4 89.7 90.4 91.0 91.4 92.1 92.3
Married-couple families, total ...................................... 12,819 13,001 13,257 13,442 13,496 13,565 13,628Percent with: .............................................................. 100.0 100.0 100.0 100.0 100.0 100.0 100.0
Father employed, not mother .................................. 22.6 22.5 21.8 21.9 22.8 22.6 22.0Mother employed ..................................................... 73.5 73.5 74.6 74.8 74.0 74.6 75.2
Father and mother employed ............................... 67.9 68.0 69.5 69.8 69.2 69.6 70.3Mother employed, not father ............................... 5.5 5.5 5.2 5.1 4.8 4.9 4.9
Neither parent employed ......................................... 4.0 4.0 3.5 3.3 3.2 2.9 2.8
Families maintained by mother ................................... 4,302 4,360 4,393 4,531 4,638 4,722 4,668Percent with employed mother ................................ 70.8 72.1 73.3 74.9 77.0 79.1 79.6
Families maintained by father ..................................... 872 909 1,044 1,015 1,075 1,077 1,086Percent with employed father ................................. 83.1 84.3 84.8 86.8 84.9 84.8 85.5
................................................................................... Families with youngest child under 6 ..........
Total .......................................................... 15,196 15,275 15,286 15,141 15,023 14,976 14,958With employed parents ........................................... 13,009 13,267 13,405 13,487 13,550 13,670 13,709
Percent of total ................................................... 85.6 86.9 87.7 89.1 90.2 91.3 91.6...................................................................................
Married-couple families, total ...................................... 11,500 11,604 11,562 11,320 11,324 11,340 11,287Percent with: .............................................................. 100.0 100.0 100.0 100.0 100.0 100.0 100.0
Father employed, not mother .................................. 35.4 35.3 35.6 35.6 36.2 36.9 37.8Mother employed ..................................................... 60.4 60.9 61.0 61.4 61.1 60.7 59.9
Father and mother employed ............................... 56.6 57.3 57.4 58.2 58.0 57.4 56.9Mother employed, not father ............................... 3.8 3.6 3.6 3.3 3.1 3.3 3.0
Neither parent employed ......................................... 4.2 3.8 3.4 2.9 2.7 2.4 2.2...................................................................................
Families maintained by mother ................................... 3,112 3,073 3,076 3,092 2,936 2,931 2,945Percent with employed mother ................................ 49.0 52.5 55.2 60.9 63.6 67.4 69.1
Families maintained by father ..................................... 584 598 648 729 763 705 726Percent with employed father ................................. 81.2 82.9 82.1 84.6 86.5 88.5 88.0
Total, all races
1 Children are own children and include sons, daughters, step-children, andadopted children. Not included are nieces, nephews, grandchildren, and otherrelated and unrelated children.
2 Refers to families maintained by never married, widowed, divorced, orseparated persons.
SOURCE: Bureau of Labor Statistics, Current Population Survey .
2
2
2
2
2
2
a median income of $62,424. In married-couple families in whichonly one parent worked, median income depended on whetherit was the mother or father who worked; income for families inwhich only the father worked was $42,955; this compares witha median of $31,248 when only the mother worked. Among
families maintained by an employed, unmarried parent, medianincome was $18,933 for families headed by mothers and $30,924for families maintained by fathers.
Job growth continued across the United States as the NationJob growth continued across the United States as the NationJob growth continued across the United States as the NationJob growth continued across the United States as the NationJob growth continued across the United States as the Nation

24 Monthly Labor Review February 2001
The Job Market in 2000
enjoyed its tenth consecutive year of economic expansion, withenjoyed its tenth consecutive year of economic expansion, withenjoyed its tenth consecutive year of economic expansion, withenjoyed its tenth consecutive year of economic expansion, withenjoyed its tenth consecutive year of economic expansion, withthe largest gains once again occurring in the the largest gains once again occurring in the the largest gains once again occurring in the the largest gains once again occurring in the the largest gains once again occurring in the WWWWWest and South.est and South.est and South.est and South.est and South.Unemployment rates were steady or down slightly from theUnemployment rates were steady or down slightly from theUnemployment rates were steady or down slightly from theUnemployment rates were steady or down slightly from theUnemployment rates were steady or down slightly from thefourth quarter of 1999. During 2000, more than half the Statesfourth quarter of 1999. During 2000, more than half the Statesfourth quarter of 1999. During 2000, more than half the Statesfourth quarter of 1999. During 2000, more than half the Statesfourth quarter of 1999. During 2000, more than half the Statesachieved record low quarterly unemployment rates.achieved record low quarterly unemployment rates.achieved record low quarterly unemployment rates.achieved record low quarterly unemployment rates.achieved record low quarterly unemployment rates.
Unemployment. Every census region and geographic di-vision attained its lowest quarterly unemployment rate onrecord in 2000.101 (See table 5.) The most marked unem-ployment rate declines over the year were recorded in theNortheast region, -0.4 percentage point, and its New Englanddivision, -0.8 point. The unemployment rate was down slightlyin the South region, driven by declines in the West SouthCentral and South Atlantic divisions. The Midwest rate heldvirtually steady over the year, despite a 0.4-percentage pointrise in the West North Central division. The West region’srate was also essentially unchanged from 1999.
The relative positions of regions and divisions with respectto unemployment rates were largely stable over the year, ow-ing to the lack of significant change in many parts of the coun-try. The lowest regional unemployment rate was again re-ported in the Midwest (3.5 percent), which has held this dis-tinction for each of the past 10 years. The highest incidence ofregional joblessness was observed in the West (4.5 percent)for the ninth consecutive year. After experiencing a 0.4-per-centage point drop from the previous quarter, New Englandrecorded the lowest jobless rate (2.4 percent) among geographicdivisions at the close of 2000. This is also the lowest quarterlyunemployment rate on record for any region or division, and itmarks the first quarter since 1989 that the lowest unemploy-
ment rate was posted by a division other than the West NorthCentral. Meanwhile, the Pacific division registered the highestrate (4.8 percent) for the eighth year in a row.
Twenty-eight States established new quarterly low unem-ployment rates in 2000, while an additional five registered ratesthat matched lows established in a previous year. Four of thefive States in the East North Central division, as well as sevenof the eight States constituting the Mountain division, achievednew or equaled previous lows. In contrast, only 1 of the 5States composing the Pacific division reported a new quarterlylow in 2000. (See map 1.) New low monthly jobless rates wereregistered by 37 States in 2000, including all those in the EastNorth Central and East South Central divisions.
Employment. Nonfarm payroll employment increased in all fourcensus regions in 2000.102 The most rapid expansion occurred inthe West (2.9 percent) and South (2.0 percent). The Midwest hadthe slowest rate of increase (0.9 percent), just slightly below thatof the Northeast (1.3 percent). These relative growth rates werereinforced by population shifts; in general, growth in the Southand West has been buoyed by migration from the Northeast andMidwest in recent years. Even after adjusting for differences inpopulation growth, however, the relative ranking of job growthamong regions remains the same. Among the nine geographicdivisions, gains ranged from 0.6 percent in the East South Centralto 3.1 percent in the Mountain division. The Pacific (2.7 percent),West South Central (2.3 percent), and South Atlantic (2.2 per-cent) divisions also had above-average growth rates. The tabu-lation on page 25 lists nonfarm payroll employment growth in2000 (in thousands).
Table 5. Unemployment rates for regions and divisions, quarterly averages, seasonally adjusted, 1999–2000
2000
First Second Third Fourthquarter quarter quarter quarter
Northeast region .............................................. 4.2 3.9 3.8 3.8 3.8 –0.4New England division ................................... 3.2 2.8 2.7 2.8 2.4 –.8Middle Atlantic division ................................ 4.6 4.3 4.2 4.2 4.3 –.3
Midwest region ................................................. 3.4 3.3 3.4 3.5 3.5 .1East North Central division .......................... 3.7 3.6 3.7 3.9 3.7 .0West North Central division ......................... 2.7 2.6 2.7 2.7 3.1 .4
South region .................................................... 4.0 3.9 3.9 3.8 3.8 –.2South Atlantic division ................................. 3.7 3.5 3.5 3.5 3.5 –.2East South Central division ......................... 4.3 4.2 4.2 4.1 4.4 .1West South Central division ......................... 4.4 4.4 4.3 4.2 4.1 –.3
West region ..................................................... 4.6 4.5 4.6 4.6 4.5 –.1Mountain division ......................................... 3.9 3.7 3.6 3.7 3.7 –.2Pacific division ............................................. 4.9 4.8 5.0 5.0 4.8 –.1
SOURCE: Bureau of Labor Statistics, Local Area Unemployment Statistics Program.
Region and divisionFourth
quarter1999
Over-the-year
change
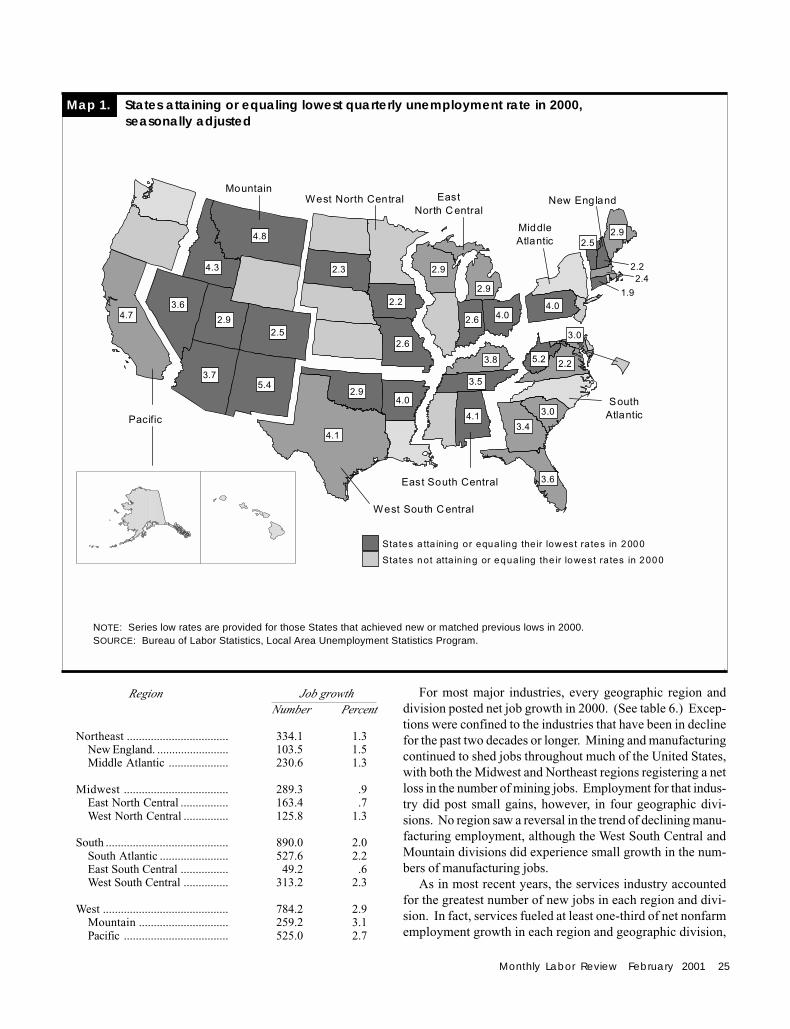
Monthly Labor Review February 2001 25
Region Job growthNumber Percent
Northeast .................................. 334.1 1.3New England. ........................ 103.5 1.5Middle Atlantic .................... 230.6 1.3
Midwest ................................... 289.3 .9East North Central ................ 163.4 .7West North Central ............... 125.8 1.3
South ......................................... 890.0 2.0South Atlantic ....................... 527.6 2.2East South Central ................ 49.2 .6West South Central ............... 313.2 2.3
West .......................................... 784.2 2.9Mountain .............................. 259.2 3.1Pacific ................................... 525.0 2.7
For most major industries, every geographic region anddivision posted net job growth in 2000. (See table 6.) Excep-tions were confined to the industries that have been in declinefor the past two decades or longer. Mining and manufacturingcontinued to shed jobs throughout much of the United States,with both the Midwest and Northeast regions registering a netloss in the number of mining jobs. Employment for that indus-try did post small gains, however, in four geographic divi-sions. No region saw a reversal in the trend of declining manu-facturing employment, although the West South Central andMountain divisions did experience small growth in the num-bers of manufacturing jobs.
As in most recent years, the services industry accountedfor the greatest number of new jobs in each region and divi-sion. In fact, services fueled at least one-third of net nonfarmemployment growth in each region and geographic division,
Map 1. States attaining or equaling lowest quarterly unemployment rate in 2000, seasonally adjusted
2.92.5
4.0
3.0
5.2 2.2
#
2.2#
2.4#
1.9
3.8
3.5
4.13.4
3.0
3.6
4.02.9
4.1
2.6 4.0
2.9
2.9
2.2
2.6
2.3
2.5
5.4
2.9
3.7
3.6
4.3
4.8
4.7
#
Mountain
#
West North Central
#
EastNorth C entral
#
MiddleAtlantic
#
New England
#
SouthAtlantic
#
East South Central
#
West South C entral
#
Pacific
States not atta in ing or equa ling the ir lowest rates in 2000
States a tta ining or equa ling their low est rates in 2000
NOTE: Series low rates are provided for those States that achieved new or matched previous lows in 2000.SOURCE: Bureau of Labor Statistics, Local Area Unemployment Statistics Program.

26 Monthly Labor Review February 2001
The Job Market in 2000
Table 6. Percentage change in total nonfarm wage and salary employment by geographic division and major industry, seasonally adjusted, fourth quarter 1999–fourth quarter 2000
Transportation Finance, GovernmentDivision Mining Construction Manufacturing and Trade insurance, Services Government
utilities and realestate
New England ........................... 4.9 6.0 –0.6 0.8 1.2 1.0 2.3 1.5Middle Atlantic ........................ –4.6 3.6 –1.2 1.1 1.3 .8 2.4 .6East North Central .................. –3.8 1.3 –.9 1.1 .9 .7 1.4 1.4West North Central ................. .0 .6 –.3 1.2 1.2 .9 2.5 1.3South Atlantic ......................... –.9 2.9 –1.3 2.7 1.6 2.0 4.0 1.7East South Central ................. –2.5 1.0 –2.2 1.2 1.0 .1 1.9 1.4West South Central ................ 1.7 4.1 .1 3.3 2.6 2.1 2.8 1.7Mountain ................................. .3 3.1 .9 3.0 3.2 1.1 3.9 3.6Pacific .................................... .7 7.4 –.3 3.3 2.2 1.4 4.0 2.5
SOURCE: Bureau of Labor Statistics, State and Area Current Employment Statistics Program.
while accounting for more than one-half the growth in 3 of the4 regions and 6 of the 9 geographic divisions. Trade rankedsecond in net job creation in all 4 regions and all geographicdivisions except the East South Central, where governmentwas the second most plentiful source of net job growth. Of themajor industries, construction exhibited the highest percent-age growth rates in the West (5.8 percent) and Northeast (4.3percent) regions, while services grew at the quickest pace ofany industry in the South (3.3 percent) and Midwest (1.7 per-cent). Construction grew most rapidly in 4 of the 9 geographicdivisions—most notably at the brisk pace of 7.4 percent in thePacific division. The services industry exhibited the fastestgrowth in 4 of the 5 remaining geographic divisions.
Growth rates in excess of 3.0 percent were registered by atleast one major industry in all geographic divisions except theEast North Central, West North Central, and East South Central.The Mountain and Pacific divisions, which experienced the fast-est overall growth, showed widespread strength, as seven majorindustries combined had growth rates above 3.0 percent.
THE LABOR MARKET BEGAN THE YEAR 2000 on a strong note,
though the rate of growth slowed by the end of the year.Overall, nonfarm payroll employment increased by 1.6 per-cent over the year, down from its 2.2 percent growth in 1999.Slowing came in construction and across the service-produc-ing industries, due to a combination of factors including higherinterest rates, energy prices, and labor shortages. Miningemployment, however, benefited from the higher energy prices.Manufacturing job losses diminished from 1999 to 2000, partlydue to the strength of IT-related manufacturing and to im-provements in aircraft orders. Yet, weakening in manufactur-ing industries related to construction and motor vehicles con-tributed to a reacceleration of factory job losses in the secondhalf of the year.
The labor market situation improved for minority workersin 2000. The employment-population ratio reached recordhighs for both blacks and Hispanics. Also, blacks and His-panics slightly closed the unemployment rate gap betweenwhites, and blacks slightly closed the earnings gap betweenwhites. The overall unemployment rate ended the year at 4.0percent, the lowest rate since 1969. All four regions of theUnited States had historically low unemployment rates in 2000.
Notes
ACKNOWLEDGMENT: The authors thank Thomas Krolik, an econo-mist in the Division of Local Area Unemployment Statistics, for hisanalysis of regional employment and unemployment.
1 See the statements from the February, March, and May 2000 FederalOpen Market Committee meetings, available on the Internet at http:// http:// http:// http:// http://wwwwwwwwwwwwwww.federalr.federalr.federalr.federalr.federalreserve.gov/fomceserve.gov/fomceserve.gov/fomceserve.gov/fomceserve.gov/fomc (last accessed December 2000).
2 At the time this article was written, fourth-quarter GDP data werenot yet available.
3 Gross Domestic Product: Third Quarter 2000 (Final), Bureau of
Economic Analysis, December 21, 2000. http://wwwhttp://wwwhttp://wwwhttp://wwwhttp://www.bea.doc.gov/.bea.doc.gov/.bea.doc.gov/.bea.doc.gov/.bea.doc.gov/bea/newsrel/gdp300f.htmbea/newsrel/gdp300f.htmbea/newsrel/gdp300f.htmbea/newsrel/gdp300f.htmbea/newsrel/gdp300f.htm (last accessed in January 2001).
4 See box on page 4 for an explanation of conceptual differencesbetween the Current Population Survey (CPS) and the Current Employ-ment Statistics survey (CES).
5 Federal Reserve Chairman Alan Greenspan indicated in mid-Octoberthat “to date, the [general economic] spillover from the surge in oilprices has been modest.” Remarks made at the 18th Annual MonetaryConference: Monetary Policy in the New Economy, Cato Institute, Wash-ington, D.C., on the Internet at http://wwwhttp://wwwhttp://wwwhttp://wwwhttp://www.federalr.federalr.federalr.federalr.federalreserve.gov/eserve.gov/eserve.gov/eserve.gov/eserve.gov/boarddocs/speeches/2000/200010192.htmboarddocs/speeches/2000/200010192.htmboarddocs/speeches/2000/200010192.htmboarddocs/speeches/2000/200010192.htmboarddocs/speeches/2000/200010192.htm (visited November 2000).

Monthly Labor Review February 2001 27
MCMCMCMCMC_poised_for_comeback.html_poised_for_comeback.html_poised_for_comeback.html_poised_for_comeback.html_poised_for_comeback.html (visited November 2000).
23 Data from the U.S. Census Bureau, Manufacturers’ ShipmentsInventories, and Orders program, available on the Internet at http://http://http://http://http://wwwwwwwwwwwwwww.census.gov/indicator/www/m3/index.html.census.gov/indicator/www/m3/index.html.census.gov/indicator/www/m3/index.html.census.gov/indicator/www/m3/index.html.census.gov/indicator/www/m3/index.html (visited January2001).
24 See for example the June, August, and September 1999 BeigeBook summaries, available on the Internet at http://http://http://http://http://wwwwwwwwwwwwwww.federalr.federalr.federalr.federalr.federalreserve.gov/eserve.gov/eserve.gov/eserve.gov/eserve.gov/FOMCFOMCFOMCFOMCFOMC/BeigeBook/1999/BeigeBook/1999/BeigeBook/1999/BeigeBook/1999/BeigeBook/1999 (visited January2001).
25 Trade data by SIC is available from the U.S. International TradeCommission’s interactive tariff and trade dataweb, http://http://http://http://http://dataweb.usitc.govdataweb.usitc.govdataweb.usitc.govdataweb.usitc.govdataweb.usitc.gov (visited January 2001).
26 This is a comparison of January–November 2000 retail sales withrespect to the same period in 1999. The Census Bureau produces data onretail sales, which are available on the Internet at http://http://http://http://http://wwwwwwwwwwwwwww.census.gov/econ/www/r.census.gov/econ/www/r.census.gov/econ/www/r.census.gov/econ/www/r.census.gov/econ/www/retmenu.htmletmenu.htmletmenu.htmletmenu.htmletmenu.html (visited January 2001).
27 See Key Trends in Securities Industry since 1990, Securities Indus-try Association, on the Internet at http://wwwhttp://wwwhttp://wwwhttp://wwwhttp://www.sia.com/publications/.sia.com/publications/.sia.com/publications/.sia.com/publications/.sia.com/publications/html/trends_during_1990s.htmlhtml/trends_during_1990s.htmlhtml/trends_during_1990s.htmlhtml/trends_during_1990s.htmlhtml/trends_during_1990s.html (visited December 2000).
28 The U.S. Census Bureau produces these data covering U.S. im-ports for consumption of steel products, not seasonally adjusted, forJanuary through November 1999 and 2000. The data are availableonline at http://wwwhttp://wwwhttp://wwwhttp://wwwhttp://www.census.gov/for.census.gov/for.census.gov/for.census.gov/for.census.gov/foreign-trade/Preign-trade/Preign-trade/Preign-trade/Preign-trade/Press-Release/ess-Release/ess-Release/ess-Release/ess-Release/steel_index.html steel_index.html steel_index.html steel_index.html steel_index.html (visited January 2001).
29 Robert Guy Matthews, “Too much steel, too few remedies,” TheWall Street Journal, Oct. 23, 2000.
30 See the PPI for blast furnaces and basic steel products, availableonline at wwwwwwwwwwwwwww.bls.gov/ppihome.htm.bls.gov/ppihome.htm.bls.gov/ppihome.htm.bls.gov/ppihome.htm.bls.gov/ppihome.htm (visited January 2001).
31 Import data by SIC industry comes from the U.S. InternationalTrade Commissions tariff and trade dataweb.
32 The comparison is made at the 2-digit level using the 1987Standard Industrial Classification (SIC) system.
33 Import data by SIC industry comes from the U.S. InternationalTrade Commissions tariff and trade dataweb.
34 Data are from the U.S. International Trade Commission’s Inter-active Tariff and Trade dataweb, and from the International TradeAdministration Office of Textiles and Apparel, on the Internet at http:/http:/http:/http:/http://otexa.ita.doc.gov/otexa.ita.doc.gov/otexa.ita.doc.gov/otexa.ita.doc.gov/otexa.ita.doc.gov (January 2001).
35 Passed in May 2000, The Trade and Development Act of 2000provided (as of October 1, 2000) eligible countries duty-free, quota-freetreatment for apparel assembled from U.S.-made fabric, yarn, and thread,or from fabric formed in any beneficiary country from U.S.-manufac-tured yarns. The text is available on the Internet at http://http://http://http://http://frwebgate.access.gpo.gov/cgi-bin/getdoc.cgi?dbname=106_congfrwebgate.access.gpo.gov/cgi-bin/getdoc.cgi?dbname=106_congfrwebgate.access.gpo.gov/cgi-bin/getdoc.cgi?dbname=106_congfrwebgate.access.gpo.gov/cgi-bin/getdoc.cgi?dbname=106_congfrwebgate.access.gpo.gov/cgi-bin/getdoc.cgi?dbname=106_cong_public_laws&docid=f:publ200.106_public_laws&docid=f:publ200.106_public_laws&docid=f:publ200.106_public_laws&docid=f:publ200.106_public_laws&docid=f:publ200.106 (last visited December 2000).
36 Textile finishing involves operations including bleaching, dyeing,printing (roller, screen, flock, plisse), and other mechanical finishing,such as preshrinking, calendering, and napping. Establishments in thisindustry perform finishing operations on purchased textiles or on acommission basis. The continued job losses in this industry contrast withthe end of such losses in broadwoven fabric mills and yarn and threadmills. See Standard Industrial Classification Manual, 1987, available onthe Internet at http://wwwhttp://wwwhttp://wwwhttp://wwwhttp://www.osha.gov/oshstats/sicser.osha.gov/oshstats/sicser.osha.gov/oshstats/sicser.osha.gov/oshstats/sicser.osha.gov/oshstats/sicser.html.html.html.html.html (visitedJanuary 2001).
37 “The U.S. aerospace industry booked $32.4 billion in firm or-ders,” Aviation Week & Space Technology, Sept. 18, 2000.
6 Over-the-year employment changes in this part of the article arebased on fourth quarter comparisons of data from the Current Employ-ment Statistics survey, using preliminary estimates for November andDecember 2000.
7 Data from the Energy Information Administration, on the Internetat http://wwwhttp://wwwhttp://wwwhttp://wwwhttp://www.eia.doe.gov/pub/oil_gas/petr.eia.doe.gov/pub/oil_gas/petr.eia.doe.gov/pub/oil_gas/petr.eia.doe.gov/pub/oil_gas/petr.eia.doe.gov/pub/oil_gas/petroleum/data_publica-oleum/data_publica-oleum/data_publica-oleum/data_publica-oleum/data_publica-tions/weekly_petroleum_status_report/current/txt/table13f.txttions/weekly_petroleum_status_report/current/txt/table13f.txttions/weekly_petroleum_status_report/current/txt/table13f.txttions/weekly_petroleum_status_report/current/txt/table13f.txttions/weekly_petroleum_status_report/current/txt/table13f.txt(visited January 2001).
8 The merger-related job cuts by petroleum companies are citednumerous times in the industry and financial press. See, for example,Tracy Cox, “Economies of larger scale,” National Petroleum News,May 1999.
9 Christopher Palmeri, “Big Oil’s Priority: Pump up the Stock Price,”Business Week, Sept. 25, 2000.
10 Production as measured by the Federal Reserve’s Industrial pro-duction index for petroleum products (SIC 29), on the Internet at http:/http:/http:/http:/http://www/www/www/www/www.federalr.federalr.federalr.federalr.federalreserve.gov/reserve.gov/reserve.gov/reserve.gov/reserve.gov/releases/G17/table2a.htmeleases/G17/table2a.htmeleases/G17/table2a.htmeleases/G17/table2a.htmeleases/G17/table2a.htm (visited Janu-ary 2001).
11 The December 1999–2000 change in gas prices are measured bythe CPI-U for gasoline.
12 Sales data are published by the Automotive News Data Center.These data are available on the Internet at http://wwwhttp://wwwhttp://wwwhttp://wwwhttp://www.automotive.automotive.automotive.automotive.automotivenews.comnews.comnews.comnews.comnews.com (visted January 2001).
13 Mary Connelly, “High-profit SUVs pass pickups,” AutomotiveNews, Oct. 16, 2000.
14 Russell Grantham, “Fuel prices, other woes put trucking firms onthe skids,” The Atlanta Journal-Constitution, Sept. 30, 2000; Chern YehKwok, “Trucking Industry Hit Hard by Record-High Gas Prices,” St.Louis Post-Dispatch, Sept. 19, 2000. Truck tonnage data is published inthe American Trucking Association’s Monthly Truck Tonnage Report.
15 See, for example, “A surprise in January: Class 8 sales rise again,”Automotive News, Feb. 28, 2000.
16 Sales data refer to Class 8 trucks and are published by AutomotiveNews.
17 Truck tractor manufacturing is classified within part of motorvehicle assembly (SIC 3711) in the Standard Industrial ClassificationManual, 1987.
18 See the statements from the February, March, and May 2000Federal Open Market Committee meetings, available on the Internet athttp://wwwhttp://wwwhttp://wwwhttp://wwwhttp://www.federalr.federalr.federalr.federalr.federalreserve.gov/fomceserve.gov/fomceserve.gov/fomceserve.gov/fomceserve.gov/fomc (visited January 2001).
19 The value of construction put-in-place statistics are produced bythe U.S. Census Bureau; they are available on the Internet at http://http://http://http://http://wwwwwwwwwwwwwww.census.gov/const/www/c30index.html.census.gov/const/www/c30index.html.census.gov/const/www/c30index.html.census.gov/const/www/c30index.html.census.gov/const/www/c30index.html (visited January 2001).
20 The 2000 Federal Reserve Beige Book summaries consistentlyreported a softening in residential construction, but did not note anywaning in commercial building until later in the year. These reports areavailable on the Internet at http://wwwhttp://wwwhttp://wwwhttp://wwwhttp://www.federalr.federalr.federalr.federalr.federalreserve.gov/eserve.gov/eserve.gov/eserve.gov/eserve.gov/FOMCFOMCFOMCFOMCFOMC/////BeigeBook/2000BeigeBook/2000BeigeBook/2000BeigeBook/2000BeigeBook/2000 (visited January 2001).
21 Data produced by the Mortgage Bankers Association of Americaand published online at http://wwwhttp://wwwhttp://wwwhttp://wwwhttp://www.mbaa.org/marketdata.mbaa.org/marketdata.mbaa.org/marketdata.mbaa.org/marketdata.mbaa.org/marketdata (visitedJanuary 2001).
22 Sheila Muto, “Prefab Home Makers See Sales Slowdown—BuyersTend to Be First to Feel Effects of Tighter Credit,” The Wall StreetJournal, May 18, 2000; and “Manufactured Housing Industry Begins toRebuild Itself,” report by the Manufactured Housing Institute, availableon the Internet at http://wwwhttp://wwwhttp://wwwhttp://wwwhttp://www.manufactur.manufactur.manufactur.manufactur.manufacturedhousing.org/edhousing.org/edhousing.org/edhousing.org/edhousing.org/

28 Monthly Labor Review February 2001
The Job Market in 2000
38 Data on unfilled orders for aircraft, missiles, space vehicles andparts are from the U.S. Census Bureau, Manufacturers’ Shipments, Inven-tories, and Orders program, available on the Internet at http://http://http://http://http://wwwwwwwwwwwwwww.census.gov/indicator/www/m3/index.html.census.gov/indicator/www/m3/index.html.census.gov/indicator/www/m3/index.html.census.gov/indicator/www/m3/index.html.census.gov/indicator/www/m3/index.html (visited January2001).
39 Vince Galloro, “Embracing PPS,” Modern Healthcare, Sept. 25,2000, p. 14.
40 The text of the Balanced Budget Refinement Act of 1999 is avail-able online at http://wwwhttp://wwwhttp://wwwhttp://wwwhttp://www.hcfa.gov/r.hcfa.gov/r.hcfa.gov/r.hcfa.gov/r.hcfa.gov/regs/bbraegs/bbraegs/bbraegs/bbraegs/bbra (last visited January 2001).
41 Richard Haugh, “A long-awaited (yet dreaded) debut,” Hospitals& Health Networks, Sept. 2000, p. 16.
Unlike the prior cost-based system, the outpatient prospective pay-ment system pays hospitals set amounts for about 700 procedure groups.Reimbursements are calculated using national average historical costswith an adjustment for regional wage differences. See, for example, AnnSaphir, “New PPS brings mixed blessing,” Modern Healthcare, June 26,2000, pp. 86–88.
42 Laurie McGinley, “Hospitals feel sting of cuts from insurers,” TheWall Street Journal, Mar. 16, 2000, p. B2.
43 Mary Chris Jaklevic, “Positive outlook for not-for-profits,”Modern Healthcare, Oct. 30, 2000, p. 2; and Barbara Kirchheimer,“Profits up for four hospital chains,” Modern Healthcare, Oct. 30,2000, p. 20.
44 Both the Job Partnership Training Act and the Workforce In-vestment Act are available on the Internet at http://wdrhttp://wdrhttp://wdrhttp://wdrhttp://wdr.doleta.gov/.doleta.gov/.doleta.gov/.doleta.gov/.doleta.gov/readroom/legislationreadroom/legislationreadroom/legislationreadroom/legislationreadroom/legislation (last visited January 2001).
45 Brian Sharp, “Onestop job shopping progresses, slowly,” GannettNews Service, June 30, 2000. Alice Lipowicz, “City slapped over jobtraining program: Funds delayed, critics charge city just doesn’t care,”Crain’s New York Business, Aug. 21, 2000.
46 Carlos Tejada, “Fewer youths get a shot at summertime jobsprograms,” The Wall Street Journal, June 27, 2000.
47 See, for example, Wes Basel, “No More Desks to Conquer,” TheDismal Scientist, http://wwwhttp://wwwhttp://wwwhttp://wwwhttp://www.dismal.com/todays_econte_120600_.dismal.com/todays_econte_120600_.dismal.com/todays_econte_120600_.dismal.com/todays_econte_120600_.dismal.com/todays_econte_120600_2.asp2.asp2.asp2.asp2.asp (visited December 2000).
48 This measure is a ratio of 3-month moving average bookings to3-month moving average shipments for the North American semicon-ductor equipment industry. It is produced by Semiconductor Equipmentand Materials International and Arthur Andersen and is published onlineat http://wwwhttp://wwwhttp://wwwhttp://wwwhttp://www.semi.org/web/wmktstats.nsf.semi.org/web/wmktstats.nsf.semi.org/web/wmktstats.nsf.semi.org/web/wmktstats.nsf.semi.org/web/wmktstats.nsf (visited January 2001).
49 Output per hour in Computer and office equipment surged by 875percent between 1990 and 1998; data are from the Bureau of LaborStatistics Industry Labor Productivity program, http://wwwhttp://wwwhttp://wwwhttp://wwwhttp://www.bls.gov/.bls.gov/.bls.gov/.bls.gov/.bls.gov/iprhome.htmiprhome.htmiprhome.htmiprhome.htmiprhome.htm (visited January 2001).
50 Historical data from the Federal Reserve’s Industrial Productionand Capacity Utilization program, http://wwwhttp://wwwhttp://wwwhttp://wwwhttp://www.federalr.federalr.federalr.federalr.federalreserve.gov/eserve.gov/eserve.gov/eserve.gov/eserve.gov/releases/G17releases/G17releases/G17releases/G17releases/G17 (visited January 2001).
51 Although it seems intuitively true that employment growth wouldprecede production capacity growth, this relationship does not appearas consistently for some other manufacturing industries as it does forsemiconductors.
52 Wes Basel, “IT Wags the Dog,” The Dismal Scientist, http://http://http://http://http://wwwwwwwwwwwwwww.dismal.com/todays_econ/te_080200.asp..dismal.com/todays_econ/te_080200.asp..dismal.com/todays_econ/te_080200.asp..dismal.com/todays_econ/te_080200.asp..dismal.com/todays_econ/te_080200.asp.
53 This is a comparison of January–November 2000 retail sales,with respect to the same period in 1999. The Census Bureau producesdata on retail sales, which are available on the Internet at http://http://http://http://http://
wwwwwwwwwwwwwww.census.gov/econ/www/r.census.gov/econ/www/r.census.gov/econ/www/r.census.gov/econ/www/r.census.gov/econ/www/retmenu.htmletmenu.htmletmenu.htmletmenu.htmletmenu.html (visited January 2001).
54 That is one strategy that department stores have used to try torecover market share from specialty retailers. Employment in depart-ment stores maintained its long-term downward march last year, with5,000 jobs dropping off payrolls. See, for example, Evan Ramstad andAnn Zimmerman, The Next Big Holiday Thing(s)—Anxious RetailersAwait Walmart Promotion,” The Wall Street Journal, Oct. 5, 2000.
55 Those online sales operations are classified within wholesaletrade.
56 Each Federal Reserve Beige Book in 2000 cited reports of laborshortages, particularly of “qualified workers.”
57 The payroll survey cannot provide direct evidence because itmeasures the number of payroll positions that firms have filled, butnot how many positions firms would like to fill and cannot.
58 The comparison is at the 2-digit SIC level.
59 The American Staffing Association publishes quarterly data onsales of temporary help services, available online at http://http://http://http://http://wwwwwwwwwwwwwww.natss.org/staf.natss.org/staf.natss.org/staf.natss.org/staf.natss.org/staffstats/qtrlytrfstats/qtrlytrfstats/qtrlytrfstats/qtrlytrfstats/qtrlytrends.htmends.htmends.htmends.htmends.htm (visited January 2001).
60 Jianfeng Pei, “Labor shortage restrains temporary-staffingfirms,” Purchasing, May 18, 2000.
61 See, for example, Timothy W. Brogan, “Thriving in a Dwin-dling Pool of Available Workers,” Staffing Success, May-June 2000; itis also available on the Internet at http://wwwhttp://wwwhttp://wwwhttp://wwwhttp://www.natss.org/staf.natss.org/staf.natss.org/staf.natss.org/staf.natss.org/staffstats/fstats/fstats/fstats/fstats/analysis.htmanalysis.htmanalysis.htmanalysis.htmanalysis.htm (visited November 2000).
62 Staffing Industry Analysts, “Staffing Industry Assisted and Re-strained by Tight Job Market,” press release, May 17, 2000, availableonline at http://wwwhttp://wwwhttp://wwwhttp://wwwhttp://www.sir.sir.sir.sir.sireporeporeporeporeport.com/prt.com/prt.com/prt.com/prt.com/pressressressressressreleases/foreleases/foreleases/foreleases/foreleases/forecastrecastrecastrecastrecastrelease.elease.elease.elease.elease.htmlhtmlhtmlhtmlhtml (visited December 2000).
63 David B. Oppendahl, “Understanding the (relative) fall and riseof construction wages,” Chicago Fed Letter, July 2000.
64 The manufacturing workweek in December may have been affectedby winter storms in the Midwest, and so, part of its December decline from41.2 hours to 40.4 hours likely reflects that weather impact.
65 Ron L. Hetrick, “Analyzing the recent upward surge in overtimehours,” Monthly Labor Review, February 2000, pp. 30–33.
66 The data in this section of the article are annual averages.
67 Currently looking refers to job search activity conducted withinthe 4 weeks preceding the survey. Had these persons been lookingwithin that period, they would have been counted as unemployedrather than not in the labor force.
68 An analysis of data on persons not in the labor force, but whoindicated that they want a job, reveals that their labor market attach-ment is generally weak. Specifically, Monica Castillo (“Persons out-side the labor force who want a job,” Monthly Labor Review, July 1998,pp. 34–42) found that 41 percent of persons not in the labor force in1994 who said they wanted a job were actually in the labor force a yearlater. The percentage was slightly higher for marginally attached workers(48 percent). For discouraged workers, 45 percent were in the laborforce in 1995.
69 A redesigned Current Population Survey was introduced in 1994.Some of the categories of persons not in the labor force were subject tomajor changes in definition. As a result, historical comparisons forthese categories are only possible back to 1994.
70 The repeal of the Social Security “earnings test” came about with

Monthly Labor Review February 2001 29
the Senior Citizens’ Freedom to Work Act of 2000. For more informa-tion, see the Social Security Legislative Bulletin (The President Signs the“Senior Citizens’ Freedom to Work Act of 2000"), on the Internet athttp://wwwhttp://wwwhttp://wwwhttp://wwwhttp://www.ssa.gov/legislation/legis_bulletin_040700.html .ssa.gov/legislation/legis_bulletin_040700.html .ssa.gov/legislation/legis_bulletin_040700.html .ssa.gov/legislation/legis_bulletin_040700.html .ssa.gov/legislation/legis_bulletin_040700.html (visitedNovember 2000).
71 A May 1997 supplement to the Current Population Survey onreasons for working more than one job showed that 4 out of every 10multiple jobholders did so to meet regular household expenses or to payoff debts. For more information, see “When one job is not enough,”ISSUES in Labor Statistics, August 2000.
72 In fact, interest in hiring foreign workers has increased, notably insectors, such as high-tech, where companies report difficulty in findingqualified workers. One result is the recent signing into law of a bill thatwould increase the number of H-1B visas issued to skilled technologyworkers from abroad.
73 Information on the labor force status of the foreign-born arereadily available from the Current Population Survey going back to1996.
74 The employment-population ratio increased with the number ofyears the foreign-born spent in the United States, peaking at 72.2 per-cent in 2000 for persons who immigrated between 1975–84.
75 To calculate the change in employment that is due to populationgrowth, the employment-to-population ratio for the first time period isapplied to the population for the second period, and the employmentlevel derived is compared with the employment level for the first pe-riod. To calculate the change in employment due to shifts in the propor-tion of the population among the separate labor force categories, mul-tiply the population estimate for the second period by the difference inthe employment-population ratios for the two periods. This changedescribes net change between labor force categories, not the gross flowsbetween categories.
76 The data presented in this section of the article are seasonallyadjusted fourth quarter figures, and over-the-year changes are based onfourth-quarter 1999 to fourth-quarter 2000 comparisons, unless other-wise noted.
77 Beginning in January 2000, the population controls used in theCPS were revised to reflect newly updated information on immigrationand an upward revision in the number of deaths. As a result, the civiliannoninstitutional population 16 years and older was lowered by about215,000. The labor force level decreased by about 125,000 and em-ployment declined by 120,000. Overall and subgroup unemploymentrates and other percentages of labor market participation were notsignificantly affected. Over-the-year changes in this article, which aregenerally based on fourth-quarter-1999 to fourth-quarter-2000 com-parisons, have been adjusted for the effects of these revised populationcontrols, unless otherwise noted.
78 The National Bureau of Economic Research (NBER) determinedthat the trough of the recession in the early 1990s occurred in March1991; hence, the expansion of the 1990s officially began in March1991. The NBER designation will be used in this article. However, itshould be noted that many labor market indicators showed weaknesseswell into 1992. The unemployment rate, for example, did not peak untilJune 1992.
79 Data on employment by occupation are not seasonally adjusted.
80 Historical data on the employment-population ratio are availablebeginning in 1954 for whites, 1972 for blacks, and 1973 for Hispanics.
81 Historical data on unemployment are available beginning in 1954for whites, 1972 for blacks, and 1973 for Hispanics.
82 Over-the-year changes in employment status by educational at-tainment have not been adjusted to reflect revised population controlsbecause adjustment factors were not available.
83 The data presented on full-time and part-time schedules are an-nual averages.
84 Data for 1994 and subsequent years are not directly comparablewith data for 1993 and earlier years because of the introduction of amajor redesign of the Current Population Survey.
85 Data on class-of-worker status are not seasonally adjusted. Theover-the-year changes have not been adjusted to reflect revised popula-tion controls because adjustment factors were not available for all of theclass-of-worker categories.
86 Self-employed persons are those who work for profit or fees intheir own businesses, professions, trades, or farms. Only the unincorpo-rated self-employed are included in the self-employed category. Personswith incorporated businesses are classified as wage and salary workersbecause they are paid employees of a corporation.
87 Persons whose businesses are incorporated are technically wageand salary workers because they are paid employees of a corporation.
88 Data on employment by occupation are not seasonally adjusted.
89 Median earnings figures indicate the value that divides the earn-ings distribution into two equal parts, one part having values above themedian and the other having values below the median. Earnings arebefore taxes and other deductions, and include any overtime pay, com-missions, or tips usually received (at the main job in the case of multiplejobholders). Data refer to wage and salary workers (excluding all self-employed persons regardless of whether or not their businesses wereincorporated) who usually work full time on their sole or primary job.
90 The data presented in this part of the article are annual averages,and changes are based on a comparison of 1999 and 2000 figures. Over-the-year changes in median weekly earnings were not adjusted for re-vised population controls because adjustment factors were not available.
91 This aggregate ratio does not control for differences in manyvariables that may affect earnings. For more information on trends inthe earnings of women, see Mary Bowler, “Women’s earnings: an over-view,” Monthly Labor Review, December 1999, pp. 13–21.
92 The prevailing Federal minimum wage was $5.15 in 2000 and$3.35 in 1981.
93 The Current Population Survey tabulates information on thelabor market activity of all household members aged 16 and older. How-ever, this section looks at the employment status of the parents only.
94 Children are own children and include sons, daughters, stepchil-dren, and adopted children. Not included are nieces, nephews, grandchil-dren, and other related and unrelated children.
95 The data on the labor force status of parents in families are annualaverages. The Current Population Survey has information on familylabor force status readily available on an annual average basis going backto 1994. Similar data are available from the March supplement to theCPS; these data are available going back to 1975. The annual average datawere used in this article because, by definition, they are based on 12months of data rather than 1, and hence, provide stronger estimates.
96 In the Current Population Survey, families maintained by themother or by the father refer to parents never married, widowed, di-vorced, or separated.
97 This represents employment in a typical week in 2000. It is

30 Monthly Labor Review February 2001
The Job Market in 2000
expected that the percentage of families in which at least one parenthad work experience in 2000 (worked at least some time during theyear) would be higher. Indeed, the March 2000 Current PopulationSurvey data on work experience in the prior year show that about 95percent of families with children had at least one parent with workexperience in 1999.
98 A family is considered to have the same race and ethnicity as thehouseholder. The “householder” refers to the person (or one of thepeople) in whose name the housing unit is owned or rented (main-tained) or, if there is no such person, any adult member, excludingroomers, boarders, or paid employees. If the house is owned or rentedjointly by a married couple, the householder may be either the husbandor the wife. The person designated as the householder is the “referenceperson” to whom the relationship of all other household members, ifany, is recorded.
99 The data on average combined weekly hours at work are unpub-lished and were specially tabulated from the CPS for this article.
100 Information on weekly earnings for families is not readily avail-able from the Current Population Survey; however, data on familyincome are tabulated from the March supplements to the CPS by theBureau of the Census. Though information on median income for fami-lies in 2000 is not yet available, the March 2000 supplement providesinformation pertaining to income in 1999.
101 The four regions and nine divisions are composed of the follow-ing States and the District of Columbia: Northeast: New Englanddivision—Connecticut, Maine, Massachusetts, New Hampshire, RhodeIsland, Vermont; Middle Atlantic division—New Jersey, New York, Penn-sylvania; South: South Atlantic division—Delaware, District of Colum-bia, Florida, Georgia, Maryland, North Carolina, South Carolina, Vir-ginia, West Virginia; East South Central division—Alabama, Kentucky,Mississippi, Tennessee; West South Central division—Arkansas, Louisi-ana, Oklahoma, Texas; Midwest: East North Central division—Illinois,Indiana, Michigan, Ohio, Wisconsin; West North Central division—Iowa,Kansas, Minnesota, Missouri, Nebraska, North Dakota, South Dakota;West: Mountain division—Arizona, Colorado, Idaho, Montana, Ne-vada, New Mexico, Utah, Wyoming; Pacific division—Alaska, Califor-nia, Hawaii, Oregon, Washington.
With the exception of California, State monthly unemploymentrate series began in January of 1978. The California series began inJanuary of 1980. Hence, quarterly unemployment rate series for theWest region and the Pacific division date from the first quarter of1980, while series for all other regions and divisions date from the firstquarter of 1978.
102 Employment estimates for census regions and divisions are thesum of State estimates and are not intended to add to national totals.In addition, they are subject to revision resulting from re-estimationand updated seasonal adjustment effective with the release of January2001 data.