the isotope effect 111 the displacement of tritium …
TRANSCRIPT

THE ISOTOPE EFFECT 111 THE DISPLACEMENT OF TRITIUM AND HYDROGEN FROM A NICKEL
SURFACE.
THESIS
submitted for the degree of
DOCTOR OF PHILOSOPHY
of the
UNIVERSITY OF GLASGOW
by
G. Kennedy L. Cranstoun, B.Sc., A.R.I.C.
August, 1962.

ProQuest Number: 13849333
All rights reserved
INFORMATION TO ALL USERS The quality of this reproduction is dependent upon the quality of the copy submitted.
In the unlikely event that the author did not send a com p le te manuscript and there are missing pages, these will be noted. Also, if material had to be removed,
a note will indicate the deletion.
uestProQuest 13849333
Published by ProQuest LLC(2019). Copyright of the Dissertation is held by the Author.
All rights reserved.This work is protected against unauthorized copying under Title 17, United States C ode
Microform Edition © ProQuest LLC.
ProQuest LLC.789 East Eisenhower Parkway
P.O. Box 1346 Ann Arbor, Ml 48106- 1346

ACKNOWLEDGMENTS
I wish to express sincere thanks to my Supervisor,Dr* S.J* Thomson, for suggesting the research problem, andfor his helpful advice and unfailing patience and enthusiasm,particularly during the writing of this thesis.
I would like also to thank Dr. K.C. Campbell for much helpful discussion and practical advice, and Dr. R. Thirsk and Mr. E.H. Boult, of King*s College, Newcastle-upon-Tyne, for undertaking the electron microscope studies.
I am also grateful to Mr. J. McAllister for carrying outthe nickel analysis.
G.K.L. CRANSTOUN.
CONTENTS
Page
Acknowledgment s AbstractIntroduction 1Chapter 1. Study of the displacement by mercury of hydrogen
and of tritium from the surface of vacuum evaporated nickel films 7
1.1. Preparation of the nickel films 8
1.2. The adsorption-desorption apparatus 91.3. The adsorption process 101.4. The desorption process 111.5* Continuous estimation of adsorbed mercury 121.6. Tritium counting ’ 131.7» The pressure gauges 13
(a) The McLeod gauge 13(b) The Pirani gauges 14
1.8. Estimation of total error incurred during the dete3>-mination of the specific activity of the desorbed gas samples 15
Chapter 2. Results of adsorption and desorption experimentson vacuum evaporated nickel films 16
2.1. Adsorption of tritiated hydrogen by vacuum evaporatednickel films 16
2.2. Early experiments on the application of the differentialisotope method 19
Page2.3. Later experiments on the differential isotope method 24
2.4* Detailed studies of the desorption process 312.5. Further detailed studies of the desorption process 38
Chapter 3> Non Standard films. 43
3.1. Sintered films 433.2. Low temperature desorption experiments 48
3.3. Oxygen adsorption experiments 543*4* Nickel films evaporated in an atmosphere of argon 573.5® Exchange experiments 613.6. Mercury displacement experiments 65
3*7* Retention of hydrogen and of tritium by nickel films 71Chapter 4. Electron microscope studies of evaporated
nickel films 74
4.1* First results 754.2. Later experiments 77Chapter 5. Discussion of results 81Introduction 825*1. Reasons for the observed variation of the specific
activity of the desorbed gas 83
5.2. Reasons for heterogeneity 86
5*3* Hydrogen and tritium retention studies $6
5»4* Reasons for the failure of the differential isotopemethod 102
5*5* The activated desorption process 1125*6. 'The displacement of hydrogen and tritium from
nickel films 118

Page(a) Displacement and trapping of hydrogen 124(t>) Displacement and trapping of tritium 125
5*7• Conclusions and future experimental work 131Chapter 6. Preparation of nickel films for hydrogen
adsorption experiments 1336.1. The vacuum system 1336.2, Furnaces 1336,3* Design of catalyst vessels 1346,4* Pre-evaporation treatment of catalyst vessels 1376,5* Deposition of nickel films 1386.6. Argon evaporated films 1406*7« Estimation of film weight 141Chapter 7« Preparation and storage of gases 1437.1. Preparation of tritium 1437*2* Preparation of pure hydrogen 146
7*3* Storage of tritiated hydrogen 146
7.4* Hydrogen for counter filling 1507*5* Other gases 150
(1) Argon 150(2) Oxygen 150(3) Alcohol 151
Chapter 8. Apparatus for studying adsorption anddesorption of hydrogen and tritium 152
8.1. General experimental method 1538.2* Attachment of the catalyst vessel 154

Page8.3* Thermostat 1558*4« Measurement of hydrogen and tritium 156
8„5* Transfer of gases 1598.6. Admission of mercury vapour to the catalyst
vessels I64
8.7* The Gas Counter 1668.80 Continuous estimation of adsorbed mercury 170Chapter 9« Pressure gauges 1739.1. McLeod gauge 1739*2. Calibration of McLeod gauge sections 1799»3<> The Pirani gauges 1809*4* Estimation of the error incurred in the measure
ment of the specific activities of the desorbed samples 188
Appendix A 192Appendix B I95
References 196
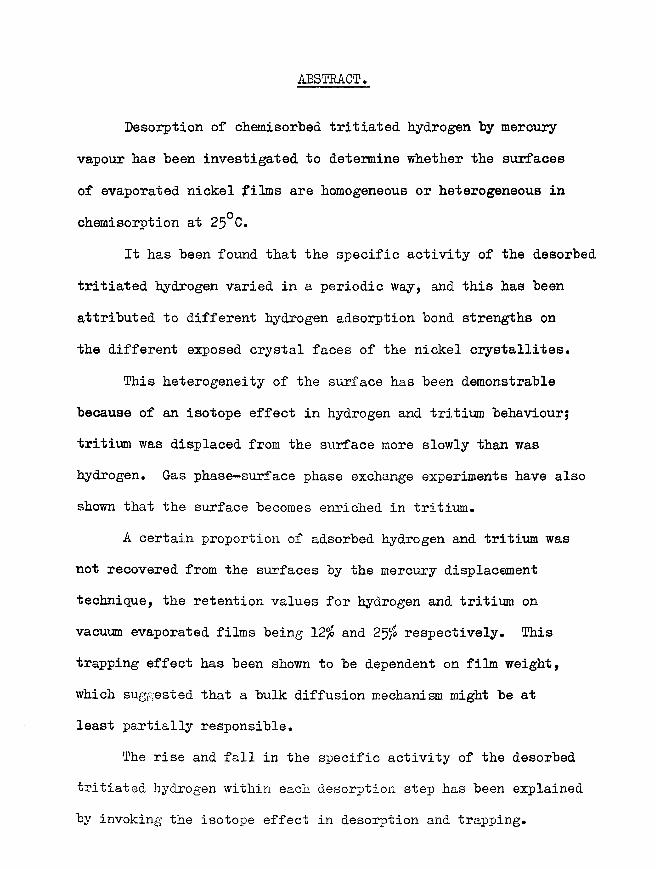
ABSTRACT.
Desorption of chemisorbed tritiated hydrogen by mercury vapour has been investigated to determine whether the surfaces of evaporated nickel films are homogeneous or heterogeneous in chemisorption at 25°C.
It has been found that the specific activity of the desorbed tritiated hydrogen varied in a periodic way, and this has been attributed to different hydrogen adsorption bond strengths on the different exposed crystal faces of the nickel crystallites.
This heterogeneity of the surface has been demonstrable because of an isotope effect in hydrogen and tritium behaviour; tritium was displaced from the surface more slowly than was hydrogen. Gas phase-surface phase exchange experiments have also shown that the surface becomes enriched in tritium.
A certain proportion of adsorbed hydrogen and tritium was not recovered from the surfaces by the mercury displacement technique, the retention values for hydrogen and tritium on vacuum evaporated films being 12$ and 25$ respectively. This trapping effect has been shown to be dependent on film weight, which suggested that a bulk diffusion mechanism might be at least partially responsible.
The rise and fall in the specific activity of the desorbed tritiated hydrogen within each desorption step has been explained by invoking the isotope effect in desorption and trapping.
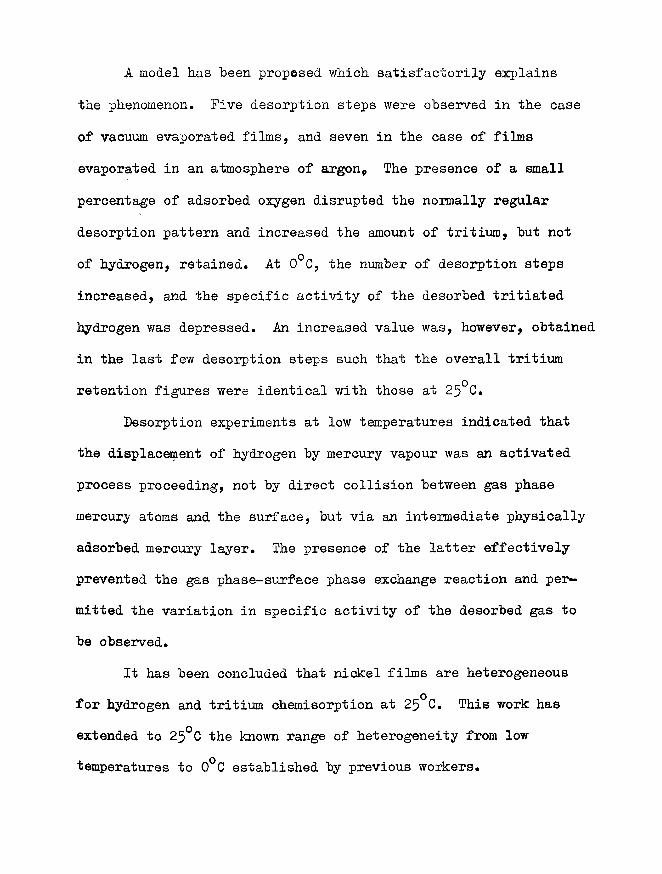
A model has been proposed which satisfactorily explains the phenomenon. Five desorption steps were observed in the case of vacuum evaporated films, and seven in the case of films evaporated in an atmosphere of argon* The presence of a small percentage of adsorbed oxygen disrupted the normally regular desorption pattern and increased the amount of tritium, but not of hydrogen, retained. At 0°C, the number of desorption steps increased, and the specific activity of the desorbed tritiated hydrogen was depressed. An increased value was, however, obtained in the last few desorption steps such that the overall tritium retention figures were identical with those at 25°C.
Desorption experiments at low temperatures indicated that the displacement of hydrogen by mercury vapour was an activated process proceeding, not by direct collision between gas phase mercury atoms and the surface, but via an intermediate physically adsorbed mercury layer. The presence of the latter effectively prevented the gas phase-surface phase exchange reaction and permitted the variation in specific activity of the desorbed gas to be observed.
It has been concluded that nickel films are heterogeneous for hydrogen and tritium chemisorption at 25°C. This work has extended to 25°C the known range of heterogeneity from low temperatures to 0°C established by previous workers.

-1-
I I T E O D U C T I O N
It is of importance, from the point of view of catalysis, to study the way in which surfaces adsorb a molecular species; whether the adsorption is uniform over the entire surface or whether particular points or areas can he differentiated by the formation of stronger or weaker bonds with the adsorbate, It is the question of homogeneity or heterogeneity of the surface which has been studied in this thesis.
H.S. Taylor (l) originated the idea of the presence of adsorption sites of varying activity. He pointed out that variations in the geometry of the surface must give rise to differences in degrees of unsaturation and hence of bond formation. Experimental evidence in support of the presence of relatively few ’’active points" was provided by Pease and Stewart (2), who discovered that catalytic activity was considerably more sensitive to poisoning than was adsorption.
Later calorimetric evidence (3) seemed to support the view of surface heterogeneity, since it was found that heats of chemisorption decreased markedly with the degree of surface coverage. If it was assumed that certain sites adsorbed more readily than others, with higher heats of adsorption, then this phenomenon could be explained. An alternative reason was, however, that the greater the degree of coverage, the closer to one another must the molecules adsorb, and

-2-
the greater would "be the effect of mutual repulsion forces, so that the heat of chemisorption could also fall with increasing coverage on a homogeneous surface (4)*
A method which could partially resolve the question of surface homogeneity or heterogeneity was devised by Roginskii and Todes (5) in 1947• This was a differential isotope method involving two adsorption stages, in the first of which one isotope was adsorbed and in the second another isotope of the same element. If there were heterogeneity of bonding on the surface, the possibility was that the isotope adsorbed first would chemisorb on those sites which gave the maximum free energy of adsorption and would, therefore, be more strongly bonded. In a subsequent desorption process this isotope would be more difficult to displace. In other words, the isotope adsorbed first would be desorbed last.
Roginskii and Keier (6,7) applied this method to the study of the chemisorption of hydrogen and deuterium on charcoal, reduced nickel, and zinc oxide catalysts, the desorption process being accomplished by what must be regarded as an undesirable method, raising the temperature of the catalyst in successive stages to 530°C* They found that the gas sample desorbed first had the same isotopic concentration as the gas adsorbed last, and so they deduced that the surfaces of their catalysts were heterogeneous.
This method was applied by Kummer and Emmett (8) to the chemisorption of carbon monoxide on a promoted iron synthetic ammonia catalyst. They used CO and "^CO added in succession as two separate

- 3-
fractions at -195°C or -78°C. Desorption was effected by raising the temperature in stages to about 120°C, the desorbed gases being removed by pumping at each stage. Analysis of the samples showed that the second fraction of added CO tended to be desorbed first, but that a partial exchange occurred rapidly between the adsorbed fractions corresponding to about 5&f> o f the iron surface. This was evident even at -195°C. If no factors other than heterogeneity of the surface were involved, it would seem that about 5Qff> of the surface was homogeneous and the other 50$ heterogeneous®
T AEischens (9) used a CO, CO exchange technique, as well as a desorption technique similar to that of Kuramer and Emmett, on unpromoted iron, and a kinetic treatment of his results showed that the surface appeared to consist of relatively few homogeneous portions, rather than of a series of sites providing a spectrum of chemisorption
bond strengths®On applying the Roginskii and Keier method to the study of the
surface nature of exhaustively reduced nickel-on-silica catalysts, G.C.A. Schuit (10) found that an equilibrium mixture of the hydrogen and deuterium adsorbates, corresponding to the temperature of desorption, was obtained. This is expected in the case of surface homogeneity.
It is evident from the foregoing that the conclusions which can be drawn are far from definite, in that some results indicate homogeneity whereas others on the same catalysts, indicate heterogeneity. Moreover, other factors must be considered before a complete inter

- 4-
pretation of results from the differential isotope method is possible. Such possibilities are} mobility of the adsorbed species, exchange between adsorbate and gas phase, interaction between adsorbed atoms, and between adsorbed atoms and the surface, in certain cases steric hindrance of the adsorbate to further adsorption, and last but not least, the question of surface contamination and its effect on adsorption and desorption.
The fall in heat of adsorption with increasing coverage could be explained either by heterogeneity of the surface or by mutual repulsion of surface dipoles, formed by polarisation of the adsorbate metal bond, making further adsorption more difficult. These alternatives can be differentiated satisfactorily by the Rogenskii and Keier method, since, in t£e case of dipole repulsion, each molecule once adsorbed, is no different from any other. If, however, the adsorbed species is mobile, equilibration of the isotopes would occur even if the surface were heterogeneous. This would lead to the erroneous conclusion of surface homogeneity, and could be an alternative explanation for Schuit*s results. Hence the differential isotope method cannot distinguish between homogeneity and surface mobility, and this is an important criticism in view of the elevated desorption temperatures used in most cases. Kummer and Etamett *s results are possibly more reliable in this context because of recent work in field-emission microscopy (ll) which shows that, at comparatively high temperatures, carbon monoxide remains essentially immobile, whereas adsorbed hydrogen atoms are mobile at
250K.

- 5-
It was decided in the present work to apply an improved version of the differential isotope method to the study of the surface nature of evaporated nickel films. The investigation of evaporated metal films has been continuing since 1935 (12), but quantitative and reproducible results in both chemisorption and catalysis were not available until 1940* when the work of Beeck, Smith and Wheeler (13)> on evaporated nickel and iron films was published. They studied the chemisorption of ethylene, hydrogen, carbon monoxide, nitrogen, and oxygen, and found that the amounts adsorbed were proportional to the film weight, indicating that the films have a porous structure. Since that time the value of evaporated films for quantitative studies of this kind has been realised, since these films have conveniently high surface areas per mg weight, and since the possibility of surface contamination is lessened, a danger ever present with catalysts prepared by reduction processes.
The isotopes chosen for adsorption were hydrogen and its radioactive isotope, tritium. The advantage of using a radioactive isotope is that a large number of desorption samples can be quickly and simply assayed by pumping them into a gas counting apparatus attached directly to the main desorption apparatus.
Desorption of the gases from the surfaces of the films has been carried out by exposing them to mercury vapour. The use of mercury vapour in this way was first mentioned by Porter and Tompkins (14)> and Gundry and Tompkins (15) > bas been investigated in detail by Campbell and Thomson (16). Its outstanding advantage is that it
-6-
allows desorption to proceed at room temperature and hence, in contrast to desorption by heating, the possibility of sintering the films and of promoting surface mobility is reduced.
To sum up, it was hoped in this work that the differential isotope method could be applied under more favourable conditions than hitherto, by the use of reproducible surfaces, and by removing the need for elevated desorption temperatures.

- 7-
CHAPTSR 1.
STUDY OF THE PISPIACEMENT BY MERCURY VAPOUR OF HYDROGENAND OF TRITIUM FROM THE SURFACE OF VACUUM EVAPORATED ___________________ NICKEL FILMS»______________
The research work described in this thesis was directed towards the end of deciding whether the surface of nickel catalysts was by nature homogeneous or heterogeneous towards the chemisorption of hydrogen. For reasons described in considerable controversy was extant in the literature concerning this problem, some evidence favouring the view that chemisorption bonds were identical over the entire surface of the catalyst, other information seeming to suggest that certain points or areas chemisorbed hydrogen in different ways with the formation of stronger or weaker bonds.
Roginskii and Keier (7) described the application to nickel catalysts of a neat and ingenious way of possibly settling this problem. This was the differential isotope method (5) whereby if the adsorption process was carried out in two steps, using hydrogen for one and deuterium for the other, a subsequent desorption stage should indicate heterogeneity if the isotope adsorbed last was desorbed first, but homogeneity if an equilibrium mixture of the isotopes was obtained. Any isotope effect could be allowed for by varying the order of adsorption of the isotopes. Using this technique, Roginskii and Keier arrived at the conclusion that the surface of the nickel catalyst they studied was heterogeneous.
The present work involved the application of the differential
isotope method, but with these important modifications.

Firstly, it was decided to study the surface of a catalyst which could he made reproducible from one sample to the next. For this reason, instead of using supported nickel catalysts like Roginskii and Keier, the surfaces of evaporated nickel films were studied.
Secondly, instead of using the stable isotope of hydrogen, deuterium, which involved the use of mass spectrometric techniques for its analysis, the radioactive isotope, tritium, was used. The analysis of tritium content in any hydrogen-tritium mixture could be easily and quickly determined by pumping the gases into a gas counter.
Thirdly, and most important, desorption was effected, not by the Russian and subsequent workers’ technique of increasing the temperature of the catalyst in successive stages to, in the majority of cases, a high value, but at room temperature by adopting the method studied by Campbell and Thomson (l6), of carrying out the displacement of hydrogen and tritium by exposing the surface to mercury vapour. In this chapter the adsorption and desorption techniques are described, the results of the experiments being detailed in chapters 2 and 3.
,1.1. PREPARATION OF THS NICKEL FIIMS.Each nickel film was deposited on the inner surface of a
Pyrex catalyst vessel from an electrically heated pure nickel wire.To obtain reproducible results (13) it was essential to ensure
that the inner surface of the catalyst vessel was clean, and free

ROTA
RY
MERC
URY
MAIN
ME
RCUR
Y
CA
TALY
ST
SAMM
APU
MP
^bm
p^011
S0U,
CE
VESS
EL
COUN
TER
X
co
CO
u
u
X
CO
G3
U
CO

- 9-
from adsorbed gases, and this was achieved by heating the catalystvessel to 5^0 C under high vacuum conditions for several hours.It was also necessary to free the wire filament from occluded gases,a satisfactory method being to heat the filament electrically tojust below the evaporation temperature of the nickel during the lasttwo hours of the de-gassing process. A McLeod gauge was providedso that residual pressure in the catalyst vessel could be measuredand at the end of the de-gassing stage, this pressure was less than -510 mm. After the catalyst vessel had been sealed, it was removed
to a large beaker containing cold, running tap water where evaporation of the filament was carried out, the cooling process being desirable to prevent undue sintering of the film. Filament evaporation was at the rate of between 30 and 40 mg per hour and film weights were usually also of that order.
Bach catalyst vessel was immediately, on completion of the evaporation, glass blown to the adsorption-desorption section of the apparatus and within a few hours adsorption of hydrogen or tritium effected through the break-seal provided on each vessel.
Full details of catalyst vessel design and film preparation are given in chapter 6.
1.2. THE ALSO HPT IOIT-DESORPT IOIT APPARATUS.
The apparatus is shown schematically in fig.l. It was a high vacuum system and pressures of about 10 ^mm could be obtained. Basically it consisted of a calibrated volume containing a McLeod

-10-
gauge, from which gas could he pumped by a Toepler pump into the catalyst vessel section* The same Toepler pump could be used for pumping gas from the catalyst vessel beck into the McLeod gauge section. A second Toepler pump was provided to pump gas from the McLeod section into the gas counter. A further section, opening into a roughly calibrated gas pipette of low volume, was used for metering volumes of gas into the McLeod section. This section was provided with a manometer and storage bulbs containing pure hydrogen and tritiated hydrogen which could be controlled by way of mercury cut-offs.
The catalyst vessel was separated from this apparatus by aliquid nitrogen cooled trap to prevent access of mercury vapour.Between the trap and the catalyst vessel was joined a capillary
203tube containing a bead of Hg. This tube was maintained at203liquid nitrogen temperatures until Hg vapour was required for
desorption.
1.3. THE ABSORPTION PROCESS.
The adsorption process consisted of measuring a suitable pressure of gas from the appropriate storage bulb into the manometer section, expanding this into the gas pipette and admitting gas trapped inthe pipette to the McLeod gauge volume which was accurately calibrated. After measuring the pressure of the gas with the McLeod gauge a proportion of it was transferred by the Toepler pump into the catalyst vessel and the residual pressure in the McLeod section

-11-
vas determined. The difference in the McLeod gauge readings gave the volume of gas transferred to the catalyst vessel. The adsorption was followed by a Pirani gauge system fitted to the catalyst vessel
section. Subsequent aliquots of gas were admitted to the catalyst vessel in this way, either until a suitable volume had been ad
sorbed or until the surface was saturated, indication of this being given by the Pirani gauges, in which case the residual gas was immediately pumped back into the McLeod section by the Toepler pump and the total residual pressure in that section determined.
The adsorption method described allowed for the variation not only of the species of each adsorbed aliquot, since the one isotope could be pumped away from the manometer section and replaced by the other at any stage in the adsorption, but also of the relative volume of each, this being achieved simply by varying the initial pressure measured in the manometer. In this way the relative quantity of each gas adsorbed could easily be varied from between 10/b and 90^ of the total.
1.4. THE DESOHPTIQH PROCSSS.
Desorption was commenced, in normal circumstances, the follow-203ing day by removing the liquid nitrogen from the Hg capillary and
allowing the mercury vapour to come into contact with the nickel surface. The rise in pressure in the catalyst section due to desorbed gas was followed by the Pirani gauges and when a suitable pressure was indicated, the desorbed gas was Toepler pumped into the McLeod

-12-
section and its pressure measured* The second Toepler pump was taen employed to pump the sample into the gas counter for determination of its specific activity. In this way very small
portions of desorbed gas were assayed as they were desorbed, the■5usual quantity of each aliquot being between 4 and 5 cm nun,
The desorption could be stopped at any time by cooling the ^ n g capillary in liquid nitrogen*
Details of the experimental technique will be found in chapter 8.
1*5. COIITTTTUOUS ESTIMATION OP ADSORBED MERCURY.203The purpose of using Hg was so that the arrival of mercury
vapour at the catalyst surface could be followed, and the amount related,: in a qualitative way, to the volume of hydrogen adsorbed* 03?’this purpose a long gamma counter was placed parallel to, and m^ contact with the catalyst vessel, care being taken to ensure that" it was disposed symmetrically in relation to the film. Tritium cfif tlb# film had no effect on this counter since the beta emissionw&U5 td<P weak to penetrate the walls of the catalyst vessel, and
203c^ly thh gamma radiation from the Hg could be counted.A*background count was taken at the commencement of each
adsorption experiment, with the 203% source shielded by a f thick l^S? dy&rider, and thereafter counts were made at suitable intervals stP that" an indication of mercury arrival at the surface, with respect' to time and volume of desorbed gas was obtained*

- 13-
Full details are given in Chapter 8,
1. 6 . TRITIUM COMING.
The specific activity of each sample of hydrogen and tritium desorbed was determined by Toeplering the gas from the McLeod gauge section, where its pressure and volume had been measured, into a gas counter, filled to a pressure of 8 an with hydrogen and containing 2 on of ethyl alcohol as the quenching agent. Subsequent samples were pumped into the same counter filling until the count rate reached a limiting value as described in section 8.
To reduce statistical errors in the count rates to a minimum, the counting of each sample was continued until at least 10,000 counts had been recorded, thus reducing the statistical error to J 10,000 counts per 10,000 i.e. 1$. In normal circumstances this error would be less at count rates over 1,000 cpm, since counting was normally carried out over ten minute periods. To check the reproducibility of the count rate, a second count for the same period was taken immediately after the first. If the difference between the two count rates was more than 1$, further counts were taken until concordant results were obtained.
1.7» THE PRESSUHE GAUGES.
(a) The McLeod Gauge.The McLeod gauge was used as the only accurate pressure
measuring device on the apparatus. Coupled with its associated

- 14-
calibrated volumes, this gauge was used in determining the
quantities of both adsorbed and desorbed gas. Bach part of the apparatus was pumped to sticking vacuum on this gauge prior to use. Great care was taken in the construction and calibration of the McLeod gauge to make it as accurate as possible. The closed and compensating limbs were constructed from 1.5 mm precision boretubing, and the bulb volume was 100 ml., providing the gauge with
-1 -2a useable pressure range between 3x10 mm and 1.8x10 mm, betweenwhich limits all pressures of both adsorbed and desorbed aliquots lay, and also between which the accuracy of the unit had been determined. This was done by using the gauge for calibration of the necessary associated volumes and studying the variation in volume obtained for different readings. The maximum difference recorded was -1$ reducing to -0.2$ by careful manipulation.
(b) The Pirani Gauges.These gauges were used in a qualitative manner to follow the
adsorption process and indicate residual pressure in the catalyst vessel and also to provide a dynamic method for following desorption. In this context they were used as direct reading instruments to provide visual information on the commencement and cessation of the desorption process, and to indicate the pressure at which desorbed gas was to be pumped into the McLeod section. The gauges were zeroed at the minimum pressure obtainable in the apparatus.
Details of the McLeod and Pirani gauges can be found in
Chapter 9*

- 15-
1,8. ESTIMATION OF TOTAL ERROR BTCUKRSD DURING THE DEPERMHEATIONOF THE SPECIFIC ACTIVITY OF THE DESORBED GAS SAMPLES.
Although, the accuracy of the McLeod gauge had been deter
mined, and although statistical errors in the counting were less than Yjoy it was decided to estimate the total error incurred under experimental conditions in the measurement of the pressure
and count rates of the small desorbed aliquots. To this end, aliquots of the stock tritiated hydrogen were expanded into the McLeod gauge section from the region of the apparatus to which the catalyst vessel was normally attached. The size of each aliquot was about 5 cm 111111 which corresponded to the quantity of tritiated hydrogen in each of the desorbed samples. After its pressure had been read, using the McLeod gauge, the gas was pumped into the gas counter. Successive aliquots were added to the counter in this way until the count rate had attained a value comparable with the maximum value used during the experiments. The counter
filling was then renewed and the procedure repeated.A standard deviation was worked out for the specific activity
of the desorbed samples, and a value obtained for the specific activity of the stock tritiated hydrogen. The value obtained for
the standard deviation was - 2.24$.Full details of the method and calculation of the standard
deviation are given in Chapter 9*

-16-
CHAPTER 2.
RESULTS OF ADSORPTION AND DESORPTION EXPERIMENTS ON ___________VACUUM EVAPORATED NICKEL FIIMS._________
2.1. ADSORPTION OF TRITIATED HYDROGEN BY VACUUM EVAPORATEDNICKEL FIIMS.Adsorption of hydrogen or of tritiated hydrogen was very
rapid. The residual pressure in the catalyst vessel after the-4adsorption of each aliquot was about 10 mm and the pressure, as
indicated by the Pirani gauges, returned to the same value after each sample had been adsorbed until the surface neared saturation when an increasingly higher pressure remained. This higher value of the residual pressure was only obtained when the surface was more than 80$ saturated. After saturation, the pressure of the residual gas would very slowly decrease for a few minutes, but apart from this, no indication was ever observed of a slow sorption (17) process. When the surface had been saturated, residual gas phase tritiated hydrogen was pumped away by the Toepler pump. It was not possible, however, to reduce the pressure in the catalyst vessel below the value of the residual pressure obtained during the adsorption, and it appeared that desorption from the surface occurred to maintain this equilibrium pressure value of about 10 mm.
When the film with adsorbed hydrogen was left overnight, a higher residual pressure was obtained the next day and in fact, a very slow rise in pressure could be observed with the Pirani gauges immediately after the "slow sorption process mentioned above was

COco
COo
CM
(VI
CM
CO
'6 “ 1 H 9 I 3 M M i l i
ADSO
RPTIV
E CA
PACI
TV
cm1
mm

- 17-
completed, i,e, within a few minutes of saturating the film and pumping off the excess gas. The quantity of hydrogen desorbed in this way was very small, and corresponded to between 1$ and 2fo of the total adsorbed. Even in films which were unsaturated, the pressure rise occurred overnight, but in this case it was less than 1$, It is possible that this desorption was due to a sintering process of the film, since the adsorptions were effected at 25°C, which is about 10°C higher than the temperature of deposition of films, and the films were used within two to three hours of the deposition.
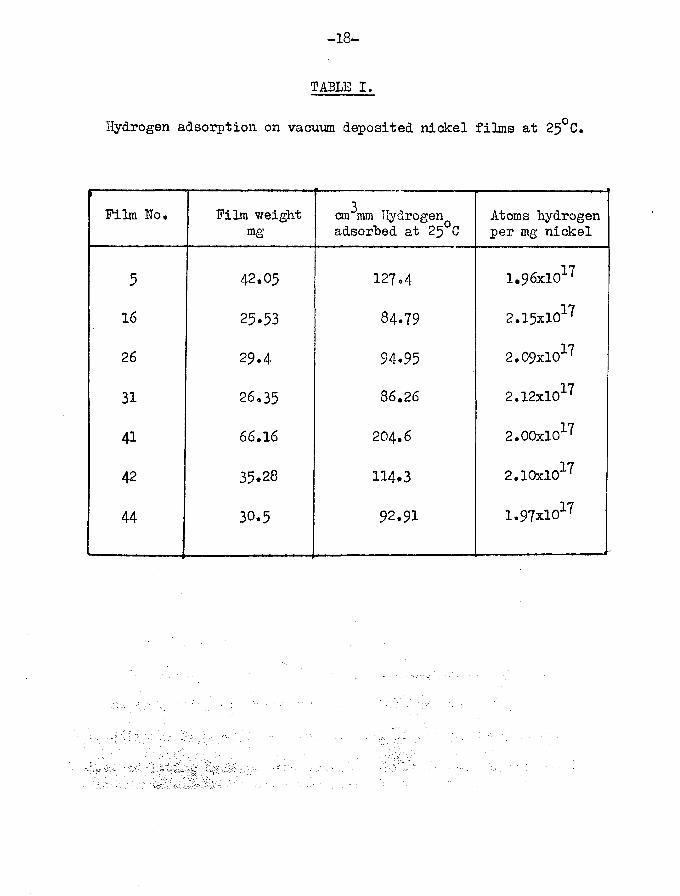
Results of a representative number of the adsorption experiments are given in Sable I for saturated films. The overall
17average amount of hydrogen adsorbed was 2,00x10 atoms per mgnickel, which is much higher than the values obtained by Beeck (13)
17for vacuum evaporated nickel films (1,2x10 atoms per mg nickel), and higher also than those by Klemperer and Stone (18) and V/ahba and Kemball (l$))» The explanation for the higher adsorption capacities is probably that more rigorous catalyst vessel and filament de-gassing processes were used in the present v/ork.
Beeck found that the amount of hydrogen adsorbed was proportional to the film weight and the present results are in agreement with this. In fig,2 volumes of hydrogen adsorbed are shown plotted against film weight. The graph is drawn through the points from the films showing the highest adsorptive capacities and is used to calculate the adsorptive capacities of unsaturated films.
-18-
TABLE I.
Hydrogen adsorption on vacuum deposited nickel films at 25°C.
Film No, Film weight mg
3cm mm Hydrogen adsorbed at 25°C
Atoms hydrogen per mg nickel
5 42.05 127.4 1.96xl017
16 25.53 84.79 2.15xl017
26 29.4 94.95 2.09xl017
31 26.35 86.26 2.12xl017
41 66,16 204.6 2.00xl017
42 35.28 114.3 2.10xl017
44 30.5 92.91 1.97xl017
-19-
Recent work by Anderson and Baker (20) showed that on nickel films a monolayer of hydrogen, as judged by comparative krypton areas, was adsorbed at 90°K with an ambient pressure of 10” mra of hydrogen. 10$ of this hydrogen could be removed by pumping.It was thought in the present work that, since the excess gas was pumped from the catalyst vessel on the completion of the adsorption, some at least of any less firmly bound hydrogen would be pumped off, especially since the pressure always returned to an equilibrium value. Apart from two results from films 12 and 44 > which showed a decreased adsorptive capacity of 13.8$ and 7*06$ respectively, as compared with films showing the highest adsorption capacity there is no real evidence of this having occurred. Other films which had been subjected to the same procedure showed no reduction in adsorptive capacity. This would indicate that 100$ coverage for
_3hydrogen is achieved with residual pressures as low as 5^10 ^(c.f. Anderson and Baker).
2.2. EARLY EXPERIMENTS ON THE APPLICATION OF THE DIFFERENTIALISOTOPE METHOD.
The first series of desorption experiments were carried out from the point of view of obtaining an indication of homogeneity or heterogeneity of the surface by a combination of the traditional Roginskii and Keier method of mercury desorption, i.e. admitting hydrogen and tritiated hydrogen to the surface in a certain order and looking for enrichment of the isotope added last in the first desorbed samples, if the surface were
-20-
heterogeneous. If the surface were homogeneous the specific activity of each desorbed sample should be constant, and in value should be the mean specific activity of the adsorbed gas. In these experiments the desorption process was uninterrupted once begun.
RESULTSt-FILM 2. (Table II)Film weight - $ 2 , 6 mgTemp, of adsorption - 25°C
Tritiated hydrogen admitted first3Specific activity - 119.1 cpm per cm ram
31st sample - 22*45 cm mm
32nd sample - 21.23 cm mm
33rd sample - 20.65 cm mm
3Total tritiated hydrogen admitted 64*33 cm mmHydrogen admitted
34th sample - 24*35 cm mm
35th sample - 23.21 cm mm6th sample - 22*49 cm\im
Total hydrogen adsorbed 70*05 cm mraFilm saturated
3Total volume of gas adsorbed 134*4 cm mm3Mean specific activity of adsorbed gas 56*96 cpm per cm mm
The film was left overnight before desorption was commenced.Details of the desorption are given in Table II.
3Volume of gas desorbed 115*3 can mmVolume of gas retained by ^surface 19.11cm mm = 14*22^
Total count rate of desorbed gas corrected for dead timeand background 5669 counts per minute
Total count rate of adsorbed gas 7654 counts per minute
Tritium retained by surface = 1985x100/7654 = 25*93^

TABLE II.
Displacement of tritiated hydrogen "by mercury vapour at 25°C.
FILM 2.
Desorbedsample
pv3cm mm
Total desorbed cm mm
*TotalCount
Count from each sample
Sp. Act./ 8 cpm/cm mm
1 13*58 13*58 635 635 46.77
2 IO.94 24.52 420 420 38.383 9*572 34.09 845.5 425.5 44.454 9.414 43*51 1283 437.5 46.47
5 6*518 50.02 1585 302 46.346 24.30 74.32 2936 1351 55.597 38.60 112.9 4911 1975 51.178 2.354 II5.3 5034 123 52.25
Corrected for dead time and minus background*
-22-
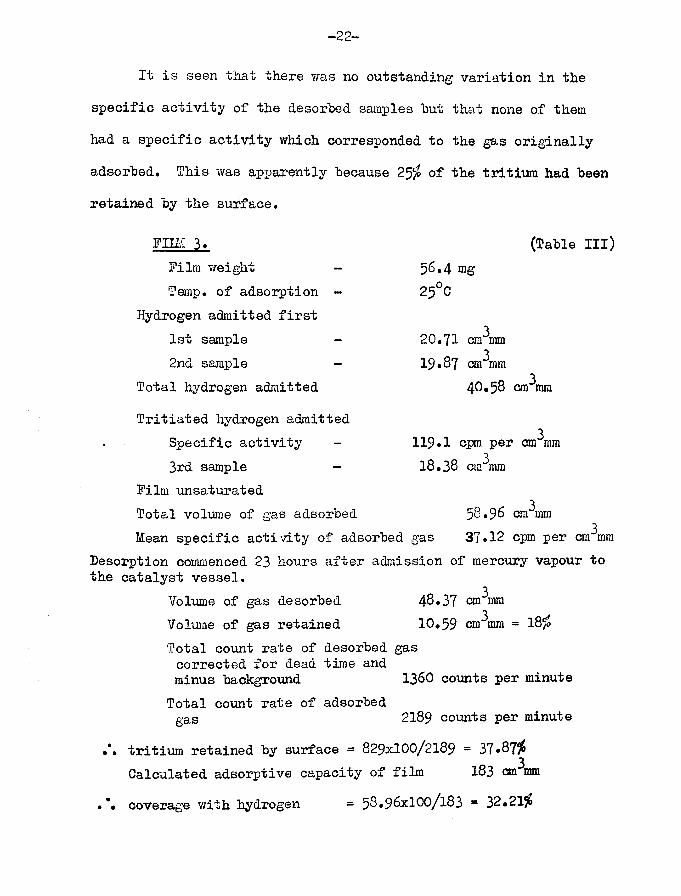
It is seen that there was no outstanding variation in the specific activity of the desorbed samples but that none of them had a specific activity which corresponded to the gas originally adsorbed* This was apparently because 25$ of the tritium had been retained by the surface.
Desorption commenced 23 hours after admission of mercury vapour to the catalyst vessel.
FID/1 3.Film weight Temp, of adsorption
(Table III)56.4 mg 25°C
Hydrogen admitted first 1st sample 2nd sample
320.71 cm mm319«87 cm mm
Total hydrogen admittedTritiated hydrogen admitted
Specific activity -3rd sample -
Film unsaturated
3119*1 cpm per cm mm318.38 cm mm
Total volume of gas adsorbedMean specific activity of adsorbed gas
Volume of gas desorbed 48*37 cm^mmVolume of gas retained 10.59 cm mm = 18$Total count rate of desorbed gascorrected for dead time and minus backgroundTotal count rate of adsorbedgas 2189 counts per minute
1360 counts per minute
Calculated adsorptive capacity or nim ioj cm mm• coverage with hydrogen = 58.9^x100/183 = 32*21$
tritium retained by surface = 829x100/2189 = 37*87$
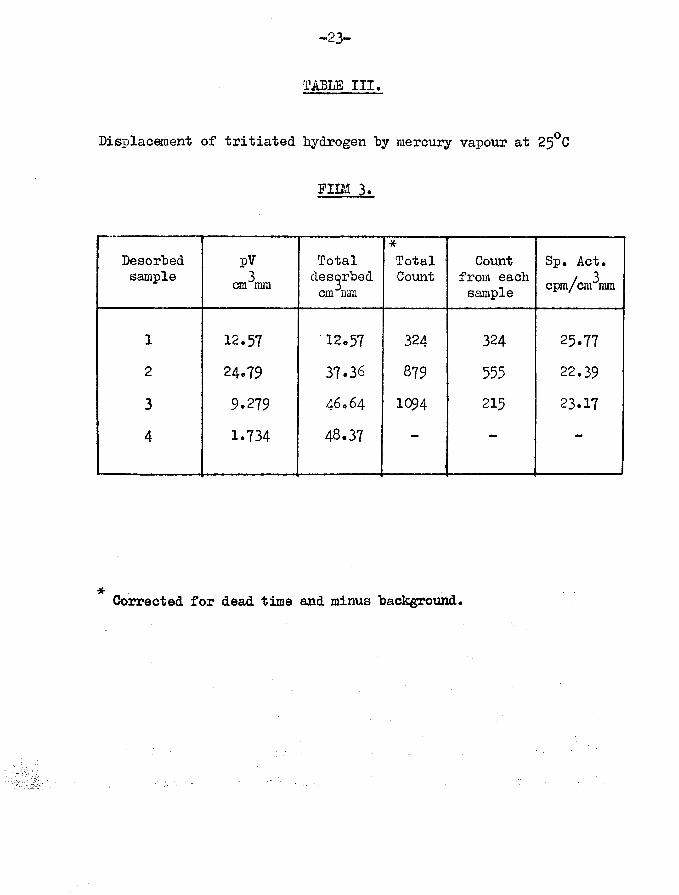
-23-
TABLB III.
Displacement of tritiated hydrogen "by mercury vapour at 25°C
p u m 3.
Desorbedsample
pV3cm mm
Total desorbed cm mm
*TotalCount
Count from each sample
Sp. Act. cPm/cm3mm
1 12.57 12.57 324 324 25.772 24.79 37.36 879 555 22.393 9.279 46064 1Q94 215 23.17
4 1.734 48.37 — — —
Corrected for dead time and minus "background.

total gas retained as a function of adsorptive capacity - = 5.79$
• • tritium retained as a functionof total adsorptive capacity = 92.9x100/6794 = 12.2$
The amount of tritium retained, as related to the calculated adsorptive capacity of the film, is thus half of the percentage of residual tritium on film 1. This is apparently in agreement with the results of Campbell and Thomson (16) who observed that for argon evaporated films of less than ^Qfp coverage the amount of tritium retained as a percentage of adsorptive capacity was half the value obtained for saturated films.
Again it can be seen that there is no marked variation in the relative specific activities of the desorbed samples, and again retained gas is enriched in tritium.
2.3. LATER EXPERIMENTS ON THE DIFFERENTIAL ISOTOPE METHOD.
Experiments will be described in 2.5 which showed that exchange between gas phase and adsorbed phase tritiated hydrogen readily occurred. In order to reduce the possibility of exchange between the desorbed tritiated hydrogen and the residual tritiated hydrogen on the nickel surface, the pressure was kept as low as possible (between lCT^and 10~^mm) in the catalyst vessel by constantly pumping the gas away as it was desorbed. This necessitated the stopping of the desorption process when a suitable amount of gas had been displaced, in order to prevent an increase in pressure in the catalyst vessel whilst pressure measurement and counting of the sample were being carried out.

-25-
Results obtained were as follows:-FIIM 12 (Table IV)
Desorption from this film was started immediately the adsorption of tritiated hydrogen was completed, in order to determine whether the surface equilibration of the tritium and hydrogen had been occurring overnight with the previous films. This equilibration was thought to occur by mobility of the adsorbed phase, or by a desorption-readsorption mechanism. This latter reason was inspired by the residual pressure obtained in the catalyst vessel during an adsorption as described in 2.1.
Film weight -Temp, of adsorption -
Hydrogen adsorbed first1st sample -2nd sample -
Total hydrogen adsorbed Tritiated hydrogen adsorbed
Specific activity -3rd sample -
Film saturated
38.35 nig 18.6°C
32.85 cm3mm 3
32.00 cm mm
3llOcpm per cm mm 3
32.22 cm mm
Total gas adsorbedMean specific activity of adsorbed gas
Details of desorption are given in Table IV.
•*. gas retained by surfaceTotal count rate of desorbed gas corrected for dead time and
Volume of gas desorbed 99.61 cm3mm 8.08 cm3mm = 7*5$
minus backgroundTotal count rate of adsorbed gas
3540 counts per minute
4712 counts per minutetritium retained 1172x100/4712 = 24.88$

-26-
TABLE IV,
Displacement of tritiated hydrogen hy mercury vapour at 20° C
FILM 12.
Desorbedsample
pVcm^mm
Totaldesorbedcm mm
TotalCount
Count from each
sampleSp. Act. cpm/cm^mm
1 28.91 28.91 1118 1118 38.662 17.5 46.41 1749 631 36.06
3 17.95 64.36 2319 570 31.76
4 22.88 87.24 680 680 29.73
5 12.37 99*61 1221 541 43.74
Corrected for dead time and minus background.
ro•«
OiZ
u iu i t u i3 / ui d 3 A 1 1AI i 3 V 31 i 13 3 d S
TOTA
L VO
LUME
DE
SORB
ED
c mf
m m.

-27-
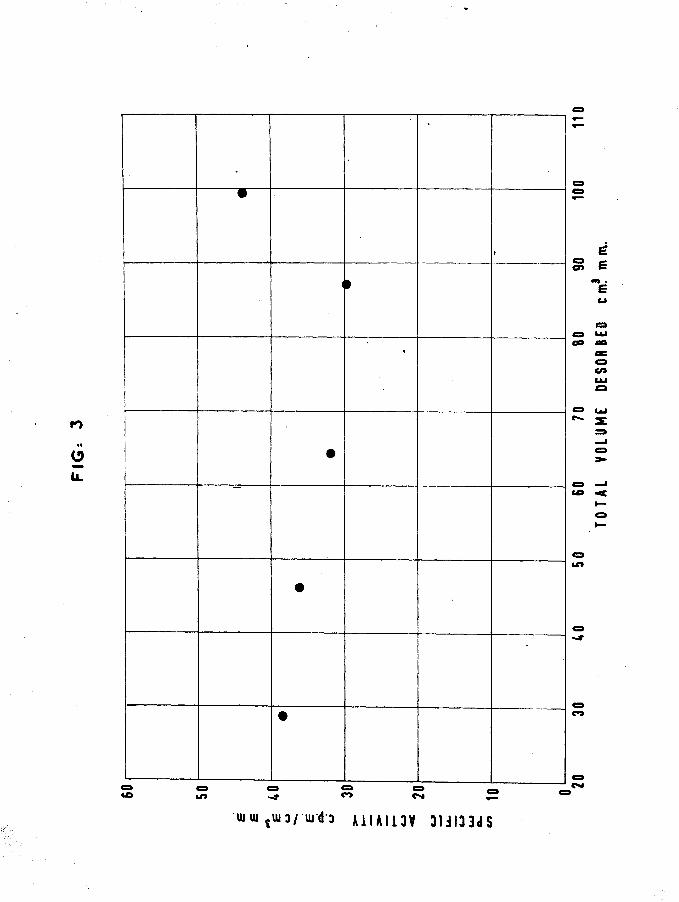
An increased value for specific activity of the last desorbed sample was obtained in this case (fig.3), but, as will become apparent later, any correlation with the fact that the desorption process was initiated immediately after adsorption was fortuitous* It will also be noticed, that enrichment of tritium was in the opposite sense to that required by the differential isotope method. The percentage of tritium retained is similar to that retained by film 2.
FIIM 14.Film weightTemp, of adsorption -
Tritiated hydrogen adsorbed first Specific activity - 1st sample -
Hydrogen adsorbed2nd sample -3rd sample -4th sample -
Total hydrogen adsorbed Total volume of gas adsorbed Film unsaturatedMean specific activity of adsorbed gas Desorption
Total gas desorbed gas retained by surface
Total count rate of desorbed gas Total count rate of adsorbed gas
(Table V)46.72 mg 18.2°C
115 cpm per cm mm 322.90 cm mm
330.97 cm mm331.10 cm mm28.96 cm^mm
391*03 cm mm 113*9 ctp mm
23*12 cpm per cm mm
398.29 cm mm 15*61 cm^mm ** 13*73$
1861 counts per minute 2634 counts per minute
• • tritium retained by surface * 773x100/2634 ■ 29*34$3Calculated adsorptive capacity of film 152 cm mm
Volume of gas retained as a function of adsorptive capacity of film
•% coverage10.27$87.47 *

-28-
TABLE V.
Displacement of tritiated hydrogen by mercury vapour at 20°C.
Fill! 15
Desorbedsample
pvcm^mm
Total desorbed
cm mm
*Totalcount
Count from each sample
Sp. Act. cpm/cnAnm
1 0.87 0.87 - - -
2 29*95 30.82 523.5 523.5 17.48
3 28.15 58.97 1099 575.5 20.454 6.78 65.75 136 136 20.05
5 17.82 83.57 474 338 18.976 12.75 96.32 751 277 21.73
7 1.97 98.29 762 11
Corrected for dead time and minus background.
-29-
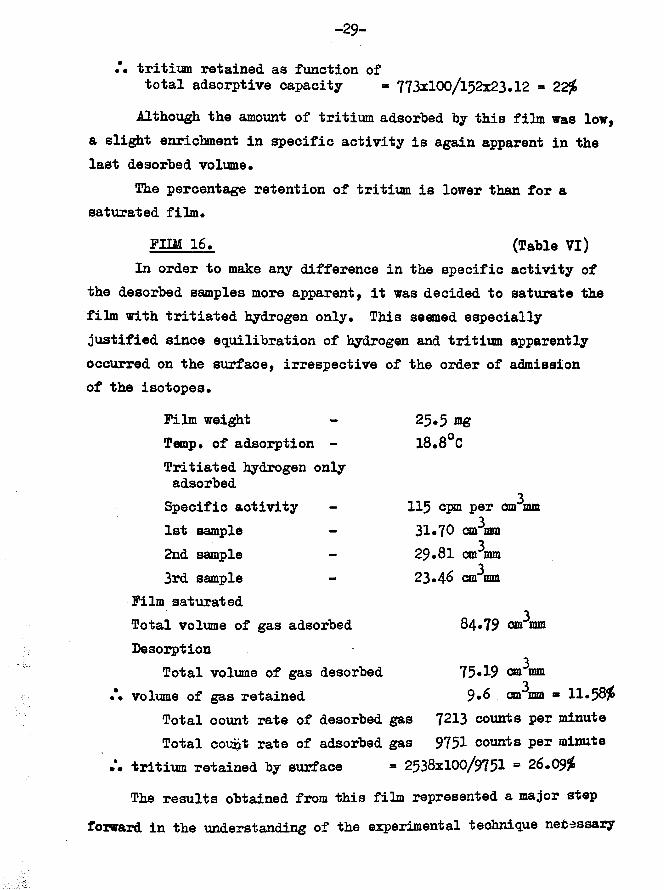
.*• tritium retained as function oftotal adsorptive capacity ■ 773x100/152x23.12 = 22$
Although the amount of tritium adsorbed by this film was low, a slight enrichment in specific activity is again apparent in the last desorbed volume*
The percentage retention of tritium is lower than for a saturated film.
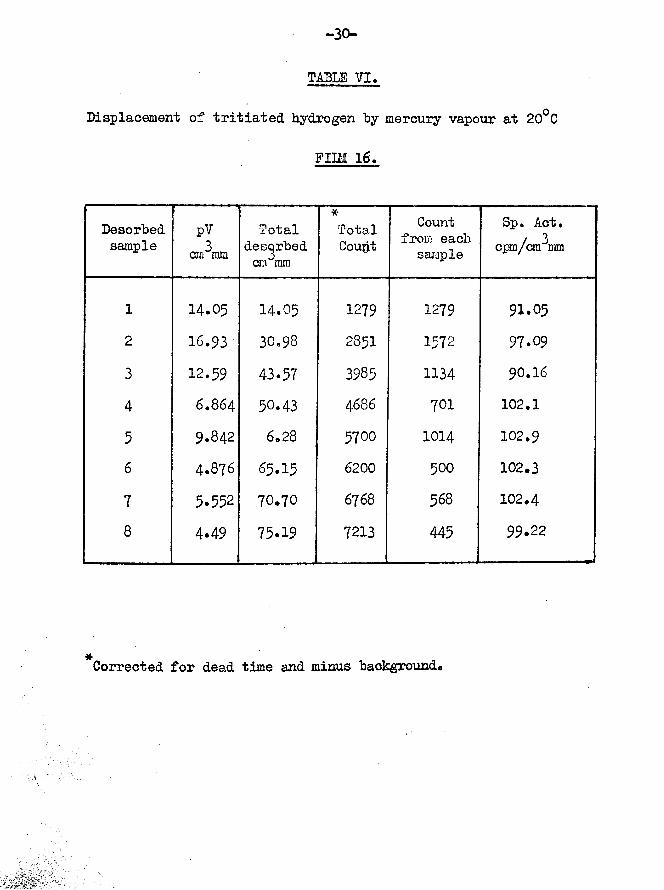
FILM 16. (Table VI)In order to make any difference in the specific activity of
the desorbed samples more apparent, it was decided to saturate the film with tritiated hydrogen only. This seemed especially justified since equilibration of hydrogen and tritium apparently occurred on the surface, irrespective of the order of admission of the isotopes.
Film weight - 25*5Temp, of adsorption - 18.8°CTritiated hydrogen only adsorbed 3Specific activity - 115 cpm per cm mm1st sample - 31*70 cm\m2nd sample - 29*81 cm^mm33rd sample - 23*46 cm mm
Film saturatedTotal volume of gas adsorbed 84*79 cm^mmDesorption
Total volume of gas desorbed 75*19 can mm•*. volume of gas retained 9*6 cm^mm * 11.58$
Total count rate of desorbed gas 7213 counts per minuteTotal count rate of adsorbed gas 9751 counts per minute
tritium retained by surface = 2538x100/9751 = 26.09$The results obtained from this film represented a major step
forward in the understanding of the experimental technique necessary
-30-
TABLE VI.
Displacement of tritiated hydrogen by mercury vapour at 20°C
PIIM 16.
Desorbedsample
pV3an mm
Total desorbed cm mm
*TotalCoupt
Count from each sample
Sp. Act. cpm/cm “mm
1 14.05 14.05 1279 1279 91.052 16.93 30.98 2851 1572 97.093 12.59 43.57 3985 1134 90.16
4 6.864 50.43 4686 701 102.1
5 9.842 6.28 5700 1014 102.9
6 4.876 65.15 6200 500 102.3
7 5.552 70.70 6768 568 102.48 4.49 75.19 7213 445 99.22
Corrected for dead time and minus background.

*6
o>u iu i^ u i3 / 'u r d ’3 A 1 I A I 1 3 Y 3 I J I 3 3 J S
TOTA
L VO
LUME
DE
SORB
ED

-31-
to study the desorption process. It now appeared that there
were at least two distinct sets of specific activities of the desorbed gas with a sharp change between them (fig.4), and it seemed obviously desirable in subsequent experiments to follow in detail the entire course of the desorption by studying more samples of much smaller volume than hitherto, of the order of magnitude of the last few samples in this experiment. It was also obviously important to use adsorbed gas of high specific activity.
It can be seen that for an area corresponding to two fifths of the total area for hydrogen adsorption in this film, the specific activity of the desorbed tritiated hydrogen was of a higher value than the remainder, although the value was still not as high as the original adsorbed gas. This result confirmed those from films 12 and 15, in which it will be remembered, enhanced specific activities were obtained towards the end of the desorptions.
Again, the percentage of tritium retained by the surface corresponded with that retained by previous saturated films.
2.4. DETAILED STUDIES OF THE DESORPTION PROCESS.
For this series of experiments the same technique was used as in 2.3, i.e. the residual pressure in the catalyst vessel was kept as low as possible by constantly Toepler pumping the gas away as it was desorbed. Snail desorbed aliquots were studied, the desorption being stopped between successive steps. Higher mean specific activities in the adsorbed gas were also used.

FIG.
5
C9CD
m
«o m ^UIUI t «u J / -urd-j AII Al l3V 3lil33dS

-32-
25. (Table VII)Temp, of adsorption - 25°C
Hydrogen adsorbed firstFirst sample - 21,92 cm^mm
Tritiated hydrogenSpecific activity - 106 cpm per cm^mm2nd sample - 32.87 crAim
•33rd sample - 30.01 cm mm■34th sample - 25.07 cm mm
Total tritiated hydrogen adsorbed 87*95 cra mm•3Total gas adsorbed 109*9 cm mmFilm unsaturatedMean specific activity of adsorbed gas 86,4 cpm per cm^mmDesorptionTotal gas desorbed 104*1 cm^mm
•*.gas retained by surface 5*8 cm^mm ■ 5*28$Total count rate of desorbed gas 6231 counts per minuteTotal count rate of adsorbed gas 9499 counts per minute
•*fc tritium retained = 3269x100/9499 0 34*41$The weight of this film is not available.If the specific activity of each desorbed fraction is plotted
against total desorption to that point, fig.5> it is seen that the specific activity during desorption varies in a periodic way, apparently indicating that there were five modes of tritium displacement.
In all subsequent experiments it was decided to adsorb tritiated hydrogen only, since previous results using hydrogen as well as tritiated hydrogen, indicated that the differential isotope method, as such, was not applicable to the study of these surfaces.

-33-
TABLE VII.
Desorption of tritiated hydrogen by mercury vapour at 25° C
F U M 25.
Desorbedsample
pvcm mm
Total desorbed cm mm
" V — 1TotalCount
Count from each
sampleSp. Act. cpm/cmmm
1 6.486 6.466 431.8 431.8 66.792 7.145 13.61 939.9 508.1 71.12
3 6.548 20.16 1409 468.8 71.58
4 7.734 27.89 1938 529.6 68.48
5 7.530 35.42 2409 470.3 62.466 9.576 45.00 3012 603.6 63.02
7 6.291 51.29 3457 444.6 70.668 9.504 60.79 4034 576.9 60.70
9 8.954 69.75 515.5 515.5 57.5810 6.259 76.01 837.5 322 51.4511 5.346 81.35 1108 270.6 50.62
12 6.433 87.79 1415 307 47.72
13 5.216 93.00 1669 254.1 48.72
5.054 98.06 1936 266.1 52.72
15 6.057 104.I 2198 261.8 43.21
* Corrected for dead time and minus background.
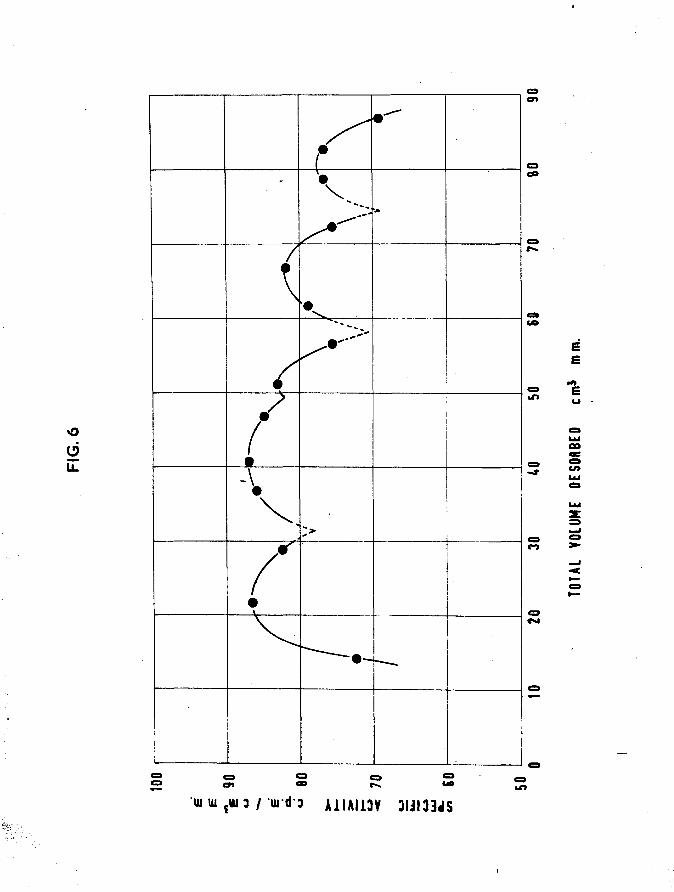
FIG.
6CTt
CO
CO
CSI
CO CDCOwui fu ij / wd u A1IM13V 3ljl33dS
TOTA
L VO
LUME
0E
S0R8
E0
cm*
mm
.

-34-
The addition of hydrogen at any stage of the adsorption merely served to dilute the activity of the tritium,
27. (Table VIII)Film weight - 43.71 mgTemp, of adsorption - 25°C
Tritiated hydrogen only adsorbedSpecific activity - 106 cpm per cm^mm1 sb sample — 30,46 cm^mm2nd sample — 27*39 cm^mm■j3rd sample - 28.03 cm mm4th sample — 20,10 cm^mm
Total gas adsorbed 106 cm^mmFilm unsaturated
Desorption commenced six hours after admitting mercury to the catalyst vessel
EESUI/PSj-
Total volume of gas desorbed 88,60 cm mmVolume of gas remaining 17*43 «n mm = 16,42$Total count rate of desorbed gas 7051 counts per minute
Total count rate of adsorbed gas 11236 counts per minute
tritium retained by film 4185*100/11236 * 37*24$3Adsorptive capacity of film 142 cm mm
•• coverage 74*64$total gas retained as function of adsorptive capacity 12,25$
tritium retained as function of adsorptive capacity 4185*100/142x106 ■ 27*81$
When the specific activity of the desorbed samples wereplotted against the total volume of desorbed gas (fig,6), a

-35-
TABLE VIII.
Desorption of tritiated hydrogen by mercury vapour at 25°C
FILM 27.
Desorbedsample
pVcm^mm
Total desorbed cm mm
*TotalCount
Count from each sample
Sp. Act. cpm/cm^mm
1 14*190 14.19 1047 1047 72.442 7*480 21.67 1694 647 86*483 6*952 28.62 2267 573 82.434 7*943 36*57 2947 680.4 85.675 4.295 40.86 371.6 371.6 86.526 5*900 46*76 872.6 501 84.897 4*413 51.17 1239 366.1 82.968 5.298 56*47 1639 399.8 75.44
9 5.261 61.73 2053.7 415.2 78.9110 5.099 66.83 2470 416.2 81.62
11 5.236 72.07 2865 395 75.4412 6.515 78*58 3364 499.4 76.67
13 3.946 82*53 302 302 76*52
14 3.120 85.65 517.6! ■
215.6 69.O8
* Corrected for dead time and minus background*

FIG
. 7
CD
CO
CDIfl
uiu tun/-uri-:i i j y 33JS
TOTA
L DE
SOIB
ED
cm?
mm
.

-36-
similar result was obtained to that from film 25.FI1M 28.
Film weaight -Temp, of adsorption -
Tritiated hydrogen only adsorbed Specific activity 1st sample -2nd sample -3rd sample -4th sample -
Total gas adsorbed Film unsaturated
(Table IX)44*20 mg25°C
106 cpm per cm mm 32.80 cm^mm 37*15 coArn 35*89 cm^mm18.04 cm^mm
123*90 cm mm
113*90 cm mm10.00 om3mm = 8.07#
DesorptionTotal gas desorbed -
• • gas retained by surfaceTotal count rate of desorbed gas 10012 counts per minute
Total count rate of adsorbed gas 13133 counts per minute
tritium retained by surface ■ 3121x100/13133 ■ 23*77$ Adsorptive capacity of film = — 3_
•• coverage143*00 cm mm86.74$
•*. tritium retained as a functionof total adsorptive capacity * 3121x100/15158 * 20.59$
The plot of specific activity against total gas desorbed is shown in fig.7.
It is seen that, unlike previous films, there were tworegions, the first where the specific activity of the desorbed gasvaries little, and the second where it appears that there is a moresharply delineated variation into five regions, yet still with an

-37-
TABLE; IX.
Desorption of tritiated hydrogen "by mercury vapour at 25° C
F im 28
Desorbedsample
pVcm3mm
Total desorbed cm mm
*TotalCount
Count from each sample
Sp. Act. ' cpm/cm3mm
1 5.302 5.302 420.6 420.6 79.302 5.332 10.63 883 462.4 86.723 5.646 16.28 1385 502.4 88.944 5.797 22.08 1890 504.7 87.065 4.453 26.53 2281 390.7 87.746 5.332 31.86 2750 468.8 87.907 5.924 37.79 3262 512.4 86.808 4.106 41.89 3618 356.4 86.509 5.846 47.74 4111 492.6 84.2810 5.608 53.35 4655 543.8 96.9611 5.755 59.10 502.6 502.6 87.8412 4.903 64.OO 925.5 423.8 86.4213 5.495 69.50 1405 478.1 87.0014 6.124 75-62 1946 542.6 88.5915 6.063 81.69 2458 5H.4 84.3316 4.715 86.40 2907 448.7 95.1717 5.093 91.49 3342 435.5 85.5118 6.552 98.05 3905 563.4 86.0019 4.356 102.40 409.5 409.5 93.9920 11.480 113.90 1448 1039.0 90.48
* Corrected for dead time and minus "background#

-38-
average activity corresponding to that of the first region® As
shall he seen in the next section, this is typical of the heavier films*
2«5o FURTHER DETAILED STUDY OP THE DESORPTION PROCESS.
In this series of experiments, increments of desorbed gas
of comparable size to those in 2*4 were studied* Instead ofconstantly removing the gas as it was desorbed, however, the
tritiated hydrogen was left in the catalyst vessel until an
appropriate volume had been desorbed, when it was pumped off andestimated in the usual way. It was hoped that this type ofexperiment would demonstrate the effect to be expected if extensiveexchange occurred between the desorbed phase and the surface. Bythis method, the pressure increased in the catalyst vessel to a
_2maximum value of the order of 4x10 mm and the time of contact of the desorbed and adsorbed phases was normally between 30 and 40 minutes, depending on the desorption rate.
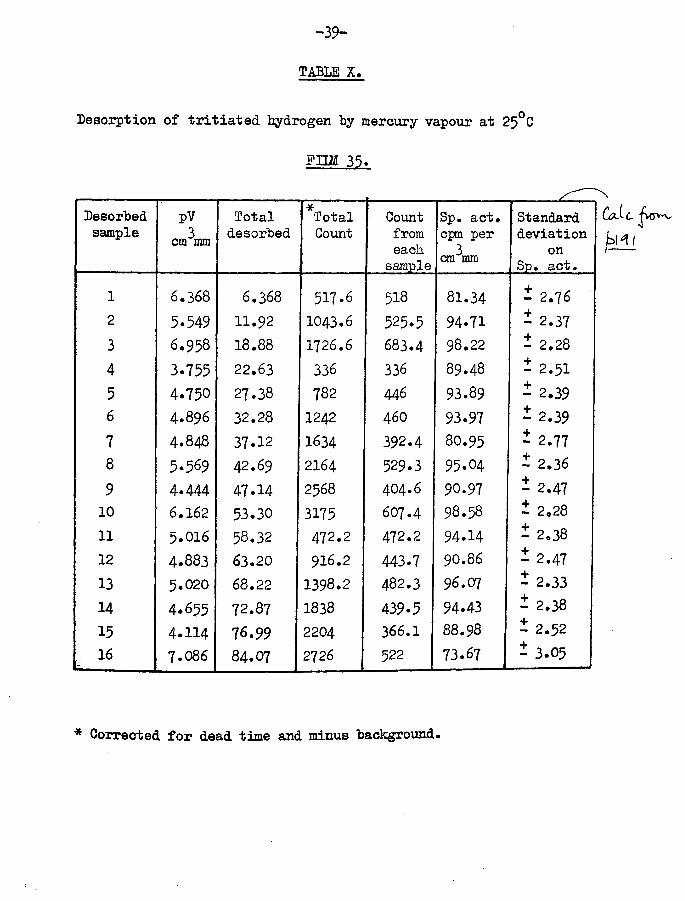
F U M 35.Film weight -Temp, of adsorption -
(Table X)
33.27 mg25°C
Tritiated hydrogen only adsorbed Specific activity - 1st sample -2nd sample -3rd sample -
106 cpm per cm^mm
Total volume of gas adsorbed
-39-
TABLE X,
Desorption of tritiated hydrogen "by mercury vapour at 25°C
FIIM 35.
Desorbedsample
pVcm^mm
Totaldesorbed
TotalCount
Countfromeach
sample
Sp. act. cpm per 3cm mm
Standard deviation
on Sp. act.
1 6.368 6.368 517.6 518 81.34 i 2.762 5-549 11.92 1043.6 525.5 94.71 - 2.37
3 6.958 18.88 1726.6 683.4 98.22 - 2.28
4 3.755 22.63 336 336 89.48 * 2.51
5 4.750 27.38 782 446 93.89 - 2.396 4.896 32.28 1242 46O 93.97 - 2.39
7 4.848 37.12 1634 392.4 8O.95 - 2.778 5.569 42.69 2164 529.3 95.04 i 2.36
9 4.444 47.14 2568 404.6 90.97 - 2.4710 6.162 53.30 3175 607.4 98.58 ± 2.28
11 5.016 58.32 472.2 472.2 94.14 - 2.38
12 4.883 63.20 916.2 443.7 90.86 - 2.47
13 5.020 68.22 1398.2 482.3 96.07 - 2.33
14 4.655 72.87 1838 439.5 94.43 - 2.38
15 4.114 76.99 2204 366.1 88.98 - 2.52
16 7.086 84.07 2726 522 73.67 - 3.05
Calc
* Corrected for dead time and minus background*

FIG
.an
i#— |
10
• — I
Y-1
CM
CO
u i u i t i u 3 / u i d a u i a i i j v a u m o s
TOTA
L DE
SORB
ED
cm3
mm.
-40-
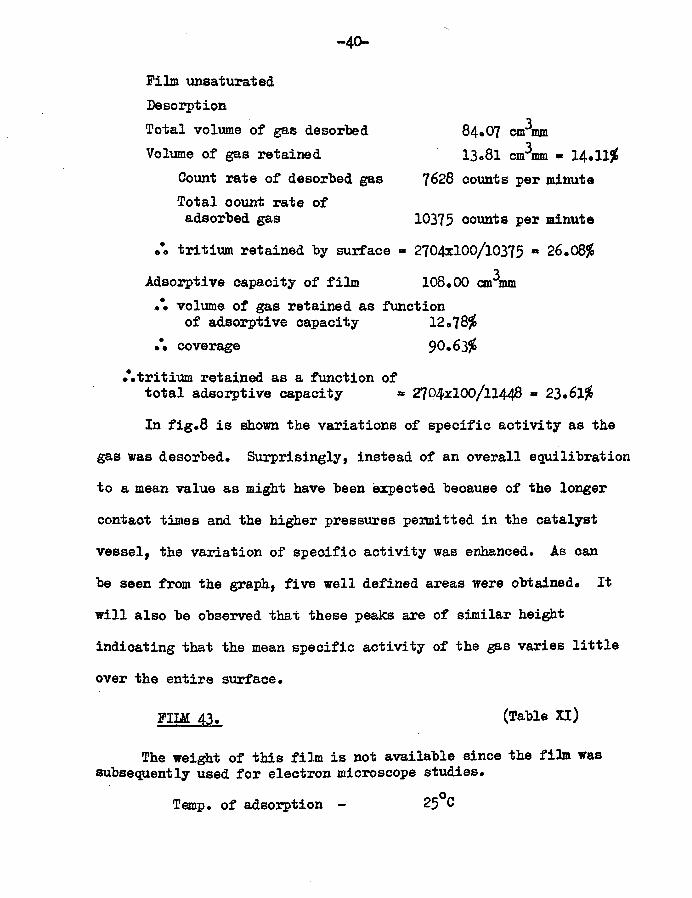
Film unsaturatedDesorptionTotal volume of gas desorbed 840O7 cm^mmVolume of gas retained 13*81 cm^mm *» 14.11#
Count rate of desorbed gas 7628 counts per minuteTotal count rate of adsorbed gas 10375 counts per minutetritium retained by surface ■ 2704x100/10375 ■ 26.08#
Adsorptive capacity of film 108.00 cm mmvolume of gas retained as function of adsorptive capacity 12*78#coverage 90*63#
/•tritium retained as a function oftotal adsorptive capacity * 2704xl00/l 1448 = 23.61#In fig.8 is shown the variations of specific activity as the
gas was desorbed. Surprisingly, instead of an overall equilibration to a mean value as might have been expected because of the longer contact times and the higher pressures permitted in the catalyst vessel, the variation of specific activity was enhanced. As can be seen from the graph, five well defined areas were obtained. It will also be observed that these peaks are of similar height indicating that the mean specific activity of the gas varies little
over the entire surface.
FIIM 43. (Table XI)
The weight of this film is not available since the film was subsequently used for electron microscope studies.
Temp, of adsorption - 25°C

-41-
TABLE XI.
Desorption of tritiated hydrogen by mercury vapour at 20°C
FIIM 43
Desorbedsample
pV Total desorbed cm mm
TotalCount
Count from each sample
Sp. Act. epm/cm^mm
1 6.977 6.977 612.8 612.8 87.862 5.400 12.517 1123 510 92.06
3 4.895 17.41 1578 455 92.964 5.315 22.73 2069 491 92.395 5.277 28.00 2562 493.4 93.506 6.745 34.75 3163 601 89.00
7 4.175 38.92 380.7 380.7 91.20
8 5.023 43.95 854.7 473 94.199 5.201 49.15 1289 435 83.64
10 5.878 55.03 1882 593 100.90
n 4.743 59.77 2370 489 103.00
12 4.865 64.63 2782 412 84.68
13 4.852 69.49 3221 439 90.48
14 4.537 74.02 3690 469 103.4015 6.193 80.22 4219 529 85.4316 8.626 88.84 792 792 91.81
17 4.344 93.19 1228 436 100.30
18 4.188 97.37 1628 400 95.5219 5.404 102.78 2078 450 83.28
20 4.796 107.57 2555 477 99.4521 5.002 112.58 3038 483 96.5422 4.581 117.16 3477 439 95.8523 4.285 121.44 3918 441 102.90
24 4.122 125.56 4319 401 97.27
* Corrected for dead time and minus background.

FIG
. 9
CO
cn
CO
CM
O) CD
u i u i { u i ) / u i d ' j A l l A I 1 0 V 3 I J I 3 3 J S
TOTA
L DE
SORB
ED
cm*
mm
.

-42-
Tritiated hydrogen only adsorbedSpecific activity - 106 cpm per an mm1st sample - 32*95 cm mm2nd sample - 30.97 cm^mm3rd sample - 31.08 cm^mm4th sample - 30.48 cm^mm5th sample - 18.81 cm^mm
Total tritiated hydrogen adsorbed 3144.30 cm mmPi 1m saturated Desorption was at 20°CTotal volume of gas desorbed 125*6 cnAam
Volume of gas retained 18,73 cra mm = 12*98$Count rate of desorbed gas 11702 counts per minuteTotal count rate of adsorbed gas 15296 counts per minute
tritium retained by surface = 3594x100/15296 = 23*49$If the graph of specific activity of the desorbed fractions
(fig.9 ) is compared with that of film 28, it will be observed that a similar desorption pattern is obtained, although in this case, the peak separation is again enhanced. There are, however, two areas, the first showing a less marked variation in specific activity than the second. According to the volume of tritiated hydrogen adsorbed, the film weight was 44 mg, i*e* comparable with the weight of film 28*

FIG. JO
r> A•/
\,V/ \
'
1
\ •
*/I\1I1/ Tf-ll«tI 1
|
.
•1
0 10 20 30 40 50 60 70T O T A L V O L U M E DESORBED c m 1 m m

-43-
CHAPTER 3*
T O STANDARD FILMS.
It was established in the previous chapter that a periodic
change occurred in the specific activity of the tritiated hydrogen desorbed from vacuum evaporated nickel films. It seemed possible that one or both of two factors might be responsible, viz. the
physical structure of the nickel surface because of crystal size, orientation of the crystal planes, or because of the presence of cracks and fissures or other topographical irregularities; another possible reason was surface contamination, especially with oxygen. This latter possibility was important because of the part thought to be played by oxygen impurities in the study of heats of adsorption
of hydrogen on various nickel catalysts (4)*Accordingly, it was decided to study in turn, the effect of
each of these factors on the pattern of desorption.
3.1. SINTERED FILMS.
Beeck (13) reported that sintering evaporated nickel films at a temperature higher than the deposition temperature reduced the volume of hydrogen adsorbed. For the purpose of studying the effect of sintering on the desorption pattern, in each of the following experiments the film was sintered by immersing the catalyst vessel in boiling water for one hour prior to the adsorption
process.
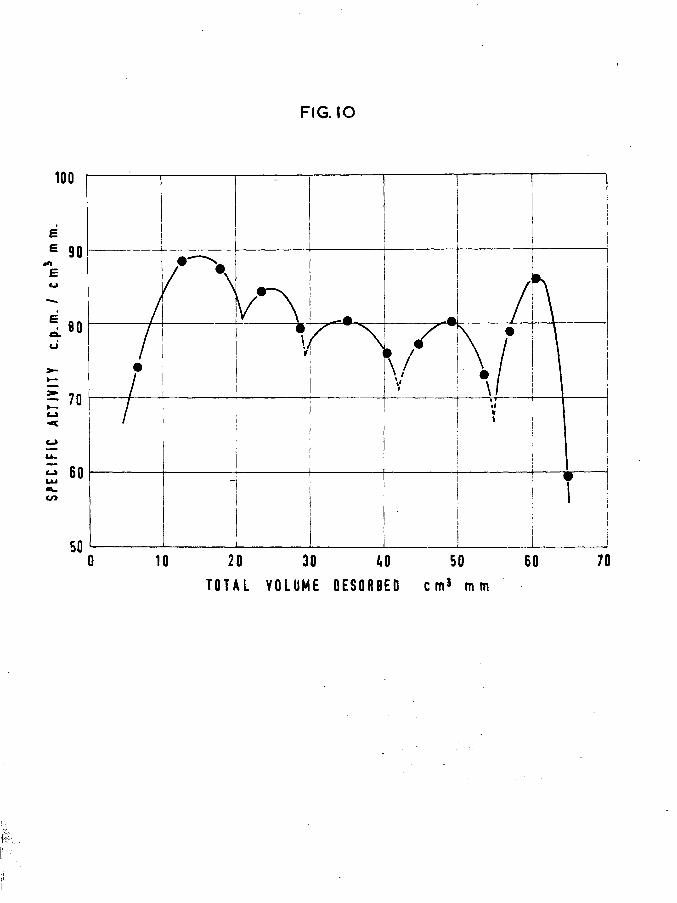
FIG.IO
100
u
= 70
cn
10 20 30 700 50 6040T O T A L V O L U M E DESORBED c m J m m

-44-
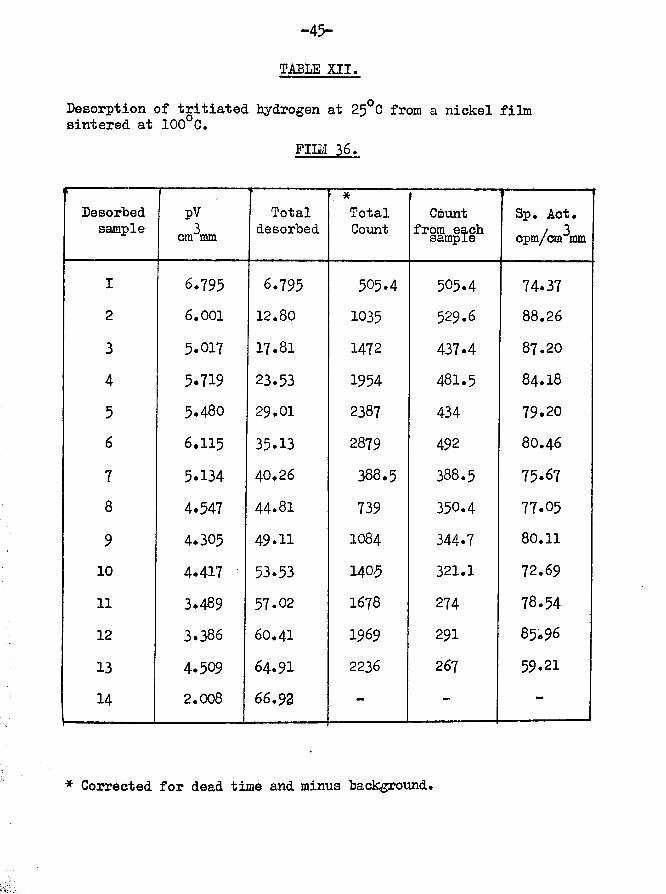
FIIM 36Film weight -Temp, of adsorption -
Tritiated hydrogen adsorbed Specific activity - 1st sample -2nd sample -3rd sample -
Total volume of gas adsorbedDesorptionTotal tritiated hydrogen desorbed -
•#. volume retained by surface -Total count rate of desorbed gas -
Total count rate of adsorbed gas
tritium retained by surfaceAdsorptive capacity of film
. reduction in surface area due to sintering
Count rate calculated from maximum adsorptive capacity
tritium retained as a function of total adsorptive capacity
Fig.!0 shows that the appearance of
(Table XII)
41.58 mg 25°C
"5106 cpm per cm mm 32.99 cm^mm 30.91 cm^mm 19.77 cm^mm
83.67 cm^mm
66.92 cnAim16.71 cm^mm » 20.02$
5125 counts per minute
8869 counts per minute3744x100/8869 « 42.23$136 cm^mm
38.5$
136x106 = 14416 counts per minute
3744x100/14416 = 25.96$ the graph is similar to that of
previous experiments with all five peaks still present although the surface area is reduced by 38.5$. It appeared that the reduction in adsorption capabilities which accompanied the sintering process, applied equally to all the areas responsible for producing the
characteristic desorption pattern.
-45-
TABLE XII.
Desorption of tritiated hydrogen at 25°C from a nickel film sintered at 100°C.
FIIM 36.
If------ ---Desorbed
samplepV3cm mm
Totaldesorbed
1 *TotalCount
Countfrom each sample
Sp. Act. cpm/cm^mm
I 6.795 6.795 505.4 505.4 74.372 6.001 12.80 1035 529.6 88.26
3 5.017 17.81 1472 437.4 87.20
4 5.719 23.53 1954 481.5 84.I8
5 5.480 29.01 2387 434 79.206 6.115 35.13 2879 492 80.46
7 5.134 40.26 388.5 388.5 75.678 4.547 44-81 739 350.4 77.05
9 4.305 49.11 IO84 344.7 80.11
10 4.417 53.53 1405 321.1 72.69
11 3.489 57.02 1678 274 78.5412 3.386 6O.4I 1969 291 85.96
13 4.509 64.91 2236 267 59.21
14i—
2.008 66.93 - - -
* Corrected for dead time and minus background.

FIG.
11
4
CO
CO
S S 5 S win tu»j/ U)d3 UIAI13Y aumdS
O)
TOTA
L 'V
OLUM
E OE
SORB
E0 cm
1 m
m.

(Table XIII)41.67 mg 25°C
106 cpm per cm mm 34*70 cnAom 42«93 cm^mm
77*63 cm^mm
62.87 cm mrn■3volume of gas retained by surface 14*76 cm mm * 19.02$Total count rate of desorbed gas 4130 counts per minute Total count rate of adsorbed gas 8229 counts per minute
tritium retained by surface 4099x100/8229 ■ 49*8$Adsorptive capacity of film 136 cm^mm
*\ reduction in surface area 42*9$•*. tritium retained as a function of
adsorptive capacity 4099*100/14416 = 28.43$Fig.11 again illustrates the essential similarity of the desorption processes from these films and from normal films. It may also be noticed that the percentage of tritium retained by the surface is much higher, expressed as a percentage of the total adsorbed tritiated hydrogen. When considered in relation to the calculated adsorptive capacity of the films, however, the values correspond with the percentage retention by normal films. It is possible that during the sintering process, and despite rigorous catalyst vessel preparation, small quantities of gas are desorbed from the glass. These will, of course, be adsorbed by the film, perhaps reducing the area available for hydrogen adsorption and poisoning
-46-FIIM 40Film weight -Temp, of adsorption -
Tritiated hydrogen adsorbed Specific activity - 1st sample -2nd sample
Total volume of gas adsorbed DesorptionTotal volume of gas desorbed

-47-
TABLE XIII.
Desorption of tritiated hydrogen at 25°C from a nickel film sintered at 100 C.
FILM 40
Desorbedsample
pV3cm mm
TOTALdesorbedcm mm
TotalCount
Count from each
sampleSp. Act.
cpm/cm^mm1 5*238 5.238 279.6 279.6 53.372 5-393 10.63 675.6 396 73.433 6.057 I6.69 1144 468.2 77.294 2.471 19.16 1289 145 58.68
5 5*771 24.93 1672 383 66.376 3.916 28.85 1922 250 63.81
7 4.867 33.71 2268 345.9 71.06
8 4.339 38.05 2562 293.6 67.679 4.207 42.26 2796 234.3 55.69
10 3.918 46.18 3085 288.6 73.6511 5.865 52.04 3466 380.8 64.92
12 2.929 54.97 183 183 62.4713 4.217 59.19 447 264 62.61
14 3.684 62.87 657 210 57.07
* Corrected for dead time and minus background.

-48-
the surface, "to a certain extent, for desorption# Experiments carried out in which a very slight leak developed in the catalyst vessel during a desorption indicated that the pattern of desorption was normal, hut that a higher percentage of tritium than usual was retained# In view of this, it would not he surprising that, especially in the case of the latter film, the retention of tritium is a few percent higher than normal.
During the adsorption process in sintered films, the residual hydrogen pressure in the catalyst vessel, before saturation, was higher hy a factor of 2 than for mnsintered films.
The results of adsorption experiments on vacuum evaporated nickel films sintered at 100°C for one hour, are tabulated below.
TABLE XIV.
Film No. , Weight mg
Observed capacity an mm
Calculatedadsorptivecapacity
% reduction
36 41.58 83.67 136 38.5
37 44.95 81.63 146 44.0940 41.67 77.63 136 42.9
3.2. LOW TEMPERATURE DESORPTION EXPERDMTS.Certain desorption experiments were carried out at lower
temperatures than normal in an attempt to estimate the effect of
temperature variation on the surface.FIIM 9.This film was immersed in liquid nitrogen before the adsorption
process was initiated./

■*49-
An attempt was made to effect a desorption with mercury vapour at this temperature but although the film was exposed to mercury vapour for more than 24 hours, the Pirani gauges indicated no increase in pressure in the catalyst vessel throughout this period*The tube leading from the mercury sours© to the catalyst vessel was heated with an infra red lamp at one stage to increase the kinetic energy of the mercury atoms before entry to the catalyst vessel, but this was without result. As soon as the liquid nitrogen container was removed from the catalyst vessel, however, a considerable increase in pressure was obtained even before the film had time to reach room temperature. This seemed to indicate that the mercury was indeed gaining access to the surface, but was possibly physically adsorbed on top of the adsorbed hydrogen, since apparently, the activation energy for the desorption process was too high for it to occur at liquid nitrogen temperatures# The results of this experiment, although negative in nature, are interesting compared with the observations recorded in section 3# It was also observed that during the adsorption process no residual pressure was indicated at any stage by the Pirani gauges.
It seemed from this result that desorption by mercury Vapour could not be carried out under extreme low temperature conditions, so the following series of desorption experiments Were effected
with the catalyst vessel immersed in melting ice.
FIIM 41.Film weight —Temp, of adsorption -
Tritiated hydrogen adsorbed
66#16 mg 26°0

-50-
Specific activity 106 cpm per cm^mm1st sample 2nd sample 3rd sample 4th sample 5th sample 6th sample 7th sample
Film unsaturatedTotal volume of gas adsorbed
The desorption process from this film was begun as a nomal desorption at room temperature, but after it had been established, immediately the fourth desorption increment had been pumped from the catalyst vessel, the latter was immersed in crushed ice. The Pirani gauge reading immediately fell to zero, where it remained for more than thirty minutes, despite the fact that the desorption
3rate had been about 10 cm mm per hour before the temperature of the catalyst vessel was lowered. Eventually the desorption slowly re-started and it was allowed to proceed for another thirty minutes. An attempt was then made to stop the desorption process by cooling the mercury vapour source in liquid nitrogen, but the desorption continued for thirty minutes before a perceptible reduction in rate was observed, and another hour passed before it slowed to the nomal desorption rate (cf 3.6). The specific activity of the gas desorbed during this time was about 10^ more than that of the previously desorbed sample. When the ice was removed from around the catalyst vessel, a large volume of hydrogen was immediately desorbed, and
the specific activity of this hydrogen was @f the same order as the

-51-
first fractions* The important desorption results can be summarised asfollowst-
SampleVolume cm mm
Specific Activity counts per minute per cm mm
Time of desorption in minutes
1 11.32 75.80 752 7*635 79*86 353 7*502 77*59 354 6.892 77*14 40
5 5*861 67*94 1606 11.48 75.71 -
FIIM 42.
The desorption from this film was carried out at 0°C but the3results were of doubtful integrity since 112*4 cm mm of gas were
3desorbed out of a total adsorption of 114*3 cm mm. A very slight leak was a possible explanation. However, the usual plot of specific activity of the desorbed samples against total volumes of gas desorbed showed two variations from normal; firstly, there were at least seven peaks; and secondly, for the main part of the desorption the average specific activity of the gas was lower than for films at 25°C, but became about 15$ higher towards the end of the desorption. Despite the possible leak, these results are typical of desorptions at 0°C, as evidenced by the following
experiment •FIIM 44. (Table XV)Film weight - 30*50 &6
_ _ O MTemp, of adsorption - 25 CTritiated hydrogen adsorbed
Specific activity - 106 cpm per can mm

o>
o»uiuit u i j / u i ( l 3 A1IAI13V 3IJI33JS
TOTA
L VO
LUME
DE
SORB
ED
cm9
mm
.

-52-
lst sample - 33*90 cm3**2nd sample - 32.69 cm\im3rd sample - 26.32 cm\m
Film saturatedTotal volume of gas adsorbed 92*91 can mmDesorption was carried out at 0°C and, although the film was
saturated, initial displacement was preceded by an induction periodof nearly one hour.
Total volume of desorbed gas 80.71 cm\mVolume retained by surface 12.30 cm^mm
Total count of desorbedgas - 7326 counts per minute
Total count rate ofadsorbed gas - 9849 counts per minute
.‘.tritium retained by surface 2523x100/9849 « 25.62$It will be observed from fig.12 that, although the mean
specific activity of the desorbed gas is initially lower than from
corresponding desorptions at 25°C, the difference is recovered at the completion of the desorption by the enhanced specific activity of the last few fractions. The amount of retained tritium is thus identical with that retained by films at 25°C.
The desorption was interesting in that, although the film was saturated, a considerable induction period was involved at the beginning of the process, when 4*7 can mm of gas were displaced in 115 minutes. Thereafter, the rate of desorption was between 6 and 7
cm^mm per hour which is comparable with normal desorption rates.Conclusions from these films would appear to be twofold:
firstly, the desorption of tritiated hydrogen by mercury vapour isan activated process requiring a considerable activation energy,

-53-
TABLE XV.
Desorption of Tritiated hydrogen by mercury vapour at 0°C
FIIM 44
Desorbedsample
v ycm mm
Total desorbed cm mm
— ■ 1TotalCount
# -Count , from eachsample
Sp. Act. cpm/cm3mm
1 4*665 4.665 392.6 392.6 84.I82 4*444 9.109 802.6 410 92.26
3 4*646 13.76 1227 424.5 91.374 4*735 18.49 1606 378.5 79.955 4.870 23.36 2059 453 93.036 4.525 27.89 2467 408 90.18
7 4.545 32.43 2874 407.7 89.718 4.692 37.12 3292 417 88.86
9 4.628 41.75 3705 413 89.25
10 4.528 46.28 4135 430 94.9711 4*530 50.81 4522 387 85.4312 4.276 55-09 4996 474 110.913 . 5.883 6O.97 564 563.9 95.8514 4.573 65-54 1011 447 97.7415 3.931 69.47 1374 363 92.3216 4.384 73.86 1852 478.7 109.117 6.857 8O .71 2330 478 69.71
.
* Corrected for dead time arid minus background*

-54-
the displacement of tritium being affected to a greater extent
than hydrogen; and secondly, desorption does not proceed until
a sufficient concentration of mercury vapour, depending on the temperature, has condensed or become physically adsorbed, perhaps on top of the adsorbed phase on the surface* This latter point is particularly important in view of the observations detailed in 3*5*
3,3. OXYGEN ADSORPTION EXPERIMENTS.
Since contamination by impurities, especially oxygen in the case of catalysts reduced from the oxide, is one of the causes cited in the literature of possible surface heterogeneity, desorption experiments were carried out in which a low percentage of oxygen was pre-adsorbed.
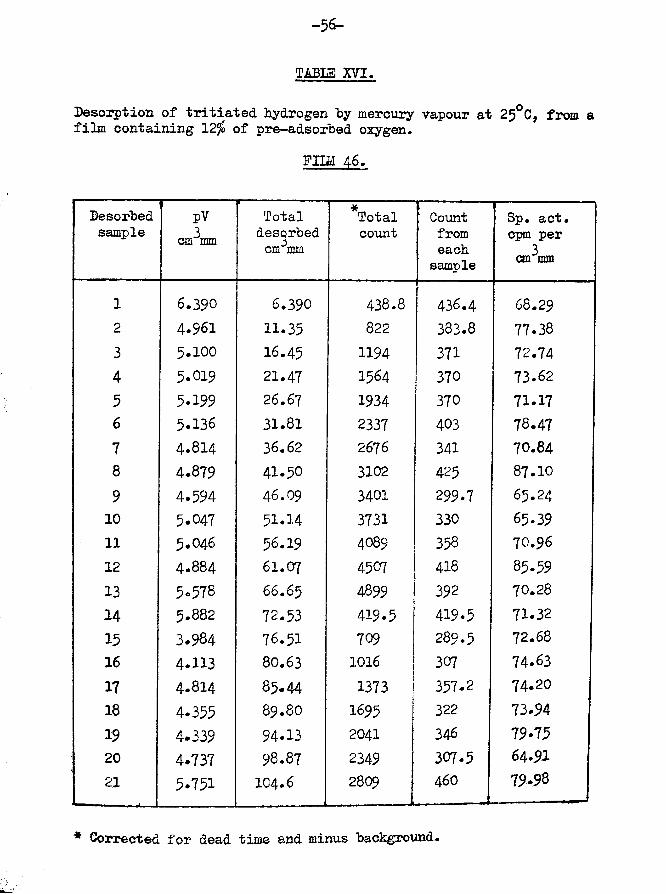
FILM 46 (Table XVI)Film weight -Temp* of adsorption -
38.10 mg
Oxygen adsorbed first 1st sample
Tritiated hydrogen adsorbed Specific activity 2nd sample -3rd sample -4th sample5th sample -
106 cpm per cm mm
Film saturatedTotal tritiated hydrogen adsorbed
.Amount of oxygen adsorbed related to total adsorption - 11*97$
Desorption
FIG
. 13
as
C3
CM
acn asuiui^ui-3 / uid'3 A1UI13V 3IJI33dS
TOTA
L VO
LUME
DE
SORB
ED
cm?
mm
.

Total volume of tritiatedhydrogen desorbed
.*. tritiated hydrogen retained13.90 cnAm = 11.73$by surface
Total count rate of desorbed gas 7707 counts per minute
Total count of adsorbed gas 12561 counts per minute
4854XIOO/1256I « 38.65$o’, tritium retained by surface
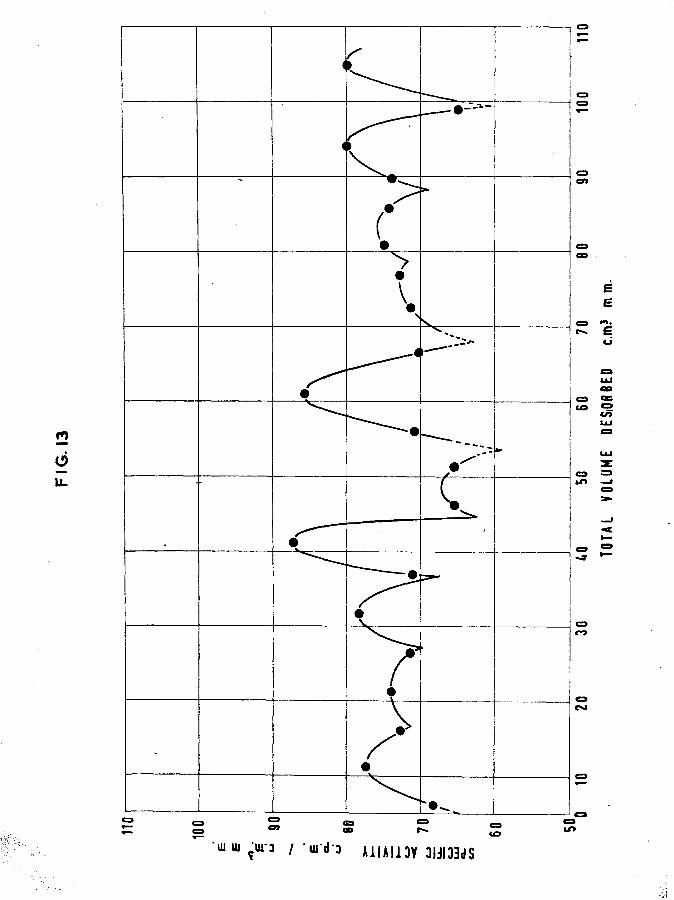
It can be seen from fig. 13 that the normal desorption pattern has been disrupted and it is difficult to recognise any essential similarity with "clean'* films. It would appear that certain of the peaks have been split into smaller ones providing an overall reduction in mean specific activity of the desorbed phase. This is reflected in the percentage of tritium retained by the surface, although the overall retention appears to be consistent with that of nounal saturated films. An unusual feature of this film is that, in spite of the amount of oxygen adsorbed, the volume of hydrogen
adsorbed is within 3 or 4$ of the calculated adsorptive capacity of the film.
This film was evaporated in an atmosphere of 1 mm of argon (cf next section).
F H M 30 (Table XVII)
Film weight Temp, of adsorption
28 mg 25°C
Oxygen adsorbed first 1st sample
Tritiated hydrogen adsorbed Specific activity - 106 cpm per cm mm
-56-
TABLE XVI.
Desorption of tritiated hydrogen by mercury vapour at 25°C, from a film containing 12$ of pre-adsorbed oxygen.
F H M 46.
Desorbedsample
pVcm^mm
Total desorbed cm mm
*Totalcount
Countfromeach
sample
Sp. act. cpm percm^mm
1 6.390 6.390 438.8 436.4 68.292 4.961 11.35 822 383.8 77.383 5.100 16.45 1194 371 72.744 5.019 21.47 1564 370 73.625 5-199 26.67 1934 370 71.176 5.136 31.81 2337 403 78.477 4.814 36.62 2676 341 70.848 4.879 41.50 3102 425 87.10
9 4.594 46.09 3401 299.7 65.2410 5.047 51.14 3731 330 65.3911 5.046 56.19 4089 358 70.9612 4.884 61.07 4507 418 85.5913 5.578 66.65 4899 392 70.28
14 5.882 72.53 419.5 419.5 71.3215 3.984 76.51 709 289.5 72.68
16 4.113 80.63 1016 307 74.6317 4.814 85.44 1373 357.2 74.2018 4.355 89.80 I695 322 73.9419 4.339 94.13 2041 346 79.7520 4.737 98.87 2349 307.5 64.91
21 5.751 104.6 2809 460 79.98
* Corrected for dead time and minus background.

art
ao
us
CSS CSS as
UiUi u n / «u«t3 A i l A l i a V 3 I J I 3 3J S
TOTA
L VO
LUME
DE
SORB
ED
c.m?
mm.
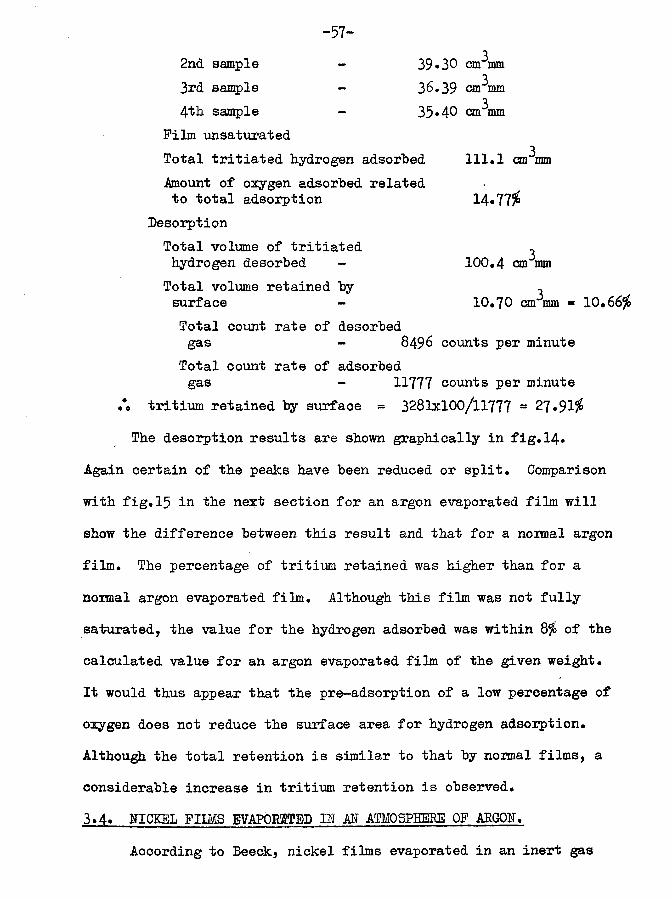
-57-2nd. sample 3rd sample 4th. sample
Film unsaturatedTotal tritiated hydrogen adsorbed 111*1 cm^mmAmount of oxygen adsorbed related to total adsorption 14*77$
DesorptionTotal volume of tritiated ^hydrogen desorbed - 100*4 cm mm
Total volume retained by ^surface - 10*70 cm mm ® 10*6Total count rate of desorbedgas - 8496 counts per minute
Total count rate of adsorbedgas - 11777 counts per minute
•*o tritium retained by surface = 3281x100/11777 = 27*91$The desorption results are shown graphically in fig.14*
Again certain of the peaks have been reduced or split. Comparisonwith fig. 15 in the next section for an argon evaporated film willshow the difference between this result and that for a normal argon film. The percentage of tritium retained was higher than for a normal argon evaporated film. Although this film was not fully saturated, the value for the hydrogen adsorbed was within 8$ of the calculated value for an argon evaporated film of the given weight* It would thus appear that the pre-adsorption of a low percentage of oxygen does not reduce the surface area for hydrogen adsorption. Although the total retention is similar to that by normal films, a considerable increase in tritium retention is observed*3*4* NICKEL FILMS EVAPORATED IE AN ATMOSPHERE OF ARGON.
According to Beeck, nickel films evaporated in an inert gas
-58-
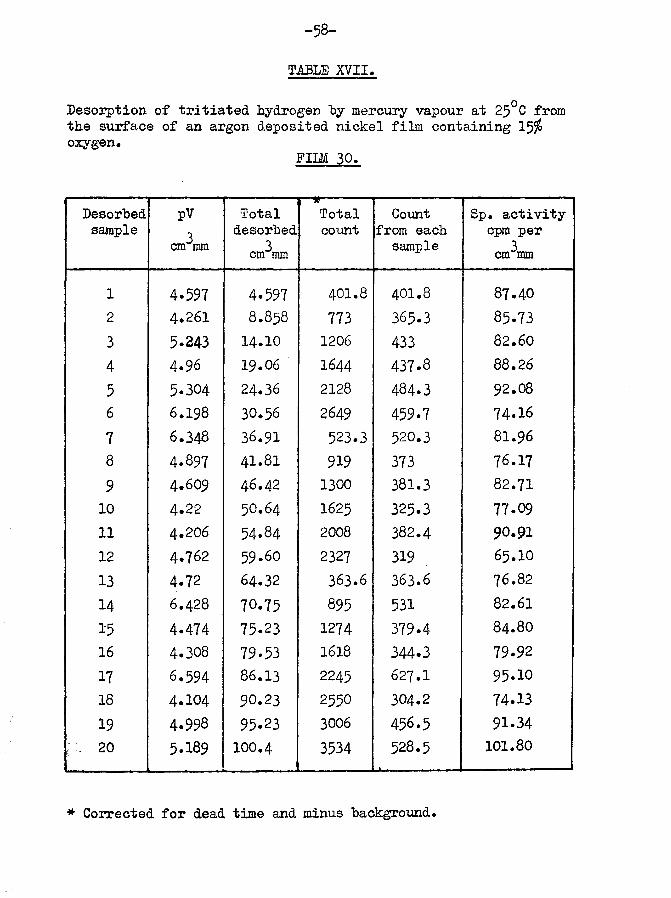
TABLB XVII.
Desorption of tritiated hydrogen hy mercury vapour at 25°C from the surface of an argon deposited nickel film containing 15$ oxygen.
FILM 30.
Desorbedsample
pVcm^mm
TotaldesorbedcrAnn
— w------Totalcount
Count from each
sampleSp. activity
cpm percm^mm
1 4.597 4.597 401.8 401.8 87.402 4.261 8.858 773 365.3 85.733 5-243 14.10 1206 433 82.60
4 4*96 19.06 I644 437.8 88.26
5 5-304 24.36 2128 484.3 92.08
6 6.198 30.56 2649 459.7 74.167 6.348 36.91 523.3 520.3 81.96
8 4.897 41.81 919 373 76.179 4.609 46.42 1300 381.3 82.71
10 4.22 5O.64 1625 325.3 77.0911 4.206 54.84 2008 382.4 90.9112 4.762 59.60 2327 319 65.IO13 4.72 64.32 363.6 363.6 76.82
14 6.428 70.75 895 531 82.61
1-5 4.474 75.23 1274 379.4 84.80
16 4.308 79.53 1618 344.3 79.9217 6.594 86.13 2245 627.1 95.1018 4.104 90.23 2550 304.2 74.1319 4.998 95.23 3006 456.5 91.3420 5.189 100.4 3534 528.5 101.80
* Corrected for dead time and minus background.

FIG
15
CO
CM
CMCO
UIUI t u n / Ui-d J A 1 I A I X 3 V 31 j l33<)S
TOTA
L VO
LUME
DE
SORB
ED
cm1
mm
.
-59-
atmosphere are orientated with the 110 crystal plane parallel to
the substrate* These films adsorbed twice as much hydrogen for a given weight as vacuum evaporated films. Although Sachtler and Dorgelo ( 2 1 ) later showed that a preferred orientation could be obtained, the plane of orientation was not necessarily represented on the surface* Nevertheless, in order to elucidate the reasons for the desorption pattern, it was decided to study argon evaporated films and determine the effect of possible differences in crystal orientation or film structure.
FIIM 49 (Table XVIII)Film weight - 25*25 mgTemp, of adsorption - 25°C
Tritiated hydrogen adsorbed ^Specific activity 106 cpm per cm mm1st sample - 32*54 cm^mm2nd sample - 32*41 cm^mm
33rd sample - 30.98 cm mm4th sample - 16.11 cm mm
Film saturatedTotal tritiated hydrogen adsorbed 112 cm^mm
DesorptionTotal gas desorbed - IO4.7O cnAam
•• gas retained by surface 7*30 cm mm = 6.52$Total count rate of desorbed gas - 9482 counts per minute
Total count rate of adsorbed gas - 11872 counts per minute
tritium retained by surface = 2390x100/11872 * 20.13$The results are plotted in fig.l§ and are typical of the
desorption pattern obtained with the argon films investigated.

-60-
TABLE XVIII.
Desorption of hydrogen by mercury vapour from the surface of an argon evaporated nickel film at 25°C
F H M 49.
Desorbed ; sample
pVcm3mm
Totaldesorbed
*TotalCount
Count from each sample
Sp. Act. cpm/cm3mm
1 2.213 2.213 166.7 166.7 75.322 4.447 6.660 572.7 406 91.283 4*995 11.66 1050 477 95.504 4.897 16.55 1484 434.6 88.76
5 5.315 21.87 1933 448 84.296 5.037 26.90 2438 505 100.27 5.O64 31.97 2930 492 97.168 5.820 37.79 3392 462 79.389 5.129 42.92 3780 388 75.6510 4-733 47.65 438.5 438.5 92.66
11 4.967 52.62 887 448.6 90.3212 4.818 57.44 1302 415 86.1213 5.289 62.72 1787 485 91.68
14 5.335 68.06 2281 493.7 92.5115 4.968 73.03 2773 493 99.2216 4.989 78.02 3178 405 81.1917 5.253 83.27 3673 495 94.2318 4.859 88.13 4194 521 107.319 5.095 93.22 4579 385 75.5620 11.48 104.7 5702 1123 97.77
* Corrected for dead time and minus background.

-61-
The number of peaks has been increased to seven and there is lessregularity in peak height compared with vacuum evaporated films.
It may also be observed that these films adsorbed a greatervolume of hydrogen per mg weight than vacuum films, the ratiobeing 4*3* The percentage of tritium retained was correspondinglyless and, in fact, the retention ratio of tritium by vacuum filmsand by argon films was also similar to this value.
Table XIX shows the adsorption values obtained for argonevaporated films. The number of hydrogen atoms adsorbed per mg
17of nickel was higher than that obtained by Beeck (2*5x10 atoms per mg). The volumes adsorbed were proportionate to the film weights and are shown graphically in fig.2.
3.5. EXCHANGE EXPERHMTS.
In a few early experiments, exchange between gas and adsorbed phase had been demonstrated in a qualitative manner, and an experiment was conducted to estimate the extent of exchange which occurred at pressures comparable to those attained in the catalyst vessel during desorption. Accordingly, an argon evaporated film was saturated with tritiated hydrogen, and successive 5 cm^mm aliquots of tritiated hydrogen of the same specific activity as the adsorbed gas were pumped into the catalyst vessel at different stages of the desorption process. Bach was allowed to remain in contact with the surface for 40 minutes, which was a similar period to the contact time of desorbed fractions. Before pumping it away from the
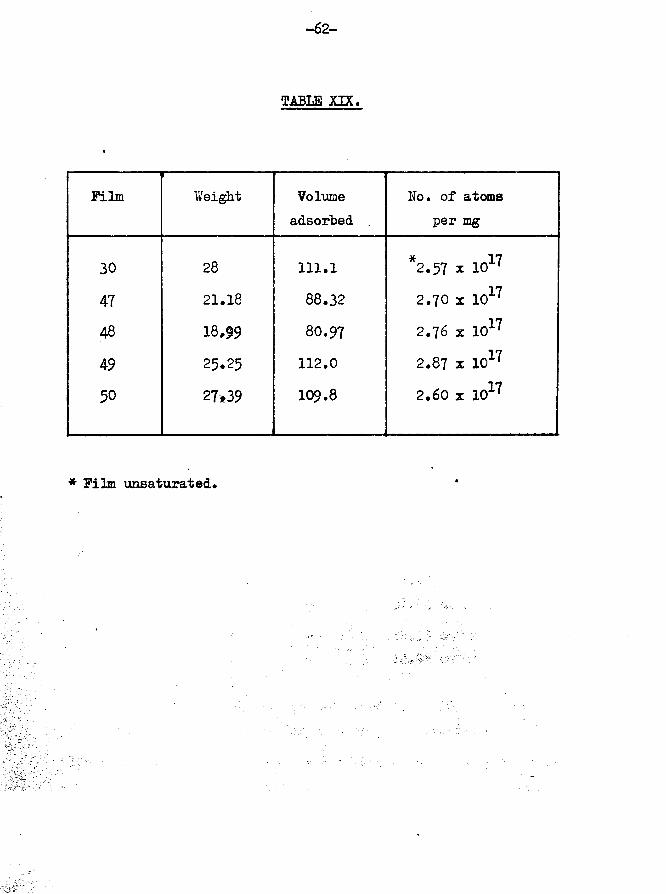
-62-
TABLE XIX.
Film Weight Volumeadsorbed
Ho. of atoms per mg
30 28 111.1 * 17 2.57 x 10 '
47 21.18 88.32 2 .70 1 1017
48 18.99 80.97 2.76 X 10¹⁷
49 25*25 112.0 2.87 I 1017
50 27*39 109.8 2.60 x 10¹⁷
* Film unsaturated.
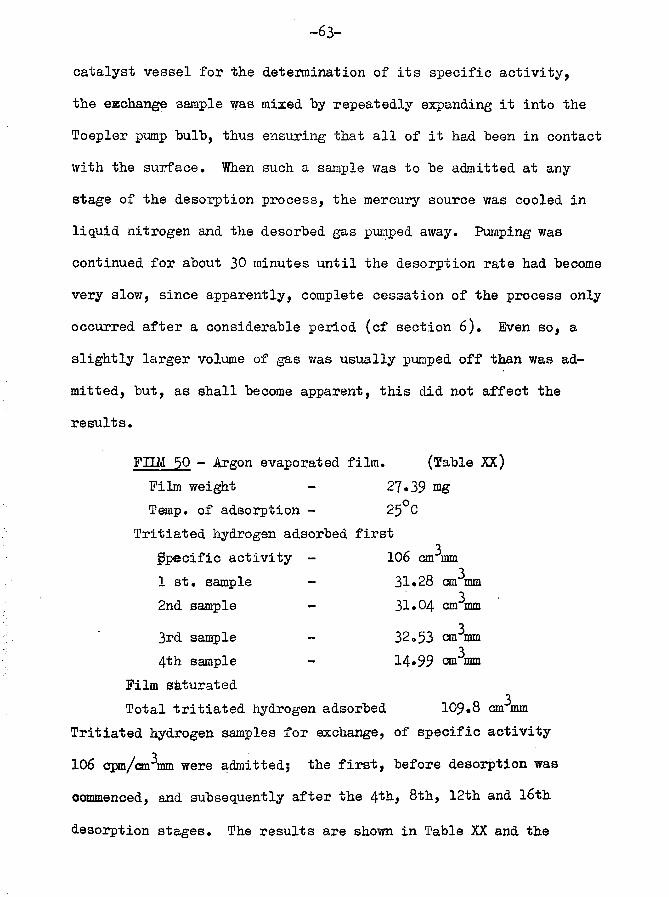
-63-
catalyst vessel for the determination of its specific activity, the exchange sample was mixed by repeatedly expanding it into the Toepler pump bulb, thus ensuring that all of it had been in contact with the surface. When such a sample was to be admitted at any
stage of the desorption process, the mercury source was cooled in liquid nitrogen and the desorbed gas pumped away. Pumping was continued for about 30 minutes until the desorption rate had become very slow, since apparently, complete cessation of the process only occurred after a considerable period (cf section 6). Even so, a
slightly larger volume of gas was usually pumped off than was admitted, but, as shall become apparent, this did not affect the results.
Film saturated3Total tritiated hydrogen adsorbed 109*8 cm mm
Tritiated hydrogen samples for exchange, of specific activity
commenced, and subsequently after the 4^b, 8th, 12th and 16th
desorption stages. The results are shown in Table XX and the
FIIM 50 - Argon evaporated film Film weight -Temp, of adsorption -
(Table XX)27*39 mg 25°C
Tritiated hydrogen adsorbed firstSpecific activity 1 st. sample 2nd sample
3106 cm mm
3rd sample 4th sample
106 cpm/cm^mm were admitted; the first, before desorption was

-64-
TABLE XX.
Results of exchange experiment.
SampleVolume of tritiated hydrogen desorbed before exchange
sample admittedVolume
admitted cm mm
Volume removed car mm
Specific activity cpm/cm mm
1 0 5.358 4.992 91.032 20.01 5*940 6.330 91.793 39.66 6.770 7.066 89.78
4 59.134 4.980 5.941 93.56
5 78.83 6.914 7.750 92.12

(O
oCM
o CD CD CDcn
•UIUJ t u i3 / u i d - 3 A 1 I A I 1 3 V 31 J I 0 3 d S
TOTA
l VO
LUME
DE
SORB
ED
cm3
mm
.
-65-
desorption curve is plotted in fig*16, the arrows indicating the point at which samples for exchange were admitted*
It can be seen that the values obtained for the specific activities were remarkably constant irrespective of the stage at which the gas was admitted, and that a 15$ reduction in specific activity had occurred. This result seemed rather surprising in view of the variation in specific activity normally exhibited by desorbed fractions. On reviewing the results from previous experiments, however, it was discovered that when desorption from normal films had been stopped overnight, the specific activities
of the fractions transferred to the gas phase during this period were similar to those of the exchange experiments. Such results are detailed in Table XXI.
As will be observed, if two such samples were desorbed from sintered or oxygen containing films, both of which showed enhanced tritium retention, these were of the same specific activity.
These results show that equilibration between the gas and adsorbed phases will only occur in the absence of gas phase mercury vapour. Physical adsorption of mercury, possibly in a second layer above hydrogen, would therefore seem to be a possibility.3.6. MERCURY DISPLACEMENT SXPERIMMTS.
The displacement of hydrogen from the films was carried out2CRby Hg vapour, the arrival of which at the nickel surface was
monitored by the gamma counter arranged parallel with the catalyst
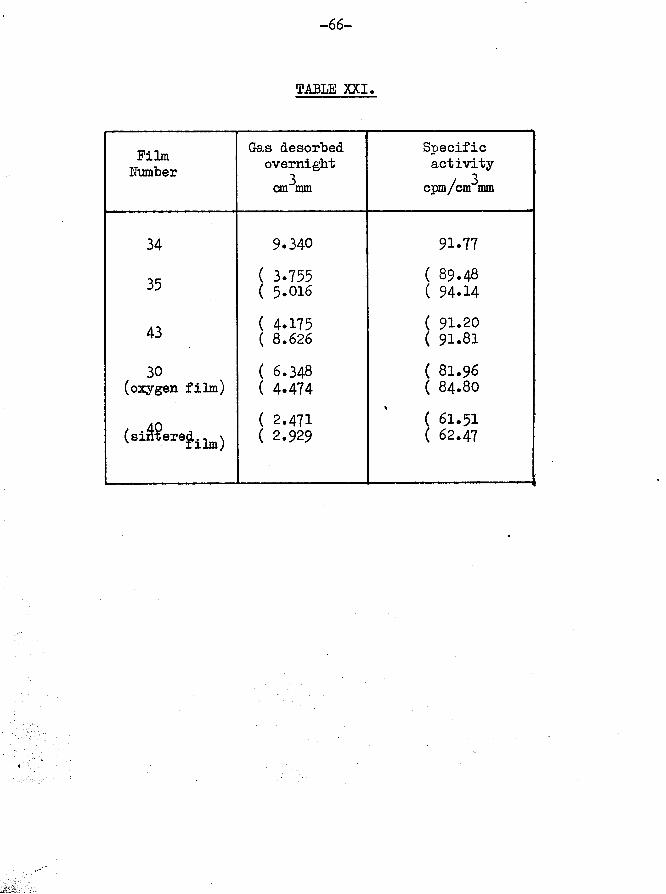
-66-
TABLE XXI.
FilmNumber
das desorbed overnight
3cm mm
Specificactivitycpm/cnAom
34 9.340 91.77
35 ( 3.755 ( 89.48( 5*016 ( 94.14
43 ( 4.175 ( 91.20( 8.626 ( 91.81
30 ( 6.348 ( 81.96(oxygen film) ( 4.474 ( 84.80
(si$erejilm)( 2.471 ( 61.51( 2.929 ( 62.47

TOTAL VOLUME DES0R8ED c m 1 m m orT R I T I U M A C T I V I T Y c.p.n. x 100
oCD CO
0
an
E EODO UCO
• o
ur>
X x\
CNI
yo,
0o> CD to
01 » U i do Ai I A 113 V AUQ3UTH
MINUTE
S

-67-
vessel. The count was taken during the first 10 minutes of each desorption period and the value obtained related to the total volume of gas and the amount of tritium desorbed up to the end of the previous desorption stage.
Typical results are shown in Table XXII for film 44 (desorption at 0°0). In fig.17 the increase in Hg count rate with time, is shown, in comparison with the tritium count and with the total volume of gas desorbed. It will be seen, as Campbell and Thomson (16) also observed, that the desorption of tritium and of hydrogen was directly proportional to the uptake of mercury on the film for the greater part of the displacement, and only very close to the completion of the reaction did the rate fall. The mercury count increased linearly even after hydrogen displacement ceased, as was observed by Campbell and Thomson (16). A 25$ difference in displacement rate between hydrogen and tritium is also apparent from the graph, tritium being desorbed more slowly than hydrogen.
An induction period will be observed at the beginning of the experiment when, although mercury was arriving at the surface, no desorption of hydrogen was occurring. The length of this period varied,being greater, as in this case, at 0°C than at 25°C. It also depended on the surface coverage of the film; for instance, desorption from film 2 which was only 32$ saturated, did not commence for 23 hours and from the argon film, 27, with a 74$ coverage, a 6 hour induction period was obtained. This phenomenon was also observed by Campbell and Thomson (16) but their calculations
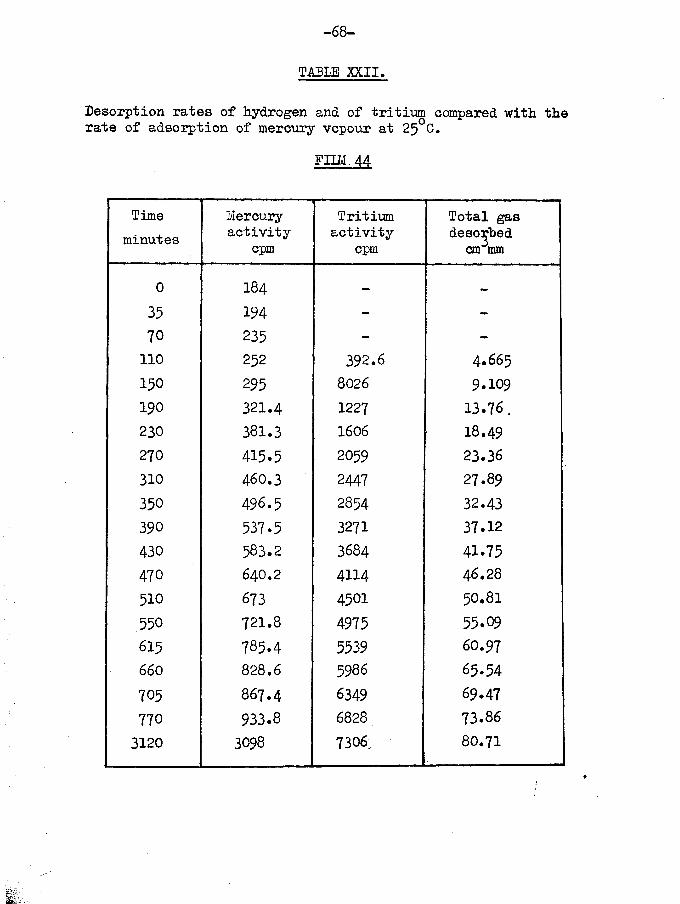
-68-
TABLE XXII.
Desorption rates of hydrogen and of tritium compared with the rate of adsorption of mercury vcpour at 25°C.
FIIM.44
Timeminutes
Mercuryactivity
cpmTritiumactivity
cpmTotal gas desorbed
cm mm
0 I84 — _
35 194 - -70 235 - -
110 252 392.6 4.665
150 295 8026 9.109190 321.4 1227 13.76.230 381.3 1606 18.49270 415.5 2059 23.36310 460.3 2447 27.89350 496.5 2854 32.43390 537.5 3271 37.12430 583.2 3684 41.75470 640.2 4114 46.28510 673 4501 50.81550 721.8 4975 55.09615 785.4 5539 60.97660 828.6 5986 65.54705 867.4 6349 69.47770 933.8 6828 73.863120 3098 73061 80.71

FIG
. I 8
I
cn
co
CM
CM — — ^ a w ao» ® ^ 3 m ^01 * urd’o AilAl lJV A003IIBH
CO CM
TRIT
IUM
ACTI
VITY
c.p
.m.
, 10
0

-69-
showed that the amount of Hg adsorbed during this time was in
sufficient to fill all the surface sites left vacant by hydrogen. Desorption for saturated films began immediately, although the maximum desorption rate was not attained during the first hour.
In the majority of films, the desorption process was
interrupted overnight, and it was observed that, although the de*»sorption rate fell to a low value soon after the mercury sourcehad been cooled in liquid nitrogen, complete cessation of the processdid not occur for some time. In fact, a volume of hydrogen of the
3order of 5 ® mm was usually obtained overnight by a slow, continued desorption process. After such an interruption the count rate from the surface had usually fallen, indicating that mercury vapour from the immediate vicinity of the surface had distilled back on cooling the source to liquid nitrogen temperatures.
In Table XXIII are the results of such an experiment involving two interruptions to the desorption process, and in fig,l$ the desorbed tritium activity is plotted against the mercury count rate from the film, (film 35)* The steps, obtained on the graph are the composite results of firstly, the tritium desorbed overnight, and, secondly, the reduction in count rate from the adsorbed mercury.It may be observed that the plotted points immediately above each step are not in line with the other values. The reason for this is that, as at the commencement of the desorption process, an induction period was obtained on re-admittingthe mercury vapour, during which the adsorption rate of the latter was greater than the desorption
rate of tritium.
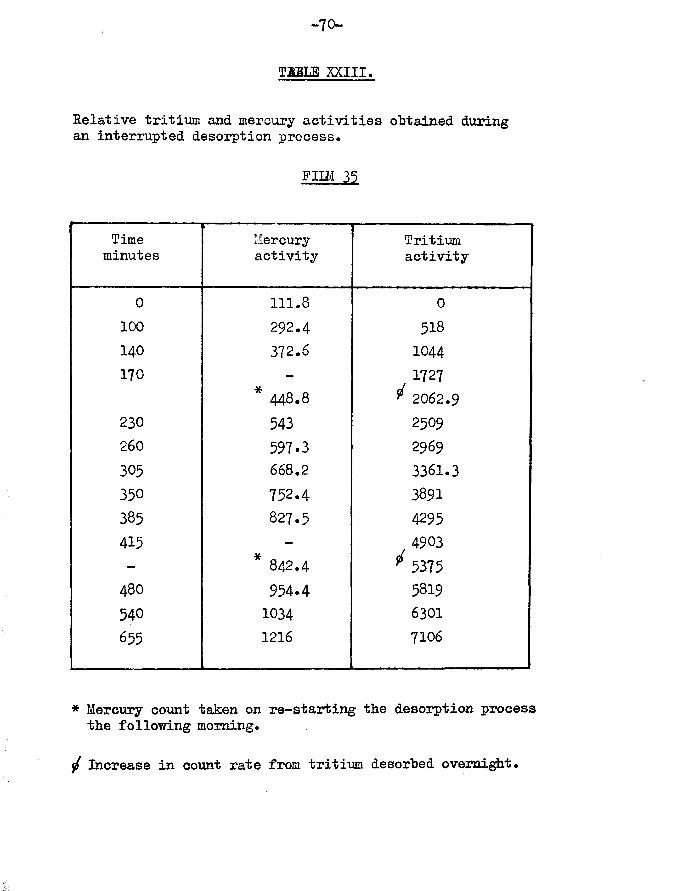
-70-
T3BLE XXIII.
Relative tritium and mercury activities obtained during an interrupted desorption process.
F M 35
Timeminutes
Mercuryactivity
Tritiumactivity
0 111.8 0
100 292.4 518
140 372.6 IO44
170
* 448.81727
^ 2062.9
230 543 2509
260 597.3 2969305 668.2 3361.3350 752.4 3891385 827.5 4295415 - 4903
^ 5375- * 842.4480 954.4 5819540 1034 6301
655 1216 7106
* Mercury count taken on re-starting the desorption process the following morning.
Increase in count rate from tritium desorbed overnight.
-71-
Comparison of desorption rates is unsatisfactory in view of the fact that most desorption experiments were interrupted once or twice "because of the length of time required and, since, as explained previously, re-starting the displacement involved an induction period. However, desorptions from films 39> an argon evaporated film, and 44> from which displacement was effected at 0°C, were continuous until completion. The values obtained
3 3were 7.5 an mm per hour and 6.3 cm mm per hour respectively. Therate from film 44 was thus slightly lower despite the fact thatthe catalyst vessel was at 0°C and the ambient temperature of themercury source was 21-22°C, which would promote the distillationof mercury vapour on to the film.
3»7. RETEHTIOH OF HYDROGEN AND OF TRITIUM BY NICKEL FIIMS.
Retention figures for hydrogen and tritium are collected in Table XXIV, from which’the following observations may be made.
Saturated vacuum deposited films retained 11-14$ of the total volume of gas adsorbed but the value for tritium retention was 25$. The film from which desorption was carried out at 0°C showed the same retention figure. For the vacuum film of 32$ coverage, a greater value was obtained for both total gas retention and tritium retention. If however, these values were related to the total adsorptive capacity of the film, aw determined by the reference curves in fig.2, the retention fell to values which differ from those of saturated films by a factor

-72-
TABLE XXIV.
FilmNo.
Type of
Film ‘Coverage
100
/b Retention Total Tritium
$ of total adsorptive capacity
Total Tritium
’ 2 Vac. 100 — — 14.22 25.9312 Vac. 100 - - 7-5 24.8816 Vac. 100 - - 11.58 26.09
43 Vac. 100 - - 12.98 23.49
31Vac. Des. at
0°C100 - - 13.15 25.62
49 Argon 100 - - 6.52 20.13
3 Vac. 32.21 18 37.87 5.79 12.2
14 Vac. 87-47 15.61 29.34 10.27 22
25 V ac. - 5.28 34.41 - -27 Vac. 74.64 16.42 37.24 12.58 27.81
28 Vac. 86.74 8.07 23.77 11.19 20.5935 Vac. 90.63 14.11 26.08 12.78 23.61
30 Argon°2
- - - 10.66 27.91
46 Vac.°2
100 - - 11.73 38.65
36 Vac.sint. 100 20.02 42.23 12.28 25.96
40 Vac.sint.
•6-
100 19.02 49.8 IO.85 28.43
-73-
of 2* Campbell and Thomson (16) have observed a similar relationship with argon evaporated films.
It is difficult to draw conclusions from the results of films with greater than 'JOp coverage, since the retention figures were similar. Prom the majority, however, slightly lower values were obtained than for saturated films. Prom fig,2 it can be seen that the weight ratio of argon evaporated to vacuum films for equal adsorptive capacities was 3*4 and the tritium retention ratios were also of this order. Total retention by those films which had pre-adsorbed a low percentage of oxygen, was
surprising in that although it was similar to that for "clean" films, a greater percentage of tritium was not recovered. Apparently the oxygen trapping process observed by Campbell and Thomson (16) was specified for tritium.
Sintered films showed enhanced retention, but referring the observed values to their theoretical adsorptive capacities at 25°C gave figures comparable with those of unsintered films*
It may, therefore, be concluded that retention of both hydrogen and tritium is dependent on film weight and not on surface area. An isotope effect is apparent in the case of both "clean” and oxygenated films, tritium being preferentially re
tained in each case.Abnormally low total retention results were probably due
to slight leakage into the apparatus, since in many cases, the desorption process was carried out over a three day period*
CHAPTER 4
ELECTRON MICROSCOPE STUDIES OP EVAPORATED NICKEL _____________________FIIMS._____________________
Electron microscope and diffraction studies have previously- been carried out, notably by Beeck (13) and by Sachtler and Dorgelo (21).
Beeck1s electron diffraction experiments seemed to indicate that film evaporation in an atmosphere of argon produced orientation of the crystal planes in relation to the substrate, this orientation being reflected in the exposed faces of the crystallites. He attributed the increased catalytic activity of the films, as compared with vacuum films, to the presence of these orientated surface planes.
Sachtler and Dorgelo, however, showed that orientation with respect to the substrate did not pre-suppose orientation of the exposed planes, and they were able to demonstrate that complete 110 orientation parallel to the substrate could be obtained by film evaporation under suitable high vacuum conditions* The exposed crystal faces, however, as will be described in chapter 5> were the stable 110 and 111 faces. They also observed that films evaporated in an argon atmosphere consisted of an array of smaller crystallites, and exhibited a greater degree of disorder than films evaporated under high vacuum conditions. Micrographs of the surfaces of films of various thicknesses were published to demon
strate that, as the film thickness increased, the size of exposed

- 15-
no faces, parallel to the substrate, decreased and eventually- disappeared. They attributed this phenomenon to the fact that, because of geometric limitations imposed by neighbouring crystallites, the maximum rate of crystal growth would be at right angles to the surface, i.e. in the 110 direction, resulting in the eventual annihilation of the 110 face by the bordering 111 and 100 faces. They also published photographs to show the effects of depositing a film at a low temperature and subsequently allowing it to warm up to room temperature. A re-crystallisation occurred which produced a more uniform surface with crystallites of a larger size.
More recent photographs published by Anderson and Baker (20) demonstrated the surface smoothing effect which occurred on sintering.
Since the conditions of film preparation would seem to be of importance in the degree of orientation produced, it was decided that some indication of plane orientation and surface appearance of the films used in the present work would be of interest. With the willing co-operation of Dr. R. Thirsk and Mr. E.H. Boult, of King's College, Newcastle-upon-Tyne, certain of the films used have been, and are in process of being, studied by electron micro
scope and diffraction techniques.
4*1. FIRST RESULTS.The first film studied was a vacuum evaporated film prepared
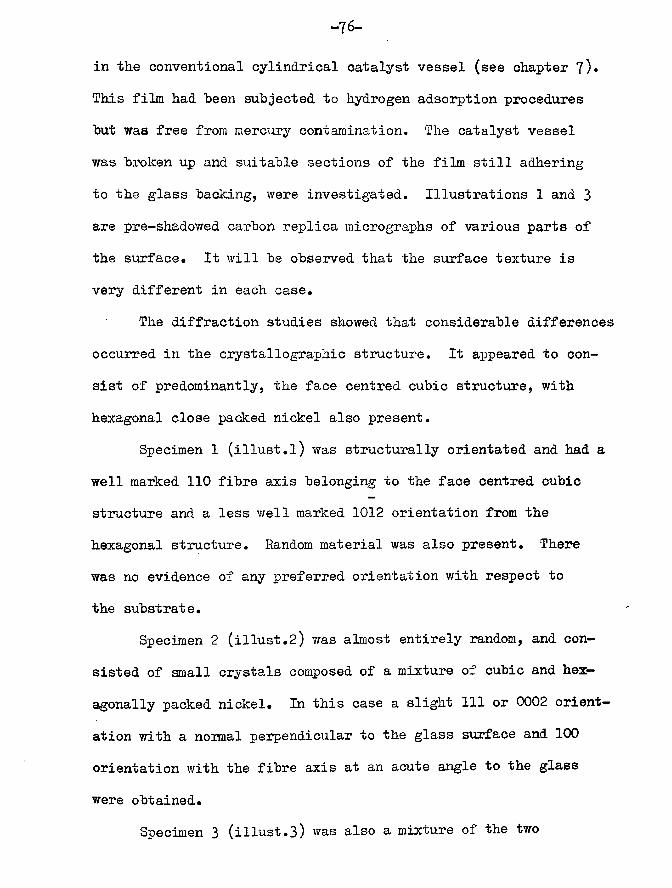
-76-
in the conventional cylindrical catalyst vessel (see chapter 7)* This film had been subjected to hydrogen adsorption procedures but was free from mercury contamination. The catalyst vessel was broken up and suitable sections of the film still adhering to the glass backing, were investigated. Illustrations 1 and 3 are pre-shadowed carbon replica micrographs of various parts of the surface. It will be observed that the surface texture is very different in each case.
The diffraction studies showed that considerable differences occurred in the crystallographic structure. It appeared to consist of predominantly, the face centred cubic structure, with hexagonal close packed nickel also present.
Specimen 1 (illust.l) was structurally orientated and had a well marked 110 fibre axis belonging to the face centred cubic structure and a less well marked 1012 orientation from the hexagonal structure. Random material was also present. There was no evidence of any preferred orientation with respect to
the substrate.Specimen 2 (illust.2) was almost entirely random, and con
sisted of small crystals composed of a mixture of cubic and hex— agonally packed nickel. In this case a slight 111 or 0002 orientation with a nomal perpendicular to the glass surface and 100 orientation with the fibre axis at an acute angle to the glass
were obtained.Specimen 3 (illust.3) was also a mixture of the two

-77-
modifications and showed a degree of 100 one dimensional orientation, a very slight 110 and a trace of 1012.
In each case the description was uniform over the samples which were about 1x3 cm.
The random nature of the film was attributed by Dr.Thirsk to the effect of temperature, dependent on the position of the various areas in relation to the hot filament during evaporation.The rate and angle at which the nickel was deposited was also important. Since the catalyst vessel had been broken up before the importance of these considerations had been appreciated, it was impossible to relate the fractions studied to their original positions relative to the filament.
It was suggested that a suitably scribed flat strip of glass be included in the catalyst vessel during the evaporation process, so that short lengths could subsequently be broken off for study and their relative positions noted. This idea was discarded because of the difficulty in providing adequate cooling of the strip during evaporation, since the film deposited thereon probably would not
have been typical.
4*2. MTEB EXPERIMENTS.
It was desirable from the point of view of the diffraction experiments to provide a flat, rather than a curved, backing for the films, since a curved backing limited the direction in which the diffraction patterns could be taken to that parallel with

-78-
tlie filament. This prevented the search for tilts in the fibre axis arising from the different directions in which the nickel reached the glass surface. Accordingly, a series of catalyst
vessels was prepared, one side of each being flattened along its length. The procedure adopted was to heat one side of the Pyrex tubing with a large oxygen glass blowing torch flame, so that the greatest possible length of the glass could be softened. A carbon reamer was then used to flatten the softened area whilst, at the same time, the glass was pushed flat against the reamer by blowing into the tube. With catalyst vessels of the size used, this flattening process was completed in two steps, since it was not possible to heat a sufficient length of tubing to enable the process to be accomplished in one operation. In this way reasonably flat interior surfaces, at least 1 can in width, could be produced.
Four types of film were prepared in these vessels.
(1) A heavy vacuum deposited film.(2) An argon evaporated film.(3) A vacuum film from which hydrogen displacement had
been effected by mercury vapour.(4) A vacuum film sintered at 100°C for one hour.These films were each saturated with hydrogen in the usual
way. The flat portion of each vessel was cut out using a fibre mounted abrasive wheel, and the position of the removed strip relative to the filament was notedo Each of the hairpin-shaped filaments had previously been arranged with its short axis parallel

-79-
with the surface, although the distance from the surface along its long axis was greater at its free end than at its supported end.
It was decided to study a sintered film because the hexagonal fonn of nickel shown to be present in the early experiment is stable above 353°C, with a difference in free energy of
formation with the cubic form of about 80 calories. Sintering in such a film, it was thought, might reduce the fraction of this metastable form by allowing equilibration of the two forms to be achieved more rapidly.
The diffraction results of these films were unfortunately not available at the time of writing this thesis, but micrographs of the surface of the argon deposited film are reproduced in illustrations 4-6. It will be observed that again a considerable variation in structure was obtained. In this case the position of the specimens relative to the filament are available.
Specimen(1) This was from the area of the film adjacent to the
supported ends of the filament. It was thus closer to the filament than the remaining specimens.
(2) This part of the film corresponded to a position half-way along the filament and hence was from one of the thickest areas. The distance from the film was intermediate between those of specimens 1 and 3*
(3) This was taken from the region of the free end of

-80-
(3) of the filament and probably corresponded to an area where the film thickness was progressively
decreasing towards the edge of the evaporation area. This specimen was furthest away from the filament•
The film filament distance varied from about 6 to 7 nun in the region of specimen 1 and 11 to 12 mm in that of specimen 3.

ILLUSTRATION I
Specimen shadowed at cot 3. Magnification x 15,000

ILLUSTRATION II
Specimen shadowed at cot 3 Magnification y 15,000
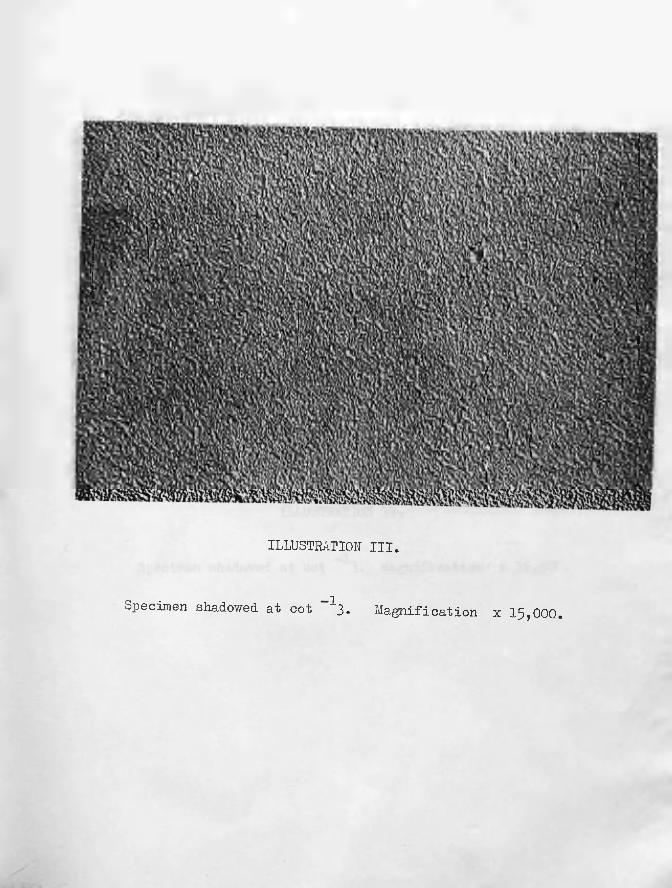
ILLUSTRATION III.
Specimen shadowed at cot ^3. Magnification x 15,000.

ILLUSTRATION IV.
Specimen shadowed at cot 3* Magnification x 16,500.

%. -fy .£
^.'•^ v * S
ILLUSTRATION V.
Shadowed at 45°• Magnification x 16,5°0.

ILLUSTRATION VI.
Specimen shadowed at cot ^3* Magnification x 16,500.

-81-
CHAPTER 5.
DISCUSSION OF RESUHPS.
The experimental results may he summarised as follows.
1# The specific activity of the desorbed gas varies in a periodic manner.
2. Five periods are observed for vacuum evaporated nickel films.3. Sintering reduces the surface area but not the number of periods.4* The presence of oxygen disrupts the regular pattern of the
periods.5. Desorption at lower temperatures increases the number of peaks
and increases the height of the later peaks.6. Argon evaporated films display seven such peaks.
7. Tritium is displaced by mercury vapour at a slower rate thanhydrogen.
8. Exchange occurs between the gas and the adsorbed phase, enriching the surface with tritium.
9. This exchange reaction is inhibited by the presence of mercuryvapour.
10. 24$ of the adsorbed tritium could not be recovered by displacement with mercury vapour in the case of vacuum evaporatedfilms.
11. The percentage of tritium retained by grgon evaporated filmswas 20$ and for films sintered at 100 C, 40$•
12. The total amount of hydrogen retained is proportional to thefilm weight and not to the volume of gas adsorbed.

-82-
HflTRQDUCTION.
Exchange occurs between a gas phase species and an adsorbed species, for instance, it is observed that if deuterium is preadsorbed on a metal film and hydrogen is admitted to the gas phase, an equilibrium mixture of hydrogen and deuterium in the gas phase is rapidly obtained. Equilibration is the process involved when two molecular gas phase species are brought into contact, with or without the presence of a catalyst, and mutual interchange of atoms occurs between the species, e.g. for the
hydrogen-deuterium system the equilibration process isH2 + D2 = 2 HD
The exchange process, however, involves equilibration of the resulting gas phase mixture since the mechanism proposed for the
two processes is the same.The first of these is the Bonhoeffer-Farkas mechanism (22)
which will be explained by reference to the hydrogen-deuterium system. It may be illustrated thus:
H2 + D 2 + M = MH + MD = H D + M .
where M is a surface metal atom. The process thus entails anadsorption—desorption process involving both species, whether one is pre-adsorbed or whether both are required to adsorb simul
taneously.The second mechanism was proposed by Rideal (23) and can
be represented thusH2 + D = H + HD
-83-
The process may proceed via a triatomic complex on onesite, involving a molecule in a van der Waals layer e.g.
D2 + MH = MH(D2) = MD + HDor the transition state may require simultaneously the presenceof an occupied site and at least one empty site.
Calculations of the kinetics of the para-hydrogen conversion (24) lead to the expectation of a zero order reaction for the first mechanism and a first order reaction for the second.
5,1. REASONS FOR THE OBSERVED VARIATION OF THE SPECIFIC ACTIVITYOF THE DESORBED GAS.
The specific activity of the desorbed fractions varied periodically in a regular pattern, within each period reaching a maximum value and then declining. There were five such periods in the case of vacuum evaporated films. This behaviour can be explained by postulating five different modes of hydrogen adsorption, coupled with an isotope effect in the bonding of hydrogen and tritium to the surface. The areas of the surface repponsible for these different bond types, were apparently of equal size and all of them adsorbed hydrogen and tritium in the same ratio, since a similar variation in specific activity was repeated in each case.The bonds formed by these different parts of the surface must, of course, be energetically different, but this difference must be of such magnitude that a considerable degree of separation occurs between successive desorption stages. If the free energy of adsorption of hydrogen and tritium was substantially uniform
over all the exposed metal faces overlapping would have occurred,

-84-
making the detection of the different peaks more difficult or even impossible. There is observed a fall in heat of adsorption
of the order of 20 K cals./Mole, with increasing coverage, for
hydrogen on evaporated nickel films (17) and for hydrogen on rigorously reduced nickel-on-silica (25). This may be attributed to surface heterogeneity and then the difference in the heat of desorption between successive areas must be of the order of 4 K cals./mole. This value is probably a fair estimate, since as Gundry and Tompkins (26) point out, attempted explanations for the fall in heat of adsorption with increasing coverage based on physical rather than chemical reasons, are inadequate to explain the high value obtained. Beeck (17) had suggested that interaction between adsorbed atoms was a sufficient explanation for this phenomenon but, for instance, the mutual repulsion of parallel orientated dipoles would give a decrease of only 2 K cals./mole (26). A demonstration of this was provided by Gomer (27), by observing separately, the diffusion of oxygen and hydrogen on a tungsten field emission tip. His results showed that at comparatively high temperatures, the sharply defined diffusion boundary ceased to move if a constant supply of adsorb— ate was not maintained. This would indicate that interaction
between adsorbed atoms is small.Be Boer (3) is of the belief that the effect can be explained
by the variation of the work function of the metal caused by removal of electrons to the adsorbed atoms. This would make

-85-subsequent bond formation more difficult, but equations proposed
by Boudart (28) and Mignolet (29) for the change in work function with increasing coverage give very low values for the decrease in heat of desorption, since these effects and the dipole effects stem from the same source. Moreover, now that accurate values for the surface potentials of the hydrogen-nieke1 system are available (30), it can be shown that these calculated values must fall short of the experimental values by a factor of 4 o r 5* Eley (3l)>Schwab (32), and Mignolet (33) have suggested that the fall in heat of adsorption may be due to the withdrawal of electrons from increasingly lower energy levels in the metal as coverage increases, but as the number of bonds on the surface is minute compared with the number of conduction electrons in the metal, this explanation also seems inadequate. Attempts to surmount this difficulty by Temkin (34)> who suggested a surface electron gas separate from the three dimensional conduction electrons, are also difficult
to accept.There are reasons to believe that the increase in concen
tration of adsorbate may affect the type of bond formed with later adsorbed molecules, as suggested by Dowden (35)* Such evidence comes from infra red studies of adsorbed molecules (36) where, for instance, carbon monoxide as been found to be singly bonded to two metal atoms at low coverages, but doubly bonded to a single metal atom at higher coverages. Even so, such an explanation of the variation in the number of bonds to hydrogen atoms would not
-86-
explain the different '’areas11 observed in the present work. In
any case Selwood (37) has recently shown that the magnetic susceptibility of nickel falls linearly with coverage, as a greater number of electron spins become paired, implying that no change
in bond type occurs, even up to very high pressures of hydrogen. Gundry and Tompkins (15) postulate of an intermediate "initial" state which at higher coverages requires an activation energy to transfer hydrogen to the "final" adsorbed state, is also inapplicable. In fact it appears that the fractions of the surface corresponding to the peak areas are self-contained and can be regarded as quite separate parts of the surface, to which, individually, certain of the above arguments might apply. Hence, although the fall in heat of adsorption with increasing coverage might be explained within each fraction to adsorbate-adsorbate interaction, or adsorbate-surface interaction, the overall fall must be explained by a priori heterogeneity of the surface. It would seem that a linear reduction in heat of adsorption with coverage would be expected from these results (cf curves of Beeck (17) and Schuit (25)), hence the rapid fall obtained by Fryling (38) on nickel, and Frankenberg (39) °n tungsten, would indeed seem to be a result of surface contamination as Kwan (4 )
and Beeck (17)> respectively, suggest.
5.2. REASONS FOR HETEROGENEITY.
Possible reasons for the observed phenomenon are twofold

-87-
First ly, the physical structure of the surface must he considered. According to de Boer (3), surface irregularities caused by cracks and fissures have a far greater influence on the bonds of low energy foimed in physical adsorption than those formed in chemi- sorption. Hence it would appear that difference in chemisorption bond strength caused by such features would be inadequate to explain the observed effect. Perhaps an instance of this is that the infra red spectrum bands of adsorbed ppecies are fairly broad, which can be attributed among other reasons, to slight differences in bonding energies because of non-uniformity of the surface. Yet, where greater differences in bonding strength apparently exist, as in the case of carbon monoxide chemisorbed on palladium, separate absorption peaks are obtained (36). Results of the present work show that the number of peaks, and their general areas, are reproducible, and it is difficult to believe that surface irregularities of the type described could be similarly reproduced
in every case.A much more likely explanation is that the various exposed
crystal faces of nickel have different free energy of adsorption for hydrogen. It has beBn established that the woifc function is different for the various crystallographic faces of metals (30), and although these differences are small, since the bonding electrons for hydrogen adsorption are derived from the metal, a small difference may be important. The configuration of the
binding sites is also important as can be observed in field

-88-
emission work (40)* For instance, hydrogen is more strongly bonded on the 111 and 100 faces of tungsten than on the 110 face. Oxygen, because of its larger size, is even more sensitive to
variations in surface atom positions, diffusion from the 110 face of tungsten involving a higher activation energy than from the 100 face. Diffusion of hydrogen and oxygen on tungsten is also observed to take place to preferred planes along well defined paths of low activation energy of diffusion. It is time that nickel does not shov; the same sharp boundary diffusion effects as tungsten, since the surfaces of face centred cubic metals are atomically smoother than the more open body centred cubic structure of tungsten. It must be pointed out, however, that the effect observed in the present work is a very small one, and
as will be discussed in section 4> 'the desorption technique would, by its nature, be sensitive to small differences in bonding
energyoBeeck (17) maintained that the heat of adsorption was
independent of orientation; this he deduced from experiments with films evaporated in vacuum and in an atmosphere of argon; but since Sachtler and Dorgelo (21) have shown that orientation with respect to substrate does not necessarily mean orientation of the exposed crystal planes, Beeck1s argument is not valid.
The results of the present work would seem to indicate that crystal faces are responsible for the observed effects. Sherman and Eyring (41) proposed, from theoretical considerations,
-89-
that the energy of adsorption of hydrogen on carbon depended on
the lattice spacing, and similar calculations have been made by Okamoto (42) for the hydrogen-nieke 1 system. Gwathmey (43) has shown, from single crystal studies, that catalytic activity is dependent on crystal face, and he points out that many factors are involved, such as the surface arrangement of Atoms, and the number and arrangement of those below the surface. A further factor is the number of surface steps and kinks, which are also dependent on crystal orientation. These considerations are important in view of suggestions (44) that chemisorbed hydrogen will take up the position of greatest symmetry and highest co-ordination with respect to the surface atoms, and will lie within the surface, bonded to several neighbouring atoms.
If the results from the sintered films are considered, it may be seen that the overall reduction in surface area applied more or less equally to each of the surface fractions. The results of Sachtler and Dorgelo (2l) show that by depositing a film at a low temperature and allowing it to warm up to room temperature, a re-crystallisation process occurs which provides larger crystallites. Electron micrographs from Anderson and Baker's work (20) show that on sintering a smoothing of the surface occurs. It would seem that the effect of sintering is to reduce the surface area by the provision of fewer but larger crystallites. Hence the relative number of crystal faces should not
vary, provided only the preferred stable faces, as will be

-90-
discussed later, were originally present. The reduction in surface area in such cases should apply equally to the contribution from each face. If, however, surface heterogeneity arose because of crystal defects or other topographical irregularities, it is unlikely that sintering would reduce the contribution of each type to the same degree. As stated previously, it is also difficult to believe that such defects could be reproduced to the same relative extent from film to film.
The electron microscope photographs in chapter 5 showed that the surface texture of our films varied considerably, and this was apparently dependent on the relative surfaee to filament distance. Although care was taken to align the filament in the catalyst vessel, variations could, none the less, occur. However, as Sachtler (2l) points out, only a relatively few crystal faces of the surface may be expected in such a system, provided the size of the crystallites is within the limits discussed later. Thus the size of crystallite could be unimportant. From this point of view, the supposition that the crystal face is the important influence in the observed heterogeneity is acceptable, since other surface irregularities would be expected to vary with crystal size. Also, since the adsorptive capacity of these films was proportional to their weights, it would seem that the crystal faces only are important in adsorption and the number of large cracks and fissures small or non-existent.
The theory of Kossel (45), Stranski (46) and Xaischew (47)

shewed that the rate of growth of a given crystal face was dependent on the number and distance of neighbouring atoms which a newly adsorbed atom found on the surface. Experimental evidence showed that in fact the immediate neighbours had a greater influence than the next nearest, and so on. Hence for the face eentred nickel structure, since the 111 and 100 faces provided fewer neighbours for a newly adsorbed atom than the 110 face, the latter would grow at a more rapid rate than the adjacent 111 and 100 faces, resulting in its eventual disappearance. Sachtler and Dorgelo (21) showed that the direction of maximum growth of the crystal would define the orientation, and for nickel, this was in the 110 direction, at right angles to the substrate, since only in this direction was growth unimpeded by neighbouring crystallites. They pointed out that, provided the film thickness was sufficient, only the stable 111 and 100 faces would be presented to the surface. It would then seem reasonable to attribute the reproducibility in number and size of the observed adsorption areas to this reason. A further point in favour of this argument was provided by Sachtler, who found that films evaporated in an argon atmosphere were composed of much smaller crystallites, and he suggested that planes other than the stable 111 or 100 were exposed, because the equilibration process was only complete when dhe crystallites were above a certain minimum size. Small crystallites may then expose a greater number of planes than is normal with larger crystallites. Sachtler also showed that a

greater degree of disorder was always observed in the case of films evaporated in an inert gas atmosphere. If the observed heterogeneity could be attributed to exposed crystal faces , argon evaporated films should exhibit an increased number of peaks. This was observed since it will be remembered that the argon films displayed two more peaks than the vacuum films.Jive of the seven peaks may be those in common with vacuum evaporated films, the remaining two being explained by the presence of faces not normally found at the surface# It would seem likely, as Sachtler claimed, that the presence of an inert gas during evaporation does not produce orientation of the exposed faces, and in fact may reduce the overall crystal orientation.
Argon films have agreater adsorptive capacity than vacuum evaporated films, and this may be explained by the fact that smaller crystallites have a greater surface area. Perhaps, also, the structure is more porous because of inert gas occluded during the evaporation, and subsequently pumped away. A reduced sintering effect is, of course, also possible because of the heat
cfiissipated by the inert gas.It is interesting to note that the heavier films studied,
these of weight about 40 mg, displayed several small additional peaks at the beginning of the desorption process. The reason for this is not immediately obvious, but Beeck (13) observed that the thicker -vacuum evaporated films showed a slight ly increased catalytic activity which he attributed to a degree of orientation.
-93-
Since the difference between vacuum films and inert gas films is apparently one of crystal size, it would seem that Beeck*s results, and the present results, indicate the presence of smaller crystallites, perhaps formed by nucleation on the surfaces of the first deposited crystallites when they had attained a certain size.
That crystal faces may give rise to heterogeneity was demonstrated by the work of Eischens, Francis and Pliskin (48), who studied the infra red spectra of carbon monoxide adsorbed on supported palladium. The spectra produced showed bands which could be attributed to the carbon atoms of the carbon monoxide being bonded to two palladium atoms. The number of bands increased with the amount of carbon monoxide on the surface. Five such bands were produced and the amount of overlapping between each was small and, in fact, non-existent in some cases. The surface coverages represented by the appearance of the bands were 20$, 45$, 65$, 85$ and 100$. The reverse phenomena occurred when the gas was pumped off. This would indicate that the surface is divided into five parts which differ from each other but which are relatively homogeneous within themselves. Eischens considered it possible that the portions may be identified as the major
crystal faces.Contamination of the surface has been claimed as the cause
of apparent heterogeneity, and Kwan (4) was of the opinion that the large observed falls in heat of adsorption were attributable to inadequately reduced or contaminated surfaces. The results of our

-94-
oxygen adsorption experiments demonstrated clearly, however, that heterogeneity of the type obtained was not induced by oxygen contamination. Reference to the desorption graphs of these experiments, when oxygen was present, shows that a different desorption pattern is obtained, with none of the regularity of peak
height or area demonstrated by "clean" films. A possible interpretation of the graphs is that, by comparison with tungsten, oxygen is preferentially adsorbed on certain crystal faces or, at least, on certain suitable sites on particular faces. According
to Campbell and Thomson (49)> the fact that hydrogen retention on oxygen contaminated films is increased, can be explained by the presence of positively charged hydrogen atoms trapped amongst the negatively charged adsorbed oxygen atoms (see also Tompkins (50)). These hydrogen atoms cannot be displaced by mercury vapour.Evidence for the presence of positively charged hydrogen stems fromconductivity and photoelectric emissivity experiments. Sachtler
—8(5l) found that for films prepared at 10*" mm, a negative surface potential for hydrogen was obtained, the conductivity falling when hydrogen was admitted. With films prepared at 10 ^mm an increase of both conductivity and photoelectric emissivity was obtained, indicating the presence of positively charged hydrogen. Oda and Arata (52) concluded that hydrogen would adsorb on bare nickel sites rather than on adsorbed oxygen, and that hydrogen sorption
partially oxygenated films raised, and then lowered, the electrical resistance, as if some of the hydrogen was positively

-95-
charged. Farnsworth (53) > by electron diffraction studies, found that surface nickel hydroxide was not formed as Roberts and Sykes
(54) Rad suggested, unless hydrogen was pre-adsorbed, and Campbell and Thomson (49) found no traces of tritiated water in the desorbed phase.
If it is accepted that a certain percentage of hydrogen is trapped between oxygen atoms, and if oxygen in low concentrations is adsorbed only at certain sites, then part of the hydrogen adsorbing near these sites on particular faces may be impossible to displace. This would reduce the volume, and reduce also the specific activity of the desorbed fractions from an oxygenated face for it was observed that tritium retention was greater on films partially covered with oxygen. (The amount of tritiated hydrogen adsorbed on an oxygenated film is, incidentally, comparable with that on a "clean" film).
It is also possible that the hydrogen to nickel bond energy distribution over the surface has been affected by the oxygen. If each oxygen atom influences the bonding to the hydrogen atoms in the vicinity, it is possible that the relatively low bond energy differences at each face may be submerged, so that a certain proportion of the hydrogen atoms over the complete surface has bonds of equivalent strength. The high peaks on the graph, which are of low » area, may be attributed to such hydrogen desorbing, when the required stage in the desorption has been attained. As de Boer (3) points out, an increased range of small desorption energy differences may be induced by the proximity of the adsorbed oxygen, with
-96-
its negative dipole.The shape of the desorption curve when oxygen is present at
low concentrations, would seem to indicate that, as Campbell and Thomson (49) observed, the surfaces of the nickel films prepared
by the method described, are substantially free from Contamination.In summary, the conclusions from this part of the work are
that the surfaces of evaporated nickel films are heterogeneous,
this heterogeneity arising from the different bond strengths between hydrogen and between tritium and the various exposed crystal
notfaces. Contamination with oxygen could^be the explanation of the peaks in the desorption curve.
5.3. HYDROGEN AND TRITIUM RETENTION STUDIES.
Campbell and Thomson (16) found that 7$ of the adsorbed tritium could not be displaced by mercury vapour from the surface of argon evaporated films when the initial surface covering with tritiated hydrogen was less than niea-Bs of stochastic calculationsthey showed that if it was assumed that a neighbour on an adjacent site was a prerequisite for desorption, then 7$ of the hydrogen atoms would be isolated on a surface consisting of a two dimensional, rectangular lattice. They also found that, if the film was initially saturated, the tritium retention was higher and of the order of 15-16$. They suggested that the difference between the latter result and that for unsaturated films, might be accounted for by the slow sorption process discussed at length in the literature,(3,17).

-97-
In the present work, using vacuum evaporated films, similar
results for total hydrogen and tritium retention were observed.For a film less than 38$ saturated, the total retention of hydrogen as related to the adsorptive capacity of the film was 6$. Tritium retention was, however, twice this value. With saturated films, the volume of gas retained was usually 12-13$. If, as Campbell and Thomson suggest, the value at low coverage can be taken as the result of isolation trapping of the hydrogen atoms by mercury vapour, then for the films under review, the figure of 12$ for tritium shows that it was preferentially trapped by mercury vapour to an extent greater than can be accounted for by isolation. It is interesting to note that, by using a "circular linear11 model, representing say, the line of adsorption sites along the lower edge of a surface step, and if displacement of hydrogen was effected in a random manner, assuming that an adjacent hydrogen was necessary before desorption could occur, a figure of 12$ was obtained for the number of isolated atoms. Hence, although the overall retention was that of the rectangular lattice of the Campbell and Thomson model with some added retention, the 12$ retention of tritium could be explained also by a one dimensional desorption pattern. A possibility is that tritium atoms on each part of the surface preferentially migrate to sites which offer the maximum co-ordination with surface atoms. Such sites may be, as mentioned before, along the lower edge of a surface step or other such crystal irregularity.
It was also found in the present work that, at complete

coverage, the ratio of tritium retained to total gas retained was almost exactly double that of the low coverage film:. This ratio applies equally to the sintered films studied, the surface area of which had been reduced by nearly 40$* When the retained values are related to the theoretical adsorptive capacities for the sintered films, very similar values to those of normal films are obtained, which seems to indicate that the overall determining factor for retention is the film weight. This is borne out by results from argon films. The weight ratio for equal adsorptive capacities for argon and vacuum evaporated films is 3t4* For argon films the retained tritium was 20$ of the total adsorbed as against 24-25$ for vacuum films. This seems to be in reasonable agreement with a 3*4 weight ratio. If the volume retention due to mercury trapping is subtracted from the total retention, the percentage of gas trapped by this second weight determined process is obtained. For vacuum films this is 12$ for tritium and about 7$ for the total volume of hydrogen retained. If it is assumed that the proportion of gas trapped by mercury is constant, as it should be on any surface if a rectangular site trapping mechanism is applicable, values for this second type of trapping are 8$ and 14$ for argon and sintered films respectively, the value for the sintered film being referred to the adsorptive capacities of argon
films. Similar reference for vacuum films gives a value of 9$ which is similar to that observed for this effect by Campbell and Thomson. The value for the sintered films is not in reasonable

-99-
agreement with those from the other films, and, since the overall trapping effect was proportional to film weight, it would seem that more than a straightforward atom isolation process was involved.
There has heen much discussion in the literature of the reasons for the ’’slow sorption" process observed hy several workers, and a review of these observations is appropriate at this point, although no "slow sorption" as such, was observed in the present work. None the less, the results of the "slow sorption" experiments bear a resemblance to the retention effect herein observed.In his study of evaporated films, Beeck (IT) found that a slow uptake of hydrogen occurred after the initial fast desorption was complete. The volume of hydrogen adsorbed in this process was independent of the sintering temperature of the films, over the range 23 to 400°C, and was proportional to the film weight. He explained this phenomenon by suggesting that the slow uptake was penetration of hydrogen into the bulk of the metal to give a lattice solution. He concluded that the process was partly adsorption and
partly absorption.Trapnell (55) found similar results with tungsten films, but
Porter and Tompkins (56) found that, after sintering, the amount of hydrogen taken up by this slow process varied directly with the decrease in surface area, and they suggested that heterogeneity of the surface was a possible explanation. De Boer (3) however, maintained that this activated process was a naturalconsequence
of the decrease in the heat of adsorption, and he believed that

-100-
a de-sintering process might occur during adsorption, an activation energy being required to re-open capillary pores, de Boer thought this sintering process might have been involved
in Taylor's work (57 )> since the latter observed that an increase in temperature during such a slow adsorption process aaused rapid desorption, but that a slow re-adsorption then occurred.This has often been suggested as evidence for surface heterogeneity*
Baker, Jenkins and Rideal (58) used a photoelectric work function method to study evaporated films at high hydrogen coverages. Since, apparently, the nidee1-hydrogen dipole changed its sign when the slow sorption prooess started, they concluded that hydrogen atoms were being adsorbed below the surface of the film, perhaps in pores or other defects. A different opinion was advanced by Gundry and Tompkins (15)> who advocated that the slow sorption process was chemisorption. They postulated that the final chemisorbed state was attained via an intermediate state with a lower adsorption energy. Bowden (59) suggested that the initial state might be attributed to the formation of bonds involving the metallic d orbitals, and the final state, a dsp hybridised bond.
The present work is not in accord with these latter views. Firstly, the amount retained is, as Beeck observed, proportional to the film weight, whereas any pore diffusion theory would imply a surface area dependence, if, as Rideal states, adsorption also takes place in the pores. It is agreed that this process proceeds

-101-
via the initial adsorption process and probably concurrently
with it, at least beyond a certain minimum coverage* Even films which were between 80 $ and 90$ saturated, i.e. with no measurable residual pressure in the gas phase, showed a loss of tritiated hydrogen in this way* Gundry and Tompkins*, and Bowden's theory suggested an essential homogeneity of the surface* If this were so, no retention of hydrogen should be observed. The diffusion of tritium or hydrogen into sites inaccessible to mercury, such as in pores, would also seem to depend on surface area rather than on weight.
There has been evidence from physical measurements that two states of bonding are present. The anomalous results of Selwood's (60) magnetic susceptibility studies seemed to indicate that perhaps diffusion of hydrogen was occurring to preferred sites on smaller crystallites. These results have recently, however, been explained for a different reason (61). Suhrmann (62) observed that the resistance of a film fell initially sharply and then more slowly. This has recently been attributed to contamination of the surface, and results from films prepared under better vacuum conditions show a sharp and complete decrease in resistance on adsorption of hydrogen (51). It is possible that the retention of tritiated hydrogen observed in the present work is attributable to the presence of contaminants since tritium is preferentially retained by oxygen, an/3 is also reduced in concentration in the desorbed phase if a slight leak of air entered the catalyst vessel. It is difficult

-102-
to explain how such contamination could vary in proportion to the film weight and he independent of large changes in surface area.It would seem likely that a bulk diffusion mechanism was responsible.The effect applied equally to all areas of the surface, since the observed desorption peak heights were relatively constant. The exchange experiments at different desorption stages showed that the same gas phase specific activity was obtained, independent of the surface area uncontaminated by mercury vapour, indicatingthat the adsorbed phase activity was constant over the whole surface. It is known that high energy trapping sites occur near the 110 face in nickel (63), where the lattice is more loosely packed, but as these sites occupy only l$of the total number this explanation is inadequate.
Adsorbed hydrogen atoms have been considered to lie between the adsorbent atoms (ll), actually in the surface of the metal, and to diffuse because of their small size, not over the surface but between the surface atoms. It may be possible to propose an internal diffusion mechanism because of lattice faults or vacant
lattice sites.At all events, this kind of heterogeneity, should not be
confused with the observed surface heterogeneity described in the
previous section.
5.4. iraARQNS FOR THE FAILURE OF THE BIFFEJfflTIAL ISOTOPE METHOD.
Rideal and Sweet (64) calculated the molar entropy of adsorbed hydrogen at 25°C on evaporated nickel films at coverages varying from
-103-
1$ to complete coverage* Their calculations showed that as the
coverage increased above 4 a greater and greater fraction of the adsorbed hydrogen became mobile* At high coverages the value of the molar entropies calculated from the observed heats of adsorption of hydrogen approached values derived from Kemball's expression (65) for the molar entropy of a two dimensional gas of hydrogen atoms, each requiring an area of one nickel site at complete coverage. It would seem from this result that, on the films used, the adsorbed hydrogen would be mobile at high coverage. This is in accord with the field emission work of Gamer, Wortmann and Lundy (63) who observed surface diffusion of hydrogen on nickel points between 180° K and 240° K. From this study of hydrogen- deuterium exchange over nickel films and nickel-silioa respectively, Gundry (66) and Schuit (67) came to the conclusion that the adsorbed phase was immobile at least at the lowest temperature employed (77° K). They found that when one of the isotopes was pre-adsorbed on the surface, if the other was admitted to the catalyst vessel, an equilibration occurred by which a low concentration of the pre- adsorbed isotope was obtained in the gas phase. This indicated that only a very small part of the surface was active in the exchange process, which is involved in both the Bonhoeffer—Farkas and Rideal mechanisms for the catalytic equilibration of hydrogen and deuterium. If mobility of the adsorbate had been possible all of the adsorbed phase could have equilibrated with the gas phase via this small area. They came to this conclusion since they

-104-
both found that a very small part of the surface was active in
exchange at that temperature, since the concentration of the pre- adsorbed isotope found in the gas phase after exchange, was low, yet the gas phase always contained an equilibrium mixture of the
isotopes. The active part of the surface increased with temperature and at 295° K all of the adsorbed isotope equilibrated rapidly with the gas phase. As Gundry pointed out, however, it was not possible to specify from these experiments whether the increase in the activity with temperature could be attributed to greater areas becoming able to desorb, or to migration to the parts of the surface from which desorption could occur most easily. Schuit was of the opinion that, if the adsorbed hydrogen was mobile, it was because of an adsorption-readsorption mechanism or of mobility of the nickel atoms. This latter reason seems invalid in view of the fact that adsorbed hydrogen reduces the rate of sintering of the nickel catalyst, attributable, according to Anderson, to the fact that hydrogen atoms are co-ordinated to more than one nickel atom, the wesultant bonding reducing the mobility of the nickel atoms. The work of Anderson and Baker (20) is difficult to reconcile with that of Rideal, firstly because of the above observations and also because Anderson showed that no major change occurred in the rare gas—surface distance on "clean" and hydrogen—chemisorbed surfaces.H e suggested that the hydrogen atoms must then be buried in the metal surface.
If Rideal fs evidence that the hydrogen atoms are completely

-105-
mobile at high coverage is accepted, and that the strength of thehydrogen-metal bond is little affected by the relative position ofthe hydrogen atom to the surface atoms, then the differential isotopemethod must fail since equilibration of the isotopes will immediatelyoccur. The technique depends for its success on localisation ofbonding. This is perhaps why Schuit1 s study of the surface of anickel-silica catalyst produced results of apparent homogeneity (10),yet those of Kummer and Snraett (8), and of Eischens (9), using carbonmonoxide, were successful. Field emission studies (ll) have shownthat even at comparatively high temperatures carbon monoxide isessentially immobile. Recent studies of reduced nickel surfaces byHirota et al (68), using two samples of carbon dioxide, one of which
18was enriched in 0, showed that on desorbing the gas by raising the temperature, the first desorbed samples showed enrichment of the isotope adsorbed last. These authors obtained evidence that an amount of chemisorbed carbon dioxide corresponding to about one third of the surface, was strongly bonded as the temperature was raised successively from —J8°C to 0°C and to 19 C. Part of this carbon dioxide remained undesorbed even at 300 C. Since this was unlikely to occur because of induced heterogeneity, these workers concluded that the nickel surface was heterogeneous, .possibly because of differences in activity of the orystal faces. It would seem from these results that carbon dioxide on nickel is also
immobile.In the present work, Rideal1 s theory can explain the fact
-106-
that equilibration of the isotopes occurred over the entire
surface, since the experimental results demonstrated that the average specific activity of the desorbed gas was similar from beginning to end of the reaction, despite variations in the order
of admission or relative volumes of the isotopes. The question arises, as to the reason why, on desorption of this equilibrated adsorbate, a repeated variation of specific activity can arise.If the adsorbed gas were mobile during the displacement of tritiated hydrogen, the gas phase hydrogen should have the same activity throughout the entire process. During the adsorption process the choice of adsorption site by either hydrogen or tritium molecules, is likely to be a random process, equilibration or adjustment of site choice occurring, as Beeck (17) suggested, by surface migration. Hence it might be expected that each crystallite would adsorb tritiated hydrogen of similar specific activity and a situation would arise comparable to that of complete surface mobility. It is unlikely that different crystallites would display an overall difference in exposed faces which might give rise to effects similar to those noted, since Sachtler (21) has shown that a preponderance of the stable 111 and 110 faces are present in all
films, however prepared.The answer to this anomaly may be found in the results of
exchange experiments quoted in the last chapter. These showed that exchange between gas phase and adsorbed phase was inhibited by the presence of mercury vapour. Gundry (66) suggested that

-107-
mobility may be inhibited by the presence of surface contaminants, and the results of Roginskii and Keier's original work on reduced nickel may be explained also in this way, if it is assumed that unreduced oxide was present which prevented the complete mobility of the adsorbate and allowed the formation of localised bonds with the isotope fraction first adsorbed. The significant observation in the present work is that exchange occurred before and after exposure of the surface to mercury vapour, provided no gas phase mercury was present. Gundry (66) noted that mercury vapour rapidly inhibited the hydrogen-deuterium equilibration but he did not state whether this was chemisorbed mercury. A significant observation, however, was that nitrogen inhibits the reaction at 70° K. The reactivity of the surface could be restored, however, by allowing it to warm up to room temperature, and the original activity at 78° K was recovered if the nitrogen was then pumped away. Experiments carried out by Gundry, to establish whether hydrogen displaced nitrogen adsorbed on nickel, showed that this occurred, but the number of molecules of nitrogen displaced per molecule of hydrogen fell as the concentration of hydrogen increased, indicating that once the hydrogen coverage was significant, adsorption of nitrogen, i.e. on top of hydrogen, was occurring, and this reversible second layer adsorption inhibited the hydrogen—deuterium equilibration. Mignolet (69)
obtained surface potential measurements at 77 ^ mm,which showed that a very small concentration of hydrogen was

-108-
adsorbed on nickel with a positive surface potential, which he explained as second layer adsorbed H2+, stabilised by charge transfer* Gomer (70) also suggested evidence for this kind of adsorption on tungsten field emission tips, and more recent studies by Sachtler and Dorgelo (71) indicated that molecular hydrogen was adsorbed when first layer adsorption was almost complete. In view of this evidence, Gundry suggested that since hydrogen has a lower ionisation potential than hydrogen it would be adsorbed in the second layer as The explanation of the inhibition of theequilibration reaction follows If the Rideal mechanism is postulated, since the second layer Ng+ would block the sites at which reaction occurred. Since the latter only occurs at a few sites, and since inhibition is obtained at low coverages of nitrogen (less than 30$) further evidence is provided that particular sites of adsorption are chosen. Shooter and Farnsworth (72) studied hydrogen—deuterium exchange on nickel surfaces after argon ion bombardment, and the observed kinetics were closer to those required by the Eley-Rideal mechanism than by the Bonhoeffer-Farkas
mechanism.The present experimental evidence may be explained in a
similar way if it is assumed that mercury atoms, which have a much lower ionisation potential than nitrogen, are being physically adsorbed in a second layer. It will be remembered that, on cooling the mercury vapour source in liquid nitrogen, a reduced count rate was obtained from the surface, indicating that the concentration of

-109-mercury vapour either in the physically adsorbed layer, or in the vicinity of the surface, was becoming reduced. On the other hand, Campbell and Thomson (16) observed that at the end of the desorption the quantity of mercury adsorbed by the surface was only
about 1.21 mercury atoms per hydrogen atom, so that, for instance, the proposal of a complete physically adsorbed monolayer is untenable. If, in accordance with the above arguments, exchange occurs at a relatively few sites, and may be inhibited by a very low concentration of a positively charged second layer adsorbate, it is not necessary to postulate a high value for the concentration of mercury on the surface at the end of a desorption. Campbell and Thomson further observed that mercury adsorption did not stop at a monolayer, but continued for a considerable period.
Thus the variation in specific activity of the gas phase desorbed tritiated hydrogen may be explained. However, if mobility of hydrogen on the surface were still possible, the variation in the gas phase specific activity cannot be explained because, as mentioned before, equilibration would occur on the surfacej and even if a difference in bonding between hydrogen, and between tritium, and the surface is accepted because of an isotope effect, the series of variations of the kind observed wou -d not be obtained. It seems reasonable to postulate that second layer adsorption of mercury prevents mobility of the hydrogen atoms. This seems acceptable since, if the mercury atom has a small positive charge, and is bonded to the surface with a bond strength of a reasonable magnitude,

-110-
or to the neighbouring hydrogen atoms by virtue of their negative dipole arrangement, the mobility of the hydrogen would be restricted. It is noteworthy that chemisorbed first layer mercury does not have this effect since equilibration still occurs at any stage throughout desorption even at high mercury coverage.It is also possible, of courde, that adsorption of mercury on specific sites is not required, if the functionof the second layer mercury is to prevent migration of hydrogen atoms on the surface.By this mechanism, the surface equilibrium of hydrogen and tritium either over the whole surface or confined to individual crystallites, will be "frozen" on the admission of mercury vapour, which is why the mean specific activity of the desorbed gas is constantf
and since, as will be seen later, desorption is an activated process from an adsorbed mercury layer, desorption will be likely at energetically favourable sites. Desorption from the gas phase by mercury atoms would be a random process unlikely to lead to the peaks in the desorption graphs. It must be pointed out that the effect observed is a minute one, the variation in specific activity of the desorbed phase varying only to about 20$ for an adsorbed specific activity of 106 cpm per cm mm, hence only small differences
in bond energy are required for its explanation.Heterogeneity, for hydrogen isotopes, of the present type has
not been observed before for two reasons; firstly, exchange must be prevented; and secondly, an isotope effect in bonding must be of a sufficiently high order to ensure a difference in desorption

-111-
rates of the isotopes* It is perhaps possible that the initial increase in tritium concentration observed by Campbell and Thomson (16) in their mercury displacement experiments is attributable to the increase in specific activity as the first peak is formed,
subsequent variations being unobserved since only the total tritium at each stage was counted. It is also possible that such very minor variations in bonding energy would play no significant part
in ^ ^ 2 ex°kange reactions and they would certainly seem to be insufficient to cause preferred adsorption on one species if mobility was not restricted.
The present desorption method seems to be very sensitive, unlike the heating processes used in previous work. These probably ensured that the effect was swamped.
Recent work by Boreskov and Vassilevitch (73) on the exchange of gas phase hydrogen or tritium with the preadsorbed isotope led them to the conclusion that, as with the hydrogen-deuterium exchange reaction, the surface was characterised by a low activation energy of exchange, and the isotope adsorbed there rapidly equilibrated with the gas phase. They postulated that an adsorbed atom liberated itself from the surface to form either a hydrogen molecule or molecule ion which remained bound to the surface with an energy of 5 - 7 K cals per mole. The vacant sites remaining were available for the reception of atoms from the gas phase, hence an adsorbed atom of tritium was replaced by an atom of hydrogen, which was in accordance with their experimental results. They
-112-
suggested that a considerable activation energy was required to displace the molecule formed to the gas phase, but they assumed that one of the atoms could transfer to neighbouring atoms very easily hence was capable of moving over the surface. If subsequent desorption occurred at the point on the surface where the activation energy was low, then the above arguments will also explain why, on this model, exchange would be inhibited by mercury. Here the free movement of the desorbed atom over the surface would be prevented. The presence of second layer mercury would reduce the possibility of the formation of a positively charged hydrogen ion molecule if, as seems possible, the mercury was polarised with a partial positive charge because of interaction with the surface or neighbouring hydrogen atoms.
5.5. THE ACTIVATED DESORPTION PROCESS.
The evidence from the low temperature desorption experiments is a further indication that the desorption process is initiated, not from the gas phase, but from an intermediate surface phase of mercury. The reasons are as follows. At liquid nitrogen temperatures no desorption occurred, yet in allowing the temperature of the catalyst vessel to rise, desorption was extensive and rapid. This could be explained by condensation of mercury atoms on the low temperature nickel surface, and an activation energy of desorption is implied. The experiments showed that even with a sufficient concentration of vapour phase mercury present to effect

-113-
to effect desorption at 25°C, lowering the temperature to 0°C immediately stopped the desorption, which was not resumed until apparently a higher concentration of mercury was present. The desorption then restarted and continued at a rate only slightly slower than that at 25°C. The fact that the walls of the catalyst vessel were at a lower temperature than the mercury source in these experiments, would preclude the possibility of a higher gas phase mercury vapour pressure in the catalyst vessel. The required concentration of mercury vapour must then have built up on the surface, perhaps, as suggested before* either totally or partially in an adsorbed second layer. During the induction period in these desorption experiments, the gamma count indicated that a build up of mercury was occurring on the surface before desorption began. It is also significant that even with a large temperature differential between the catalyst vessel and the mercury source, the rate of desorption once begun is no faster than at roan temperature. This would indicate that a rate determining step is involved and this is probably the formationof a second layer of physically adsorbed mercury corresponding to the temperature of
the desorption experiments.Further evidence for this stems from the fact that, even
when the concentration of gas phase mercury vapour was removed at the conclusion of any stage in the desorption, the desorption process did not immediately stop, but continued at an ever reduced rate, for several hours, so that overnight a volume of hydrogen of about 4 or 5 cm^mm was usually desorbed. It seems possible

-114-
from this evidence that a small concentration of mercury vapour in an intermediate state between physical adsorption and chemi— sorption was present, since it could not be distilled back from the catalyst vessel by lowering the temperature of the mercury source, and yet it was not capable of providing immediate desorption of hydrogen. An induction period was also involved at 25°C, even with a saturated film. Although desorption began immediately mercury vapour was admitted to the catalyst vessel, the maximum desorption rate was not achieved for some time, usually for at least one hour. It would seem probable that a saturation vapour pressure of mercury would be attained very rapidly in the catalyst vessel at the gas phase presstfcres involved, especially if the catalyst vessel was at a lower temperature than the mercury souroe. If this is so the induction period could only be explained by the time taken to achieve a stationary intermediate state between the
gas and chemisorbed mercury phases.It is postulated in the present work that desorption does
not occur directly from the gas phase, but via an intermediate physically adsorbed phase which requires an activation energy for transference to the chemisorbed state. This seems a reasonable explanation for the fact that the desorption process is apparently sensitive to differences in bond strength between the adsorbenta.nd the adsorbate and also the small differences in bonding incurred by the hydrogen—tritium isotope effect, which apparently causes tritium to be more firmly bound than hydrogen. It is

-115-
difficult to see how a random displacement directly from the gas phase could detect these verysmall differences between the film sites.
The reason for the different desorption results at 0°C could be explained in terms of an activated process. It will be remembered that the mean specific activity of the desorbed gas in these experiments was of a lower value than that for experiments at 25°C, but that a sudden increase occurred towards the end of the desorption which restored the amount of retained tritium to that of normal films. An increased number of peaks was also obtained but these were of low area. It is possible that on each fraction of the surface at 0°C a certain proportion of the tritium was, by virtue perhaps of its adsorption position as suggested in section 4> adsorbed with a higher bond energy. & 0°C the activation energy required for its displacement was not available at the time of displacement of the remainder of the gas from the particular area. This tritium however, was not trapped, hence there was no reason that at a subsequent stage, when conditions were energetically more favourable, this should not be desorbed even after gas from other areas had been displaced. A certain proportion of tritium on other areas might also be retained in this way. It is suggested that the peaks thus observed corresponded, not to other areas of the surface, but merely to the sudden displacement of this more strongly bound hydrogen. Sites of this type have been proposed by Gomer (40) different fractions of the surface, where, by

-116-
virtue of similarity of co-ordination, the adsorption bond energies may be equivalent* This would seem to imply a spectrum of bonding energies occurred within each fraction of the surface because of steps or faults on the surface.
It may have been remembered that from films 25 and 27 which were only partially covered with tritiated hydrogen, the greatest displacement of tritium was obtained at the beginning of the desorption process, since the first few peaks were higher than the remainder. It may be supposed that the gas first desorbed was that which was least strongly bound to the surface.
This seemed anomalous since, even if, from Rideal's results, only limited mobility was achieved at lower coverages, it would be reasonable to suppose that sites of highest adsorption energy would be preferentially filled. Again, the activated desorption process could explain this result. It may be postulated that the tritiated hydrogen would be equally distributed over the entire surface on sites with the highest adsorption energies, irrespective of whether mobility was confined to each crystallite or was possible over the entire surface. The mercury may be visualised as adsorbing preferentially on these high energy sites, displacing hydrogen, either by a surface mechanism or by an adsorption—desorption process, on to the less active sites until those are completely filled. Sites of increasingly higher energies will be filled by this process, until the number of sites left unfilled by mercury corresponds with the number of hydrogen atoms present. Desorption

-117-
will then begin. Campbell (74) calculates that the amount of mercury adsorbed in the case of an unsaturated film before desorption occurs is lower than that required to fill all the vacant sites. If an adsorption-desorption process is postulated, it is possible that, as fewer vacant sites become available for readsorption the presence of mercury inhibits the process in a similar way to the inhibition of the exchange process.
It was also observed that during experiments when the desorbed gas was pumped continuously from the catalyst vessel, the peak heights were reduced. During these experiments the desorption process was stopped between successive stages, to prevent an undue rise in pressure in the catalyst vessel during the time that each sample was being measured and counted. Since it has been shown that desorption does not immediately stop on cooling the mercury source to liquid nitrogen temperatures, a small pressure of desorbed gas was obtained during this period. Two results are therefore possible; firstly, since gas phase mercury was being removed, exchange could occur between this desorbed gas and the surface, the effect on the subsequently desorbed sample being one of reducing the specific activity to nearly the mean value; secondly, if a certain amount of surface mobility was regained during this period, equilibration of the gas remaining on the surface fraction under review would occur, either with the remainder of the entire surface or of the surface of the crystallite. Since the period between each desorption was short (about 15 minutes) both of tb©s© effects

-118-
would be limited as is evidenced by the fact that a detectable variation in specific activity was still achieved.
5.6. THE DISPLACEMENT OP HYDROGEN AND TRITIUM PROM NICKEL FILMS.
A displacement model has been devised which gives a satisfactory interpretation of the rise and fall of the specific activity of the tritiated hydrogen displaced from nickel by mercury.
Although some of the concepts were subsequently discarded, they are included, for the present, in the following development of the model.(l) If displaced tritium and hydrogen are in equilibrium with the
surface according toHT + HA ^ h2 + TA where A represents the substrate,
then they will distribute themselves between the gas and adsorbed
phases such thatT ct T where T is the number of adsorbed a________ __g_ aH H atoms, T is the number of tritiuma g gatoms in the gas phase and H and Hct
have similar meanings for hydrogen.
Prom chapter 3.5* i^ was seen that the ratio of the specific-% ■activities of the gas phase and surface phase was 106 approx.
- — 100— 100The value for CL from this result will then be 91/106 = $5*Glueckauf and Kitt (75) observed for the deuterium-hydrogen system
on palladium at 25°C 1fcj roi # CM 1
h j s • _ H2 .
for molecular fractions x^ = 0.01 to xd = 0.99

-119-
Gundry (66) and Schuit (67) observed with the same system on nickel at room temperature, a value for ct a little less than unity.
It has already been pointed out that mercury vapour may interfere with this equilibrium, and it will be seen later that equilibrium is not invoked in the final model.
(2) The desorption of hydrogen and tritium was not instantaneous on the admission of mercury vapour. If the supply of mercury vapour was stopped, the desorption continued for some time. As has already been observed, mercury may be physically adsorbed on the surface and an activation energy is required to displace hydrogen in a subsequent step. This physical adsorption has been confirmed by cooling the mercury reservoir in liquid nitrogen temperatures when 203Hg distilled back. The significance of this is that, when mercury was in random collision with surface atoms, they were not immediately displaced, i.e. an isotope effect could thereby operate during the displacement.
(3) The tritium in the gas phase was present as HT. The equi
librium constant for the reactionH + T «==*= 2HT is calculated as follows2 2
2HT1
- In K =
B1 A2 " B2 or H2 + ^2 >A f°ET
[ A f°1 [ A f° 's ET A1 A2 RT B1 B2
__0 —O Ti»0 -m®F. - V “ B-*2 1 + 2 1et rt

* - 3.95061 + 3.04344i.e. - In K = - 0.907 K = e0'90? *, 2.58
(Necessary values tabulated by Haar, Friedman and Beckett (76)).
From the relative numbers of hydrogen and tritium atoms present, it is concluded that over 99*9$ o f the tritium is present
Qas HT. Since only one atom in 10 adsorbed atoms was a tritium atom, the near neighbour atoms for any particular atom would be hydrogen. The chance of finding neighbouring tritium atoms was considered to be remote. We have, therefore, restricted our attention to the processes.
n®(a) + “ + HA —> H2(g) + HgA + A
and ^>(a) + ^ + TA —^ HT(g) ' + HgA + A
neglecting + TA + TA T2(g) + HgA + Awhere Hg^^ represents physically adsorbed mercury.
(4 ) Let us now consider a fraction of the area of a tritiatedfilm, say l/5th of the total area. Let us assume, for the present,that there are T adsorbed tritium atoms and H adsorbed hydrogen a aatoms which are in equilibrium with T gaseous tritium atoms ase>HT and H hydrogen atoms as Hg at that moment, i.e.
If mercury atoms displace a small amount of hydrogen and tritium to

-121-
the gas phase, A H and A T atoms
T - A T _ T + A T-Jz----- " Ci.-Ji_____Ha " A H Hg + A H
i.e. (Ta - AT)(Hg+AH) = (H& - A H)(Tg+ AT)<*
- a A h Tg - a A h a ®
since T H = H T CLa 8 a gTaA H - A * H g - a Ha A T - a. A H Tg
i.e. A H ( T a+ a T g) = AT(a-Ha + Hg)
A m T . a T . T n TT a -f g =_= ^ jL _aA H aH + h . aH. a ha g a a
since T S T and H \ H& g a ^ g
From this it is observed that the ratio of increments cominginto the gas phase is related to the T /H ratio on the surface at3L &that moment •
We conclude from this section that i f T / k can vary on this8L &
l/5th of the surface, then so also might A T / A H, as was experimentally observed. If, however, the ratio T /H is affected by equi-3r 3rlibration with the whole surface via the gas phase A T and A H , at all stages in the desorption, then variations in A T and A H would be small.
It was in fact experimentally observed that when the system was allowed to partially equilibrate (e.g. films 27 and 28), the peak heights were reduced (figs. 6 and 7)»5.7. THE GENERAL FQjRM OF TES FINAL DISPLACEMENT EQUATION.
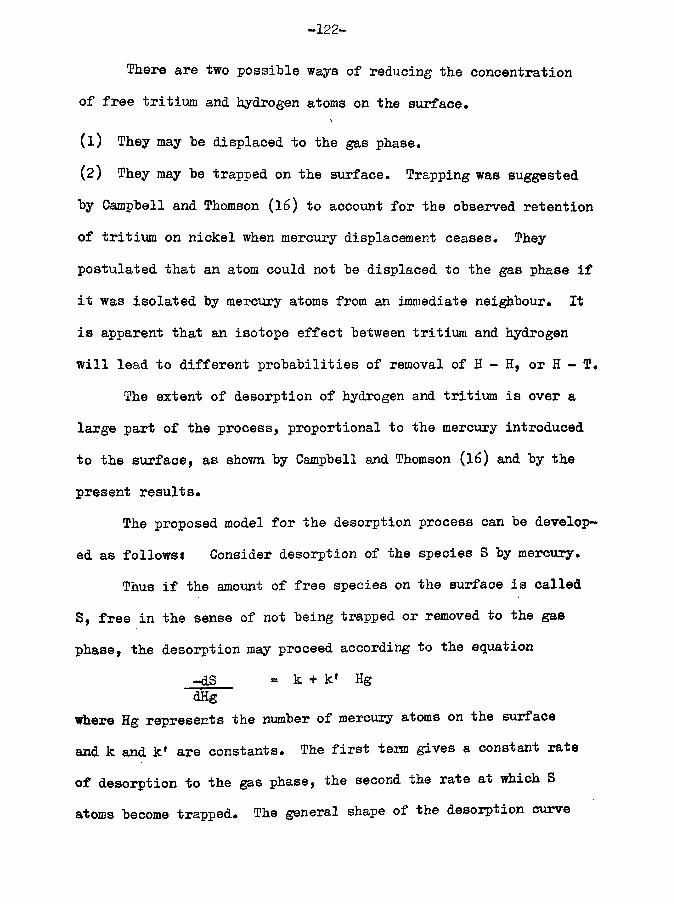
-122-
There are two possible ways of reducing the concentration of free tritium and hydrogen atoms on the surface.
(1) They may be displaced to the gas phase.(2) They may be trapped on the surface. Trapping was suggestedby Campbell and Thomson (16) to account for the observed retention of tritium on nickel when mercury displacement ceases. They postulated that an atom could not be displaced to the gas phase if it was isolated by mercury atoms from an immediate neighbour. It is apparent that an isotope effect between tritium and hydrogen will lead to different probabilities of removal of H - H, or H - T.
The extent of desorption of hydrogen and tritium is over alarge part of the process, proportional to the mercury introduced to the surface, as shown by Campbell and Thomson (16) and by the
present results.The proposed model for the desorption process can be develop
ed as follows* Consider desorption of the species S by mercury.Thus if the amount of free species on the surface is called
S, free in the sense of not being trapped or removed to the gasphase, the desorption may proceed according to the equation
-dS = k + k* HgdHg
where Hg represents the number of mercury atoms on the surface and k and k* are constants. The first term gives a constant rate of desorption to the gas phase, the second the rate at which S atoms become trapped. The general shape of the desorption curve
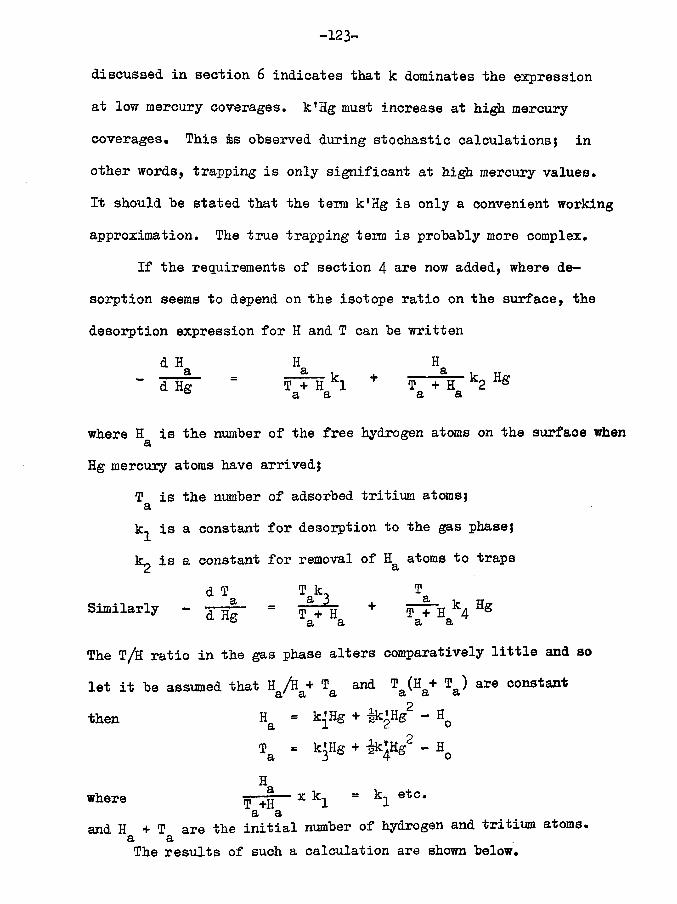
-123-
discussed in section 6 indicates that k dominates the expression at low mercury coverages. k ’Hg must increase at high mercury coverages. This is observed during stochastic calculations; in other words, trapping is only significant at high mercury values.It should he stated that the terra k'Hg is only a convenient working approximation. The true trapping terra is probably more complex.
If the requirements of section 4 are now added, where desorption seems to depend on the isotope ratio on the surface, the desorption expression for H and T can be written
d H H HSI SL •* | £1 4 tt“ d H g = T + H 1 T + H 2 8B a a a a
where H is the number of the free hydrogen atoms on the surface when£LHg mercury atoms have arrived;
T is the number of adsorbed tritium atoms; ak^ is a constant for desorption to the gas phase;kn is a constant for removal of H atoms to traps2 a
d T Tk. TSimilarly - + j-+H \ HS
a a a aThe T/H ratio in the gas phase alters comparatively little and so
let it be assumed that R ^/E^r T& and ^a(^a+ ^a) are constant then Ha = kjHg + -jgk Hg2 - Hq
Ta = k'Hg + *^Hg2 - Hq
Hwhere [F+i— x kl * kl e* ° 'a aand H + T are the initial number of hydrogen and tritium atoms, a a
The results of such a calculation are shown below.

-124-
If the specific activity of the adsorbed gas is 106 cpm/cnAim3then 1 cm mm contains 1.023 x 10 atoms of tritium;3
and 1 can mm of hydrogen at 20 C contains 6.58 x 10^ atoms
3If 80 cm mm of gas are adsorbed on a film, there will be
8.18 x 10^ atoms of tritiumand 18
5.27 x 10 atoms of hydrogenFor a film with five peaks, it is assumed that there are five
areas on the surface each with
DISPLACEMENT AND TRAPPING OF HYDROGEN.According to Campbell and Thomson (16) adsorption of 100
mercury atoms displaces 83 hydrogen atoms®Also the ratio of atoms displaced to atoms trapped, according
to Campbell and Thomson and the results detailed in chapter 3*7>
is about 93*7 •Hence at the end of the desorption process there will be
and
I.64 x lO^atoms of tritium 181*05 x 10 atoms of hydrogen
and
187/100 x 1*05 x 10 atoms trapped
1893/100 x 1.05 x 10 displaced to the
gas phase.
At the end of a desorption process0 <= Hg + i k£ Hg2 - 1.05 x 10¹⁸^
The number of hydrogen atoms in the gas phase18 f = 0.93 x 1.05 x 10 = k2 Hg
i.e. 0.93 x 1.05 x 1018 = x 100/83 x 0.93 x 1.05 x 1018
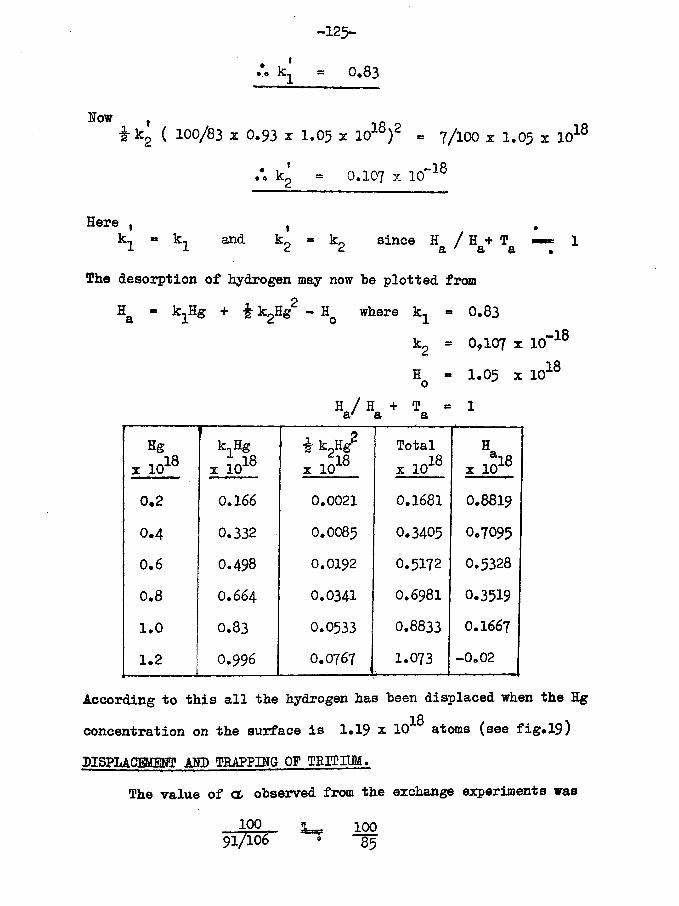
k„
-125-
- 0.83
Now4-k' ( 100/83 x 0.93 x 1.05 x 1018)2 = 7/100 x 1.05 x 1018
/• k. 0.107 x 10'-18
Here , ki and since H / H + TO / Q t
The desorption of hydrogen may now he plotted fromHa * k^Hg + -J- kgHg - Hq where k^ 0.83
* 0*107 x 10
H - 1.05 x 10o
-1818
H / H + T a' a a
Hg x 10
k,Hg x 10
£ k2H /,„18x 10
Total, J 8 x 10
Hx l O 18
0.2 0.166 0.0021 0.1681 0.8819
0.4 0.332 0.0085 0.3405 0.70950.6 0.498 0.0192 0.5172 0.5328
0.8 0.664 0.0341 0.6981 0.35191 .0 0.83 0.0533 0.8833 O.I667
1.2 O.996 0.0767 1.073 -0.02
According to this all the hydrogen has been displaced when the Hg18concentration on the surface is 1.19 x 10 atoms (see fig.19)
PISPIACW^T and TRAPPING OF TRITIUM.The value of a observed from the exchange experiments was
100 9l/l06
10085

-126-
i.e.THS
= J 5100 X
TaHa
i.e. Te
« H is S lower than Ta * Ha
Now A tA H
* 85 100
x aHa
s 1a
Tx a
Ha
Also A T k H " 3 ff Tx a / H / a + Ta = k3 Tx aA H k..H1 S
Ha / H ' a + Ta kl Ha
• • *k- *kl
Ta *Ha
1a
X TaHa •*• k3
II
Since kl ■ 0.83, k3 = 0.85 X 0.83
Reference to fig*17 also shows that the rate of displacement of tritium is 85$ that of hydrogen.
Although k^ has "been derived from the gas phase - adsorbed phase equilibrium, the idea of such equilibrium at each dtage of a desorption process was subsequently discarded.
If, say, all the tritium is displaced from the surface atlQ
Hg = 1.15 x 10 atoms, then the concentration of free tritium onthe surface at any point in the desorption process is given by
(Ta / Ha + T a>k3HS + i ^ a + Ha)Hg2 “ To and at the end of the displacement, this equals zero, i.e.
1.64 X 1010 = 1>64 x 0.706 x 1.15 x 1018 +1.05 x 10xo
|1*64 * 10* x (1#15 x io18)21.05 x 10¹⁰ 4
k4 = °*36 x 10”18

The stepwise desorption and trapping of tritium may now he calculated from
" Ali ■ k3 + k4 N 3i.e.
A t t ta k , + 7— - k . [ ( H g ) ]A Hg ~ T +H 3 T +H 4 ° a a a a
Step 1,1ft 180 - 0.2 x 10 atoms Hg. Average Hg = 0.1 x 10 atoms
T / H + T * 1 0 . = i#562 x 10~8a a a 1.05 x lO10
- A T - 1.562 x 10"8 x 0.706 x 0.2 x 1018 + 1.562 x K f 8*0.2 x 1018 x 0.36 x 10~18 x 0.1 x 1018
* 0.2205 x 1010 + 0.01125 * 1010« 0.2317 x 10¹⁰
10residual tritium ■ 1.408 x 10 atoms.
Step 210.2 - 0.4 x 10 8 atoms Hg Average Hg « 0.3 x 10^8atoms
* / H + T = 1>4PS.. — ~ g - I.596 x 10"8a a a 0.8819 x 10
- A t = 1.596 X 0.2 X 0.706 X 1010 + 1.596 X 0.36 X 0.2 X 0.3 x
= 0.2254 X lo10 + 0.03447 * lol°= 0.2599 X 10¹⁰
10•*. residual tritium = I.I48 x 10 atoms.
gfoP 3« 180 .4 - 0.6 x 10 atoms Hg Average Hg = 0.5 x 10 atoms

-128-
T / H + T * — 48 * 1q1° s 1.618 x 10"8O.7095 x 10 0
- A T - 1.618 x 0.2 x O.7O6 x 1010 + 1.618 x O.36 x 0.2 x 0 .5 x 1010
- 0.2284 x 10¹⁰ + O.O583 x 1010
« 0.2867 x 10¹⁰
residual tritium = O.86I4 x 10^ atoms
Step 4.l ft 1ft0.6 - 0.8 x 10 atoms Hg Average Hg = 0.7 x 10 atoms
™ / r, m 0.8614 X 10¹⁰ , ✓ ,^-8T / H + T » ■ ■ ■ ■t: ■ = 1.617 x 10a a a 0.5328 x 10¹⁰
« 1.617 x 0.2 x 0.706 x 1010 + 1.617 x 0.36 x 0.2 x 0.7 x 1010
« 0.2287 x 10¹⁰ + 0.0815 x 10¹⁰« O.3098 x 1010
10residual tritium = 0.5516 x 10 atoms
step 5.18 180.8 - 1.00 x 10 atoms Hg Average Hg « 0.9 x 10 atoms
- 0,5516 * lo10 - 1-568 n o - 8a a a 1 o0.3519 X 10iO
- A T * 1.568 x 0.2 x 0.706 x 1010 + 1.568 x 0.36 x 0.2 x 0.9 x 1010= 0.2214 x 10¹⁰ + 0.1016 x 10¹⁰ *= 0.3230 x 10¹⁰
residual tritium * 0.2286 x 10 atoms
Step 6.lft 1 ft1.00 - 1.15 x 10 atoms Hg Average Hg = 1.075 x 10 atoms

-129-
T /& + T * Pa2.286 x 10 - = 1.372 x 10"8a a a O.I667 x 10
- T = 1.372 x 0.15 x 0.706 x 1010 + 1.372 x 0.36 x 0.15 x 1.075x 10
10 10 = 0.1452 x K T + 0.0796 x 10^
= 0.2248 x 10¹⁰
.% residual tritium = 0.0038 x lO^atoms
Results may be tabulated as follows *-
1 2 3 4 5 6Hg x 1018 0 - 0.2 0.2 - 0.4 0 .4 - 0.6 0.6 - 0.8 0.8 - 1 1 - 115T /H +T a' a ax 10-8 1.562 1*596 1.618 1.617 1.568 1.372T 1010 a 1,408 1.148 0.8614 O .5516 0.2286 0.0038
H xlO18 a 0.8819 0.7095 0.5328 0.3519 O.I667 0.0250
H xlO18 8
0.166 0.166 0.166 0.166 0.166 0.1245H trap.xl°Lj 0.0021 O.OO85 0.0192 O.O341 0.0533 O.07O8
T x 1010 8
0.2205 0.2254 0.2284 0.2283 0.2214 0.1452
T Trap.x 10 0.0112 0.0345 0.0583 0.0815 0.1016 0.0796
T /E 8 / 8
* 10-8 13.28 13.58 13.76 13.75 13.34 11.66
Sp.act. ga| cpm/ cqi mm 90.14 92*15 93.37 93.33 90.51 79.16
Total tritium displaced to gas phase = 1.269 x 10 atoms =* 77*39$Total tritium trapped = 0.3667 x 10 atoms = 22*37$

RE
SID
UA
L H
YD
RO
GE
N
XlO
F I G. I 9
O* 2 0 4 0*6 0 8 1-0
HgX lO,e
O
\F 1 G . 2 0
j
\O 0 2 0 - 4 0 - 6 0-8 l - O T s
X IO/a
<0'ox0 15 15cc1 14 h-- J 1 3 <9 12U)Ml .. CL 11 F I G. 2 !
O 0 2 0 4 0 6 0 8 l O 12
E IOO
8 0
7 0
F I G . 2 2
6 0O 0 -4 0 .8 I. 2
Hg X I O ' * H g X I O 1®

-130-no
Total hydrogen displaced to gas phase = O .9545 x 10 atoms ■ 90.88$18Total hydrogen trapped = O.O7O8 x 10 atoms = 6.74$
The free hydrogen left on the surface after each desorptionstage is plotted in fig.19* The free tritium is plotted in fig.20and it will he observed that, whereas the plot for hydrogen is a
straight line, a very slight curve is obtained because of the changingT / H + T ratio, a ' a a
The above model is satisfactory in several ways. Firstly, it provides trapping values for hydrogen and tritium which are very close to the esqperimentally observed values. The percentages of each displaced to the gas phase are thus also reasonable, (cf 3*7 )*
In fig.21 the residual T/H ratio on the surface is plotted (crosses), and for comparison the T /H ratio in the gas phase at each stage in the desorption (circles). It will be observed that equilibrium between gas phase and adsorbed phase is not involved, sincet /a /g 1 g is not a constant fraction of T / H .31 3
Fig.22 shows the gas phase specific activities of the desorbed fractions, the plot being to the same scale as that of the experimentalcurves. It is seen that a rise and fall is obtained although themaximum is displaced to the right. However, if slight overlapping of the peaks occur, the curve would become more symmetrical, since the higjh initial values of the second peak would be superimposed on
the low latter values of the first.The maximum values obtained for the gas phase specific activity
are not as high as those observed experimentally, and the variation

-131-
between the maximum and minimum values is also less than the experimental differences. It must be remembered, however, that the trapping process, as shown experimentally, is not a straightforward one of atom isolation, and without greater knowledge of the trapping process it is difficult to suggest a mare accurate tem for the latter in the displacement-trapping equations.
5«7. CONCLUSIONS AND FUTURE EXPERIMENTAL WORK.
Conclusions from the foregoing discussion, derived from the experimental results so far obtained, may be summarised as follows.
(1) The surface of the nickel films prepared under the stated conditions is heterogeneous, this heterogeneity being attributable to the differences in bond strengths between the adsorbate and the various exposed crystal faces in the films.
(2) The periodic variation in specific activity of the desorbed gas was observed because of an isotope effect in bonding between hydrogen and tritium, and because of the inhibition of gas-surface exchange by mercury vapour. The fact that the desorption was carried out at 25° C and involved an activated process, prevented the very small differences in binding energy from being submerged.
(3) An isotope effect is also present in the retention of tritium and hydrogen. This retention cannot be explained by a straightforward application of the Campbell—Thomson theory, since the overall effect is dependent on film weight rather than on surface area. A bulk diffusion mechanism would also seem to be involved.

-132-
Further lines of experimental work are suggested by the present results. Short term studies would be, firstly, desorption experiments from sintered argon evaporated films, since, if the increased number of desorption peaks can be attributed to the
presence of unstable crystal faces, these should be removed, or at least reduced in area, by sintering; secondly, desorption experiments from films evaporated in an atmosphere free of mercury vapour, to assess the effect, if any, of the mercury vapour present, from the McLeod gauge, in the catalyst preparation section
of the apparatus.A long texm project which would give a more complete answer
to the question of whether crystal face is responsible for the observed heterogeneity, is the study of adsorption and desorption on single crystals of nickel. Each crystal face could then be isolated, and its desorption pattern observed.
-133-
CHAPTER 6.
PREPARATION OF NICKEL FILMS FOR HYDROGEN ADSORPTION __________________ EXPER3MTS.____________________
6.1. THE VACUUM SYSTEM.
Preparation treatment of the catalyst vessels was carried out on a subsidiary vacuum line connected by a three-way tap between the diffusion pumps and the main vacuum apparatus manifold. Provision of the three-way tap enabled the diffusion pumps to be by-passed so that initial evacuation of a new catalyst vessel could be carried out by the rotary pump, thus preventing the necessity for large volumes of air to be taken through the diffusion pumps. A further advantage of the by-pass line was that, whilst initial pumping on the catalyst vessel section was proceeding, the diffusion pumps could, if necessary, maintain the requisite level of pressure in the main vacuum system. To determine when the required pressure had been reached in a new catalyst vessel, a mercury filled McLeod gauge was provided, of bulb capacity 100cm , with a closed limb of 1mm bore capillary tubing. This gauge was used in a comparative, qualitative way to indicate residual pressure in this section.
Two catalyst vessels could be accommodated at the same time, and these were arranged to lie horizontally, supported by the baking out furnaces, and connected to the vacuum system by BIO joints.
6.2. FURNACES.
Two furnaces were provided for baking out catalyst vessels.
These/

C A T A L Y S T
V E S S E L S
-134-
consisted of brass tubes, 20cm long and 3cm in diameter, and flanged at each end to retain the windings and insulation. These were wound with nichrome tape to a cold resistance of 55ohms, the tape being located, and connected to the electricity supply, at each end by means of nichrome wire of a suitable gauge, and insulated from the tube by asbestos paper. Over the windings thermal
insulation was effected by two layers of woven asbestos tape 2cm wide, bound at each end of the furnace with asbestos string.These two furnaces were designed to operate, in series, directly from the mains, under which conditions temperatures of 5^0°C were provided, although for a finer adjustment of temperature a Variac transformer was later used.
An iron constantan thermocouple was employed to monitor the temperature of one of the furnaces, and was connected to a milliammeter shunted with a suitable length of fine gauge nichrome wire so that full scale deflection was obtained at 500°C* Calibration was against a borosilicate glass thermometer.
6o3» DESIGN OF CATALYST VESSEL.
The catalyst vessel (fig.23 ) consisted of a Pyrex tube,16cm long and 2cm in diameter. Through one end of this passed two tungsten leads connected with a hairpin shaped filament made of pure grade nickel wire, G,2M in diameter, supplied by Messrs. Johnson Matthey, Ltd. This wire was spectroscopically pure and contained not more than 15 parts per million of metallic impurities.

-135-
(it has recently been shown, however, that such nickel contains a much higher percentage of gaseous impurities (ref. 20 ). )
The tungsten leads were made by cutting Johnson Matthey*s 1mm annealed tungsten wire into Jem lengths, using the edge of a carborundum wheel to prevent splitting the laminae, although it was later found that the shearing action of the wire cutter on the shoulder of a pair of pliers was equally effective and more convenient. The wire was cleaned by being stroked with a stick of sodium nitrite after being heated to red heat. The resulting violent exothermic reaction left the wire with a bright, silvery appearance after it had been cooled, and excess nitrite washed away. By being carefully heated in a soft glass blowing torch flame, the wire was reoxidised to an irridescent greenish purple colour. It was then sleeved with 3cm lengths of 2mm bore Pyrex tubing, this being melted on to the tungsten with an oxygen blow torch flame. Care was taken to melt the glass progressively along its length, to exclude air bubbles. The glass to metal seal produced had a characteristic bronze colour, if the processing had been correct* Suitable lengths of nickel wire were then wound around the prepared tungsten leads and spot welded in position. This ensured adequate electrical contact without recourse to silver soldering with its attendant contamination possibilities (ref. 74 )• The length of free nickel filament was arranged to be about 20cm.
Since a certain amount of trouble was experienced through leakage at the tungsten seals when the filament was located in the

-136-
catalyst vessel by the usual pinch seal method, it was decided to adopt the following method for making seals. The free ends of the tungsten leads were allowed to protrude through two small holes made in the rounded off end of the catalyst vessel. The edges of
each hole were then melted and collapsed on to the extreme end of the appropriate tungsten-glass sleeve and a seal effected. By this means practically the whole length of the tungsten-glass seal was left undisturbed to retain its original efficiency. Before the annealing of the seal, with a soft flame from a glass blowing torch, was completed, the filament was checked for correct alignment in the tube and the protruding ends of the tungsten wire were coated with silver solder to seal the laminae against gas leakage.
The catalyst vessel was de-gassed at a situation remote from the adsorption-desorption part of the apparatus. Moreover, the filament had to be evaporated after the vessel was sealed to prevent contamination. Hence the catalyst vessel was provided at its other end with a break-seal, for subsequent connection to the adsorption-desorption section, and with a side arm incorporating a constriction through which the catalyst vessel could be connected to the de-gassing section by means of the B 10 cone already mentioned. The vessel was sealed at this constriction on completion of the de-gassing process. The catalyst vessel was normally glass blown on to the adsorption-desorption apparatus in a vertical position with the break-seal uppermost, and consequently with the tungsten leads at the lowest position. In the case of

-137-
vessels prepared for low temperature desorption experiments, however, the break-seal was located between the tungsten leads so that the latter could be kept above the level of the refriger
ant. It was found that extreme temperature changes promoted leakage of gas through the tungsten seals.
6.4* PRE-EVAPORATION TREATMENT OF CATALYST VESSELS.
The pre-evaporation treatment was carried out as described
by K.C. Campbell (ref .74 )* and- more rigorously than that advocated by Beeck (ref. 13 ). Each catalyst vessel was connected to the de-gassing vacuum line by the standard BIO joint. It was arranged to be in a horizontal position, supported by one of the furnaces, and with the tungsten seal end protruding from the furnace by at least 2cm to prevent charring of the Apiezon W wax or, better still, of the Araldite with which the end of the catalyst vessel and the tungsten wires were coated as an added precaution against gas leakage through the laminae or through the seal itself. Otherwise, the whole of the catalyst vessel up to and including the break-seal, was enclosed by the furnace, the position of the side aim constriction being arranged to be just outside, since this had to
be accessible for sealing off the vessel.Each catalyst vessel was pumped out at 500°C for at least
five hours, and, in the majority of cases, for more than twelve hours, until no residual pressure could be measured by the McLeod gauge. For the last two hours of this process, the filament was
-138-
de-gassed by raising its temperature electrically to just below the evaporation temperature of nickel, using current supplied by a 70 amp 12 volt mains transformer, fed by a Variac transformer*The current necessary for this was 4*0 ampwith the catalyst vessel at 500°C, this being checked in a few cases by raising the current slightly when a very fine trace of nickel was discernible on the inside surface of the glass. The current passing through the filament was measured on an A,C, ammeter which had a full scale deflection of 10 amps. On initially heating the filament, thegas pressure, as indicated by the McLeod gauge, rose to more than—3 -510 "mm, falling, at first rapidly, to less than 10 ^mm at the end
of the two hours. The filament and the catalyst vessel were thenallowed to cool, and the constriction was de-gassed preparatoryto sealing off. This was done by heating it several times witha soft glass blowing torch flame, to just below the softeningpoint of the glass, which was indicated by the flame turningorange, until no rise in pressure was observable with the McLeodgauge; when all parts of the catalyst vessel were cold and noresidual pressure could be detected by the McLeod gauge, thevessel was sealed at the constriction and removed.
6.5* DEPOSITIONS OF NICKEL FIIMS.
Since considerable heat has to be dissipated during the evaporation process, and since undue sintering of the film must
be avoided, evaporation was carried out with the catalyst vessel

-139-
immersed in a large beaker into which was flowing a rapid stream of cold tap water.
Using the same electrical equipment as in the de-gassing process, a current of 6.25 amp was passed through the filament which became almost white hot. . Adjustment of the current value
was of prime importance since, if a little too high, the filament would melt locally and break before a sufficiently heavy film had been deposited.
The rate of film evaporation under these conditions was between 30 and 40 mg per hour, normal film weights before filament
burn-out being also of that order, but film weights up to, and over, 60mg were obtained.
Since the pre-evaporation preparation of the catalyst vesselwas not carried out in a mercury free system, the catalyst vessel
-3would contain mercury vapour at a pressure of about 10 mm - the saturation vapour pressure of mercury under the given conditions. This, of course, was not registered by the McLeod gauge. However, it was deemed unnecessary to provide means of excluding mercury vapour from the catalyst vessel, such as a trap cooled in liquid nitrogen, since the initial stages of evaporation of the filament exert a powerful gettering action on residual gases in the catalyst vessel. It is, however, essential to limit the availability of such contaminants by sealing off the catalyst vessel from the rest
of the apparatus before evaporation.Although facilities on the apparatus allowed for the

-140-
simultaneous de-gassing of two catalyst vessels, this was rarely
done* Only one at a time was prepared to ohviate any possibility of gas leakage or diffusion into the vessel. Hence films were, in general, evaporated immediately after the de-gassing process was completed, and used for adsorption experiments always within a few hours of deposition.
6.6. AEGON EVAPORATED FILMS.
The majority of films studied were vacuum evaporated, but a few films were deposited in an atmosphere of argon at 1mm pressure.
The argon used was contained in a 1 litre Pyrex bulb fitted with a break-seal. To the tubing above the break-seal was fitted a side arm with a 2mm bore vacuum tap and a BIO ground glass cone. This unit was then joined to the catalyst vessel de-gassing section of the apparatus through one of the BIO sockets. After thorough de-gassing of this section by pumping, the tap was closed and the seal broken by means of an enclosed stainless steel ball, the tap then being used to control admission of argon to the remainder of the catalyst vessel de-gassing system.
The catalyst vessel, filament and constriction were de-gassed in the usual way and allowed to cool. The mercury was raised halfway up the closed limb of the McLeod gauge, which was then used as a manometer, to measure a suitable argon pressure calculated from the volume of the catalyst vessel, and the volume of the remainder of the de—gassing system. After expanding the gas into

-141-
the McLeod bulb, a portion of it was trapped by raising the
mercury, and the residual gas pumped away* The trapped argon was
then expanded into the catalyst vessel, giving a resultant pressure of 1mm and the vessel sealed.
A higher filament evaporation current than for vacuum films was required, 7*2 - 7*3 amps being necessary to provide a comparable evaporation rate. The resultant film appeared to be darker in colour than vacuum evaporated films, which were of a silvery, mirror-like appearance.
6.7. ESTIMATION OF F H M WEIGHT.A colorimetric method was used for the estimation of the
weight of nickel inthe films (ref.16 ). In this method the water soluble nickel III dimethylglyoxime complex was used as the colour*-
ed compound. Solutions were prepared as follows Nitric acid approx. IONPotassium bromate-bromide mixture (3g KBrO^ and 12g KBr per litre, giving 0.1N bromine on acidification).
Dimethylglyoxime 1$ in ethanol.Ammonia solution, 0.88 ammonia diluted 1*10.The nickel film was dissolved in 25 ml. waim ION nitric acid
and the solution diluted to 1 litre with distilled water. 10 ml. of this solution were measured out with a pipette and transferred to a 50 ml* standard flask to which was added 10 ml. of the potassium bromate—bromide solution to oxidise the nickel to the

OP
TIC
AL
DEN
SITY
O
PT
ICA
L D
EN
SIT
Y*3
/\/ \•1
/ FIG. 2 4 \ FIG. 2 5
4 2 0 4 4 0 4 6 0 4 8 0 5 0 0 5 2 0 O lO 2 0 3 0 4 0 5 0WAVE LENGTH(itim) DEVELOPMENT TIME(min)
0 4
0 * 3
F IG 26
OO5 0 0200 4 0 03 0 0IOO
MICROGRAMS OF NICKEL

-142-
trivalent state. Excess bromine was liberated, causing the solution to develop a yellow colour# 1 ml* dimethylglyoxime, followed by
10 ml*ammonia solution, was added and an orange red solution was produced which was diluted to 50 ml, with distilled water.
K.C. Campbell (ref. 74 ) showed that the absorption maximum of this solution was at a wavelength of 465/J (fig* 24 ) and that it was necessary to allow 3Qnins* for maximum colour development in the solution. A Unicam spectrophotometer was used to determine optical densities. Standard nickel solutions were also prepared} weighed samples of the nickel wire used for the evaporation of the films were dissolved in 25 ml. ION nitric acid and the solutions
made up to 1 litre. These solutions were used to produce standard solutions of the dimethylglyoxime complex from which the relationship between optical density and the weight of nickel could be obtained. This is shown in fig. 26 > the weights shown being those in 50 nil* of the coloured solutions, which were in turn derived from 10 ml. of the original solutions and thus represent one-
hundreth of the film weight.The method employed was to deteimine simultaneously the op
tical densities of solutions of the complex prepared from the unknown and two standard nickel solutions, when the amount of nickel in the unknown could be determined by interpolation. A range of standard solutions was thus prepared of about 10, 20, 30 and 40 m g .
Weights of films determined by this method were reproducible to
within 1$.
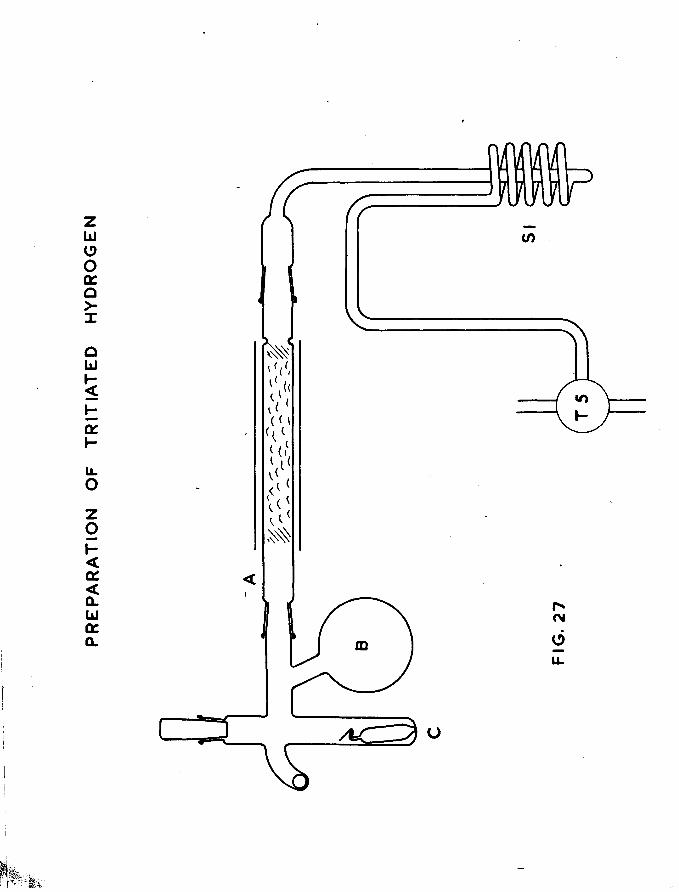
PR
EP
AR
AT
ION
OF
T
RIT
IAT
ED
H
YD
RO
GE
N
FIG
. 27

-143-
CHAPTER 7.
PREPARATION AND STORAGE OP GASES.
7*1. PREPARATION OF TRITIUM.
Since the tritium used in the adsorption experiments was
obtained from the Atomic Energy Research Establishment in the fo m
of tritiated water, a method of reduction to tritiated hydrogen was necessary. Of prime importance was the preparation of gas of extreme
purity and although various methods for the production of tritium from tritiated water for gas counting have been described (ref.77 ), these have rather concentrated on the attainment of quantitative
yields to obviate isotope effects.One of the methods, however, was adopted, viz; reduction of
the tritiated water by magnesium at 500°^ (ref. 78 ) since it was considered that the extreme reactivity of the magnesium would remove any impurities, the most important of which would be oxygen and nitrogen. K.C. Campbell (ref. 74 ) had previously applied this method and had found the resultant tritium to be satisfactory for
adsorption experiments.The apparatus for the reduction (fig* 27 ) consists of a Pyrex
tube A, 2cm in diameter, packed for a distance of about 12cm with B.D.H. Grignard reaction grade magnesium turnings. These were located by a plug of glass wool held in place by dimples impressed into the tube at the end nearest the 3-way tap T^, through which this section
-144-
of apparatus was to be evacuated. The glass wool plug further
prevented the very fine magnesium oxide powder formed in the reaction being carried by the gas stream into other parts of the apparatus. In order to achieve the necessary reduction temperature, the section of tubing containing the magnesium was surrounded by a furnace 20cm long and 2cm in diameter, of identical con
struction with those described in 6.2, but with a cold resistance
of 250 ohms. This was designed to give a temperature of 500°C at mains voltage and lower temperatures when under the control of a Sunvic simmerstat. An iron constantan thermocouple was provided to monitor the furnace temperatures, and this was calibrated at 350°C and 500°C against a borosilicate glass thermometer. The tritiated water, the volume of which was calculated from the volume of the storage bulb provided for the tritiated hydrogen, and from the estimated possible pressure of the stored gas, was measured into a glass phial, 4cm long and 0*5cm in diameter, fitted with a break- seal. The phial was placed in the tube C which was then closed with a greased B14 joint, and which had a 250cm bulb B attached to increase the volume of the section. This reduced the pressure of the small volume of air liberated when the phial seal was broken, and also provided a reservoir of water vapour prior to reduction. Between the reduction tube and tap T5 which joined the complete gas preparation system to the main apparatus, a spiral trap was inserted, cooled in liquid nitrogen, to remove any unreduced water and other condensible substances such as organic compounds

-145-
from carbon impurity in the magnesium, and boron and silicon hydrides produced by the reaction of magnesium boride and silicide with water vapour, the latter compounds being the result of
possible interaction between the magnesium and the borosilioate glass (ref. 74 ).
Before the seal on the tritiated water phial was broken, the apparatus was evacuated with the furnace at 350°C to de-gas the magnesium turnings. This procedure was continued, usually overnight, until no residual pressure was indicated by the Vacustat on the main vacuum manifold. The magnesium was then allowed to cool, tube C immersed in liquid nitrogen and the seal on the phial broken by means of an enclosed stainless steel ball, the liberated air which had been enclosed in the phial being pumped away. The temperature of the magnesium was raised to $ 0 0 °C9 pumping being continued until again no residual pressure remained. When this had been achieved, the section was isolated from the pumps, the spiral trap was cooled in liquid nitrogen, and the refrigerant removed from tube C to allow the tritiated water to evaporate and pass over the hot magnesium.
The Toepler pump PI (see fig. 30 ) was used to pump the tritiated hydrogen into the previously evacuated storage bulb provided, the gas obtained by the first few strokes of the pump being used to flush out the storage section and then discarded. Constant Toepler pumping was necessary for a period of at least six hours to obtain 2 litres of tritiated hydrogen at a pressure of 2/3 of
-146-
an atmosphere. The maximum pressure obtainable was limited by the height of the Toepler pump non-return valve, since it was
necessary to maintain a sufficient pressure differential inside and outside the apparatus to lift the pump mercury above the valve (see 8 .5).
The tritiated water obtained from A.E.R.E., Harwell, had a specific activity of 220 me per ml. This was diluted with
distilled water before reduction to give a resultant gas activity of about 11Q cpm per can mm in the gas counter used.
7*2. PREPARATION OF PURE HYDROGEN.
It was decided to prepare hydrogen of comparable purity to the tritium by the same reduction technique. In this case the phial was filled with a sample of conductivity water and the hydrogen produced pumped into a second storage bulb.
7.3* STORAGE OF TRITIATED HYDROGEN.
Since it was possible to prepare large quantities of tritiated hydrogen at each reduction and since the volume used per experiment was comparatively small, the question of storing the gas for several months without risk of contamination was important.Bulbs sealed with greased vacuum taps were not suitable since after a time, the grease hardened, inducing streaking and subsequent leakage, both of the stored gas and of air. The need for re—greasing
of such taps was frequently necessary.

M E R C U R Y CUT O F F V A LVE
D E T A I L
5
F I G . 2 8
-147-
Accordingly it was decided to use mercury cut-offs, and these had to he capable of handling a large pressure differential of the order of 2 /3 of an atmosphere, and yet be suitable for the controlled issue of various low predetermined pressures of gas* High pressure cut-offs have been described in the literature but these in general appeared to be altogether too complicated in construction, and it was decided to design a new and simpler type which adequately fulfilled the required conditions. The cut-off is illustrated in figs.28 and 29. The outer casing consisted of a Pyrex tube 1, 1.2 cm in diameter and JO cm
long, which had a B 24 cone at its lower end for fitting to a 250 ml. Quickfit mercury-containing conical flask. The cone was extended almost to the bottom of the flask by a suitable length of Pyrex tubing, so that the mercury could be raised and lowered in the outer tube by connecting the flask to atmosphere or to the secondary vacuum line by means of a three-way tap. Concentric with this outer tube, a second tube 2, 0.6 an in diameter, was connected to the vacuum system via a ring seal at the top of the wider tube. The bottom end of the inner tube was thickened, and a mercury float valve 3, constructed from a sealed 16 cm length of 0.3 cm Pyrex tubing, with its upper end thickened to form the valve face, was ground in with fine carborundum powder against it. This ensured that the valve seat thus formed was flush with the end of the tube. This was necessary to prevent mercury being trapped round the seal, because of surface tension forces when the mercury

T H E M A N O M E T E R S E C T IO N
T 2T I
M V2
T 4
T 3
FIG. 2 9
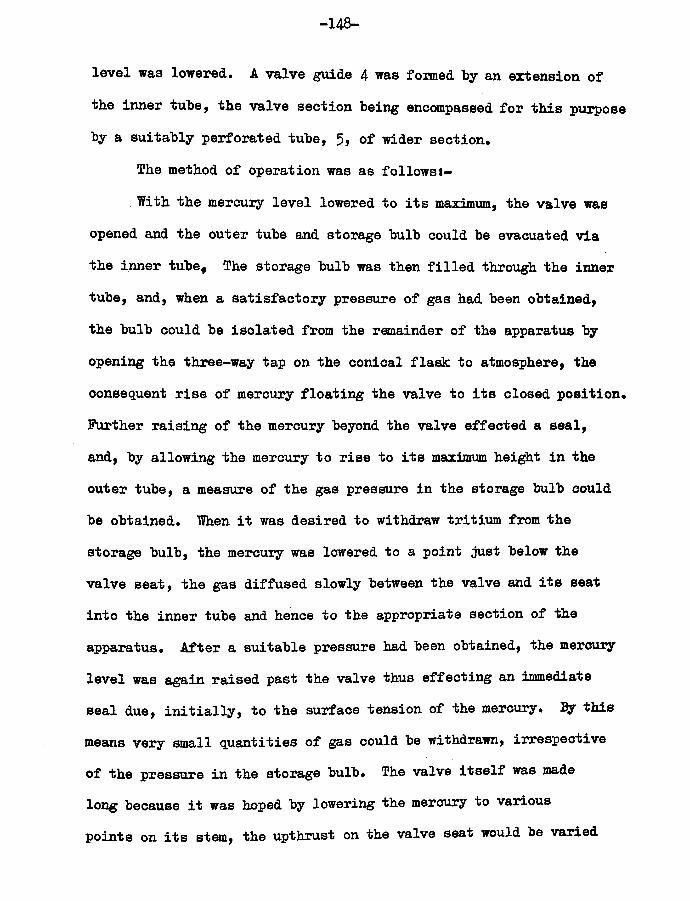
-148-
level was lowered* A valve guide 4 was formed "by an extension of
the inner tube, the valve section being encompassed for this purpose by a suitably perforated tube, 5> of wider section*
The method of operation was as followsi-
With the mercury level lowered to its maximum, the valve was opened and the outer tube and storage bulb could be evacuated via the inner tubef The storage bulb was then filled through the inner tube, and, when a satisfactory pressure of gas had been obtained, the bulb could be isolated from the remainder of the apparatus by opening the three-way tap on the conical flask to atmosphere, the consequent rise of mercury floating the valve to its closed position* Further raising of the mercury beyond the valve effected a seal, and, by allowing the mercury to rise to its maximum height in the outer tube, a measure of the gas pressure in the storage bulb could be obtained* When it was desired to withdraw tritium from the storage bulb, the mercury was lowered to a point just below the valve seat, the gas diffused slowly between the valve and its seat into the inner tube and hence to the appropriate section of the apparatus* After a suitable pressure had been obtained, the mercury level was again raised past the valve thus effecting an immediate seal due, initially, to the surface tension of the mercury* ?y this means very small quantities of gas could be withdrawn, irrespective of the pressure in the storage bulb* The valve itself was made long because it was hoped by lowering the mercury to various points on its stem, the upthrust on the valve seat would be varied

-149-
and hence the rate of diffusion of gas adjusted to a suitable
value* It was found, however, that the difference in gas pressure on either side of the valve kept it closed, even if the valve stem was completely above the mercury level* As the storage bulb pressure fell, the valve was less firmly seated and so the rate of diffusion of gas remained essentially constant! only when the pressure differential was a few cm, would the upthrust on the valve by the mercury become important*
This cut-off was made sufficiently long to obtain h qualitative indication of the residual gas pressure in the storage bulb, but there is no reason why a very compact unit could not be made if valves were fitted to limit the height to which the mercury could rise and if the float valve itself was made smaller* It should also be pointed out that the valve position relative to the surface of the mercury in the flask must be related to the maximum gas pressure it is desired to achieve in the storage bulb*
A pair of these cut-offs with associated 2 litre storage bulbs was provided, one for the tritiated hydrogen and the other for pure hydrogen prepared as described in the previous section*
A simpler type of cut-off was also tried* This had the same basic layout except that the valve mechanism was dispensed with, the bottom end of the inner tube being left open, although suitably constricted, and in this case the inner tube was connected to the storage bulb. The gas was confined simply by the head of mercury
above the open end of the inner tube* Lowering the mercury to

-150-
a suitable point resulted in gas bubbling out of the constricted
end of the tube. This method was less satisfactory since it was extremely difficult to discharge a precise quantity of gas.
7.4. HYDROGEN FOR COULTER FILLING.
The hydrogen used for counter filling was British Oxygen Company, Limited, commercial cylinder hydrogen which had been passed through a liquid nitrogen cooled trap containing activated charcoal, and admitted to a 2 litre storage bulb through mercury via a No*4 glass sinter.
The storage bulb was isolated from the vacuum apparatus by tap T^. A mercury column open to the bulb was used to indicate the hydrogen pressure.
7.5. OTHER GASES.a) ARQOIT. Argon was used in certain experiments to provide an
inert gas atmosphere during film evaporation. The argon was spectrally pure and was supplied by the British Oxygen Company, Limited, in a 1 litre Pyrex bulb fitted with a break-seal. The method of admission of the gas to the catalyst vessel was described
in 6.5.(2) OXYGM. A few experiments required the adsorption of a certain
percentage of oxygen as a preliminary to hydrogen adsorption. This oxygen was also obtained spectrally pure in 1 litre bulbs from the British Oxygen Co., Ltd.} before use it was expanded into a 2 litre storage bulb to reduce its pressure. This bulb was isolated by
Tap T,. through which the oxygen could be admitted to the pressure

-151-
measuring section of the apparatus.
7.6. ALCOHOL.
Ethyl alcohol was used as the gas counter quenching agent. After being dried with anhydrous magnesium sulphate, a few ml. were placed in a small bulb closed with a greased B7 stopper, the bulb being isolated by a simple U-tube mercury cut-off (fig. 29 ). After addition of alcohol, the bulb was cooled in liquid nitrogen, the mercury in the cut-off lowered, and the air, which had been admitted with the alcohol, was pumped away. The alcohol was allowed to warm up to room temperature and pumped on until bubbles of absorbed gases were no longer emitted. The mercury in the cut-off was then raised to isolate the bulb. When alcohol vapour was required for the gas counter, the bulb was cooled by liquid nitrogen and the mercury lowered, the requisite pressure of alcohol vapour being obtained as the bulb warmed up.
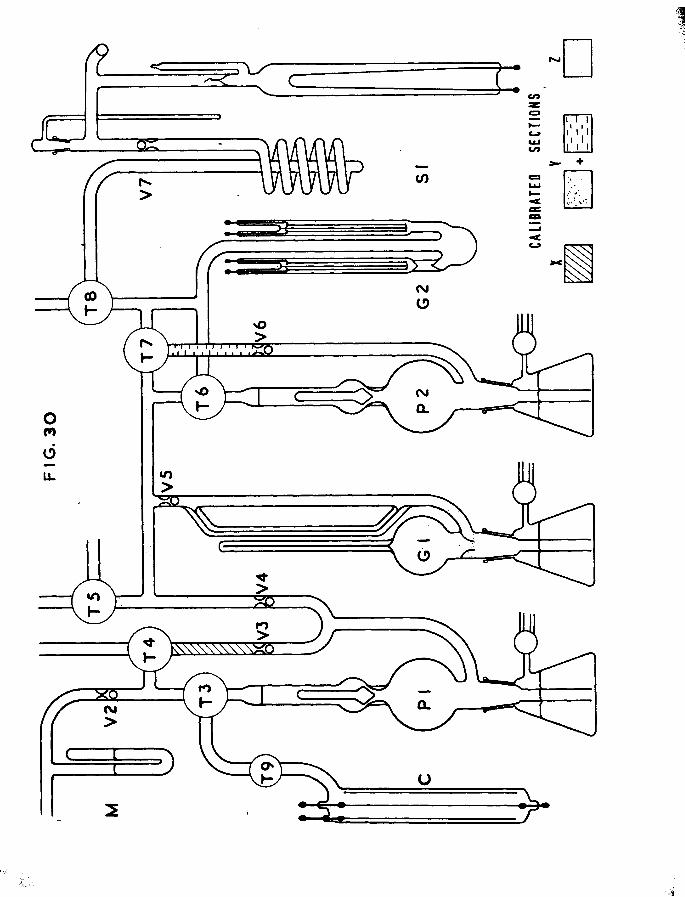
FIG. 30
CO
CO
OB
CM
•OrO
fOS I(VI

-152-
CHAPTER 8.
APPARATUS FOR STUDYING ADSORPTION AND DESORPTION OF ______________ HYDROGEN AND TRITIUM._______________
The apparatus was constructed throughout of Pyrex tubing of wide gauge for maximum pumping speed* except where volumes were to he kept to a minimum. Tap bores were appropriate to the gauge.Two glass mercury diffusion pumps arranged as a two-stage unit, backed by a Speedivac rotary oil pump, provided the vacuum. These were connected via a liquid nitrogen trap and an 8 mm tap to a main horizontal vacuum line from which leads were taken to the various sections of the apparatus, through taps T^, T^, and Tg (fig.30). The main vacuum line carried a Vacustat for the rapid assessment of pressure in any section of the apparatus.
Taps used were hollow key vacuum taps lubricated by Apiezon N grease, the number of which was kept to a minimum to reduce the possibility of contamination by air dissolved in the grease, or of air leaking into the apparatus past the taps when the grease became hard. To this end taps T^ to Tg were 3 mm bore three-way taps.
Mercury was used as the working fluid in cut-offs to storage bulbs, Toepler pumps and McLeod gauges, and was operated by means of three-way taps carried by the 250 ml. conical flasks which acted as mercury reservoirs for these units, one tap position opening the flask to atmosphere for raising the mercury, and the other to a secondary vacuum line, operated by a rotary oil pump, for lowering it.

-153-
Since the interior of the apparatus would contain a saturation pressure of mercury vapour, and since the latter acts as a poison to hydrogen absorption on nickel surfaces, the catalyst vessel section was separated from the main apparatus by a spiral trap cooled in liquid nitrogen. Taps were also excluded from this section to avoid possible surface contamination from the tap grease, catalyst vessels being fitted and removed by means of a B7 joint sealed with Apiezon W wax.
The entire vacuum system could be pumped very rapidly to a low pressure and no part of any experiment was commenced until the appropriate section of apparatus had been pumped to sticking
vacuum on the McLeod gauge Gl (fig. 30 ), this corresponding to a pressure of about 10 ^mm of mercury.
This and the following chapter describe in detail the design philosophy and the construction of the various parts of the apparatus and the method of executing the experiments.
8.1. GENERAL EXPERIMENTAL METHOD.
An aliquot portion of hydrogen or tritium from the appropriate storage bulb was admitted to the calibrated section, Y, via the cut-off in the side aim of Toepler pump PI, and its pressure measured by the McLeod gauge Gl. One or two strokes of Toepler pump P2 transferred an appropriate volume of this gas into the catalyst section, where the adsorption was followed to completion by the Pirani gauges G2. The residual gas in the McLeod section was
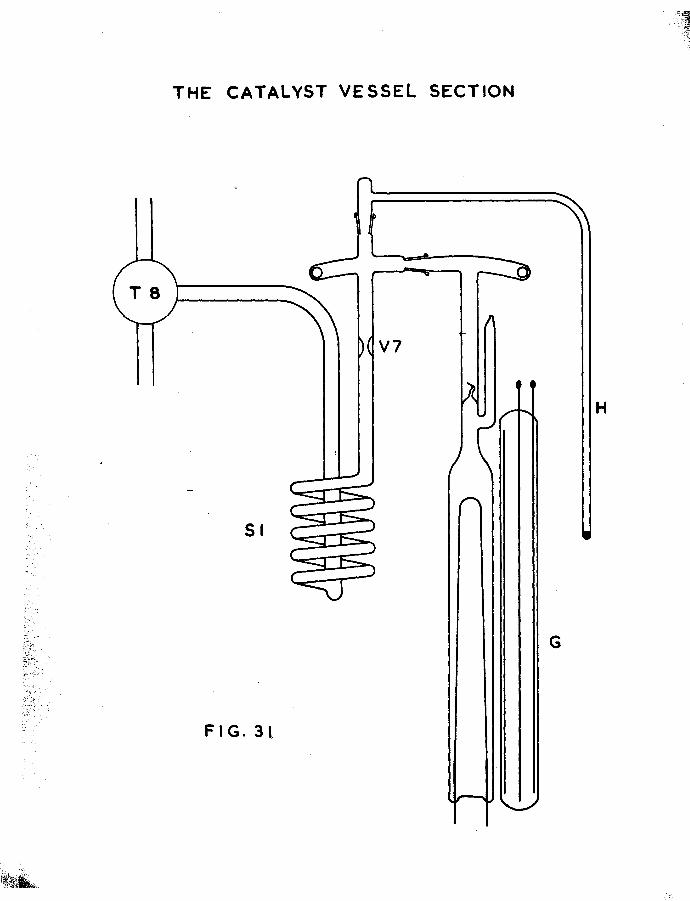
T H E C A T A L Y S T V E S S E L S E C T IO N
T 8
V7
H

-154-
pumped away after its pressure was measured, so that the quantity of gas transferred to the catalyst section could he determined. Further aliquots of hydrogen or tritium were admitted to the catalyst vessel in this way, until the requisite volume of gas had been adsorbed.
Desorption was effected by admitting mercury vapour to the catalyst vessel, the pressure of the displaced gas being indicated qualitatively by the Pirani gauges. This gas could be pumped away by Toepler pump P2 either continuously, or, when a suitable pressure was indicated by the Piranis, into section Z, its pressure measured, then pumped by PI into the gas counter C for the determination of its specific activity.
8.2. ATTACHMENT OF THE CATALYST VESSEL, (fig.31)
A catalyst vessel containing a freshly evaporated film was, without delay, glass blown by the length of tubing above the break- seal on to a corresponding Pyrex tube carrying two side arms, one ending in a B7 cone and the other designed to accommodate a stainless steel ball. This unit was connected to the apparatus by the B7 joint sealed with Apiezon W wax, the catalyst vessel being positioned vertically, immersed in a water—filled thermostat tank. The section, including the tubing above the break-seal and the spiral trap S2, separating the catalyst vessel from the remainder of the apparatus, was then evacuated through tap Tg, pumping being continued until sticking vacuum was obtained on the McLeod gauge.

-155-
Hifhen this had heen achieved the trap S2 was immersed in liquid nitrogen to prevent mercury vapour from the Toepler pumps, etc#,
reaching the catalyst vessel# The capillary tube containing ^^Hg, which was attached between trap S2 and the catalyst vessel, was also cooled by liquid nitrogen to prevent vapourisation of the mercury#
This section of the apparatus was then ready for the adsorption- desorption studies to proceed, the break-seal into the catalyst vessel being broken by the included stainless steel ball at the appropriate time, which was at least half-an-hour after cooling the traps to ensure that all mercury vapour between the break-seal and the traps had been condensed#
8#3. THERMOSTAT.
The majority of experiments were carried out with the catalyst vessel theimostated at 25°C. A 40 litre water—filled tank was used to ensure adequate heat capacity# The water temperature was controlled by a Sunvic type TS3 R.C. thermostat unit switching a Robinson Flame lamp through a Sunvic type F102—3 9amP* capacity hot wire vacuum switch# The circuit diagram is shown in fig. 37• A.
stirrer powered by an electric motor, the speed of which could be adjusted by a 2,000ohm rheostat, was also provided. By this means
# |i ^ Q ^
the water in the thermostat was kept at 25 — tt C, the period of cooling between the maximum and minimum temperatures being normally of several hours duration and the heating time a few minutes#

-156-
8.4« MEASUREMENT OF HYDROGEN AND TRITIUM.
Measurement of the tritium and pure hydrogen intended for adsorption was accomplished by the lowering of the mercury in the appropriate cut-off to a point immediately below the valve, allowing the gas to diffuse into the section enclosed by taps T^, T^,T^ and T^ until a suitable pressure was registered on manometer M. The mercury was then raised to seal the valve. Since the cut-off inner tubes only were connected to the manometer section, and since the valves at their lower ends were permanently closed after the storage bulbs had been filled, this section was of constant volume< thus subsequent raising of the mercury had no effect on the pressure of gas already measured, although minor pressure adjustments could be made by varying the height of mercury in the side aim attached to one of the cut-offs (fig. 29 ). Noimally the mercury in this side arm was kept at a constant height by increasing the pressure in the conical flask slightly above atmospheric, thus causing the
mercury to close a ground glass ball valve VI.Tap'T^ was then opened to allow the gas to expand into the
section X between T * and ball valve V3 situated in the side arm of4Toepler pump PI. This section had been approximately calibrated,
its volume being 3cm , and was used as a gas pipette. After closing tap T^ and lowering the mercury in Toepler pump PI below the bottom of the side arm U—tube, the gas in the pipette was expanded into the McLeod gauge section. This was then sealed by raising

-157-
the mercury against "ball valve V4, the gas heing confined in section Y (fig* 30 ), which had been accurately calibrated, using the McLeod gauge 61. The quantity of gas in the section was precisely determined by pressure measurement, this being normally about 40cm^mm corresponding to an original Manometer reading of l*5cm*
Tap Tg was then turned anti-clockwise through 90°> so that by operating Toepler pump P2 a volume of this gas could be transferred to the Pirani gauge section which was connected to the catalystvessel via Tg. Two strokes of the Toepler pump transferred about
330cm mm of gas, the pressure of the residual gas in the McLeod section, which was afterwards pumped away through T^, being measured after returning Tg to its original position. The quantity of gas admitted was then accurately known, and this was allowed to adsorb on the film by breaking the seal into the catalyst vessel with the enclosed steel ball. Adsorption was very rapid and was monitored by the Pirani gauges, which indicated when the pressure had returned almost
to the original low value.Successive aliquots of gas could be added in a similar way
until either a satisfactory volume of gas had been adsorbed by the surface, or until the Pirani gauges showed a residual pressure, indicating that the surface was saturated. In such cases the unad— sorbed gas was immediately pumped back into the McLeod section by Toepler pump PI, after suitably arranging Taps Tg and T^, and the total residual gas pressure measured in the usual way. This latter measurement involved the use of calibrated volume Z which was the

-158-
same as volume Y minus the volume between T^ and ball valve V5. By this method the pressure of gas admitted to the McLeod section and subsequently to the nickel surface could be varied between very wide limits. These limits were governed firstly by the rate of diffusion of hydrogen or tritium through the cut-off valves which set the minimum pressure obtainable in the manometer section, and secondly by the pressure measuring limits of the McLeod gauge. In normal circumstances, however, the percentage of hydrogen or tritium adsorbed could easily be varied between 10$ and 90$> of the total adsorptive capacity of the film. Moreover, hydrogen or tritium aliquots could be chosen at will by pumping out the gas already occupying the manometer section and replacing it by the otherj hence the order of admission of samples of each gas could also be varied.
A modification of this procedure was necessary when it was required to adsorb oxygen on the films. Oxygen for this purpose was stored in a 2 litre bulb controlled by tap T,.. Before measuring out a quantity of oxygen, the McLeod gauge mercury was raised to close V5, this merely to reduce the volume of the section, Taps T^ and T^ were closed and the mercury in PI lowered below the cut-off. Oxygen could then be admitted to the manometer section via T^ by opening Tp. carefully and reading off a suitable pressure on the manometer.Tap T^ was then operated to isolate the gas in the manometer section and allow the residual oxygen from the other regions to be pumped away. Aliquots of oxygen could then be measured in the usual way.
The desorption stage of the experiment was initiated by

-159-
203allowing the Hg vapour to enter the catalyst vessel. The resultant slow build up of pressure due to the desorbed tritiated hydrogen was followed by the Pirani gauges. The desorbed gas, on
the attainment of a required pressure was pumped by Toepler P2 into calibrated section Z for exact pressure measurement by the McLeod gauge, Toepler PI was then used to transfer the gas to the gas counter, via tap T y for the determination of its specific activity.
8.5* TRANSFER OF GASES.
As already indicated, the transfer of hydrogen and tritium was performed by the mercury Toepler pumps PI and P2. Bach had a bulb capacity of 150ml. and was supported by the B24 joint of a 250ml. Quick-fit conical flask which contained the mercury, an extension tube from the lower end of the B24 cone attached to the bulb of the pump dipping below the surface of the mercury and reaching as closely as possible to the bottom of the flask. Above the bulb was fitted the ground glass non—return valve into the stem of which was sealed a billet of silver steel so that the valve could be held open by a magnet if necessary. To limit the rise of mercury a No .4 glass sinter was fitted at a suitable height above the valve, the same purpose being achieved in the pump side arms by ball valves V3, V4
and V6 at the same height as the sinters.Toepler PI carried a U-tube in the side arm, the purpose of
which has already been described. Its pumping functions were threefold. Firstly, it was used to pump the pure tritiated hydrogen or
-160-
pure hydrogen prepared as in 7.1 and 7.2, into the appropriate storage "bulb. For this purpose taps T^, T^ and T^ were closed and the McLeod gauge mercury raised to close V5. The prepared gas was then pumped through T^ into the manometer section via T^ and hence into the storage bulb by way of the appropriate cut-off. The maximum obtainable pressure in the manometer section, and consequently in the storage bulbs, was thus limited to the difference in height between atmospheric pressure and the distance between the Toepler sinter and the surface of the mercury in the conical flask, since the mercury was raised in the pump by admitting atmospheric pressure to the flask. It was noticed occasionally during the pumping process that smearing of the glass by the pump mercury occurred. This was traced to very finely divided magnesium oxide which was carried into the pump by the gas stream, and it was to check this that the precaution described in 7*1 was taken. Although the behaviour of the mercury returned to normal at the conclusion of the tritium preparation, the impurity concentrated at the lower end of the Toepler pump dip tube, nonnally at the level the mercury attained in the conical flask when the pump was at the top of its stroke. This had the effect later, of lowering the surface tension of the mercury at that point, causing air to leak into the pump round the bottom end of the dip tube. This deposit was easily removed, however, by flooding the mercury surface,through the side arm in the flask, with dilute nitric acid, sucking this out and washing the surface several times with distilled water.
-161-
The second purpose of this Toepler pump was for filling the gas counter with hydrogen to the appropriate pressure, and this process will he described in 8.7» The third function of PI was to
transfer each sample of gas desorbed from the catalyst surface from the McLeod section Z to the gas counter via T^. The quantity of
gas in these samples was of the order of 5 cm^mm, this being pumped into the counter section which contained gas at a pressure of 10 cm* It was found that under these conditions pumping efficiency was about 90$ and that this was obtained after about half-a-dozen strokes of the pump. Further pumping had little or no effect. The reason was that the gas pressure above the mercury seal of the non-return valve, coupled with surface tension effects in the mercury itself, prevented transmission of the very small quantities of gas being pumped last. To overcome this inefficiency, and for reasons given in 8.7, the residual lOJb of desorbed gas was transferred after mixing it with a quantity of counter-filling hydrogen. The procedure was to pump the gas initially using twelve strokes of the Toepler pump, mixing the residue with -g- cm of counter—filling hydrogen admitted from the manometer section via the 'gas pipette, and to pump this into the counter, again using twelve strokes of the Toepler.This technique reduced the transfer error to a calculated value much less than lj&. 'The transfer process was then completed oy raising the Toepler valve magnetically at the top of the twelfth stroke, thus allowing the .gases in the counter section to expand through the sinter into the Toepler bulb when the mercury was lowered to a point

-162-
just above the side arm entry* Raising and lowering the mercury in
this fashion with the valve held open, effectively mixed the counter gases, the mercury being raised against the sinter at the last
stroke to standardise the counter section volume before counting commenced*
Toepler pump P2 had three-way taps T^ and T^ associated with it in such a way that it could be used to pump gas either from the McLeod section to the catalyst section or vice versa.
During the adsorption process this pump was used to transfer an aliquot portion of gas from the calibrated section Y into the Pirani gauge region and hence into the catalyst vessel through Tg.It might be argued that the same result could have been achieved by simply expanding a measured quantity of gas from the McLeod section through a suitable tap into the catalyst vessel. The method employed, however, reduces the dead space in the catalyst vessel region to a minimum, and makes as much of the added sample as possible easily and rapidly available to the nickel surface, thus reducing diffusion effects due to differences in tube cross sectional area. Furthermore, since a precise quantity of gas could be completely transferred to the catalyst vessel section, the very small residual pressure left after each stage of the adsorption could be confined entirely to that region, obviating the need to pump it away between successive McLeod gauge measurements. Allowances for such residues are difficult to make since McLeod gauges are not sufficiently
accurate at the very low pressures involved (see

-163-
The actual gas pressure left in the McLeod section after each ad
sorption step was arranged to he of such a magnitude that any McLeod gauge error was reduced to a minimum. It was also desirable to pump desorbed gases from the catalyst vessel into an intermediate pressure measuring section of low volume in order to make the subsequent transfer of gas by Toepler PI into the counter as efficient as possible. It was also possible to measure small desorbed volumes of gas with greater accuracy since they could be isolated in the McLeod gauge section Z with a resultant amplification of pressuret this was the most important reason for making the section very compact.The fact that the gas could be concentrated in this small section also meant that a larger number of desorbed samples from each experiment could be assayed. Moreover, since the volumes of individual catalyst vessels varied to some extent, the need for calibration of the catalyst section volume at each experiment was removed.
A further advantage of interrupting the catalyst vessel-McLeod gauge region with a Toepler pump was that the desorbed gas could either be removed immediately from the proximity of the film, or left in the catalyst volume for a definite time, or until a suitable
pressure had been obtained, and then pumped away rapidly for measurement. Otherwise it would have been necessary to stop the desorption process before each McLeod reading, a procedure winch could not be effected instantaneously, otherwise the quantity of gas read on the McLeod gauge and the quantity actually pumped into the
counter would not have been the same.

-164-
Furtheimore, the volume Y used for measuring the gas for adsorption was identical, except for the small extra section, with the volume used for measuring the desorbed samples Z* Thus calibration of volumes was kept to a minimum and any small errors incurred in calibration would be common to both adsorbed and desorbed volumes*
About a dozen strokes of this Toepler pump were UBed to transfer a quantity of gas from the catalyst region, the Pirani gauges indicating when the residual pressure was sufficiently low* Again, to make pumping more effecient, and to ensure that small quantities of gas could be detected by the Pirani gauges, the catalyst volume, i.e* the volume of the catalyst vessel plus spiral trap plus Pirani gauges, was kept as small as possible.lt was, in fact, never more than 150cm . Since the pressure in the McLeod gauge section was always less than 2xlO~’ mm, gas could be pumped more efficiently with this Toepler pump into the McLeod gauge section than with PI into the gas counter*
8*6* A3MISSI0N OF MERCURY VAPOUR TO THE CATALYST VESSEL.203A small globule of Hg or ordinary mercury, was placed in
a 0*3cm diameter Pyrex tube connected between the catalyst vessel and the spiral trap S2 by means of a waxed B7 joint (fig* 31 )•This tube was of sufficient length to be immersed in a container of liquid nitrogen* A ball valve YJ was placed between this junction and the spiral trap, the stainless steel ball of which could be

-165-
reanoved to an accommodating side arm so that the valve could he kept open when required. Before the hreak-seal into the catalyst vessel was broken prior to the adsorption process, the mercury- containing tube was cooled in liquid nitrogen to stop the vapour
isation of the mercury, the vapour pressure of which at -197°C is -3about 10 mm. Time was allowed for the mercury vapour in the section
to condense either in the tube or the spiral trap, and the ball valve was left open for this purpose. The desorption process was initiated by removing the liquid nitrogen container from the tube containing the mercury, thus allowing it to warm up to roan tempeiv ature, and closing the ball valve by dropping the ball on to the valve seat. This effectively prevented mercury vapour from preferentially condensing in the cooled spiral trap, instead of diffusing into the catalyst vessel and considerably increased the desorption rate without, at the same time, preventing the diffusion of desorbed hydrogen or tritium through to the Pirani gauges. The normal desorption rate of hydrogen with the valve closed and the mercury at 20°C, was about 8am mm per hour, but when the valve was left open the rate fell by at least a factor of 5* ^ wasdesired to stop the desorption at any stage, for instance in the evening, the liquid nitrogen flask was again raised round the mercury tube and the ball valve was opened, again allowing the mercury vapour to condense not only in the tube but in the trap.The desorption process was therefore stopped more quickly. The ball valve was also raised when a sample of gas was to be pumped

-166-
out by the Toepler pump. The normal procedure during an experiment, if* it was not necessary to stop the desorption process before removing the gas, was to open the ball valve, pump the desorbed sample away with the Toepler pump until a suitably low residual pressure was indicated on the Pirani gauges, lower the ball valve and allow a further sample to be desorbed, the interruption to the desorption process lasting only about five minutes. If, however, it was necessary to pump the gas away immediately on desorption, the ball valve was left closed, since the diffusion rate of hydrogen through it was sufficiently rapid, and the gas pumped away by continuous operation of the Toepler pump, the object of which was to keep the pressure in the catalyst region below a maximum indicated by the Pirani gauges. When sufficient pressure of gas had been collected in the McLeod section, the desorption process was stopped by the method described, although pumping was continued for a period until desorption had slowed to a suitable rate. Desorption was restarted when continuous operation of the Toepler pump again became possible, the interruption in this case being of twenty minutes duration, which was the time taken to remove the last desorbed increments, measure the pressure of the sample, and transfer it to
the gas counter.
8.7. THE GAS COUNTER.
Standard gas counting techniques were used to determine the
specific activity of the gas desorbed from the films.

-167-
The gas counter cathode consisted of a copper cylinder 10 cm long and 2.1 cm in diameter, to which had been silver-soldered a length of 1 mm tungsten wire; this was later to be sealed through a glass envelope to form the electrical connection. The cylinder was highly polished internally and externally with Brasso-soaked cotton wool wound around a mandrel fitted in the chuck of an electric drill. The anode was made from 0.1 mm tungsten wire along which a piece of fine emery paper had been drawn several times to remove high spots which might have caused spurious discharges in the completed counter.
In ordef to reduce dead space and thus increase counter efficiency, the glass envelope was as closely fitted round the cathode as was compatible with the fact that the final sealing of the tube had to be carried out with the cathode in place without oxidising it. The anode was positioned lengthwise in the centre of the cathode tube, and was silver-soldered at either end to lengths of 1 mm tungsten, which were sealed through the glass to foim electrical connections. To reduce discharging, care was taken to ensure that the silver—soldered joints were outwith the cathode volume. The counter was connected to the apparatus by a B 10 joint
carried by a side arm fitted with a tap. (C, fig.30»)«The counter volume was calibrated with respect to the manometer
section. This was done since the manometer was to be used to measure the pressure of hydrogen which, when pumped into the gas counter by Toepler PI, would give a pressure of 8 cm. Calibration was done by
-168-
admitting carbon dioxide to the evacuated counter hydrogen bulb and, by opening T y allowing 8cm of carbon dioxide to fill the
counter and manometer sections. T^ was then closed and the gas in the manometer section pumped away. After a length of absorbent paper, tied round the tubing at a convenient situation on the manometer section, had been soaked in liquid nitrogen, T^ was opened. The carbon dioxide condensed in the cooled region of the tube until no residual pressure was indicated by the manometer. T^ v/as then closed and the necessary pressure of carbon dioxide was read off on the manometer when the cooled region of tubing warmed up.
The counter v/as filled to a pressure of 2cm with ethyl alcohol vapour, this being evaporated directly into the counter through T^, by warming the liquid nitrogen cooled alcohol bulb with the hand. The pressure of the alcohol vapour was read on the manometer. Tap T^ was then turned anti-clockwise through 90° so that the counter section, consisting of the volume between T^ and the Toepler sinter, the volume between T^ and T^, as well as the volume of the counter itself, contained 2cm of alcohol vapour. 5cm of counter filling hydrogen were then admitted through Tginto the manometer section and pumped by Toepler PI, through. T^, into the counter, the McLeod mercury having been raised and T^ and T^ closed to make pumping more efficient. Six strokes of the Toepler transferred the hydrogen into the counter, and the complete
filling was mixed by the pump.

COUN
TS
PER
MINU
TE
x 100
CO
UNTS
PE
R MI
NUTE
x
100
G A S C O U N T E R P L A T E A U . FIG. 32
~ r * — * >
/
i
101 -------11 12 13 14 15 16 17 18
COUNTER VOLTAGE x 100
G A M M A C O U N T E R P L A T E A U . FIG. 33
490350 400 450COUNTER VOLTAGE

-169-
The counter plateau was determined by admitting a sample of tritium and taking one minute counts at 25 volt intervals, the results "being shown in fig. 32 for the most commonly used counter, a very long shallow plateau being obtained. Three counters were used in the course of the work, each having essentially the same characteristics. During the course of the desorption the counter was surrounded by lead bricks 1 thick, and a background count was determined over at least a half-hour period, this being subtracted from the count rate obtained from the first desorbed sample.Since the background was normally about 70cpm, and since the specific activity of a desorbed sample was at least this value per3cm mm, a difference of several hundred counts per minute was
obtained, this also being the difference in count rate between subsequent added samples. Counting was continued after the addition of each sample until the expected statistical error was at the most 1$, and in most cases, less, since counting was carried out over ten minutes and longer at the lower count rate. In each case a repeat count was taken over the same period, the first being accepted if the second was within 1$. If this was not so, further counts were carried out until concordant results were obtained#
If it became necessary to clear the McLeod section, the provision of made it possible to pump a fresh desorbed sample into the volume between Tn and the Toepler sinter whilst counting of the previous sample was proceeding, T^ being opened and the gases mixed in the usual way at the appropriate time. was only
-170-
opened when it was absolutely necessary, to prevent mercury vapour alloying with the cathode, which may destroy the plateau ashappened with one counter (74)• The trouble did not recur whenthis precaution was taken.
The method of adding desorbed samples to the counter was described in 8.5? the residues being added along with counter hydrogen. Since the maximum number of samples pumped into the same counter filling in any experiment was twelve, the maximum increase in pressure obtained in the counter would be 0.5 cm.K.C. Campbell (74) studied the effect of varying the pressure ina similar gas counter, and found that increased pressures movedthe plateau to higher voltages, but that the shift corresponded to only 20 volts per cm increase in pressure. The counter described had a 1400 volts operating voltage associated with a plateau 300
volts long with a slope of 1 fo9 so that the effect of this increase, amounting in any one filling to a maximum of 0.6 cm, would be negligible. This was borne out by the blank determinations
described in 9*4*
8.8. CONTINUOUS ESTIMATION OF ADSORBED MERCURY.
20%g, a gamma emitter, was used to displace adsorbed tritiated hydrogen from the nickel films. By using the following counting technique, the arrival of mercury vapour at the surface could be followed and related to the rate of desorption of hydrogen and tritium.
The counting technique employed for this purpose was devised

-171-
by Campbell and Thomson (16), and was such that estimation ofmercury could proceed without interruption of the desorptionprocess. A gamma counter G (fig.3l) was arranged parallel to,and in contact with, the catalyst vessel and was screened from the 203Hg source H by enclosing the latter in a lead cylinder of wall thickness -g”. In order that activity on all parts of the film could be detected, the counter chosen, a Mullard type MX120, was such that the complete length of a nickel film could be accommodated within its working section. The cathode of this counter was a stainless steel cylinder 17*5 cm long and 2.2cm in diameter, and the filling was a neon-argon mixture with bromine as the quenching agent. The counter plateau is shown in fig.33.
The experimental technique involved counting the mercury activity for ten minutes immediately a desorption stage was commenced, and relating the observed activity to the tritium activity and total volume of desorbed hydrogen obtained to the end of the previous desorption stage. This obviated the need to stop the desorption process between successive steps. The technique was valid since only a measure of the relative increase in mercury activity was desired, and no attempt was made to correlate the exact amount of mercury vapour adsorbed with the amount of tritium desorbed since this had already been investigated in detail by Campbell and Thomson (16). Differences in.radial distribution of the nickel, which would presuppose radial differences in the amount of mercury adsorbed, were also of no consequence for this reason. Relatively

-172-
large statistical errors were initially incurred in the count rate since mercury activity from the films was at first low,
and since it was necessary to count for a comparable period in each case, which had to be short because of the ever changing amount of adsorbed mercury* Since, again, only an indication of the relative increase of count rate was necessary, these errors were acceptable#
The ancillary counting equipment used was the same as for the gas counting experiments* The counter was connected via an Ericsson Telephones Ltd., type 110A probe unit with a 500 microsecond paralysis time, to an Ekco Electronics type N529B scaling
unit*

-173“
CHAPTER 9.P R E S S U R E G A U G E S .
9.1* MoLEOD GAUGE.
Details - The mercury filled McLeod gauge was used for measur- ing the pressure of adsorption samples contained in volume Y and of desorption samples in volume Z. Since it was necessary to measure these with the highest possible accuracy, a McLeod gauge was chosen for the purpose, this having the added advantages of simplicity of construction and of being independent of the presence of mercury vapour. Again, since the same unit could be used in both steps of the experiment, any inherent errors in the absolute measurement of pressures would be common to both adsorption and desorption increments and the overall experimental error in the relation of desorbed volumes to adsorbed volumes thus reduced. Since the function of the gauge depends on the application of Boyle’s Law and since the deviation of hydrogen from Boyle’s Law at low pressures is slight (ref .80 ), a further justification for employing a McLeod gauge was
provided.The size and compression ratio of the gauge were determined
from the ma-ri mum and the minimum pressures of gases to be used in the experiments, taking into account the volumes of the associated sections Y and Z and the need to ensure adequate amplification of the lowest pressures to a value that could be read accurately by
the instrument.
-174-
As mentioned before, measurement of pressure on a McLeodgauge depends on the application of Boyle’s Law. If the volume
3m can of the gas trapped in the gauge at the unknown pressure2p cms is Vq, and if A cm is the capillary cross sectional area,
and h the difference in height between the mercury columns in the closed and comparison limbs, then Boyle's Law gives
p(VQ - hA) = Ah x h2 2 i.e. p = Ah N - Ah = Ah N since the volume ' o ' o
of the capillary is small compared with V •This formula assumes that the meniscus in the comparison tube
is raised to the same level as the end of the capillary in the closed limb each time. If this is not done, the formula becomes
p = A ^ x h2)/VQ where h^ is the distance between the end of the capillary in the closed limb and the meniscus in that limb, and h2 is the difference in heights of the menisci. Factors influencing the reliability of McLeod gauge measurements are the accuracy with which h^ and h2 can be determined, and also the accuracy of the calibration.
Discrepancies in measuring true values of h^ and h2 arise because of capillary depression (81). Porter (82) showed that this increased with decreasing capillary diameter, and was caused by variation of the angle of contact between the mercury and the glass. This angle could vary between 30 and 60 in a gauge in which the mercury and the glass were perfectly clean.

-175-
Rosenberg (83) and Klemperer (84) showed that roughening the inside of the capillaries, for example by using a mild abrasive
such as ^ 2^3 considerably reduced the error.Further causes (86) are slight oxidation of the mercury after
exposure to air and the state of cleanliness of the inside surface of the tubes, error being caused, for instance, by the presence
of adsorbed water vapour as well, of course, as by the presence of a more obvious contaminant. It is, then, of the uibmost importance to ensure that the glass and the mercury are initially perfectly clean, and to allow air to come into contact with the interior of the gauge as seldom as possible once it has been evacuated and de-gassed.
"Figures quoted (87) for the errors to be expected from carefully constructed McLeod gauges show that the error due to capillary depression becomes increasingly important at pressures below 10 inm, at which pressure it is of the order of — 2$ and very much
higher at lower pressures.The capillaries in the gauge used were constructed from 0.15cm
diameter tubing, this being considered a suitable compromise,bearing in mind the increasing error incurred with narrow bores and the need to make h^ and h2 as large as possible to reduce errors in their physical measurement. It was decided to employ Veridia Precision Bore tubing supplied by Chance Brothers Limited, Birmingham, which has a tolerannce of — 0.01mm in bore diameter and a low coefficient of expansion. Another advantage of this product is that, because

-176-
of the manufacturing method of collapsing the glass on to a mandrel of precise diameter which is then dissolved away, the bore is left with a somewhat translucent, roughened finish and is therefore,
ideal for the construction of McLeod gauges to Rosenberg's recommendation* The closed limb of the gauge was made from a 17cm length of this tubing, the closed end being formed by collapsing the glass inward by turning the tube rapidly in a soft oxygen blow pipe flame. Care was taken to apply the flame to as short a length of the tubing as possible, since the etched appearance of the glass disappeared in heating to a sufficiently high temperature and, of course, the possibility of distorting the tube had to be avoided.At all events it was easy to see which parts of the tube had been heated in this manner because of its changed appearance and these parts were always kept outwith the range of the mercury levels in the gauge. The end of the capillary assumed a perfectly hemispherical shape when heating was continued for a sufficient length of time, the shape being checked for regularity under a microscope. No attempt was made to flatten the end of the capillary since this was considered too difficult to achieve precisely and a simple correction factor could be applied for the hemisphere. The tube was cleaned thoroughly by being left overnight in chromic acid solution. It was washed with a continuous stream of water introduced to the closed end by means of a fine capillary tube, the washing process being completed with distilled waterj the tube was dried in an air oven at 100 C.
Before glass-blowing the tube on to the bulb of the gauge, it
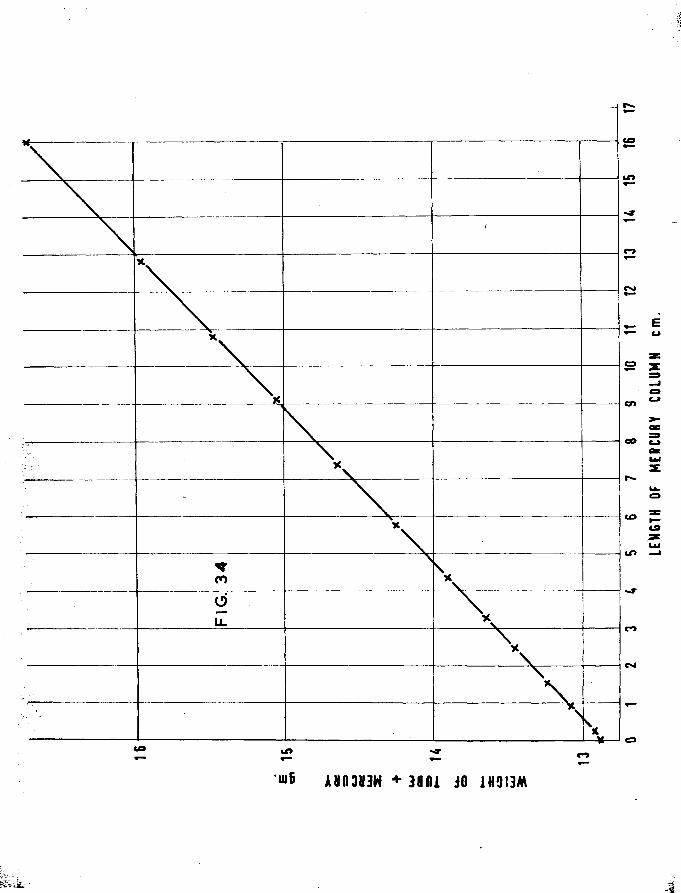
CO
CO
Cvl
40
“ 8 A V R 3 H 3H ♦ 3 1 0 1 30 1 H 9 I 3 M
LENG
TH
OF ME
RCUR
Y CO
LUMN
cm
.

-177-
was decided to check the hore for linearity and constancy of
diameter. This was achieved hy securely clamping a length of heavy gauge "brass angle in a vertical position, checking it for vertical- ity in both planes by means of a travelling telescope. By lightly clamping the tube in the angle, it could quickly and repeatedly be set up in a vertical position. Linearity was satisfactorily confirmed
with the travelling telescope, and bore regularity was determined by weighing the tube empty, and then each time after adding a small increment of clean mercury through a fine capillary, the tube being set up in the angle and the total length of the added mercury column measured with a cathetometer. On plotting weight against length of the mercury column, a perfectly straight line was obtained (fig. 34)> from the slope of which could be determined the bore diameter (see Appendix A), this being calculated to be O.I5OO8 cm.
The closed limb was then fused to a 100 ml. bulb which carrieda B 24 cone and dip tube for fitting to the 25O ml. Quickfit conicalflask which was to contain the doubly distilled mercury. To simplifythe V calibration, and to decrease the chance of error, entry to the o 7bulb was restricted by a 2 cm length of 0.5 can diameter tubing, fitted by a ring seal between the bottom of the bulb and the B 24 cone. The side arm of the gauge carrying the compensating limb (cut, incidentally, from the same length of tubing as the closed limb), was joined immediately below this ring seal (see 01, fig.30). Before calibration , the entire gauge, including the side arm, was filled with chromic acid solution and left overnight, the chromic acid then being thoroughly

-178-
washed out by a stream of water admitted via a fine capillary tube extending to the end of the closed limb, and the washing process
completed with distilled water. After being dried overnight in a steam oven, the gauge was calibrated by being weighed empty, and then filled with conductivity water to the end of the bulb con
striction tube. The volume V was calculated from the volume andotemperature of the water filling the gauge. The calculation is shown in appendix A.
Before use, the gauge was pumped out for several days until sticking vacuum was obtained when the mercury was raised} whilst in use, the mercury column rose steadily in both the closed and compensating limbs, and the curve of the meniscus, when viewed through the cathetometer, appeared to be reasonably constant in the usable
parts of the tubes.Once evacuated, the gauge was opened to atmosphere only when
absolutely necessary for re—greasing taps, and care was also taken to raise the mercury against its limiting valve V5 during preparation of the hydrogen or tritium to prevent contamination of the mercury. Air or alcohol vapour or any other possible contaminants were
excluded.

-179-
9.2. CALIBRATION OF McLEOD GAUGE SECTIONS Y AND Z.
Calibration of these volumes (fig. 30) was carried out by the McLeod gauge and, at the same time, an assessment of the accuracy
and reliability of the gauge was obtained. A pressure of hydrogen, found by trial and error, was measured into the manometer section, such that when a quantity of gas was admitted to the appropriate McLeod volume via the gas pipette, the maximum permissible reading was obtained on the McLeod gauge. If the manometer reading was about 1.7 cm, the resulting pressure of gas in volume Y would be 2.8x10“ ■*mm approximately, which gave a corresponding closed limb reading of about 15 can.
The mercury was always raised very slowly until it had reached the cut-off tube below the bulb, to prevent surging of the gas, and was allowed to rise until the meniscus in the compensator limb was about 0.5 cm below the end of the closed limb, i.e. well clear of the portion which had been heated to effect the upper bend in the compensator tube. The maximum permissible reading in the closed limb was also determined by the need to ensure that the mercury level came to rest above the section which had been heated during the joining of the limb to the bulb. The maximum pressure which could be read by the gauge was thus about 3x10 \am. When the mercury levels had come to rest, each limb was tapped gently several times to ensure that the menisci had assumed their optimum positions, in all cases a slight fall being obtained, and the levels read by a cathetometer.
During calibration of the appropriate section, the gas external

-179a-
to the gauge was pumped away, and the mercury in the gauge lowered
to allow the trapped gas to expand into the required volume* Raising the McLeod mercury trapped a proportion of this gas, the gas excluded from the gauge again being pumped away to ensure comparable measurement conditions each time, although in fact, comparison of readings before and after pumping this away showed that only a minute difference in the readings occurred. This process was repeated about adozen times until the pressure measured by the McLeod gauge was
—2about 1*8x10 mm, which was lower than the minimum pressure read12during any desorption process, this being approximately 2.6x10 mm.
The maximum and minimum values obtained for the calibrated volumes differed by 2$, and the error could be reduced to less than 1$ by careful manipulation, and in certain repeat calibrations the error was less than 0.4$. Variations in air temperature during the several repeat calibrations had no detectable influence on the results.
Both standard volumes were calibrated in this way, using results from experiments which showed the least variation. A "volume factor" was then worked out for each, so that when it was necessary to measure the quantity of gas in one of the' sections, h^ and hg were measuredand their product multiplied by the appropriate factor, this giving
3the quantity of gas in cm mm.The hemispherical end of the closed limb could be allowed for
in these calculations since the volume of a hemisphere equals the volume of a cylinder of the same radius and of height two thirds the

-180-
the radius of the hemisphere. The correction factor was applied by subtracting l/3 of the bore radius from h^, i.e. 0.025 nim. The error incurred without making this correction was, in any case, only in the smallest volume of gas measured.
Representative results and the calculations of the volumes are given in Appendix A.
9.3. THE PIRANI GAUGES.
It was desirable to have a means of monitoring gas pressure in the catalyst section of the apparatus. Ideally any gauge used had to be of low volume to reduce dead space, and had to be capable of providing a direct and preferably rapid pressure reading.Pirani gauges were thus designed which provided a dynamic indication of pressure, and these proved indispensible for the following of the adsorption and desorption processes involved in the experiments, where the pressure in the catalyst vessel was constantly and
progressively changing.During the adsorption process uptake of each increment of gas
admitted to the catalyst vessel could be watched by observing the galvanometer light beam returning rapidly to its zero position after being deflected when the gas was admitted. Immediate indication when the surface was saturated could thus be obtained, as could information of any further slow sorption process which might occur from the
residual gas.A direct indication of pressure in the catalyst vessel was par
ticularly useful during the desorption process. At the commencement
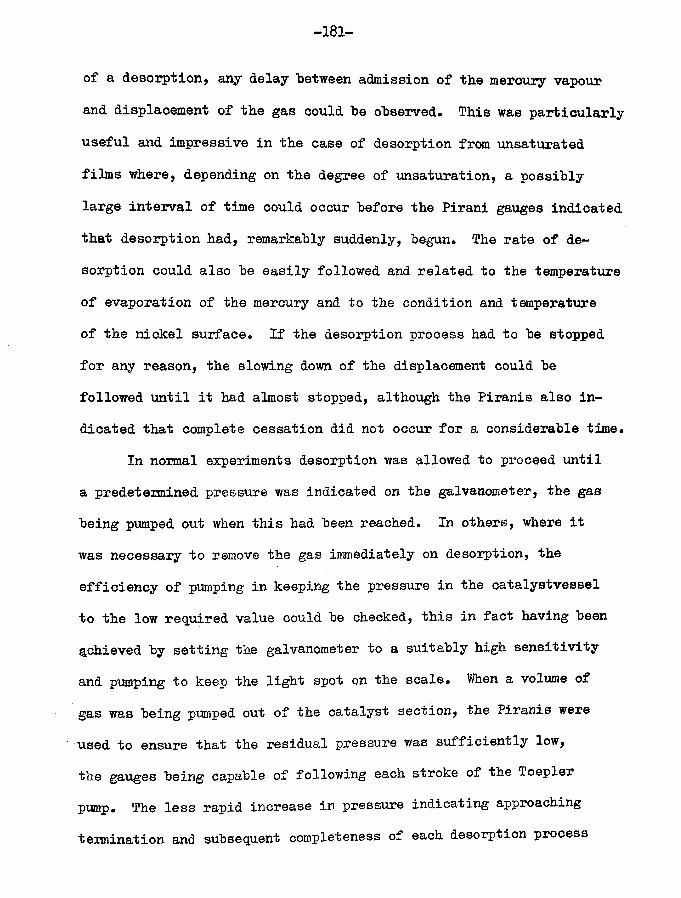
-181-
of a desorption, any delay between admission of the mercury vapour and displacement of the gas could he observed. This was particularly useful and impressive in the case of desorption from unsaturated films where, depending on the degree of unsaturation, a possibly large interval of time could occur before the Pirani gauges indicated that desorption had, remarkably suddenly, begun. The rate of desorption could also be easily followed and related to the temperature of evaporation of the mercury and to the condition and temperature of the nickel surface. If the desorption process had to be stopped for any reason, the slowing down of the displacement could be followed until it had almost stopped, although the Piranis also indicated that complete cessation did not occur for a considerable time.
In normal experiments desorption was allowed to proceed until a predetermined pressure was indicated on the galvanometer, the gas being pumped out when this had been reached. In others, where it was necessary to remove the gas immediately on desorption, the efficiency of pumping in keeping the pressure in the catalystvessel to the low required value could be checked, this in fact having been achieved by setting the galvanometer to a suitably high sensitivity and pumping to keep the light spot on the scale. When a volume of gas was being pumped out of the catalyst section, the Piranis were used to ensure that the residual pressure was sufficiently low, the gauges being capable of following each stroke of the Toepler pump. The less rapid increase in pressure indicating approaching termination and subsequent completeness of each desorption process

-182-
were also demonstrated.
Lastly, since these instruments were extremely sensitive, any slight leak in the catalyst vessel or in fact in any part of the apparatus, could be detected and easily checked visually by opening the appropriate part of the apparatus to the Pirani section. Completion of de-gassing, for example of the catalyst section after the new vessel had been fitted, could also be visually indicated in this manner.
The function of Pirani gauges depends on the fact that the heat conductivity of a gas at low pressures decreases linearly with pressure, hence the heat conducted away from the filament and thus its temperature, varies with gas pressure, the resistance of the filament altering in proportion.
Ellet and Zabel (ref. 88 ) showed that the sensitivity of such a gauge varied as the square root of the wire area, hence that the wire should be as long as was convenient and that a nickel filament could achieve greater sensitivity than the more usual tugnsten one. Moreover, the nickel wire could be more easily flattened to provide a greater surface area. They also showed that the sensitivity could be increased by keeping the wall temperature of the gauge low, this being most noticeable if a galvanometer of low resistance was used, preferably of the same order of magnitude as the filament resistance. Also important are the temperature of the lead—in wires which conduct heat away from the filament and the method by which the fila
ment is supported (79)*The/
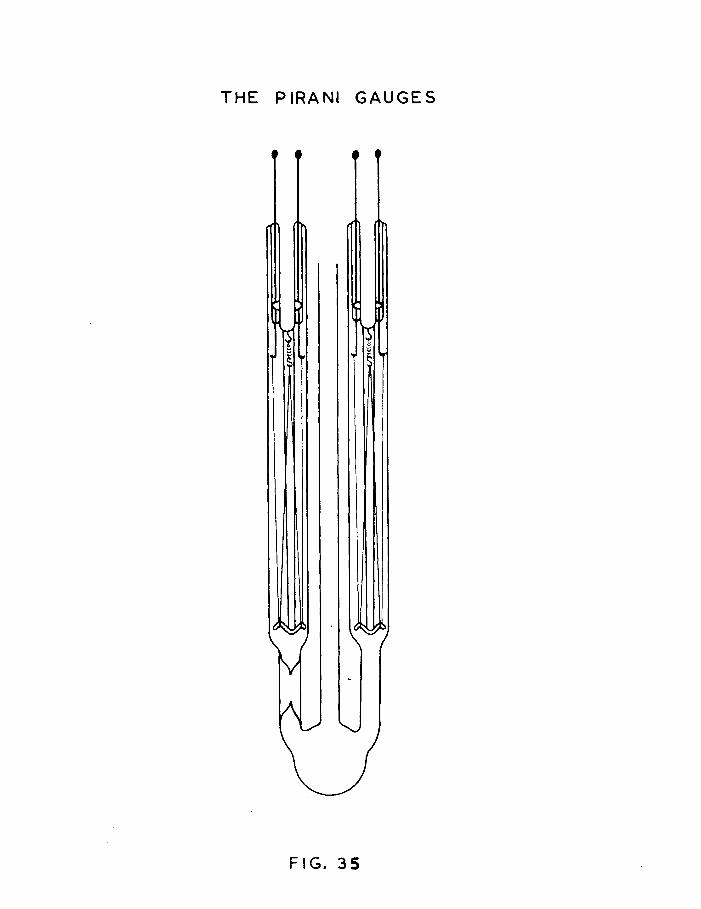
T H E PIRANI G A U G E S
F I G . 3 5

-183-
The gauges used owe their essential design features to those
used by Wardle, and Reasbeck et al (89,90), and were intended to
operate immersed in liquid nitrogen. They are shown in fig.35.
The filament consists of a 30cm length of nickel tape 0.05mm x 0.003mm
of resistance 100 ohms supplied by Johnson Matthey. The tape was supported at the centre point by a coil spring made from 0.01mm tungsten
wire supported between the tungsten lead-in wires, the filament being
taken from each side of this, down over a glass former and back up to the lead-in wires,, the ends of which had been bent into hooks and
coated with silver solder. Before soft-soldering the filament into
position it was tensioned against the spring by attaching 5gpi weights to glass hooks waxed to the free ends, which were allowed to hang
freely over the tungsten hooks, the tape then being soldered at the
points of contact with the tungsten, The purpose of this process
was to dampen the effect of external vibrations which were reported
to cause instability. Since, however, it is claimed that the wire
to wall distance in such a gauge is unimportant, it is most likely
that the vibration effects produced in early forms of the gauge
were caused by faulty thermal contacts between the filament and
its supports (91)•Trouble was experienced by the filament breaking at the point
supported by the spring. This was caused by the sharp angle at which
the nickel tape was bent over the very thin tungsten and the trouble
was cured by fitting a small glass hook between the spring and the
filament, thus increasing the radius of the bend. Care was also

-184-
taken to ensure that the filament was free from kinks since these also had a weakening effect.
Since it is important to maintain a sufficient length of the lead-in wires at a constant temperature to prevent variations in the filament temperature, due to conduction of heat along the wires, these were formed from lengths of 0.5mm tungsten wire arranged so that 2.5cm of their lengths were enclosed in the glass envelope of the gauge, cooling of the wires being achieved by arranging them to pass down the outside of a corresponding length of 0.4cm diameter glass tubing concentric with the Pirani envelope. This tubing formed a well in the top end of the gauge into which the liquid nitrogen could flowo The lower end of this tube carried the hook to which the tungsten spring was attached and also the glass filament former. The tungsten leads were sleeved with glass to the same length as this tube, and were supported on either side of it by fusing small beads of glass between the tube and the extreme lower end of each sleeve, in order to disturb as little of the original seal as was practicable (see 6.3)* The upper end of each sleeve was located when the external envelope of the gauge, consisting of a 12cm length of 1.2cm Pyrex tubing, was fused to the previously flanged end of the inner tube, the glass being melted around the upper end of each sleeve, again disturbing as short a
length as possible.Two such units were made, one of which carried a constriction
at its lower end for subsequent sealing off, since the gauge was to

-185-
act as compensator for the other. They were mounted close together vertically with the tube connecting them to the catalyst section of
the apparatus joined at their lower ends so that the mercury vapour would be condensed before gaining access to the gauge since there was the danger of mercury alloying and thus weakening the soldered joints, and also the possibility of short-circuiting the filament if sufficient mercury condensed in any part of the glass supports.
After the gauges had been de-gassed by being evacuated, and the constriction at the lower end of the compensator de-gassed by being heated several times with a soft glass blowing flame until no further pressure rise occurred, and after testing the tungsten leads for freedom from leaks, the constriction was sealed and the gauges were ready for use.
In operation the gauges were immersed in liquid nitrogen to maintain the required steady, low wall temperature, care being taken to ensure that the complete gauge was immersed together with a reasonable length of the lead-in wires. For this purpose a narrow necked Dewar flask was ideal, since the rate of evaporation of liquid nitrogen from it was far lower than from a conventional flask, this being aided by the ice which formed at its open end round the lead-in wires. Ho trouble was ever experienced from instability due
to a temperature variation.The filaments were heated by current from a lead acid accumul
ator, used for the stability of its output, the voltage being set at 1 volt by a 250ohm potentiometer, this being sufficient to maintain

PIRANI GAUGE CIRCUIT
IG. 36
IG 37 T H E R M O S T . C IR C U IT
HOT WIR^ VACUUM SWITCH
NEON
N
UJHEATER
LTHERMOSTAT

-186-
them at about room temperature, yet giving an adequate temperature gradient between the filament and the wall. The gauge P, and its compensator C, formed two of the arms of a balanced Wheatstone bridge circuit, which was used to measure the out-of-balance current obtained as gas pressure in the gauge varied. The circuit, components of which were mounted on a Paxolin base, is shown in fig.36. The potentiometer R^, used for adjusting the out-of-balance current, was a 50 dhm close tolerance unit supplied by Beckman Instruments Ltd., the resistance tolerance being -1$, and the linear tolerance -0.1$. The 12 ohm resistor R^ had a 5$ tolerance. R^, a 200 ohm close tolerance Beckman potentiometer of - 3$ resistance
•j* >tolerance and -0.25$ linear tolerance, was provided for initially balancing the bridge, this being found more convenient than using combinations of fixed resistors, the tolerance of the potentiometer being better, in any case, than that of the usual fixed resistor. Both potentiometers were 10 turn instruments, and were fitted with multi turn indicating dials reading to 0.01 ohm. The galvanometer (G) used was a Pye Scalamp Galvanometer 79^l/S, with a nominal resistance of 24 ohms; the sensitivity could be varied in five steps by built-in shunts. This instrument proved to be of more than adequate sensitivity when used with the described circuit, the two most sensitive shunt positions never being necessary.
The circuit was initially balanced with the gauge at sticking—6vacuum on the McLeod gauge, about 10 mm, by adjusting Rg so that R^
was zero with respect to the Rg arm of the bridge, thus making the

-187-
comp let e range of available for the measurement of bridge
out-of-balance current. For quantitative purposes, to give the most accurate measurement of differences in the resistance of the filament, the value of R^ could be chosen so that the full range of
R^ corresponded with the maximum pressure the gauges were capable of registering; i.e. the maximum out-of-balance current had to be adjusted so that it was just accommodated by the full range of R^* This was altered to the value in the diagram since it was decided to convert the gauges to direct reading instruments, using the least sensitive scale of the galvanometer, the resistance value chosen giving a half scale deflection from the central zero, useful for estimating qualitatively the pressure of desorbed gas in the catalyst vessel, and being also suitable for monitoring adsorption* The value of R. necessary for this was much smaller than that re-
T
quired to enable the full range of R^ to be used, because a greater deflection could be obtained on the galvanometer by decreasing the Pirani resistance/R^ ratio, since any variation in the Pirani resistance would cause a greater relative difference in the r$tio, and hence a greater relative difference in out—of—balance current flowing.
If a more sensitive range was required, the third shunt position was chosen, R^ being adjusted to bring, and keep, the spot on the scale* For experiments where the gas was pumped off mimed— iately on desorption, this scale was used, the spot being zeroed at the left hand end of the scale and pumping speed adjusted so that it travelled no further than the extreme right of the scale.

-188-
Hence, although the Pirani circuit was initially correctly adjusted, and the instruments calibrated for hydrogen against the McLeod gauge, the gauges were used only qualitatively since the
McLeod gauge was considered more reliable for quantitative purposes. Zero drift, common to Pirani systems, was however, negligible and the only drifting which occurred was at higher gas pressures after the instruments had been in constant use for many hours.
9.4. ESTIMATION OF THE ERROR INCURRED IN THE MEASUREMENT OF THESPECIFIC ACTIVITIES OF THE DESORBED SAMPLES.
Although statistical errors to be expected from tritium counting and those incurred in the McLeod gauge measurements could be estimated separately, it was desirable to obtain a value for the overall error which was likely to have arisenduring the course of the experimental determination of the specific activity values.
A series of blank experiments was carried out which simulated the transfer of the desorbed samples from the catalyst vessel into the McLeod gauge section, and subsequently into the gas counter.For this purpose a sample of tritiated hydrogen from the storage bulb was transferred to the volume provided by the Pirani gauges and spiral trap S^, i.e. to the section of the apparatus to which the catalyst vessels were normally attached. The pressure of this gas was chosen such that, on opening tap T^ to the McLeod gauge section, the amount of gas expanded into calibrated volume Z (fig.30) was about 5 6 cm^mm, which was of a similar order to that of thedesorbed samples. After the pressure of such a sample had been

-189-
measured, it was transferred into the gas counter in the usual way,
using initially twelve strokes of Toepler pump PI, the resulting•jresidue in the McLeod section "being mixed with 3 cm of counter
filling hydrogen at 5 to 8 mm pressure and pumped into the counter by a further twelve strokes of the Toepler pump. The gases in the counter volume were then mixed and the count rate determined, counting again being continued for 10,000 counts at low count rates, or for ten minutes at the higher rates. Repeat counts were in this case not taken since it was desired to determine the maximum error incurred. Subsequent aliquots of tritiated hydrogen were withdrawn from the catalyst vessel section, and added to the gas counter filling until the total count rate had reached a reasonable value.
This procedure determined the error involved, firstly, in measuring the pressure of each sample, secondly, in transferring it to the gas counter, and thirdly, in the counting technique.Three such determinations were made altogether, and the results
obtained are shown in Table 25•The calculation of the standard deviation is as followst- Let r = the time residual from the arithmetic mean;
t ' = the residual from the working mean;a = the difference between the true and working mean;
n = the number of results.
Then r1 = r + a5Kr')2=Z(r + a)2
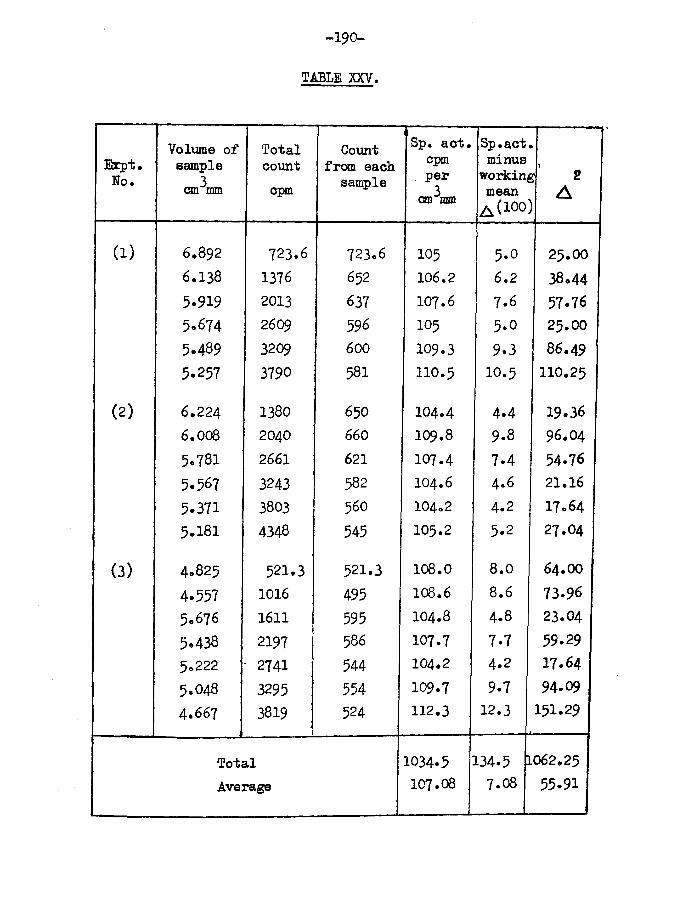
-190-
TABLE XXV.
Expt • Eo.
Volume of samplecan mm
Totalcountcpm
Count from each
sample
Sp* act. cpm percm^mm
Sp.act,minusworkingmean
a (100'A
(i) 6*892 723.6 723.6 105 5.0 25.006*138 1376 652 106.2 6.2 38*445.919 2013 637 107.6 7.6 57.765.674 2609 596 105 5.0 25.OO5.489 3209 600 109.3 9.3 86.49
5.257 3790 581 110.5 10.5 110.25
(2) 6.224 1380 650 104.4 4*4 19.366.008 2040 660 109.8 9.8 96.04
5.781 2661 621 107.4 7.4 54.765.567 3243 582 104.6 4.6 21.16
5.371 3803 560 104.2 4.2 17.645.181 4348 545 105.2 5.2 27.04
(3) 4.825 521.3 521.3 108.0 8 .0 64.OO4.557 1016 495 108.6 8.6 73.965.676 1611 595 104.8 4.8 23.045.438 2197 586 107.7 7.7 59.295*222 2741 544 104.2 4.2 17.645.O48 3295 554 109.7 9.7 94.094.667 3819
1524 112.3 12.3 151.29
Total 1034.5 134.5 1062*25
Average 107.08 7.08 55.91
-191-
** 2 (r^ + 2ar + a2)
= 5 ( r)2+ 2 a X (r) + na2i.e. X ( r ) 2= 2.(r’)2 - 2aX(r) - na2Since N = If + r for any specific activity value
where N is the observed value and
1 is the true value
and 2 N ■ nN + X (r)but N = F/n and hence (r) ® 0thusX(r)2 = X (rf )2 - na2i.e. from the tabulated values
■S (r)2 = 1062.25 - 952.5
= 109.75. 109.75 +
r - 1 - j f - = - 2 . 4
This is - 2.2455 of 107.08.Hence standard deviation in specific activity determinations
= ^2.2455

-192-
APPENDIX A.(1) Calibration of McLeod gauge volume
Weight of McLeod gauge + distilled water Weight of McLeod gauge empty
weight of water filling gauge Temperature of water Density of water at 21°C Density of water at 22°C •• corrected volume Vo(2) Calculation of capillary bore diameterProm fig. 34 weighty of ynercury
slope of graph * length of mercury column (cm)
w = Q 1A where (>
A
q> 1 TT a2/4 a
i.e. d = 4wQ IT
227.41 m108.00 gn119*41 && 21.4°c0.99802 gm per ml.0.99780 gm per ml.
119.2 cm3
= density of mercury= length of the mercury
column= cross sectional area of
the capillary= capillary bore diameter
The values of w and 1 may be obtained from 2 points on the gp?aph
e.g. points 4 and 13.w = 16.7164 - 13.2374 = 3.479 m 1 = 16.026 - 1.558 - 14.47 ™
a m 0.15008 cm

-193-
(3) Calculation of the calibrated volumes Y and Z.
Volume Z(a) McLeod gauge readings
= (15.314 - 0.025) - 0.910
= 14.38 cm
A(bh &o) Av 1 x 2
h2 * 14.336 - 0.910= 13.43 cm
22 _ OjOa _ 14.38 x 13.43.. p * v 7 x ”1 6 x 119.2 mo
(L) McLeod gauge readings^ = (15.314 - 0.025) - 2.578
- 12.71 cmh2 * 14.336 - 2.578
= 11.76 cm22 0.09 _ 12.7 x 11,•• p = 7 x “I T " x 119.2
By Boylefs Law
x 0 ^ x ,14.^13.,4.3 x 119.2
22 x 0 x 12-7 * 11-76 l Z 7 1 T 6 119.2• • Z = 154.0 cm3
Similarly Y = 157*0 cm311 ii(4/ Calculation of volume factors .
Section Z3It was desired to measure quantities of gas in an at 1 mm
pressure.
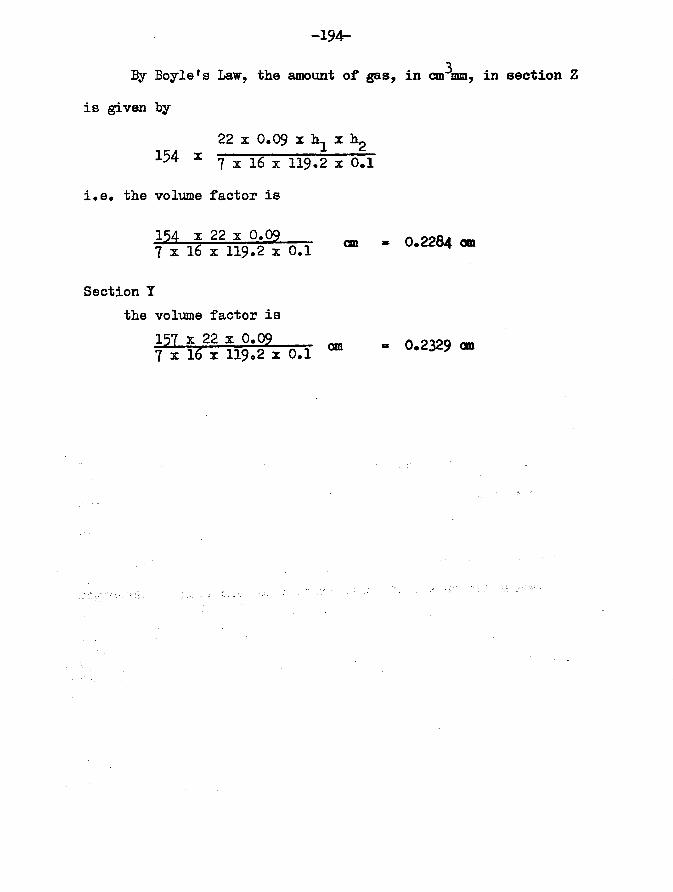
3By Boyle's Law, the amount of gas, in cm mm, in section Z
is given by22 x 0.09 x h^ x hg
154 x 7 x 16 x 119.2 x 0 .1
i.e. the volume factor is
154- x 22 x 0.09 7 x 16 x 119*2 x 0.1 cm 0.2284 om
Section Ythe volume factor is

-195-
APPMDIX B.
As described in Chapter 7> mercury cut-offs were provided on the pure hydrogen and tritiated hydrogen storage bulbs, so that large volumes of gas could be stored for a considerable time without risk of contamination by leakage of air through taps.
The construction of the cut-offs was such that, however, if it was necessary to remove any of the taps T^ to T^ for regreasing, air entered the storage bulbs. To prevent this, in the case of T^ and T^, ball valve V2 was provided. Before removing T^ or T^ for regreasing, was closed magnetically andT^ was opened so that the manometer section was connected to the rotary pump. If atmospheric pressure was then admitted via T^ or T^, the leakage of air past V2 was such that the rotary oil pump could maintain a pressure of about 1cm in the manometer
section.Suitably disposed valves would also enable T^ or Tg to be
regreased without risk of contamination to the stored gases.

-196-
REFERENCSS.
1. Taylor, Proc. Roy. Soc., 1925, A108, 105. J.Phys. Chem., 1926, 30, 145.
2. Pease and Stewart, J.A.C.S., 1925, £[, 1235.
3. de Bowr, Advances in Catalysis, 1956, 8, 147.
4° Kwan, Advances in Catalysis, 1954, .6, 70.
5. Roginskii and Todes, Acta Physicochim. U.S.S.R., 1946, 21, 519.6. Roginskii and Keier, Dolclady Akad. Kauk. S.S.S.R., 1947, 57. 151.7. Roginskii and Keier, Izvest. Akad. Nauk. S.S.S.R., 1950, 27.
see Tolpin, John and Field, Advances in Catalysis, 1953, j>»664.
248
8. Kummer and Barnett, J.A.C.S., 1951, 23, 2886.
9. Eischens, J.A.C.S., 1952, 2 6167.10. Schuit, Proc. Intern. Symp. React. Solids, Gothenburg, 1954, 571.11. Gomer, Discuss. Faraday Soc., 1959, 28, 123.12. Ablesova and Roginskii, Z. Physik. Chem., 1935, 174. 449*
13. Beeck, Smith and Wheeler, Proc. Roy. Soc., 1940, A177. 62.
14. Porter and Tompkins, Discuss. Faraday Soc., 1950, 8., 203.
15. Gundry and Tompkins, Trans. Faraday Soc., 1956, ^2, 1609*16. Campbell and Thomson, Trans. Faraday Soc., 1959, 306.
17. Beeck, Advances in Catalysis, 1950, .2, 163*18. Klemperer and Stone, Proc. Roy. Soc., 1957, A243, 375*
19. Wahba and Kemball, Trans. Faraday Soc., 1953, 42^ 1351*20. Anderson and Baker, J. Phys. Chem., 1962, j56, 482.
21. Sachtler and Dorgelo, and van der Khaap, J. Chim. Phys., 1954,5 h 491.
22. Bonhoeffer and Farkas, Z. Phys. Chem., 1931, ®12, 231*

-197-23. Rideal, Proc. Camb. Phil. Soc., 1938, 35. 130.
24. Sachtler and Dorgelo, Bull. Soc. Chim. Beiges, 1958, 67. 465.
25- Schuit and de Boer, Rec. Trav. Chim., 1953, 72, 909*26. Gundry and Tompkins, Quart. Rev., i960, 14. 257*
27. Gomer, J. Chem. Phys., 1958, 22., 441.28. Boudart, J.A.C.S., 1952, 3556.
29. Mignolet, Bull. Soc. Chim. Beiges, 1955, 126,
30. Culver and Tompkins, Advances in Catalysis, 1959, 11. 68.
31. Eley, J. Phys. Chem., 1951» 5H) 1017.32. Schwab, Trans. Faraday Soc., 1946, £ 2 , 689.
33. Mignolet, J. Chem. Phys., 19559 2£, 1955*
34. Temkin, Symp. Problems of Chem. Kinetics, Catalysis and Reactivity, Akad. Nauk. S.S.S.R., 1955*
35. Bowden, Chemisorption, Butterworths Sci. Publ. London, 1957, 3
36. Eischens and Pliskin, Advances in Catalysis, 1958, 10. 1.
37. Vaska and Selwood, J.A.C.S., 1958, 80. 1331*
Lu 00 . Fryling, J. Phys. Chem., 1926, 30. 8l8.
39. Frankenberg, J.A.C.S., 1944, 66, 1827•40. Gomer, Discuss Faraday Soc., 1959, 28, 23.
41. Sherman and Ejyring, J.A.C.S., 1932, 54. 2661.
42. Okamoto, Sci. Papers, Inst. Phys. Chem. Research, (Tokyo)1936, 22., 223.
43. Gwathmey and Cunningham, Advances in Catalysis, 1958, 10, 57.
44. Culver, Pritchard and Tompkins, Z. Elektrochem, 1959, JlLj 741.
45. Kossel, Leipziger Vortrage, 1928, p.l8.46. Stranski, Z. Phys. Chem., 1931, Bll, 342.

-198-
47* Stranski and Kaischew, Phys. Chem., 1934? B26, 312.48. Eischens, Francis and Pliskin, J. Phys. Chem., 1956, 60, 194«
Advances in Catalysis, 1958? 10. 1*49* Campbell and Thomson, Trans. Faraday Soc., 1961, 57. 279•50. Tompkins, Superficial Chemistry and Solid Imperfections, Imp.Coll.
Sci. and Tech. London, Inaug. Lect., i960.
51• Sachtler, J. Chem. Phys., 1956? 25. 751*52. Oda and Arata, J. Physic.Chem., 1959? 62_> 1471*53. Farnsworth, Schlier, and Tuul, J. Physic. Chem. Solids,
1958, £, 57.54* Roberts and Sykes, Proc. Roy. Soc., 1957? A242, 534*55* Trapnell, Proc. Roy. Soc., 1951? A206, 39*56. Porter and Tompkins, Proc. Roy. Soc., 1953? A127. 529*57* Taylor and Liang, J.A.C.S., 1947? 62? 1306.
Taylor and Sadek, J.A.C.S., 1950, J 2 , 1168.
58. Baker, Jenkins and Rideal, Trans. Faraday Soc., 1955? ^592.59* Bowden, J. Chem. Soc., 1950, 242.60. Selwood, Advances in Catalysis, 1957? 2> 93*61. Dietz and Selwood, J. Appl. Phys., 1959? 30S. 101S.62. Suhimann, Advances in Catalysis, 1957? 2> ^3*63. Wortman, Gomer and Lundy, J.Chem. Phys., 1957? 27. 1099*64* Rideal and Sweet, Proc. Roy. Soc., i960, A257. 291*65. Kemball, Proc. Roy. Soc., 1946, A187. 73*66. Gundry, Actes du Beuxieme Congres Intern, de Catalyse, Paris,
I960, 1, 1083.67* Schuit, de Boer, Dorgelo and van Reijen, Chemisorption,
Butterworths Sci. Publ., London, 1956? 39*68. Hirota, Kobayashi and Kiji, Bull. Chem. Soc., Japan, 1961, 34? 1213.

-199-
69* Mignolet, Discuss. Faraday Soc., 1950, §.y 105*70. Gomer, Wortman and Lundy, J. Chem. Phys., 1957, 269 1147*71. Sachtler and Dorgelo, Bull. Soc. Chim. Beiges, 1958, 6l> 4^5*72. Shooter and Farnsworth, J. Phys. Chem. Solids, 1961, 21t 219*73. Boreskov and Vassilevitch, Actes du Deuxieme Congres Intern.
de Catalyse, Paris, I960, .1* 1095*74. Campbell, Ph.D Thesis, Durham, 1958.75* Glueckauf and Kitt, Proc. Int. Symp. on Isotope Separation,
North Holland, Amsterdam, 1958, 211.76. Haar, Friedman and Beckett, N.B.S. Monograph 20, 1961.77. Kamen, Radioactive Tracers in Biology, Acad. Press Inc.
New York, 1947*78. Thomson and Walton, Trans. Faraday Soc., 1957, 82L.79. von Ubisch, Analyt. Chem., 1952, 24, 931.
see also Leek (8l) p. 33, and Dushman (86) p.318.80. Rayleigh, Phil. Trans., 1901, AI96, 208.
Gaede, Ann. Physik, 1913, Jd, 289.81. Leek, Pressure Measurement in Vacuum Systems, London, The
Inst, of Physics, 1957, 264.82. Porter, Trans. Faraday Soc., 1933, 29, 702.83. Rosenberg, Res. Sci. Instr., 1938, 10, 258.84* Klemperer, J. Sci. Instr., 1944, 21, 88.85. Haase, Z. tech. Physik, 1943, 24* 27*86. Dudhraan, Vacuum Technique, Chapman & Hall, Ltd., London,
1955, 12.
87. Rosenberg, Rev. Sci. Instr., 1939, 10* 131*88. Ellet and Zabel, Phys. Rev., 1931, 37* 1102.

-200-
89* Wardle, Ph.D Thesis, Durham, 1953, p.121.90. Chackett, Reasbeck and Wilson, 1953> Geochim. et Cosmochim.
Acta, 3, 261.
91. Hale, Trans. Am. El. Chem. Soc., 1911, 20, 243*see also Dushraan (86), p.318.