the irs1 branch of the insulin signaling cascade plays a dominant role in hepatic nutrient
TRANSCRIPT

MOLECULAR AND CELLULAR BIOLOGY, Sept. 2009, p. 5070–5083 Vol. 29, No. 180270-7306/09/$08.00�0 doi:10.1128/MCB.00138-09Copyright © 2009, American Society for Microbiology. All Rights Reserved.
The Irs1 Branch of the Insulin Signaling Cascade Plays a DominantRole in Hepatic Nutrient Homeostasis�
Shaodong Guo,1 Kyle D. Copps,1 Xiaocheng Dong,1 Sunmin Park,1 Zhiyong Cheng,1 Alessandro Pocai,2Luciano Rossetti,2 Mini Sajan,3 Robert V. Farese,3 and Morris F. White1*
Howard Hughes Medical Institute, Division of Endocrinology, Children’s Hospital Boston, Harvard Medical School, Boston,Massachusetts 021151; Department of Metabolic Disorders, Merck Research Laboratories, Rahway, New Jersey 070652;
and College of Medicine, University of South Florida, Tampa, Florida 336123
Received 30 January 2009/Returned for modification 31 March 2009/Accepted 6 July 2009
We used a Cre-loxP approach to generate mice with varied expression of hepatic Irs1 and Irs2 to establishthe contribution of each protein to hepatic nutrient homeostasis. While nutrient-sensitive transcripts wereexpressed nearly normally in liver lacking Irs2 (LKO2 mice), these transcripts were significantly dysregulatedin liver lacking Irs1 (LKO1 mice) or Irs1 and Irs2 together (DKO mice). Similarly, a set of key gluconeogenicand lipogenic genes was regulated nearly normally by feeding in liver retaining a single Irs1 allele without Irs2(DKO/1 mice) but was poorly regulated in liver retaining one Irs2 allele without Irs1 (DKO/2 mice). DKO/2mice, but not DKO/1 mice, also showed impaired glucose tolerance and insulin sensitivity—though both Irs1and Irs2 were required to suppress hepatic glucose production during hyperinsulinemic-euglycemic clamp. Incontrast, either hepatic Irs1 or Irs2 mediated suppression of HGP by intracerebroventricular insulin infusion.After 12 weeks on a high-fat diet, postprandial tyrosine phosphorylation of Irs1 increased in livers of controland LKO2 mice, whereas tyrosine phosphorylation of Irs2 decreased in control and LKO1 mice. Moreover,LKO1 mice—but not LKO2 mice—that were fed a high-fat diet developed postprandial hyperglycemia. Weconclude that Irs1 is the principal mediator of hepatic insulin action that maintains glucose homeostasis.
Insulin regulates systemic metabolism by activating the in-sulin receptor tyrosine kinase, resulting in the activation ofpathways that coordinate metabolic flux, cellular growth, andsurvival (42, 43). Cell-based and mouse-based experimentshave shown that the insulin signal is transduced largely throughtyrosine phosphorylation of insulin receptor substrates 1 and 2(Irs1 and Irs2), and other scaffold proteins including SHC,CBL, APS and SH2B, GAB1, GAB2, DOCK1, and DOCK2(2, 4, 15, 19, 23, 27, 46). However, work with knockout miceshows that most insulin responses associated with nutrienthomeostasis are mediated through Irs1 or Irs2 (42). SystemicIrs2 null mice display metabolic defects in liver, muscle, andadipose tissues (32) but develop diabetes owing to pancreatic�-cell failure (44). In contrast, systemic Irs1 null mice displaygrowth retardation and develop peripheral insulin resistancemainly in skeletal muscle but avoid diabetes owing to robustIrs2-dependent pancreatic �-cell growth and compensatory in-sulin secretion (1, 38).
Insulin signaling initially promotes the storage of circulatingglucose as glycogen in muscle and liver, while persistent insulinsignaling promotes the conversion of excess glucose into he-patic fatty acids (35). During fasting, insulin falls while gluca-gon rises to stimulate hepatic glycogenolysis and gluconeogen-esis to maintain circulating glucose concentrations in thenormal range at the expense of hepatic fatty acid oxidation (9).Upon feeding, insulin regulates the transition from the fasting
to the postprandial state by reducing the activity and concen-tration of rate-limiting metabolic enzymes, including phos-phoenolpyruvate carboxykinase (Pck1), glucose 6-phosphatase(G6pc), and carnitine palmitoyltransferase-1 (Cpt1a) (35).This transition fails without hepatic insulin signaling, at least inpart, because forkhead box O1 (Foxo1) remains active in thenucleus to prevent gene expression changes that attenuatehepatic glucose production (6). Insulin also acts upon hypo-thalamic neurons to suppress hepatic gluconeogenesis, but it isunknown whether this mechanism is independent of directhepatic insulin signaling (25, 28).
Both Irs1 and Irs2 contain multiple YXXM motifs that arephosphorylated by the activated insulin receptor kinase (43).In cell-based experiments, Irs1 and Irs2 display similar capac-ities to bind to the 85-kDa regulatory subunits (PIK3R1 orPIK3R2) of the phosphatidylinositol 3-kinase (PI3K), whichactivate the associated 110-kDa catalytic subunits (PIK3C2Aor PIK3C2B) that produces phosphatidylinositol-3,4,5-triphos-phate (PI-3,4,5-P3) (43). PI-3,4,5-P3 recruits the Ser/Thr ki-nases PDK1 and Akt to the plasma membrane where Akt isactivated by PDK1-mediated phosphorylation (22). Cell linesderived from embryonic hepatocytes suggest that Irs2 is theprincipal mediator of the PI3K3Akt cascade in the liver (33,41). Regardless, recent work in adult mouse liver or isolatedhepatocytes shows that Akt is activated by Irs1 and Irs2, ineither case promoting the phosphorylation of glycogen syn-thase kinase-3� (GSK3�) and GSK3�, FOXO transcriptionfactors, and components of the mTOR pathway (5, 6, 16).Activation of atypical protein kinase C isoforms by insulin-stimulated PI3K3PDK1 signaling contributes to hepatic fattyacid homeostasis and, unexpectedly, depends entirely upon theIrs2 branch of the insulin signaling cascade (7, 37).
* Corresponding author. Mailing address: Howard Hughes MedicalInstitute, Division of Endocrinology, Children’s Hospital Boston, Har-vard Medical School, Karp Family Research Laboratories, Rm. 4210,300 Longwood Avenue, Boston, MA 02115. Phone: (617) 919-2846.Fax: (617) 730-0244. E-mail: [email protected].
� Published ahead of print on 13 July 2009.
5070
on April 10, 2019 by guest
http://mcb.asm
.org/D
ownloaded from

Recent data suggest that Irs2 functions mainly during fastingand immediately after feeding to suppress hepatic glucose out-put (16), whereas Irs1 functions mainly during feeding to reg-ulate hepatic glucose homeostasis and promote lipogenesis(16). Indeed, acute reduction of Irs2 expression—accom-plished via adenovirus-mediated short hairpin RNA (shRNA)delivery—causes mild steatosis (40). Thus, persistent Irs1 sig-naling without Irs2 might promote excess lipid synthesis. Weused the Cre-loxP approach to produce mice with differenthepatic concentrations of Irs1 or Irs2. This experimental ap-proach can reveal how mice adapt to partial Irs1 or Irs2 defi-ciency—which, unlike the acute reduction achieved by tran-sient expression of shRNA (40), might resemble thephysiologic state developed during the prolonged period ofmetabolic dysregulation preceding overt type 2 diabetes.
MATERIALS AND METHODS
Animals. Generation of animals with floxed (flanked by loxP) Irs2 has beendescribed previously (17); a similar strategy was used to generate the floxed Irs1allele (6). Mice of six different genotypes were selected and analyzed in thisstudy. Mice homozygous for the floxed Irs1 and Irs2 alleles (Irs1lox/lox::Irs2lox/lox)were used as control (CNTR) mice. LKO1 mice are liver-specific Irs1 knockoutmice, while LKO2 mice are liver-specific Irs2 knockout mice; each was generatedby breeding the respective floxed mice (Irs1lox/lox or Irs2lox/lox) with Alb-Cretransgenic mice [Jackson Laboratory strain B6.Cg-Tg(Alb-cre)21 Mgn/J] thatexpress the Cre recombinase cDNA from the rat albumin promoter (31). TheDKO mice are those in which both Irs1 and Irs2 are simultaneously deleted in theliver (Irs1lox/lox::Irs2lox/lox::Alb-Cre). DKO/1 mice are DKO mice in which onewild-type (�) allele of Irs1 is retained (Irs1�/lox::Irs2lox/lox::Alb-Cre), while DKO/2mice are DKO mice in which one wild-type Irs2 allele is retained(Irs1lox/lox::Irs2�/lox::Alb-Cre). All the mice were maintained on a mixed back-ground derived from C57BL/6J and 129/Sv. Genotyping was performed by PCRusing genomic DNA isolated from the tail tip as previously described in refer-ences 6 and 17. Animals were housed on a 12-h/12-h light/dark cycle and were feda standard rodent chow ad libitum. For high-fat diet (HFD) feeding, 4-week-oldmale mice were fed a diet containing 45% fat-derived calories (D12451; Re-search Diet) for 12 weeks. All protocols for animal use and euthanasia wereapproved by the Institutional Animal Care and Use Committee of Children’sHospital Boston and in accordance with NIH guidelines.
Metabolic analysis. Blood glucose levels were measured in random-fed (adlibitum) or overnight-fasted mice using a glucometer (Elite XL; Bayer). Plasmainsulin and leptin levels were measured using rat insulin and leptin enzyme-linked immunosorbent assay (Crystal Chem Inc.), respectively. Plasma triglycer-ides, free fatty acids, and total cholesterol from overnight-fasted mice weremeasured using the L-type triglyceride, nonesterified fatty acid, and cholesterol Ekits from Wako Diagnostics (Richmond, VA), respectively. Serum albumin levelswere assessed using BCG reagent (Bioassay System, Hayward, CA). Glucosetolerance tests were performed on overnight-fasted mice. Animals were injectedintraperitoneally (i.p.) with D-glucose (2 g/kg of body weight), and blood glucoselevels were measured at indicated time points. For insulin tolerance tests, micewere fed ad libitum, and diluted insulin (1 U/kg Humulin R; Lilly) was injectedi.p.; blood glucose concentrations were measured at 0, 15, 30, and 60 min afterinsulin injection. Bone mineral density and fat accumulation were determinedusing dual-energy X-ray absorptiometry with a Lunar Piximus II mouse den-sitometer (GE LUNAR Corp., Madison, WI) as described by the manufac-turer. Mice were anesthetized using Avertin (0.25 mg/g body weight, i.p.)before scanning. Hepatic glycogen content in liver was analyzed in fed mice,and hepatic triglyceride concentrations were analyzed in overnight-fastedmice, as previously described (6).
Hyperinsulinemic-euglycemic clamp. To assess glucose metabolism in vivo,mice were subjected to hyperinsulinemic-euglycemic clamp analysis after cathe-ters were implanted into the right jugular vein 5 days prior to the clamp. Theprocedure was performed essentially as previously described for overnight-fastedmice (17).
Intracerebroventricular (ICV) insulin stimulation with pancreatic insulinclamp. For ICV insulin infusion and pancreatic insulin clamp, a catheter wasimplanted in the third cerebral ventricle 3 weeks prior to the clamp experiment.Additional catheters were implanted in the right jugular vein and left carotid
artery a week before the clamp. The clamp procedure was performed as previ-ously described (30).
Antibodies. Antibodies against Akt, Foxo1, Gsk3�/�, ribosomal S6 kinase(S6K), and �-actin or phosphospecific antibodies against Akt(T308), Akt(S473),Foxo1(S256), Gsk3�(S9), and S6K(T389) were obtained from Cell SignalingTechnology. Antibodies against Irs1, Irs2, and p85 were obtained from Millipore(Billerica, MA).
RNA isolation and quantitative real-time PCR. Total RNA was isolated fromliver using the Trizol reagent (Invitrogen) according to the manufacturer’s pro-tocol. For real-time PCR analysis, 1 �g of total RNA was treated with RNase-free DNase and subsequently reverse transcribed with random hexamer primers(Bio-Rad). Relative mRNA abundance levels normalized to cyclophillin levelswere determined with the threshold cycle (��CT) method after amplification,using an iCycler IQ real-time PCR detection system (Bio-Rad) and SYBR green(Bio-Rad). The data are presented as means � standard errors of the means(SEM).
Affymetrix GeneChip analysis. Liver mRNA expression in LKO1, LKO2, andDKO mice fasted for 16 h (n � 2) or fed for 4 h (n � 2) was determined onMG430 2.0 GeneChips (Affymetrix); for CNTR mice, a total of six fasted and sixfed mice were used. RNA labeling and microarray hybridizations were per-formed at the Harvard Medial School Biopolymers Facility, using the Affymetrixmodel 450 fluidics station and model 3000 scanner. Affymetrix MircroarraySuite 5.0 was used to generate cell intensity (CEL) files that were analyzed byrobust multichip average analysis implemented in GeneSpring 7.2 (AgilentTechnologies).
Immunoprecipitation and Western blot analysis. Livers were removed andhomogenized in homogenization buffer (25 mM Tris-Cl [pH 7.4], 50 mM sodiumpyrophosphate, 100 mM sodium fluoride, 10 mM EDTA, 1% NP-40, 1 mMphenylmethylsulfonyl fluoride, 10 mM sodium orthovanadate, 10 �g/ml aproti-nin, and 10 �g/ml leupeptin). Samples were allowed to solubilize for 30 min onice, and particulate matter was removed by centrifugation at 14,000 � g for 15min at 4°C. Immunoprecipitations and Western blot analyses of insulin signalingproteins were performed as previously described (11) using 100 �g (immuno-blots) or 500 �g (immunoprecipitations) of each liver lysate. Liver lysates orimmunoprecipitates were resolved by sodium dodecyl sulfate-polyacrylamide gelelectrophoresis and transferred to nitrocellulose membranes for immunoblottingwith specific antibodies. Representative blots, developed using enhanced chemi-luminescence, were quantitated using ImageQuant TL (2003) software.
aPKC activity. Atypical protein kinase C (aPKC) activity was measured aspreviously described (37).
Statistics. All data are presented as means � SEM or as estimated marginalmeans � SEM determined by generalized linear regression (SPSS, version 16.0).Pairwise comparisons of the estimated marginal means were made, and P 0.05was taken as a significant difference. The Bonferroni method was used to adjustthe observed significance levels for the fact that multiple contrasts were beingtested. Serial measurements made during glucose and insulin tolerance testswere summarized by determining the area under the curve using Medcalcv10.0 (6).
RESULTS
Differential regulation of gene expression by hepatic Irs1and Irs2. To distinguish the contributions of Irs1 and Irs2 inthe liver, we investigated the effect of 4 h of feeding upon theconcentration of Irs1/2-sensitive transcripts in livers of micelacking hepatic Irs1 (LKO1) or Irs2 (LKO2). To select a set ofinformative transcripts that depended upon Irs1 or Irs2 signal-ing for normal expression, we analyzed previously publishedresults obtained from these mice, using Affymetrix MOE430GeneChips (ArrayExpress database accession number E-MEXP-1649) (6). Thousands of probe sets were previously reported tochange significantly across all possible test conditions. In thisanalysis, we restricted the list to the 319 probe sets (109 genes)that changed significantly—more than �1.5-fold (false discov-ery rate [FDR] of 0.01)—in CNTR liver but changed lessthan �1.4-fold—in practice not at all (FDR 0.05)—betweenfasted and fed DKO mouse liver (Fig. 1). This set of transcriptscontained well-known insulin-sensitive genes, including the
VOL. 29, 2009 Irs1 IS DOMINANT IN HEPATIC NUTRIENT HOMEOSTASIS 5071
on April 10, 2019 by guest
http://mcb.asm
.org/D
ownloaded from
5072 GUO ET AL. MOL. CELL. BIOL.
on April 10, 2019 by guest
http://mcb.asm
.org/D
ownloaded from

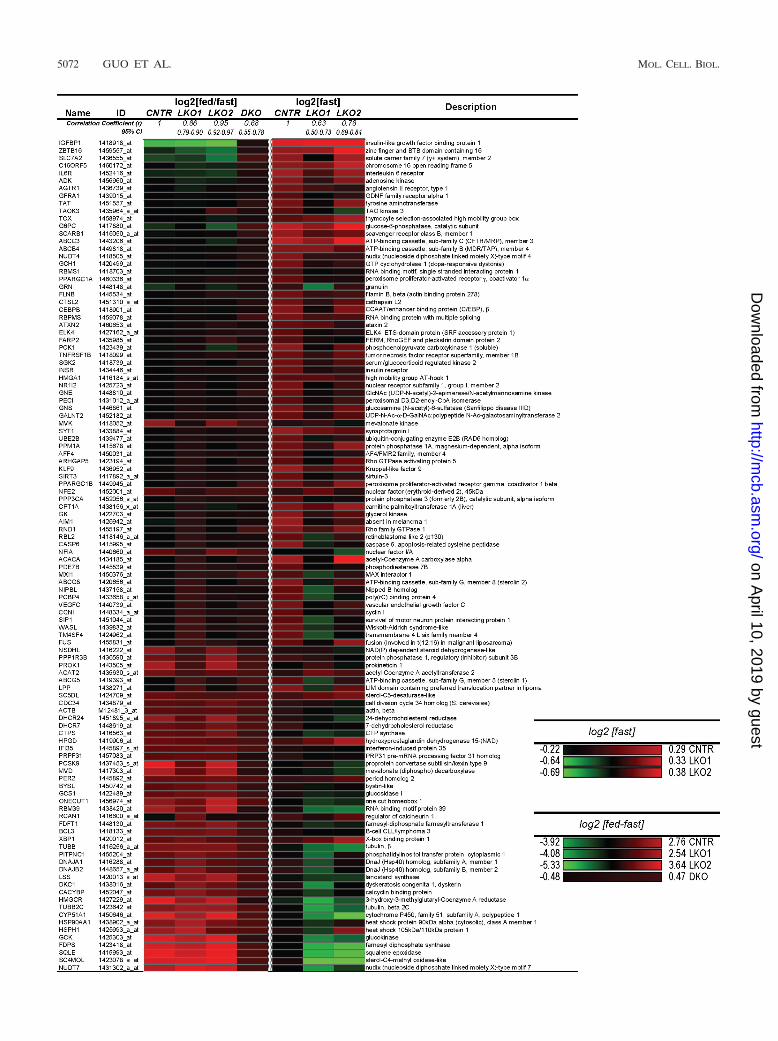
Igfbp1, G6pc, Pck1, Pgc1�, Xbp1, and Gck genes (Fig. 1).Inspection of the heat map showed that the responses of thesetranscripts to feeding were similar in CNTR and LKO2 mice,as Pearson’s correlation coefficient (r) was nearly perfect (r �0.95; 95% confidence interval [CI], 0.92 to 0.97; P 0.0001). Incomparison, the response of the reporter transcripts to feedingin LKO1 mice was less correlated to that in the CNTR (r �0.86; 95% CI, 0.79 to 0.90; P 0.001). Thus, either Irs1 or Irs2could regulate the transition of hepatic gene expression fromthe fasted to postprandial state, but Irs1 was required for anear normal response.
Since Irs2 was proposed recently to play a dominant roleduring fasting (16), we compared the concentrations of thereporter transcripts specifically in fasted liver samples (Fig. 1).Inspection of the heat map indicated that deletion of eitherIrs1 or Irs2 influenced the overall expression of these reportertranscripts during fasting. Since the Pearson’s correlation co-efficients were indistinguishable between LKO1 and LKO2mice, we conclude that both Irs1 and Irs2 contribute to theregulation of these genes during fasting (Fig. 1).
Feeding-stimulated signaling in DKO/1 and DKO/2 mice.Previous work shows that liver-specific knockout of Irs1 or Irs2has a moderate effect upon hepatic insulin action at the phys-iologic level (5, 6, 16). To establish whether incomplete loss ofIrs1 or Irs2 affects the hepatic insulin response, we used aCre-loxP strategy to produce mice that retained one allele ofIrs1 without Irs2 (DKO/1 mice) or one allele of Irs2 withoutIrs1 (DKO/2 mice). Immunoblotting confirmed the completeabsence of Irs1 and Irs2 in the DKO liver (Fig. 2A and B).Compared to liver extracts from CNTR mice, DKO/1 liverextracts had a low concentration of Irs1 and undetectable Irs2,whereas DKO/2 liver extracts had a low concentration of Irs2without Irs1 (Fig. 2A and B). The phosphorylation of severalproteins in the Irs1/23PI3K3Akt signaling cascade was ana-lyzed in liver extracts from mice fasted 20 h or mice fasted 20 hand allowed access to food for a further 4 h (Fig. 2C to G). InCNTR mice, feeding increased the phosphorylation of Akt(T308 and S473), Foxo1(S253), GSK3�(S9), and S6K(T389).As previously shown, the phosphorylation of Akt(T308) andFoxo1(S253) was completely absent in the fed DKO liver (Fig.2C and E). In contrast, Akt(S473) phosphorylation was ele-vated significantly in fasted DKO liver but did not increaseduring the postprandial period (Fig. 2D). Feeding significantlystimulated phosphorylation of Akt(T308) in DKO/1 or DKO/2liver; however, in the fasted state, Akt(T308) phosphorylationwas significantly higher in the DKO/1 liver (Fig. 2C). Regardless,downstream phosphorylation of Foxo1(S253) was indistinguish-able in DKO/1 and DKO/2 livers under fasting or postprandialconditions (Fig. 2E). Finally, stimulation of GSK3�(S9) andS6K(T389) phosphorylation by feeding was detected in DKO/1,DKO/2, and DKO liver (Fig. 2F and G).
Hepatic gene expression in DKO/1 and DKO/2 mice. Weinvestigated the concentrations of transcripts encoding specific
insulin-sensitive genes—including the G6pc, Pck, Gck, Fasn,Hmgcr, Acc, Srebp1c, and Srebp2 genes in livers from CNTRmice or from DKO/1, DKO/2, and DKO mice. Under fastingconditions, the expression of the tested genes in DKO/1 andDKO/2 livers was barely different than that in the CNTR (Fig.3A to H). As expected, the concentration of G6pc and Pcktranscripts decreased significantly in CNTR mice after feed-ing—consistent with the suppression of gluconeogenesis byinsulin (Fig. 3). In contrast, the transcript concentrations ofGck, Fasn, Acc, Hmgcr, Srebp1c, and Srebp2 increased afterfeeding CNTR mice, which is consistent with the utilization ofglucose by the postprandial liver for the synthesis of glycogen,fatty acids, and cholesterol (Fig. 3). In comparison, the effect offeeding upon these genes was largely lost in DKO liver, con-firming that the postprandial concentrations of these tran-scripts were regulated largely by Irs1 or Irs2 signaling (Fig. 3).In several cases—G6pc, Pck, Gck, Fasn, and Srebp1c (Fig. 3A,C, E, G, and F)—the retention of Irs1 (DKO/1 mice) alloweda more normal postprandial response than did the retention ofIrs2 (DKO/2 mice). In the case of Hmgcr and Srebp2, theresponse to feeding was significantly reduced in both DKO/1and DKO/2 livers. Thus, both Irs1 and Irs2 contributed togene expression in the liver, but in most cases, Irs1 appearedto be dominant, as suggested by the Affymetrix analysisresults (Fig. 1).
Metabolic regulation in DKO/1 and DKO/2 mice. As previ-ously shown, DKO mice were about 30% smaller than CNTRmice (Fig. 4A). Although DKO/1 and DKO/2 mice wereslightly smaller than the CNTR mice, the difference did notreach statistical significance (Fig. 4A). At 6 weeks of age, theDKO mice displayed �40% greater adiposity and �20% lessbone mineral density than CNTR mice, whereas adiposity andbone density were indistinguishable between CNTR, DKO/1,and DKO/2 mice (Fig. 4B and C). In 8-week-old DKO mice,fasting plasma concentrations of insulin and leptin and fastingblood glucose concentrations were significantly elevated (Fig.4D to F), whereas the concentrations of triglyceride, free fattyacids, and free cholesterol decreased (Fig. 4G to I). In contrast,each of these measures was normal in the DKO/2 and DKO/1mice (Fig. 4D to I), as well as in LKO1 and LKO2 mice of thesame age (Table 1). Thus, even a low concentration of Irs1 orIrs2 in the liver was sufficient to maintain normal circulatinghormone and metabolite concentrations.
Next, we compared glucose tolerance and insulin sensitivityin 8-week-old mice. In comparison with DKO mice—whichdisplayed severe glucose intolerance—DKO/1 and DKO/2mice displayed intermediate glucose intolerance—DKO/1mice being significantly better than DKO/2 mice (Fig. 4J andK). As previously shown (6), the DKO mice displayed severeinsulin resistance during the i.p. insulin tolerance test (Fig. 4Land M). The DKO/1 and DKO/2 mice were significantly moresensitive to insulin than DKO mice; however, compared to theCNTR mice, the DKO/1 mice displayed a stronger response to
FIG. 1. Heat map of annotated reporter transcripts dependent upon Irs1 and Irs2 signaling for normal expression. Data are from AffymetrixGeneChips (MOE430 2) analysis. Expression was determined in chow-fed mice after 16 h of fasting with or without refeeding for 4 h. Transcriptexpression was determined in the fasting state, log2[fast]—or the change between fed and fasted states, log2[fed/fast]. The Pearson correlationcoefficient was calculated versus CNTR samples together with the 95% CI.
VOL. 29, 2009 Irs1 IS DOMINANT IN HEPATIC NUTRIENT HOMEOSTASIS 5073
on April 10, 2019 by guest
http://mcb.asm
.org/D
ownloaded from

insulin than did the DKO/2 mice (Fig. 4L and M). Thus,hepatic Irs1 mediated a stronger response than did Irs2 toinjected glucose or insulin in mice.
Roles of hepatic Irs1 and Irs2 in direct and central controlof hepatic glucose production. A hyperinsulinemic-euglycemicclamp was used to establish the relative contribution of Irs1and Irs2 to systemic glucose homeostasis. During peripheralinsulin infusion (2.5 mU kg�1 min�1), the circulating glucoseconcentration in CNTR mice was maintained at 5 mM byinfusing 275 �mol kg�1 min�1 glucose. The DKO mice re-quired a much lower glucose infusion rate than did the CNTRmice, whereas the LKO1 or LKO2 mice were maintained at 5mM by the infusion of 195 � 20 and 183.8 � 12 �mol kg�1
min�1 glucose, respectively. Thus, insulin sensitivity was par-tially impaired in the LKO1 and LKO2 mice but markedlydysregulated in the DKO mice (Fig. 5A).
Compared to the CNTR mice, basal hepatic glucose produc-
tion was slightly—but not significantly—increased in fastedLKO1, LKO2, and DKO mice (Fig. 5B). The peripheral insulininfusion completely suppressed hepatic glucose production inthe CNTR mice but had no effect upon LKO1, LKO2, or DKOmice (Fig. 5B). Thus, both Irs1 and Irs2 were required for thenormal inhibition of hepatic glucose production during thehyperinsulinemic-euglycemic clamp. In comparison, the whole-body glucose disposal rate (Rd) decreased significantly in theDKO mice but increased slightly in LKO1 mice compared tothe normal rate in the CNTR and LKO2 mice (Fig. 5C).
Hepatic glucose production can also be regulated by theindirect effects of insulin in the hypothalamus (8). In the brain,insulin suppresses hepatic glucose production via vagus nerve-mediated signals generated by insulin-stimulated closure ofK-ATP channels (25, 30). To establish whether the centraleffect of insulin to inhibit hepatic glucose production also re-quires direct hepatic insulin signaling, we performed ICV in-
FIG. 2. Feeding-stimulated signaling in livers of DKO/1 and DKO/2 mice. Liver lysates from duplicate male mice fasted for 20 h or fed 4 h afterthe 20-h fast were separated by sodium dodecyl sulfate-polyacrylamide gel electrophoresis and immunoblotted with antibodies against Irs1 (A) orIrs2 (B) and p85, or total Akt, Foxo1, GSK3�, and S6K plus phospho-specific antibodies against Akt(T308) (C), Akt(S473) (D), Foxo1(S253) (E),GSK3�(Ser9) (F), and S6K(Thr389) (G). Bars represent averages � SEM; the quantitated signals are shown beneath each graph. The intensityof each signal (numerator) was analyzed using a general linear model with genotype and fasted or fed state as factors and expression as a numericalcovariate to correct the signal for variable expression. Statistical significance was set at P 0.05 using the Bonferroni correction for multiplecomparisons; �, P 0.05 versus the same genotype and fasted state; �, P 0.05 versus CNTR fasted state.
5074 GUO ET AL. MOL. CELL. BIOL.
on April 10, 2019 by guest
http://mcb.asm
.org/D
ownloaded from

sulin infusion while endogenous insulin secretion was inhibitedby a pancreatic insulin clamp (30). Before initiating the ICVinsulin infusion, the circulating glucose concentration wasmaintained at 5 mM in CNTR, LKO1, and LKO2 mice byinfusing about 90 �mol kg�1 min�1 glucose; �50% less glu-cose was required by the DKO mice (Fig. 5D). ICV insulinincreased by twofold the rate of glucose infusion required tomaintain the circulating glucose at 5 mM in CNTR, LKO1, andLKO2 mice (Fig. 5D); however, ICV insulin had no effect uponthe DKO mice (Fig. 5D). Consistent with these results, ICVinsulin significantly reduced hepatic glucose production inCNTR, LKO1, and LKO2 mice but had no effect upon theDKO mice (Fig. 5E). As expected, ICV insulin had no effectupon peripheral glucose disposal (Fig. 5F). Thus, a direct he-patic insulin signal through Irs1 or Irs2 was required to observethe inhibitory effect of ICV insulin upon hepatic glucose pro-duction.
Roless of hepatic Irs1 and Irs2 during nutrient stress. Obe-sity causes insulin resistance that can progress to diabetes. Toestablish the roles of Irs1 and Irs2 in response to this nutrient
stress, we compared glucose homeostasis and feeding-stimu-lated signaling in LKO1 and LKO2 mice maintained for 12weeks on a normal chow or HFD (Fig. 6). Chow-fed LKO1 andLKO2 mice showed a fasting metabolic profile indistinguish-able from that of CNTR mice (Table 1). In contrast, all HFD-fed mice displayed elevated circulating glucose concentrationsduring the fasting state—though only the DKO mice weresignificantly hyperglycemic relative to the CNTR mice (Fig.6A). During the HFD, postprandial blood glucose was elevatedin the LKO1 and DKO mice, whereas that of LKO2 miceremained indistinguishable from that of CNTR mice (Fig. 6A).We previously showed that, when maintained on a regularchow diet, both LKO1 and LKO2 mice were normally sensitiveto injected insulin, but LKO1 mice were mildly glucose intol-erant (6). Consistent with these findings, HFD-fed LKO1 micedisplayed severe glucose intolerance indistinguishable fromthat of DKO mice, while glucose tolerance of HFD-fed LKO2mice was barely different from that of the CNTR mice andsignificantly better than that of the LKO1 mice (Fig. 6B andC). The HFD-fed LKO1 mice were also significantly less sen-
FIG. 3. Gene expression in fasted or fed livers from CNTR, DKO/2, DKO/1, and DKO mice maintained on the chow diet. Real-time PCR datafor each gene were normalized against the corresponding fasted CNTR mouse values. Open circles represent expression in the fasted mice, andclosed circles represent expression in the fed mice. Each graph is annotated with the value of the vector defining the expression change betweenfasted and fed mice (n � 3 mice per group). �, P 0.05 versus feeding-stimulated change in CNTR mice.
VOL. 29, 2009 Irs1 IS DOMINANT IN HEPATIC NUTRIENT HOMEOSTASIS 5075
on April 10, 2019 by guest
http://mcb.asm
.org/D
ownloaded from

sitive to injected insulin than were the LKO2 mice (Fig. 6Dand E). Chow-fed LKO1 and LKO2 mice each exhibited nor-mal fasting plasma insulin, triglyceride, and liver tissue triglyc-eride concentrations (Table 1). Among the HFD-fed mice,fasting plasma insulin concentrations in LKO1 and DKO micewere significantly elevated compared to those in the CNTRmice (Fig. 6F), whereas plasma and liver tissue triglycerideconcentrations were significantly decreased (Fig. 6G and H); incontrast, each of these measurements was unchanged between
HFD-fed LKO2 and CNTR mice (Fig. 6F to H). Thus, LKO2mice exhibited responses to HFD feeding that were similar tothose seen in CNTR mice, whereas LKO1 mice respondedsimilarly to DKO mice.
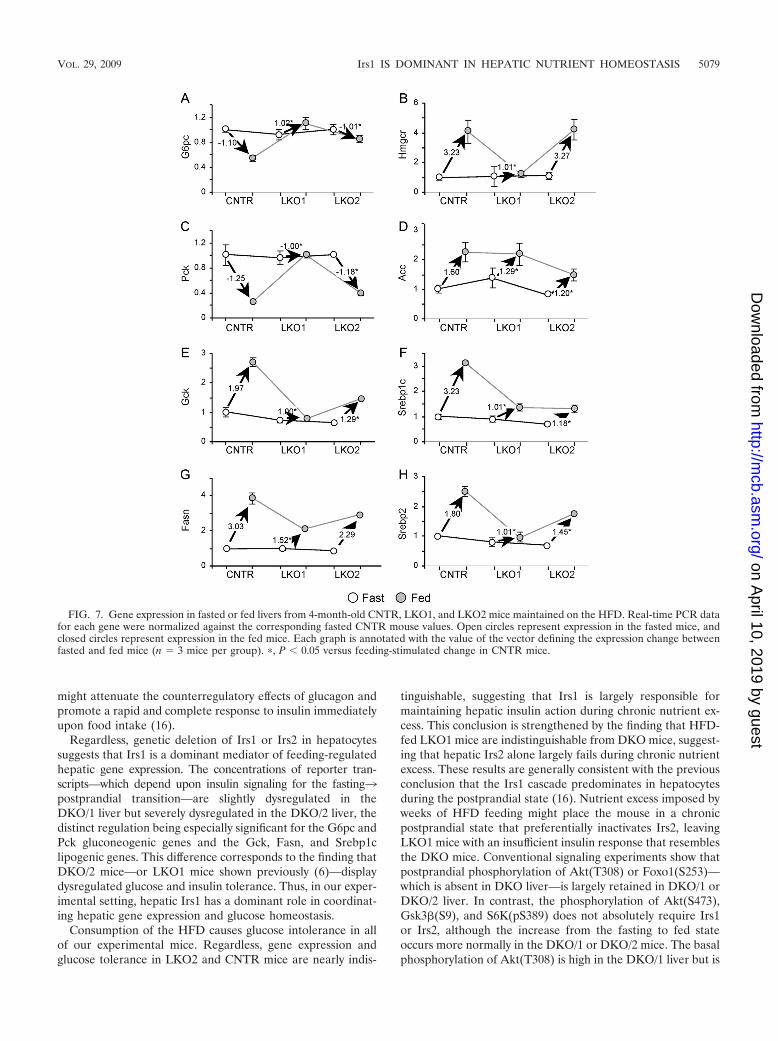
Next, we investigated the effect of the HFD upon fasting andpostprandial expression of several insulin-sensitive genes—in-cluding the G6pc, Pck, Gck, Fasn, Hmgcr, Acc, Srebp1c, andSrebp2 genes (Fig. 7). During fasting, gene expression wasindistinguishable between CNTR, LKO1, and LKO2 mice, and
FIG. 4. Metabolic characterization of CNTR, DKO/1, DKO/2, and DKO mice: body weight (A), percent body fat (B), and bone mineral densitydetermined by dual-energy X-ray absorptiometry at 8 weeks of age (C); plasma insulin (D), leptin (E), and blood glucose (F) concentrations,circulating triglyceride (G), free fatty acids (FFA) (H), and total cholesterol (I) in 8-week-old male mice. Values are averages � SEM (n � 8 miceper group). Significance was calculated using a general linear model with genotype and fasting or feeding state as factors. �, P 0.05 versus CNTRmice, using the Bonferroni correction for multiple comparisons. (J and K) Glucose tolerance tests performed at 8 weeks of age with male micefasted for 16 h (n � 6/genotype); the results were summarized by determining the area under each curve (AUC), using Medcalc (v10). One-wayanalysis of variance (ANOVA) was used to compare the groups. �, P 0.05. (L and M) Insulin tolerance tests performed with nonfasted8-week-old male mice; the results were summarized by determining the area between 100% and each curve (AOC) using Medcalc. One-wayANOVA was used to compare the groups. �, P 0.05.
5076 GUO ET AL. MOL. CELL. BIOL.
on April 10, 2019 by guest
http://mcb.asm
.org/D
ownloaded from

postprandial gene expression in HFD-fed CNTR mice changedin the expected direction; that is, the G6pc and Pck genesdecreased upon feeding, whereas the Hmgcr, Acc, Gck,Srebp1c, Srebp2, and Fasn genes increased upon feeding (Fig.7A to H). However, compared to chow-fed mice, the effect of
feeding upon Gck was reduced about threefold in the HFD-fedCNTR mice (compare Fig. 7E and 3E). The LKO1 liver—which retains only Irs2—displayed markedly impaired post-prandial changes in expression of the G6pc, Pck, Gck, Fasn,Hmgcr, and Srebp2 genes (Fig. 7A, C, E, G, B, and H). Incontrast, postprandial gene expression in the LKO2 liver re-sembled more closely the expression in the CNTR liver. TheAcc and Srebp1c genes were notable exceptions, as these genesdysregulated similarly in LKO1 and LKO2 livers (Fig. 7D andF). Overall, however, Irs1 played a more dominant role inpostprandial liver gene expression during HFD feeding.
Finally, we investigated tyrosine phosphorylation of Irs1 andIrs2 and several downstream responses in the liver of HFD-fedmice that were fasted (20 h) or fasted for 20 h and fed for 4 h.Irs1 protein was detected equally by immunoblotting in fastedand fed CNTR and LKO2 livers, and Irs2 was detected equallyin fasted and fed CNTR and LKO1 livers (data not shown).Both Irs1 and Irs2 were tyrosine phosphorylated at the end ofthe fast (Fig. 8A to D). Tyrosine phosphorylation of Irs1 in-creased between 1.5- and 2-fold, after feeding in the livers ofCNTR or LKO2 mice maintained on HFD or chow (Fig. 8Aand B). However, Irs2 tyrosine phosphorylation was not sig-nificantly stimulated by 4 h of feeding in HFD-fed CNTR andLKO1 mouse livers owing to elevated basal phosphorylation(Fig. 8C). It was also barely increased following feeding in thelivers of chow-fed CNTR and LKO1 mice (Fig. 8D). Regard-less, Akt(T308) phosphorylation at 4 h after feeding was equiv-alently stimulated in HFD-fed CNTR, LKO1, and LKO2 mice,whereas it was barely detected in fasted or fed DKO mice(Fig. 8E).
Like Akt, aPKC is activated by the PI3K cascade; however,aPKC is coupled exclusively to the Irs2 branch of the insulinsignaling cascade (34, 39). Regardless of the diet, feeding stim-ulated aPKC activity about twofold in the livers of CNTR andLKO1 mice but had no effect upon aPKC activity in the liversof LKO2 or DKO mice (Fig. 8F and G). Recent studies suggestthat Akt is primarily responsible for suppressing expression ofthe G6pc and Pck genes, whereas aPKC preferentially in-creases the expression of lipogenic genes, such as Srebp1c (39).However, 4 h of feeding decreased expression of the Pck geneby at least 50% in CNTR and LKO2 livers—but not in theLKO1 liver—even though feeding-stimulated Akt(T308) phos-phorylation was the same at this time point (Fig. 8E). More-over, feeding substantially increased expression of the Gck,
FIG. 5. Hyperinsulinemic-euglycemic clamp (A to C) and ICVclamp analysis (D to F) in CNTR, LKO1, LKO2, and DKO mice.Graphs show the averages � SEM for each parameter obtained (n �6 mice per group) as follows. Peripheral glucose infusion rate (GIR)(A and D); hepatic glucose production (HGP) (B and E); peripheralglucose disposal (Rd) (C and F). Comparisons were made using ageneral linear model with genotype and insulin infusion as factors, andsignificant differences were taken at P 0.05, using the Bonferronicorrection for multiple comparisons. �, P 0.05 versus CNTR mice;�, P 0.05 versus basal (B) or saline infusion (D to F).
TABLE 1. Metabolic parameters for 8-week-old chow-fed micea
ParameterValue for indicated mice
CNTR DKO DKO/1 LKO2 DKO/2 LKO1
Blood glucose (mg/dl) 57 � 3 142 � 7b 61 � 6 54 � 7 77 � 6 64 � 6Insulin (ng/ml) 0.36 � 0.02 2.18 � 0.15b 0.39 � 0.07 0.32 � 0.05 0.40 � 0.12 0.38 � 0.06Leptin (ng/ml) 4.85 � 0.58 36.68 � 6.75b 4.63 � 0.64 4.41 � 1.2 5.17 � 0.85 5.57 � 1.88Triglyceride (mg/dl) 33.1 � 6.8 12.4 � 0.6b 28.8 � 4.7 29.1 � 5.2 26.9 � 1.6 30.3 � 5.1FFA (meq/liter) 1.63 � 0.13 0.46 � 0.05b 1.61 � 0.19 1.45 � 0.12 1.63 � 0.05 1.39 � 0.28Cholesterol (mg/dl) 107 � 8 64 � 4b 99 � 4 98 � 5Albumin (g/dl) 3.01 � 0.12 2.52 � 0.16b 3.15 � 0.26 3.10 � 0.15Fed liver glycogen (mg/g) 55.2 � 4.8 26.7 � 1.8b 52.8 � 4.2 54.6 � 6.8 54 � 2.4 57.3 � 5.5Liver triglyceride (mg/g) 44.2 � 4.3 47.5 � 4.8 49.6 � 3.5 48.7 � 6.5 40.38 � 3.8 44.6 � 4.7
a Unless noted otherwise in the text, measurements come from overnight-fasted mice. FFA, free fatty acid.b P 0.05 versus CNTR mice.
VOL. 29, 2009 Irs1 IS DOMINANT IN HEPATIC NUTRIENT HOMEOSTASIS 5077
on April 10, 2019 by guest
http://mcb.asm
.org/D
ownloaded from

Fasn, and Hmgcr lipogenic genes in CNTR and LKO2 mice—but not in LKO1 mice in which aPKC activation was normal(Fig. 7). Thus, after 4 h of feeding, maintenance of normalhepatic gene expression was better correlated with Irs1 expres-sion and tyrosine phosphorylation than with either Akt oraPKC activation.
DISCUSSION
Our results identify Irs1 as the principal mediator of hepaticinsulin action especially during nutrient excess imposed byweeks of HFD feeding. Without hepatic Irs1 (LKO1 mice),fasting and postprandial gene expression is significantly dys-regulated compared to CNTR mice or mice without Irs2(LKO2 mice). Indeed, even the low concentration of Irs1 inDKO/1 mice is sufficient to maintain nearly normal gene ex-pression, fasting glucose concentrations, and postprandial glu-cose tolerance. When fed an HFD, LKO1 mice—which retainnormal Irs2 expression—develop severe glucose intoleranceand diabetes that are indistinguishable from those seen in mice
completely lacking Irs1 and Irs2 (DKO mice). Although LKO2mice also develop abnormal glucose tolerance on the HFD,they are indistinguishable from CNTR mice—and significantlybetter than LKO1 and DKO mice. We conclude that hepaticIrs1 is a principal mediator of the transition between fastingand postprandial glucose homeostasis, especially during nutri-ent excess.
Previous reports point to Irs2 as the critical mediator ofhepatic insulin action. Hepatocytes with low insulin receptorconcentrations retain significant Irs1 phosphorylation duringinsulin stimulation, while typical biological insulin responsesand Irs2 phosphorylation fail (33). Neonatal Irs2�/� hepato-cyte cell lines retain insulin-stimulated Irs1 tyrosine phosphor-ylation, while insulin weakly activates PI3K, Akt, or aPKC andweakly inhibits Gsk3�/� or Foxo1 (41). Moreover, recent worksuggests that Irs2 is an important mediator of fasting insulinaction in adult murine hepatocytes, at least in part because Irs2mRNA and protein concentrations increase during the fastingstate (16). Presumably, Irs2 amplifies the hepatic insulin signalgenerated by a low fasting concentration of insulin—which
FIG. 6. Nutrient homeostasis in HFD-fed LKO1 and LKO2 mice. (A) Blood glucose concentrations (average � SEM; n � 6) determined after16 h fast with or without 4 h of refeeding in 4-month-old male CNTR, LKO1, LKO2, and DKO mice fed chow or an HFD. (B and C) Glucosetolerance test results for 4-month-old overnight-fasted mice (n � 6 per group); the results were summarized by determining the area under eachcurve (AUC), using Medcalc (v10). (D and E) Insulin tolerance test results for nonfasted 4-month-old male mice (n � 6); the results weresummarized as the average area between 100% and each curve (AOC), determined using Medcalc. Fasting plasma insulin and triglyceride (TG)concentration (F and G), and liver triglyceride content (H) determined after 12 weeks of HFD feeding (n � 6). One-way ANOVA was used tocompare the groups. �, P 0.05 versus CNTR mice; �, P 0.05 versus DKO mice; �, P 0.05 versus LKO1 mice.
5078 GUO ET AL. MOL. CELL. BIOL.
on April 10, 2019 by guest
http://mcb.asm
.org/D
ownloaded from
might attenuate the counterregulatory effects of glucagon andpromote a rapid and complete response to insulin immediatelyupon food intake (16).
Regardless, genetic deletion of Irs1 or Irs2 in hepatocytessuggests that Irs1 is a dominant mediator of feeding-regulatedhepatic gene expression. The concentrations of reporter tran-scripts—which depend upon insulin signaling for the fasting3postprandial transition—are slightly dysregulated in theDKO/1 liver but severely dysregulated in the DKO/2 liver, thedistinct regulation being especially significant for the G6pc andPck gluconeogenic genes and the Gck, Fasn, and Srebp1clipogenic genes. This difference corresponds to the finding thatDKO/2 mice—or LKO1 mice shown previously (6)—displaydysregulated glucose and insulin tolerance. Thus, in our exper-imental setting, hepatic Irs1 has a dominant role in coordinat-ing hepatic gene expression and glucose homeostasis.
Consumption of the HFD causes glucose intolerance in allof our experimental mice. Regardless, gene expression andglucose tolerance in LKO2 and CNTR mice are nearly indis-
tinguishable, suggesting that Irs1 is largely responsible formaintaining hepatic insulin action during chronic nutrient ex-cess. This conclusion is strengthened by the finding that HFD-fed LKO1 mice are indistinguishable from DKO mice, suggest-ing that hepatic Irs2 alone largely fails during chronic nutrientexcess. These results are generally consistent with the previousconclusion that the Irs1 cascade predominates in hepatocytesduring the postprandial state (16). Nutrient excess imposed byweeks of HFD feeding might place the mouse in a chronicpostprandial state that preferentially inactivates Irs2, leavingLKO1 mice with an insufficient insulin response that resemblesthe DKO mice. Conventional signaling experiments show thatpostprandial phosphorylation of Akt(T308) or Foxo1(S253)—which is absent in DKO liver—is largely retained in DKO/1 orDKO/2 liver. In contrast, the phosphorylation of Akt(S473),Gsk3�(S9), and S6K(pS389) does not absolutely require Irs1or Irs2, although the increase from the fasting to fed stateoccurs more normally in the DKO/1 or DKO/2 mice. The basalphosphorylation of Akt(T308) is high in the DKO/1 liver but is
FIG. 7. Gene expression in fasted or fed livers from 4-month-old CNTR, LKO1, and LKO2 mice maintained on the HFD. Real-time PCR datafor each gene were normalized against the corresponding fasted CNTR mouse values. Open circles represent expression in the fasted mice, andclosed circles represent expression in the fed mice. Each graph is annotated with the value of the vector defining the expression change betweenfasted and fed mice (n � 3 mice per group). �, P 0.05 versus feeding-stimulated change in CNTR mice.
VOL. 29, 2009 Irs1 IS DOMINANT IN HEPATIC NUTRIENT HOMEOSTASIS 5079
on April 10, 2019 by guest
http://mcb.asm
.org/D
ownloaded from

further stimulated by feeding, which might explain the betterglucose tolerance observed for DKO/1 mice. Gsk3�(S9) phos-phorylation is stronger in the DKO/1 mice than in the DKO/2mice, whereas Foxo1(S253) and S6K(pS389) phosphorylationis indistinguishable. In contrast, postprandial aPKC activityincreases normally in CNTR and LKO1 mice but not in fedLKO2 or DKO mice, consistent with a specific link to Irs2-mediated PI3K signaling (7, 39). Additional work is needed tounderstand how Irs2 couples specifically to aPKC and to iden-tify the Irs1/2-independent mechanisms that promote phos-phorylation of Akt(S473), Gsk3�(S9), and S6K(pS389) in fedDKO mice.
After prolonged maintenance on an HFD, feeding still stim-ulates Irs1 tyrosine phosphorylation in CNTR and LKO2 mice,whereas it fails to stimulate Irs2 phosphorylation in CNTR andLKO1 mice. While Akt(T308) phosphorylation is stimulated ineither case, this seems slightly stronger in LKO2 mice than inLKO1 mice. Consistent with chow-fed mice, postprandialaPKC activation proceeds normally in the LKO1 liver but failsin the LKO2 liver. Earlier data suggest that aPKC—especiallyPKC that is most abundant in the liver—mainly promotesSREBP-1c expression and triglyceride synthesis (20, 39),whereas Akt suppresses gluconeogenic gene expression viaFoxo1 (12, 21, 36, 45, 47). However, constitutively active Akt
FIG. 8. Feeding-stimulated signaling in livers of HFD- and chow-fed LKO1 and LKO2 mice. Liver tissues from duplicate male mice fasted for20 h or fed for 4 h after the 20-h fast were analyzed by immunoprecipitation and/or immunoblotting. Tyrosine phosphorylation (pY) of Irs1 (Aand B) and Irs2 (C and D) was determined by immunoprecipitation and immunoblotting with antiphosphotyrosine antibody. Feeding-stimulatedphosphorylation of Akt(T308) (E) and aPKC activity (n � 3 per group) (F and G). Bars represent averages � SEM; the quantitated signals areshown beneath each graph. The intensity of each signal (numerator) was analyzed using a general linear model, with genotype and fasted or fedstate as factors and expression (or expression of actin for pY) as a numerical covariate to correct the signal for variable expression. Statisticalsignificance was set at P 0.05 using the Bonferroni correction for multiple comparisons; �, P 0.05 versus genotype and fasted state; �, P 0.05 versus CNTR fasted state; �, P 0.05 versus CNTR fed state.
5080 GUO ET AL. MOL. CELL. BIOL.
on April 10, 2019 by guest
http://mcb.asm
.org/D
ownloaded from

also increases Srebp1c gene expression and induces markedhypertriglyceridemia (26). Likewise, activation of aPKC by in-sulin or by metformin via AMPK phosphorylates CBP/p300 atSer436 to disrupt association with the CREB-TORC2 complex,a key component in the control of gluconeogenic gene expres-sion (13a). Moreover, phosphorylation of CBP/p300 at Ser1834by Akt disrupts association of CBP with C/EBP�, inhibitinghepatic gene expression (10). Thus, Akt and aPKC both con-tribute substantially to the control of gluconeogenic and lipo-genic gene expression, as summarized in Fig. 9.
Our studies indicate that postprandial expression of the Gck,Fasn, Srebp1c and Srebp2 genes are, in general, slightly re-duced in the DKO/1 or LKO2 liver but substantially reduced inthe DKO/2 or LKO1 liver, demonstrating the primary impor-tance of Irs1 for the control of triglyceride synthetic geneexpression in this system. However, glucose itself can promoteexpression of lipogenic genes, including the Fasn and Accgenes, via an insulin-independent pathway involving Chrebp(14) (Fig. 9). This pathway is likely to have augmented expres-sion of these genes in hyperglycemic chow-fed DKO and HFD-fed LKO1 mice (Fig. 9). Nevertheless, circulating triglycerideconcentrations in these mice were significantly lower thanthose in controls.
Although the HFD clearly distinguishes hepatic Irs1 signal-ing from Irs2 signaling, the moderate cost of deleting hepaticIrs2 in chow-fed mice can be detected by glucose and insulintolerance tests. A joint requirement for Irs1 and Irs2 is de-tected by the hyperinsulinemic-euglycemic clamp conductedwith a low insulin infusion rate (2.5 mU kg�1 min�1), whichstrongly suppresses hepatic glucose production in CNTR mice,but not in LKO1 or LKO2 mice. Using a higher insulin infu-sion rate (5.0 mU kg�1 min�1 for their LKO1 mice, or 7.5 mUkg�1 min�1 for their LKO2 mice), Kubota et al. (16) foundthat glucose production is inhibited more strongly in LKO1liver than in LKO2 liver, suggesting that Irs2 is critical tosuppress glucose production. A conservative synthesis of theseresults is that both Irs1 and Irs2 are required for the mostsensitive hepatic response and Irs1 is more important duringnutrient excess or when insulin is limiting.
In addition to directly suppressing gluconeogenesis throughIrs1- and Irs2-mediated signaling in hepatocytes, insulin alsohas indirect effects upon hepatic glucose production throughaction in the hypothalamus (30). Several reports suggest that
hypothalamic insulin action is mediated via Irs2 and transmit-ted to the liver through the vagus nerve (24, 25, 29, 30).Whether this central effect of insulin upon the liver is sufficientto suppress glucose production is controversial (3). However,our results indicate that direct hepatic insulin signalingthrough either Irs1 or Irs2 is essential for the central effect ofinsulin, because glucose production is not inhibited in fastingDKO mice by central insulin infusion. Unlike peripheral insu-lin infusion, which requires both Irs1 and Irs2 for full effect,centrally infused insulin requires either hepatic Irs1 or Irs2.Our previous work suggests that the normal transition betweenthe fasting and postprandial states depends upon the inactiva-tion of hepatic Foxo1 by insulin, which is nearly impossible toachieve in DKO mice (6). In comparison, insulin-resistantDKO mice without hepatic Foxo1 display nearly normal fastingand postprandial glucose homeostasis. Thus, inactivation ofFoxo1—or the deletion of Foxo1 in DKO mice—might berequired for the hepatic response to the central insulin. Directexperimentation of the triple knockout mice is needed to testthis hypothesis.
The acute suppression of both Irs1 and Irs2 by at least 80%in the liver, using shRNA, produces effects upon glucose ho-meostasis that are similar to those in DKO/1, DKO/2, andDKO mice (40). However, lipid homeostasis is different inthese experimental models; the residual Irs signal in DKO/1and DKO/2 mice is composed of either Irs1 or Irs2, respec-tively, while the residual Irs signal in shRNA-treated mice iscomposed of mixtures of Irs1 and Irs2. In both models, glu-coneogenic gene expression is nearly normal in liver retainingIrs1 but abnormal in liver in which Irs1 is reduced or absent. Adifference is that Srebp1c and Fasn mRNAs increase in livertreated with shRNA against Irs2 or both Irs1 and Irs2, leadingto the conclusion that Irs2 is the principal regulator of hepaticlipogenesis (40). Regardless, the transition of these genes fromthe fasted state to the postprandial state is nearly normal inDKO/1 mice but reduced significantly in DKO/2 and DKOmice; a similar pattern emerges in the LKO1 and LKO2 micefed an HFD. Thus, our results support the hypothesis that Irs1is the dominant regulator of hepatic gene expression control-ling lipogenesis—probably because it mediates the long-termeffects of insulin needed to induce Srebp1c.
In summary, a low concentration of Irs1 or Irs2 can mediatethe fasting and postprandial hepatic insulin response to feed-ing under conditions of ordinary nutrition provided by chowdiets. However, a dominant role for Irs1 is seen during nutrientexcess, in conjunction with reduced feeding-stimulated signal-ing by Irs2. While persistent Irs1 signaling better controls he-patic glucose homeostasis, it also promotes lipogenesis that canlead to hepatic steatosis. Thus, characteristics of dyslipidemiawere most prominent in the hyperinsulinemic shRNA-treatedmice—which retain low concentrations of Irs1 and Irs2—sug-gesting that hyperinsulinemia in the presence of diminishedIrs1/2 signaling might promote steatosis (40). Although ourDKO mice are also hyperinsulinemic, they lack Irs1 and Irs2,so the chronic effect upon lipogenesis is largely absent (13).Consistent with the study by Kubota et al. (16), Irs2 appears tobe important in the early postprandial period to augment theinitial response to insulin—not as the exclusive suppressor ofhepatic glucose production—but to reduce the requirement for
FIG. 9. Model of regulation of hepatic gene expression and metab-olism by Irs1 and Irs2 via Akt and aPKC. AMPK, AMP-activatedprotein kinase; 3, activation; �, inhibition.
VOL. 29, 2009 Irs1 IS DOMINANT IN HEPATIC NUTRIENT HOMEOSTASIS 5081
on April 10, 2019 by guest
http://mcb.asm
.org/D
ownloaded from

long-term insulin action that can lead to Irs1-mediated lipidproduction.
ACKNOWLEDGMENTS
This work was funded by the Howard Hughes Medical Institute andU.S. National Institutes of Health grants DK038712 and DK055326.S.G. is supported by an American Diabetes Association Junior Facultygrant (7-07-JF-27).
REFERENCES
1. Araki, E., M. A. Lipes, M. E. Patti, J. C. Bruning, B. Haag III, R. S. Johnson,and C. R. Kahn. 1994. Alternative pathway of insulin signalling in mice withtargeted disruption of the IRS-1 gene. Nature 372:186–190.
2. Baumann, C. A., V. Ribon, M. Kanzaki, D. C. Thurmond, S. Mora, S.Shigematsu, P. E. Bickel, J. E. Pessin, and A. R. Saltiel. 2000. CAP definesa second signalling pathway required for insulin-stimulated glucose trans-port. Nature 407:202–207.
3. Buettner, C., R. Patel, E. D. Muse, S. Bhanot, B. P. Monia, R. McKay, S.Obici, and L. Rossetti. 2005. Severe impairment in liver insulin signaling failsto alter hepatic insulin action in conscious mice. J. Clin. Investig. 115:1306–1313.
4. Chiang, S. H., C. A. Baumann, M. Kanzaki, D. C. Thurmond, R. T. Watson,C. L. Neudauer, I. G. Macara, J. E. Pessin, and A. R. Saltiel. 2001. Insulin-stimulated GLUT4 translocation requires the CAP-dependent activation ofTC10. Nature 410:944–948.
5. Dong, X., S. Park, X. Lin, K. Copps, X. Yi, and M. F. White. 2006. Irs1 andIrs2 signaling is essential for hepatic glucose homeostasis and systemicgrowth. J. Clin. Investig. 116:101–114.
6. Dong, X. C., K. D. Copps, S. Guo, Y. Li, R. Kollipara, R. A. DePinho, andM. F. White. 2008. Inactivation of hepatic Foxo1 by insulin signaling isrequired for adaptive nutrient homeostasis and endocrine growth regulation.Cell Metab. 8:65–76.
7. Farese, R. V., M. P. Sajan, and M. L. Standaert. 2005. Atypical proteinkinase C in insulin action and insulin resistance. Biochem. Soc. Trans. 33:350–353.
8. Girard, J. 2006. The inhibitory effects of insulin on hepatic glucose produc-tion are both direct and indirect. Diabetes 55(Suppl. 2):S65–S69.
9. Gribble, F. M. 2005. Metabolism: a higher power for insulin. Nature 434:965–966.
10. Guo, S., S. B. Cichy, X. He, Q. Yang, M. Ragland, A. K. Ghosh, P. F.Johnson, and T. G. Unterman. 2001. Insulin suppresses transactivation byCAAT/enhancer-binding proteins beta (C/EBPbeta). Signaling to p300/CREB-binding protein by protein kinase B disrupts interaction with themajor activation domain of C/EBPbeta. J. Biol. Chem. 276:8516–8523.
11. Guo, S., S. L. Dunn, and M. F. White. 2006. The reciprocal stability ofFOXO1 and IRS2 creates a regulatory circuit that controls insulin signaling.Mol. Endocrinol. 20:3389–3399.
12. Guo, S., G. Rena, S. Cichy, X. He, P. Cohen, and T. Unterman. 1999.Phosphorylation of serine 256 by protein kinase B disrupts transactivation byFKHR and mediates effects of insulin on insulin-like growth factor-bindingprotein-1 promoter activity through a conserved insulin response sequence.J. Biol. Chem. 274:17184–17192.
13. Haeusler, R. A., and D. Accili. 2008. The double life of Irs. Cell Metab. 8:7–9.13a.He, L., A. Sabet, S. Djedjos, R. Meller, X. Sun, M. A. Hussain, S. Radovick,
and F. E. Wondisford. 2009. Metformin and insulin suppress hepatic glu-coneogenesis through phosphorylation of CREB binding protein. Cell 137:635–646.
14. Ishii, S., K. Iizuka, B. C. Miller, and K. Uyeda. 2004. Carbohydrate responseelement binding protein directly promotes lipogenic enzyme gene transcrip-tion. Proc. Natl. Acad. Sci. USA 101:15597–15602.
15. Kotani, K., P. Wilden, and T. S. Pillay. 1998. SH2-Balpha is an insulin-receptor adapter protein and substrate that interacts with the activation loopof the insulin-receptor kinase. Biochem. J. 335:103–109.
16. Kubota, N., T. Kubota, S. Itoh, H. Kumagai, H. Kozono, I. Takamoto, T.Mineyama, H. Ogata, K. Tokuyama, M. Ohsugi, T. Sasako, M. Moroi, K.Sugi, S. Kakuta, Y. Iwakura, T. Noda, S. Ohnishi, R. Nagai, K. Tobe, Y.Terauchi, K. Ueki, and T. Kadowaki. 2008. Dynamic functional relay be-tween insulin receptor substrate 1 and 2 in hepatic insulin signaling duringfasting and feeding. Cell Metab. 8:49–64.
17. Lin, X., A. Taguchi, S. Park, J. A. Kushner, F. Li, Y. Li, and M. F. White.2004. Dysregulation of insulin receptor substrate 2 in beta cells and braincauses obesity and diabetes. J. Clin. Investig. 114:908–916.
18. Reference deleted.19. Lock, P., F. Casagranda, and A. R. Dunn. 1999. Independent SH2-binding
sites mediate interaction of Dok-related protein with RasGTPase-activatingprotein and Nck. J. Biol. Chem. 274:22775–22784.
20. Matsumoto, M., W. Ogawa, K. Akimoto, H. Inoue, K. Miyake, K. Fu-rukawa, Y. Hayashi, H. Iguchi, Y. Matsuki, R. Hiramatsu, H. Shimano,N. Yamada, S. Ohno, M. Kasuga, and T. Noda. 2003. PKClambda in liver
mediates insulin-induced SREBP-1c expression and determines both he-patic lipid content and overall insulin sensitivity. J. Clin. Investig. 112:935–944.
21. Matsumoto, M., A. Pocai, L. Rossetti, R. A. DePinho, and D. Accili. 2007.Impaired regulation of hepatic glucose production in mice lacking the fork-head transcription factor foxo1 in liver. Cell Metab. 6:208–216.
22. Mora, A., C. Lipina, F. Tronche, C. Sutherland, and D. R. Alessi. 2005.Deficiency of PDK1 in liver results in glucose intolerance, impairment ofinsulin-regulated gene expression and liver failure. Biochem. J. 385:639–648.
23. Noguchi, T., T. Matozaki, K. Inagaki, M. Tsuda, K. Fukunaga, Y. Kitamura,T. Kitamura, K. Shii, Y. Yamanashi, and M. Kasuga. 1999. Tyrosine phos-phorylation of p62(Dok) induced by cell adhesion and insulin: possible rolein cell migration. EMBO J. 18:1748–1760.
24. Obici, S., Z. Feng, G. Karkanias, D. G. Baskin, and L. Rossetti. 2002.Decreasing hypothalamic insulin receptors causes hyperphagia and insulinresistance in rats. Nat. Neurosci. 5:566–572.
25. Obici, S., B. B. Zhang, G. Karkanias, and L. Rossetti. 2002. Hypothalamicinsulin signaling is required for inhibition of glucose production. Nat. Med.8:1376–1382.
26. Ono, H., H. Shimano, H. Katagiri, N. Yahagi, H. Sakoda, Y. Onishi, M. Anai,T. Ogihara, M. Fujishiro, A. Y. Viana, Y. Fukushima, M. Abe, N. Shojima,M. Kikuchi, N. Yamada, Y. Oka, and T. Asano. 2003. Hepatic Akt activationinduces marked hypoglycemia, hepatomegaly, and hypertriglyceridemia withsterol regulatory element binding protein involvement. Diabetes 52:2905–2913.
27. Pawson, T., and J. D. Scott. 1997. Signaling through scaffold, anchoring, andadaptor proteins. Science 278:2075–2080.
28. Plum, L., B. F. Belgardt, and J. C. Bruning. 2006. Central insulin action inenergy and glucose homeostasis. J. Clin. Investig. 116:1761–1766.
29. Pocai, A., T. K. Lam, R. Gutierrez-Juarez, S. Obici, G. J. Schwartz, J. Bryan,L. Huilar-Bryan, and L. Rossetti. 2005. Hypothalamic K(ATP) channelscontrol hepatic glucose production. Nature 434:1026–1031.
30. Pocai, A., S. Obici, G. J. Schwartz, and L. Rossetti. 2005. A brain-liver circuitregulates glucose homeostasis. Cell Metab. 1:53–61.
31. Postic, C., and M. A. Magnuson. 2000. DNA excision in liver by an albumin-Cre transgene occurs progressively with age. Genesis 26:149–150.
32. Previs, S. F., D. J. Withers, J. M. Ren, M. F. White, and G. I. Shulman. 2000.Contrasting effects of IRS-1 versus IRS-2 gene disruption on carbohydrateand lipid metabolism in vivo. J. Biol. Chem. 275:38990–38994.
33. Rother, K. I., Y. Imai, M. Caruso, F. Beguinot, P. Formisano, and D. Accili.1998. Evidence that IRS-2 phosphorylation is required for insulin action inhepatocytes. J. Biol. Chem. 273:17491–17497.
34. Sajan, M. P., M. L. Standaert, A. Miura, C. R. Kahn, and R. V. Farese. 2004.Tissue-specific differences in activation of atypical protein kinase C andprotein kinase B in muscle, liver and adipocytes of insulin receptor sub-strate-1 knockout mice. Mol. Endocrinol. 18:2513–2521.
35. Saltiel, A. R., and C. R. Kahn. 2001. Insulin signalling and the regulation ofglucose and lipid metabolism. Nature 414:799–806.
36. Schmoll, D., K. S. Walker, D. R. Alessi, R. Grempler, A. Burchell, S. Guo,R. Walther, and T. G. Unterman. 2000. Regulation of glucose-6-phos-phatase gene expression by protein kinase Balpha and the forkheadtranscription factor FKHR. Evidence for insulin response unit-dependentand -independent effects of insulin on promoter activity. J. Biol. Chem.275:36324–36333.
37. Standaert, M. L., M. P. Sajan, A. Miura, Y. Kanoh, H. C. Chen, R. V. Farese,Jr., and R. V. Farese. 2004. Insulin-induced activation of atypical proteinkinase C, but not protein kinase B, is maintained in diabetic (ob/ob andGoto-Kakazaki) liver. Contrasting insulin signaling patterns in liver versusmuscle define phenotypes of type 2 diabetic and high fat-induced insulin-resistant states. J. Biol. Chem. 279:24929–24934.
38. Tamemoto, H., T. Kadowaki, K. Tobe, T. Yagi, H. Sakura, T. Hayakawa, Y.Terauchi, K. Ueki, Y. Kaburagi, S. Satoh, H. Sekihara, S. Yoshioka, H.Horikoshi, Y. Furuta, Y. Ikawa, M. Kasuga, Y. Yazaki, and S. Aizawa. 1994.Insulin resistance and growth retardation in mice lacking insulin receptorsubstrate-1. Nature 372:182–186.
39. Taniguchi, C. M., T. Kondo, M. Sajan, J. Luo, R. Bronson, T. Asano, R.Farese, L. C. Cantley, and C. R. Kahn. 2006. Divergent regulation of hepaticglucose and lipid metabolism by phosphoinositide 3-kinase via Akt andPKClambda/zeta. Cell Metab. 3:343–353.
40. Taniguchi, C. M., K. Ueki, and C. R. Kahn. 2005. Complementary roles ofIRS-1 and IRS-2 in the hepatic regulation of metabolism. J. Clin. Investig.115:718–727.
41. Valverde, A. M., D. J. Burks, I. Fabregat, T. L. Fisher, J. Carretero, M. F.White, and M. Benito. 2003. Molecular mechanisms of insulin resistance inIRS-2-deficient hepatocytes. Diabetes 52:2239–2248.
42. White, M. F. 2003. Insulin signaling in health and disease. Science 302:1710–1711.
43. White, M. F., and C. R. Kahn. 1994. The insulin signaling system. J. Biol.Chem. 269:1–4.
44. Withers, D. J., J. S. Gutierrez, H. Towery, D. J. Burks, J. M. Ren, S. Previs,Y. Zhang, D. Bernal, S. Pons, G. I. Shulman, S. Bonner-Weir, and M. F.
5082 GUO ET AL. MOL. CELL. BIOL.
on April 10, 2019 by guest
http://mcb.asm
.org/D
ownloaded from
White. 1998. Disruption of IRS-2 causes type 2 diabetes in mice. Nature391:900–904.
45. Yeagley, D., S. Guo, T. Unterman, and P. G. Quinn. 2001. Gene- andactivation-specific mechanisms for insulin inhibition of basal and glucocor-ticoid-induced insulin-like growth factor binding protein-1 and phosphoenol-pyruvate carboxykinase transcription. Roles of forkhead and insulin re-sponse sequences. J. Biol. Chem. 276:33705–33710.
46. Yenush, L., and M. F. White. 1997. The IRS-signaling system during insulinand cytokine action. Bioessays 19:491–500.
47. Zhang, W., S. Patil, B. Chauhan, S. Guo, D. R. Powell, J. Le, A. Klotsas, R.Matika, X. Xiao, R. Franks, K. A. Heidenreich, M. P. Sajan, R. V. Farese, D. B.Stolz, P. Tso, S. H. Koo, M. Montminy, and T. G. Unterman. 2006. FoxO1regulates multiple metabolic pathways in the liver: effects on gluconeogenic,glycolytic, and lipogenic gene expression. J. Biol. Chem. 281:10105–10117.
VOL. 29, 2009 Irs1 IS DOMINANT IN HEPATIC NUTRIENT HOMEOSTASIS 5083
on April 10, 2019 by guest
http://mcb.asm
.org/D
ownloaded from