the ipox® weekenglish... · payment processors redecard (rdcd3 bs: +10.14%) and cielo (ciel3 bs:...
TRANSCRIPT

The IPOX® Week www.ipoxschuster.com Jul 29, 2011
Summary U.S. markets strongly underperformed their international counterparts amid a toxic mix of U.S. political vacuum, weak U.S. macroeconomic data and big declines in selected stocks on earnings. Momentum for strong brands benefited pricings in the key U.S. IPOs. Dark clouds surface over the exuberant U.S. IPO pricing sentiment front.
[ Week 8/01/2011 ]
Highlights The IPOX universe fell last week, with the IPOX Global 50
(IPGL50: -1.88% to +4.25% YTD) and IPOX Asia-Pacific 30 (IPTA: +0.26% to +16.32% YTD) strongly outpacing the global and regional benchmarks.
75/100 stocks in the broad IPOX Global Index (IPGL100) fell, with the average (median) equally-weighted index member shedding -2.42% (-2.19%), slightly more than the applied market-cap weighted index.
The IPOX Asia-Pacific 30 (IPTA) was the key beneficiary from the re-adjustment of the U.S. /H.K. spread as markets finally focused on the sound macroeconomic outlook for Asia-Pacific and oversold conditions. Its year-over-year spread versus benchmark MSCI Asia-Pacific (MXPC) extended to a massive +2719 bps. Strong earnings of key large-cap holdings supported, with Sands China (1928 HK: +6.54%) and AIA Group (1299 HK: +6.46%) in focus.
The IPOX U.S. universe was unable to withstand the dramatic change in U.S. equity sentiment and the big fall in the Russell 2000 Index (RUT: -5.32%). The IPOX U.S. 30 Index (IPXT) fell by -4.93% to +4.75% YTD, underperforming benchmark S&P 500 by a large 101 bps. Substantial declines in two of the largest recent U.S. private-equity backed IPOs HCA Holdings (HCA: -22.91%) and NXP Semiconductor (NXPI: -13.02%) – amongst others - point to dark clouds surfacing over the exuberant U.S. initial IPO pricing sentiment front. Bankers were able to price non-dividend paying HCA on top of its upward revised price range earlier in the year. IPOX U.S. member Emdeon (EM UN: +16.28%) rose on takeover speculation.
We note relative firmness amongst the IPOX Emerging Markets universe (IPXUEM), including IPOX China (CNI and IPXUCHCP) and IPOX Latin America (IPXULATT). With Brazil’s Bovespa (IBOV: -2.40% to -15.12%) having
Key IPOX Indexes Returns YTD:
IPOX Return
Week (%) 2011 Return
YTD (%) +/- Benchmark
YTD
IPGLC (USD) -2.07 +1.31 .
IPGL50 (USD) -1.88 +4.25 Significant +
IPGL30 (USD) -2.62 +3.96 Significant +
IPXO (USD) -4.86 +5.24 Significant + IPXT (USD) -4.93 +4.75 Significant +
IXTE (EUR) -2.78 -4.82 .
IPTA (USD) +0.17 +16.22 Significant +
IPXUEM (USD) -1.00 -3.68 .
IPXUBRIC (USD) -2.72 -10.64 Significant -
IPXUCHCP (USD) -0.57 +0.01 . CNI (USD) -0.82 -1.24 . IPXUCAUP (USD) -3.13 -6.93 Significant -
IPXULATT (USD) -1.55 -8.89 Significant -
officially entered bear market territory in local currency terms, we note last week’s upswing in Brazil’s leading payment processors Redecard (RDCD3 BS: +10.14%) and Cielo (CIEL3 BS: +5.87%). Most significant IPOs launched: (Week 07/25/2011):
Company Ticker Return / IPO (%)
Abril Educacao SA ABRE11 BZ -6.50%
Dunkin' Brands Group Inc DNKN US 52.26%
Tangoe Inc TNGO US 16.00%
Chefs' Warehouse Holdings CHEF US 18.33%
Sun Art Retail Group Ltd 6808 HK 39.17%
Teavana Holdings Inc TEA US 65.88%
Wesco Aircraft Holdings WAIR US -0.13%
C&J Energy Services Inc CJES US 5.17%
Focus Media Network Ltd 8112 HK 8.33%
Horizon Pharma Inc HZNP US 0.44%
Indiscriminate demand from positive feed-back traders, hedge funds as well as long-run IPO investors helped last week’s key U.S. deals, despite the plunge associated with a string of U.S. and Chinese IPOs recently issued (e.g. HCA, NXPI, TNAV, ACOM, CIE): Our top picks of last week - specialty consumer stocks Dunkin’ Brands (DNKN US: +52.26%) and Teavana Holdings (TEA US: +65.88%) - debuted strongest amongst the number of U.S. deals.
In total, 18 accessible global IPOs debuted, with the average (median) IPO gaining +18.86% (+8.83%). We note the strong debut of Tiger N.Y.-backed Sun Art Retail Group Ltd. (6808 HK: +39.17%) and Focus Media Network Ltd. (8112 HK: +8.33%), underlying the increasingly positive momentum for the beating down H.K. IPO market.
The continued weakness in the mainland benchmarks finally took a slight dent on initial IPO sentiment in the Chinese A Shares market: 3 deals priced with the average (median) equally-weighted IPO gaining +26.24% (+29.53%), a decline for the previous week.
Upcoming IPOs: (Week: 08/01/2011): Company Ticker Day Lead
WhiteGlove Health WGH US 8/4 RODMAN, WRHAMB
WageWorks Inc WAGE US 8/5 CS, WBC
Seasonally motivated, no sizeable deals are lined up for this upcoming week. Health care firm WhiteGlobe Health (WGH US) – originally expected last week - is the first IPO YTD to chose an IPO auction for its ‘going public’.
We expect small/micro-cap health care technology provider WageWorks Inc. (WAGE US) to benefit from the unabatedly strong interest for U.S. domiciled IPOs in specialty consumer or technology.
Ask us how you can become an IPOX Licensing Partner – Contact: Dr. Josef Schuster – www.ipoxschuster.com - 001.312.264. 4410 email: [email protected]

IPOX-100® Global Index
www.ipoxschuster.com Jul 29, 2011
Objective
To provide access into the growth and innovativeness of the global economy and trends in Equity Capital Markets Activity in developed countries within a disciplined and totally transparent index methodology. The IPOX-100 Global Index captures the performance of the Top 100 largest and generally most liquid IPOs and spin-offs in developed and emerging countries ranked quarterly by market capitalization in the underlying IPOX Global Composite Index. The Index has historically captured around 75% of the total market capitalization in the IPOX Global Composite Index and applies certain diversification rules, such as a 10% capping on the largest constituents and a minimum average daily equity turnover of approximately USD 10 million.
Summary Statistics Top 10 Holdings Sector Breakdown
Number of Holdings 100 1. Philip Morris International Consumer Discretionary 11.36 %
Total Market Cap (USDbn) 1375.91 2. Ecopetrol SA ADR Consumer Staples 13.18
Average Market Cap (USDbn) 13.76 3. Visa Inc Energy 15.35
Median Market Cap (USDbn) 8.96 4. Glencore International PLC Financials 19.76
Largest Constituent (USDbn) 126.57 5. AIA Group Ltd Health Care 4.46
Smallest Constituent (USDbn) 1.70 6. General Motors Company Industrials 4.72
Total Return (2010) (%) 7.67 7. BANCO SANTANDER BRASIL-ADS Information Technology 12.79
Daily Equity Turnover (Index) USD 3.5bn 8. OGX Petroleo E Gas Participa Materials 12.35
Liquidity Adjustment YES 9. Covidien Plc Telecom Services 2.10
Ticker Symbol BBG <IPGL100> INDEX 10. Sands China Ltd. Utilities 3.94
Closing Index level (USD) (P) 596.97 0
Price Performance (%) (USD based)
Total Market Cap/Dispersion
Breakdown (USD)(% and #Co’s) Period IPOX-100
Global MSCI
MXWD S&P 500 Dow Jones Stoxx 50
Giant > 44.8 bn 26.94 5 5 days -2.17 % -2.91 % -3.92 % -2.00 %
Large < 44.8 bn 53.57 48 2011 YTD 2.72 1.59 2.75 -2.84
Mid < 8.6 bn 19.49 47 2010 5.27 10.42 12.78 -6.46
Small < 1.6 bn 0.00 0 2009 42.47 31.52 23.45 27.32
Micro < 451 ml 0.00 0 2008 -50.75 -43.45 -38.49 -45.76
2007 29.52 9.59 3.53 10.47
2006 42.80 18.84 13.62 23.41
Best weekly Performer (%) 2005 20.69 8.85 3.00 4.45
1. Redecard - ON 10.14 1 year 13.75 15.58 17.32 10.88
2. Turkiye Halk Bankasi 8.77 3 years -2.41 -0.57 0.76 -6.60
3. Sands China Ltd. 6.54 5 years 4.13 0.52 0.21 -4.01
10 years 9.56 2.91 0.69 0.73
Worst weekly Performer (%) IPOX-100 Global Base Date: 02/01/1999, annualized returns (p.a.)
1. HCA Holdings Inc -22.91
2. Cobalt International -16.64 Comparative Historical Volatility (%) Bloomberg
3. NXP Semiconductor NV -13.02 Days IPGL100 MXWD SPX SX5L
10 14.28 % 16.99 % 17.81 % 25.99 %
Exposure 50 15.64 15.33 15.52 22.65
VALUE BLEND GROWTH 100 13.58 14.03 13.90 21.67
LARGE
MID Regional Markets Breakdown (%)
SMALL Asia-Pacific 31.33 % EU +Russia 32.35 % Americas 36.82 %
Areas of current exposure Developed Markets 51.79 % Emerging Markets 48.21 % © IPOX Schuster LLC. IPOX is a registered international trademark of IPOX Schuster LLC. Index of Initial Public Offerings (IPOX) and IPOX Derivatives
Patent No. US 7,698,197. Past performance is no guarantee of comparable future performance. Please consider the investment objectives, risks, and charges and expenses of the carefully before investing. To receive more information on IPOX IPO Indexes and IPOX Analytics, contact [email protected] call (312) 264-4410.
IPOX-30® Global Index
www.ipoxschuster.com Jul 29, 2011
Objective
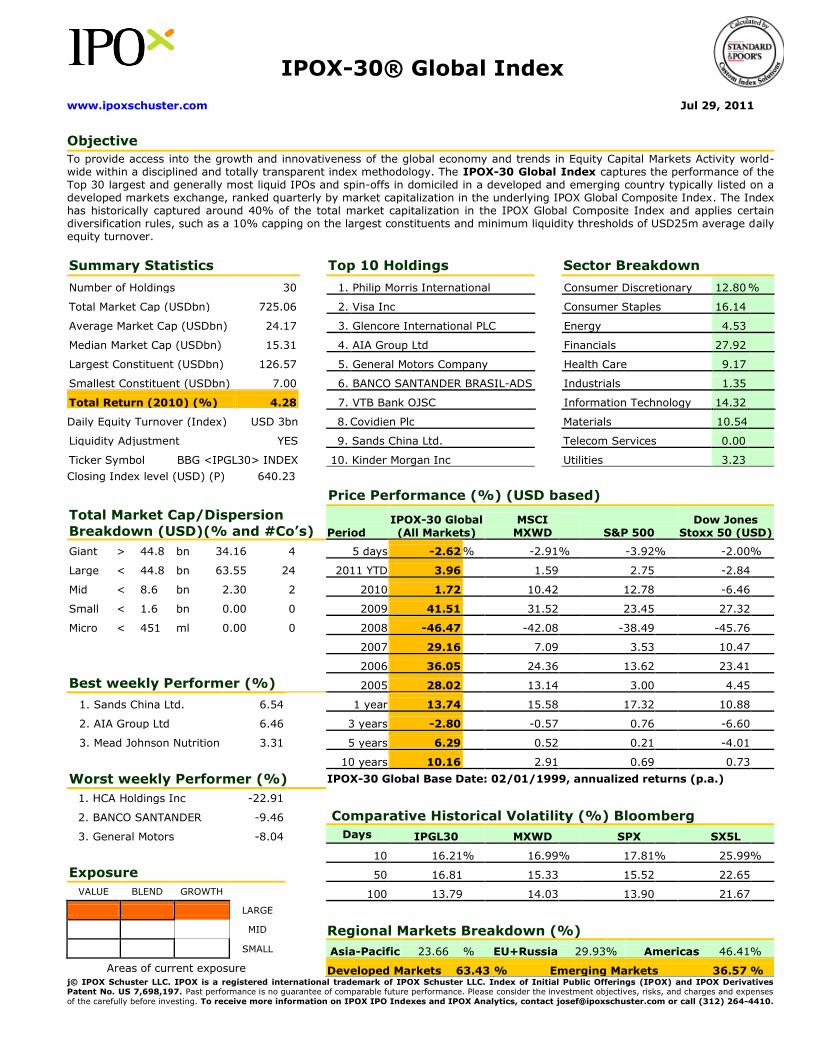
To provide access into the growth and innovativeness of the global economy and trends in Equity Capital Markets Activity world-wide within a disciplined and totally transparent index methodology. The IPOX-30 Global Index captures the performance of the Top 30 largest and generally most liquid IPOs and spin-offs in domiciled in a developed and emerging country typically listed on a developed markets exchange, ranked quarterly by market capitalization in the underlying IPOX Global Composite Index. The Index has historically captured around 40% of the total market capitalization in the IPOX Global Composite Index and applies certain diversification rules, such as a 10% capping on the largest constituents and minimum liquidity thresholds of USD25m average daily equity turnover.
Summary Statistics Top 10 Holdings Sector Breakdown
Number of Holdings 30 1. Philip Morris International Consumer Discretionary 12.80 %
Total Market Cap (USDbn) 725.06 2. Visa Inc Consumer Staples 16.14
Average Market Cap (USDbn) 24.17 3. Glencore International PLC Energy 4.53
Median Market Cap (USDbn) 15.31 4. AIA Group Ltd Financials 27.92
Largest Constituent (USDbn) 126.57 5. General Motors Company Health Care 9.17
Smallest Constituent (USDbn) 7.00 6. BANCO SANTANDER BRASIL-ADS Industrials 1.35
Total Return (2010) (%) 4.28 7. VTB Bank OJSC Information Technology 14.32
Daily Equity Turnover (Index) USD 3bn 8. Covidien Plc Materials 10.54
Liquidity Adjustment YES 9. Sands China Ltd. Telecom Services 0.00
Ticker Symbol BBG <IPGL30> INDEX 10. Kinder Morgan Inc Utilities 3.23
Closing Index level (USD) (P) 640.23 0
Price Performance (%) (USD based)
Total Market Cap/Dispersion
Breakdown (USD)(% and #Co’s) Period IPOX-30 Global (All Markets)
MSCI MXWD S&P 500
Dow Jones Stoxx 50 (USD)
Giant > 44.8 bn 34.16 4 5 days -2.62 % -2.91 % -3.92 % -2.00 %
Large < 44.8 bn 63.55 24 2011 YTD 3.96 1.59 2.75 -2.84
Mid < 8.6 bn 2.30 2 2010 1.72 10.42 12.78 -6.46
Small < 1.6 bn 0.00 0 2009 41.51 31.52 23.45 27.32
Micro < 451 ml 0.00 0 2008 -46.47 -42.08 -38.49 -45.76
2007 29.16 7.09 3.53 10.47
2006 36.05 24.36 13.62 23.41
Best weekly Performer (%) 2005 28.02 13.14 3.00 4.45
1. Sands China Ltd. 6.54 1 year 13.74 15.58 17.32 10.88
2. AIA Group Ltd 6.46 3 years -2.80 -0.57 0.76 -6.60
3. Mead Johnson Nutrition 3.31 5 years 6.29 0.52 0.21 -4.01
10 years 10.16 2.91 0.69 0.73
Worst weekly Performer (%) IPOX-30 Global Base Date: 02/01/1999, annualized returns (p.a.)
1. HCA Holdings Inc -22.91 2. BANCO SANTANDER -9.46 Comparative Historical Volatility (%) Bloomberg
3. General Motors -8.04 Days IPGL30 MXWD SPX SX5L
10 16.21 % 16.99 % 17.81 % 25.99 %
Exposure 50 16.81 15.33 15.52 22.65
VALUE BLEND GROWTH 100 13.79 14.03 13.90 21.67
LARGE
MID Regional Markets Breakdown (%)
SMALL Asia-Pacific 23.66 % EU+Russia 29.93 % Americas 46.41 %
Areas of current exposure Developed Markets 63.43 % Emerging Markets 36.57 % j© IPOX Schuster LLC. IPOX is a registered international trademark of IPOX Schuster LLC. Index of Initial Public Offerings (IPOX) and IPOX Derivatives Patent No. US 7,698,197. Past performance is no guarantee of comparable future performance. Please consider the investment objectives, risks, and charges and expenses
of the carefully before investing. To receive more information on IPOX IPO Indexes and IPOX Analytics, contact [email protected] or call (312) 264-4410.

IPOX-100® U.S. Index (ETF: FPX)
www.ipoxschuster.com Jul 29, 2011
Objective
To provide access into the growth and innovativeness of the U.S. economy and trends in U.S. Equity Capital Markets Activity using IPOs and spin-offs as a proxy within a disciplined and totally transparent index methodology. Based on the IPOX Global Composite Index, the IPOX-100 U.S. applies certain diversification rules and liquidity adjustments, such as a 10% capping on the largest constituents.
Summary Statistics Top 10 Holdings Sector Breakdown
Number of Holdings 100 1. Philip Morris International Consumer Discretionary 14.98 %
Total Market Cap (USDbn) 631.02 2. Visa Inc Consumer Staples 7.49
Average Market Cap (USDbn) 6.31 3. General Motors Company Energy 22.52
Median Market Cap (USDbn) 2.43 4. Covidien Plc Financials 16.99
Largest Constituent (USDbn) 126.57 5. Kinder Morgan Inc Health Care 2.01
Smallest Constituent (USDbn) 0.78 6. Lorillard Inc Industrials 5.92
Total Return (2010) (%) 19.08 7. TE Connectivity Ltd. Information Technology 5.25
Daily Equity Turnover (Index) USD 5.5bn 8. Mead Johnson Nutrition Co Materials 6.45
Liquidity Adjustment YES 9. Discover Financial Services Telecom Services 4.34
Ticker Symbol BBG <IPXO> INDEX, FPX 10. HCA Holdings Inc Utilities 14.06
Closing Index level (USD) (P) 1093.68 0
Price Performance (%)
Total Market Cap/Dispersion
Breakdown (USD)(% and #Co’s) Period IPOX-100
(FPX) S&P 500 Russell 2000
Index Nasdaq-100
Giant > 44.8 bn 36.81 5 5 days -4.86 % -3.92 % -5.32 % -2.75 %
Large < 44.8 bn 50.39 48 2011 YTD 5.24 2.75 1.71 6.54
Mid < 8.6 bn 12.79 47 2010 17.27 12.78 25.31 19.22
Small < 1.6 bn 0.00 0 2009 43.73 23.45 25.22 53.54
Micro < 451 ml 0.00 0 2008 -44.29 -38.49 -34.72 -41.89
2007 14.39 3.53 -2.73 18.67
2006 19.70 13.62 17.05 6.79
Best weekly Performer (%) 2005 23.40 3.00 3.32 1.49
1. Emdeon Inc 16.28 1 year 24.94 17.32 22.54 27.01
2. GNC Holdings Inc 8.39 3 years 3.46 0.76 3.71 8.58
3. Green Dot Corp 7.99 5 years 6.25 0.21 2.63 9.35
10 years 7.69 0.69 5.09 3.45
Worst weekly Performer (%) IPOX-100 U.S. Base Date: 01/03/1989, annualized returns (p.a.)
1. Patriot Coal Corp -24.00
2. HCA Holdings Inc -22.91 Comparative Historical Volatility (%) Bloomberg
3. BROADSOFT INC -20.08 Days IPXO SPX RUT NDX
10 20.68 % 17.81 % 24.48 % 21.40 %
Exposure 30 17.68 15.52 20.46 19.25
VALUE BLEND GROWTH 50 18.18 15.52 21.17 18.60
LARGE 100 15.44 13.90 19.16 16.48
MID 200 14.19 13.03 18.53 15.50
SMALL 400 17.44 16.68 23.38 18.51
Areas of current exposure Source: Bloomberg Analytics
© © IPOX Schuster LLC. IPOX is a registered international trademark of IPOX Schuster LLC. Index of Initial Public Offerings (IPOX) and IPOX Derivatives
Patent No. US 7,698,197. Past performance is no guarantee of comparable future performance. Please consider the investment objectives, risks, and charges and expenses
carefully before investing. To receive more information on IPOX IPO Indexes and IPOX Analytics, contact [email protected] or call (312) 264-4410.

IPOX-30® U.S. Index
www.ipoxschuster.com Jul 29, 2011
Objective
To provide access into the growth and innovativeness of the U.S. economy and trends in U.S. Equity Capital Markets Activity using IPOs and spin-offs as a proxy within a disciplined and totally transparent index methodology. Based on the IPOX Global Composite Index, the IPOX-30 U.S. applies certain diversification rules and liquidity adjustments, such as a 10% capping on the largest constituents.
Summary Statistics Top 10 Holdings Sector Breakdown
Number of Holdings 30 1. Philip Morris International Consumer Discretionary 17.02 %
Total Market Cap (USDbn) 465.76 2. Visa Inc Consumer Staples 21.60
Average Market Cap (USDbn) 15.53 3. General Motors Company Energy 8.58
Median Market Cap (USDbn) 7.27 4. Covidien Plc Financials 4.66
Largest Constituent (USDbn) 126.57 5. Kinder Morgan Inc Health Care 11.28
Smallest Constituent (USDbn) 3.60 6. Lorillard Inc Industrials 6.52
Total Return (2010) (%) 16.99 7. TE Connectivity Ltd. Information Technology 25.68
Daily Equity Turnover (Index) USD 4.4bn 8. Mead Johnson Nutrition Co Materials 1.55
Liquidity Adjustment YES 9. HCA Holdings Inc Telecom Services 1.69
Ticker Symbol BBG <IPXT> INDEX 10. Dollar General Corp Utilities 1.42
Closing Index level (USD) (P) 1150.96 0
Price Performance (%)
Total Market Cap/Dispersion
Breakdown (USD)(% and #Co’s) Period IPOX-30 U.S. S&P 500 Russell 2000
Index Nasdaq-100
Giant > 44.8 bn 31.70 3 5 days -4.93 % -3.92 % -5.32 % -2.75 %
Large < 44.8 bn 44.23 11 2011 YTD 4.75 2.75 1.71 6.54
Mid < 8.6 bn 24.07 16 2010 14.92 12.78 25.31 19.22
Small < 1.6 bn 0.00 0 2009 40.35 23.45 25.22 53.54
Micro < 451 ml 0.00 0 2008 -42.55 -38.49 -34.72 -41.89
2007 12.30 3.53 -2.73 18.67
2006 24.77 13.62 17.05 6.79
Best weekly Performer (%) 2005 27.32 3.00 3.32 1.49
1. Molycorp Inc 5.47 1 year 22.60 17.32 22.54 27.01
2. Mead Johnson Nutrition 3.31 3 years 2.06 0.76 3.71 8.58
3. Kinder Morgan Inc -0.46 5 years 6.10 0.21 2.63 9.35
10 years 8.83 0.69 5.09 3.45
Worst weekly Performer (%) IPOX-30 U.S. Base Date: 01/03/1989, annualized returns (p.a.)
1. HCA Holdings Inc -22.91
2. NXP Semiconductor NV -13.02 Comparative Historical Volatility (Bloomberg)
3. Motorola Mobility -9.06 Days IPXT SPX RUT NDX
10 22.01 % 17.81 % 24.48 % 21.40 %
Exposure 30 17.86 15.52 20.46 19.25
VALUE BLEND GROWTH 50 17.99 15.52 21.17 18.60
LARGE 100 15.10 13.90 19.16 16.48
MID 200 13.77 13.03 18.53 15.50
SMALL 400 17.12 16.68 23.38 18.51
Areas of current exposure Source: Bloomberg Analytics
© IPOX Schuster LLC. IPOX is a registered international trademark of IPOX Schuster LLC. Index of Initial Public Offerings (IPOX) and IPOX Derivatives
Patent No. US 7,698,197. Past performance is no guarantee of comparable future performance. Please consider the investment objectives, risks, and charges and expenses carefully before investing. To receive more information on IPOX IPO Indexes and IPOX Analytics, contact [email protected] or call (312) 264-4410.

IPOX-30® Europe Index
www.ipoxschuster.com Jul 29, 2011
Objective
To provide access into the growth and innovativeness of the European economy and trends in European Equity Capital Markets Activity within a disciplined and totally transparent index methodology. Based on the IPOX Global Composite Index, the IPOX-30 Europe has historically captured around 40% of the total market capitalization in the IPOX Composite Europe Index and applies certain diversification rules, such as a 10% capping on the largest constituents and is adjusted for liquidity.
Summary Statistics Top 10 Holdings Sector Breakdown
Number of Holdings 30 1. Glencore International PLC Consumer Discretionary 5.31 %
Total Market Cap (EURbn) 174.64 2. CaixaBank Consumer Staples 0.00
Average Market Cap (EURbn) 5.82 3. Galp Energia SGPS SA Energy 8.60
Median Market Cap (EURbn) 3.60 4. Eurasian Natural Resources Corp Financials 18.32
Largest Constituent (EURbn) 37.62 5. Enel Green Power SpA Health Care 0.00
Smallest Constituent (EURbn) 1.28 6. Wacker Chemie AG Industrials 17.87
Total Return (2010) (%) 9.02 7. Suez Environment SA Information Technology 5.60
Daily Equity Turnover (Index) EUR 1.2bn 8. Amadeus IT Hldg SA Materials 28.92
Liquidity Adjustment YES 9. ADP Promesses Telecom Services 0.84
Ticker Symbol BB <IXTE> INDEX 10. Bureau Veritas SA Utilities 14.53
Closing Index Level (USD) (P) 421.24
Price Performance (%)
Total Market Cap/Dispersion
Breakdown (EUR)(% and #Co’s) Period IPOX-30 Europe MSCI Europe
Dow Jones STOXX 50
DAX30 DAX
Giant > 44.8 bn 0.00 0 5 days -2.76 % -3.11 % -2.03 % -2.29 %
Large < 44.8 bn 40.52 5 2011 YTD -4.80 -4.41 -2.92 3.54
Mid < 8.6 bn 58.64 24 2010 6.42 3.90 0.04 16.06
Small < 1.6 bn 0.84 1 2009 29.69 21.56 23.76 23.85
Micro < 451 ml 0.00 0 2008 -55.26 -40.93 -43.43 -40.37
2007 13.68 3.33 -3.57 22.36
2006 26.09 15.97 10.39 22.05
Best weekly Performer (%) 2005 22.86 21.71 20.70 27.07
1. African Barrick Gold Ltd 9.44 1 year 3.19 2.07 0.97 16.69
2. Strabag SE 1.01 3 years -7.06 -2.60 -4.02 3.81
3. Amadeus IT Hldg SA 0.90 5 years -5.06 -3.71 -6.26 4.64
10 years 1.72 -1.11 -4.12 2.20
Worst weekly Performer (%) IPOX-30 Europe Base Date: 01/03/1990
1. Pandora A/S -10.64
2. Statoil Fuel & Retail ASA -9.50 Country Breakdown (by applied market cap)
3. Prysmian SpA -7.06 1. Austria 1.45 % 9. Italy 1.55 %
2. Belgium 0.00 10. Netherlands 1.64
Exposure 3. Denmark 2.88 11. Norway 0.00
VALUE BLEND GROWTH 4. Finland 0.00 12. Portugal 10.13
LARGE 5. France 20.12 13. Spain 21.21
MID 6. Germany 9.72 14. Sweden 0.00
SMALL 7. Greece 0.00 15. Switzerland 0.00
Areas of current exposure 8. Ireland 0.00 16. United Kingdom 31.31 © IPOX Schuster LLC. IPOX is a registered international trademark of IPOX Schuster LLC. Index of Initial Public Offerings (IPOX) and IPOX Derivatives
Patent No. US 7,698,197. Past performance is no guarantee of comparable future performance. Please consider the investment objectives, risks, and charges and expenses
carefully before investing. To receive more information on IPOX IPO Indexes and IPOX Analytics, contact [email protected] or call (312) 264-4410.

JPMorgan IPOX® Europe 50 Index
www.ipoxschuster.com Jul 29, 2011
Objective
To provide access into the growth and innovativeness of the European economy and trends in European Equity Capital Markets Activity within a disciplined and totally transparent index methodology. Based on the IPOX Composite Europe Index, the JP Morgan IPOX Europe 50 is a market-cap weighted index measuring the performance of the top 50 companies ranked quarterly in the IPOX Composite Europe Index. It has historically captured around 88% of total market cap of the IPOX Composite Europe Index and applies certain diversification rules, such as a 10% capping of the largest constituents.
Summary Statistics Top 10 Holdings Sector Breakdown
Number of Holdings 50 1. Glencore International PLC Consumer Discretionary 8.17 %
Total Market Cap (EURbn) 210.87 2. CaixaBank Consumer Staples 0.00
Average Market Cap (EURbn) 4.22 3. Galp Energia SGPS SA Energy 7.66
Median Market Cap (EURbn) 2.49 4. Eurasian Natural Resources Corp Financials 17.93
Largest Constituent (EURbn) 37.62 5. Enel Green Power SpA Health Care 1.55
Smallest Constituent (EURbn) 0.78 6. Wacker Chemie AG Industrials 15.88
Total Return (2010) (%) 11.2 7. Suez Environment SA Information Technology 5.68
Daily Equity Turnover (Index) EUR 1.5bn 8. Amadeus IT Hldg SA Materials 31.02
Liquidity Adjustment YES 9. ADP Promesses Telecom Services 0.66
Ticker Symbol BB <IPXUJPEU> INDEX 10. Bureau Veritas SA Utilities 11.44
Closing Index level (EUR) (P) 3147.63 0
Total Market Cap/Dispersion
Breakdown (EUR)(% and #Co’s) Period JPM IPOX IPXUJPEU
MSCI Europe MSDLE15
Dow Jones STOXX 50
DAX30 DAX
Giant > 44.8 bn 0.00 0 5 days -2.65 % -3.11 % -2.03 % -2.29 %
Large < 44.8 bn 34.39 5 2011 YTD -5.42 -4.41 -2.92 3.54
Mid < 8.6 bn 59.73 35 2010 8.45 3.90 0.04 16.06
Small < 1.6 bn 5.88 10 2009 33.26 21.56 23.76 23.85
Micro < 451 ml 0.00 0 2008 -54.43 -40.93 -43.43 -40.37
2007 14.53 3.33 -3.57 22.36
2006 31.13 15.97 10.39 22.05
Best weekly Performer (%) 2005 24.42 21.71 20.70 27.07
1. African Barrick Gold Ltd 10.10 1 year 3.19 2.07 0.97 16.69
2. CFAO 4.70 3 years -5.40 -2.60 -4.02 3.81
3. Laboratorious Almirall 3.42 5 years -3.07 -3.71 -6.26 4.64
10 years 2.97 -1.11 -4.12 2.20
Worst weekly Performer (%) Base Date: 01/02/1990, annualized returns (p.a.)
1. Pandora A/S -10.62
2. Ocado Group PLC -9.40 Comparative Historical Volatility (%) Bloomberg
3. Statoil Fuel & Retail -9.22 Days IPXUJPEU MSDLE15 SX5P DAX
10 17.57 % 18.06 % 15.96 % 15.84 %
Exposure 30 17.74 17.23 13.16 16.58
VALUE BLEND GROWTH 50 16.16 16.00 13.15 16.93
LARGE 100 14.92 15.46 13.94 18.45
MID 200 14.14 14.20 13.44 16.11
SMALL 400 18.49 17.32 17.13 17.90
Areas of current exposure Source: Bloomberg Analytics
© IPOX Schuster LLC. IPOX is a registered international trademark of IPOX Schuster LLC. Index of Initial Public Offerings (IPOX) and IPOX Derivatives Patent No. US 7,698,197. Past performance is no guarantee of comparable future performance. Please consider the investment objectives, risks, and charges and expenses
carefully before investing. To receive more information on IPOX IPO Indexes and IPOX Analytics, contact [email protected] or call (312) 264-4410.

IPOX-30® Asia-Pacific Index
www.ipoxschuster.com Jul 29, 2011
Objective
To provide scalable access into the growth and innovativeness of the economy of the developed Asia-Pacific countries of Australia, Hong Kong, Japan, New Zealand and Singapore and trends in Asian-Pacific Equity Capital Markets Activity within a disciplined and totally transparent index methodology. Based on the IPOX Composite Asia-Pacific Index, the IPOX-30 Asia-Pacific has historically captured around 40% of the total market capitalization in the IPOX Composite Asia-Pacific Index and applies certain diversification rules, such as a 10% capping on the largest constituents.
Summary Statistics Top 10 Holdings Sector Breakdown
Number of Holdings 30 1. AIA Group Ltd Consumer Discretionary 37.53 %
Total Market Cap (USDbn) 246.40 2. Sands China Ltd. Consumer Staples 2.04
Average Market Cap (USDbn) 8.21 3. Belle International Holdings Ltd. Energy 3.35
Median Market Cap (USDbn) 4.63 4. Wynn Macau Financials 30.81
Largest Constituent (USDbn) 44.27 5. Otsuka Holdings Co Ltd Health Care 7.48
Smallest Constituent (USDbn) 1.29 6. DAI-ICHI LIFE INSURANCE Industrials 4.03
Total Return (2010) (%) 29.87 7. SJM Holdings Ltd. Information Technology 9.97
Daily Equity Turnover (Index) USD 0.6bn 8. QR National Ltd Materials 4.77
Liquidity Adjustment YES 9. GCL-Poly Energy Holdings Ltd. Telecom Services 0.00
Ticker Symbol BB <IPTA> INDEX 10. AVAGO TECHNOLOGIES Utilities 0.00
Closing Index Level (USD) (P) 851.53
Price Performance (%)
Total Market Cap/Dispersion
Breakdown (USD)(% and #Co’s) Period IPOX-30
Asia-Pacific MSCI Pacific
MXPC HSI Index
HSI TOPIX
TPX
Giant > 44.8 bn 0.00 0 5 days 0.26 % -1.67 % -0.02 % -3.16 %
Large < 44.8 bn 60.13 8 2011 YTD 16.32 -1.45 -2.58 -6.39
Mid < 8.6 bn 39.87 22 2010 28.13 13.08 5.32 -0.97
Small < 1.6 bn 0.00 0 2009 48.12 21.15 52.03 5.63
Micro < 451 ml 0.00 0 2008 -49.21 -37.92 -48.27 -41.77
2007 11.88 3.52 39.06 -12.22
2006 37.35 10.43 33.76 0.95
Best weekly Performer (%) 2005 22.56 20.65 4.55 40.24
1. Sands China Ltd. 6.54 1 year 39.87 12.68 6.38 -2.31
2. AIA Group Ltd 6.46 3 years 14.23 -0.95 0.27 -13.09
3. Aozora Bank Ltd 5.44 5 years 11.27 -1.19 5.76 -11.60
10 years 10.45 3.67 6.29 -3.36
Worst weekly Performer (%) IPOX-30 Asia-Pacific Base Date: 01/02/1995
1. AVAGO TECHNOLOGIES -9.28
2. United Laboratories -8.90 Country Breakdown (by applied market cap)
3. Myer Holdings Ltd -6.52 1. Australia 1.20 % 4. New Zealand 0.00 %
2. Hong Kong 59.64 5. Singapore 12.29
Exposure 3. Japan 26.87
VALUE BLEND GROWTH
LARGE
© IPOX Schuster LLC. IPOX is a registered international trademark of IPOX Schuster LLC. Index of
Initial Public Offerings (IPOX) and IPOX Derivatives Patent No. US 7,698,197. Past performance is no guarantee of comparable future performance. Please consider the investment objectives, risks, and charges and
expenses carefully before investing. To receive more information on IPOX IPO Indexes and IPOX
Analytics, contact [email protected] or call (312) 264-4410.
MID
SMALL
Areas of current exposure

IPOX® BRIC 25 Index
www.ipoxschuster.com Jul 29, 2011
Objective
To provide concentrated access into the growth and innovativeness of companies domiciled in Brazil, Russia, India and China (BRIC) within a disciplined and totally transparent index methodology. Based on the IPOX Emerging Markets Composite Index, the IPOX BRIC 25 Index has historically captured around 70% of total market cap created through IPO and spin-off activity of emerging markets IPO and spin-off activity. The index includes stocks which are freely accessible to foreign investors only.
Summary Statistics Top 10 Holdings Sector Breakdown
Number of Holdings 25 1. BANCO SANTANDER BRASIL-ADS Consumer Discretionary 1.51 %
Total Market Cap (USDbn) 248.59 2. OGX Petroleo E Gas Participa Consumer Staples 1.93
Average Market Cap (USDbn) 9.94 3. United Company RUSAL Plc Energy 15.95
Median Market Cap (USDbn) 7.45 4. Agricultural Bank of China Ltd H Financials 42.23
Largest Constituent (USDbn) 35.27 5. Cielo SA Health Care 2.81
Smallest Constituent (USDbn) 1.70 6. BM&F Bovespa S.A. Industrials 1.72
Total Return (2010) (%) 2.5 7. Redecard - ON Information Technology 18.25
Daily Equity Turnover (Index) USD 1.8bn 8. Evergrande Real Estate Group Materials 12.99
Liquidity Adjustment YES 9. Yandex NV Telecom Services 0.00
Ticker Symbol BB < IPXUBRIC > INDEX 10. Country Garden Holdings Co. Utilities 2.60
Closing Index Level (USD) (P) 545.21 0
Price Performance (%)
Total Market Cap/Dispersion
Breakdown (USD)(% and #Co’s) Period IPOX BRIC 25 MSCI MXEF
MSCI MSEUBRIC
BONY BKBRIC
Giant > 44.8 bn 0.00 0 5 days -2.72 % -1.34 % -1.48 % -1.24 %
Large < 44.8 bn 64.66 9 2011 YTD -10.64 -1.19 -3.71 -4.15
Mid < 8.6 bn 35.34 16 2010 0.02 16.36 7.25 9.32
Small < 1.6 bn 0.00 0 2009 84.03 74.50 88.80 81.54
Micro < 451 ml 0.00 0 2008 -61.50 -54.48 -60.27 -55.43
2007 29.94 34.48 56.12 66.91
2006 75.14 29.18 33.76 50.55
Best weekly Performer (%) 2005 11.91 30.31 4.55 36.90
1. Redecard - ON 10.15 1 year -5.66 14.48 6.33 9.54
2. Cielo SA 5.87 3 years -7.02 3.85 -0.30 0.48
3. Agricultural Bank 3.17 5 years 1.99 8.53 8.85 12.65
10 years 16.08 14.24 15.13 n.a.
Worst weekly Performer (%) IPOX BRIC 25 Base Date: 01/01/1999
1. BANCO SANTANDER -9.46
2. Hypermarcas SA -8.10 Comparative Historical Volatility (%) Bloomberg
3. BM&F Bovespa S.A. -7.92 Days IPXUBRIC MXEF MSEUBRIC BKBRIC
10 20.81 % 11.98 % 13.40 % 17.59 %
Exposure 50 19.18 15.48 16.07 18.64
VALUE BLEND GROWTH 100 17.97 14.88 15.60 18.44
LARGE
MID IPOX BRIC 25 Country Breakdown (%)
SMALL Brazil 33.04 % Russia 16.71 % India 2.52 %
Areas of current exposure China 47.74 %
© IPOX Schuster LLC.. IPOX is a registered international trademark of IPOX Schuster LLC. Index of Initial Public Offerings (IPOX) and IPOX Derivatives
Patent No. US 7,698,197. Past performance is no guarantee of comparable future performance. Please consider the investment objectives, risks, and charges and expenses carefully before investing. To receive information on IPOX IPO Indexes and IPOX Analytics, contact [email protected] or call (312) 264-4410.

IPOX® China 20 Index
www.ipoxschuster.com Jul 29, 2011
Objective
To provide concentrated access into the growth and innovativeness of the Chinese economy within a disciplined and totally transparent index methodology. Based on the IPOX China Composite Index, the IPOX China 20 has historically captured around 60% of total market cap created through IPO and spin-off activity of companies domiciled in mainland China and trading abroad. The index includes stocks which are freely accessible to foreign investors only.
Summary Statistics Top 10 Holdings Sector Breakdown
Number of Holdings 20 1. Agricultural Bank of China Ltd H Consumer Discretionary 7.23 %
Total Market Cap (USDbn) 115.06 2. Want Want China Holdings Ltd. Consumer Staples 9.48
Average Market Cap (USDbn) 5.75 3. Evergrande Real Estate Group Ltd. Energy 0.00
Median Market Cap (USDbn) 4.26 4. Country Garden Holdings Co. Ltd. Financials 51.16
Largest Constituent (USDbn) 16.68 5. Longfor Properties Co. Ltd. Health Care 8.62
Smallest Constituent (USDbn) 1.66 6. Sinopharm Group Co. Ltd. – H Industrials 9.50
Total Return (2010) (%) -6.23 7. China Longyuan Power Group Information Technology 0.00
Daily Equity Turnover (Index) USD 1.5bn 8. Chongqing Rural Commercial Bank Materials 7.99
Liquidity Adjustment YES 9. Fosun International Ltd. Telecom Services 0.00
Ticker Symbol BB <CNI> INDEX 10. China Rongsheng Heavy Industry Utilities 6.01
Closing Index Level (USD) (P) 680.62 0
Price Performance (%)
Total Market Cap/Dispersion
Breakdown (USD)(% and #Co’s) Period IPOX China 20 MSCI China
MSEUSCF FTSE Xinhua 25
XIN0I HSCEI
Giant > 44.8 bn 0.00 0 5 days -0.82 % -1.12 % -0.70 % -1.79 %
Large < 44.8 bn 30.06 3 2011 YTD -1.24 -1.64 -1.93 -2.51
Mid < 8.6 bn 69.94 17 2010 -8.40 2.32 0.90 -0.80
Small < 1.6 bn 0.00 0 2009 62.51 58.80 50.66 62.12
Micro < 451 ml 0.00 0 2008 -55.37 -51.94 -50.80 -51.06
2007 42.02 63.10 53.62 55.94
2006 82.59 78.13 80.40 99.34
Best weekly Performer (%) 2005 -5.87 15.93 10.99 12.46
1. Renhe Commercial 5.48 1 year -1.18 4.38 3.53 3.61
2. Agricultural Bank of China 3.17 3 years -4.83 1.87 -1.43 0.62
3. Want Want China Holdings 2.51 5 years 7.08 12.21 9.96 12.51
10 years 19.24 12.58 13.30 19.59
Worst weekly Performer (%) IPOX China 20 Base Date: 01/01/1999
1. Zhongsheng Group -8.57
2. China Rongsheng -7.75 Comparative Historical Volatility (%) Bloomberg
3. ANTA Sports Products -7.40 Days
CNI MSEUSCF XIN0I HSCEI
10 15.47 % 17.02 % 17.59 % 18.58 %
Exposure 50 21.17 19.77 20.34 21.61
VALUE BLEND GROWTH 100 19.51 18.03 18.92 19.65
LARGE
MID Listing Breakdown (%)
SMALL HK 100.00 % US 0.00 % SG 0.00 %
Areas of current exposure Regions of current exposure.
© IPOX Schuster LLC. IPOX is a registered international trademark of IPOX Schuster LLC. Index of Initial Public Offerings (IPOX) and IPOX Derivatives
Patent No. US 7,698,197. Past performance is no guarantee of comparable future performance. Please consider the investment objectives, risks, and charges and
expenses carefully before investing. To receive information on IPOX IPO Indexes and IPOX Analytics, contact [email protected] or call (312) 264-4410.

IPOX® China 30 A Share Index
www.ipoxschuster.com Jul 29, 2011
Objective
To provide access into the growth and innovativeness of the economy and trends in domestic Chinese Equity Capital Markets Activity within a disciplined and totally transparent index methodology. The IPOX China 30 A-Shares Index captures the performance of the Top 30 largest and generally most liquid IPOs and spin-offs in domestic China ranked quarterly by market capitalization in the underlying IPOX China Composite A-shares Index. The Index has historically captured around 50% of the total market capitalization in the underlying IPXO China Composite A-shares Index and applies distinct diversification rules. (Float-adjusted) Market Cap is calculated by listed A-shares only. The index is available in USD and CNY.
Summary Statistics Top 10 Holdings Sector Breakdown
Number of Holdings 30 1. Agricultural Bank of China Ltd A Consumer Discretionary 5.56 %
Float Adj.Market Cap (USDbn) 383.20 2. China Everbright Bank Company Consumer Staples 2.90
Average Market Cap (USDbn) 12.77 3. China Pacific Insurance (Group) Energy 4.40
Median Market Cap (USDbn) 7.19 4. Jiangsu Yanghe Brewery Joint- Financials 22.72
Largest Constituent (USDbn) 122.44 5. China Shipbuilding Industry Health Care 2.16
Smallest Constituent (USDbn) 3.28 6. China State Construction Industrials 41.57
Total Return (2010) (%) -7.06 7. China Coal Energy Co Ltd A Information Technology 9.83
Daily Equity Turnover (Index) USD 1.2bn 8. Huatai Securities Co Ltd A Materials 10.84
Liquidity Adjustment YES 9. China Merchants Securities Co Telecom Services 0.00
Ticker Symbol BB IPXUCAUP <INDEX> 10. Jinduicheng Molybdenum Co Ltd Utilities 0.00
Closing Index Level (USD) (P) 459.41 0
Price Performance (%) (USD based)
Float-adj. Market Cap/Dispersion
Breakdown (USD)(% and #Co’s) Period IPOX China 30
A Share SH Comp
Index FTSE Xinhua A50 Index
FTSE Xinhua All Share Index
Giant > 44.8 bn 9.83 1 5 days -3.13 % -2.49 % -2.90 % -3.23 %
Large < 44.8 bn 60.60 13 2011 YTD -6.93 -3.79 -4.22 -5.20
Mid < 8.6 bn 29.56 16 2010 -8.73 -14.31 -23.50 -4.87
Small < 1.6 bn 0.00 0 2009 71.18 79.98 83.75 101.59
Micro < 451 ml 0.00 0 2008 -56.53 -65.39 -67.99 -64.53
2007 183.84 96.66 122.05 161.00
2006 103.78 130.43 136.79 116.92
Best weekly Performer (%) 2005 -10.82 -8.33 -6.67 -14.50
1. Hangzhou Hikvision 7.72 1 year 4.28 2.03 -5.10 6.62
2. Sichuan Kelun 1.10 3 years -1.13 -1.77 -5.27 4.58
3. Jiangsu Yanghe Brewery 0.15 5 years 22.89 10.19 11.67 18.77
10 years 9.65 2.72 n.a. n.a.
Worst weekly Performer (%) IPOX China 30 A Base Date: 01/01/1997, annualized returns (p.a.)
1. China CNR Corporation -13.88
2. CSR Corp Ltd A -12.25 Comparative Historical Volatility (%) Bloomberg
3. China Railway Constr -8.22 Days IPXUCAUP SHCOMP XIN9I XIN7I
10 19.39 % 17.93 % 16.62 % 21.72 %
Exposure 30 18.29 17.18 18.08 20.14
VALUE BLEND GROWTH 50 18.70 17.40 18.01 19.77
LARGE 100 16.34 15.68 16.89 18.61
MID
© IPOX Schuster LLC. IPOX is a registered international trademark of IPOX Schuster LLC. Index of
Initial Public Offerings (IPOX) and IPOX Derivatives Patent No. US 7,698,197. Past performance is no
guarantee of comparable future performance. Please consider the investment objectives, risks, and charges and expenses carefully before investing. To receive more information on IPOX IPO Indexes and IPOX
Analytics, contact [email protected] or call (312) 264-4410. ..
SMALL
Areas of current exposure

IPOX® Latin America 20 Index
www.ipoxschuster.com Jul 29, 2011
Objective
To provide concentrated access into the growth and innovativeness of companies domiciled in Argentina, Brazil, Chile, Colombia, Mexico, Peru and Panama trading on the respective domestic or foreign exchange within a disciplined and totally transparent index methodology. Based on the IPOX LatAm Composite Index, a sub-set of the IPOX Emerging Markets Composite Index, the IPOX LatAm 20 Index has historically captured around 60% of total market cap created through IPO and spin-off activity of IPOs in the respective countries. Constituents are capped at 10% at the quarterly reconstitution event and subject to a minimum USD 5mn average/median 21 trading day equity turnover screen.
Summary Statistics Top 10 Holdings Sector Breakdown
Number of Holdings 20 1. Ecopetrol SA ADR Consumer Discretionary 6.39 %
Total Market Cap (USDbn) 256.32 2. BANCO SANTANDER BRASIL Consumer Staples 3.25
Average Market Cap (USDbn) 12.82 3. OGX Petroleo E Gas Participa Energy 26.12
Median Market Cap (USDbn) 4.49 4. Fresnillo PLC Financials 22.19
Largest Constituent (USDbn) 85.50 5. Cielo SA Health Care 2.78
Smallest Constituent (USDbn) 2.74 6. BM&F Bovespa S.A. Industrials 3.18
Total Return (2010) (%) 16.67 7. Redecard – ON Information Technology 18.08
Daily Equity Turnover (Index) USD 0.4bn 8. HRT Participacoes em Petroleo Materials 15.80
Liquidity Adjustment YES 9. Hypermarcas SA Telecom Services 0.00
Ticker Symbol BB IPXULATT <INDEX> 10. EcoRodovias Infraestrutura Utilities 2.22
Closing Index Level (USD) (P) 442.75 0
Price Performance (%) (USD based)
Total Market Cap/Dispersion
Breakdown (USD)(% and #Co’s) Period IPOX LatAm 20 MSCI Emerging
Markets MSCI Latin
America BOVESPA (BRL)
Giant > 44.8 bn 9.60 1 5 days -1.55 % -1.34 % -1.34 % -2.40 %
Large < 44.8 bn 56.95 6 2011 YTD -8.89 -1.19 -6.64 -15.12
Mid < 8.6 bn 33.45 13 2010 13.73 16.36 12.07 1.05
Small < 1.6 bn 0.00 0 2009 120.70 74.50 98.14 82.66
Micro < 451 ml 0.00 0 2008 -59.91 -54.48 -52.78 -41.22
2007 27.94 36.48 46.59 43.65
2006 54.75 29.27 39.46 33.04
Best weekly Performer (%) 2005 n.a. 30.40 45.07 27.80
1. Redecard - ON 10.14 1 year 0.69 14.48 6.53 -12.14
2. Cielo SA 5.87 3 years 0.50 3.85 0.61 0.45
3. Fresnillo PLC 5.36 5 years 7.93 8.53 12.02 9.48
10 years n.a. 14.24 17.15 15.49
Worst weekly Performer (%) IPOX LatAm 20 Base Date: 01/01/2005, annualized returns (p.a.)
1. BANCO SANTANDER -9.46
2. OSX Brasil SA -8.44 Comparative Historical Volatility (%) Bloomberg
3. Hypermarcas SA -8.10 Days IPXULATT MXEF MXLA IBOV
10 28.40 % 11.98 % 20.86 % 17.94 %
Exposure 30 22.40 14.61 18.46 16.98
VALUE BLEND GROWTH 50 22.77 15.48 18.25 16.65
LARGE 100 21.96 14.88 18.01 16.21
MID
© IPOX Schuster LLC. IPOX is a registered international trademark of IPOX Schuster LLC. Index of Initial Public Offerings (IPOX) and IPOX Derivatives Patent No. US 7,698,197. Past performance is no
guarantee of comparable future performance. Please consider the investment objectives, risks, and charges and
expenses carefully before investing. To receive more information on IPOX IPO Indexes and IPOX
Analytics, contact [email protected] or call (312) 264-4410.
SMALL
Areas of current exposure