the investment deficit
TRANSCRIPT

8/8/2019 The Investment Deficit
http://slidepdf.com/reader/full/the-investment-deficit 1/18
The InvestmentDecit

8/8/2019 The Investment Deficit
http://slidepdf.com/reader/full/the-investment-deficit 2/18
About Demos
Dēmos is a non-partisan public policy research and advocacy organization. Headquartered in New York
City, Dēmos works with advocates and policymakers around the country in pursuit of four overarching
goals: a more equitable economy; a vibrant and inclusive democracy; an empowered public sector that
works for the common good; and responsible U.S. engagement in an interdependent world. Dēmos was
founded in 2000.
In 2010, Dēmos entered into a publishing partnership with The American Prospect , one of the nation's
premier magazines focussing policy analysis, investigative journalism, and forward-looking solutions for the
nation's greatest challenges.
About the Our Fiscal Security Project
The Our Fiscal Security project is a collaborative effort of the Economic Policy Institute, Demos, and The
Century Foundation. Our institutions are dedicated to promoting an economic path that achieves scal
responsibility without undermining our national strength. Today, the foundation of that strength – a secure
and growing middle class – is being tested by falling incomes, lost wealth, high unemployment and recordforeclosures. Yet instead of rebuilding the public structures that could fortify our economy, our elected
leaders are facing misguided pressure to reduce the federal budget decit.
We believe the rst priority for our nation is to secure the fundamentals of the economy: strong growth and
good jobs. We also believe that in order to reduce our long-term national debt we must refuel the engine
of our economy: the middle class. Finally, we strongly oppose the idea that America’s scal challenges can
be solved by cutting longstanding social insurance programs that have brought security and prosperity to
millions of Americans. Putting our nation on a path of broad prosperity will require generating new jobs,
investing in key areas, modernizing and restoring our revenue base and lowering the costs of our health
care system. Achieving these goals, however, will require an informed and engaged public to help set our
national priorities.
This brief was compiled and authored by Tamara Draut, Vice President of Policy and Programs, and Robert Hiltonsmith,
Policy Analyst in the Economic Opportunity Program at D ēmos.
8/8/2019 The Investment Deficit
http://slidepdf.com/reader/full/the-investment-deficit 3/18
Demos Board of DirectorsCurrent Members
Amelia Warren Tyagi, Board Chair
Co-Founder & EVP/COO, The Business Talent
Group
Miles Rapoport, President
Demos
Mark C. Alexander
Professor of Law, Seton Hall University
Ben Binswanger
Chief Operating Ofcer, The Case Foundation
Raj Date
Chairman & Executive Director, Cambridge Winter
Maria Echaveste
Co-Founder, Nueva Vista Group
Gina Glantz
Senior Advisor, SEIU
Amy Hanauer
Founding Executive Director, Policy Matters Ohio
Stephen Heintz
President, Rockefeller Brothers Fund
Sang Ji
Partner, White & Case LLP
Clarissa Martinez De Castro
Director of Immigration &
National Campaigns, National Council of La Raza
Rev. Janet McCune Edwards Presbyterian Minister
Arnie Miller
Founder, Isaacson Miller
John Morning
Graphic Designer
Wendy Puriefoy
President, Public Education Network
Janet Shenk Senior Program Ofcer, Panta Rhea Foundation
Adele Simmons
Vice Chair, Chicago Metropolis 2020
David Skaggs
Former Congressmen
Paul Starr
Co-Editor, The American Prospect
Ben Tayor
Chairman, The American Prospect
Ruth Wooden
President, Public Agenda
Members, Past & On Leave
President Barack Obama
Tom Campbell
Christine Chen
Juan Figueroa
Robert Franklin
Charles R. Halpern
Sara Horowitz
Van Jones
Eric Liu
Spencer Overton
Robert Reich
Linda Tarr-Whelan
Ernest Tollerson
Afliations are listed for identication purposes
only.
As with all Dēmos publications, the views
expressed in this report do not necessarily
reect the views of the Dēmos Board of
Trustees.
8/8/2019 The Investment Deficit
http://slidepdf.com/reader/full/the-investment-deficit 4/181
A Productivity-Progress Paradox
In the post-World War II era, the US saw sustained public and private investment in America’s
infrastructure and labor force. The nation’s institutions and its workers came together under a social
contract that created and sustained a new middle class and fueled social progress.
These investments expanded educational opportunity, strengthened our social safety net, and developed a
physical and technological infrastructure that helped industry and citizens alike to thrive.The post-war social contract began to dissolve in the 1980s. This shift – characterized by tax cuts,
deregulation, and decreased public spending – also resulted in radical disinvestment in the nation’s
infrastructure and workforce.
In the last thirty years, our nation has experienced a paradox of productivity and progress. Productivity,
driven by extraordinary growth in technology and an increased push towards consumption, has nearly
tripled . Meanwhile social, environmental, and educational progress has stalled.
Over the past three decades, American median income has stagnated and job quality has declined for
many workers. Health care costs have eaten into wage growth and tuition costs have risen. Poverty and
environmental pollution have become more prevalent. Affordable, quality childcare and accessibility tohigher education have grown more elusive.
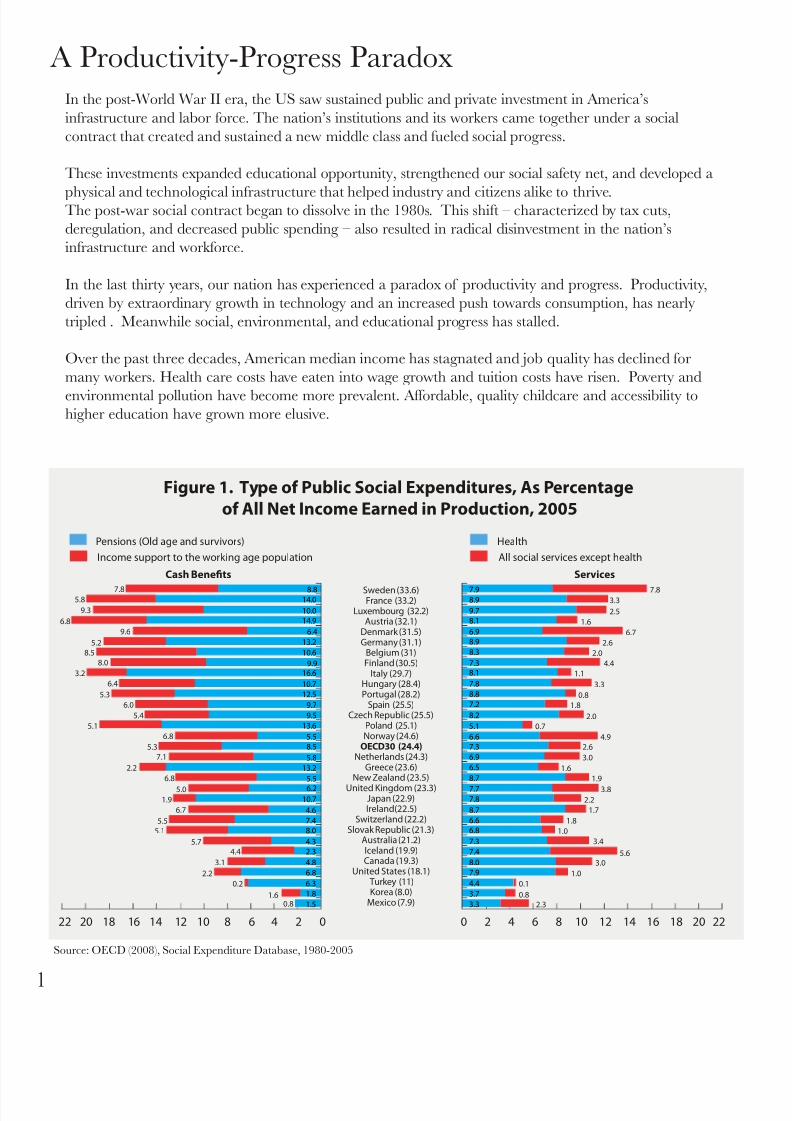
Figure 1. Type of Public Social Expenditures, As Percentage
of All Net Income Earned in Production, 2005
Pensions (Old age and survivors) Health
Income support to the working age population All social services except health
ServicesCash Benets
Sweden (33.6)France (33.2)
Luxembourg (32.2)Austria (32.1)
Denmark (31.5)Germany (31.1)
Belgium (31)Finland (30.5)
Italy (29.7)Hungary (28.4)Portugal (28.2)
Spain (25.5)Czech Republic (25.5)
Poland (25.1)Norway (24.6)
OECD30 (24.4)Netherlands (24.3)
Greece (23.6)New Zealand (23.5)
United Kingdom (23.3)Japan (22.9)Ireland(22.5)
Switzerland (22.2)Slovak Republic (21.3)
Australia (21.2)Iceland (19.9)Canada (19.3)
United States (18.1) Turkey (11)Korea (8.0)
Mexico (7.9)
0 2 4 66 8 10 12 14 16 18 20 2222 20 18 16 14 12 10 8 4 2 0
3.31.5
1.8
6.3
6.8
4.8
2.3
4.3
8.0
7.4
4.6
10.7
6.2
5.5
5.8
8.5
5.5
9.5
9.7
13.2
13.6
12.5
10.7
10.6
10.0
13.2
14.0
14.9
16.69.9
6.4
8.8
2.30.8
0.1
1.0
3.05.6
3.4
1.0
1.8
1.7
2.2
3.8
1.9
1.6
3.0
2.6
4.9
0.7
2.0
1.8
0.8
3.3
1.1
4.4
2.0
2.6
6.7
1.6
2.5
3.37.8
3.7
4.4
7.9
8.0
7.4
7.3
6.8
6.6
8.7
7.8
7.7
8.7
6.5
6.9
7.3
6.6
5.1
8.2
7.2
8.8
7.8
8.17.3
8.3
8.9
6.9
8.1
9.7
8.97.9
0.81.6
0.2
2.2
3.1
4.45.7
5.1
5.5
6.7
1.9
5.0
6.8
2.2
7.1
5.3
6.8
5.1
5.4
6.0
5.3
6.4
3.2
8.0
8.5
5.2
9.6
6.8
9.3
5.87.8
Source: OECD (2008), Social Expenditure Database, 1980-2005

8/8/2019 The Investment Deficit
http://slidepdf.com/reader/full/the-investment-deficit 5/18
Panic over our rising national debt receives ample attention in Congress and in the media, and decit
spending is often branded as the greatest threat to our nation's future. While ignoring our scal challenges
could undermine our security and economic exibility, the ongoing lack of investment in American
infrastructure and workers has and continues to severely threaten our competitiveness and future economic
prosperity.
The U.S. ranks 27th – nearly last – among OECD countries when it comes to social spending—such as
disability, old age, unemployment, and poverty alleviation—that addresses the well-being of its population.1
(See Figure 1.) This brief highlights examples of the disinvestment problem, pointing specically to failuresin areas such as education, transportation, technology, and research and development.
The Social Infrastructure Decit
Early Childhood Education and Care
Most developed nations have recognized that affordable childcare is both a necessity for working parents
and a key investment in the cognitive and social development of children. Yet the U.S invests signicantly
less than many of our peers in this area. In 2005, total public spending in the United States on child care
and preschool was 0.4 percent of GDP, ranking 28th out of 37 countries.2 (See Figure 2.)
Paid family leave for new parents is not guaranteed in the U.S., though it is in every other developed nation
today. In the United States, childcare assistance is provided to only about one in seven children who are
eligible to receive federal assistance.3 Because the majority of children under the age of 5 are raised by
parents in their 20s and early 30s, the lack of affordable, high-quality childcare exacerbates the difculties
of our nation's young workers in the labor market, and of women especially.
Childcare spending as a % of GDP Pre-primary spending as a % of GDP% GDP
Figure 2. Public Expenditure on Childcare and Early Education Services,
As Percentage of GDP, 2005
L u x e m
b o u r g
A u s t r a l i a
E s t o
n i a
G e r m
a n y
C y p r
u s 1 , 2
J a p a n
A
u s t r i a
P
o l a n
d
K o r e a
C a n
a d a
G
r e e c e
I r e l a n
d
S w i t z e
r l a n d
U S
D e n
m a r k
I c e l a n
d
F
r a n c e
S w
e d e n
F i n l a n
d
B e
l g i u
m
N o r w
a y
B u
l g a r i a
R o m a n i a
H u
n g a r y
N e w
Z e
a l a n d
L a t v i a
I t a l y
M a l t a
S p a i n
L i t h
u a n i a
C z e
c h R e p u b l i c
M
e x i c o
S l o
v a n i a
P o r t u
g a l
N e t h e
r l a n d s
S l o v a k R e
p u b l i c
U K
0.0
0.2
0.4
0.6
0.8
1.0
1.2
1.4
1.6
Source: OECD Family Database
8/8/2019 The Investment Deficit
http://slidepdf.com/reader/full/the-investment-deficit 6/183
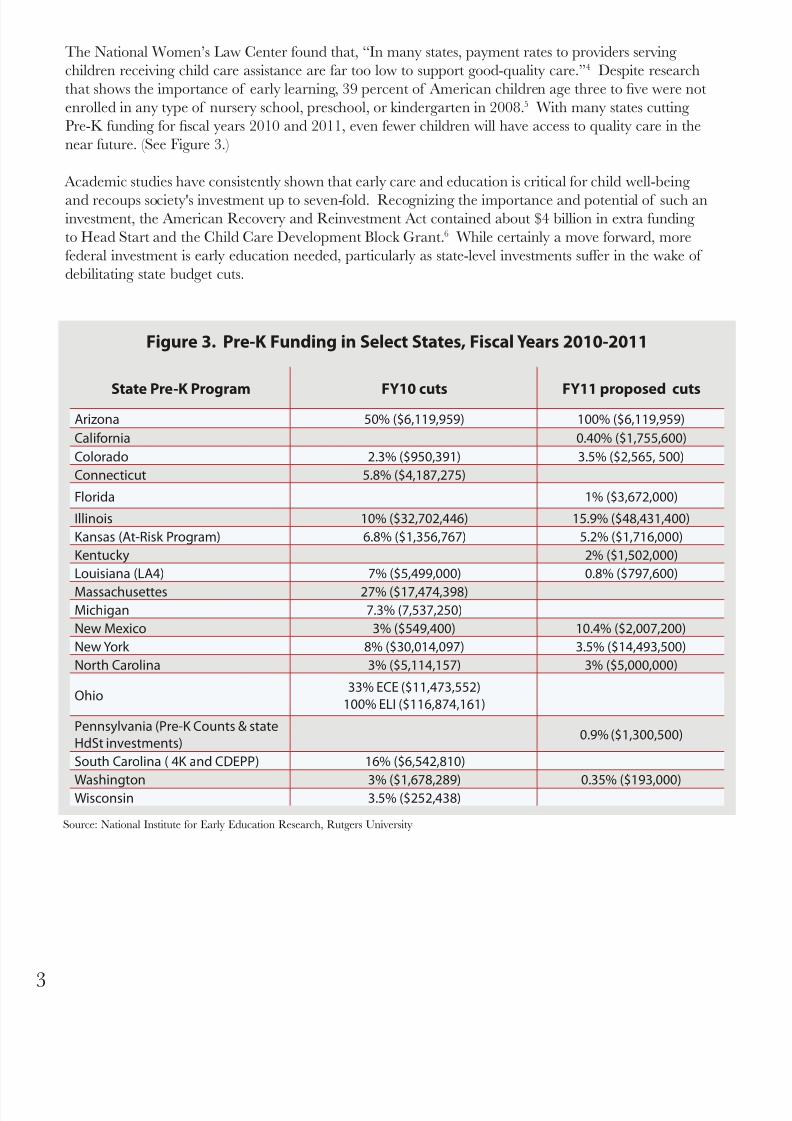
The National Women’s Law Center found that, “In many states, payment rates to providers serving
children receiving child care assistance are far too low to support good-quality care.”4 Despite research
that shows the importance of early learning, 39 percent of American children age three to ve were not
enrolled in any type of nursery school, preschool, or kindergarten in 2008.5 With many states cutting
Pre-K funding for scal years 2010 and 2011, even fewer children will have access to quality care in the
near future. (See Figure 3.)
Academic studies have consistently shown that early care and education is critical for child well-being
and recoups society's investment up to seven-fold. Recognizing the importance and potential of such aninvestment, the American Recovery and Reinvestment Act contained about $4 billion in extra funding
to Head Start and the Child Care Development Block Grant.6 While certainly a move forward, more
federal investment is early education needed, particularly as state-level investments suffer in the wake of
debilitating state budget cuts.
Source: National Institute for Early Education Research, Rutgers University
Figure 3. Pre-K Funding in Select States, Fiscal Years 2010-2011
State Pre-K Program FY10 cuts FY11 proposed cuts
Arizona 50% ($6,119,959) 100% ($6,119,959)
California 0.40% ($1,755,600)
Colorado 2.3% ($950,391) 3.5% ($2,565, 500)
Connecticut 5.8% ($4,187,275)
Florida 1% ($3,672,000)
Illinois 10% ($32,702,446) 15.9% ($48,431,400)
Kansas (At-Risk Program) 6.8% ($1,356,767) 5.2% ($1,716,000)
Kentucky 2% ($1,502,000)
Louisiana (LA4) 7% ($5,499,000) 0.8% ($797,600)
Massachusettes 27% ($17,474,398)Michigan 7.3% (7,537,250)
New Mexico 3% ($549,400) 10.4% ($2,007,200)
New York 8% ($30,014,097) 3.5% ($14,493,500)
North Carolina 3% ($5,114,157) 3% ($5,000,000)
Ohio33% ECE ($11,473,552)
100% ELI ($116,874,161)
Pennsylvania (Pre-K Counts & stateHdSt investments)
0.9% ($1,300,500)
South Carolina ( 4K and CDEPP) 16% ($6,542,810)
Washington 3% ($1,678,289) 0.35% ($193,000)Wisconsin 3.5% ($252,438)

8/8/2019 The Investment Deficit
http://slidepdf.com/reader/full/the-investment-deficit 7/18
K-12 Education
With states facing huge budget shortfalls, cuts have been made in K-12 funding in thirty-three states and
the District of Columbia since 20087. Arizona, for example, eliminated preschool for 4,328 children and
cut funding for kindergarten in half, while Colorado cut $260 million in public school spending in FY 2011,
signifying a 5% fall from FY 2010 and cuts of over $400 per student.8
Higher Education
Faced with limited opportunities and poor conditions in the job market, more and more young people have
rushed onto college campuses. Since 1950, the percentage of high school graduates immediately enrolling
in either 2- or 4-year colleges has risen from just under 50 percent in 1980 to over 69 percent in 2008. 9 But,
as tuition at public universities has more than tripled since 198010, many students have found completing
college nancially impossible, dropping out under heavy work and student loan burdens. The main driver
of these tuition increases has been a steady decline in state funding of higher education, which today is at
a 25-year low. In fact, state funds accounted for 46 percent of the operating support for public institutions
in 1980, but just 27 percent in 2005.11 As states confront gaping budget holes today, the trends of increased
tuition and reduced student aid continue across the country. Furthermore, states are cutting into many
programs traditionally offered to students, in order to cut costs. In one example, UC Berkeley recentlyannounced plans to eliminate four intercollegiate sports in order to cut budget costs. 12
What has resulted is a middle class squeeze, with tuitions climbing faster than ination and thus becoming
unaffordable for increasingly more middle class families. Policymakers addressed the issue by shifting state
and federal nancial aid resources away from grant aid for the neediest students toward merit- and loan-
based aid. Nevertheless, the average college graduate today leaves school with over $20,000 in student loan
debt, and one in ve do so without a diploma.13
Further, the weak labor market has meant that students (and their families) who work to nance their
tuition and living costs are having trouble nding jobs, and many have delayed or abandoned college plans
as a result.
The impact of the reversal in state funding and nancial aid is evident in the United States' standing with
regards to college attainment. In the past, the U.S. was the global leader in higher education attainment.
The College Board now nds the U.S. ranking twelfth out of 36 advanced nations in terms of the number
of 25- to 34-year olds with college degrees.14 In the case of higher education, we have fallen behind in an
area in which we once excelled.

8/8/2019 The Investment Deficit
http://slidepdf.com/reader/full/the-investment-deficit 8/185
The Physical Infrastructure Decit
The physical infrastructure of a country includes its roads, airports, railroads, water supply, power grid,
and telecommunications network. It also includes public institutions such as schools, government buildings,
police stations, and the postal system. A well-maintained and evolving physical infrastructure is critical to
economic production and consumption. It also enables comfortable living conditions, (heated homes and
safe drinking water, for example) not to mention civil society.
Maintaining a physical infrastructure as large as that in the U.S. is a formidable challenge, one that we have
not met. Even when combining federal, state, local, and private-sector expenditures, the U.S. currently
spends about two percent of GDP per year on infrastructure investment. This is well below the average of
what other developed nations spend (3 percent) and signicantly less than the estimated nine plus percent
spent by China.15 Our level of investment is inadequate to keep much of our current infrastructure
functioning, let alone to improve it. The American Society of Civil Engineers estimates that we will need to
invest an additional $1.1 billion over the next ve years in order to adequately improve the condition of our
infrastructure.
Transportation
Thirty-three percent of U.S. roads are in poor or mediocre conditions.16 Poor road quality is a major factor
in congestion and trafc accidents. Americans spend more than 4 billion hours a year stuck in trafc. This
costs the country more than $78.2 billion a year in wasted time and fuel costs.
Even as gas prices have skyrocketed, the total fuel wasted due to trafc congestion climbed from 1.7 billion
gallons in 1995 to 2.9 billion gallons in 2005.17 From 1980-2005, vehicle miles traveled (VMT) by cars
increased by 94%. VMT for trucks increased 105%. At the same time, the number of highway lane miles
Source: American Society of Civil Engineers
Figure 4. American Society of Civil Engineers, Report Card for America’s
Infrastructure, 2009 Grades
Aviation D
Bridges C
Dams D
Drinking Water D-
Energy D+
Hazardous Waste D
Inland Waterways D-
Levees D-
Public Parks and Recreation C-Rail C-
Roads D-
Schools D
Solid Waste C+
Transit D
Wastewater D-
America's Infrastructure GPA: D
Estimated 5 Year Investment Need: $2.2 Trillion
8/8/2019 The Investment Deficit
http://slidepdf.com/reader/full/the-investment-deficit 9/18
available grew by less than 4%. This dramatic disconnect creates crowded, rapidly deteriorating roads that
are a recipe both for inefciency, pollution, and increased accidents, injuries and loss of life. We spend $70
billion for highway capital improvements each year, but experts estimate that we need more than $186
billion annually to substantially improve the nation's highways.18
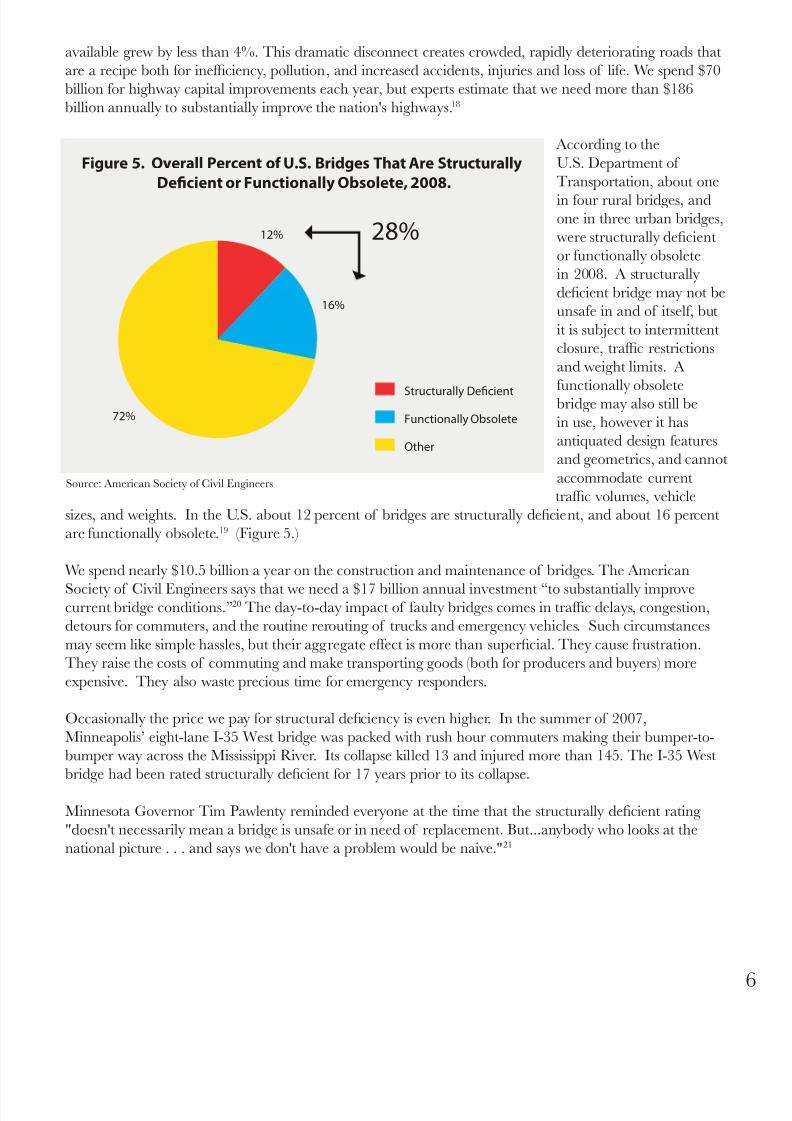
According to the
U.S. Department of
Transportation, about one
in four rural bridges, andone in three urban bridges,
were structurally decient
or functionally obsolete
in 2008. A structurally
decient bridge may not be
unsafe in and of itself, but
it is subject to intermittent
closure, trafc restrictions
and weight limits. A
functionally obsoletebridge may also still be
in use, however it has
antiquated design features
and geometrics, and cannot
accommodate current
trafc volumes, vehicle
sizes, and weights. In the U.S. about 12 percent of bridges are structurally decient, and about 16 percent
are functionally obsolete.19 (Figure 5.)
We spend nearly $10.5 billion a year on the construction and maintenance of bridges. The American
Society of Civil Engineers says that we need a $17 billion annual investment “to substantially improvecurrent bridge conditions.”20 The day-to-day impact of faulty bridges comes in trafc delays, congestion,
detours for commuters, and the routine rerouting of trucks and emergency vehicles. Such circumstances
may seem like simple hassles, but their aggregate effect is more than supercial. They cause frustration.
They raise the costs of commuting and make transporting goods (both for producers and buyers) more
expensive. They also waste precious time for emergency responders.
Occasionally the price we pay for structural deciency is even higher. In the summer of 2007,
Minneapolis’ eight-lane I-35 West bridge was packed with rush hour commuters making their bumper-to-
bumper way across the Mississippi River. Its collapse killed 13 and injured more than 145. The I-35 West
bridge had been rated structurally decient for 17 years prior to its collapse.
Minnesota Governor Tim Pawlenty reminded everyone at the time that the structurally decient rating
"doesn't necessarily mean a bridge is unsafe or in need of replacement. But...anybody who looks at the
national picture . . . and says we don't have a problem would be naive."21
Source: American Society of Civil Engineers
Figure 5. Overall Percent of U.S. Bridges That Are Structurally
Decient or Functionally Obsolete, 2008.
Structurally Decient
Functionally Obsolete
Other
72%
12% 28%
16%

8/8/2019 The Investment Deficit
http://slidepdf.com/reader/full/the-investment-deficit 10/187
Broadband
As of 2009, the U.S. ranks
rst in the world in terms of
broadband usage. With 81
million subscribers, the U.S.
is more than double the size
of the next largest broadband
market, Japan (at 31.6 millionsubscribers). Yet the U.S. ranks
10th in terms of percentage of
ber optic connections, and 24th
in terms of download speed
of our networks. In 2007the
trade publication Digital Journal
summed up the consequences
of the U.S. being far behind
other nations in this realm: “…
Downloading a 4.5 GB le at5 megabit connection [the U.S.
"high speed" connection at the
time of publication]…takes 15
minutes, whereas the high-speed
60 megabit connection in Japan
can download the le in a mere
1.25 seconds.”22
This dramatic difference in
speed not only affects the
average consumer who isdownloading a movie in a
fraction of an hour versus a
fraction of a second. It also
affects businesses that rely on a
high-speed connection, making
them more likely to move
abroad. Our behind-the-times
information infrastructure also
puts us at a critical disadvantage
when it comes to developing
advances such as telemedicine,
which rely on superfast
connections.
Source: OECD Broadband Portal, June 2010
Source: OECD Broadband Portal, June 2010
81,146.2
31,630.8
24,843.7
19,582.0
18,213.3
16,347.7
12,338.5
9,980.0
9,921.49,786.6
6,446.4
6,131.0
5,133.0
4,620.0
3,133.9
3,022.4
2,780.1
2,046.0
1,918.6
1,902.3
1,844.8
1,785.0
1,637.5
1,630.9
1,427.2
1,355.0
992.4
870.6
627.7
158.5
104.8
Figure 6. Total Broadband Subscribers (000s), December 2009
United States
Japan
Germany
France
United Kingdom
Korea
Italy
Canada
MexicoSpain
Turkey
Netherlands
Australia
Poland
Belgium
Sweden
Switzerland
Denmark
Greece
Portugal
Austria
Hungary
Norway
Chile
Finland
Czech Republic
New Zealand
Ireland
Slovak Republic
Luxembourg
Iceland
Figure 7. Fiber Optic Connections Percentage of Total Broadband
Subscriptions, December 2009
54%
49%
28%
23%
13%
11%
11%
10%
7%
6%
5%
3%
2%
2%
1%
1%
1%
1%
1%
0.5%
Japan
Korea
Slovak Republic
Sweden
Norway
Denmark
OECD
Czech Republic
Iceland
Hungary
United States
Italy
Netherlands
Portugal
Finland
Switzerland
Ireland
Turkey
Belgium
Germany

8/8/2019 The Investment Deficit
http://slidepdf.com/reader/full/the-investment-deficit 11/18
Source: American Society of Civil Engineers
Figure 8. Average Advertised Broadband Download Speed, By Country,
Kbits/second*, October 2009
Japan 107,725
Portugal 103,718
France 54,551Korea 52,772
Netherlands 33,679
OECD AVG 30,550
Hungary 27,542
Slovak Republic 26,939
Austria 25,519
Sweden 23,693
Australia 21,823
Denmark 20,397
Switzerland 20,073United Kingdom 19,681
Poland 19,675
Canada 19,567
Czech Republic 18,788
Finland 18,384
Norway 18,000
New Zealand 17,807
Iceland 17,774
Germany 16,033
Greece 15,945United States 14,619
Italy 14,336
Spain 12,800
Belgium 10,825
Turkey 10,473
Luxembourg 10,457
Ireland 6,088
Mexico 2,514
Source: OECD Broadband Portal, June 2010Note (*): Advertised speeds are typically the theoretical maximum for the employed technologies. Users commonly have lower actual speeds.
Also, often only parts of the country have been upgraded to the fastest speeds.
8/8/2019 The Investment Deficit
http://slidepdf.com/reader/full/the-investment-deficit 12/189
Energy
For the most part, with current technologies electrical energy cannot be stored. Instead is must be
generated as needed. A power grid connects generators or electricity with transmission equipment that
transfers electricity to meet demand. The U.S. power grid is really three major interconnected sections. It
consists of about 3,100 utilities.23
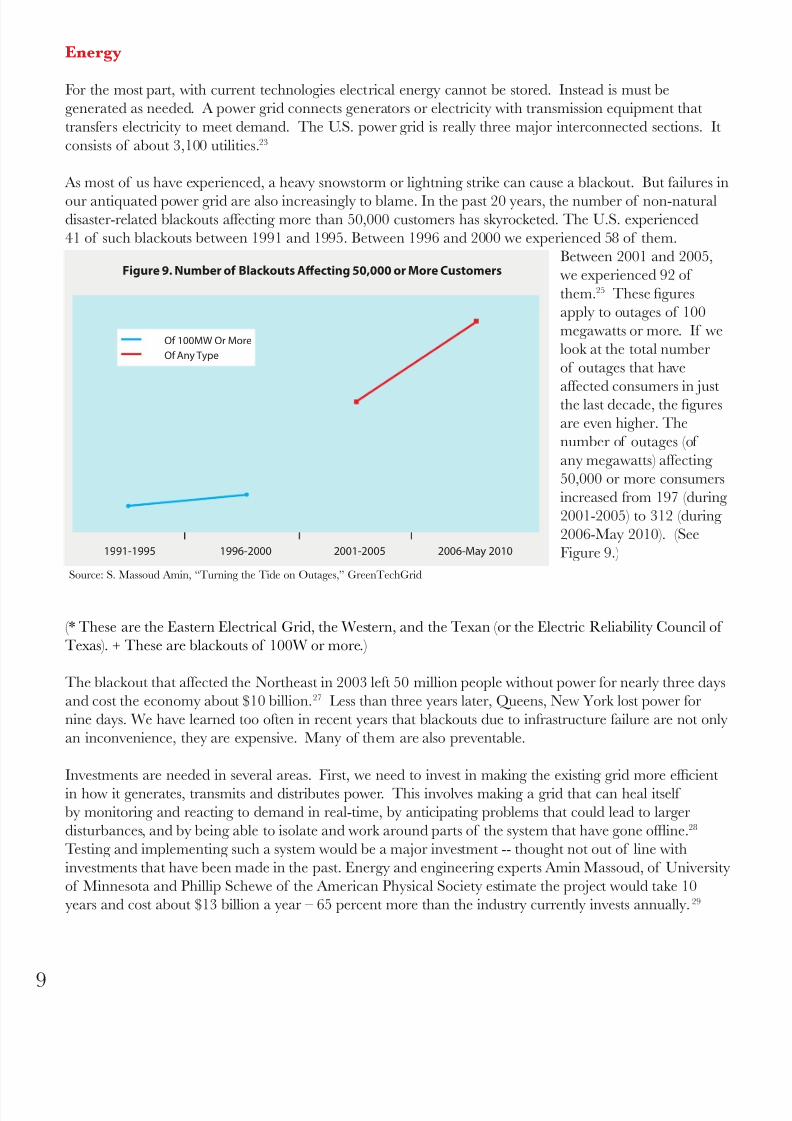
As most of us have experienced, a heavy snowstorm or lightning strike can cause a blackout. But failures in
our antiquated power grid are also increasingly to blame. In the past 20 years, the number of non-naturaldisaster-related blackouts affecting more than 50,000 customers has skyrocketed. The U.S. experienced
41 of such blackouts between 1991 and 1995. Between 1996 and 2000 we experienced 58 of them.
Between 2001 and 2005,
we experienced 92 of
them.25 These gures
apply to outages of 100
megawatts or more. If we
look at the total number
of outages that have
affected consumers in justthe last decade, the gures
are even higher. The
number of outages (of
any megawatts) affecting
50,000 or more consumers
increased from 197 (during
2001-2005) to 312 (during
2006-May 2010). (See
Figure 9.)
(* These are the Eastern Electrical Grid, the Western, and the Texan (or the Electric Reliability Council of
Texas). + These are blackouts of 100W or more.)
The blackout that affected the Northeast in 2003 left 50 million people without power for nearly three days
and cost the economy about $10 billion.27 Less than three years later, Queens, New York lost power for
nine days. We have learned too often in recent years that blackouts due to infrastructure failure are not only
an inconvenience, they are expensive. Many of them are also preventable.
Investments are needed in several areas. First, we need to invest in making the existing grid more efcient
in how it generates, transmits and distributes power. This involves making a grid that can heal itself
by monitoring and reacting to demand in real-time, by anticipating problems that could lead to larger
disturbances, and by being able to isolate and work around parts of the system that have gone ofine.28
Testing and implementing such a system would be a major investment -- thought not out of line with
investments that have been made in the past. Energy and engineering experts Amin Massoud, of University
of Minnesota and Phillip Schewe of the American Physical Society estimate the project would take 10
years and cost about $13 billion a year – 65 percent more than the industry currently invests annually. 29
Source: S. Massoud Amin, “Turning the Tide on Outages,” GreenTechGrid
1991-1995 1996-2000 2001-2005 2006-May 2010
Figure 9. Number of Blackouts Aecting 50,000 or More Customers
Of Any Type
Of 100MW Or More
8/8/2019 The Investment Deficit
http://slidepdf.com/reader/full/the-investment-deficit 13/18
Massoud and Schewe put this gure in perspective relative to the size and cost of regular blackouts:
The costs sound high, but estimates peg the economic loss from all U.S. outages at $70 to $120 billion a year. Although a big
blackout occurs about once a decade, on any given day 500,000 U.S. customers are without power for two hours or more. 30
We also need to invest in new facilities to generate and transmit power. The demand for electricity has
increased by about 25 percent since 1990. Meanwhile the construction of transmission facilities has
decreased by 30 percent. The annual investment in these facilities had declined or been stagnant for nearly
30 years before we nally began to invest in them around 2006. 31 These investments are promising, butthey represent only the beginning of what we need to do.
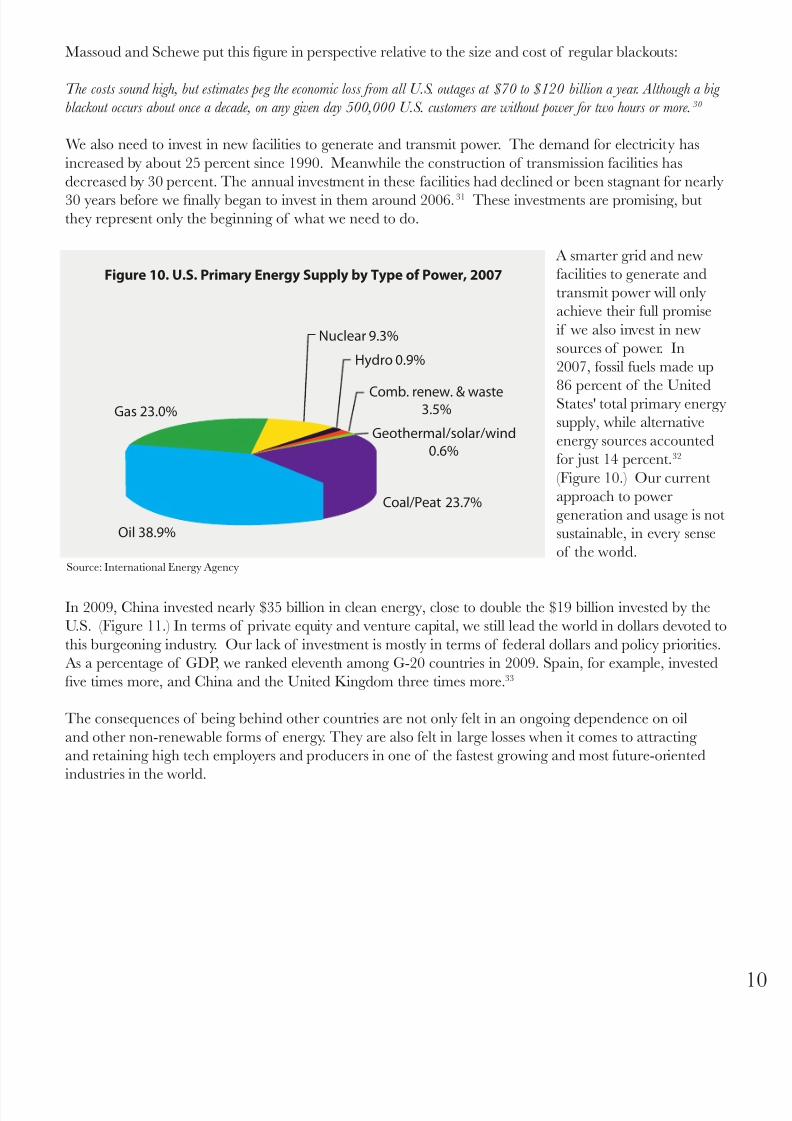
A smarter grid and new
facilities to generate and
transmit power will only
achieve their full promise
if we also invest in new
sources of power. In
2007, fossil fuels made up
86 percent of the UnitedStates' total primary energy
supply, while alternative
energy sources accounted
for just 14 percent.32
(Figure 10.) Our current
approach to power
generation and usage is not
sustainable, in every sense
of the world.
In 2009, China invested nearly $35 billion in clean energy, close to double the $19 billion invested by the
U.S. (Figure 11.) In terms of private equity and venture capital, we still lead the world in dollars devoted to
this burgeoning industry. Our lack of investment is mostly in terms of federal dollars and policy priorities.
As a percentage of GDP, we ranked eleventh among G-20 countries in 2009. Spain, for example, invested
ve times more, and China and the United Kingdom three times more.33
The consequences of being behind other countries are not only felt in an ongoing dependence on oil
and other non-renewable forms of energy. They are also felt in large losses when it comes to attracting
and retaining high tech employers and producers in one of the fastest growing and most future-oriented
industries in the world.
Source: International Energy Agency
Figure 10. U.S. Primary Energy Supply by Type of Power, 2007
Oil 38.9%
Gas 23.0%
Nuclear 9.3%
Hydro 0.9%
Coal/Peat 23.7%
Comb. renew. & waste3.5%
Geothermal/solar/wind
0.6%

8/8/2019 The Investment Deficit
http://slidepdf.com/reader/full/the-investment-deficit 14/1811
Unless this trend is reversed, corporate investment will continue moving abroad. Applied Materials is a
Silicon Valley-based equipment manufacturer for the semi-conductor industry with a market capitalization
of more than $15 billion. In fall of 2009 the company moved its chief technology ofcer to Beijing
and opened a large solar research and development center in the city of Xian. Mark Pinto, the Applied
Materials’ CTO, told the Chicago Tribune that China's fast-growing solar-energy market, fueled by
government investment was a main factor.34 Applied Materials was already a global company before the
move. But current trends will likely accelerate its overseas expansion, as well as that other companies.
Figure 11. 2009 Clean Energy Investment Among G20 Countries, $ Billions
(Top 10)
China $34.6 Billion
United States $18.6 Billion
United Kingdom $11.2 Billion
Rest of EU-27 $10.8 Billion
Spain $10.4 Billion
Brazil $7.4 Billion
Germany $4.3 BillionCanada $3.3 Billion
Italy $2.6 Billion
India $2.3 Billion
Source: The Pew Charitable Trusts, Who’s Winning the Clean Energy Race? Growth, Competition and Opportunity in the World’s
Largest Economies, March 2010.

8/8/2019 The Investment Deficit
http://slidepdf.com/reader/full/the-investment-deficit 15/18
Conclusion
With our nation’s public nances struggling under the pressures from two unfunded wars, the largest tax
cuts in modern history, and the great recession, policymakers are focusing blindly on decit reduction,
myopically shunning investments critical to economic recovery and long-term prosperity. Yet, the greatest
chance for creating broadly shared and sustainable economic growth – that is, for securing our nation's
scal future – is a renewed commitment to investments in our nation’s social and physical infrastructure.

8/8/2019 The Investment Deficit
http://slidepdf.com/reader/full/the-investment-deficit 16/1813
Endnotes1. Organization For Economic Cooperation and Development (OECD), Social Expenditure Database, http://www.oecd.org/document/9/0,3343,en_2649_34637_38141385_1_1_1_1,00.html.
2. OECD Family Database. “PF3.1: Public spending on childcare and early education.” OECD Family Database,. http://www.oecd.org/dataoecd/44/20/38954032.xl 3. Jennifer Mezey, Mark Greenberg, and Rachel Schumacher, The Vast Majority of Federally‐ Eligible Children DidNot Receive Child Care Assistance in FY 2000,Center for Law and Social Policy, 2002, www.clasp.org/publications/1in7full.pdf.
4. National Women’s Law Center, Letter to Joseph Biden, February 25, 2010, www.whitehouse.gov/sites/default/les/microsites/100226-child-care.pdf 5.Kids Count Data Center. The Annie E. Casey Foundation. (URL doesn’t work) http://datacenter.kidscount.org/data/acrossstates/Default.aspx
6. “American Recovery and Reinvestment Act.” Web Page of Speaker Nancy Pelosi. http://www.speaker.gov/newsroom/legislation?id=0273#education.
7. Johnson, Nicholas, Phil Oliff, and Erica Williams. “An Update on State Budget Cuts.” Center on Budget and Policy Priorities. 25 May 2010. http://www.cbpp.org/cms/index.cfm?fa=view&id=1214.
8. Ibid.
9. U.S. Department of Education, The Condition of Education, 2009, Table A-20-1. http://nces.ed.gov/programs/coe/2010/section3/table-trc-1.asp.
10. The College Board, Trends in College Pricing, 2010, Figure 5. http://trends.collegeboard.org/les/2009_Trends_College_Pricing.pdf.
11. “Facts About Higher Education Financing.” The American Council on Education. http://www.acenet.edu/AM/Template.cfm?Section=Search§ion=Legal_Issues_and_Policy_Briefs1&template=/CM/ ContentDisplay.cfm&ContentFileID=3820. 12. “UC Berkeley To Cut Funding For 5 Sports Programs,” KTVU.com, September 28, 2010. http://www.ktvu.com/news/25198096/detail.html. 13. The Project on Student Debt. “Face Sheets about Student Debt and Financial Aid.” The Institute for College Access & Success. http://projectonstudentdebt.org/fact_sheets.vp.html.
14. The College Board, The College Completion Agenda 2010 Progress Report, http://completionagenda.collegeboard.org/sites/default/les/reports_pdf/Progress_ Report_2010.pdf.
15. Jessica Milano, “Building America's 21st Century Infrastructure.” Progressive Policy Institute. 15 January 2009. http://www.ppionline.org/ppi_ci.cfm?contentid=254788&knlgAreaID=450020&subsecid=900200. 16. American Society of Civil Engineers, “2009 Report Card on America’s Infrastructure: Bridges,” http://www.infrastructurereportcard.org/fact-sheet/bridges. 17. Ibid.
18. Ibid.
19. American Society of Civil Engineers, “2009 Report Card on America’s Infrastructure: Bridges,” http://www.infrastructurereportcard.org/fact-sheet/bridges. 20. Ibid.
21. Philip Rucker, William Branigin and Amy Goldstein, “Minneapolis Bridge, Like Many In U.S., Was 'Structurally Decient',” Washington Post, August 3, 2007,http://www.washingtonpost.com/wp-dyn/content/article/2007/08/02/AR2007080200423.html.
22. Chris V. Thangham, “Japan's Internet access speed 30 times faster than connect ions in U.S.” Digital Journal, June 27, 2007, http://www.digitaljournal.com/article/200308/Japan_s_Internet_access_speed_30_times_faster_than_connections_in_U_S_. 23. 2009 Report Card on American’s Infrastructure: Energy,” http://www.infrastructurereportcard.org/fact-sheet/energy
25. Amin Massoud Amin, “Turning the Tide on Outages,” GreenTechGrid , http://www.greentechmedia.com/articles/read/turning-the-the-tide-on-outages/. 26. Ibid.
27. “5 Years After Blackout, Power Grid Still in Dire Straits,” The Public Record, August 7, 2008.
28. Massoud Amin and Phillip F. Schewe, “Preventing Blackouts: Building a Smarter Power Grid,” Scientic American, August 13, 2008, http://www.scienticamerican.com/article.cfm?id=preventing-blackouts-power-grid&page=3.
29. Ibid.
30. Ibid.
31. American Society of Civil Engineers, 2009 Report Card on American’s Infrastructure: Energy,” http://www.infrastructurereportcard.org/fact-sheet/energy.
32. International Energy Agency, “Share of Total Primary Energy Supply in 2007: United States” OECD/International Energy Agency, http://www.iea.org/stats/pdf_graphs/USTPESPI.pdf.
33. The Pew Charitable Trusts, Who’s Winning the Clean Energy Race? Growth, Competition and Opportunity in the World’s Largest Economies, March 2010,http://www.pewtrusts.org/uploadedFiles/wwwpewtrustsorg/Reports/Global_warming/G-20%20Report.pdf.
34. Jim Tankersley and Don Lee, “U.S. Lags in Clean-Energy Investment, Study Finds,” Chicago Tribune, March 24, 2010, http://articles.chicagotribune.com/2010-03-24/news/sc-biz-0325-energy--20100324_1_clean-energy-investment-clean-energy-fossil-fuels.

8/8/2019 The Investment Deficit
http://slidepdf.com/reader/full/the-investment-deficit 17/18
Contact
Media Inquiries:
Dēmos
Tim Rusch, Communications Director
212-389-1407

8/8/2019 The Investment Deficit
http://slidepdf.com/reader/full/the-investment-deficit 18/18
220 Fifth Ave., 2nd Floor | New York, New York 10001 | 212.633.1405www.demos.org