the inventure group, inc. - nasdaqfiles.shareholder.com/downloads/snak... · statements contained...
TRANSCRIPT

11
The Inventure Group, Inc.(NASDAQ: SNAK)
August 2009Investor Presentation
NASDAQ: SNAK

22
Forward Looking StatementsStatements contained in this presentation that are not historical facts are “forward looking” statements as that term is defined in the Private Securities Litigation Reform Act of 1995. Because such statements include risks and uncertainties, actual results may differ materially from those expressed or implied by such forward-looking statements. Factors that may cause actual results to differ from the forward-looking statements contained in this presentation and that may affect the Company’s prospects in general include, but are not limited to, the potential need for additional financing, acquisition related risks, significant competition, customer acceptance of existing and future products, dependence upon major customers, dependence upon existing and future licensing agreements, general risks related to the food products industry, and such other factors as are described in the Company’s filings with the Securities and Exchange Commission. Actual financial results for the periods presented do not necessarily indicate the results that may be expected for any future periods. To the Inventure Group’s knowledge, the information included herein is correct as of the date of this presentation and we do not undertake any obligation to update this information in the future.
NASDAQ: SNAK

33
Company Overview
NASDAQ: SNAK

4
The Inventure GroupThe Inventure GroupCompany DescriptionCompany Description
Rapidly growing $100+ million innovative marketer and manufacturer of healthy / all natural and indulgent specialty food brands
Headquartered in Phoenix, Arizona with plants in Arizona, Indiana and Washington
Goal is continue to build a rapidly growing specialty brand Company that capitalizes on evolving consumer eating habits in two primary product segments: Healthy / Natural Food Products Indulgent Specialty Snack Food Brands Supplement with Premium Private Label
Six Consecutive Quarters of YOY Revenue and Earnings GrowthNASDAQ: SNAK

5
Leverage National DistributionAccess to Major Retailers in All Channels
Grocery Kroger, Albertsons, Safeway, Meijers, HEB, Wakefern, Food Lion, Giant Eagle,
Whole Foods, Super Valu, Harris Teeter, BiLo
Natural Whole Foods, Sprouts, UNFI, Tesco Fresh & Easy, Trader Joe’s
Mass, Drug, Club Kmart, Rite-Aid, Sam’s, Costco
Vending, Foodservice Presence in estimated 50% of vending machines nationally VSA/Vistar (e.g. Canteen), Sysco, Shamrock
Convenience Stores 47 of Top 50 chains (represents est. 50,000 stores) 7-Eleven, Speedway, Circle K, Diamond Shamrock, Casey’s, Pantry, Hess, Exxon
Mobil, Sheetz, Wawa
International Mexico, Canada, Caribbean, Latin America, South America, The Middle East, India,
Hong Kong, Thailand, Taiwan and the PhilippinesNASDAQ: SNAK

6
Leverage Operational Capacity Bluffton, Indiana
140,000 ft2 manufacturing plant $125 million production capacity (40% utilized) Double sheeting technology; extended shelf-life products Pellet snack production capabilities
100,000 ft2 distribution center (60% utilized) TPL managed; state-of-the-art
Goodyear, Arizona 60,000 ft2 manufacturing plant and warehouse
$40 million production capacity (70% utilized) Regional potato chip brands: Poore Brothers, Bob’s Texas Style New Production capacity completed July 2009
Lynden, Washington $100+MM revenue capacity Fruit processing, IQF technology and bagging operation
NASDAQ: SNAK

7
Experienced Management Team
Significant Growth Diverse Food & CPGOperational Expertise ExperienceTerry McDaniel – CEO UnileverSteve Weinberger – CFO WiseTim Bateman – VP Sales Haägan DazsTim Brown – VP Sales TropicanaSteve Sklar – SVP, Marketing Marie Callender’sLisa Schommer – VP, Business Development Con AgraKirk Roles – VP, Human Resources NabiscoBrad Rader – VP & General Manager – Rader Farms Dial CorpAlex Rembert – VP, Operations Frito-Lay, Inc.
NASDAQ: SNAK

88
Financial Review
NASDAQ: SNAK

99
Market Data Market Data (as of COB 08/06/09)(as of COB 08/06/09)
Stock Exchange: Nasdaq Market Symbol: SNAK Shares Outstanding: 18.25 million Market Capitalization: $50 million Stock Price: $2.73 52 week range: $0.90 – $2.78 EPS: $0.15 YTD stock performance: + 67% Company Founded: 1983 Public Since: 1996 Headquarters: Phoenix, Arizona
NASDAQ: SNAK

1010
2009 performance has been stronger than ever Anticipate continued growth for the back half of the year
2Q09 Net income: $1.03 million, up 43.6% vs. 2Q08 EPS: 6¢ per share, up 50% vs. 2Q08 EBITDA: $2.8 million, up 41% vs. 2Q08 Net revenue: $33.4 million, up 14.4% vs 2Q08
YTD Total Net Revenue up 13.9% - $63.1MM vs. $55.4MM Gross Profit up 20%- $12.4MM vs. $10.4MM Operating income up 38% - $3.6MM vs. $2.6MM Net Income up 70% - $1.9MM vs. $1.1MM EPS up 67% - 10 cents vs. 6 cents EBITDA up 33% - $5.2MM vs. $4.0MM
The first half of 2009 EBITDA is higher than any other previous full year of earning except for 2008
Consolidated Financial Results
NASDAQ: SNAK

11
Historical Net Revenue Growth
$0.0
$20.0
$40.0
$60.0
$80.0
$100.0
$120.0
Net Revenue 75.3 69.8 90.9 113.1 63.2
2005 2006 2007 2008 2009 H1
+10% -7%
+30%
+24%
+14%
($M)
NASDAQ: SNAK
12
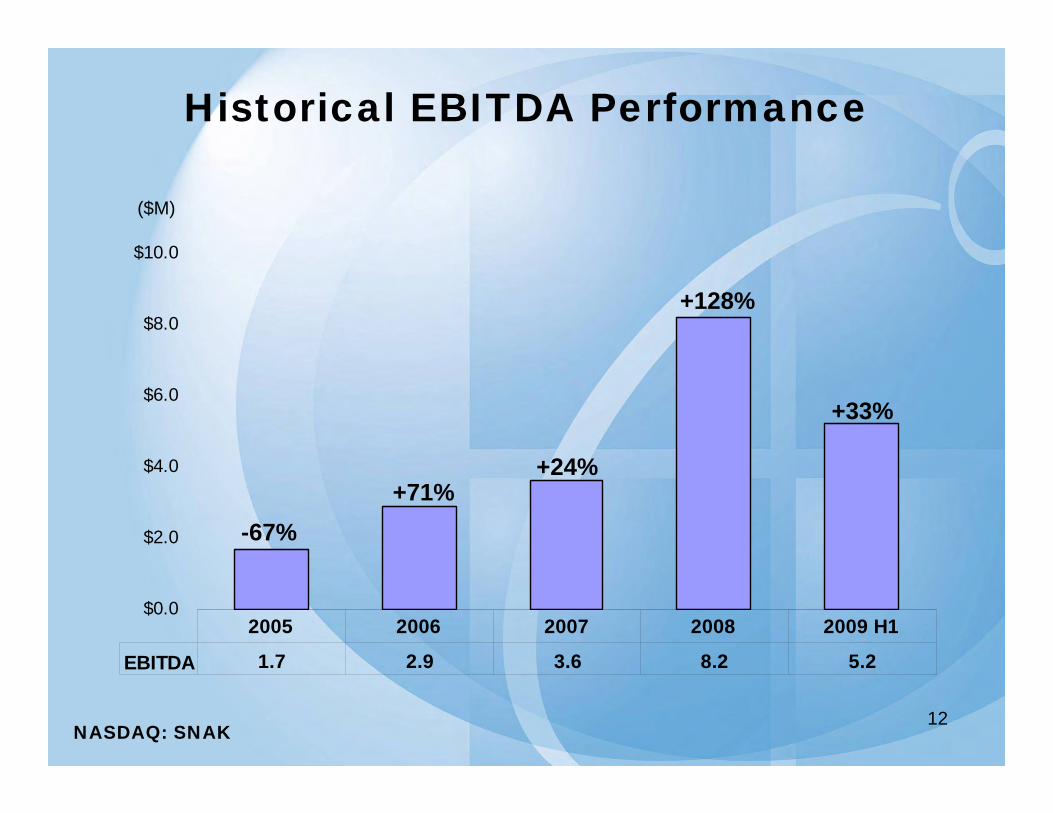
Historical EBITDA Performance
$0.0
$2.0
$4.0
$6.0
$8.0
$10.0
EBITDA 1.7 2.9 3.6 8.2 5.2
2005 2006 2007 2008 2009 H1
($M)
-67%+71%
+24%
+128%
+33%
NASDAQ: SNAK

1313
Baked Goods/Snack FoodsLeading Revenue Growth, Increasing Profitably
Houlihan Lokey Food & Beverage Newsletter November 2008
November 2008 November 2006
NASDAQ: SNAK

1414
Valuation Comparison
Company Ticker Stock Price Shares O/S (mm) EBITDA Market Cap (mm) Market Cap/EBITDAGolden Enterprises GLDC 2.45 11.75 5.67 29 5.08The Inventure Group SNAK 2.75 18.25 9.43 50 5.32Reliv International RELV 3.19 12.23 5.91 39 6.60J&J Snack Foods JJSF 41.85 18.45 87.7 772 8.80Diamond Foods DMND 27.52 16.48 49.95 454 9.08Lance, Inc. LNCE 24.34 31.98 82.67 778 9.42*Note: All data as of close on 8/7/09
SNAK currently trades at a discount relative to other small capitalization consumer packaged goods companies
NASDAQ: SNAK

1515
Forward Outlook
NASDAQ: SNAK

1616
3 Year Strategic Overview Focusing our resources primarily on building healthier and natural food solutions:
Rader Farms – frozen berry business Build the Rader Farms business through organic growth and acquisition Drive a two tier strategy for branded and Private Label
Boulder Canyon Natural Foods Expand distribution and product categories/lineup Consider acquisitions to add critical mass in natural snack category
Better for you snacks Build a portfolio of better for you snack food Convert existing formats New formats and brands
Premium store brands
Indulgent specialty snack brands: Drive a portfolio of warehouse brands (TGI Friday’s, Burger King, etc.) and consider acquisitions
that leverage the Bluffton facility Leverage plant with major co-packing partners if possible Develop other product forms Seek other licensing Seek premium store brands
Bring innovation to the categories we participate in and seek acquisitions which compliment our brand portfolio
NASDAQ: SNAK

1717
Healthy/Natural BrandsHealthy/Natural Brands
NASDAQ: SNAK

18
Rader FarmsExpansion Plan
NASDAQ: SNAK
19
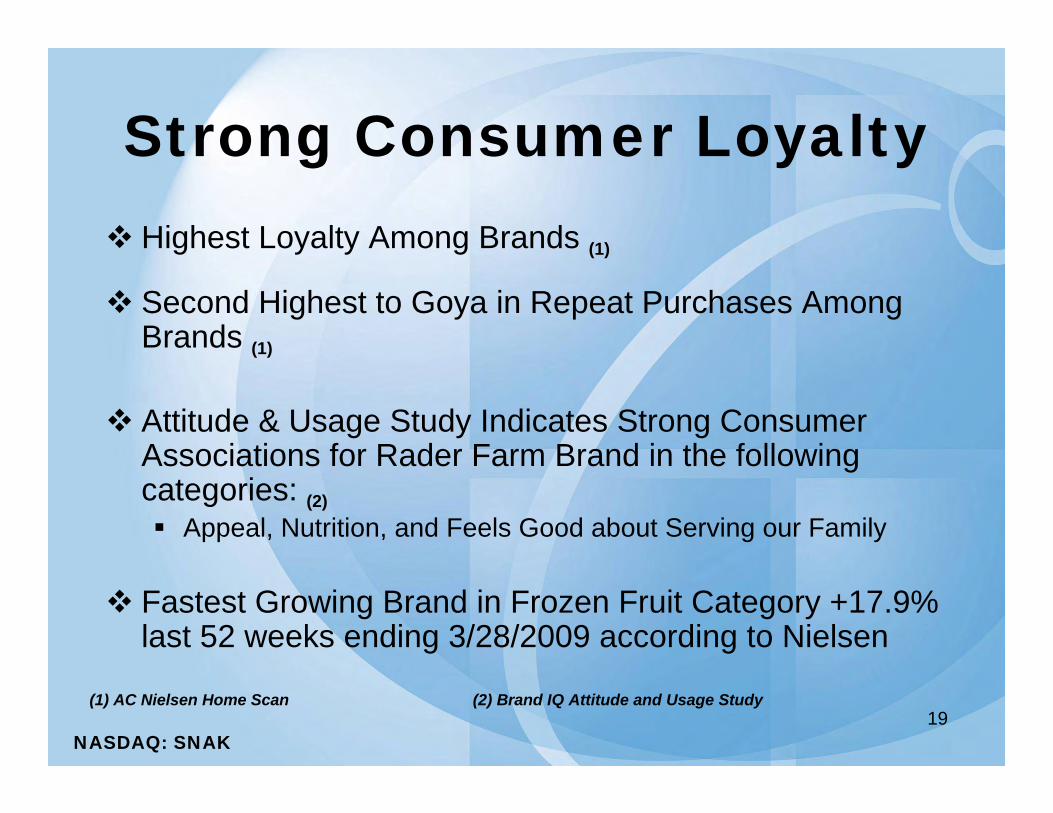
Strong Consumer Loyalty Highest Loyalty Among Brands (1)
Second Highest to Goya in Repeat Purchases Among Brands (1)
Attitude & Usage Study Indicates Strong Consumer Associations for Rader Farm Brand in the following categories: (2) Appeal, Nutrition, and Feels Good about Serving our Family
Fastest Growing Brand in Frozen Fruit Category +17.9% last 52 weeks ending 3/28/2009 according to Nielsen
(1) AC Nielsen Home Scan (2) Brand IQ Attitude and Usage Study
NASDAQ: SNAK

2020
YTD09 Highlights Continues to perform well, delivered double digit revenue growth Net revenues grew 13.6%: $22.4MM vs. $19.7MM
Forward Strategy Take a leadership role and become the Grocery Category Manager
in Frozen Fruit Drive a two tier Branded and Premium Store Brands Strategy Educate retailers on consumer needs and preferences for a
Premium (Rader) and Price (Private Label) positioned brands Bring Innovative products to the category Leverage strong brand loyalty for Rader Farms Brand Expand brand geographically and into new channels
Healthy/Natural: Rader Farms
NASDAQ: SNAK

21
Press Release – Headline

22
Press Release – 8-13-09

23
New Standup PackagingFruit Blends
NASDAQ: SNAK

24
Boulder Canyon Natural FoodsBoulder Canyon Natural Foods
NASDAQ: SNAK

2525
YTD09 Highlights One of our best performers, $4.9MM in revenue, up 28% vs. 1H08 New distribution and existing customer gains continue on a national basis
Forward Strategy Continue brand geographical and category expansion
Expand brand presence into all natural snack sections of grocery stores Close distribution gap in natural stores Focus growth in club and limited c-store channels
Continue focus on introducing new products Innovative kettle chip flavors Better for you kettle chips New forms of better for you products
Enhance margin structure Improve plant efficiencies Allocate organizational resources
Healthy/Natural: Boulder Canyon
NASDAQ: SNAK

2626
Boulder CanyonRetail Sales Trends
Nielsen Total US, 52 week ending 5/16/09 Total chips category +5.4% $ sales vs. YAG Boulder brand +27.2% $ sales vs. YAG
(+85% over 2 years)
SPINS Total US, 52 weeks ending 4/18/09 Total chip category +14.1% $ sales vs. YAG Boulder brand +23.3% $ sales vs. YAG
(+74% over 2 years)
NASDAQ: SNAK

27
Boulder CanyonRegional Sales Growth Trend
SpinScan 52 Weeks Ending 4/18/09
14%12%
15%18%
15%12% 13%
10%
21%23% 24%
46%
32%
39%
26% 26%
33%
0%
-10.0%
0.0%
10.0%
20.0%
30.0%
40.0%
50.0%
Total US Mid Atlantic North Central North East Northern Cal Northwest SouthCentral
South East South West
Total Category Boulder Canyon
NASDAQ: SNAK

28
Boulder New Package Ties in with new consumer programs
All Natural Gluten Free heading – larger font
NASDAQ: SNAK

29
New Boulder Canyon Products
NASDAQ: SNAK

30
Better for You Premium Store BrandsMoving Existing Brands to Better For you
Premium All Natural Store Brands 1st Half Sales = $1.1MM up +511%
NASDAQ: SNAK

31
Better for You productsMoving Existing Brands to Better For you
NASDAQ: SNAK

32
Indulgent Specialty BrandsIndulgent Specialty Brands
NASDAQ: SNAK

3333
Continue to achieve targeted revenue and earnings goals in this $3 billion category
1st Half 09 Financial Highlights: Burger King: $3.0MM in revenues, up 24.3% versus the same period last year T.G.I. Friday’s: $19.4MM in revenues, up 4.1% for the first half of 2009 versus
down 20% during the same period last year Private Label: $3.2MM in revenues, up 119% vs. prior year’s period O’Boises: Rolled out in very limited channels and sold $233k in the first 2 months
Forward Strategy Build TGI Friday’s sales trends Continue BURGER KING roll out Pursue new strategic licensing opportunities Evaluate other products we can produce at Bluffton facility Build Poore Brothers brand regionally Identify Premium Private Label and Co-Pack opportunities
Indulgent Specialty Brand Snack Performance
NASDAQ: SNAK

3434
2009 New TGIF Products
NASDAQ: SNAK

3535
2008/2009 New Burger King Products
NASDAQ: SNAK

3636
2009 O’Boisies Product Introduction
NASDAQ: SNAK

37
The Poore BrothersIntensely Different Brands
Leading kettle chip brand in the Southwest United States
Compelling Intensely Different positioning
Success story in foodservice
NASDAQ: SNAK

3838
Investing in the Future Capital
Completing the expansion at our Goodyear plant Evaluating investments in our Rader and Bluffton facilities
Hiring Continue to strengthen our overall leadership team in the hiring of Alex Rembert V.P. of
Operations for the company New plant Director at our Rader Farms facility New Oracle Analyst in our IT department Successfully invested in Sales and Marketing hires late last year/early this year. Investing in PR & IR
Investment in Brand Development Increase Market Research Increase Research and Development Increase New Product Support Increase Consumer Activity
Business Intelligence Significantly enhanced our financial reporting and analysis at Rader Farms Rolled out a new sales reporting tool to our sales team which will significantly improve our
sales data and analysis New sales and syndicated date reports Additional market research focused on Boulder and Rader
NASDAQ: SNAK

3939
Poised for Continued GrowthPoised for Continued Growth Despite macro weakness, we continue to consistently deliver record earnings and
profitable growth Sixth consecutive quarter of earnings growth Double digit percentage increases in the majority of products
The Inventure Group is better positioned for growth than in recent years Expanding our portfolio of categories and brands Realizing distribution gains Identifying strategic opportunities partnerships (licensing, etc.) Reducing debt: Reduced by $3.6mm vs. 2008 year end levels
Diversified base of growth drivers Healthy/Natural brands Indulgent specialty snack brands Private label
Top notch human capital with relentless focus on enhancing operating efficiency and building shareholder value
NASDAQ: SNAK

4040
Thank YouInvestor Relations Contact
Steve Weinberger Chief Financial Officer
(623)932-6200www.inventuregroup.net
NASDAQ: SNAK