the international patent system yearly review
TRANSCRIPT
PCTTHE INTERNATIONAL PATENT SYSTEM
>> YEARLY REVIEW
Developments and Performance in 2010

ACKNOWLEDGEMENTS
The PCT Yearly Review was prepared under the general direction of Director General Francis Gurry andsupervised by Carsten Fink, Chief Economist. The principal contributors were Mosahid Khan, Ryan Lamb,Bruno Le Feuvre, and Hao Zhou. Other written contributions were provided by Debra Collier. Bruno LeFeuvre coordinated the production of the Review and Samiah Do Carmo Figueiredo provided valuableadministrative support.
Colleagues in WIPO’s Innovation and Technology Sector offered valuable comments on drafts at variousstages of preparation. Gratitude is also due to Heidi Hawkings for timely editorial support, Odile Conti forthe Review’s design and the Language Service for the French and Spanish translations.
Finally, WIPO is grateful to national and regional patent offices for sharing their annual statistics.
Readers are welcome to use the information provided in this review, but are requested to cite WIPO as thesource. Tables and graphs can be downloaded in image format at:
www.wipo.int/ipstats/en/statistics/pct/

3
4
7
1111111212141516171818192021222324242526
2727272828292930313232333435
TABLE OF CONTENTS
HIGHLIGHTS
INTRODUCTION TO THE PATENT COOPERATION TREATY
SPECIAL THEME: THE CHANGING GEOGRAPHY OF THE PCT SYSTEM
SECTION A – USE OF THE PCT SYSTEM
INTERNATIONAL PHASE: F IL ING OF PCT APPLICATIONSGLOBAL TREND
A.1 Trend in PCT ApplicationsAPPLICATIONS BY COUNTRY OF ORIGIN
A.2 Top Countries of Origin: PCT ApplicationsA.3 Geographical Regions: PCT ApplicationsA.4 Geographical Subregions: PCT ApplicationsA.5 PCT Applications by Income GroupA.6 PCT Applications as Share of Resident Applications
PCT APPLICANTS
A.7 Distribution of PCT ApplicantsA.8 Distribution of PCT Applicants by Country of OriginA.9 Top PCT ApplicantsA.10 Top PCT Applicants among UniversitiesA.11 Distribution of PCT Applications by Ownership TypeA.12 Foreign Inventors Named in PCT Applications
FIELDS OF TECHNOLOGY OF PCT APPLICATIONS
A.13 PCT Applications by Field of TechnologyA.14 Top Country of Origin: Fields of TechnologyA.15 Top Middle Income Countries: Fields of Technology
PCT NATIONAL PHASE ENTRIESGLOBAL TREND
A.16 PCT National Phase Entry TrendNATIONAL PHASE ENTRIES BY COUNTRY
A.17 Top Countries: National Phase EntriesA.18 Top Middle Income Countries: National Phase EntriesA.19 Distribution of National Phase Entries by RegionA.20 National Phase Entries per PCT ApplicationA.21 Share of PCT National Phase Entries out of Total Filings Abroad
NATIONAL PHASE ENTRIES BY OFFICE
A.22 Top 20 Patent Offices: National Phase EntriesA.23 National Phase Entries by Patent Office and Country of OriginA.24 National Phase Entries by Patent Office and Middle Income Country of OriginA.25 Share of PCT National Phase Entries out of Total Non-Resident Filings

36
3636373738394041414242434444454646474748
49
49505051
52
5252
54
545454
55
555555
56565761626667
SECTION B – PERFORMANCE OF THE PCT SYSTEM
RECEIVING OFFICES
B.1 Top 15 Receiving OfficesINTERNATIONAL BUREAU
B.2 Filings by Medium of FilingB.3 Electronic Filing and Processing of PCT ApplicationsB.4 Languages of Filing and PublicationB.5 TranslationB.6 TerminologyB.7 Publication TimelinessB.8 Republication TimelinessB.9 QualityB.10 Efficiency
INTERNATIONAL SEARCHING AUTHORITIES
B.11 Distribution by ISAB.12 Timeliness in transmitting ISRs
SUPPLEMENTARY INTERNATIONAL SEARCHING AUTHORITIES
B.13 Distribution by SISAINTERNATIONAL PRELIMINARY EXAMINING AUTHORITIES
B.14 Distribution by IPEAB.15 Timeliness in transmitting IPRPs
SECTION C – WIPO’S PATENT INFORMATION SERVICE
C.1 PATENTSCOPE Search ServiceC.2 New Internet Resources on PCT WebsiteC.3 Special Access to Information for Developing CountriesC.4 Patent Economics and Statistics
SECTION D – LEGAL DEVELOPMENTS
D.1 Changes to the Legal FrameworkD.2 Other Developments
SECTION E – PCT TRAINING
E.1 SeminarsE.2 WebinarsE.3 Distance Learning
SECTION F – MEETINGS
F.1 Meeting of International Authorities under the PCTF.2 PCT Working GroupF.3 PCT Assembly
ANNEXES NNEXESSTATISTICAL SOURCES AND METHODSSTATISTICAL TABLELIST OF ACRONYMSGLOSSARYPCT CONTRACTING STATESADDITIONAL RESOURCES

3
HIGHLIGHTS
In 2010, the international patent system saw several notable developments.
Recovery of PCT application filings. With an estimated 164,300 PCT applications filed in 2010, the totalvolume increased by 5.7% compared to 2009. The strongest growth originated from China (+55.6%) whichovertook the Republic of Korea as the fourth-ranked PCT filing country. India (+36.6%), the Republic ofKorea (+20.3%) and Japan (+8.0%) also experienced significant growth, offsetting a mixed performance inEuropean countries and a continued decline in the United States of America (US) (-1.6%) which, despite thisdecrease, remains the largest user of the PCT system.
Changing geography of PCT filings. Asia became the biggest PCT filing region, overtaking Europe.1
Mostof the filings originated from East Asia. With an annual growth of 18.4%, this subregion alone filed morePCT applications than any other subregion, followed by North America and Western Europe. These threesubregions together accounted for 83.4% of all PCT applications filed.
Top PCT applicants. Panasonic Corporation (Japan) maintained its top position in the list of PCT applicationspublished, followed by the telecommunications company ZTE Corporation (China) and QualcommIncorporated (US). Among universities, the top four university PCT applicants are located in the US, namelythe University of California, the Massachusetts Institute of Technology, the University of Texas and theUniversity of Florida.
Fields of technology. Digital Communication saw the fastest growth (17.3%) and accounts for the largestshare of total PCT applications published (up from the third largest share in 2009). Almost every other fieldof technology experienced declines or only modest growth. The sharpest decline was seen in the field oftelecommunications.
2
.
1 The groupings by region and subregion are based on the United Nations definition of regions.2 It should be noted that the 2009 decline in PCT filings resulted in a 2.3% decrease in the number of PCT applications published in 2010.
INTRODUCTION TO THE PATENT COOPERATION TREATY
History
The Patent Cooperation Treaty (PCT) is an international treaty administered by the World IntellectualProperty Organization (WIPO) which offers patent applicants an advantageous route for seeking patentprotection internationally. Since entering into force in 1978, the PCT has served as an alternative to the ParisConvention for the Protection of Industrial Property (1883) - the Paris Convention - for acquiring patentrights in different countries. Starting with only 18 Members, in 2010 there were 142 PCT contracting states.
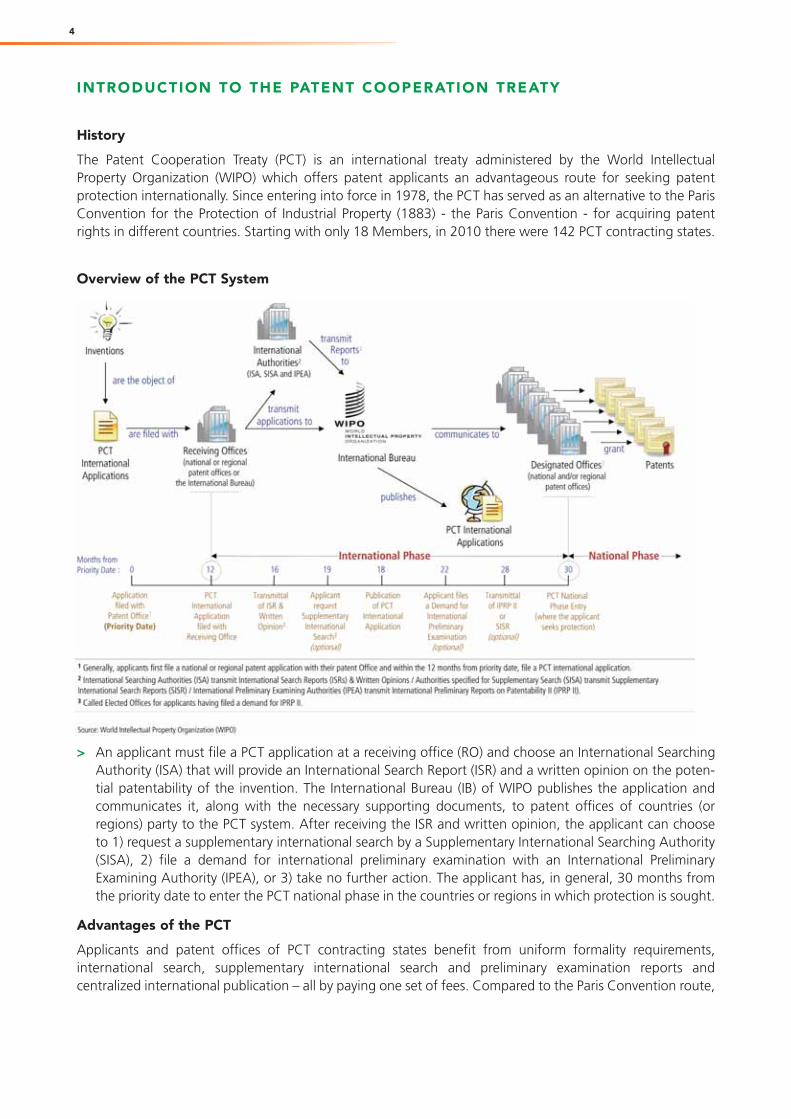
Overview of the PCT System
> An applicant must file a PCT application at a receiving office (RO) and choose an International SearchingAuthority (ISA) that will provide an International Search Report (ISR) and a written opinion on the poten-tial patentability of the invention. The International Bureau (IB) of WIPO publishes the application andcommunicates it, along with the necessary supporting documents, to patent offices of countries (orregions) party to the PCT system. After receiving the ISR and written opinion, the applicant can chooseto 1) request a supplementary international search by a Supplementary International Searching Authority(SISA), 2) file a demand for international preliminary examination with an International PreliminaryExamining Authority (IPEA), or 3) take no further action. The applicant has, in general, 30 months fromthe priority date to enter the PCT national phase in the countries or regions in which protection is sought.
Advantages of the PCT
Applicants and patent offices of PCT contracting states benefit from uniform formality requirements,international search, supplementary international search and preliminary examination reports andcentralized international publication – all by paying one set of fees. Compared to the Paris Convention route,
4

applicants can delay the examination procedures at national patent offices as well as the payment ofassociated legal fees and translation costs. By deferring national and regional procedures, applicants gaintime to make decisions on the potential commercialization of the invention and in which markets to seekpatent protection. Because the PCT system was designed to reduce unnecessary duplication between patentoffices, applicants can expect to benefit from time and cost savings.
Filing of PCT Applications
Generally, applicants seeking to protect an invention in more than one country first file a national or regionalpatent application with their national or regional patent office. Within 12 months from the filing date ofthat first application (a time limit set by the Paris Convention), they file an international application underthe PCT with a RO, i.e., the respective national or regional patent office or the IB, in a language acceptedby the RO, thus beginning the “international phase”. A patent application filed through the PCT system isa PCT international application, referred to hereafter as a PCT application. Only a national or a resident ofa PCT contracting state can file a PCT application. If several applicants are named in a PCT application, atleast one of them must comply with this requirement.
Applicants can file a single, uniform international application in one language to seek patent protection ina large number of countries, thereby avoiding the need to file several separate applications, possibly indifferent languages, at each national or regional patent office. At the moment of filing, all contracting statesare automatically designated in the application, but the applicant ultimately decides in which national orregional offices to seek patent protection. It should be noted that an “international patent”, as such, doesnot exist and that the granting of patents remains under the control of national or regional patent officesin what is called the “national phase” (see below).
International Phase
The international phase usually lasts for a period of 18 months and mainly consists of a formal examinationof the application, international search, international publication of the application, optional supplementaryinternational search, and optional international preliminary examination. Published PCT applications areaccessible, free of charge, via WIPO’s online PATENTSCOPE search service.
International BureauThe receiving office transmits a copy of the PCT application to the IB, which is responsible for:
receiving and storing all application documents;performing a second formalities examination;translating the title and abstract of the PCT application and certain associated documents into Englishand/or French, where necessary;publishing the application and related documents on PATENTSCOPE;communicating documents to offices and third parties;providing legal advice to users on request; andproviding PCT-related assistance to PCT members.
International SearchPCT applications are subject to an international search by one of the 17 ISAs3 which, in turn, identify theprior art relevant to the patentability of the invention; draft (or “establish”) an ISR; and provide a writtenopinion on the invention’s potential patentability. That opinion can assist the applicant in deciding whetherto continue to seek protection for the invention. If the written opinion is unfavorable, the applicant maychoose to amend the application to improve the probability of obtaining a patent, or to withdraw theapplication before incurring additional costs.
3 Fourteen ISAs are currently active. The national patent offices of India, Israel and Egypt, although appointed as ISAs, are not yet operating as such.
5
Supplementary International SearchAs of January 1, 2009, the PCT Supplementary International Search (SIS) service offers applicants the optionto request searches from ISAs other than the one that carried out the initial search. This service aims toprovide a more complete overview of the prior art in the international phase, by allowing the applicant tohave a search performed in the ISA’s specialty language. Applicants can request a SupplementaryInternational Search Report (SISR) by an SISA up to 19 months from the priority date.
International Preliminary ExaminationAfter receiving the ISA’s written opinion, applicants can request an optional international preliminaryexamination, i.e., a second evaluation of the invention’s patentability, to be carried out by an IPEA usuallyon an amended version of the application. (All ISAs are also IPEAs.) The resulting International PreliminaryReport on Patentability (IPRP II) further assists the applicant in determining whether or not to enter thenational phase.
National Phase
Under the PCT, applicants have at least 18 months from the date on which the PCT application was filedbefore entering the national phase at individual patent offices. This 18-month delay affords the applicantadditional time – compared to that provided under the Paris Convention – to evaluate the chances ofobtaining a patent and to plan how to use the invention commercially in the countries in which protectionis sought. In the national phase, each patent office is responsible for examining the application inaccordance with its national patent laws and deciding whether to grant patent protection. The time requiredfor the examination and grant of a patent varies across patent offices.
For more information on the PCT, please visit: www.wipo.int/pct/en/
6

SPECIAL THEME – THE CHANGING GEOGRAPHY OF THE PCT SYSTEM
The face of the world economy has changed much over the past two decades. Led by China and other Asianeconomies, several middle income countries have grown at a persistently faster pace than have high incomecountries. Their share of the global output has correspondingly increased. The recent financial and economiccrisis has only accelerated this trend; high income countries have experienced sharper declines and weakerrecoveries than the group of fast-growing middle income countries.
This Special Theme discusses how the shift in the world economy has shaped the geography of the PCT sys-tem. To a significant extent, this is a story about the rise of East Asia. However, economic forces can onlypartly explain the evolution of filings via the PCT system, and several considerations provide a more nuancedview of East Asia’s ascendancy.
East Asia has become the main PCT filer
Until recently, the PCT system was mainly used by applicants from North America and Western Europe. In2010, East Asia overtook them to become the subregion accounting for the most PCT filings (see figure 1).Indeed, since the economic recovery that followed the dot-com recession, the major East Asian filers –China, Japan and the Republic of Korea - experienced particularly rapid growth in applications. They con-tinued to increase their filings even during and after the most recent economic downturn – unlike NorthAmerica and Western Europe. From 2002 to 2010, the average annual growth rate of East Asia was 15.1%,compared to 1.1% for North America and 3.1% for Western Europe.
Figure 1: PCT filing trends
Source: WIPO Statistics Database
Rise of East Asia reflected in economic fundamentals, but not fully
Economic fundamentals can, to some degree, explain why East Asia has emerged as the main PCT filer. Table 1presents selected countries’ shares of total PCT filings, their shares of global gross domestic product (GDP)and of worldwide research and development expenditure (R&D) for 1998 and 2008.
0
10,000
20,000
30,000
40,000
50,000
60,000
1990 1991 1992 1993 1994 1995 1996 1997 1998 1999 2000 2001 2002 2003 2004 2005 2006 2007 2008 2009 2010
Japan China Republic of Korea East Asia North America Western Europe
7

4 The fact that the PCT shares of high income countries exceed their GDP shares supports the view that a threshold level for intensive use of the PCT system exists.
Table 1: PCT filings, GDP and R&D expenditure (%)
Source: WIPO Statistics DatabaseNote: Data on GDP and on R&D expenditure are in purchasing power parity US dollars. The top five ranking of high income and middle income economies isbased on 2008 PCT filings. Worldwide R&D expenditure is a WIPO estimate based on 76 countries.
In the case of China and the Republic of Korea, rising PCT share went hand in hand with growing GDP andR&D shares. However, there is no one-to-one correspondence. For example, the Republic of Korea saw a 4percentage point increase in its PCT share, but only a modest increase in its R&D share. Vice versa, Chinasaw a quadrupling of its R&D share, but a smaller increase in its PCT share – though China has, since 2008,overtaken the Republic of Korea in PCT filings. Comparing the two countries suggests that once an economyreaches a particular threshold level of technological development, PCT use grows over-proportionately; theRepublic of Korea appears to have reached that level earlier, but China is catching up quickly.
4
Japan stands out in that its share of global output and worldwide R&D expenditure fell, but its share of PCTfilings almost doubled from 9.10% in 1998 to 17.6% in 2008. This is in contrast to the US, Germany andFrance which saw declining shares for all three performance measures. Japan’s experience thus demon-strates that strategic decision-making can have a more pronounced impact on PCT use than that predictedby economic fundamentals.
East Asia’s rise in global patenting emerged earlier
Looking beyond the PCT system, East Asia already overtook Western Europe in 1977 as the subregion inwhich patent offices received the most applications. At that time, Japan accounted for the bulk of them; adecade later, filings in the Republic of Korea picked up and, some time in the 1990s, applications in Chinastarted to grow rapidly. In 2009, the number of patents filed in East Asia (834,703) exceeded the numberat all offices in North America (496,285) and Western Europe (224,017) combined.
In 1995, East Asia also emerged as the region of origin of most patents filed in foreign countries. However,East Asia’s dominance is less pronounced for these so-called filings abroad when taken in the context oftotal patents filed by the region. In particular, filings abroad by Japanese and US residents are similar inmagnitude; filings abroad by Chinese residents are still few in number – though growing rapidly – especiallycompared to China’s share of global GDP (see figure 2).
8
Countries Income Group PCT Filings GDP R&D expenditureType Ranking 2008 1998 2008 1998 2008 1998
United States of America High 1 31.63 41.68 20.30 23.12 33.47 38.63Japan High 2 17.62 9.10 6.16 7.99 12.61 15.46Germany High 3 11.55 14.03 4.27 5.39 6.79 7.86Republic of Korea High 4 4.84 0.76 1.91 1.68 3.82 2.53France High 5 4.33 4.79 3.02 3.63 3.80 5.01China Middle 1 3.75 0.52 11.66 6.53 10.20 2.74India Middle 2 0.66 0.02 4.91 3.65 2.23 1.67Russian Federation Middle 3 0.47 0.59 3.23 2.44 2.00 1.49Brazil Middle 4 0.29 0.17 2.83 2.98 1.80 1.66Turkey Middle 5 0.24 0.05 1.36 1.37 0.59 0.33All others 24.62 28.29 40.34 41.21 22.68 22.61

Figure 2: Trends in patent applications filed abroad
Source: WIPO Statistics DatabaseNote: Data are missing for some origins. The year 2009 is based on estimates.
Countries’ use of the PCT system differs
As shown above, East Asia emerged as the subregion accounting for the most PCT filings in 2010, but hadalready become the region of origin of most patents filed in foreign countries in 1995. This suggests thatEast Asian applicants have relied less on the PCT system for their filings abroad than have applicants fromother regions, and more on the so-called Paris route. This is, indeed, borne out by the data. Figure 3 showsthe share of PCT national phase entries out of countries’ total filings abroad from 2005 to 2009. For theRepublic of Korea, China and Japan, this share remained below 50 percent, whereas it remained above thatlevel for the US (73%) and Germany (57%). However, use of the PCT system has increased markedly for theRepublic of Korea and Japan in recent years.
Figure 3: Share of PCT national phase entries out of total filings abroad
Source: WIPO Statistics Database
There are also important differences in the extent to which PCT filings later become national phase entries.Figure 4 shows that there are more than 2.5 national phase entries per PCT filing for Japan, Germany andthe US; for the Republic of Korea, this number stands at around 1.5; and for China it falls to below 1 –smaller than several other middle income countries. To put these numbers into perspective, US applicants in2009 accounted for 6 times as many PCT filings but 27 times as many PCT national phase entries as didChinese applicants. The following factors might explain why middle income countries, and especially China,showed far fewer national phase entries per PCT filing: applicants may have commercial interests in fewercountries; they may be deterred by the costs of proceeding with national phase entry; or they may have lessexperience in drafting applications leading therefore to more dropouts.
0
25,000
50,000
75,000
100,000
125,000
150,000
175,000
200,000
Appl
icatio
ns fi
led
abro
ad
1995 1996 1997 1998 1999 2000 2001 2002 2003 2004 2005 2006 2007 2008 2009
Filing Year
China Germany Republic of Korea Japan United States of America
0
25
50
75
100
Shar
e (%
)
2005 2006 2007 2008 2009
Filing Year
China Germany Republic of Korea Japan United States of America
9

10
Figure 4: Number of PCT national phase entries per PCT application
Source: WIPO Statistics DatabaseNote: PCT national phase entries are compared with PCT applications filed 12 months earlier. PCT national phase entry at a regional patent office may result inseveral national patents. Thus, the number of national jurisdictions in which applicants seek protection is invariably higher than the number of national phase entries.
What might happen in the coming years?
Fundamental economic forces will continue to shape the geography of the PCT system. Reflecting currenteconomic forecasts, this heralds growing dominance by Asia. Even though East Asia alone already accountsfor more filings than any other subregion, there remains additional growth potential. East Asian countriesstill rely less on the PCT system for their filings abroad than do the US and Germany. China’s participationin the PCT system is still relatively young. As China’s economy further develops and applicants gainexperience with the international patent system, its PCT filings may well generate more national phaseentries.
Beyond the three dominant East Asian countries, other Asian economies might reach the threshold level oftechnological development at which more intensive patenting sets in. The 36.6 percent growth in India’sPCT filings in 2010 points in that direction, though it remains to be seen whether such fast growth willpersist.
0.0
1.0
2.0
3.0
4.0
Aver
age
Franc
eJap
an
German
y
United
State
s of A
merica
India
Brazil
Repu
blic o
f Kore
a
Russi
an Fe
derat
ionTu
rkey
China
Origin
2008 2009

11
SECTION A – USE OF THE PCT SYSTEM
INTERNATIONAL PHASE: F IL ING OF PCT APPLICATIONS
This section presents the key statistical trends and patterns for the international phase. It briefly describesthe global trend, analyzes PCT applications by country of origin, income group and the applicant’sgeographical region;5 it then presents the ranking of top applicants and a breakdown of applications by fieldof technology.
GLOBAL TREND
A.1 Trend in PCT Applications
Figure A.1 depicts the number of PCT applications filed since 1990 and annual growth rates. The underlyingdata are based on the international filing date of PCT applications.
Figure A.1: Trend in PCT applications
Source: WIPO Statistics Database
> In 2010, an estimated 164,300 PCT applications were filed, representing a 5.7% increase compared tothe previous year. Due to the economic recovery, the number of PCT applications filed in 2010 exceed-ed the 2008 level.
> Since the inception of the PCT system in 1978, about 1.98 million PCT applications have been filedworldwide.
5 The income groups correspond to those used by the World Bank. The groupings by region and subregion are based on the United Nationsdefinition of regions.
33.5
15.6 11.0 14.7 17.4 17.0 20.5 18.4 17.5 13.822.1
16.12.0 4.4 6.4 11.5 9.4 6.9 2.1
-4.5
5.7
0
50,000
100,000
150,000
200,000
PCT
Appl
icatio
ns
1990 1991 1992 1993 1994 1995 1996 1997 1998 1999 2000 2001 2002 2003 2004 2005 2006 2007 2008 2009 2010
PCT Applications Growth Rate (%)
International Filing Year

12
APPLICATIONS BY COUNTRY OF ORIGIN
This subsection analyzes PCT applications according to the country, region and subregion of origin of theapplicant, as well as the income group of the applicant’s country of residence. PCT applications are assignedto a particular country of origin according to the country of residence of the first-named applicant. Astatistical table containing all countries is provided in the annex.
A.2 Top Countries of Origin: PCT applications
Figure A.2 shows the trend in PCT filings for the top five countries of origin, including a combined group ofall other origins.
Figure A.2: Distribution of PCT applications by country of origin
Source: WIPO Statistics Database
> The leading country of origin remains the US, followed by Japan and Germany.
> Even though PCT filings of all origins combined, shown in figure A.2, have grown significantly since1990, China and the Republic of Korea experienced particularly strong growth, with respective averageannual growth rates of 37.5% and 15.6% from 2005 to 2010.
> The share of the top five countries of origin accounted for 71% of total PCT filings in 2010.
-0.9 5.3 1.9 37.5 15.6 2.7
Average Annual Growth Rate (%): 2005-2010
0
10,000
20,000
30,000
40,000
50,000
PCT
Appl
icatio
ns
United States of America Japan Germany China Republic of Korea All others
Country of Origin
1990 1995 2000 2005 2010

13
Table A.2 presents the number of PCT applications filed by the top 20 countries of origin over the last five years.
Table A.2: PCT applications by country of origin
Source: WIPO Statistics Database
> For the third consecutive year, applicants from the US reduced their overall number of PCT filings.Following a sharp drop of 11.7% in 2009, their filings only slightly decreased by 1.6% in 2010.
> The number of PCT applications filed by applicants from China (+55.6%), India (+36.6%) and theRepublic of Korea (+20.3%) sharply increased in 2010. The number of PCT applications filed by appli-cants from Spain, Austria and Japan also showed positive annual growth with 12%, 11.3% and 8%increases, respectively, compared to 2009.
> Only a few of the countries shown in table A.2 filed fewer PCT applications in 2010 than in 2009. Amongthe 6 countries in which filings declined, Denmark (-12.7%), the Netherlands (-8.6%) and Sweden (-7.1%) had the sharpest decreases.
> With a total of 54,000 PCT applications filed, European Patent Convention (EPC) member states, as ablock, saw an increase of 0.8% in these applications from 2009 to 2010.
ChangeCountry of Origin Year of Filing 2010 compared
Share to 20092006 2007 2008 2009 2010 (%) (%)
United States of America 51,280 54,043 51,638 45,617 44,890 27.3 -1.6
Japan 27,025 27,743 28,760 29,802 32,180 19.6 8.0
Germany 16,736 17,821 18,855 16,797 17,558 10.7 4.5
China 3,942 5,455 6,120 7,900 12,295 7.5 55.6
Republic of Korea 5,945 7,064 7,899 8,035 9,668 5.9 20.3
France 6,256 6,560 7,072 7,237 7,288 4.4 0.7
United Kingdom 5,097 5,542 5,466 5,044 4,908 3.0 -2.7
Netherlands 4,553 4,433 4,363 4,462 4,078 2.5 -8.6
Switzerland 3,621 3,833 3,799 3,671 3,728 2.3 1.6
Sweden 3,336 3,655 4,137 3,567 3,314 2.0 -7.1
Canada 2,575 2,879 2,976 2,527 2,721 1.7 7.7
Italy 2,698 2,946 2,883 2,652 2,658 1.6 0.2
Finland 1,846 2,009 2,214 2,123 2,145 1.3 1.0
Australia 1,996 2,052 1,938 1,740 1,776 1.1 2.1
Spain 1,204 1,297 1,390 1,564 1,752 1.1 12.0
Israel 1,593 1,737 1,899 1,555 1,488 0.9 -4.3
India 833 902 1,072 961 1,313 0.8 36.6
Denmark 1,158 1,151 1,357 1,344 1,173 0.7 -12.7
Austria 911 1,009 953 1,024 1,140 0.7 11.3Belgium 1,030 1,124 1,135 1,008 1,057 0.6 4.9All others 6,006 6,672 7,308 6,768 7,170 4.4 5.9Total 149,641 159,927 163,234 155,398 164,300 100.0 5.7

14
A.3 Geographical Regions: PCT Applications
Figure A.3 depicts PCT application filing trends according to the region of origin of the applicant.
Figure A.3: PCT applications filed by geographical region
PCT applications filed in Asia, Europe and North America
Source: WIPO Statistics Database
PCT applications filed in Africa, Latin America and Oceania
Source: WIPO Statistics Database
> In 2010 Asia became the region to file the most PCT applications worldwide, followed by Europe andNorth America. North America had dominated the ranking in 2005.
> Applicants from Asia, Europe and North America each filed between 45,000 and 60,000 PCT applica-tions in 2010. By contrast, applicants from the other three regions only filed between about 400 and2,000 PCT applications each over the same period.
> Only three of the six regions had a positive average annual growth rate over the period from 2005 to2010, namely Asia (10.9%), Latin America and the Caribbean (LAC) (4.8%) and Europe (2.2%).
10.9 2.2 -0.7
Average Annual Growth Rate (%): 2005-2010
0
15,000
30,000
45,000
60,000
75,000
PCT
Appl
icatio
ns
Asia Europe North America
Region
1990 1995 2000 2005 2010
-2.5 4.8 -1.5
Average Annual Growth Rate (%): 2005-2010
0
1,000
2,000
3,000
PCT
Appl
icatio
ns
Oceania LAC Africa
Region
1990 1995 2000 2005 2010
15
A.4 Geographical Subregions: PCT Applications
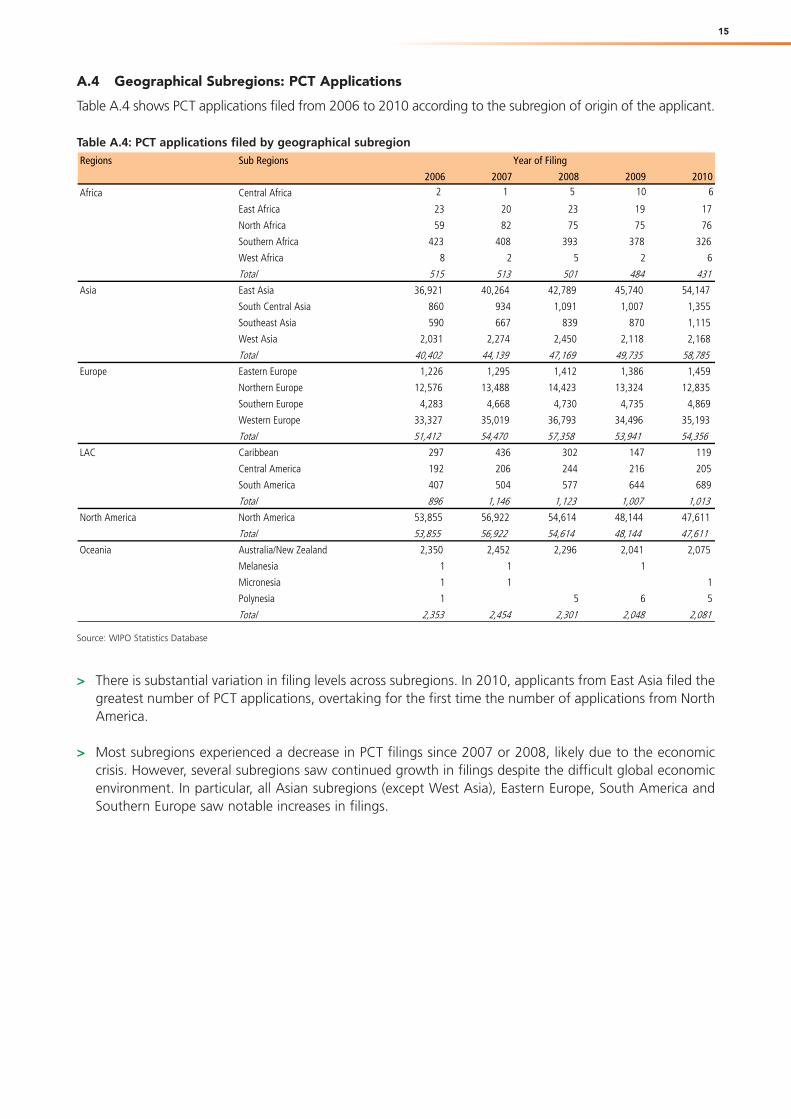
Table A.4 shows PCT applications filed from 2006 to 2010 according to the subregion of origin of the applicant.
Table A.4: PCT applications filed by geographical subregion
Source: WIPO Statistics Database
> There is substantial variation in filing levels across subregions. In 2010, applicants from East Asia filed thegreatest number of PCT applications, overtaking for the first time the number of applications from NorthAmerica.
> Most subregions experienced a decrease in PCT filings since 2007 or 2008, likely due to the economiccrisis. However, several subregions saw continued growth in filings despite the difficult global economicenvironment. In particular, all Asian subregions (except West Asia), Eastern Europe, South America andSouthern Europe saw notable increases in filings.
Regions Sub Regions Year of Filing
2006 2007 2008 2009 2010
Africa Central Africa 2 1 5 10 6
East Africa 23 20 23 19 17
North Africa 59 82 75 75 76
Southern Africa 423 408 393 378 326
West Africa 8 2 5 2 6
Total 515 513 501 484 431
Asia East Asia 36,921 40,264 42,789 45,740 54,147
South Central Asia 860 934 1,091 1,007 1,355
Southeast Asia 590 667 839 870 1,115
West Asia 2,031 2,274 2,450 2,118 2,168
Total 40,402 44,139 47,169 49,735 58,785
Europe Eastern Europe 1,226 1,295 1,412 1,386 1,459
Northern Europe 12,576 13,488 14,423 13,324 12,835
Southern Europe 4,283 4,668 4,730 4,735 4,869
Western Europe 33,327 35,019 36,793 34,496 35,193
Total 51,412 54,470 57,358 53,941 54,356
LAC Caribbean 297 436 302 147 119
Central America 192 206 244 216 205
South America 407 504 577 644 689
Total 896 1,146 1,123 1,007 1,013
North America North America 53,855 56,922 54,614 48,144 47,611
Total 53,855 56,922 54,614 48,144 47,611
Oceania Australia/New Zealand 2,350 2,452 2,296 2,041 2,075
Melanesia 1 1 1
Micronesia 1 1 1
Polynesia 1 5 6 5
Total 2,353 2,454 2,301 2,048 2,081

6 At least one applicant must be a resident or national of a contracting state.
A.5 PCT Applications by Income Group
Table A.5 presents PCT applications filed from 2006 to 2010 according to the income group of theapplicant’s country of origin.
Table A.5: PCT applications filed by income group
Source: WIPO Statistics Database
> The high income group filed an increasing number of PCT applications from year to year until the onsetof the economic crisis in 2008. In 2010, the number of PCT applications by this group increased com-pared to 2009 but did not reach its pre-crisis level.
> The middle income group, dominated by China, was not as affected by the crisis as was the high incomegroup. Its filing trend remained positive during the period shown in table A.5, with a substantial increasein 2010.
> Use of the PCT system by low income countries is limited. Over the last five years, the main countries oforigin in terms of PCT filings were the Democratic People's Republic of Korea (17 PCT applications),Kenya (17) and the Lao People's Democratic Republic (7).
Figure A.5: Top 10 middle income countries: PCT applications
Source: WIPO Statistics Database Note: China was not included in the graph due to the significant difference in PCT filings between China and the other middle income group countries. Data forChina are available in paragraph A.2.
> Several countries experienced significant increases in PCT filings from 2005 to 2010. Over this period,Malaysia (+59.8 %), Chile (+57.8 %) and Thailand (+48.8%) saw the highest average annual growthrates. However, it should be noted that Chile and Thailand only acceded to the PCT in 2009 and Malaysiain 2006. Even though it was possible, under more restrictive conditions6, for their applicants to file a PCTapplication before they acceded to the PCT, their accession strongly promoted PCT filings by applicantsfrom those countries.
> Over the past five years, notable increases in PCT filings have also been observed from applicants origi-nating from countries that have been PCT members for more than a decade, such as applicants fromTurkey (+22.7%), India (+14.1%) and Brazil (+12.8%).
16
Income Groups Year of Filing
2006 2007 2008 2009 2010
High Income 142,153 150,540 152,839 143,457 147,345
Middle Income 7,243 9,095 10,209 11,890 16,910
Low Income 13 8 18 12 22
14.1 2.7 12.8 22.7 59.8 -3.8 6.3 13.1 57.8 48.8 7.3Average Annual Growth Rate (%): 2005-2010
0
200
400
600
800
1,000
1,200
1,400
PCT
Appl
icatio
ns
India Russian Federation Brazil Turkey Malaysia South Africa Mexico Ukraine Chile Thailand Others
Country of Origin
1990 1995 2000 2005 2010

7 Ideally, the calculation of the conversion ratio should be based on “first filings” at national patent offices. However, the data collected frommost patent offices do not distinguish between “first” and “subsequent” filings. The figures presented in Table A.6 are, therefore, based ontotal resident patent filings.
A.6 PCT Applications as Share of Resident Applications
Table A.6 presents a hypothetical “conversion ratio” that seeks to capture how frequently applicants opt fora PCT application after filing a patent application with their national or regional patent office. Formally, theconversion ratio is defined as the total number of PCT applications filed by country A in year t divided bythe total number of resident patent applications filed by country A in year t-1. (Total data on resident patentapplications include regional patent applications.) The one-year lag between PCT applications and residentpatent applications is due to the fact that applicants have up to 12 months from the filing date of the earliernational filing to submit a PCT application.7 For example, the conversion ratio for Germany is 0.29 (17,558PCT applications in 2010 divided by 60,557 resident applications in 2009).
A high conversion ratio implies that a large proportion of resident applications lead to the filing of PCTapplications. Similarly, a low conversion ratio means only a small share of resident applications give rise toPCT applications.
It should be noted that numbers are somewhat biased as certain PCT applications do not have priority claimsassociated with prior resident filings. For example, an Israeli applicant may forgo filing a patent applicationat the Israeli Patent Office, but opt to file a national application first at the United States Patent andTrademark Office (USPTO), after which it is then “converted” into a PCT application. This explains why forcertain countries the value of the conversion ratio exceeds 1.
Table A.6: Conversion ratio of top 30 countries
Source: WIPO Statistics Database Note: Filings at the European Patent Office (EPO) by an applicant of an EPC member state are considered resident filings.
> The conversion ratio for the top 30 filing countries varied from 0.03 (Russian Federation) to 1.59 (Israel) in 2010.
> The first half of the ranking is composed almost exclusively of high income countries. South Africa, beingthe only exception, is ranked at position 13.
17
CountryChange compared
to 2009 Conversion Ratio from Resident Applications
to PCT Applications
Israel 1.59 0.08
Singapore 1.26 0.15
Luxembourg 1.23 -0.19
Finland 1.01 0.10
Canada 0.80 0.08
Switzerland 0.76 0.02
Netherlands 0.67 -0.03
Belgium 0.65 0.06
Denmark 0.53 -0.04
Spain 0.41 0.04
Ireland 0.41 -0.02
France 0.39 0.01
South Africa 0.36 -0.07
Austria 0.36 0.03
Slovenia 0.29 -0.08
Germany 0.29 0.02
Malaysia 0.29 0.01
United Kingdom 0.29 0.01
Mexico 0.25 -0.06
Italy 0.24 0.00
Hungary 0.22 0.02
United States of America 0.21 0.01
New Zealand 0.20 -0.06
Turkey 0.19 0.01
Czech Republic 0.16 -0.07
Japan 0.11 0.02
Republic of Korea 0.08 0.01
Poland 0.07 0.00
China 0.05 0.01
Russian Federation 0.03 0.00

18
PCT APPLICANTS
This subsection presents the distribution of PCT applicants, the top ranking of all applicants and universityapplicants and the share of foreign inventors named in PCT applications. For statistical purposes, the PCTapplicant is considered to be the first-named applicant in the application and, for technical reasons, onlyapplicants that are not individuals are considered (except for A.11). For confidentiality reasons, statistics onPCT applicants are based on published PCT applications rather than all PCT applications filed. Under the PCTrules, a PCT application should be published promptly after the expiration of 18 months from the prioritydate. Since most applicants prefer to file PCT applications at the end of the 12-month priority period, thestatistics based on publication date have a delay of approximately 6 months compared to those based oninternational filing date.
A.7 Distribution of PCT Applicants
Applicants can be companies, universities, government institutions and individuals. In 2010, about 41,900applicants were mentioned in published PCT applications, representing about 200 applicants fewercompared to 2009. Figure A.7 shows the distribution of PCT applicants in relation to published PCTapplications in 2010.
Figure A.7: Distribution of applicants and published PCT applications
Source: WIPO Statistics Database
> About half of all PCT applicants owned 10% of all published PCT applications. The so-called Pareto prin-ciple applies to the distribution of PCT applicants as 80% of all applicants are responsible for roughly20% of all applications.
> The PCT system is intensively used by a small number of filers: 42% of total published PCT applicationsbelong to only 1% of all PCT applicants.
0
10
20
30
40
50
60
70
80
90
100
0 10 20 30 40 50 60 70 80 90 100Share of applicants
Shar
e of
app
licat
ions
19
A.8 Distribution of PCT Applicants by Country of Origin
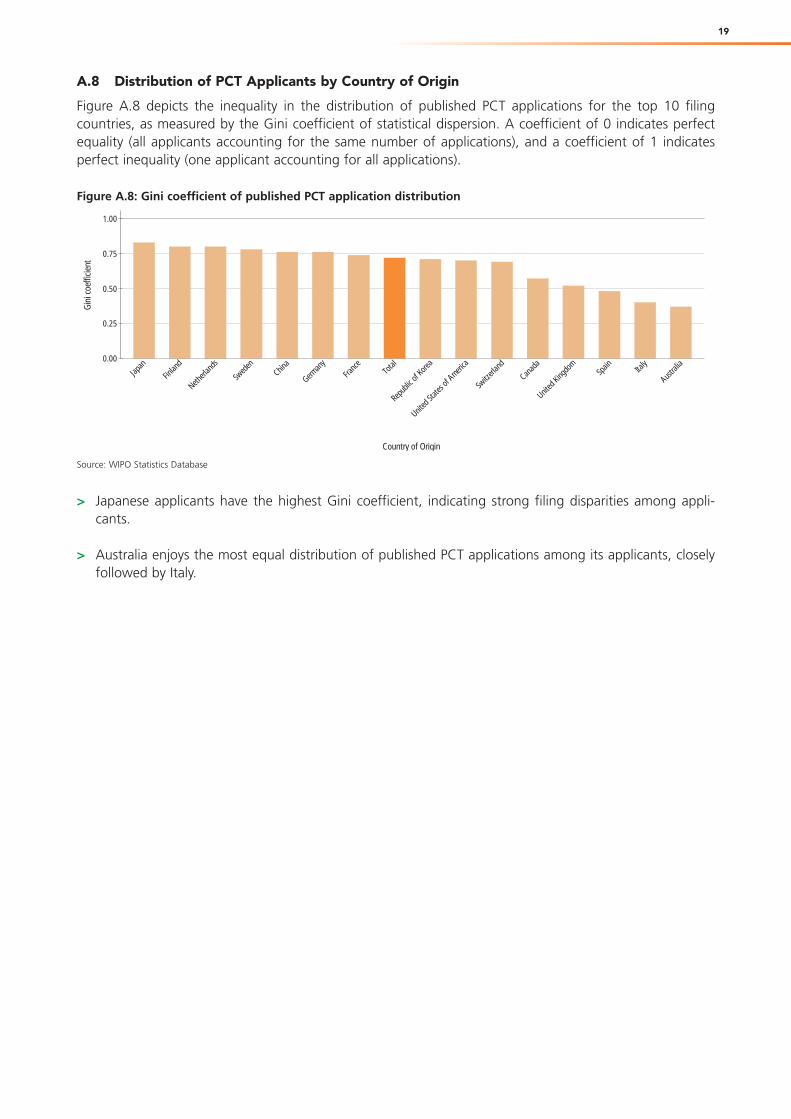
Figure A.8 depicts the inequality in the distribution of published PCT applications for the top 10 filingcountries, as measured by the Gini coefficient of statistical dispersion. A coefficient of 0 indicates perfectequality (all applicants accounting for the same number of applications), and a coefficient of 1 indicatesperfect inequality (one applicant accounting for all applications).
Figure A.8: Gini coefficient of published PCT application distribution
Source: WIPO Statistics Database
> Japanese applicants have the highest Gini coefficient, indicating strong filing disparities among appli-cants.
> Australia enjoys the most equal distribution of published PCT applications among its applicants, closelyfollowed by Italy.
0.00
0.25
0.50
0.75
1.00
Gin
i coe
fficie
nt
Japan
Finlan
d
Netherl
ands
Swed
enChin
a
German
yFra
nce
Total
Repu
blic o
f Kore
a
United
State
s of A
merica
Switz
erlan
d
Canad
a
United
King
dom
Spain Ita
ly
Austral
ia
Country of Origin

20
A.9 Top PCT Applicants
Table A.9 presents the list of the top 50 PCT applicants in 2010, by number of applications published.
Table A.9: Top PCT applicants
Source: WIPO Statistics Database
> Panasonic Corporation (Japan) remained at the top of the list. Compared to 2009, the China-based ZTECorporation surged 20 places to move into second position. Qualcomm (US) gained two places andranked third.
Numberof PCT Change
2010 Position applications ComparedRank Changed PCT Applicant's Name Country of Origin published to 2009
1 0 PANASONIC CORPORATION Japan 2,154 2632 20 ZTE CORPORATION China 1,868 13513 2 QUALCOMM INCORPORATED United States of America 1,677 3974 -2 HUAWEI TECHNOLOGIES CO., LTD. China 1,528 -3195 -1 KONINKLIJKE PHILIPS ELECTRONICS N.V. Netherlands 1,435 1406 -3 ROBERT BOSCH GMBH Germany 1,301 -2877 0 LG ELECTRONICS INC. Republic of Korea 1,298 2088 2 SHARP KABUSHIKI KAISHA Japan 1,286 2899 -3 TELEFONAKTIEBOLAGET LM ERICSSON (PUBL) Sweden 1,149 -9210 -2 NEC CORPORATION Japan 1,106 3711 -2 TOYOTA JIDOSHA KABUSHIKI KAISHA Japan 1,095 2712 -1 SIEMENS AKTIENGESELLSCHAFT Germany 833 -9913 0 BASF SE Germany 818 7914 5 MITSUBISHI ELECTRIC CORPORATION Japan 726 15715 0 NOKIA CORPORATION Finland 632 -3116 -2 3M INNOVATIVE PROPERTIES COMPANY United States of America 586 -10217 0 SAMSUNG ELECTRONICS CO., LTD. Republic of Korea 578 -1818 2 HEWLETT-PACKARD DEVELOPMENT COMPANY, L.P. United States of America 564 1019 -7 FUJITSU LIMITED Japan 476 -34120 -4 MICROSOFT CORPORATION United States of America 469 -17521 2 E.I. DUPONT DE NEMOURS AND COMPANY United States of America 452 -5722 5 INTERNATIONAL BUSINESS MACHINES CORPORATION United States of America 416 1523 9 MITSUBISHI HEAVY INDUSTRIES, LTD. Japan 391 1824 3 CANON KABUSHIKI KAISHA Japan 379 -2225 56 HITACHI, LTD. Japan 373 18326 0 BSH BOSCH UND SIEMENS HAUSGERATE GMBH Germany 371 -4227 10 THE PROCTER & GAMBLE COMPANY United States of America 359 1828 10 SONY CORPORATION Japan 347 1929 13 NOKIA SIEMENS NETWORKS OY Finland 345 3230 -12 NXP B.V. Netherlands 320 -27330 6 SUMITOMO CHEMICAL COMPANY, LIMITED Japan 320 -2632 7 KABUSHIKI KAISHA TOSHIBA Japan 318 -833 15 APPLIED MATERIALS, INC. United States of America 313 1734 1 THOMSON LICENSING France 311 -4835 6 HONDA MOTOR CO., LTD. Japan 309 -936 27 COMMISSARIAT A L'ENERGIE ATOMIQUE ET AUX ENERGIES ALTERNATIVES France 308 7037 -8 BAKER HUGHES INCORPORATED United States of America 307 -6838 2 THE REGENTS OF THE UNIVERSITY OF CALIFORNIA United States of America 306 -1538 20 MURATA MANUFACTURING CO., LTD. Japan 306 5240 13 FRAUNHOFER-GESELLSCHAFT ZUR FORDERUNG DER ANGEWANDTEN FORSCHUNG E.V. Germany 298 3340 21 NTT DOCOMO, INC. Japan 298 4942 -21 MOTOROLA, INC. United States of America 290 -24842 8 PIONEER CORPORATION Japan 290 744 -19 SONY ERICSSON MOBILE COMMUNICATIONS AB Sweden 289 -14644 2 DOW GLOBAL TECHNOLOGIES INC. United States of America 289 -1544 20 MEDTRONIC, INC. United States of America 289 5347 -4 EASTMAN KODAK COMPANY United States of America 284 -2748 -14 KYOCERA CORPORATION Japan 279 -8349 1 ALCATEL LUCENT France 275 -849 5 FUJIFILM CORPORATION Japan 275 1149 7 HENKEL KOMMANDITGESELLSCHAFT AUF AKTIEN Germany 275 14

21
A.10 Top PCT Applicants among Universities
Table A.10 shows the top 50 PCT applicants among educational institutions in 2010.
Table A.10: Top PCT applicants: university sector
Source: WIPO Statistics Database
> The University of California (US) accounted for the largest number of published PCT applications in thecategory of educational institutions. It is the only applicant in this category that also features in the top100 list of PCT applicants.
> Among the top 50 educational institutions, 30 are based in the US, 10 in Japan and 5 in the Republic ofKorea. The number of Japanese academic institutions increased from 6 in 2009 to 10 in 2010.
Number2010 of PCT Change
Overall Position applications ComparedRank Changed PCT Applicant's Name Country of Origin published to 2009
38 2 THE REGENTS OF THE UNIVERSITY OF CALIFORNIA United States of America 306 -15103 4 MASSACHUSETTS INSTITUTE OF TECHNOLOGY United States of America 145 0115 16 BOARD OF REGENTS, THE UNIVERSITY OF TEXAS SYSTEM United States of America 130 4144 0 UNIVERSITY OF FLORIDA United States of America 107 -4145 33 THE UNIVERSITY OF TOKYO Japan 105 11168 -22 THE TRUSTEES OF COLUMBIA UNIVERSITY IN THE CITY OF NEW YORK United States of America 91 -19168 -18 PRESIDENT AND FELLOWS OF HARVARD COLLEGE United States of America 91 -18176 16 THE JOHNS HOPKINS UNIVERSITY United States of America 89 2183 575 SNU R&DB FOUNDATION Republic of Korea 86 63202 112 ARIZONA BOARD OF REGENTS United States of America 80 25206 74 THE REGENTS OF THE UNIVERSITY OF MICHIGAN United States of America 79 18218 -7 THE TRUSTEES OF THE UNIVERSITY OF PENNSYLVANIA United States of America 75 -5242 110 CORNELL UNIVERSITY United States of America 71 22287 162 OSAKA UNIVERSITY Japan 60 22290 -29 UNIVERSITY OF UTAH RESEARCH FOUNDATION United States of America 59 -7290 43 THE BOARD OF TRUSTEES OF THE UNIVERSITY OF ILLINOIS United States of America 59 7302 -64 WASHINGTON UNIVERSITY United States of America 57 -15341 60 KOREA ADVANCED INSTITUTE OF SCIENCE AND TECHNOLOGY Republic of Korea 52 9347 -70 THE BOARD OF TRUSTESS OF THE LELAND STANFORD JUNIOR UNIVERSITY United States of America 51 -11349 -16 CALIFORNIA INSTITUTE OF TECHNOLOGY United States of America 50 -2349 36 PURDUE RESEARCH FOUNDATION United States of America 50 5357 92 DUKE UNIVERSITY United States of America 49 11368 -102 WISCONSIN ALUMNI RESEARCH FOUNDATION United States of America 48 -16376 -94 UNIVERSITY OF SOUTHERN CALIFORNIA United States of America 47 -13376 9 KYOTO UNIVERSITY Japan 47 2376 264 INDUSTRY-UNIVERSITY COOPERATION FOUNDATION HANYANG UNIVERSITY Republic of Korea 47 20395 -10 ISIS INNOVATION LIMITED United Kingdom 45 0414 116 YISSUM RESEARCH DEVELOPMENT COMPANY OF THE HEBREW UNIVERSITY OF JERUSALEM Israel 43 10430 6 TOHOKU UNIVERSITY Japan 41 2430 41 THE UNIVERSITY OF NORTH CAROLINA AT CHAPEL HILL United States of America 41 4443 46 EIDGENOSSISCHE TECHNISCHE HOCHSCHULE ZURICH Switzerland 40 4448 -31 UNIVERSITY OF MASSACHUSETTS United States of America 39 -2462 -122 INDUSTRY-ACADEMIC COOPERATION FOUNDATION,YONSEI UNIVERSITY Republic of Korea 38 -13462 -93 RAMOT AT TEL AVIV UNIVERSITY LTD. Israel 38 -9462 54 KEIO UNIVERSITY Japan 38 4462 88 NORTHWESTERN UNIVERSITY United States of America 38 6462 119 NATIONAL UNIVERSITY CORPORATION HOKKAIDO UNIVERSITY Japan 38 8486 -76 IMPERIAL COLLEGE OF SCIENCE, TECHNOLOGY AND MEDICINE United Kingdom 37 -5486 240 INDIANA UNIVERSITY RESEARCH & TECHNOLOGY CORPORATION United States of America 37 13497 84 UNIVERSITY OF MIAMI United States of America 36 6497 229 NATIONAL UNIVERSITY CORPORATION OKAYAMA UNIVERSITY Japan 36 12526 -77 THE REGENTS OF THE UNIVERSITY OF COLORADO United States of America 34 -4526 70 THE UNIVERSITY OF QUEENSLAND Australia 34 5526 114 NATIONAL UNIVERSITY CORPORATION NAGOYA UNIVERSITY Japan 34 7526 200 EMORY UNIVERSITY United States of America 34 10559 -158 THE OHIO STATE UNIVERSITY RESEARCH FOUNDATION United States of America 32 -11559 -110 THE RESEARCH FOUNDATION OF STATE UNIVERSITY OF NEW YORK United States of America 32 -6580 -144 POSTECH FOUNDATION Republic of Korea 31 -8580 211 NIHON UNIVERSITY Japan 31 9593 47 UNIVERSITY OF MARYLAND, BALTIMORE United States of America 30 3593 266 NATIONAL UNIVERSITY OF CORPORATION HIROSHIMA UNIVERSITY Japan 30 10

22
A.11 Distribution of PCT Applications by Ownership Type
Figure A.11 shows the 2010 distribution of published PCT applications among three ownership types –companies, individuals and universities – for the top 15 high and middle income countries.8
Figure A.11: Distribution of PCT applications by ownership type
Top 15 high income countries: published PCT applications
Source: WIPO Statistics Database
Top 15 middle income countries: published PCT applications
Source: WIPO Statistics Database
> The distribution is relatively homogenous among high income countries. Notable exceptions are Spainand the United Kingdom, which both have a comparatively high proportion of university filings.
> The distribution is more heterogeneous for middle income countries. The share of filings by companiesis above 80% for China but below 3% for Egypt. University filings represent between 20% and 30% oftotal filings in Chile and Malaysia.
8 The “universities” group includes all educational institutions, whereas the “individuals” group refers to applicants who are physical persons,and the “companies” group includes all other entities, mainly businesses.
0
25
50
75
100
Shar
e (%
)
Swed
en
Finlan
d
Netherl
ands
Japan
Switz
erlan
d
German
yFra
nce
High In
come
Total
United
State
s of A
merica
United
King
dom
Canad
aIta
ly
Repu
blic o
f Kore
a
Austral
iaIsr
ael
Spain
Country of Origin
Companies Individuals Universities
0
25
50
75
100
Shar
e (%
)
China
Middle
Incom
eInd
ia
Thail
and
Turke
y
Malaysi
a
Bulga
riaBra
zil
Colombia
South
Africa
Chile
Mexico
Russi
an Fe
derat
ion
Morocco
Ukraine
Egyp
t
Country of Origin
Companies Individuals Universities

23
A.12 Foreign Inventors Named in PCT Applications
The graph below indicates the share of PCT applications published in 2010 with at least one named inventorhaving a nationality different from the country of origin of the first-named applicant.
Figure A.12: Foreign inventors named in PCT applications, top 20 countries of origin
Source: WIPO Statistics Database
> Just over 75% of published PCT applications filed by an applicant based in Switzerland had at least oneinventor who did not have Swiss nationality.
> The share of foreign inventors named in published PCT applications from the Republic of Korea (6.3%),China (7.2%) and India (7.5%) is rather low compared to the total average share (29.2%).
0
25
50
75
100
Shar
e (%
)
Switz
erlan
d
Netherl
ands
Belgi
umFin
land
Swed
en
United
State
s of A
merica
Canad
a
Denmark
Austria
Total
United
King
dom
Austral
iaFra
nce
German
yJap
anSp
ainIsr
ael
Italy
India
China
Repu
blic o
f Kore
a
Country of Origin

24
FIELDS OF TECHNOLOGY OF PCT APPLICATIONS
PCT applications span a wide range of technologies – some emerging, some maturing and others declining.This subsection shows the distribution of PCT applications across fields of technology by year, for the top 10countries of origin and for the top 10 countries of origin for middle income countries other than China. Asin the previous subsection, for confidentiality reasons, statistics are based on the publication rather than thefiling date. Statistics based on publication date have a delay of approximately 6 months compared to thosebased on international filing date. The breakdown of published PCT applications by technology is based ona concordance table between International Patent Classification (IPC) symbols and 35 fields of technology.9
A.13 PCT Applications by Field of Technology
Table A.13 shows the number of PCT applications by field of technology for applications published from2006 to 2010.10
Table A.13: PCT applications by field of technology
Source: WIPO Statistics Database
9 Concordance table available at: www.wipo.int/ipstats/en/statistics/patents/. In the past, when an application belonged to multiple technicalfields, it was counted multiple times but, since 2010, it is being counted as a fraction of one application. As a result, the counts using“fractional counting” are close to the number of PCT applications published.10 The 2009 decline in PCT filings resulted in a 2.3% decrease in the number of PCT applications published in 2010, partly explaining the largenumber of decreases or instances of modest growth observed among the 35 fields of technology.
2006 2007 2008 2009 2010
I Electrical engineering1 Electrical machinery, apparatus, energy 7,000 7,874 8,933 8,972 9,143 1.92 Audio-visual technology 4,723 4,893 4,736 4,405 4,245 -3.63 Telecommunications 6,401 7,369 8,014 7,331 6,230 -15.04 Digital communication 5,972 7,574 8,731 9,022 10,581 17.35 Basic communication processes 1,302 1,360 1,462 1,396 1,273 -8.86 Computer technology 9,916 11,208 11,708 10,268 9,540 -7.17 IT methods for management 1,662 1,963 2,458 2,167 2,058 -5.08 Semiconductors 4,339 4,681 5,039 5,612 5,847 4.2II Instruments9 Optics 4,089 4,270 4,548 4,312 4,178 -3.1
10 Measurement 5,947 6,547 6,844 6,746 6,377 -5.511 Analysis of biological materials 1,717 1,747 1,800 1,864 1,759 -5.612 Control 2,348 2,389 2,526 2,387 2,102 -11.913 Medical technology 9,640 10,478 11,069 10,454 10,465 0.1III Chemistry14 Organic fine chemistry 5,976 6,057 6,107 5,677 5,511 -2.915 Biotechnology 4,875 5,120 5,287 5,285 5,206 -1.516 Pharmaceuticals 8,680 8,797 8,968 8,473 7,843 -7.417 Macromolecular chemistry, polymers 2,994 3,064 3,135 3,085 2,812 -8.818 Food chemistry 1,582 1,575 1,685 1,525 1,525 0.019 Basic materials chemistry 3,897 4,400 4,711 4,676 4,567 -2.320 Materials, metallurgy 2,369 2,555 2,798 2,755 2,859 3.821 Surface technology, coating 2,595 2,594 2,668 2,466 2,436 -1.222 Micro-structural and nano-technology 196 246 305 350 342 -2.323 Chemical engineering 3,349 3,464 3,790 3,625 3,564 -1.724 Environmental technology 1,700 1,972 2,232 2,216 2,131 -3.8IV Mechanical engineering25 Handling 3,754 3,984 3,900 3,721 3,619 -2.726 Machine tools 2,651 2,834 3,202 2,951 2,710 -8.227 Engines, pumps, turbines 3,181 3,615 4,132 4,380 4,288 -2.128 Textile and paper machines 2,513 2,233 2,300 2,159 1,944 -10.029 Other special machines 3,580 3,655 4,086 3,981 3,741 -6.030 Thermal processes and apparatus 1,594 1,856 2,129 2,359 2,379 0.831 Mechanical elements 3,461 3,852 4,404 4,136 4,002 -3.232 Transport 4,814 5,300 5,966 5,834 5,455 -6.5V Other fields
33 Furniture, games 3,397 3,653 3,635 3,279 3,078 -6.134 Other consumer goods 2,752 2,933 3,161 3,005 3,000 -0.235 Civil engineering 3,577 3,847 4,337 4,411 4,354 -1.3
Change
Compared
to 2009 (%)Technical Field Publication Year
25
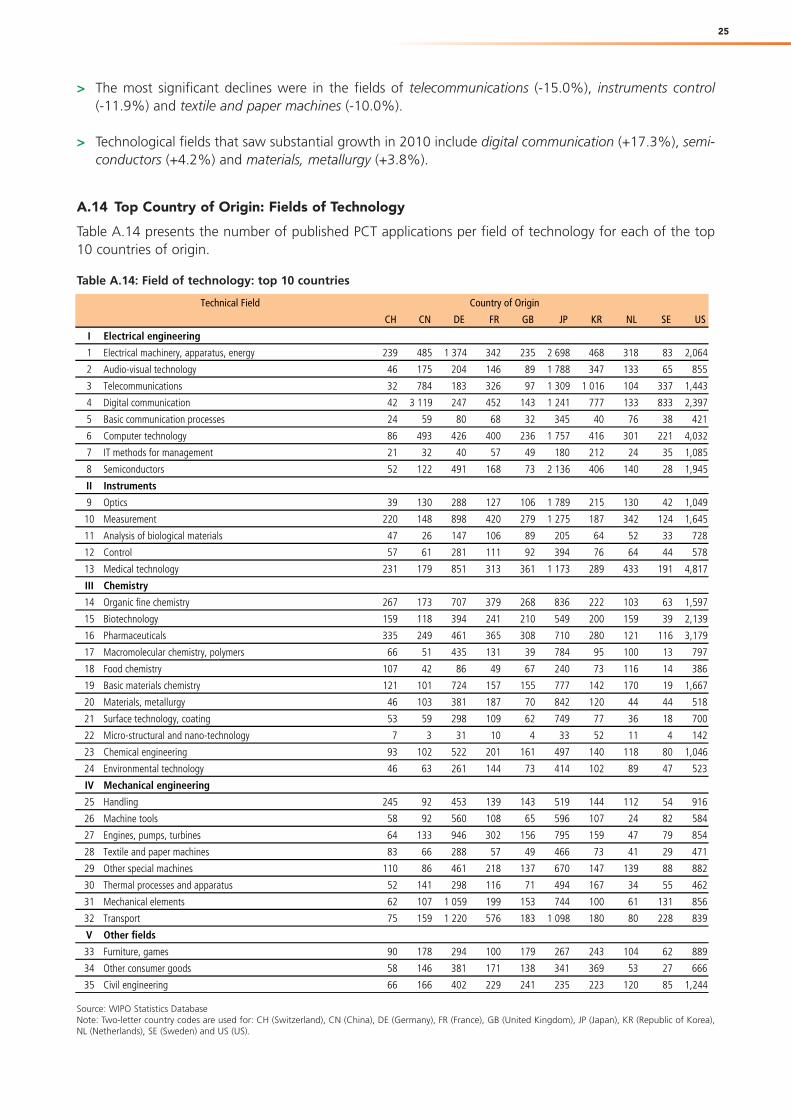
> The most significant declines were in the fields of telecommunications (-15.0%), instruments control(-11.9%) and textile and paper machines (-10.0%).
> Technological fields that saw substantial growth in 2010 include digital communication (+17.3%), semi-conductors (+4.2%) and materials, metallurgy (+3.8%).
A.14 Top Country of Origin: Fields of Technology
Table A.14 presents the number of published PCT applications per field of technology for each of the top10 countries of origin.
Table A.14: Field of technology: top 10 countries
Source: WIPO Statistics DatabaseNote: Two-letter country codes are used for: CH (Switzerland), CN (China), DE (Germany), FR (France), GB (United Kingdom), JP (Japan), KR (Republic of Korea),NL (Netherlands), SE (Sweden) and US (US).
Technical Field Country of Origin
CH CN DE FR GB JP KR NL SE US
I Electrical engineering
1 Electrical machinery, apparatus, energy 239 485 1 374 342 235 2 698 468 318 83 2,064
2 Audio-visual technology 46 175 204 146 89 1 788 347 133 65 855
3 Telecommunications 32 784 183 326 97 1 309 1 016 104 337 1,443
4 Digital communication 42 3 119 247 452 143 1 241 777 133 833 2,397
5 Basic communication processes 24 59 80 68 32 345 40 76 38 421
6 Computer technology 86 493 426 400 236 1 757 416 301 221 4,032
7 IT methods for management 21 32 40 57 49 180 212 24 35 1,085
8 Semiconductors 52 122 491 168 73 2 136 406 140 28 1,945
II Instruments
9 Optics 39 130 288 127 106 1 789 215 130 42 1,049
10 Measurement 220 148 898 420 279 1 275 187 342 124 1,645
11 Analysis of biological materials 47 26 147 106 89 205 64 52 33 728
12 Control 57 61 281 111 92 394 76 64 44 578
13 Medical technology 231 179 851 313 361 1 173 289 433 191 4,817
III Chemistry
14 Organic fine chemistry 267 173 707 379 268 836 222 103 63 1,597
15 Biotechnology 159 118 394 241 210 549 200 159 39 2,139
16 Pharmaceuticals 335 249 461 365 308 710 280 121 116 3,179
17 Macromolecular chemistry, polymers 66 51 435 131 39 784 95 100 13 797
18 Food chemistry 107 42 86 49 67 240 73 116 14 386
19 Basic materials chemistry 121 101 724 157 155 777 142 170 19 1,667
20 Materials, metallurgy 46 103 381 187 70 842 120 44 44 518
21 Surface technology, coating 53 59 298 109 62 749 77 36 18 700
22 Micro-structural and nano-technology 7 3 31 10 4 33 52 11 4 142
23 Chemical engineering 93 102 522 201 161 497 140 118 80 1,046
24 Environmental technology 46 63 261 144 73 414 102 89 47 523
IV Mechanical engineering
25 Handling 245 92 453 139 143 519 144 112 54 916
26 Machine tools 58 92 560 108 65 596 107 24 82 584
27 Engines, pumps, turbines 64 133 946 302 156 795 159 47 79 854
28 Textile and paper machines 83 66 288 57 49 466 73 41 29 471
29 Other special machines 110 86 461 218 137 670 147 139 88 882
30 Thermal processes and apparatus 52 141 298 116 71 494 167 34 55 462
31 Mechanical elements 62 107 1 059 199 153 744 100 61 131 856
32 Transport 75 159 1 220 576 183 1 098 180 80 228 839
V Other fields
33 Furniture, games 90 178 294 100 179 267 243 104 62 889
34 Other consumer goods 58 146 381 171 138 341 369 53 27 666
35 Civil engineering 66 166 402 229 241 235 223 120 85 1,244

26
> Almost half of all published PCT applications originating from China belonged to the Digital communi-cations and Telecommunications fields. These two fields represent, respectively, more than a third and aquarter of all PCT publications attributed to applicants from Sweden and the Republic of Korea.
A.15 Top Middle Income Countries: Fields of Technology
Table A.15 presents the number of published PCT applications per field of technology for each of the top10 middle income countries of origin. The data for China are presented in table A.14 and are not repeatedin table A.15.
Table A.15: Field of technology: top 10 middle income countries
Source: WIPO Statistics DatabaseNote: Two-letter country codes are used for: BR (Brazil), CL (Chile), CO (Colombia), IN (India), MX (Mexico), MY (Malaysia), RU (Russian Federation), TR (Turkey),UA (Ukraine) and ZA (South Africa).
> Most published PCT applications filed by applicants from India belonged to the Pharmaceuticals andOrganic fine chemistry fields.
> Medical technology was the leading field of technology for Brazilian applicants, and Civil engineeringwas the most popular field for Russian and South African applicants.
Technical Field Country of OriginBR CL CO IN MX MY RU TR UA ZA
I Electrical engineering1 Electrical machinery, apparatus, energy 25 1 2 24 10 9 29 19 6 152 Audio-visual technology 6 4 3 3 10 6 1 63 Telecommunications 8 17 8 8 6 2 44 Digital communication 3 1 28 1 31 4 10 75 Basic communication processes 2 6 2 2 4 36 Computer technology 12 2 38 4 22 23 7 2 177 IT methods for management 3 31 2 6 10 12 2 128 Semiconductors 1 4 1 2 10 2II Instruments9 Optics 5 1 1 2 8 2 2
10 Measurement 15 2 2 17 7 9 32 8 3 1411 Analysis of biological materials 2 1 1 5 1 1 3 1 112 Control 8 1 17 3 4 14 6 1013 Medical technology 51 3 3 27 7 14 40 19 8 26III Chemistry14 Organic fine chemistry 23 3 2 227 1 8 12 2 1 515 Biotechnology 13 8 2 68 5 15 24 1 2 1016 Pharmaceuticals 39 8 2 247 14 18 35 30 3 1217 Macromolecular chemistry, polymers 8 1 1 10 5 3 4 1 118 Food chemistry 7 3 2 20 9 7 6 3 2 319 Basic materials chemistry 23 5 5 35 9 8 26 2 520 Materials, metallurgy 15 1 1 27 14 3 24 5 3 1321 Surface technology, coating 6 4 7 3 10 2 1 322 Micro-structural and nano-technology 1 1 523 Chemical engineering 14 3 5 20 6 5 23 10 5 924 Environmental technology 6 3 1 16 2 4 16 1 5IV Mechanical engineering25 Handling 22 4 14 8 8 19 16 2 2026 Machine tools 5 1 4 5 1 15 7 1 327 Engines, pumps, turbines 28 1 1 23 6 10 46 17 6 828 Textile and paper machines 7 10 1 3 2 10 1 129 Other special machines 15 5 3 10 15 5 17 17 2 1030 Thermal processes and apparatus 18 1 6 3 2 11 32 3 931 Mechanical elements 20 1 3 10 3 2 26 6 1 732 Transport 28 25 6 10 30 12 5 17V Other fields33 Furniture, games 25 2 10 11 5 20 20 2 1634 Other consumer goods 29 1 2 12 7 5 21 90 4 1735 Civil engineering 22 3 3 9 11 9 58 17 10 32

27
PCT NATIONAL PHASE ENTRIES
The national or regional patent office at which the applicant enters the PCT national phase initiates thegranting procedure according to prevailing national law. Statistics associated with PCT national phase entryoffer information on international patenting strategies. Statistics for national phase entry are based on datasupplied to WIPO by national and regional patent offices several months after the end of each year.Therefore, the latest available data refer to 2009. Some data shown in this section might be estimated, asnot all offices have provided statistics.11 The national phase entry section briefly describes the global trendbefore reviewing national phase entries by applicants’ country and region of origin and by patent office.
GLOBAL TREND
A.16 PCT National Phase Entry Trend
Figure A.16 depicts the number of PCT national phase entries from 1995 to 2009. Missing data for officesthat have not furnished statistics are estimated by WIPO on an aggregate basis in order to present thefollowing figure.
Figure A.16: PCT national phase entries
Source: WIPO Statistics Database
> In 2009, an estimated 450,000 PCT national phase entries were filed at patent offices worldwide, rep-resenting a decrease of 3.0% over 2008.
> Since 1995, the number of PCT national phase entries has decreased only twice, in 2003 and in 2009.The average growth rate over the entire period stood at 12%. The number of PCT national phase entriesin 2009 was almost five times higher than in 1995.
11 For further details, see “Statistical Sources and Methods” in the annex.
19.1
37.0
11.4
24.0
8.7
21.3
6.9
-1.5
14.2 10.3 13.16.0 6.9
-3.0
0
100,000
200,000
300,000
400,000
500,000
PCT
Nat
ioan
l Pha
se E
ntrie
s
1995 1996 1997 1998 1999 2000 2001 2002 2003 2004 2005 2006 2007 2008 2009
PCT National Phase Entries Annual Growth rate (%)
Year

28
NATIONAL PHASE ENTRIES BY COUNTRY
This subsection analyzes PCT national phase entries according to the applicant’s country and region oforigin. It also provides details by income group and compares the use of the PCT system to that of the ParisConvention route. Data by origin may be incomplete.12 A statistical table listing all countries is provided inthe annex.
A.17 Top Countries: National Phase Entries
Figure A.17 shows the number of PCT national phase entries by applicants’ country of origin for the top 10filing countries in terms of PCT national phase entries in 2008 and 2009.
Figure A.17: PCT national phase entries by country of origin
Source: WIPO Statistics Database
> Applicants from the US accounted for about 137,200 PCT national phase entries in 2009 worldwide, adecrease of 7% compared to 2008.
> Applicants from the Netherlands (-6.5%) and from Germany (-3.1%) also saw substantial declines in thenumber of national phase entries. By contrast, applicants from Japan (+5.2%) and the Republic of Korea(+4.2%) experienced the fastest growth among the top 10 origins.
> All top 10 countries belong to the high income group.
12 An estimated 9,700 PCT national entries were initiated in 2009, as well as in 2008, with no indication on the origin of the application orwith an invalid country, e.g. the EPO. Data are estimated; see “Statistical Sources and Methods” in the annex for further details.
-7.0 5.2 -3.1 2.5 -1.5 -0.5 -6.5 4.2 -1.7 -2.2Annual Growth Rate (%): 2008-2009
0
25,000
50,000
75,000
100,000
125,000
150,000
PCT
Nat
iona
l Pha
se E
ntrie
s
United
State
s of A
merica
Japan
German
yFra
nce
United
King
dom
Switz
erlan
d
Netherl
ands
Repu
blic o
f Kore
a
Swed
en Italy
Country of Origin
2008 2009

29
A.18 Top Middle Income Countries: National Phase Entries
Figure A.18 shows the number of PCT national phase entries by applicants’ country of origin for the top 10middle income country filers in 2008 and 2009.
Figure A.18: PCT national phase entries by middle income country of origin
Source: WIPO Statistics Database
> Applicants from China accounted for about 5,000 PCT national phase entries in 2009 worldwide, anincrease of 12.1% compared to 2008.
> Applicants from all top 10 middle income countries reduced, sometimes drastically so, their nationalphase entries at offices worldwide compared to 2008; the only three exceptions were Argentina13, Chinaand Malaysia.
A.19 Distribution of National Phase Entries by Region
Figure A.19 shows the 2009 distribution of PCT national phase entries by region.
Figure A.19: Distribution of PCT national phase entries by region in 2009
Source: WIPO Statistics Database
> In 2009, the highest number of PCT national phase entries originated in Europe, followed by NorthAmerica and Asia. Respectively, they account for 39.1%, 32.3% and 23.9% of the world total, togetherrepresenting over 95% of all PCT national phase entries worldwide.
13 Even though Argentina is not a PCT member, their applicants can file PCT applications if at least one applicant is a resident or national ofa contracting state.
12.1 -8.7 -0.6 -3.9 -0.1 -2.4 -1.7 13.8 -41.6 16.5Annual Growth Rate (%): 2008-2009
0
1,000
2,000
3,000
4,000
5,000
6,000
PCT
Nat
iona
l Pha
se E
ntrie
s
China
India
South
Africa
Russi
an Fe
derat
ionBra
zil
Turke
y
Mexico
Malaysi
aCub
a
Argenti
na
Country of Origin
2008 2009
Europe: 39.1%North America: 32.3%Asia: 23.9%Oceania: 1.7%LAC: 0.5%Africa: 0.3%Unknown: 2.2%

14 This indicator also includes PCT applications that do not result in any national phase entry.
A.20 National Phase Entries per PCT Application
Figure A.20 depicts the average number of PCT national phase entries per PCT application.14 In calculatingthis number, PCT national phase entries are compared with PCT applications filed 12 months earlier (i.e.,national phase entries in 2009 are compared with PCT filings in 2008), since most applicants enter the PCTnational phase around 18 months after the international filing date.
It should be noted that a PCT national phase entry at a regional patent office may result in several nationalpatents. Thus, the number of national jurisdictions in which applicants seek protection is invariably higherthan the number of national phase entries.
Figure A.20: Average number of national phase entries per PCT application
Top 15 high income countries: PCT applications
Source: WIPO Statistics Database
Top 15 middle income countries: PCT applications
Source: WIPO Statistics Database
> On average, for every PCT application filed, applicants using the PCT system entered the national phasein 2.7 patent offices in 2009. The average was slightly higher (2.8) for high income countries and sub-stantially lower (1.1) for middle income countries.
> Among the high income countries, applicants from Switzerland, the Netherlands and the UnitedKingdom filed, on average, the most PCT national phase entries per PCT application. For the middleincome countries, applicants from Argentina, South Africa and Chile filed the most national phase entriesper PCT application. Interestingly, Argentina and Chile were not PCT members in 2008 at the time of thePCT filings.
30
0
1
2
3
4
5
Aver
age
Switz
erlan
d
Netherl
ands
United
King
dom
Austral
iaFra
nce
Swed
en
High In
come
Japan
German
yIta
lyTo
tal
United
State
s of A
merica
Israe
l
Canad
a
Finlan
dSp
ain
Repu
blic o
f Kore
a
Country of Origin
0
1
2
3
4
Aver
age
Argenti
na
South
Africa
Chile
Colombia Ind
ia
Mexico
Brazil
Bulga
ria
Russi
an Fe
derat
ion
Middle
Incom
e
Malaysi
aTu
rkey
China
Ukraine
Egyp
tSe
rbia
Country of Origin

15 In this subsection, PCT national phase entries only include entries at patent offices of other countries, i.e., they exclude national phaseentries in an applicant’s country of residence. However, PCT national phase entries at the EPO by applicants from EPC member countries areincluded in the calculation of national phase entries.
A.21 Share of PCT National Phase Entries out of Total Filings Abroad
While the PCT system offers several important benefits to patent applicants, some select the ParisConvention route instead for filing applications abroad. Figure A.21 presents the share of PCT nationalphase entries out of total patents filed abroad. This share reflects the extent to which applicants fromdifferent countries rely on the PCT system in seeking patent protection abroad.15
Figure A.21: Share of PCT national phase entries out of total filings abroad
Top 15 high income countries: filings abroad
Source: WIPO Statistics Database
Top 15 middle income countries: filings abroad
Source: WIPO Statistics Database
> In 2009, PCT national phase entries accounted for about 54% of patent applications filed abroad. Onaverage, applicants from high income countries (56%) rely to a greater extent on the PCT system forinternational filings than do applicants from middle income countries (42%).
> More than 75% of applications filed abroad by applicants from Cuba, South Africa and Sweden werefiled via the PCT system.
31
0
25
50
75
100
Shar
e (%
)
Swed
en
United
State
s of A
merica
Netherl
ands
United
King
dom
Finlan
d
Austral
iaFra
nce
Switz
erlan
d
Belgi
um Italy
German
y
High In
come
Total
Israe
lJap
an
Canad
a
Repu
blic o
f Kore
a
Country of Origin
0
25
50
75
100
Shar
e (%
)
Cuba
South
Africa
Turke
y
Russi
an Fe
derat
ionBra
zil
Mexico
Middle
Incom
eInd
iaChin
a
Malaysi
aChil
e
Argenti
na
Bulga
ria
Thail
and
Ukraine
Belar
us
Country of Origin
32
NATIONAL PHASE ENTRIES BY OFFICE
This subsection analyzes PCT national phase entries according to the patent office in which the applicantseeks to obtain a patent. In particular, it provides information on the destinations of national phase entries,presenting data on national phase entries by office, by office and origin, and gives the share of entries outof total non-resident applications. Data for some offices are estimated or are nonexistent.16 A statistical tablelisting all offices is available in the annex.
A.22 Top 20 Patent Offices: National Phase Entries
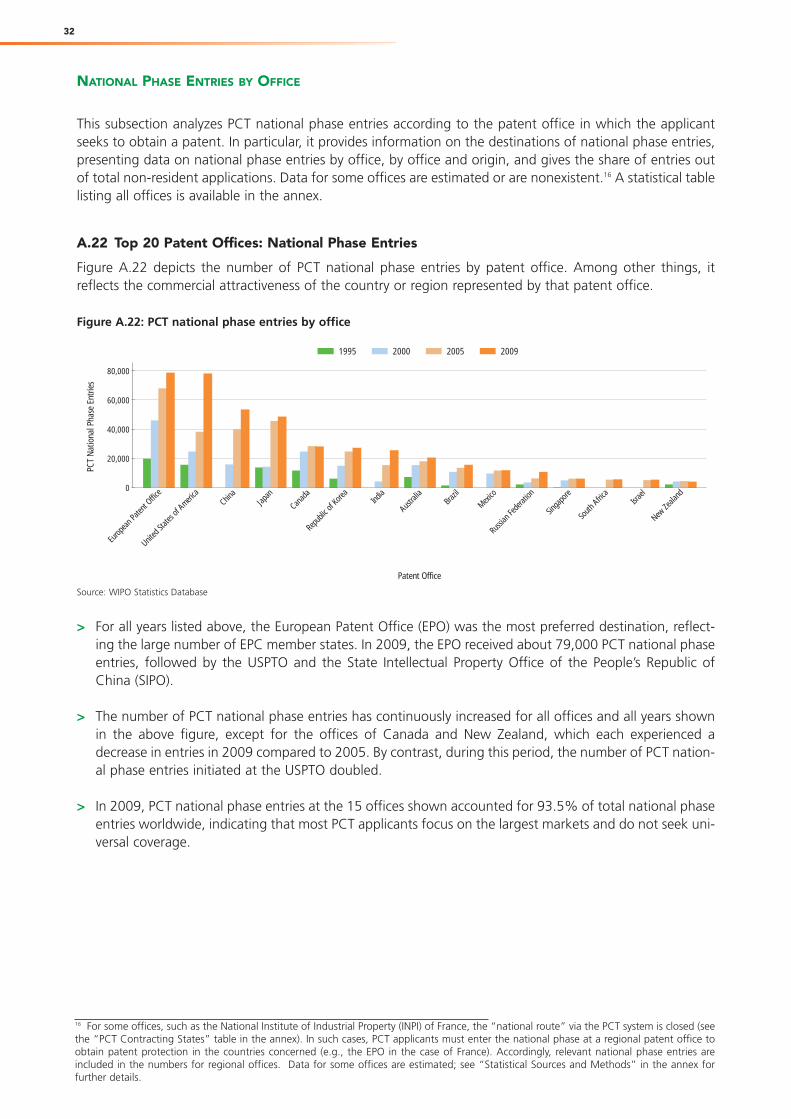
Figure A.22 depicts the number of PCT national phase entries by patent office. Among other things, itreflects the commercial attractiveness of the country or region represented by that patent office.
Figure A.22: PCT national phase entries by office
Source: WIPO Statistics Database
> For all years listed above, the European Patent Office (EPO) was the most preferred destination, reflect-ing the large number of EPC member states. In 2009, the EPO received about 79,000 PCT national phaseentries, followed by the USPTO and the State Intellectual Property Office of the People’s Republic ofChina (SIPO).
> The number of PCT national phase entries has continuously increased for all offices and all years shownin the above figure, except for the offices of Canada and New Zealand, which each experienced adecrease in entries in 2009 compared to 2005. By contrast, during this period, the number of PCT nation-al phase entries initiated at the USPTO doubled.
> In 2009, PCT national phase entries at the 15 offices shown accounted for 93.5% of total national phaseentries worldwide, indicating that most PCT applicants focus on the largest markets and do not seek uni-versal coverage.
16 For some offices, such as the National Institute of Industrial Property (INPI) of France, the “national route” via the PCT system is closed (seethe “PCT Contracting States” table in the annex). In such cases, PCT applicants must enter the national phase at a regional patent office toobtain patent protection in the countries concerned (e.g., the EPO in the case of France). Accordingly, relevant national phase entries areincluded in the numbers for regional offices. Data for some offices are estimated; see “Statistical Sources and Methods” in the annex forfurther details.
0
20,000
40,000
60,000
80,000
PCT
Nat
iona
l Pha
se E
ntrie
s
Europ
ean P
atent
Office
United
State
s of A
merica
China
Japan
Canad
a
Repu
blic o
f Kore
aInd
ia
Austral
iaBra
zil
Mexico
Russi
an Fe
derat
ion
Singa
pore
South
Africa
Israe
l
New Ze
aland
Patent Office
1995 2000 2005 2009
33
A.23 National Phase Entries by Patent Office and Country of Origin
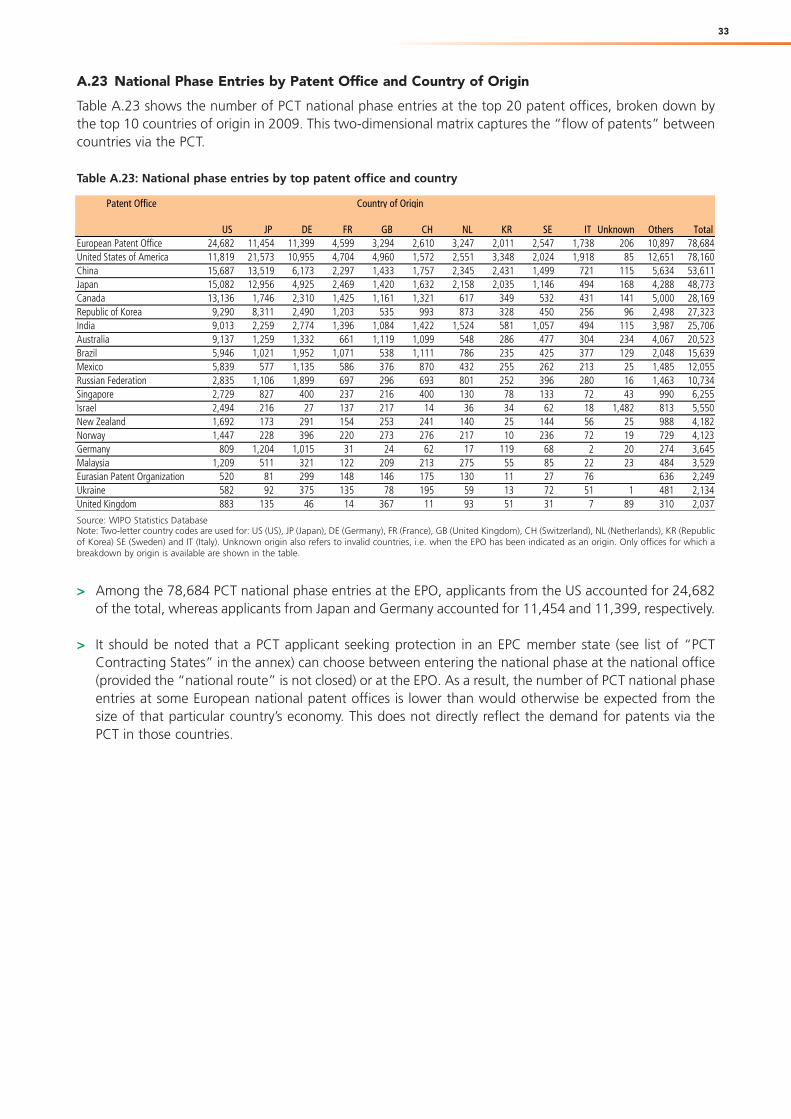
Table A.23 shows the number of PCT national phase entries at the top 20 patent offices, broken down bythe top 10 countries of origin in 2009. This two-dimensional matrix captures the “flow of patents” betweencountries via the PCT.
Table A.23: National phase entries by top patent office and country
Source: WIPO Statistics DatabaseNote: Two-letter country codes are used for: US (US), JP (Japan), DE (Germany), FR (France), GB (United Kingdom), CH (Switzerland), NL (Netherlands), KR (Republicof Korea) SE (Sweden) and IT (Italy). Unknown origin also refers to invalid countries, i.e. when the EPO has been indicated as an origin. Only offices for which abreakdown by origin is available are shown in the table.
> Among the 78,684 PCT national phase entries at the EPO, applicants from the US accounted for 24,682of the total, whereas applicants from Japan and Germany accounted for 11,454 and 11,399, respectively.
> It should be noted that a PCT applicant seeking protection in an EPC member state (see list of “PCTContracting States” in the annex) can choose between entering the national phase at the national office(provided the “national route” is not closed) or at the EPO. As a result, the number of PCT national phaseentries at some European national patent offices is lower than would otherwise be expected from thesize of that particular country’s economy. This does not directly reflect the demand for patents via thePCT in those countries.
Patent Office Country of Origin
US JP DE FR GB CH NL KR SE IT Unknown Others TotalEuropean Patent Office 24,682 11,454 11,399 4,599 3,294 2,610 3,247 2,011 2,547 1,738 206 10,897 78,684United States of America 11,819 21,573 10,955 4,704 4,960 1,572 2,551 3,348 2,024 1,918 85 12,651 78,160China 15,687 13,519 6,173 2,297 1,433 1,757 2,345 2,431 1,499 721 115 5,634 53,611Japan 15,082 12,956 4,925 2,469 1,420 1,632 2,158 2,035 1,146 494 168 4,288 48,773Canada 13,136 1,746 2,310 1,425 1,161 1,321 617 349 532 431 141 5,000 28,169Republic of Korea 9,290 8,311 2,490 1,203 535 993 873 328 450 256 96 2,498 27,323India 9,013 2,259 2,774 1,396 1,084 1,422 1,524 581 1,057 494 115 3,987 25,706Australia 9,137 1,259 1,332 661 1,119 1,099 548 286 477 304 234 4,067 20,523Brazil 5,946 1,021 1,952 1,071 538 1,111 786 235 425 377 129 2,048 15,639Mexico 5,839 577 1,135 586 376 870 432 255 262 213 25 1,485 12,055Russian Federation 2,835 1,106 1,899 697 296 693 801 252 396 280 16 1,463 10,734Singapore 2,729 827 400 237 216 400 130 78 133 72 43 990 6,255Israel 2,494 216 27 137 217 14 36 34 62 18 1,482 813 5,550New Zealand 1,692 173 291 154 253 241 140 25 144 56 25 988 4,182Norway 1,447 228 396 220 273 276 217 10 236 72 19 729 4,123Germany 809 1,204 1,015 31 24 62 17 119 68 2 20 274 3,645Malaysia 1,209 511 321 122 209 213 275 55 85 22 23 484 3,529Eurasian Patent Organization 520 81 299 148 146 175 130 11 27 76 636 2,249Ukraine 582 92 375 135 78 195 59 13 72 51 1 481 2,134United Kingdom 883 135 46 14 367 11 93 51 31 7 89 310 2,037

34
A.24 National Phase Entries by Patent Office and Middle Income Country of Origin
Table A.24 shows the number of PCT national phase entries at the top 20 patent offices, broken down bytop 10 middle income countries of origin in 2009. This two-dimensional matrix captures the “flow ofpatents” between countries, with a focus on applications from middle income countries.
Table A.24: National phase entries at patent offices by top middle income country
Source: WIPO Statistics DatabaseNote: Two-letter country codes are used for: CN (China), IN (India), ZA (South Africa), RU (Russian Federation), BR (Brazil), TR (Turkey), MX (Mexico), MY (Malaysia),CU (Cuba) and AR (Argentina). Only offices for which a breakdown by origin is available are shown in the table. Totals may be incomplete as some patent officesdo not report the origins of all applications.
> The USPTO attracted the largest number of PCT national phase entries from middle income countries,closely followed by the EPO. Among the middle income countries, applicants from China and India filedthe most entries at these two offices.
> About 56% of the entries at SIPO by applicants from middle income countries originated from Chineseapplicants, and 78% of such entries at the Turkish patent office originated from Turkish applicants.
Patent Office Country of Origin (Middle Income)
CN IN ZA RU BR TR MX MY CU AR Others TotalUnited,States,of,America 1,049 477 186 198 187 32 58 47 27 33 128 2,422European,Patent,Office 1,247 281 122 136 137 116 49 24 9 14 107 2,242China 640 122 79 86 58 33 18 33 8 3 53 1,133Japan 498 119 49 41 49 10 17 16 5 6 49 859India 308 237 74 61 49 6 20 23 20 3 35 836Canada 180 118 48 39 47 5 31 5 10 4 62 549Australia 170 135 96 10 36 7 12 13 20 6 30 535Republic of Korea 298 92 26 22 24 9 12 8 6 1 22 520Brazil 128 88 57 16 42 5 24 4 14 9 33 420Russian Federation 143 36 20 54 9 19 11 1 5 1 24 323Mexico 53 55 28 7 53 2 48 2 5 4 35 292Eurasian Patent Organization 16 23 6 75 2 17 1 15 155Singapore 64 32 8 7 6 1 2 13 4 1 14 152Colombia 4 23 79 1 15 17 4 1 6 150Malaysia 35 31 7 3 3 3 13 14 1 8 118New Zealand 14 58 17 4 3 2 2 3 2 1 5 111Ukraine 11 10 7 54 2 8 4 1 10 107Turkey 8 4 2 1 3 73 1 2 94African Regional Intellectual Property Organization 5 27 28 1 1 1 2 3 68Egypt 12 16 18 3 7 3 1 1 7 68

35
A.25 Share of PCT National Phase Entries out of Total Non-Resident Filings
Figure A.25 depicts the share of PCT national phase entries out of total non-resident filings received byoffices in 2009.17 Like Figure A.21, this indicator reflects the extent to which applicants rely on the PCTsystem rather than the Paris Convention route in seeking patent protection abroad. Unlike Figure A.21,however, this information is presented from the perspective of patent offices selected by applicants fornational phase entry, rather than the applicant’s country of origin.
Figure A.25: Share of PCT national phase entries out of total non-resident filings
Source: WIPO Statistics DatabaseNote: The above figure shows the 20 offices having received the most non-resident filings in 2009.
> PCT national phase entries accounted for the majority of non-resident patent filings in 2009 (54%).
> The share of PCT national phase entries out of total non-resident filings exceeded 90% for the offices ofIsrael, Norway and South Africa. By contrast, PCT applicants seeking patent protection in EPC memberstates seem to prefer entering the national phase at the EPO rather than at national patent offices, assuggested by the low shares for Germany and the United Kingdom.
> The relatively low share of PCT national phase entries at the USPTO (29%) can be partly explained by thehigher share of non-resident applications from Canada, Japan and the Republic of Korea, whose appli-cants prefer direct filings at foreign patent offices rather than the PCT route (see Figure A.21).
17 These PCT national phase entries only include entries by non-resident applicants. However, PCT national phase entries at the EPO byapplicants residing in EPC member states are included in the calculation of national phase entries.
0
25
50
75
100
Shar
e (%
)
Israe
l
South
Africa
Norway
Mexico
Brazil
New Ze
aland
India
Russi
an Fe
derat
ion
Austral
ia
Canad
a
Euras
ian Pa
tent O
rganiz
ation
Malaysi
a
Singa
pore
Repu
blic o
f Kore
aJap
anChin
a
Europ
ean P
atent
Office
Total
United
State
s of A
merica
United
King
dom
German
y
Patent Office

36
SECTION B – PERFORMANCE OF THE PCT SYSTEM
RECEIVING OFFICES
A PCT application is filed with a receiving office (RO), which may be a national or regional patent office, orthe IB. There are 112 ROs responsible for recording PCT applications, examining their compliance with PCTrequirements and transmitting them to the IB for further processing.
B.1 Top 15 Receiving Offices
Table B.1 presents PCT filings by the top 15 ROs over the past five years. In principle, a PCT application isfiled with the national patent office of the applicant’s country of residence or with a regional patent officeacting on that country’s behalf. PCT applications may alternatively be filed with the IB, a competent RO forapplicants from all PCT contracting states.
Table B.1: PCT filings by receiving office
Source: WIPO Statistics Database
> For the third consecutive year, the USPTO in its capacity of RO saw a decline in PCT filings. From 2006to 2010, the share of PCT applications filed with the USPTO out of the total count decreased from 34.7%to 27.4%.
> With respective annual growth figures of 61.5% and 20.1%, the RO of China and the Republic of Koreabecame the fourth and fifth top ROs in 2010, both overtaking the IB in its role as a RO.
Changed2010 compared
Receiving Offices 2006 2007 2008 2009 2010 Share to 2009(%) (%)
United States of America 51,850 54,594 52,050 46,045 45,093 27.4 -2.1Japan 26,421 26,935 28,027 29,291 31,555 19.2 7.7European Patent Office 23,382 26,061 29,494 27,360 29,032 17.7 6.1China 3,827 5,400 6,081 8,000 12,918 7.9 61.5Republic of Korea 5,918 7,060 7,911 8,025 9,639 5.9 20.1International Bureau 8,688 9,184 9,050 8,692 8,721 5.3 0.3United Kingdom 5,188 5,548 5,272 4,627 4,431 2.7 -4.2France 3,862 3,810 3,805 3,771 3,459 2.1 -8.3Canada 2,143 2,370 2,299 1,895 2,064 1.3 8.9Sweden 2,123 2,246 2,318 2,045 1,783 1.1 -12.8Germany 2,327 2,308 2,189 1,954 1,771 1.1 -9.4Australia 2,010 2,004 1,921 1,710 1,757 1.1 2.7Spain 924 984 1,052 1,243 1,396 0.8 12.3Finland 1,014 1,028 943 1,157 1,188 0.7 2.7Israel 1,511 1,631 1,704 1,238 1,103 0.7 -10.9All others 8,453 8,763 9,120 8,346 8,390 5.1 0.5Total 149,641 159,926 163,236 155,399 164,300 100.0 5.7

37
INTERNATIONAL BUREAU
In addition to its role as a RO, the IB is responsible for certain functions in the international phase of the PCTsystem. These include formality examination, translation of abstracts and patentability reports, andpublication of PCT applications. This subsection first shows the distribution of methods and languages offiling across all ROs and languages of publication; it then highlights the latest developments in the handlingof PCT applications by the IB, providing information on electronic processing and translation andterminology work; finally, it presents performance indicators such as publication timeliness and unit cost ofprocessing of a PCT application through to publication.
B.2 Filings by Medium of Filing
A PCT applicant can choose from among different filing methods and formats when filing an application.The three methods available are: (i) filing on paper; (ii) filing on paper along with a digital storage medium(with the application being prepared electronically using WIPO-provided software); and (iii) using fullyelectronic media in different formats, such as PDF or XML. Electronic filing offers benefits to both applicantsand patent offices and is thus encouraged by the PCT system through related fee reductions.
Figure B.2: PCT filings by method of filing across all receiving offices
Source: WIPO Statistics Database
> The share of electronic flings (including paper and digital filings) continued to increase in 2010, repre-senting 83.2% of total filings.
> Fully electronic filings accounted for almost 78% of total filings in 2010, whereas the share of paper plusdigital filings has decreased year on year since fully electronic filings were made available.
International Filing Year
Share of electronic filings, incl. Paper and digital (%)28.7 34.7 40.9 45.8 48.9 54.0 57.6 67.4 74.3 79.8 83.2
0
25,000
50,000
75,000
100,000
125,000
150,000
175,000
PCT
Appl
icatio
ns
2000 2001 2002 2003 2004 2005 2006 2007 2008 2009 2010
Paper Paper + Digital Fully Electronic (PDF, SEF and XML)

38
B.3 Electronic Filing and Processing of PCT Applications
The main developments affecting the processing of PCT applications by the IB in 2010 were:
Test environment for new “ePCT” system. The IB is developing a new system, provisionally referred to as“ePCT”, to allow pre-publication access for applicants and/or their agents to the IB’s files containingdocuments and up-to-date bibliographic data relating to PCT applications filed on or after January 1, 2009.Deployment of a fully functional test version of ePCT was completed in December 2010, enabling the launchof a pilot scheduled in January 2011 with the participation of a group of experienced PCT users.
PCT Online Document Upload Service. Following the PCT Online Document Upload service pilot phase in2009, this service became fully operational for all PCT users in January 2010, allowing PCT applicants and/ortheir agents to submit to the IB post-filing documents relating to PCT applications by uploading them via aweb interface. The main advantages of this service are the quick and efficient submission of post-filingelectronic documents to the IB, avoiding costs and delays related to paper mailing, as well as overcomingthe image quality problems that can result from fax transmission or paper scanning. In July 2010 the servicewas expanded to enable applicants to upload post-filing documents destined for the IB in its capacity as ROs.
PCT Automated Document Ordering System (PADOS). In 2010, the IB completed the development andinternal testing of an upgraded system to replace PCT Communication On Request (COR), one of thesystems used by offices to order PCT documents. PADOS will be subjected to external user testing by anumber of pilot offices starting in early 2011.
Priority Document Access Service (DAS). On January 1, 2010, it became possible for the IB to retrievepriority documents through DAS in processing PCT applications. This service enables a PCT applicant torequest that the IB retrieve a copy of an earlier application from DAS, for use as a priority document (as longas certain conditions are met), instead of having to provide a certified copy. The service provided for underPCT Rule 17.1(b), whereby the RO with which the applicant has filed the priority application prepares a copyof the priority document and sends it directly to the IB, continues to apply and is not affected by thisadditional service.18
Secure Online PCT E-Payment System. In July 2010, the IB launched a new PCT E-Payment Service, whichallows applicants to pay certain fees by credit card via a secure online e-payment facility. The facility isavailable for the payment of fees to the IB as RO in respect of new PCT applications filed therewith, andalso, irrespective of the RO with which the PCT application was filed, for the payment of fees to the IB forfiling a request for supplementary international search. Applicants are therefore no longer required to supplycredit card details to the IB on separate forms but can instead carry out online credit card transactions in asecure and confidential environment. Other PCT fees due to the IB will gradually become payable via thisservice.
Search copies transmitted electronically. The search copies produced by the IB in its role as RO (RO/IB) arenow transmitted electronically to the EPO in its capacity as ISA. The EPO is the recipient of the hightestvolume of RO/IB search copies, representing 76% of total search copies transmitted.
Receiving offices prepared to receive and process PCT applications in electronic form. On March 1,2010, the Icelandic Patent Office began receiving and processing PCT applications in electronic form,bringing the number of ROs that accept such filings to 22.
PCT-SAFE updates. Updates to PCT-SAFE software were issued in January, April, July and October 2010,enabling filers to take advantage of new PCT services, particularly the DAS service and E-Payment systemdescribed above.
18 Further information is available at: www.wipo.int/patentscope/en/priority_documents/

39
B.4 Languages of Filing and Publication
Figure B.4 presents the distribution of PCT applications according to language of filing and language ofpublication. A PCT application may be filed in any language accepted by the relevant RO, but must bepublished in one of the 10 official publication languages.
Figure B.4: Distribution of filing and publication languages
Source: WIPO Statistics Database
> English was the most frequently used language of filing and publication in 2010. In both cases, Englishwas used more frequently than all other languages combined.
> The languages of filing with the most increased use in 2010 compared to 2009 were Portuguese(+100%), Chinese (+58%) and Korean (+27%).
1
344
728
1,730
3,163
5,504
7,353
11,425
16,852
29,815
87,385
Lang
uage
s
Arabic
Portuguese
Russian
Spanish
Others
French
Korean
Chinese
German
Japanese
English
Filings in 2010 Filings in 2009 Publications in 2010

40
B.5 Translation
The goal of the IB's translation service is to enhance the patent system's disclosure function by making thetechnological information in PCT applications accessible in languages other than those in which the originaldocuments were filed. In order to meet that objective, the IB translates all abstracts and titles of PCTapplications into English and French, and all preliminary search and examination reports into English.
The IB started outsourcing translation work in 2006. The great majority of all translations are nowoutsourced (see figure below), a process involving numerous translation agencies and external translators.
Figure B.5: Distribution of translation work
Source: WIPO Statistics Database
> The translation of 89% of titles and abstracts and 98% of reports was outsourced in 2010.
> With about 203,500 translations in 2010, the number of abstracts and titles translated decreased by 6%compared to the previous year, reflecting the decrease in both PCT filings in 2009 as well as PCT publi-cations in 2010.
Other important developments in 2010 include:
> The IB launched a pilot project to ascertain the viability of using computer-assisted translation/workflowtools to make the overall translation process more efficient, enable the reuse of past translations and sim-plify the process of distributing vast numbers of translations. The pilot project is now ready to integratesoftware for managing the flow of the translations through WIPO’s internal document management sys-tem.
> A new round of bids for contracts (worth around 14 million Swiss francs per year) for translation ofEuropean language texts into English and French and for translation of Chinese and Japanese texts intoEnglish is currently in progress and is being promoted extensively worldwide. This is expected to lead tomore effective quality control and to higher quality translations at a more competitive price.
Share of Outsourced Translations(%)36.8 60.1 73.9 79.5 88.8
25,000
75,000
125,000
175,000
225,000
Abst
ract
s an
d Ti
tles
2006 2007 2008 2009 2010
In-house Outsourced
Share of Outsourced Translations(%)83.9 89.9 93.6 95.7 97.9
0
25,000
50,000
75,000
Repo
rts
2006 2007 2008 2009 2010
In-house Outsourced

41
B.6 Terminology
In 2010 the IB continued to develop terminology databases aimed at improving the quality of internally andexternally produced translations. During 2010, 6,901 new terms were added to the PCT terminologydatabase across all 10 PCT publication languages, and 8,248 terms were validated. At the end of 2010, thedatabase contained 47,901 terms.
The main objective for 2011 will be to validate all previously unvalidated terms in the database to ensurethe quality and reliability of this resource. The IB also plans to increase the number of terms available incertain languages that are currently underrepresented in the database, and to seek partnerships withexternal institutions that could assist with the validation of highly technical terminology.
In addition, a number of new functionalities were added to PATENTSCOPE in 2010 with a view to improvingkeyword-based information retrieval. These are described in subsection C.1.
B.7 Publication Timeliness
The PCT provides that PCT applications and related documents shall be published “promptly” after theexpiration of 18 months from the priority date, unless the applicant requests early publication or theapplication is withdrawn or considered withdrawn. Figure B.7 shows actual publication timeliness after theexpiration of the 18-month period.
Figure B.7: Timeliness of publishing PCT applications
Source: WIPO Statistics Database
> In 2010, 74.2% of PCT applications were published within the week following the expiration of 18months from the priority date, and 96.2% were published within two weeks. This represents the short-est figures for timeliness of publication of the past decade.
42.7 57.3 44.1 22.0 7.4 8.4 49.1 43.1 54.8 65.9 74.2
Share of PCT Applications published within one Week (%)
0
25
50
75
100
Dist
ribut
ion
by D
elay
s (%
)
2000 2001 2002 2003 2004 2005 2006 2007 2008 2009 2010
Publication Year
< 1 week between 1 - 2 weeks between 2 - 3 weeks between 3 - 4 weeks > 4 weeks

42
B.8 Republication Timeliness
The IB publishes PCT applications even in the absence of an ISR. In such a case, the PCT application isrepublished along with the ISR after the report is received. Figure B.8 shows the timeliness of republicationby the IB of PCT applications with ISRs, calculated from the date of receipt of the ISR by the IB.
Figure B.8: Timeliness of republishing PCT applications with ISRs
Source: WIPO Statistics Database
> In 2010, 76.3% of republications took place within two months of the IB receiving the ISR and 96.2%within three months. As with publication timeliness, the delay for republishing PCT applications with theISR was, in 2010, the shortest of the past decade.
B.9 Quality
In order to measure the quality of the formality examination performed by the IB in a simple andcomprehensive way, the IB has developed an aggregate quality index, calculated as the simple average offour lead quality indicators. Three of these indicators are based on the timeliness of key transactions in thePCT system: acknowledgement of receipt of the PCT application, publication and republication. The fourthindicator reflects the number of republications due to corrections of entries in bibliographical data.19
Figure B.9: Quality index of formality examination
Source: WIPO Statistics Database
> Since 2006, quality as measured by the aggregate index has markedly improved, reaching an unprece-dented level of 95.3% in the final quarter of 2010.
19 Formally, the quality index is the simple average of: (i) percentage of forms PCT/IB/301 (“Notification of receipt of a PCT Application”) sentup to 5 weeks after the IB receives a PCT application; (ii) percentage of PCT applications published up to 6 months and 3 weeks after theinternational filing date; (iii) percentage of later publications of ISRs within 2 months after the IB receives the ISR; and (iv) percentage of “R5republications”, i.e., corrections in Section I of the PCT application.
26.6 2.7 14.8 13.5 46.1 52.6 43.1 45.3 54.3 71.1 76.3
Share of PCT Applications republished within two Months (%)
0
25
50
75
100
Dist
ribut
ion
by D
elay
s (%
)
2000 2001 2002 2003 2004 2005 2006 2007 2008 2009 2010
Republication Year
< 2 months between 2 - 3 months between 3 - 4 months between 4 - 5 months > 5 months
75.9%
80.3%
75.3%72.2% 73.1%
78.9%
84.4% 83.5% 84.6% 83.9% 84.3%
89.1%86.5%
90.2%91.8% 90.2% 91.1% 92.5%
95.3%
86.6%
1 2 3 4 1 2 3 4 1 2 3 4 1 2 3 4 1 2 3 4
2006 2007 2008 2009 2010
Years and quarters

43
B.10 Efficiency
The IB’s productivity in processing PCT applications can be measured by unit cost of processing, defined asthe average total cost of publishing a PCT application. Average total cost is determined by total PCTexpenditure, plus a certain share of expenditure on support and management activities.20 The unit cost thusincludes the cost of all PCT activities – including translation, communication, management and others.21
In computing unit cost, the production cost consists of two parts: direct and indirect costs. Direct costscorrespond to the expenditure incurred by the IB (for administration of the PCT system and relatedprograms). Indirect costs include expenditure for supporting units (e.g., building, information technologyamong others). Indirect costs are weighted to take into account only the share attributable to the PCTsystem. The cost of storing published applications is added to unit cost since the PCT system must storeapplications for 30 years.
Formally, unit cost is defined as:
Figure B.10 depicts the evolution of the unit cost of processing from 2004 to 2010, including a breakdownof the contribution of direct and indirect costs.
Figure B.10: Unit cost of processing a published PCT application
Source: WIPO Statistics Database
> Although the number of PCT applications published was 2% lower in 2010 than in 2009, cost reduc-tions in 2010 were such that the unit cost per application was reduced by 8% to reach 756 CHF. Themain causes of this decrease are reductions in the indirect costs associated with the processing of appli-cations and staff reductions within WIPO.
20 The complete methodology is available at www.wipo.int/edocs/mdocs/govbody/en/a_42/a_42_10-annex3.pdf.21 As of January 2010, the number of PCT applications published is determined based on actual publication date instead of the year indicatedin the publication number. As a consequence, processing costs have slightly changed compared to previous editions of the PCT Yearly Review.
649
393
583
351
538
295
531
302
509
271
541
282
536
220
Processing Year
Total Processing Cost (CHF)1,042 934 833 836 782 826 756
0
200
400
600
800
1,000
1,200
Cost
of P
roce
ssin
g (C
HF)
2004 2005 2006 2007 2008 2009 2010
Direct Costs Indirect Costs
storage ofCost Number of publications
Total cost of production Unit cost +=

44
INTERNATIONAL SEARCHING AUTHORITIES
Each PCT application must undergo an international search carried out by one of the ISAs. ROs have enteredinto agreements with at least one but sometimes several ISAs for the carrying out of international searches.Where a RO has an agreement with multiple ISAs, the PCT applicant must select one of them.
Once the ISA has performed the search, the applicant will receive an ISR that contains a list of documentsrelevant for assessing the patentability of the invention. In addition, the ISA establishes a written opiniongiving a detailed analysis of the potential patentability of the invention.
B.11 Distribution by ISA
Table B.11 shows the distribution of search reports issued by all ISAs from 2006 to 2010. Since 2009, 17national patent offices or regional organizations have been acting as ISAs.22
Table B.11: Distribution of ISRs by ISA
Source: WIPO Statistics Database
> With 42% of all ISRs issued in 2010, the EPO remains the most selected ISA despite a decrease of 1.4%compared to the previous year.
> The ISAs that experienced the highest yearly increase in the number of ISRs issued in 2010 were China(+5,203), Japan (+2,522) and the Republic of Korea (+1,599).
> The high annual growth rate observed for the office of Brazil can be explained by the fact that it startedacting as an ISA in 2009. The office of Austria experienced a sharp drop coinciding with a 1,500 Euroincrease in its search fee on January 1, 2010.
22 Fourteen ISAs are currently active. The national patent offices of India, Israel and Egypt, although appointed as ISAs, are not yet operatingas such (bringing to 17 the total number of ISAs).
ChangedInternational Searching Year 2010 comparedAuthorities 2006 2007 2008 2009 2010 Share to 2009
(%) (%)
Australia 2,752 2,811 2,753 2,666 3,425 2.1 28.5
Austria 1,094 1,168 1,193 1,588 409 0.2 -74.2
Brazil 66 312 0.2 372.5
Canada 2,317 2,529 2,478 2,053 2,209 1.3 7.6
China 3,892 5,492 6,188 8,095 13,298 8.1 64.3
European Patent Office 71,513 75,387 77,908 69,963 69,013 42.0 -1.4
Finland 642 718 660 860 924 0.6 7.4
Japan 25,146 25,947 27,117 28,446 30,968 18.8 8.9
Nordic Patent Institute 102 239 301 0.2 25.9
Republic of Korea 6,673 10,238 19,018 21,708 23,307 14.2 7.4
Russian Federation 807 856 895 849 804 0.5 -5.3
Spain 1,063 1,141 1,201 1,351 1,440 0.9 6.6
Sweden 3,190 3,131 2,339 2,038 2,079 1.3 2.0
United States of America 30,541 30,506 21,380 15,454 15,811 9.6 2.3
Total 149,630 159,924 163,232 155,376 164,300 100.0 5.7

45
B.12 Timeliness in transmitting ISRs
In order to ensure that the ISR is published with its corresponding PCT application, the PCT rules set a timelimit for establishing the ISR: three months from receipt of the application by the ISA or nine months fromthe priority date, whichever time limit expires later.
In practice, since the technical preparations for publishing a PCT application take approximately one monthand should finish 15 days before the publication date, the establishment of the ISR within 16 months fromthe priority date still allows the IB to publish the ISR with the application. ISRs received at the IB after thecompletion of technical preparations for publication are published separately later.
Figure B.12a presents information on timeliness in transmitting ISRs to the IB. Timeliness is measured usingthe transmittal dates recorded in the ISR and thus does not take into account possible postal delays.
Figure B.12a: Timeliness in transmitting ISRs
Source: WIPO Statistics Database
> In 2010, 64.3% of ISRs were established within the 16-month time limit. Reflecting one of the shortestISR transmittal delays of the decade, the number of republications due to the late arrival of the ISR was36,865 in 2010, representing a decrease of 27% compared to 2009.
60.7 52.3 38.6 45.1 42.1 54.4 54.7 48.7 48.5 55.6 64.3
Share ISRs transmitted within less than 17 months (%)
0
25
50
75
100
Dist
ribut
ion
by D
elay
s (%
)
2000 2001 2002 2003 2004 2005 2006 2007 2008 2009 2010
Year
< 17 months between 17 - 18 months between 19 - 20 months between 21 - 30 months > 30 months
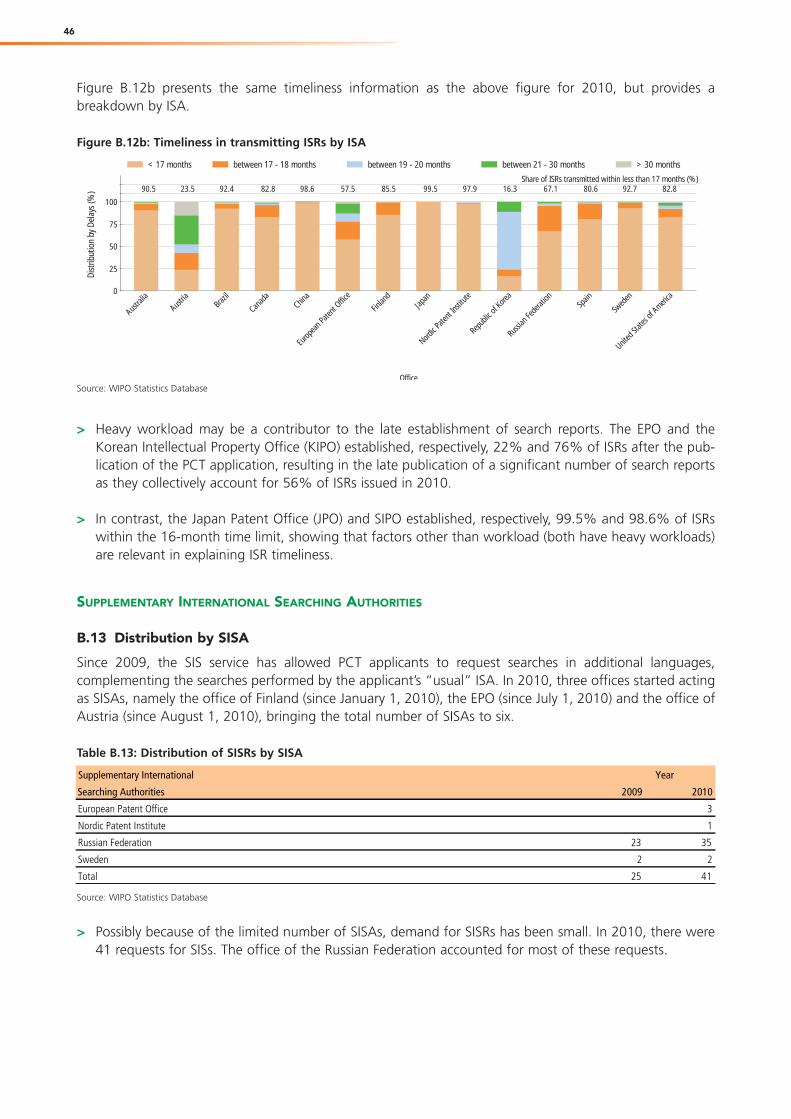
46
Figure B.12b presents the same timeliness information as the above figure for 2010, but provides abreakdown by ISA.
Figure B.12b: Timeliness in transmitting ISRs by ISA
Source: WIPO Statistics Database
> Heavy workload may be a contributor to the late establishment of search reports. The EPO and theKorean Intellectual Property Office (KIPO) established, respectively, 22% and 76% of ISRs after the pub-lication of the PCT application, resulting in the late publication of a significant number of search reportsas they collectively account for 56% of ISRs issued in 2010.
> In contrast, the Japan Patent Office (JPO) and SIPO established, respectively, 99.5% and 98.6% of ISRswithin the 16-month time limit, showing that factors other than workload (both have heavy workloads)are relevant in explaining ISR timeliness.
SUPPLEMENTARY INTERNATIONAL SEARCHING AUTHORITIES
B.13 Distribution by SISA
Since 2009, the SIS service has allowed PCT applicants to request searches in additional languages,complementing the searches performed by the applicant’s “usual” ISA. In 2010, three offices started actingas SISAs, namely the office of Finland (since January 1, 2010), the EPO (since July 1, 2010) and the office ofAustria (since August 1, 2010), bringing the total number of SISAs to six.
Table B.13: Distribution of SISRs by SISA
Source: WIPO Statistics Database
> Possibly because of the limited number of SISAs, demand for SISRs has been small. In 2010, there were41 requests for SISs. The office of the Russian Federation accounted for most of these requests.
90.5 23.5 92.4 82.8 98.6 57.5 85.5 99.5 97.9 16.3 67.1 80.6 92.7 82.8Share of ISRs transmitted within less than 17 months (%)
0
25
50
75
100
Dist
ribut
ion
by D
elay
s (%
)
Austral
ia
Austria
Brazil
Canad
aChin
a
Europ
ean P
atent
Office
Finlan
dJap
an
Nordic P
atent
Institu
te
Repu
blic o
f Kore
a
Russi
an Fe
derat
ionSp
ain
Swed
en
United
State
s of A
merica
Office
< 17 months between 17 - 18 months between 19 - 20 months between 21 - 30 months > 30 months
Supplementary International Year
Searching Authorities 2009 2010
European Patent Office 3
Nordic Patent Institute 1
Russian Federation 23 35
Sweden 2 2
Total 25 41

47
INTERNATIONAL PRELIMINARY EXAMINING AUTHORITIES
PCT applicants can optionally request an International Preliminary Examination (IPE), by filing what is knownas a Chapter II Demand with a competent IPEA. The selection of a competent IPEA is based on negotiatedagreements between ROs and IPEAs. Once the preliminary examination has been carried out, an IPRP is sentto the applicant, who is then better placed to make an informed decision on whether to enter the PCTnational phase. The report is also transmitted to all national offices in their capacity as “elected” office.23
National offices, in examining the PCT application during the national phase, can take into account the IPRPwhen considering the patentability of the underlying invention.
B.14 Distribution by IPEA
Table B.14 shows the distribution of IPRPs issued by all IPEAs from 2006 to 2010. Since 2009, 17 nationalpatent offices or regional organizations have been acting as IPEAs.24
Table B.14: Distribution of IPRPs by IPEA
Source: WIPO Statistics Database
> Since 2004, a written opinion outlining the examiner’s views on the patentability of the subject matterhas accompanied each IPRP, leading to a decline in requests for further preliminary examination.
> The EPO acts as a competent IPEA for most ROs and carried out the largest share of preliminary exami-nations. The USPTO issued 34% more IPRPs in 2010 than in 2009.
23 “Elected” offices are national (or regional) patent offices at which the applicant intends to use the results of the internationalpreliminaryexamination.24 Fourteen IPEAs are currently active. The national patent offices of India, Israel and Egypt, although appointed as IPEAs, are not yet operatingas such (bringing to 17 the total number of IPEAs).
International Preliminary Year 2010
Examining Authority 2006 2007 2008 2009 2010 Share
(%)
Australia 1,024 1,016 826 725 852 5.4
Austria 139 131 100 113 61 0.4
Brazil 0.0
Canada 424 462 419 427 257 1.6
China 325 363 396 425 394 2.5
European Patent Office 12,805 11,247 10,857 9,588 8,278 52.7
Finland 51 138 184 132 139 0.9
Japan 2,754 2,720 2,376 2,175 1,904 12.1
Nordic Patent Institute 11 34 0.2
Republic of Korea 669 598 476 368 310 2.0
Russian Federation 123 105 90 109 62 0.4
Spain 132 126 117 135 110 0.7
Sweden 827 714 724 523 409 2.6
United States of America 7,020 5,195 2,179 2,156 2,884 18.4
Total 26,293 22,815 18,744 16,887 15,694 100

48
B.15 Timeliness in transmitting IPRPs
Similar to the establishment of search reports, the PCT rules set a time limit for establishing the IPRP: 28months from the priority date; six months from the start of the preliminary examination; or six months fromthe date of receipt of the translated application document by the IPEA (where relevant) – whichever timelimit expires last.
In practice, most applicants enter the PCT national phase immediately before the expiration of the time limitset by the PCT, that is, 30 months from the priority date. The establishment of IPRPs before 28 months fromthe priority date therefore leaves applicants two months, in principle, to decide on PCT national phase entry.
Figure B.15a presents information on timeliness in transmitting IPRPs to the IB. Timeliness here is measuredusing the date the IB receives reports, rather than the date the reports were established. The measurementmay thus be influenced by transmittal delays.
Figure B.15a: Timeliness in transmitting IPRPs
Source: WIPO Statistics Database
> Timeliness in transmitting IPRPs improved from 2006 to 2009. Whereas the share of IPRPs transmittedwithin less than 29 months remained almost stable in 2010 compared to the previous year, the share ofIPRPs transmitted after 32 months increased by 3.2%.
Figure B.15b presents the same timeliness information as the above figure for 2010, but provides abreakdown by IPEA.
Figure B.15b: Timeliness in transmitting IPRPs by IPEA
Source: WIPO Statistics Database
> Delays in transmitting IPRPs vary substantially from office to office. This may be due to a number of con-tributing factors, such as workload and exchanges between the IPEA and the applicant before establish-ing the IPRP.
82.5 82.2 78.7 69.5 67.8 60.5 61.8 64.0 70.8 71.4 70.7
Share of IPRPs transmitted within less than 29 months (%)
0
25
50
75
100
Distr
ibut
ion
by D
elays
(%)
2000 2001 2002 2003 2004 2005 2006 2007 2008 2009 2010
Year
< 29 months between 29 - 30 months between 31 - 32 months > 32 months
81.3 30.0 69.4 84.0 84.8 89.9 86.2 79.4 49.2 53.2 88.2 96.3 13.8Share of IPRPs transmitted within less than 29 months (%)
0
25
50
75
100
Distr
ibut
ion
by D
elays
(%)
Austral
iaAust
ria
Canad
aChin
a
Europ
ean P
atent
Office
Finlan
dJap
an
Nordic P
atent
Institu
te
Repub
lic of
Korea
Russian
Fede
ration
Spain
Swed
en
United
State
s of A
merica
Office
< 29 months between 29 - 30 months between 31 - 32 months > 32 months

49
SECTION C – WIPO’S PATENT INFORMATION SERVICE
C.1 PATENTSCOPE Search Service
The PATENTSCOPE search service is the authoritative source of information on published PCT applications. Thisfree service provides access to over 5 million patent documents from the PCT and national/regional collections.
The main developments to the service in 2010 include:
New multilingual searches. A new Cross-Lingual Information Retrieval (CLIR) option in the PATENTSCOPEsearch service became available for public testing in May 2010.25 This tool allows PATENTSCOPE users toenhance the power of their searches of the PCT and national patent collections. Search queries in onelanguage are translated into several other languages by special software developed by WIPO on the basis ofstatistical analysis of the terminology in patent application texts. Performing a search based on a multilingualquery can lead to more comprehensive search results.
Machine translation of descriptions and claims of patent documents within PATENTSCOPE. As a resultof improved integration of Google™ Translate in the PATENTSCOPE search service, it became possible, as ofAugust 2010, to view a quick translation of the description and claims of patent documents (published PCTapplications as well as national patents in national collections) in all languages supported by Google™Translate. Combined with the cross-lingual expansion of search queries and the possibility to use machine-translated titles and abstracts in result lists, PATENTSCOPE users now have access to powerful tools forovercoming the language barrier.
National patent collections. National patent collections from the following countries were added to thePATENTSCOPE search service in 2010: Argentina, Colombia, Costa Rica, Brazil, Guatemala, Morocco,Panama, Peru, Spain and Uruguay, bringing to 18 the total number of national (or regional) offices whosedata are available.
Availability of search interfaces in other languages. At the end of 2010, it became possible to accessWIPO’s “Search International and National Patent Collections” page via Chinese, French, German, Japaneseand Portuguese interfaces (in addition to English). Furthermore, at the beginning of 2011, Russian andSpanish interfaces were added.
Availability of full-text search of PCT applications filed on paper in Japanese with the Japan PatentOffice. All PCT applications filed on paper (including applications filed in PCT-EASY format) in Japanese, withthe JPO as RO, and which were published on or after February 11, 2010, are now available in searchabletext format in Japanese on PATENTSCOPE.
Full-text search available in Chinese and English for PCT applications filed in XML format. As of July2010, the PATENTSCOPE search service started supporting keyword searches in Chinese and English for PCTapplications filed electronically in XML format with SIPO as RO. The searchable text data include thedescriptions and claims of PCT applications filed on or after January 1, 2010.
New online tool to facilitate green technology patent searches. On September 16, 2010, WIPOlaunched the IPC Green Inventory, an online tool linked to the IPC system that facilitates searches for patentinformation relating to environmentally-sound technologies, as defined by the United Nations FrameworkConvention on Climate Change (UNFCCC). In addition to the link to the IPC system, the IPC Green Inventoryis hyperlinked to the PATENTSCOPE search service for automatic search and display of all “green” PCTapplications. The IPC Green Inventory can help in identifying existing and emerging green technologies, aswell as potential partners for further research and development (R&D) and commercial exploitation.
25 Available at: www.wipo.int/patentscope/search/en/clir/clir.jsp

50
C.2 New Internet Resources on PCT Website
During 2010, in addition to the regular updating of existing materials, the following new resources weremade available to PCT users:
PCT Time Limit Calculator supports additional languages. The web-based PCT Time Limit Calculator isnow available in Chinese, English, French, German, Korean, Japanese, Portuguese, Russian and Spanish. TheCalculator assists applicants in computing essential PCT time limits and provides full explanations of all timelimits, as well as references to relevant PCT articles or rules. By selecting “summary”, all calculated timelimits are shown together on one practical reference page. Using the Calculator does not require any priorregistration and is available free of charge.
Practical web page on PCT-Patent Prosecution Highway (PCT-PPH) Pilot. This web page26 brings togetherdetails and forms for use in the fast-track examination procedures now available at certain offices. Itindicates which offices have entered into bilateral agreements concerning the accelerated processing of PCTapplications, based on positive results obtained by other PCT authorities offering this option.27 This resourceis currently available in English but will become available in Chinese, French, German, Korean, Japanese,Portuguese, Russian and Spanish in the course of 2011.
Directives for new equivalent amounts of certain fees. A new web page containing the revisedprocedures for establishing equivalent amounts in different currencies for the international filing fee, thesearch fee, the supplementary search fee and the handling fee, as approved by the PCT Assembly, isavailable in English and French.28 These revised procedures entered into force on July 1, 2010.
Archive of PCT Assembly documents online. A historical archive of PCT Assembly documents from, 1978to 1996, containing all documents issued for particular meetings, has been made available on the PCTwebsite in order to expand the archives of PCT documents available on the Internet.29 These documentsprovide insight into and perspective on the early beginnings and development of the PCT system. Additionalhistorical collections of PCT documents will progressively be added.
New Frequently Asked Questions on PCT Articles 19 and 34. A comprehensive set of guidelines on filingamendments to claims under PCT Articles 19 and 34 has been published in English and French and will bemade available in Chinese, German, Korean, Japanese, Portuguese, Russian and Spanish in 2011.
C.3 Special Access to Information for Developing Countries
Following the launch in 2009 of the Access to Research for Development and Innovation (aRDi) program, in2010 WIPO launched a second program, called Access to Specialized Patent Information (ASPI), that aimsto provide intellectual property (IP) offices, universities and research institutes in least developed countries(LDCs) with free access and certain developing countries with very low-cost access to technology databases.Both programs aim to support least developed and developing countries in effectively leveraging thevaluable information contained in patents, as well as in scientific and technical journals.
The aRDi program provides access to over 50 scientific and technical journals in partnership with 12prominent publishers for 107 developing and least developed countries.30
The ASPI program, in cooperation with six of the world’s leading commercial patent database vendors,provides access to commercial patent databases offering sophisticated tools and services for retrieving andanalyzing patent data for 115 developing and least developed countries.31
Access to these databases and services is underpinned by training and awareness-raising activities within theframework of WIPO’s project to establish Technology and Innovation Support Centers (TISCs) in developing countries.
26 Available at: www.wipo.int/pct/en/filing/pct_pph.html27 See subsection D.2 for further information on the PCT-PPH pilot.28 Available at: www.wipo.int/pct/en/fees/equivalent_amounts.html29 Available at: www.wipo.int/meetings/en/topic.jsp?group_id=13530 See further details at www.wipo.int/ardi/en/31 See further details at www.wipo.int/patentscope/en/programs/aspi/index.html

51
C.4 Patent Economics and Statistics
The main achievements in the area of economics and statistics in 2010 were:
Miscellaneous economics publications. These publications are the result of special research projects andacademic conferences organized or supported by WIPO. Among these publications, WIPO released, inJanuary 2011, a survey conducted in 2010 to better understand how PCT applicants had fared under thedifficult economic conditions in 2009 and how they responded to the incipient economic recovery in 2010.
World Intellectual Property Indicators (WIPI) 2010. The second edition of the WIPI publication wasreleased in September 2010 and includes statistics on the PCT system. In addition to the WIPO-administeredIP filing and registration systems, WIPI also reviews national activity in the area of patents, utility models,trademarks, industrial designs and microorganisms.
Release of the 2009 world IP data. In 2010 WIPO collected the 2009 aggregated IP data from IP officesworldwide, through its annual IP statistics questionnaires. Among other data, statistics on PCT nationalphase entries are collected through this means. The data collected were published in January 2011.
Further information, publications and statistical data are available on WIPO’s Economics and Statisticswebsite.32 These pages are updated on a regular basis.
32 At: www.wipo.int/econ_stat/en/

52
SECTION D – LEGAL DEVELOPMENTS
D.1 Changes to the Legal Framework
Amendments and modifications that entered into force in 2010
Amendments to the PCT regulations adopted by the Assembly of the PCT Union in September 2009 enteredinto force on July 1, 2010. They include changes concerning:
(a) clarification of the extent to which SISAs may define the scope of the SIS to be offered (PCT Rule 45bis.9);
(b) the form of amendments requiring applicants to indicate the basis for amendments in the applicationfiled (PCT Rules 46.5, 66.8 and 70.2);
(c) the process for establishing equivalent amounts of certain PCT fees in different currencies (PCT Rules15.2, 16.1 and 57.2). Corresponding changes to the directives of the PCT Assembly relating to theestablishment of equivalent amounts of certain fees also entered into force on the same date.
Modifications to the Administrative Instructions under the PCT were made with effect from January 1, 2010,in order to implement provisions of the PCT regulations that allow the applicant to request that prioritydocuments be obtained from digital libraries. Also, minor modifications were made with effect from July 1,2010, which were consequential to amendments of the regulations under the PCT adopted by the PCTAssembly in October 2009.
Amendments agreed in 2010 that enter into force in 2011
Amendments adopted by the PCT Assembly in September 2010, which will enter into force on July 1, 2011,consist of minor changes and clarifications relating to the following:
(a) how corrections of obvious mistakes authorized by the IPEA are made available to designated offices andthe public;
(b) the translations that may be required in relation to amendments under PCT Articles 19 and 34 andaccompanying letters;
(c) the sanction that may be applied by an IPEA for failing to provide a letter indicating the basis for anamendment; and
(d) the sheets that should be included as annexes to the IPRP.
D.2 Other Developments
Fast-track procedures for the examination of patent applications in the national phase
PCT-Patent Prosecution Highway pilots. On January 29, 2010, the first of a number of PCT-PPH pilotsstarted in respect of PCT applications that had received a positive written opinion from either the ISA orIPEA, or where a positive IPER was issued within the framework of the PCT by one of the participatingoffices. Use of the PCT-PPH enables applicants, where the necessary requirements are met, to fast-trackpatent examination procedures in the national phase. This first pilot involved the Trilateral Offices: the EPO,the JPO and the USPTO. Similar PCT-PPH pilot programs followed during the course of the year between:

53
> the USPTO and KIPO;> the Austrian Patent Office and the National Board of Patents and Registration of Finland;> the Austrian Patent Office and the USPTO;> the JPO and the National Board of Patents and Registration of Finland;> the Federal Service on Intellectual Property, Patents & Trademarks of Russia and the USPTO;> the JPO and the Spanish Patent and Trademark Office; and> the Spanish Patent and Trademark Office and the USPTO.
Other fast-track procedures. In May 2010, the United Kingdom Intellectual Property Office started anindependent fast-track procedure for the accelerated examination of patent applications in the UnitedKingdom national phase, called PCT (UK) Fast Track. Under this procedure, patent applicants can, where thenecessary requirements are met, request accelerated examination in the United Kingdom national phase iftheir PCT application has received a positive search report or IPRP, regardless of which authority issued it.
Supplementary international search
The National Board of Patents and Registration of Finland (on January 1, 2010), the EPO (on July 1, 2010)and the Austrian Patent Office (on August 1, 2010) started providing a SIS service that gives PCT applicantsthe option of requesting additional language-based searches during the international phase, in addition tothe main ISR established by the ISA. This service is intended to provide a more complete overview of theprior art in the international phase.
Regional patents
African Regional Intellectual Property Organization (ARIPO) patents. Following the entry into force, onMarch 24, 2010, of the Harare Protocol on Patents and Industrial Designs within the framework of ARIPOwith respect to Liberia, any PCT application filed on or after that date includes the designation of that statefor an ARIPO patent as well as for a national patent. Furthermore, as from that date, nationals and residentsof Liberia are able to file PCT applications with ARIPO as RO, in addition to their national RO or the IB.
European patents. An agreement between the EPO and the government of Montenegro on the extensionof European patents to Montenegro, which entered into force on March 1, 2010, provides for the extensionto Montenegro of the protection conferred by European patent applications and patents. The extensionprocedure is also available, where the necessary requirements are met, via the PCT.
Albania became bound by the EPC on May 1, 2010, and Serbia became bound by the EPC on October 1,2010, with the result that any PCT application filed on or after May 1, 2010, in the case of Albania, or onor after October 1, 2010, in the case of Serbia, includes the designation of those states for a Europeanpatent, in addition to a national patent. Furthermore, as from those dates, nationals and residents of thosestates will be able to file PCT applications with the EPO as RO, in addition to their national RO or the IB. Asa consequence of these accessions, the extension agreements between Albania and the EPO and Serbia andthe EPO terminated with effect from the above-mentioned dates.

54
SECTION E – PCT TRAINING
E.1 Seminars
In 2010, the IB organized and participated in 110 PCT promotional activities in the following 22 countries:Australia, Chile, China, Denmark, Finland, France, Germany, Israel, Japan, Mali, Mexico, Norway, Peru,Poland, Portugal, Spain, Sweden, Switzerland, Turkey, United Kingdom, US and Zimbabwe. The activitieswere presented in Chinese, English, French, Spanish, German and Japanese.
E.2 Webinars
Fourteen webinars were broadcast in 2010. Broadcasts were made in all 10 PCT publication languages, and1,072 participants from 65 countries participated in the webinars. The recordings and accompanyingPowerPoint presentations are available on the PCT website.33
E.3 Distance Learning
The PCT distance learning course launched in 2009, entitled “Introduction to the PCT”, became available inall 10 publication languages in 2010. In 2010, 4,122 participants followed the course via the Internet in 142countries.
33 Available at: www.wipo.int/pct/en/seminar/webinars/index.html

55
SECTION F – MEETINGS
F.1 Meeting of International Authorities under the PCT
The 17th session of the Meeting of International Authorities under the PCT was held in Rio de Janeiro, fromFebruary 9 to 11, 2010. The session primarily focused on the need to ensure that the work carried out byinternational authorities meets the necessary level of quality. The authorities noted the results of a PCT usersurvey and the reports made by each authority on their quality management systems. They set up asubgroup to review a variety of issues and to develop proposals on how best to take this area of workforward. The meeting also gave some preliminary input on matters to be discussed by the PCT WorkingGroup regarding “The Future of the PCT”. In addition, the meeting reaffirmed the need to find a satisfactoryway of supporting the amendment of PCT applications by paragraph, to enable the full-text processing ofPCT applications.
F.2 PCT Working Group
The third session of the PCT Working Group was held in Geneva from June 14 to 18, 2010. The WorkingGroup endorsed a series of recommendations, based on a study by the IB entitled “The Need for Improvingthe Functioning of the PCT System”, that cover a variety of actions which should be undertaken by the IB,applicants, contracting states and national offices to make the PCT system more effective both forprocessing patent applications and for supporting technology transfer and technical assistance fordeveloping countries. Many of the proposals related to improving the quality of international search andpreliminary examination reports sought to build on efforts already under way by offices acting asinternational authorities to improve their ability to search prior art from a wide range of sources and in alarge number of languages, and to share the results of those searches with other offices. The WorkingGroup also recommended some minor changes to the PCT regulations, which were adopted by the PCTAssembly as set out under subsection D.1, above.
F.3 PCT Assembly
The 41st session of the Assembly of the PCT Union was held in Geneva during the period from September20 to 29, 2010, as part of the meetings of the Assemblies of the member states of WIPO. The PCT Assemblyadopted amendments to the PCT regulations which will enter into force on July 1, 2011, as outlined under“Changes to the Legal Framework”, above, and also noted reports on the work being undertaken by thePCT Working Group and the PCT Meeting of International Authorities.

56
ANNEXES
STATISTICAL SOURCES AND METHODS
For the international phase of the PCT system, data are drawn from the WIPO statistical database. The num-bers of PCT applications for 2010 are estimated due to the transmittal delay of PCT applications to WIPO.The estimates are made based on several statistical and econometric models for major PCT filing countries.For other countries, the estimates are made by adjusting actual received applications according to countries’share of the estimated total PCT filings.
For the national phase of the PCT system, statistics are based on data supplied to WIPO by national andregional patent offices, which WIPO often receives six months or more after the end of the year concerned.The latest available year to date is therefore 2009. In some cases, PCT national phase entry data providedby the PATENTSCOPE search service have been used. Data may be missing for some offices or may be incom-plete for some countries of origin. WIPO has estimated missing data wherever possible. The total numberof PCT national phase entries in 2009 was estimated by applying the 2008-2009 growth rate of PCT nation-al phase entry data provided by offices to the 2008 total. The data supplied to WIPO correspond to morethan 80% of the world total. For PCT national phase entries by office or by origin, where an office has notprovided to WIPO its number of PCT national phase entries for 2009, the 2008 or 2007 data have beenused.
Patent data for the following offices refer to 2007 instead of 2008 and 2009 data: African IntellectualProperty Organization (OAPI), Algeria, Brazil, Colombia, Cuba, Ecuador, Samoa, Sweden and Uganda.
Patent data for the following offices refer to 2008 instead of 2009 data: African Regional IntellectualProperty Organization (ARIPO), Australia, Belize, Bosnia and Herzegovina, India, Kazakhstan, Kyrgyzstan,Malaysia, Morocco, Norway, Papua New Guinea, Sri Lanka and the Former Yugoslav Republic of Macedonia.
The income groups correspond to those used by the World Bank34 and the groupings by region and subre-gion are based on the United Nations definition of regions.35
The figures shown in this review are subject to change.36
34 Available at: http://data.worldbank.org/about/country-classifications/country-and-lending-groups35 Available at: http://unstats.un.org/unsd/methods/m49/m49regin.htm. Even though the geographical terms used by WIPO might slightlydiffer from those defined by the UN, composition of regions and subregions remain identical.36 Regular updates are available at www.wipo.int/ipstats/en/.

57
STATISTICAL TABLE
The following table shows the number of PCT applications filed in 2010 and the number of PCT nationalphase entries in 2009 by office and by country (or territory) of origin.37
A PCT applicant seeking protection in any of the EPC member states can generally choose to enter thenational phase at the relevant national office or at the EPO.38 This explains why the number of PCT nation-al phase entries at some European national offices is lower than would otherwise be expected. The PCTnational phase route is closed for France, Italy, the Netherlands and several other countries (see the “PCTContracting States” table in the annex). A PCT applicant seeking protection in those countries must enterthe PCT national phase at the regional office (such as the EPO).
The following example may help in understanding the table below: the Bulgarian Office received 27 PCTapplications in 2010 and 20 PCT national phase entries in 2009, whereas applicants residing in Bulgariaaccounted, worldwide, for 32 PCT applications in 2010 and 35 PCT national phase entries in 2009.
African Intellectual Property
Organization OA 2 n.a. -- n.a.
African Regional Intellectual
Property Organization AP 0 n.a. 410a n.a.
Albania AL 1 1 12 3
Algeria DZ 1 3 734b 2
Andorra AD n.a. 11 n.a. 20
Angola AO IB 1 -- 0
Antigua and Barbuda AG 0 1 -- 1
Argentina AR n.a. 16 n.a. 92
Armenia AM 4 5 7 4
Australia AU 1,757 1,776 20,523a 6,482
Austria AT 493 1,140 -- 2,900
Azerbaijan AZ 2 2 -- 11
Bahamas BS n.a. 20 n.a. 110
Bahrain BH 0 1 -- 2
Bangladesh BD n.a. 1 n.a. 0
Barbados BB IB 85 -- 488
Belarus BY 12 15 -- 14
Belgium BE 88 1,057 EP 4,667
Belize BZ 0 1 54a 6
Bermuda BM 0 0 -- 108
Bolivia (Plurinational State of) BO n.a. 0 n.a. 2
Bosnia and Herzegovina BA 7 13 9a 5
Botswana BW 0 1 -- 0
Brazil BR 449 492 15,639b 754
Brunei Darussalam BN n.a. 0 n.a. 17
Bulgaria BG 27 32 20 35
Cameroon CM OA 2 OA 6
Canada CA 2,064 2,721 28,169 7,436
37Some figures are estimated. See the note on “Statistical Sources and methods” in the annex.
38 See EPC member states in the “PCT Contracting States” table in the annex.
By Country of Origin
PCT National Phase Entries
in 2009At Receiving
OfficeBy Country
of OriginAt Designated /Elected Office
Name Code PCTInternational
Phase Filings in 2010

58
Chad TD OA 1 OA 0
Chile CL 59 88 -- 57
China CN 12,918 12,295 53,611 5,018
Colombia CO 0 47 1,747b 73
Congo CG OA 0 OA 2
Costa Rica CR 2 3 -- 4
Côte d'Ivoire CI OA 1 OA 0
Croatia HR 39 51 52 86
Cuba CU 5 5 210b 164
Cyprus CY 0 43 EP 175
Czech Republic CZ 134 139 52 343
Democratic People's Republic
of Korea KP 3 4 55 25
Denmark DK 539 1,173 45 4,501
Dominican Republic DO 3 3 -- 0
Ecuador EC 2 33 794b 7
Egypt EG 47 49 1,375 16
Estonia EE 18 46 14 64
Eurasian Patent Organization EA 10 n.a. 2,249 n.a.
European Patent Office EP 29,032 n.a. 78,684 n.a.
Fiji FJ n.a. 0 n.a. 1
Finland FI 1,188 2,145 46 5,176
France FR 3,459 7,288 EP 22,778
Gabon GA OA 2 OA 0
Georgia GE 5 5 186 7
Germany DE 1,771 17,558 3,645 51,341
Greece GR 57 92 EP 230
Grenada GD 0 0 -- 2
Guatemala GT 2 2 297 9
Guinea GN OA 1 OA 0
Hong Kong (SAR), China HK 0 0 -- 132
Hungary HU 151 174 14 610
Iceland IS 26 58 18 201
India IN 833 1,313 25,706a 2,113
Indonesia ID 9 16 -- 10
International Bureau IB 8,721 n.a. -- n.a.
Iran (Islamic Republic of) IR n.a. 6 n.a. 5
Ireland IE 79 448 EP 1,675
Israel IL 1,103 1,488 5,550 4,888
Italy IT 530 2,658 EP 7,805
Jamaica JM n.a. 0 n.a. 4
Japan JP 31,555 32,180 48,773 79,599
Jordan JO n.a. 0 n.a. 25
Kazakhstan KZ 17 19 135a 24
Kenya KE 2 4 -- 2
Kuwait KW n.a. 0 n.a. 1
Kyrgyzstan KG 1 1 2a 0
By Country of Origin
PCT National Phase Entries
in 2009At Receiving
OfficeBy Country
of OriginAt Designated /Elected Office
Name Code PCTInternational
Phase Filings in 2010

59
Lao People's Democratic
Republic LA IB 7 -- 0
Latvia LV 17 26 EP 86
Lebanon LB n.a. 4 n.a. 5
Libyan Arab Jamahiriya LY 0 1 -- 1
Liechtenstein LI CH 73 CH 188
Lithuania LT 3 11 9 8
Luxembourg LU 0 254 -- 637
Macao (SAR), China MO 0 0 -- 3
Madagascar MG IB 0 36 0
Malaysia MY 335 354 3,529a 215
Malta MT 0 21 EP 89
Marshall Islands MH n.a. 1 n.a. 3
Mauritius MU n.a. 2 n.a. 38
Mexico MX 165 193 12,055 354
Monaco MC 0 17 EP 37
Morocco MA 16 14 767a 11
Namibia NA AP 28 -- 1
Netherlands NL 1,083 4,078 EP 17,182
Netherlands Antilles AN 0 0 -- 17
New Zealand NZ 253 299 4,182 1,007
Nicaragua NI 0 1 -- 0
Niger NE OA 0 OA 2
Nigeria NG IB 2 -- 7
Norway NO 492 706 4,123a 2,193
Oman OM IB 4 -- 0
Pakistan PK n.a. 1 n.a. 1
Panama PA n.a. 5 n.a. 78
Papua New Guinea PG 0 0 41 0
Peru PE 0 7 -- 2
Philippines PH 9 14 -- 20
Poland PL 167 201 51 215
Portugal PT 67 117 17 320
Qatar QA n.a. 7 n.a. 2
Republic of Korea KR 9,639 9,668 27,323 12,555
Republic of Moldova (the) MD 1 0 3 0
Romania RO 4 10 13 25
Russian Federation RU 662 735 10,734 894
Saint Kitts and Nevis KN 0 2 -- 4
Saint Vincent and the Grenadines VC IB 2 -- 5
Samoa WS n.a. 5 n.a. 1
San Marino SM 1 5 -- 9
Saudi Arabia SA n.a. 81 n.a. 186
Senegal SN OA 0 OA 1
Serbia RS 16 19 40 14
Serbia and Montenegro
(formerly Yugoslavia) YU n.a. 0 n.a. 1
By Country of Origin
PCT National Phase Entries
in 2009At Receiving
OfficeBy Country
of OriginAt Designated /Elected Office
Name Code PCTInternational
Phase Filings in 2010

60
Seychelles SC 0 10 -- 20
Sierra Leone SL AP 2 -- 0
Singapore SG 493 642 6,255 1,364
Slovakia SK 27 44 45 68
Slovenia SI 76 127 EP 212
South Africa ZA 73 297 5,595 1,001
Spain ES 1,396 1,752 91 2,804
Sri Lanka LK IB 10 264a 2
Swaziland SZ AP 0 AP 4
Sweden SE 1,783 3,314 21b 11,989
Switzerland CH 333 3,728 61 17,196
Syrian Arab Republic SY 12 12 -- 1
T F Y R of Macedonia MK 2 2 406a 2
Tajikistan TJ 0 0 1 0
Thailand TH 49 73 -- 33
Trinidad and Tobago TT 1 1 -- 23
Tunisia TN 7 9 -- 14
Turkey TR 263 483 182 366
Uganda UG AP 0 1b 0
Ukraine UA 96 109 2,134 55
United Arab Emirates AE IB 30 -- 33
United Kingdom GB 4,431 4,908 2,037 18,304
United Republic of Tanzania TZ AP 0 -- 1
United States of America US 45,093 44,890 78,160 137,192
Uruguay UY n.a. 5 n.a. 12
Uzbekistan UZ 3 4 151 0
Venezuela VE n.a. 1 n.a. 9
Viet Nam VN 5 9 -- 1
Yemen YE n.a. 3 n.a. 0
Zambia ZM 0 1 -- 0
Zimbabwe ZW 0 0 -- 1
Unknown n.a. 23 2,836 12,538
World Total 164,300 164,300 450,000 450,000
Source: WIPO Statistics DatabaseNote: a 2008 data; b 2007 data; -- unknown data; n.a. not applicable; AP, EP, IB, OA competent designated, elected or receiving office
By Country of Origin
PCT National Phase Entries
in 2009At Receiving
OfficeBy Country
of OriginAt Designated /Elected Office
Name Code PCTInternational
Phase Filings in 2010

61
L IST OF ACRONYMS
DO Designated OfficeEO Elected OfficeEPC European Patent ConventionEPO European Patent OfficeGDP Gross Domestic ProductIB International Bureau of WIPOIP Intellectual PropertyIPC International Patent ClassificationIPE International Preliminary ExaminationIPEA International Preliminary Examining AuthorityIPRP International Preliminary Report on PatentabilityISA International Searching AuthorityISR International Search ReportJPO Japan Patent OfficeKIPO Korean Intellectual Property OfficePCT Patent Cooperation TreatyR&D Research and DevelopmentRO Receiving Office SAFE Secure Application Filed ElectronicallySIPO State Intellectual Property Office of the People’s Republic of ChinaSIS Supplementary International SearchSISA Authority specified for Supplementary Search (Supplementary International Searching Authority)SISR Supplementary International Search ReportUSPTO United States Patent and Trademark OfficeWIPO World Intellectual Property Organization
62
GLOSSARY
Applicant: An individual or legal entity that files a patent application. There may be more than one applicantin an application. In PCT statistics, the name of the first-named applicant is used to determine the ownerof a PCT application.
Application: A set of legal documents submitted to a patent office requesting that a patent be granted forthe applicant’s invention. The patent office then examines the application and decides whether to granta patent or reject the application.
Authority specified for Supplementary Search (SISA): An International Searching Authority (ISA) thatprovides supplementary international search service. Also known as “Supplementary InternationalSearching Authority (SISA)”.
Chapter I of the PCT: The provisions in the PCT that regulate the filing of PCT applications, establishmentof international searches and written opinions by ISAs, international publication of PCT applications, andprovides for the communication of PCT applications and related documents to designated offices.
Chapter II of the PCT: The provisions in the PCT that regulate the optional international preliminaryexamination procedure.
Country of Origin: For statistical purposes, the country of origin of a PCT application is the country ofresidence (or nationality, in the absence of a valid residence) of the first-named applicant in the PCTapplication.
Designated Office (DO): A national or regional office of or acting for a State designated in a PCT applicationunder Chapter I of the PCT.
Designated State: A Contracting State in which protection for the invention is sought, as specified in thePCT application.
Elected Office: The national or regional office of or acting for a State elected by the applicant under ChapterII of the PCT, at which the applicant intends to use the results of the international preliminaryexamination.
Filing Abroad: For statistical purposes, a patent application filed by a resident of the home country at apatent office of a foreign country. For example, a patent application filed by an applicant residing inFrance at the USPTO is considered a “filing abroad” from the perspective of France. A “filing abroad” isthe mirror concept to a “non-resident filing”, which describes a patent application by a resident of aforeign country from the perspective of the home country.
International Authority: A national or regional patent office, or international organization that fulfillsspecific tasks, as prescribed by the PCT.
International Bureau (IB): In the context of the PCT, the International Bureau of the World IntellectualProperty Organization acts as a Receiving Office for PCT applications from all Contracting States. It alsohandles certain processing tasks with respect to all PCT applications filed with all Receiving Officesworldwide.
International Filing Date. The date on which the Receiving Office received the PCT application (providedcertain formality requirements are met).

63
International Patent Classification (IPC): An internationally recognized patent classification system. IPC hasa hierarchical structure of language-independent symbols that consists of sections, classes, subclassesand groups. IPC symbols are assigned according to technical features in the patent applications. Onepatent application can be assigned multiple IPC symbols, as it may relate to multiple technical features.
International phase of the PCT: The international phase consists of five main stages: 1. the filing of a PCT application by the applicant and its processing by the Receiving Office; 2. the establishment of an ISR and written opinion by an ISA; 3. the publication of the PCT application and related documents, as well as their communication to
designated and elected offices by the IB; 4. the optional establishment of a SISR by a SISA; and5. the optional establishment of an IPRP by an IPEA.
International Preliminary Examining Authority (IPEA): National or regional patent office appointed by thePCT Assembly to carry out international preliminary examination. Its task is to establish the IPRP (ChapterII of the PCT).
International Preliminary Report on Patentability (Chapter II of the PCT) (IPRP): A preliminary, non-binding opinion, established by the IPEA on the request of the applicant, on whether the claimedinvention appears to be novel, to involve an inventive step (to be non-obvious), and to be industriallyapplicable. Prior to January 1, 2004, this report was known as the “International Preliminary ExaminationReport”.
International Search Report (ISR): A report established by the ISA containing citations of documents (priorart) considered to be relevant for determining, in particular, the novelty and inventive step of theinvention as claimed. The ISR also includes the classification of the subject matter of the invention andan indication of the fields searched as well as any electronic databases searched.
International Searching Authority (ISA): National patent office or intergovernmental organizationappointed by the PCT Assembly to carry out international searches. ISA establishes ISRs and writtenopinions on PCT applications.
Invention: An invention is a new solution of a technical problem. To obtain patent rights the invention mustbe novel, involve an inventive step and be industrially applicable, judged by a person skilled in the art.
National Phase Entry: When the PCT applicant enters the national phase before a national or regionalpatent office it is referred to as national phase entry. It consists of the payment of fees and, wherenecessary, the submission of the translated PCT application. It must take place within 30 months fromthe priority date of the application (longer time periods are allowed by some offices).
National Phase of PCT: This follows the international phase of the PCT procedure, and consists of theprocessing of the application before each national or regional patent office in which the applicant seeksprotection for his invention.
Non-Resident Filing: For statistical purposes, a patent application filed with the patent office of the homecountry by an applicant from a foreign country. For example, a patent application filed at the USPTO byan applicant residing in France is considered a non-resident filing from the perspective of the US. A non-resident filing is the mirror concept to a filing abroad, which describes a patent application filed by ahome country resident at a foreign patent office. “Non-resident filing” is also known as “foreign filing”.
Paris Convention: An international convention (The Paris Convention for the Protection of IndustrialProperty), signed in Paris, France, on March 20, 1883. It is one of the first and most important intellectualproperty treaties. The Paris Convention establishes, among others, the “right of priority” which enables

64
a patent applicant, when filing an application in countries other than the original country of filing, toclaim priority of up to 12 months for this filing.
Patent: A patent is an exclusive rights granted by law to the applicant for the invention for a limited periodof time (generally 20 years from filing). The patent holder has the exclusive right to commercially exploitthe invention for the duration of the patent term. In return, the applicant is obliged to disclose theinvention to the public in a manner that enables others, skilled in the art, to replicate the invention. Thepatent system is designed to balance the interests of applicants (exclusive rights) and the interests ofsociety (disclosure of invention). Patents are granted by national or regional patent offices and are limitedto the jurisdiction of the issuing authority. Patent rights can be obtained through the filing of anapplication at the relevant national or regional office(s), or by the filing a PCT application.
Patent Cooperation Treaty (PCT): An international treaty administered by the World Intellectual PropertyOrganization. The PCT allows applicants to seek patent protection for an invention simultaneously in alarge number of countries (PCT Contracting States) by filing a single “PCT international application”. Thedecision on whether to grant patent rights remains at the discretion of the national or regional patentoffices.
PATENTSCOPE Search Service: The PATENTSCOPE search service allows access, free of charge, to all PCTapplications published. Since April 2006, the PATENTSCOPE search service has become the authenticpublication source of PCT applications. Powerful, flexible search interfaces allow retrieval of relevant PCTapplications and associated information.
PCT Application: A patent application filed through the WIPO administered Patent Cooperation Treaty(PCT). PCT application is also known as a PCT international application.
Prior Art: All information that has been disclosed to the public in any form about an invention before a givendate. The prior art information can assist in determining whether the claimed invention is new andinvolves an inventive step (is not obvious) for the purposes of international searches and internationalpreliminary examination.
Priority Date: Priority date is the filing date of the application on the basis of which priority is claimed.
Publication of PCT Application: The IB publishes the PCT application and related documents promptly afterthe expiration of 18 months from the priority date. If the PCT application is withdrawn or consideredwithdrawn, the application is not published. An applicant can request an early publication of the PCTapplication.
Receiving Office (RO): A patent office or the IB with which the PCT application is filed. The role of theReceiving Office is to check and process the application in accordance with the PCT and its regulations.
Resident Filing: For statistical purposes, an application filed at a patent office by an applicant havingresidence in the same country. For example, a patent application filed at the Japan Patent Office by aresident of Japan is considered a resident filing for Japan Patent Office. “Resident filing” is also knownas “domestic filing”.
Supplementary International Searching Authority (SISA): See “Authority specified for SupplementaryInternational Search”.
Supplementary International Search Report (SISR): A report, similar to the ISR, established during thesupplementary international search. Supplementary international search permits the applicant to request,

65
in addition to the main international search, one or more supplementary international searches each tobe carried out by an International Authority other than the ISA that carries out the main internationalsearch. The SIS primarily focuses on the patent documentation in the language in which the SISAspecializes.
World Intellectual Property Organization (WIPO): WIPO is a specialized agency of the United Nations. It isdedicated to developing a balanced and accessible international intellectual property (IP) system, whichrewards creativity, stimulates innovation and contributes to economic development while safeguardingthe public interest. WIPO was established in 1967 with a mandate from its Member States to promotethe protection of IP throughout the world through cooperation among states and in collaboration withother international organizations.
Written Opinion of the ISA: For every PCT application filed on or after January 1, 2004, an ISA establishes,at the same time that it establishes the ISR, a preliminary and nonbinding written opinion on thequestions whether the claimed invention appears to be novel, to involve an inventive step and to beindustrially applicable.

66
PCT CONTRACTING STATES
In 2010, the PCT system counted 142 contracting states.
1 Only PCT applications filed on or after May 1, 2010, include the designation of this state for a European patent.2 Extension of European patent possible; in the case of Albania and Serbia, only for PCT applications filed before May 1, 2010, and
October 1, 2010, respectively3 May only be designated for a regional patent (the “national route” via the PCT has been closed).4 Only PCT applications filed on or after March 24, 2010, include the designation of this state for an ARIPO patent.5 Only PCT applications filed on or after January 1, 2009, include the designation of this state for a European patent.6 Only PCT applications filed on or after July 1, 2009, include the designation of this state for a European patent.
Where a state can be designated for a regional patent, the two-letter code for the relevant regional patent office is indicated in parentheses(AP = ARIPO patent; EA = Eurasian patent; EP = European patent; OA = OAPI patent).
AE United Arab Emirates
AG Antigua and Barbuda
AL Albania (EP)1, 2
AM Armenia (EA)
AO Angola
AT Austria (EP)
AU Australia
AZ Azerbaijan (EA)
BA Bosnia and Herzegovina2
BB Barbados
BE Belgium (EP)3
BF Burkina Faso (OA)3
BG Bulgaria (EP)
BH Bahrain
BJ Benin (OA)3
BR Brazil
BW Botswana (AP)
BY Belarus (EA)
BZ Belize
CA Canada
CF Central African
Republic (OA)3
CG Congo (OA)3
CH Switzerland (EP)
CI Côte d’Ivoire (OA)3
CL Chile
CM Cameroon (OA)3
CN China
CO Colombia
CR Costa Rica
CU Cuba
CY Cyprus (EP)3
CZ Czech Republic (EP)
DE Germany (EP)
DK Denmark (EP)
DM Dominica
DO Dominican Republic
DZ Algeria
EC Ecuador
EE Estonia (EP)
EG Egypt
ES Spain (EP)
FI Finland (EP)
FR France (EP)3
GA Gabon (OA)3
GB United Kingdom (EP)
GD Grenada
GE Georgia
GH Ghana (AP)
GM Gambia (AP)
GN Guinea (OA)3
GQ Equatorial Guinea (OA)3
GR Greece (EP)3
GT Guatemala
GW Guinea-Bissau (OA)3
HN Honduras
HR Croatia (EP)
HU Hungary (EP)
ID Indonesia
IE Ireland (EP)3
IL Israel
IN India
IS Iceland (EP)
IT Italy (EP)3
JP Japan
KE Kenya (AP)
KG Kyrgyzstan (EA)
KM Comoros
KN Saint Kitts and Nevis
KP Democratic People’s
Republic of Korea
KR Republic of Korea
KZ Kazakhstan (EA)
LA Lao People’s
Democratic Republic
LC Saint Lucia
LI Liechtenstein (EP)
LK Sri Lanka
LR Liberia (AP)4
LS Lesotho (AP)
LT Lithuania (EP)
LU Luxembourg (EP)
LV Latvia (EP)3
LY Libyan Arab Jamahiriya
MA Morocco
MC Monaco (EP)3
MD Republic of Moldova (EA)
ME Montenegro2
MG Madagascar
MK The former Yugoslav
Republic of Macedonia (EP)5
ML Mali (OA)3
MN Mongolia
MR Mauritania (OA)3
MT Malta (EP)3
MW Malawi (AP)
MX Mexico
MY Malaysia
MZ Mozambique (AP)
NA Namibia (AP)
NE Niger (OA)3
NG Nigeria
NI Nicaragua
NL Netherlands (EP)3
NO Norway (EP)
NZ New Zealand
OM Oman
PE Peru
PG Papua New Guinea
PH Philippines
PL Poland (EP)
PT Portugal (EP)
RO Romania (EP)
RS Serbia (EP)2
RU Russian Federation (EA)
SC Seychelles
SD Sudan (AP)
SE Sweden (EP)
SG Singapore
SI Slovenia (EP)3
SK Slovakia (EP)
SL Sierra Leone (AP)
SM San Marino (EP)6
SN Senegal (OA)3
ST Sao Tome and Principe
SV El Salvador
SY Syrian Arab Republic
SZ Swaziland (AP)3
TD Chad (OA)3
TG Togo (OA)3
TH Thailand
TJ Tajikistan (EA)
TM Turkmenistan (EA)
TN Tunisia
TR Turkey (EP)
TT Trinidad and Tobago
TZ United Republic of
Tanzania (AP)
UA Ukraine
UG Uganda (AP)
US United States of America
UZ Uzbekistan
VC Saint Vincent and
the Grenadines
VN Viet Nam
ZA South Africa
ZM Zambia (AP)
ZW Zimbabwe (AP)

67
PCT Contracting States in 2009
ADDITIONAL RESOURCES
The following patent resources are available on the WIPO website:
PATENTSCOPE – WIPO’s gateway to patent services and activities.www.wipo.int/patentscope/en/
Information on the PCT Systemwww.wipo.int/pct/en/
PATENTSCOPE search service – Search PCT international applications and view/download complete patentapplications and related documentation.
www.wipo.int/pctdb/en/
PCT Statistics – monthly, quarterly and yearly statistics on the PCT System, including a comparative list ofapplicants and details of the indicators included in this report.
www.wipo.int/ipstats/en/statistics/pct/
Law of Patents – includes current and emerging issues related to patents, information on WIPO-administered treaties, access to national/regional patent laws, patent law harmonization.
www.wipo.int/patent/law/en

WIPO Publication No. 901(E)/10 ISBN 978-92-805-2086-6
World Intellectual Property OrganizationAddress:34, chemin des Colombettes P.O. Box 18CH-1211 Geneva 20Switzerland
Telephone:+41 22 338 91 11
Fax:+41 22 733 54 28
e-mail:[email protected]@wipo.int
Internet:www.wipo.int/ipstats