the international journal of indian psychology- volume 1-issue-3
DESCRIPTION
The International Journal of Indian Psychology (ISSN 2348-5396) is an interdisciplinary, peer-reviewed, academic journal that examines the intersection of Psychology, Social sciences, Education, and Home science. The journal is an international electronic journal published in quarterly. All peer-reviewed articles must meet rigorous standards and can represent a broad range of substantive topics, theoretical orientations, and empirical methods.TRANSCRIPT


Message from Editors:
Thank you so much for join with us. The International Journal of Indian
Psychology (IJIP) is published by RED’SHINE Publication with 4 Issues per year.
It is an online open access journal that provides quarterly publication of articles in
all areas of the subject such as: Clinical Psychology, Social Psychology,
Educational Psychology, School Psychology, Child Psychology, as well as Social
Science, Home Science and Education also. The Journal welcomes the submission
of manuscripts that meet the general criteria of significance and scientific
excellence. Papers will be published by rapid process within 20 days after
acceptance and peer review process takes 14 days. All articles published in
WWW.IJIP.IN will be peer-reviewed.
Dr. Suresh Makvana*
(Editor in Chief)
Mr. Ankit Patel**
(Co-Editor)
*Email: [email protected]
**Email: [email protected]

Message from Director of RED’SHINE Publication:
The International Journal of Indian Psychology is an interdisciplinary, peer-
reviewed, academic journal that examines the intersection of Psychology, Social
sciences, Education, and Home science with IJIP. IJIP is an international electronic
journal published in quarterly. All peer-reviewed articles must meet rigorous
standards and can represent a broad range of substantive topics, theoretical
orientations, and empirical methods.
The International Journal of Indian Psychology welcomes submissions that explore
of the Psychology, Social sciences, Education, and Home science aspects of human
behavior.
I like to thank all participants of Volume 1 and congratulation! for paper
publishing.
Er. Bhavin Patel
IT Engineer, Dept. of Development,
RED’SHINE Publication, Lunawada

Index of The International Journal of Indian Psychology (IJIP), Volume 1 – Issue 3
© 2014 WWW.IJIP.IN, All Right Reserved
I n d e x . . .
Page Title Author (s)
1 to 5 Person of the Issue: Ivan
Petrovich Pavlov (1849–
1936)
Mr. Ankit P. Patel
6 to 14
Marital Adjustment
among Serving and Non-
Serving Married Couples
Dr. S. M. Makvana
15 to 33
Healthy Practices in
Teaching & Learning
with Information
Technology, and
Evaluation Method in
Classroom
Mr. Rajendrakumar
Muljibhai Parmar
Dr. S. M. Makvana
34 to 51
Some Case Studies of
AIDS/HIV Patients in
India
Mr. Ankit P. Patel
52 to 60
Self Compassion and
Emotional Intelligence of
Engineering and Dental
College Students
Dr. Thiyam Kiran Singh
Ms. Niharika Saini
61 to 72 Does Marital Adjustment
and Psychological Well-
Being Differences in
Working and Non-
Working Female?
Dr. Garima Gupta
Ms. Neha Nafis
73 to 77
Stress Management
among Teaching & Non -
Teaching Staff
Pooja Verma
Dr. Ravindra Kumar
78 to 83 Academic achievement of
college students and their
locus of control
Ms. Ruhanshi Mathur
84 to 90 Yoga in Relation to its
Psychophysical Impact
Dr. Shailesh Raval
91 to 96 Adjustment and health
care awareness among
youths of Rajkot district
Mr. Mohit M. Pandya
Dr. D. J. Bhatt

Index of The International Journal of Indian Psychology (IJIP), Volume 1 – Issue 3
© 2014 WWW.IJIP.IN, All Right Reserved
97 to 101
Stress and sexual
dysfunction among call
center employees
Dr. V.D. Kasture
102 to 107 Depression among B.Ed
college students
Mr. Ramesh O. Prajapati
108 to 114
Ectomorphic and
Endomorphic Personality:
A Study of Emotional
Quotient among Women
Urvashi Sharma
Dr. Ravindra Kumar
115 to 124
The Development of
Distributive Justice: Does
Type of Schooling really
matter?
Dr. Rita Karmakar
Prof. Anjali Ghosh
125 to 132
T. V. serial and
Aggression
Mr. Pravin A Baviskar
Dr. N. D. Mundada
133 to 137
A Study of Academic
Stress among Senior
Secondary Students
Kartiki Porwal
Dr. Ravindra Kumar
138 to 140
A study of Adjustment
Problem among working
women and non working
women
Ms. Kachchhi Parvati K
141 to 146 Adolescence at Risk: An
Overview
Mr. Shaik Ali
147 to 160
An assessment of role
stress experienced by
management students in
India- Suggestive
measures and strategies
Dr. Neeta Sinha
161 to 164 Mental Health among
Married and Unmarried
Women
Mr. Alpesh B. Kotar

Disclaimer
The views expressed by the authors in their articles, reviews etc in this issue are
their own. The Editor, Publisher and owner are not responsible for them. All
disputes concerning the journal shall be settled in the court at Lunawada, Gujarat
The present issue of the journal is edited & published by RED’SHINE Publication (A unit of RED’MAGIC Networks. Inc) at 86/Shardhdha, 88/Navamuvada, Lunawada, Gujarat-India, 389230
© 2014 IJIP, All Right Reserved.
Designed by:
Published by:
Submit your paper at: [email protected] | Publishing charge 500/- INR only.

The International Journal of Indian Psychology: Volume: 01 | Issue: 03 | ISSN 2348-5396
© 2014 www.ijip.in April – June 2014 1 | P a g e
Person of the Issue: Ivan Petrovich Pavlov (1849–1936)
Mr. Ankit P. Patel*
Quick Facts
Name: Ivan Petrovich Pavlov
Occupation: Physiologist, Scientist
Birth Date: September 14, 1849
Death Date: February 27, 1936
Education: University of St. Petersburg, Imperial
Medical Academy
Place of Birth: Ryazan, Russia
Place of Death: Leningrad, Russia
AKA: Pavlov
Full Name: Ivan Petrovich Pavlov
Russian Physiologist Ivan Pavlov developed his concept of the conditioned reflex
through a famous study with dogs and won a Nobel Prize Award in 1904.
Synopsis
Born on September 14, 1849, in Ryazan, Russia, Ivan Pavlov abandoned his early
theological schooling to study science. As the Department of Physiology head at the Institute of
Experimental Medicine, his groundbreaking work on the digestive systems of dogs earned him
the Nobel Prize for Physiology or Medicine in 1904. Pavlov remained an active researcher until
his death on February 27, 1936.
Early Life and Education
Ivan Petrovich Pavlov was born on September 14, 1849, in Ryazan, Russia. The son of a
priest, he attended a church school and theological seminary. However, he was inspired by the
ideas of Charles Darwin and I.M. Sechenov, the father of Russian physiology, and gave up his
theological studies in favor of scientific pursuit.
*MA Student Department of Psychology, S P University, V Vidhya Nagar, Anand, Gujarat

The International Journal of Indian Psychology: Volume: 01 | Issue: 03 | ISSN 2348-5396
© 2014 www.ijip.in April – June 2014 2 | P a g e
Pavlov studied chemistry and physiology at the University of St. Petersburg and received
the degree of Candidate of Natural Sciences in 1875. He then enrolled at the Imperial Medical
Academy in St. Petersburg, completing his graduate dissertation on the centrifugal nerves of the
heart in 1883.
Awards and Achievements
For his groundbreaking work, Pavlov was named the 1904 Nobel Prize winner for
Physiology or Medicine. More honors followed over the years. He was elected Academician of
the Russian Academy of Sciences in 1907, and in 1912 he was given an honorary doctorate at
Cambridge University. Following a recommendation by the Medical Academy of Paris, he was
awarded the Order of the Legion of Honour in 1915.
Later Years
Later in life, Pavlov applied his laws to the study of psychosis, arguing that some people
withdrew from daily interactions with others due to the association of external stimuli with a
harmful event. Although he was notably dismissive of psychology as a pseudo-science, his
research helped lay the groundwork of several important concepts in the then-nascent discipline.
Pavlov openly decried the war-torn conditions of his country after the Russian Revolution of
1917. He toed a dangerous line with his criticism of Communism after visits to the United States
in the 1920s, though he escaped prosecution due to his standing as one of Russia's preeminent
scientists. Pavlov softened his tone in the last years of his life, perhaps due to increased
government support of scientific research. He remained devoted to his lab work until his death
from double pneumonia on February 27, 1936, in Leningrad.
Personal Life
In 1881, Pavlov married pedagogical student Seraphima Vasilievna Karchevskaya. The
couple had virtually no money in their early years together, and often lived separately until their
finances stabilized. Their first son died suddenly as a young child, but they proceeded to have
three more sons and a daughter.
Discovery
After graduation, Pavlov studied under cardiovascular physiologist Carl Ludwig in
Leipzig, Germany, and gastrointestinal physiologist Rudolf Heidenhain in Breslau, Poland. With
Heidenhain, he devised an operation in which he created an exteriorized "pouch" on a dog's
stomach and maintained nerve supply to properly study gastrointestinal secretions. He then spent

The International Journal of Indian Psychology: Volume: 01 | Issue: 03 | ISSN 2348-5396
© 2014 www.ijip.in April – June 2014 3 | P a g e
two years at a laboratory in St. Petersburg, where he researched cardiac physiology and the
regulation of blood pressure.
In 1890, Pavlov took charge of the Department of Physiology at the newly created
Institute of Experimental Medicine. He was also named Professor of Pharmacology at the
Imperial Medical Academy, and five years later was appointed to its vacant Chair of Physiology.
During this period, Pavlov focused on the secretory activity of digestion in dogs, implanting
fistulas in their salivary ducts to record the uninterrupted effects of the nervous system on the
digestive process.
Pavlov's observations led him to formulate his concept of the conditioned reflex. In his
most famous experiment, he sounded a tone just before presenting dogs with food, conditioning
them to begin salivating every time he sounded the tone. Pavlov published his results in 1903,
and delivered a presentation on "The Experimental Psychology and Psychopathology of
Animals" at the 14th International Medical Congress in Madrid, Spain, later that year.
Time Line:
September 14, 1894 Born in Ryazan, Russia.
1870 Leaving his religious career, Pavlov enrolled to take a natural science course at the
University of St. Petersburg.
1875 Graduated from the University of St. Petersburg and took an assistantship from
Cyon in his laboratory at the Military-Medical Academy; received the degree of
Candidate of Natural Sciences.
1876-78 Becomes an assistant in Ustimovich's laboratory.
Summer of 1877 He spent time in Physiological Laboratory of Professor R. Heidenhain
at Breslau.
1879 Graduated from the Military-Medical Academy.
1879 Completed third course of study at the Academy of Medical Surgery; awarded his
first gold medal.
1879-1904 Wrote for a volume in commemoration of the 25th Graduation Anniversary
from the Military-Medical Academy.

The International Journal of Indian Psychology: Volume: 01 | Issue: 03 | ISSN 2348-5396
© 2014 www.ijip.in April – June 2014 4 | P a g e
June 13, 1880 Proposed to Seraphima (Sara) Vasilievna karchevskaya.
1880-84 Postgraduate study and research at the Academy.
1881 Married Sara.
1883 Discovered dynamic nerves of the heart and submitted thesis for the degree of
Doctor of Medicine.
April 24, 1884 Made a lecturer in physiology at the Military-Medical Academy.
1885-86 Studied abroad June 15, 1890 Made chair and appointed professor of
pharmacology in the Military-Medical Academy.
1890 Appointed director of physiology department at the Institute of Experimental
Medicine in St. Petersburg.
June 13, 1891 Gained directorship of the Department of Physiology in the Institute of
Experimental Medicine.
1891-1900 Did most of his research on physiology of digestion at the Institute of
Experimental Medicine.
May 29, 1895 Appointed to Chair of Physiology until 1925.
1897 Published his lectures entitled Lectures on the functions of the principal digestive
gland.
1901 Elected as a corresponding member of the Russian Academy of Sciences.
1904 Received Nobel Prize in Physiology and Medicine for work on the physiology of
the digestive glands.
1907 Elected Academician of the Russian Academy of Sciences.
1912 Given an honorary doctorate at Cambridge University.
1915 Awarded the Order of the legion of Honour (Medical Academy of Paris
recommendation).
January 24, 1921 Awarded a special government decree signed by Lenin.
1924 Resigned from professorship at the Military-Medical Academy.

The International Journal of Indian Psychology: Volume: 01 | Issue: 03 | ISSN 2348-5396
© 2014 www.ijip.in April – June 2014 5 | P a g e
1935 Youngest son, Vsevolod, died.
1935 Government built a laboratory for Pavlov with his chief work on conditioned
reflexes.
1936 On February 27, Pavlov died in Leningrad
Books:
Conditioned Reflexes and Psychiatry - Lectures on Conditioned Reflexes, (1903)
Quotes:
―As a young man I entered the laboratory, I have spent my entire life in it, I became an old man
in it, and it is my dream to spend my final days in it.‖
—Ivan Petrovich Pavlov
Reference:
1. Anrep, G. V. (1936). "Ivan Petrovich Pavlov. 1849-1936". Obituary Notices of Fellows
of the Royal Society 2 (5): 1–0. doi:10.1098/rsbm.1936.0001. JSTOR 769124
2. Babkin, B.P. (1949). Pavlov, A Biography. Chicago and London: The University of
Chicago Press. pp. 27–54. ISBN 1406743976.
3. Bio.com, Pavlov, http://www.biography.com/people/ivan-petrovich-pavlov-
9435332#awesm=~oCvSOEPtb8k5eK
4. Cavendish, Richard. (2011). "Death of Ivan Pavlov". History Today 61 (2): 9.
5. Nobel Prizes, http://www.nobelprize.org/nobel_prizes/medicine/laureates/1904/pavlov-
bio.html
6. Sheehy, Noel; Chapman, Antony J. and Conroy, Wendy A., ed. (2002). "Ivan Petrovich
Pavlov". Biographical Dictionary of Psychology. Routledge. ISBN 0415285615.
7. The Nobel Prize in Physiology and Medicine 1904 Ivan Pavlov". Nobelmedia. Retrieved
2 February 2012.
8. http://www.muskingum.edu/~psych/psycweb/history/pavlov.html

The International Journal of Indian Psychology: Volume: 01 | Issue: 03 | ISSN 2348-5396
© 2014 www.ijip.in April – June 2014 6 | P a g e
Marital Adjustment among Serving and Non-Serving Married Couples
Dr. S. M. Makvana*
Abstract
Human being among living begins, has highest capacities to adapt to new situation. Man
as a social animal not only adapts to physical demands but also adjusts to social pressure in
society. Psychologists have interpreted adjustment from two important points of views. One,
adjustment and the second lays emphasis on process by which an individual adjust in external
environment. Married people need to adjust to each other, in order to live a happy life. Various
factors contribute to the adjustment of the Spouses. The beliefs and religiosity level of each
partner has its influence on the Marriage.
Introduction:
Marital adjustment is a life longs process; although in the early days of marriage one has
to give serious consideration. As Lasswell (1982) points out, "understanding the individual trait
of the spouse is an ongoing process in marriage; because even if two people know each other
before or at the time of marriage, there is a possibility that people change during the life cycle.
Marital adjustment, therefore, calls for maturity that accepts and understands growth and
development in the spouse. If this growth is not experienced and realized fully, death in marital
relationship is inevitable. Sinha and Mukerjee (1990) defines marital adjustment as, "the state in
which there is an overall feeling between husband and wife, of happiness and satisfaction with
their marriage and with each other." It, therefore, calls experiencing satisfactory relationship
between spouses characterized by mutual concern, care, understanding and acceptance. Sexual
compatibility and mutual enjoyment is an important factor contributing to the success of most
marital relationship, Job of spouse, shape of families in a variety of ways. Locke & Wallace
(1959) defines marital adjustment as: “accommodation of husband and wife to each other at a
given time” Marital adjustment is a process, the outcome of which is determined by the degree
of: a) troublesome marital differences, b) interpersonal tensions and personal anxiety, c) marital
satisfaction d) dyadic cohesion, e) consensus on matters of importance to marital functioning.
There are a number of factors that define a healthy marital adjustment by Spanier and Cole
(1976).
*Associate Professor, Department of Psychology, Sardar Patel University, Vallabhvidyanagar,
Gujarat-388120

The International Journal of Indian Psychology: Volume: 01 | Issue: 03 | ISSN 2348-5396
© 2014 www.ijip.in April – June 2014 7 | P a g e
Marriage and family have been the pillars of the basic structure on which the structure of
society and nations are built. It is through this institution that an individual‟s physical and social
needs are fulfilled. Fujihara (1998) was study on 153 married couples which showed that marital
adjustment was significantly correlated with subcategories of social adjustment (1) household
adjustment (except the spouse),(2) external family adjustment, (3) work adjustment, (4) social
leisure adjustment and (5) general adjustment. Thus, marital adjustment may be a part of social
adjustment for women, but it may be separate for men. A study made on 1609 couples from the
Russian Army, found that marital dissatisfaction from husband will cross over to the wife
directly, whereas the indirect crossover when a stressor, such as economic hardship or a negative
life event increases the strain of a partner, is mediated the impact of the wife's social
undermining
Behavior on her husband (Westman, Vinokur, Hamilton & Roziner, 2004). Different
factors involved in marital adjustment According to Alfred Adler (1978), marriage is part of the
three tasks (i.e., work, friendship, and love) that the human community sets for every individual.
Relationship importance, over the course of life, people learn to establish different relationships,
with different values, expectations and commitments. One of those relationships is the marital
relationship. For A good marital relationship marital adjustment is essential.
Different Psychological Factors of Marital adjustment:
1. Economics Factor:
Gudmunson, Beutler, Israelsen, McCoy & Hill (2007) found that financial problems
significantly contributed to lower reported marital satisfaction among married couples. In a study
in Finland conducted by Kinnunen and Feldt (2004) concluded that husband's unemployment is
strongly associated with his marital adjustment. Couples with better economic resources are
martially adjusted as compared to those who have limited economic resources. Economic hard
times increased rate of martial distress. (Blekesaune's 2008)
2. Belongingness:
According to Baumeister & Leary (1995) Lack of belongingness or attachments are
linked to a variety of ill effects on health, adjustment, and well-being. In a close relationship
there is a need to belong and if that need isn‟t fulfilled then problems may occur. One of the
universal institutions is marriage which is accepted to satisfy the need for belongingness.

The International Journal of Indian Psychology: Volume: 01 | Issue: 03 | ISSN 2348-5396
© 2014 www.ijip.in April – June 2014 8 | P a g e
3. Trust:
Trust is very important factor of marital life. Relationships are composed of trust, and
sharing of intimate thoughts and feelings. They are built upon trust and sharing and they get
stronger from these things (Finkenauer, Kerkhof, Righetti, & Branje, 2009). According to Regan,
Kocan, and Whitlock (1998) Trust is one of the most important component of a loving
relationship. Also international studies have found that trust to be a critical factor in the success
of long-term marriages (Roizblatt et al. 1999; Sharlin 1996). In a longitudinal study, Kristina
Moeller and Hakan Stattin (2001) report that adolescents with trustful parental relationships
experienced greater satisfaction with their partner relationships in midlife.
4. Personality:
Personality traits relationship of neuroticism, extraversion, openness, agreeableness and
conscientiousness with marital adjustment is needed it is said by Bouchard, Sabourin, & Lussier,
Y (1999). Personality factors differentiated stable from unstable marriages; Stable marriages
were more similar in intelligence, pretension, radicalism, tender-mindedness, mutual trust,
acceptance, enthusiasm, and genuineness by Kim, Martin, and Martin (1989) and Levine and
Henessy (1990). The factors that reduce the likelihood of stability and satisfaction have included
the lack of warmth and extraversion passive-aggression by (Slavik, Carlson, & Sperry, 1998);
Feelings of insecurity, unfairness, depreciation, and powerlessness by (Begin, Sabourin, Lussier,
& Wright, 1997); disagreeableness, emotional instability, inconsiderateness, and physical abuse
(Botwin et al., 1997; Kosek, 1996; Shackelford & Buss, 1997); depression (Cohan & Bradbury,
1997; Davila & Bradbury, 1997; Fals-Stewart, Birchler, Schafer, & Lucente, 1994); neuroticism
(Karney & Bradbury, 1997; Russell & Wells, 1994a; Russell & Wells, 1994b); tension, anxiety,
worry, and suspicion (Craig & Olson, 1995); hostility, defensiveness, and aggression.
6. Communication:
The relationship between marital communication and adjustment is a strong one (Murphy
& Mendelson 2004). Gottman (1995) in his book indicated that communication could be both
productive and destructive to relationships as unhappy couples tend to criticize, disagree,
complain, put down, and use excuses and dislike. Unrewarding communication patterns lead to
the development of relationship distress (Markman, 1979). In contrast, happy couples with

The International Journal of Indian Psychology: Volume: 01 | Issue: 03 | ISSN 2348-5396
© 2014 www.ijip.in April – June 2014 9 | P a g e
marital stability and satisfaction are more likely to use active listening skills, agree, approve,
assent, use laughter and humor (Fisher, Giblin, & Hoopes, 1982) and possess character virtues of
self-restraint, courage, and friendship (Fowers & Olson, 1986). Gottman (1995) has suggested
that satisfied couples maintain a five-to-one ratio of positive to negative exchanges in
interactions.
While not necessarily predictive of a couple‟s social status prospects, the husband‟s job
at the time of marriage indexes several dimensions that might be important for early marital
interaction and the probability of marital success. Most obviously, there are occupational
differences in the income available for coping with the financial strains of the early years of
marriage. Furthermore, we might expect occupational differences in marital instability to the
extent that occupational classes differ with respect to the traditionalist of role expectations or the
acceptability of divorce. We can also identify those couples whose marriages began when the
husband was in school or in the armed forces, circumstances that are sometimes regarded as in
propitious beginnings for a marriage.
2. OBJECTIVES:
In the present research the role of marital adjustment among serving and non-serving
married couples in the following context.
1. To study the relationship between Male and female married couples on Marital adjustment.
2. To examine the interactive effect of Marital adjustment among Serving and non-serving
married couples.
3. To examine the relative effects of Marital adjustment among less than and more than marital
duration of married life.
4. To study of relative effect of Marital adjustment among Types of Sex, Types of status and
Types of marital duration.
3.0: METHODS AND MATIRIALS:
3.1: Sample:
For the purpose of the present research, a sample consisting of 160, respondents were
selected as a final sample from Serving and non-serving less and more than 10 years marrrage
completed person, marital duration were considered in the group of Male and female and
married couples of Anand district of Gujarat state taken only.

The International Journal of Indian Psychology: Volume: 01 | Issue: 03 | ISSN 2348-5396
© 2014 www.ijip.in April – June 2014 10 | P a g e
3.2: Tools: following tools were used
For the collection of the data, various research tools have, been used in the related
studies. Researchers have collected the information regarding Marital Adjustment.
3.1.1: Personal data sheet:
For information (Dependents variables and Independent variables) Marital Adjustment regarding
age, family, area, marriage date, duration marriage, sex, income source of family, type of work
with service and so on were collected data/samples by Personal data sheet.
3.1.2: Used of Scale:
For the present research paper the tool used was Marital Adjustment Questionnaire.
Showing split half and test retest reliability values, The questionnaire consisted of 25 items on
“yes” and “no” answer getting single marks but in case who given “no” answer of statement
number 4-10-19 of 1 marks, in case persons is given “yes” answer so the statement marks is
zero it is range in 25 question to answer of the questionnaire. The questionnaire constructed and
standardizes Dr. Promod kumar and Ku Kanchana Rohatgi (1987) was used.
3.3: Hypotheses: Following major hypothesis tested in present research.
1. There is no significant different between mean score on the marital adjustment of male and
female married couples.
2. There is no significant different between mean score on the serving and non-serving couples
regard Marital adjustment.
3. There is no significant mean difference between the mean score of marital adjustment of less
than and more than 10 years marital duration of married couples.
4. There is no significant interactive relationship between marital adjustment on types of sex
and status of married couples.
5. There is no significant interactive effect on marital adjustment among types of sex and
marital duration of married couples.
6. There is no significant interactive effect on marital adjustment of type of status and types of
marital duration regards married couples.
Split half N=60 r-value-0.49 Index reliability0.70
Test retest N=60 r-value-0.71 Index reliability0.84

The International Journal of Indian Psychology: Volume: 01 | Issue: 03 | ISSN 2348-5396
© 2014 www.ijip.in April – June 2014 11 | P a g e
7. There is no significant interactive effect on marital adjustment of type of sex, types of status
and types of marital duration regards married couples.
3. 4: Variable of the study:
3.4.1: Dependent variables: Total Scores of respondents on marital adjustment
3.4.2: Independent variables: Type of sex, Status and Marital duration as a Independent
variables.
3. 5: Research design: The 2 x 2 x 2 three-factor factorial research design adopted in the study
3. 6: Major statistical techniques used:
To analyze the data with related variables of 2 x 2 x 2 three-factor factorial research design and
the „ANOVA‟ applied in different variables.
4.: RESULTS AND DISCUSSION:-
The scores on Marital adjustment was analyzed as stated in three-factor factorial research design
and basic satistics is as per below;
Table No.1:
The 2 X 2 X 2 Variables mean difference, ANOVA of Marital adjustment
Source Variables S.S Df M.S. F-Value
A Sex 9.50781 1 9.50781 0.87@
B Status 15.00781 1 15.00781 1.37@
C Marital duration 327.75780 1 327.75780 29.82**
A X B Sex X Status 0.00391 1 0.00391 0.00@
A X C Sex X Marital duration 0.30469 1 0.30469 0.03@
B X C Status X Marital duration 66.30468 1 66.30468 6.03*
A X B X
C
Sex, Status, Marital
Duration
1.80859 1 1.80859 1.64@
Error 0000 1670.75000 152 10.99178 1.00000
Total 00000 2091.44500 159 13.15374 0.00000
‘F” Level of Indication: 6.83 >** 0.01, Levels and 3.93 > *0.05, levels and @N.S significance
Results:

The International Journal of Indian Psychology: Volume: 01 | Issue: 03 | ISSN 2348-5396
© 2014 www.ijip.in April – June 2014 12 | P a g e
Table No.1 that the sex meant by male and female play a very important and crucial role
in marital adjustment of married couples. There are several male and female married couples in
this time provide good environment and given many facilities as well as accommodation to the
couples they may have good aspiration, expectation for bette rment and active participation of
married life and adjustment. It can be seen from Table no1 and the Ho1 tested this observation.
it was found that the (mean ss 9.50781) ‘F’value is 0.87 for the type s of sex. which was
notsignificant of the level. Therefor the abov e, H01 null-hypothesis was acceptance and it was
regards that the married couples of male and female do not have difference in marital
adjustment.
The results presented in table no1, indicate that the marital adjustment of married couples
in connection with status of serving and non serving married couples. it was found that the (mean
ss 15.00781) ‘F’value is 1.37 for the type s of status which was not significant of any level.
Hence, therefor the above, H 02 Null-hypothesis was acceptance and it was regards of serving
and non serving married couples do have not difference in marital adjustments. As per the
scoring pattern the married couple‟s gat higher score indicates higher marital adjustments and
lower level score indicates lower level marital adjustment.
The H 03 tested this observation.it was found that the (mean ss 327.75780) ‘F’value is
29.82 for the type s of marital durations which was significant of 0.01 level. Hence, therefor the
above, H 03 null-hypothesis was rejected and it was held that the marital duration of married
couples as a less than 10 years and more than 10 years experience of married couples do have
difference in marital adjustment. Moreover, this difference is found significant. Hence, the
hypothesis was rejected. It means in the present study it is seen that there is a significant
different in between the married couples of as a less than 10 years and more than 10 years
experience of married couples. As per the scoring pattern, the higher value of the score indicates
higher level of adjustment and lower level score indicates lower level adjustment.
Looking to the above table number 1 it can be observed that the interaction between sex
and status (A X B) both variables found that the (mean ss 0.00391) „F‟ value is 0.00. The „F‟
value was not significant at any level. Therefor the above, H04 null-hypothesis was accepted
and regard at per that both the groups is differ on marital adjustments scores.
H 05 : There is no significant mean difference between (A X C) interactive effect of
types of sex and types of marital duration of married couples on marital adjustment,. Looking to

The International Journal of Indian Psychology: Volume: 01 | Issue: 03 | ISSN 2348-5396
© 2014 www.ijip.in April – June 2014 13 | P a g e
the above table number 1 , it can be observed that the interaction between types of sex and types
of marital duration. Both variables found that the (mean ss 0.30469) „F‟ value is 0.03. The „F‟
value was not significant at any level. Therefor the above, H5 null-hypothesis was accepted and
regard at per that both the groups is differ on marital adjustment scores.
The H 0 6 tested this observation.it was found that the (mean ss 66.30468) ‘F’value is
6.03 for the types of status and types of marital durations (B X C) which was significant of 0.01
level. Hence, therefor the abov e, H 0 6 null-hypothesis was rejected and it was held that the
status and types of marital durations ( B X C) of married couples as a serving and non serving as
well as less than 10 years and more than 10 years experience of married couples do have
difference in marital adjustment. Moreover, this difference is found significant. Hence, the
hypothesis was rejected. It means in the present study it is seen that there is a significant
different in between the married couples. As per the scoring pattern, the higher value of the score
indicates higher level of adjustment and lower level score indicates lower level adjustment.
H 07: There is no significant mean difference between (A X B X C) interactive effect of
types of sex, status and types of marital duration of married couples on marital adjustment,.
Looking to the above table number 1, it can be observed that the interaction between types of
sex, status and types of marital duration. Both variables found that the (mean ss 1.80859) „F‟
value is 1.64. The „F‟ value was not significant at any level. Therefor the above, H7 null-
hypothesis was accepted and regard at per that both the groups is differ on marital adjustment
scores.
Summary
The Male and female married couples has not significant influence on Marital adjustment.
The serving and non-serving married couples have not significant influence on marital
adjustment.
Less than 10 and more than 10 years marital duration have significant influence on marital
adjustment.
Types of sex and types of occupational status have not significant interactive interaction on
marital adjustment.
Types of sex and types of marital duration have not significant interactive interaction on
marital adjustment.

The International Journal of Indian Psychology: Volume: 01 | Issue: 03 | ISSN 2348-5396
© 2014 www.ijip.in April – June 2014 14 | P a g e
Types of occupational status and types of marital duration have significant interactive
interaction on marital adjustment.
A type of sex, types of status and marital duration was not significant influence on marital
adjustment.
References:
1. Adital B; Lavee, Y. (2005). Dyadic characteristics of individual attributes: attachment,
neuroticism, and their relations to marital quality and closeness. American Journal of
Orthopsychiatry, 4, 621.
2. Baniasadi, H. (2002). The study of some social and personal factors on marital
adjustment. Human science magazine, special edition for psychology, 8-20.
3. Campbell, J. L., & Snow, B. M. (1992). Gender role conflict and family environment as
predictors of men’s marital satisfaction. Journal of Family Psychology, 6, 84-87.
4. Fatehizadeh, M. (2005). The study of the relationship between pre-marriage factors with
marital satisfaction, research- family quarterly periodical, 1st number, 2nd year.
5. Makvana S.M.(1989): A study of marital adjustment and sexual satisfaction among
married couples : An unpublished dissertation of Sardar Patel university
Vallabhvidyanagar Anand pp 1 to 190
6. http://www.ukessays.com/essays/psychology

The International Journal of Indian Psychology: Volume: 01 | Issue: 03 | ISSN 2348-5396
© 2014 www.ijip.in April – June 2014 15 | P a g e
Healthy Practices in Teaching & Learning with Information Technology, and Evaluation
Method in Classroom
Mr. Rajendrakumar Muljibhai Parmar,* Dr. S. M. Makvana**
Abstract: -
Thousands of candles can be light from a single candle, and the life of candle will not be
reduced. Happiness never decreases by being sharing. One of the most satisfying aspects of
teaching at the college or university level may be found in the mentoring connection that faculty
members can develop with their students. A good mentoring connection can be what is
sometimes called a "peak experience" for both mentor and student. A sharing of something
unique that no one else may experience in quite the same way. The student experiences an
acceptance of ideas and contributions that may be unequalled in previous life experience.
Although there has been a strong move forward to get educational technology into the
hands of teachers and students, many barriers to implementation still exist.
The integration of technology into the curriculum will not succeed without giving
teachers sufficient time to practice, explore, conceptualize, and collaborate.
Professional development activities may not provide ongoing, hands-on training for
teachers or practical strategies for implementing technology into lesson plans. Initial technology
funding may not be sustained and thus not capable of providing upgrades, maintenance, and
ongoing professional development. Fortunately, these obstacles can be addressed and overcome.
This Critical Issue provides practical information for promoting technology use in schools,
college, and university.
Introduction
Relationships and the Making of Meaning
Relationships are as essential to teaching as the flour in the cake. The reason that we
often fail to appreciate the importance of relationships is that we have inherited misconceptions
about teaching, about learning and about the nature of the mind.
*Assistant Professor, Shree J M Patel Institute of Social Work and Applied Arts, APMS Campus
In Front of Near New Bus Stand, Anand, Gujarat, India
**Associate Professor, Department of Psychology, Sardar Patel University, Vallabhvidyanagar,
Gujarat-388120
The International Journal of Indian Psychology: Volume: 01 | Issue: 03 | ISSN 2348-5396
© 2014 www.ijip.in April – June 2014 16 | P a g e
Now we are equally certain that the mind is a kind of computer and the teacher's task is to
program it. As long as the students' circuits are not fried from partying the night before,
information can be fed to them at a reasonable rate and they should be able to process it.
Relationships and the Process of Learning
Second argument for good relationships is based on the contextual nature of the learning
process. There is recent evidence that we do not learn isolated facts that are stored away in our
heads like books on a library shelf; we learn them along with the context in which they are
encountered.
Creating Good Relationships
How do you encourage relationships that lead to the most effective teaching and
learning? Key features underlying the agreement are mutual respect; shared responsibility for
learning and mutual commitment to goals; effective communication and feedback; cooperation
and willingness to negotiate conflicts and a sense of security in the classroom.
Role of a Mentor
Providing academic help
Providing career help in study
Providing technological support
It is common to hear the mentor described as:
Guide
Role model
Advocate
Friend
Coach
Primary role of the mentor
o Establish mutual trust and respect.
o Establish a positive, personal relationship with a mentee.
o Maintain regular interaction and consistent support.
o Have fun and enjoy the experience.
Help a mentee to develop or begin to develop life skills.
o Work with your mentee to accomplish specific goals such as improved grades, time
management, school attendance, self-esteem, and confidence.

The International Journal of Indian Psychology: Volume: 01 | Issue: 03 | ISSN 2348-5396
© 2014 www.ijip.in April – June 2014 17 | P a g e
o Instill the framework for developing broader life-management skills (i.e., decision-
making, goal setting, conflict resolution, money management, etc.).
Assist a mentee in obtaining additional resources.
o Provide awareness of community, educational, and economic resources available to
youth and their families and how to access these resources.
o Act as a guide, advocate, "coach" and role model.
o Avoid acting as a professional case manager. View the role of mentor as a friend
rather than a counselor.
Increase the mentee's ability to interact with people from various backgrounds
(cultural, racial, socioeconomic, etc.).
o Respect and explore differences among people from various backgrounds.
o Introduce the mentee to different environments (i.e., workplace versus school setting).
Discus differences in behavior, attitude, and style of dress.
Keep in mind that each mentor-mentee match is unique and will result in unique
experiences.
Technology in the classroom
There are various types of technologies currently used in traditional classrooms. Among these
are:
Computer in the classroom: Having a computer in the classroom is an asset to any
teacher. With a computer in the classroom, teachers are able to demonstrate a new lesson,
present new material, illustrate how to use new programs, and show new websites.
Class website: An easy way to display your student's work is to create a web page
designed for your class. Once a web page is designed, teachers can post homework
assignments, student work, famous quotes, trivia games, and so much more. In today's
society, children know how to use the computer and navigate their way through a
website, so why not give them one where they can be a published author. Just be careful
as most districts maintain strong policies to manage official websites for a school or
classroom. Also, most school districts provide teacher WebPages that can easily be
viewed through the school district's website.
Class blogs and wikis: There are a variety of Web 2.0 tools that are currently being
implemented in the classroom. Blogs allow for students to maintain a running dialogue,
The International Journal of Indian Psychology: Volume: 01 | Issue: 03 | ISSN 2348-5396
© 2014 www.ijip.in April – June 2014 18 | P a g e
such as a journal, thoughts, ideas, and assignments that also provide for student comment
and reflection. Wikis are more group focused to allow multiple members of the group to
edit a single document and create a truly collaborative and carefully edited finished
product.
Wireless classroom microphones: Noisy classrooms are a daily occurrence, and with
the help of microphones, students are able to hear their teachers more clearly. Children
learn better when they hear the teacher clearly. The benefit for teachers is that they no
longer lose their voices at the end of the day.
Mobile devices: Mobile devices such as clickers or Smartphone can be used to enhance
the experience in the classroom by providing the possibility for professors to get
feedback.
Smart Boards: An interactive whiteboard that provides touch control of computer
applications. These enhance the experience in the classroom by showing anything that
can be on a computer screen. This not only aids in visual learning, but it is interactive so
the students can draw, write, or manipulate images on the Smart Board.
Online media: Streamed video websites can be utilized to enhance a classroom lesson
(e.g. United Streaming, Teacher Tube, etc.)
Benefits
Educational technology is intended to improve education over what it would be without
technology. Some of the claimed benefits are listed below:
Easy-to-access course materials. Instructors can post the course material or important
information on a course website, which means students can study at a time and location
they prefer and can obtain the study material very quickly
Student motivation. Computer-based instruction can give instant feedback to students
and explain correct answers. Moreover, a computer is patient and non-judgmental, which
can give the student motivation to continue learning. According to James Kulik, who
studies the effectiveness of computers used for instruction, students usually learn more in
less time when receiving computer-based instruction and they like classes more and
develop more positive attitudes toward computers in computer-based classes. The
American educator, Cassandra B. Whyte, researched and reported about the importance
of locus of control and successful academic performance and by the late 1980s, she wrote

The International Journal of Indian Psychology: Volume: 01 | Issue: 03 | ISSN 2348-5396
© 2014 www.ijip.in April – June 2014 19 | P a g e
of how important computer usage and information technology would become in the
higher education experience of the future.
Wide participation. Learning material can be used for long distance learning and are
accessible to a wider audience.
Improved student writing. It is convenient for students to edit their written work on
word processors, which can, in turn, improve the quality of their writing. According to
some studies, the students are better at critiquing and editing written work that is
exchanged over a computer network with students they know.
Subjects made easier to learn. Many different types of educational software are
designed and developed to help children or teenagers to learn specific subjects. Examples
include pre-school software, computer simulators, and graphics software.
A structure that is more amenable to measurement and improvement of outcomes. With
proper structuring it can become easier to monitor and maintain student work while also
quickly gauging modifications to the instruction necessary to enhance student learning.
Determining Effective Goals for Technology Use
Technology is not transformative on its own. Evidence indicates that when used effectively,
"technology applications can support higher-order thinking by engaging students in authentic,
complex tasks within collaborative learning contexts" (Means, Blando, Olson, Middleton,
Morocco, Remz, & Zorfass, 1993). Instead of focusing on isolated, skills-based uses of
technology, schools should promote the use of various technologies for sophisticated problem-
solving and information-retrieving purposes (Means & Olson, 1995).
In other words, new technology can be an appropriate vehicle for promoting meaningful,
engaged learning. It allows students to work on authentic, meaningful, and challenging problems,
similar to tasks performed by professionals in various disciplines; to interact with data in ways
that allow student-directed learning; to build knowledge collaboratively; and to interact with
professionals in the field. Technologies also can be used to promote the development of higher-
order thinking skills and allow opportunities for teachers to act as facilitators or guides and often
as a co-learner with the students.
In the classroom, teachers can develop a countless of technology-supported engaged learning
projects that enable students to solve real-world problems, retrieve information from online
resources, and connect with experts. Such projects can be adapted for all grade levels. For

The International Journal of Indian Psychology: Volume: 01 | Issue: 03 | ISSN 2348-5396
© 2014 www.ijip.in April – June 2014 20 | P a g e
example, a teacher can share an author's Web site with young children to help them understand
how writers make their stories interesting and fun to read. Middle-school students can use e-mail
and teleconferencing to connect with experts to solve science problems. High-school students
can develop a mock technology company and use the Internet, scanners, and presentation
software to plan and deliver speeches to stockholders.
Accepting New Roles for Teachers in the Classroom
Technology integration brings changes to teachers' instructional roles in the classroom. The
teacher's roles in a technology-infused classroom often shift to that of a facilitator or coach rather
than a lecturer (Henriquez & Riconscente, 1998). Technology use also tends to foster
collaboration among students (Tinzmann, 1998). Schaffer and Logan (1999) document these and
other changes in the dynamics of the classroom.
As students become more self-directed, teachers who are not accustomed to acting as facilitators
or coaches may not understand how technology can be used as part of activities that are not
teacher-directed. This situation may be an excellent opportunity for the teacher not only to learn
from the student but also to model being an information seeker, lifelong learner, and risk taker.
Kozma and Schank (1998) note, "Teachers must become comfortable letting students move into
domains of knowledge where they themselves lack expertise, and they must be able to model
their own learning process when they encounter phenomena they do not understand or questions
they cannot answer"
Coaching Teachers at Different Skill Levels
A school may be home to educators with a wide variety of skill levels in technology: computer
gurus anxious to put the capabilities of the newest hardware and software to use; moderate
technocrats, who implement basic computerized tasks; and the technologically limited. The
problem faced by administrators and professional development staff of such a school is
providing adequate training to bring all teachers to an adequate level of technical expertise so
learning goals can be met.
Because teachers learn at different rates and have individual needs when mastering new skills,
technology training should be flexible yet cover a comprehensive set of skills. Before
professional development is designed, each teacher’s current level of technology skills should be
determined by using appropriate instruments, such as the Educational Technology Foundations
for All Teachers developed as part of the National Educational Technology Standards. These

The International Journal of Indian Psychology: Volume: 01 | Issue: 03 | ISSN 2348-5396
© 2014 www.ijip.in April – June 2014 21 | P a g e
standards can be used to determine the skill level of individual teachers and their needs for
professional development. Self-assessment directly related to the technology learning goals set
by the school also is appropriate and effective.
Technology Coordinator:
Be available for troubleshooting and just-in-time support, or for securing further technical
assistance.
Periodically check all technology for problems; complete repairs as needed.
Determine alternative configurations for computers depending on instructional goals.
(For example, pool all grade-level computers to create a lab, or develop mobile
computers to meet the needs of different classes at different times.)
Develop flexible plans for classrooms' Internet use based on access points.
Participate in the planning and implementation stages for technology use. Be aware of
classroom needs to incorporate technology into the curriculum.
Develop strategies for training teachers for using technology that will meet the school's
educational goals for the use of technology.
Design timely, teacher-responsive support for technology, such as workshops, coaching,
and mentoring.
Identify each teacher's skill level with technology using assessment instruments such as
the Professional Competency Continuum Assessment Tool.
Develop the knowledge and skills to help teachers at all competency levels improve their
ability to integrate technology to promote learning.
Work individually with teachers in the classroom. Provide adequate time and support for
each teacher's individualized learning.
Identify additional technology professional development opportunities for teachers.
Help teachers work in teams to identify, evaluate, and select appropriate software relating
to their content areas and learning goals. Provide guidelines on how to evaluate learning
software.
Provide a professional development corner in the school library or faculty room where
reviewed software is cataloged and available to teachers.
Encourage other teachers, students, and community members to volunteer their
technology skills for minor troubleshooting.

The International Journal of Indian Psychology: Volume: 01 | Issue: 03 | ISSN 2348-5396
© 2014 www.ijip.in April – June 2014 22 | P a g e
Continue to update technology knowledge and skills through ongoing professional
development.
Teachers:
Determine the purpose of using technology in the classroom, as determined by the
specified educational goals. Is it used to support inquiry, enhance communication, extend
access to resources, guide students to analyze and visualize data, enable product
development, or encourage expression of ideas? After the purpose is determined, select
the appropriate technology and develop the curricula. Create a plan for evaluating
students' work and assessing the impact of the technology.
Coordinate technology implementation efforts with core learning goals, such as
improving students' writing skills, reading comprehension, mathematical reasoning, and
problem-solving skills.
Collaborate with colleagues to design curricula that involve students in meaningful
learning activities in which technology is used for research, data analysis, synthesis, and
communication.
Promote the use of learning circles, which offer opportunities for students to exchange
ideas with other students, teachers, and professionals across the world.
Encourage students to broaden their horizons with technology by means of global
connections, electronic visualization, electronic field trips, and online research and
publishing.
Ensure that students have equitable access to various technologies (such as presentation
software, video production, Web page production, word processing, modeling software,
and desktop publishing software) to produce projects that demonstrate what they have
learned in particular areas of the curriculum.
Encourage students to collaborate on projects and to use peer assessment to critique each
other's work.
In addition to standardized tests, use alternative assessment strategies that are based on
students' performance of authentic tasks. One strategy is to help students develop
electronic portfolios of their work to be used for assessment purposes.

The International Journal of Indian Psychology: Volume: 01 | Issue: 03 | ISSN 2348-5396
© 2014 www.ijip.in April – June 2014 23 | P a g e
Ensure that technology-rich student products can be evaluated directly in relation to the
goals for student outcomes, rather than according to students' level of skill with the
technology.
Create opportunities for students to share their work publicly--through performances,
public service, open houses, science fairs, and videos. Use these occasions to inform
parents and community members of the kinds of learning outcomes the school is
providing for students.
Learn how various technologies are used today in the world of work, and help students
see the value of technology applications. (Pertinent online information can be found in
the 1998-99 Occupational Outlook Handbook and the Bureau of Labor Statistics Career
Information.)
Participate in professional development activities to gain experience with various types of
educational technology and learn how to integrate this technology into the curriculum.
Develop strategies for using technology to improve student achievement.
Develop strategies for using technology to enhance engaged learning for at-risk students.
Develop an individual professional development plan that provides for acquisition of
technology skills and integration of technology into classroom projects. This plan can be
based on documents such as Core Technology Competencies and Skills, Curriculum,
Learning, and Assessment Competencies and Skills, Classroom and Instructional
Management Competencies and Skills, Recommended Foundations in Technology for
All Teachers, Internet Skills Rubrics, and the Professional Competency Continuum
Online Assessment Tool.
Form study groups to explore issues, share assessments of student work, and identify
strategies for improving technology use.
Engage in collaborative planning and evaluation.
Take on new and expanded roles as part of professional development. Such roles might
include devising individual professional development plans, acting as peer advisors and
mentors, collecting data, and forming study groups.
Pursue innovative ideas for using community resources to provide and support
professional development in technology use.

The International Journal of Indian Psychology: Volume: 01 | Issue: 03 | ISSN 2348-5396
© 2014 www.ijip.in April – June 2014 24 | P a g e
Visit other schools and classrooms to see how technology has been integrated effectively
into the curriculum. Or virtually visit classrooms by viewing CD-ROMs (such as the
Captured Wisdom CD-ROM Library, produced by the North Central Regional
Technology in Education Consortium), videotapes of technology use in schools, or
Internet sites relating to technology integration in content areas (such as the Handbook of
Engaged Learning Projects).
Use telecommunications (such as e-mail lists and mail groups) to become part of a
community of teachers. Form peer groups across schools, and join subject-matter
networks and collaborative to communicate about technology.
At faculty meetings, share ideas for using technology within different content areas.
Attend and present at conferences to learn more and share ideas about teaching with
technology.
Become familiar with the Technology Foundation Standards for All Students, which were
developed as part of the National Educational Technology Standards by the International
Society for Technology in Education. Determine how these standards can promote
students' technology use in the classroom.
Become aware of the Educational Technology Foundations for All Teachers, also
developed as part of the National Educational Technology Standards. Take steps to meet
these standards.
Actively participate in professional development activities to increase technology use.
Develop an individual professional development plan that provides for acquisition of
technology skills and integration of technology into classroom projects. This plan can be
based on documents such as Core Technology Competencies and Skills, Curriculum,
Learning, and Assessment Competencies and Skills, and Classroom and Instructional
Management Competencies and Skills.
Search the NETS database of lessons and units for grade-specific activities that integrate
technology into content-area instruction.
Develop strategies for using technology to improve student achievement.
Develop strategies for using technology to enhance engaged learning for at-risk students
and using technology to enhance literacy instruction.

The International Journal of Indian Psychology: Volume: 01 | Issue: 03 | ISSN 2348-5396
© 2014 www.ijip.in April – June 2014 25 | P a g e
Design class projects in which students use technology for inquiry, research, design, data
synthesis, communication, and development.
Focus on student projects with authentic uses of technology for real-world application in
the classroom.
Promote cooperative learning in the classroom so that students work together with
technology and learn from each other.
If the classroom technology is limited, develop teaching strategies that involve small
groups of students using the technology at different times.
Use technology, Internet sites, and software in the classroom; reflect on the degree of
success in using these strategies to meet learning goals.
Collaborate with other teachers, and work in teams to design and implement technology-
supported projects.
Use the Learning with Technology Profile Tool to compare current instructional practices
with a set of indicators for engaged learning and high-performance technology.
Promote the intersection of learning and technology, so that engaged learning and high
technology performance contribute to the students' technology effectiveness.
Visit other schools and classrooms to see how technology has been integrated effectively
into the curriculum.
Form study groups to explore issues, share assessments of student work, and identify
strategies for improving technology use.
Work in teams to identify, evaluate, and select software that is appropriate to the
curriculum and the school's learning goals.
Gain practice in evaluating online educational materials for use in instruction.
At faculty meetings, share ideas for using technology within different content areas.
Attend and present at conferences to learn more and share ideas about teaching with
technology.
Parents and Community Members:
Support technology implementation and the professional development it requires.
Participate on technology-planning teams; provide perspectives on real-world needs.
Join in fundraising and lobbying efforts. Help identify potential sources of technology
funding.

The International Journal of Indian Psychology: Volume: 01 | Issue: 03 | ISSN 2348-5396
© 2014 www.ijip.in April – June 2014 26 | P a g e
Suggest possible collaborations, such as with a local university or business, and provide
contacts to help the school develop them.
Volunteer time to allow teachers to engage in professional development activities.
Join in planning for technology implementation and the professional development it
requires; provide perspectives on real-world needs.
Join in fund-raising efforts, lobbying, and identifying potential sources of funding.
Suggest possible collaborations, such as with a local university, and use contacts to help
the school develop them.
Volunteer time to allow teachers to engage in professional development activities.
Parents should understand the importance, benefits, and issues associated with
informational uses of technology in schools.
Parents share with their children the importance and concerns they have about the uses of
technology.
Parents are involved in school activities, including helping students become more
successful users of technology.
Parents advocate for better educational opportunities for their children, including better
access and use of technology.
Parents model and provide guidance to quality uses of technology outside of school,
including adhering to copyright laws and understanding the benefits and challenges of the
vast and diverse materials available on the Internet.
National Educational Technology Standards for Teachers: -
They are especially relevant for teachers considering the following technology action options:
Teachers understand and support the importance of students learning to use educational
technology as an important component of their preparation for further education, work,
and life in general.
Teachers demonstrate their support of technology use by developing their own skills,
knowledge, and strategies necessary to model effective uses of technology.
Teachers learn and use effective ways to integrate technology into their curriculum and
use technology in ways that enhance instructional opportunities and successes for all
students.

The International Journal of Indian Psychology: Volume: 01 | Issue: 03 | ISSN 2348-5396
© 2014 www.ijip.in April – June 2014 27 | P a g e
Teachers learn uses of technology that provide assessment feedback to parents, students,
and the teacher about how well the student is learning, and then use that data to improve
learning productivity.
Teachers understand and instill into their students the social ethical, legal and human
issues surrounding the uses of technology
Students
Student standards have been developed by the International Society for Technology (ISTE),
which recommends students' use of technology should reflect the following skills and operations:
Basic operations and concepts
o Students demonstrate a sound understanding of the nature and operation of
technology systems.
o Students are proficient in the use of technology.
Social, ethical, and human issues
o Students understand the ethical, cultural, and societal issues related to technology.
o Students practice responsible use of technology systems, information, and
software.
o Students develop positive attitudes toward technology uses that support lifelong
learning, collaboration, personal pursuits, and productivity.
Technology productivity tools
o Students use technology tools to enhance learning, increase productivity, and
promote creativity.
o Students use productivity tools to collaborate in constructing technology-
enhanced models, prepare publications, and produce other creative works.
Technology communications tools
o Students use telecommunications to collaborate, publish, and interact with peers,
experts, and other audiences.
o Students use a variety of media and formats to communicate information and
ideas effectively to multiple audiences.
Technology research tools
o Students use technology to locate, evaluate, and collect information from a variety
of sources.

The International Journal of Indian Psychology: Volume: 01 | Issue: 03 | ISSN 2348-5396
© 2014 www.ijip.in April – June 2014 28 | P a g e
o Students use technology tools to process data and report results.
o Students evaluate and select new information resources and technological
innovations based on the appropriateness for specific tasks.
Technology problem-solving and decision-making tools
o Students use technology resources for solving problems and making informed
decisions.
o Students employ technology in the development of strategies for solving problems
in the real world.
Goals:
The school's technology plan clearly identifies learning goals to be achieved through
technology.
Technology supports the instructional learning goals. It is integrated into instruction in
meaningful ways so that it contributes to the attainment of high standards by all students.
Technology is used for challenging, long-term projects that promote students' higher-
order thinking skills instead of merely for drill-and-practice programs to improve basic
skills.
All students have opportunities to use a variety of technologies to support their work on
authentic tasks.
All technology is in operable condition and is being used effectively and to the maximum
extent possible.
Just-in-time technology support is available for teachers and students.
There is flexibility in managing the technology to ensure that all students and teachers
have equity of access.
Professional development is considered an important part of the technology plan and the
technology budget.
The professional development component of the technology plan ensures that every
teacher has allotted time throughout the school year for professional development relating
to technology and its integration into the classroom.
Professional development in technology is directly applicable to the classroom situation.
A diverse portfolio is in place to ensure that funding is available to support technology
and ongoing professional development.

The International Journal of Indian Psychology: Volume: 01 | Issue: 03 | ISSN 2348-5396
© 2014 www.ijip.in April – June 2014 29 | P a g e
Evaluation
Ongoing evaluation of technology applications and student achievement, based on the overall
educational goals that were decided on, helps to ensure that the technology is appropriate,
adaptable, and useful. Such evaluation also facilitates change if learning goals are not being met.
Administrators can acknowledge and recognize incremental improvements in student outcomes
as well as changes in teachers' curricula and practices. Gradual progress, rather than sudden
transformation, is more likely to result in long-term change.
Baker (1999) emphasizes that besides being a means to collect, interpret, and document findings,
evaluation is a planning tool that should be considered at the beginning of any technology
innovation. She adds that the overall focus of evaluation is student learning. Heinecke, Blasi,
Milman, and Washington (1999) note that multiple quantitative and qualitative evaluation
measures may be necessary to document student learning outcomes. To ensure that evaluation
procedures are adequately designed and carried out, administrators and teachers may wish to
consult evaluation sources such as An Educator's Guide to Evaluating the Use of Technology in
Schools and Classrooms.
All of these issues are important in using technology to improve student achievement.
Educational technology is not, and never will be, transformative on its own. But when decisions
are made strategically with these factors in mind, technology can play a critical role in creating
new circumstances and opportunities for learning that can be rich and exciting. "At its best,
technology can facilitate deep exploration and integration of information, high-level thinking,
and profound engagement by allowing students to design, explore, experiment, access
information, and model complex phenomena," note Goldman, Cole, and Syer (1999). These new
circumstances and opportunities—not the technology on its own—can have a direct and
meaningful impact on student achievement.
Encourage SEAs and LEAs to set aside 10 percent to 15 percent of funds to evaluate their
technology grants.
Provide a model comprehensive plan for states and districts to consider as they design
their own evaluation plans to include a statement of purpose, identifies clear objectives,
demonstrates valid approaches to research design, and specifies appropriate time frames
for analysis and reporting.
Support efforts to develop shared instruments and sets of common data elements.

The International Journal of Indian Psychology: Volume: 01 | Issue: 03 | ISSN 2348-5396
© 2014 www.ijip.in April – June 2014 30 | P a g e
Develop a database of "best practices" for technology programs and applications that
have shown to support student achievement in scientifically based research studies.
Develop a list of highly qualified researchers and evaluators from whom SEAs and LEAs
can obtain guidance.
Explore the development of validated instruments that could be shared across states.
Review a range of national and state educational standards for student learning (such as
those listed in Developing Educational Standards). Seek out content standards that
articulate the goals for students to achieve.
Determine key aspects of national and state student learning standards for the school or
district to focus on as educational goals. Involve teachers in this process to ensure that
their expertise and opinions are considered.
Charge cross-disciplinary groups of teachers and technology coordinators with finding
new ways that technology can help students to achieve those learning goals.
Collaborate to create a technology plan for the school. (Refer to the Critical Issue
"Developing a School or District Technology Plan.")
Set one-, three-, and five-year goals for improving student learning through technology.
Identify specific curricula, practices, skills, attitudes, and policies that can be enhanced
through the use of technology to foster significant improvement in the character and
quality of student learning. (For example, if the district is interested in improving
students' writing performance, word processing with an emphasis on revision and editing
should become a salient part of the curriculum across disciplines.)
Identify classrooms in the district where students are already producing exemplary work
using technology; or visit virtual classrooms by viewing CD-ROMs videotapes of
technology use in schools (such as the Learning With Technology videotapes), or Internet
sites relating to technology integration in content areas (such as lessons using the
Amazing Picture Machine and the Handbook of Engaged Learning Projects). Build a
database or other resource that allows the school to share these best practices with school
staff and the community in general.
Be aware of state technology plans, district technology plans, and related policies. Ensure
that the school is in compliance.

The International Journal of Indian Psychology: Volume: 01 | Issue: 03 | ISSN 2348-5396
© 2014 www.ijip.in April – June 2014 31 | P a g e
Become familiar with factors that affect the effective use of technology for teaching and
learning. Learn about research studies conducted in real school settings that describe how
technology use is influenced by teachers' experience with technology, adequacy of
release time, professional development opportunities, and length of class periods.
Ensure that teachers are aware of the value of technology for all students, especially those
considered at risk of educational failure. (Refer to the Critical Issue "Using Technology
to Enhance Engaged Learning for At-Risk Students.")
Ensure that all students have equitable access to effective uses of technology. Develop
strategies for addressing access inequities, strategies for addressing type-of-use
inequities, and strategies for addressing curriculum inequities.
Provide ongoing, extensive, and research-based professional development opportunities
and technical support to help teachers use technology to develop meaningful instructional
strategies for students. (Refer to the Critical Issues "Realizing New Learning for All
Students Through Professional Development" and "Finding Time for Professional
Development.")
Ensure that new, research-based approaches to professional development are consistent
with the National Staff Development Council (NSDC) standards for staff development.
Provide incentives, structures, and time for teachers to participate in highly effective staff
development (such as study groups and action research) to help them integrate
technology into their teaching and learning.
Find ways to make appropriate structural changes in the school day and class scheduling
to support engaged learning with technology. Consider block scheduling as a possibility.
Educate parents about new assessment methods that enable teachers and administrators to
make judgments about the effectiveness of technology in supporting student learning.
Use appropriate evaluation procedures and tools to determine the impact of technology
use on student achievement based on the learning goals that were set. Consult evaluation
sources such as An Educator's Guide to Evaluating the Use of Technology in Schools and
Classrooms. Share findings with the community.
Criticism
Although technology in the classroom does have many benefits, there are clear
drawbacks as well. Lack of proper training, limited access to sufficient quantities of a

The International Journal of Indian Psychology: Volume: 01 | Issue: 03 | ISSN 2348-5396
© 2014 www.ijip.in April – June 2014 32 | P a g e
technology, and the extra time required for many implementations of technology are just a few of
the reasons that technology is often not used extensively in the classroom.
Similar to learning a new task or trade, special training is vital to ensuring the effective
integration of classroom technology. Since technology is not the end goal of education, but rather
a means by which it can be accomplished, educators must have a good grasp of the technology
being used and its advantages over more traditional methods. If there is a lack in either of these
areas, technology will be seen as a hindrance and not a benefit to the goals of teaching.
Another difficulty is introduced when access to a sufficient quantity of a resource is
limited. This is often seen when the quantity of computers or digital cameras for classroom use is
not enough to meet the needs of an entire classroom. It also occurs in less noticed forms such as
limited access for technology exploration because of the high cost of technology and the fear of
damages. In other cases, the inconvenience of resource placement is a hindrance, such as having
to transport a classroom to a computer lab instead of having in-classroom computer access by
means of technology such as laptop carts.
Technology implementation can also be time consuming. There may be an initial setup or
training time cost inherent in the use of certain technologies. Even with these tasks
accomplished, technology failure may occur during the activity and as a result teachers must
have an alternative lesson ready. Another major issue arises because of the evolving nature of
technology. New resources have to be designed and distributed whenever the technological
platform has been changed. Finding quality materials to support classroom objectives after such
changes is often difficult even after they exist in sufficient quantity and teachers must design
these resources on their own.
References
1. Technological changes in Education, 1st Edition 2007 BySanjay Prakash Sharma, Vista
International Publishing House, V-196, Near Shiv Sadhan Mandir, C-11, Yamuna Vihar
Delhi- 110053
2. Social Work Education in India by Singh, Surendra, Srivastava, S.P,New Royal Book,
Lacknow
3. Women Education, Employment and Gender-DiscriminationbyDr. Talwar Sabana, Serials
Pub. New Delhi
4. Adoption of Health Technologies in Indiaby Gupta, Indrani, Sage Pub, New Delhi

The International Journal of Indian Psychology: Volume: 01 | Issue: 03 | ISSN 2348-5396
© 2014 www.ijip.in April – June 2014 33 | P a g e
5. Educational and communication for Development – 2nd
editionBy Dahama OP, Oxford &
IBH, New Delhi

The International Journal of Indian Psychology: Volume: 01 | Issue: 03 | ISSN 2348-5396
© 2014 www.ijip.in April – June 2014 34 | P a g e
Some Case Studies of AIDS/HIV Patients in India
Mr. Ankit P. Patel*
Introduction
The present study deals with the mental health of AIDS patients. Therefore it is essential
that we should have some clear ideas about the scientific nature of AIDS and mental health.
Human Immunodeficiency Virus Infection / Acquired Immunodeficiency Syndrome
(HIV/AIDS) is a disease of the human immune system caused by infection with human
immunodeficiency virus (HIV). During the initial infection, a person may experience a brief
period of influenza-like illness. This is typically followed by a prolonged period without
symptoms. As the illness progresses, it interferes more and more with the immune system,
making the person much more likely to get infections, including opportunistic infections and
tumors that do not usually affect people who have working immune systems. HIV is transmitted
primarily via unprotected sexual intercourse (including anal and even oral sex), contaminated
blood transfusions, hypodermic needles, and from mother to child during pregnancy, delivery, or
breastfeeding. Some bodily fluids, such as saliva and tears, do not transmit HIV. Prevention of
HIV infection, primarily through safe sex and needle-exchange programs, is a key strategy to
control the spread of the disease. There is no cure or vaccine; however, antiretroviral treatment
can slow the course of the disease and may lead to a near-normal life expectancy. While
antiretroviral treatment reduces the risk of death and complications from the disease, these
medications are expensive and may be associated with side effects.
*MA Student Department of Psychology, Sardar Patel University, Vallabh Vidhya Nagar,
Anand, Gujarat

The International Journal of Indian Psychology: Volume: 01 | Issue: 03 | ISSN 2348-5396
© 2014 www.ijip.in April – June 2014 35 | P a g e
Acute infection:
The initial period following the contraction of HIV is called acute HIV, primary HIV or
acute retroviral syndrome. Many individuals develop an influenza-like illness or a
mononucleosis-like illness 2–4 weeks post exposure while others have no significant symptoms.
Symptoms occur in 40–90% of cases and most commonly include fever, large tender lymph
nodes, throat inflammation, a rash, headache, and/or sores of the mouth and genitals. The rash,
which occurs in 20–50% of cases, presents itself on the trunk and is maculopapular, classically.
Some people also develop opportunistic infections at this stage. Gastrointestinal symptoms such
as nausea, vomiting or diarrhea may occur, as may neurological symptoms of peripheral
neuropathy or Guillain-Barre syndrome. The duration of the symptoms varies, but is usually one
or two weeks.
Due to their nonspecific character, these symptoms are not often recognized as signs of
HIV infection. Even cases that do get seen by a family doctor or a hospital are often
misdiagnosed as one of the many common infectious diseases with overlapping symptoms. Thus,
it is recommended that HIV be considered in patients presenting an unexplained fever who may
have risk factors for the infection.
AIDS in India:
According to a recent study in the British Medical Journal, India has an HIV/AIDS
population of approximately 1.4-1.6 million people. According to the United Nations 2011 AIDS
report, there has been a 50% decline in the number of new HIV infections in the last 10 years in
India. ―According to the data released by National AIDS Control Organization NACO, India has
demonstrated an overall reduction of 57 percent in estimated annual new Human
immunodeficiency virus (HIV) infections (among adult population) from 0.274 million in 2000
to 0.116 million in 2011, and the estimated number of people living with HIV was 2.08 million
in 2011.
The prevalence estimates reported above are suspect. NACO‘s sentinel survey data
indicates over 5.7 million HIV cases in 2001. In 1987 New Delhi announced a National AIDS
control Program but that organization spent a substantial amount of time arguing that the AIDS
problem in India was overstated.

The International Journal of Indian Psychology: Volume: 01 | Issue: 03 | ISSN 2348-5396
© 2014 www.ijip.in April – June 2014 36 | P a g e
Despite being home to the world‘s third-largest population suffering from HIV/AIDS
(with South Africa and Nigeria having more), the AIDS prevalence rate in India is lower than in
many other countries. In 2007, India‘s AIDS prevalence rate stood at approximately 0.30%—the
89th
highest in the world. The spread of HIV in India is primarily restricted to the southern and
north-eastern regions of the country and India has also been praised for its extensive anti-AIDS
campaign. The US$2.5 billion National AIDS Control Plan III was set up by India in 2007 and
received support from UNAIDS The main factors which have contributed to India‘s large HIV-
infected population are extensive labor migration and low literacy levels in certain rural areas
resulting in lack of awareness and gender disparity. The Government of India has also raised
concerns about the role of intravenous drug use and prostitution in spreading AIDS, especially in
north-east India and certain urban pockets. A recent study published in the British medical
journal ―The Lancet‖ in (2006) reported an approximately 30% decline in HIV infections among
young women aged 15 to 24 years attending prenatal clinics in selected southern states of India
from 2000 to 2004 where the epidemic is thought to be concentrated. The authors cautiously
attribute observed declines to increased condom use by men who visit commercial sex workers
and cite several pieces of corroborating evidence. Some efforts have been made to tailor
educational literature to those with low literacy levels, mainly through local libraries as this is the
most readily accessible locus of information for interested parties. Increased awareness regarding
the disease and citizen‘s related rights is in line with the Universal Declaration on Human Rights.
The estimated adult HIV prevalence was 0.32% in 2008 and 0.31% in 2009. The states
with high HIV prevalence rates include Manipur (1.40%), Andhra Pradesh (0.90%), Mizoram
(0.81%), Nagaland (0.78%), Karnataka (0.63%) and Maharashtra (0.55%).
The adult HIV prevalence in India is declining from estimated level of 0.41% in 2000
through 0.36% in 2006 to 0.31% in 2009. Adult HIV prevalence at a national level has declined
notably in many states, but variations still exist across the states. A decreasing trend is also
evident in HIV prevalence among the young population of 15–24 years. The estimated number
of new annual HIV infections has declined by more than 50% over the past decade.
According to Michel Sidibé, Executive Director of UNAIDS, India‘s success comes from
using an evidence-informed and human rights-based approach that is backed by sustained
political leadership and civil society engagement. India must now strive to achieve universal
access to HIV prevention, treatment, care and support.

The International Journal of Indian Psychology: Volume: 01 | Issue: 03 | ISSN 2348-5396
© 2014 www.ijip.in April – June 2014 37 | P a g e
*HIV statistics, 2011 in India
State Antenatal
clinic HIV
prevalence
2007 (%)
STD clinic
HIV
prevalence
2007 (%)
IDU HIV
prevalence
2007 (%)
MSM HIV
prevalence
2007 (%)
Female sex
worker HIV
prevalence
2007 (%)
A & N
Islands 0.25 1.33 ... ... ...
Andhra
pradesh 1.00 17.20 3.71 17.04 9.74
Arunachal
Pradesh 0.00 0.00 0.00 ... ...
Assam 0.00 0.50 2.41 2.78 0.44
Bihar 0.25 0.40 0.60 0.00 3.40
Chandigarh 0.25 0.42 8.64 3.60 0.40
Chhattisgarh 0.25 3.33 ... ... 1.43
D & N Haveli 0.50 ... ... ... ...
Daman & Diu 0.13 ... ... ... ...
Delhi 0.25 5.20 10.10 11.73 3.15
Goa 0.18 5.60 ... 7.93 ...
Gujarat 0.25 2.40 ... 8.40 6.53
Haryana 0.13 0.00 0.80 5.39 0.91
Himachal
Pradesh 0.00 0.00 ... 5.39 0.87
Jammu &
Kashmir 0.00 0.20 ... ... ...
Jharkhand 0.00 0.40 ... ... 1.09
Karnataka 0.50 8.40 2.00 17.60 5.30
Kerala 0.38 1.60 7.85 0.96 0.87
Lakshadweep 0.00 0.00 ... ... 0.00
Madhya 0.00 1.72 ... ... 0.67

The International Journal of Indian Psychology: Volume: 01 | Issue: 03 | ISSN 2348-5396
© 2014 www.ijip.in April – June 2014 38 | P a g e
Pradesh
Maharashtra 0.50 11.62 24.40 11.80 17.91
Manipur 0.75 4.08 17.90 16.4 13.07
Meghalya- 0.00 2.21 4.17 ... ...
Mizoram 0.75 7.13 7.53 ... 7.20
Nagaland 0.60 3.42 1.91 ... 8.91
Orissa 0.00 1.60 7.33 7.37 0.80
Pondicherry 0.00 3.22 ... 2.00 1.30
Punjab 0.00 1.60 13.79 1.22 0.65
Rajasthan 0.13 2.00 ... ... 4.16
Sikkim 0.09 0.00 0.47 ... 0.00
Tamil Nadu 0.25 8.00 16.80 6.60 4.68
Tripura 0.25 0.40 0.00 ... ...
Uttar Pradesh 0.00 0.48 1.29 0.40 0.78
Uttaranchal 0.00 0.00 ... ... ...
West Bengal 0.00 0.80 7.76 5.61 5.92
*Some areas report an HIV prevalence rate of zero in antenatal clinics. This does not
necessarily mean HIV is absent from the area, as some states report the presence of the virus at
STD clinics and amongst injecting drug users. In some states and territories the average
antenatal HIV prevalence is based on reports from only a small number of clinics.
History:
In 1986, the first known case of HIV was diagnosed by Dr. Suniti Solmon amongst
female sex workers in Chennai. Later that year, sex workers began showing signs of this deadly
disease. At that time, foreigners in India were traveling in and out of the country. It is thought
that these foreigners were the ones responsible for the first infections. By 1987, about 135 more
cases came to light. Among these 14 had already progressed to AIDS. Prevalence in high risk
groups reached above 5% by 1990. As per UNDP‘s 2010 report, India had 2.395 million people
living with HIV at the end of 2009, up from 2.27 million in 2008. Adult prevalence also rose
from 0.29% in 2008 to 0.31% in 2009.

The International Journal of Indian Psychology: Volume: 01 | Issue: 03 | ISSN 2348-5396
© 2014 www.ijip.in April – June 2014 39 | P a g e
In 1986, HIV started its epidermis in India, attacking sex workers in Chennai, Tamil
Nadu. Setting up HIV screening centers was the first step taken by the government to screen its
citizens and the blood bank.
To control the spread of the virus, the Indian government set up the National AIDS
Control Programmers in 1987 to co-ordinate national responses such as blood screening and
health education.
In 1992, the government set up the National AIDS Control Organization (NACO) to
oversee policies and prevention and control programmers‘ relating to HIV and AIDS and the
National AIDS Control Programmers (NACP) for HIV prevention. The State AIDS Control
Societies (SACS) was set up in 25 societies and 7 union territories to improving blood safety.
In 1999, the second phase of the National AIDS Control Programmed (NACP II) was
introduced to decrease the reach of HIV by promoting behavior change. The prevention of
mother-to-child transmission programmed (PMTCT) and the provision of antiretroviral treatment
were materialized.
In 2007, the third phase of the National AIDS Control Programmed (NACP III) targeted
the high-risk groups, conducted outreach programmers, amongst others. It also decentralized the
effort to local levels and non-governmental organizations (NGOs) to provide welfare services to
the affected.
Key Words: - HIV/AIDS, Case Study, Clinical Psychology
REVIEW OF LITERATURE
A: UNAIDS Inter: Agency test team (IATT) on education published a research paper in 2009.
Such research was carried out by IATT for 2010. Global monitoring report on reaching and
teaching the most marginalized. The research was carried out with the aim of improving and
accelerating the education response to HIV and AIDS. Its specific objectives are to encourage
alignment and harmonization within and across agencies to support global and country level
actions.
B: In may 2006 a working group of the unaided (IATT) on education was formed to
support the main streaming of HIV and AIDS in the G.M.R. IATT administration housed in
UNESCO‘s section of HIV and AIDS in the division for the co-ordination of priorities in
education has acted as the agent between IATT and GMR.
The International Journal of Indian Psychology: Volume: 01 | Issue: 03 | ISSN 2348-5396
© 2014 www.ijip.in April – June 2014 40 | P a g e
C: The team of 2010 GMR on reaching and teaching the most marginal has particular
relevance. Children affected by AIDS can face particular challenges in getting educational
opportunities ensuring regular school attendance containing their studies. Teachers are given an
important responsibility in ensuring that children and young people acquire essential knowledge,
skills, and attitudes for HIV prevention.
D: AIDS research alliance help to make HIV/AIDS treatable but 8000people still die of
AIDS every day, while millions more with HIV may lose thrill of their lifespan.
As an independent research organization, AIDS research alliance has moved the science
forward contributing to the approval of today‘s HIV/AIDS treatment. AIDS research alliance
was the first origination to claim that it is possible to cure HIV/AIDS. Today the world is
working to prevent HIV infection. AIDS research alliance is taking steps towards realizing
president OBAMA‘s vision of an ―AIDS free generation‖
OBJECTIVES
1: Main aim of this study is to know about the patient‘s emotional stability, adjustment, and self
concept regarding their mental health.
2: To know about the patient‘s present life style.
3: To study and compare the mental health of male patient and female patient.
4: To know the difference between the personality traits of male and female patient.
5: Massage to whole society that all patient of AIDS require more sympathy, co-operation,
affection, love, and care.
RESEARCH DESIGN
For present research ―MENTAL HEALTH BATTERY OF ARUNKUMAR AND
ALPNA SEN GUPTA‖ was used. From this battery only 70 items were selected for the study, 15
items for emotional stability, 40 for adjustment, and 15 for self-concept. Twenty patients were
selected randomly from GODHRA‘s CIVIL hospital. In this group 10 patients are male and 10
patients are female. When patients came to hospital for treatment, the questionnaire was given to
them. All patients answered with full co-operation. Thus data of twenty patients was collected.
After that according to MHB the analysis was done. ‗t‘ test was used for all case studies.

The International Journal of Indian Psychology: Volume: 01 | Issue: 03 | ISSN 2348-5396
© 2014 www.ijip.in April – June 2014 41 | P a g e
VARIABLES
In this study patient‘s illness and present life style are independent variables. Gender of
patients is independent variable. Emotional stability, Adjustment, and Self-concept are
dependent variables.
RESULT AND DISCUSSION
Result of each patient is indication is separate table. Table wise discussion is done below. Final
conclusions and significance of research is show at the end. Case study 1 to 10 is male patients
and 11 to 20 are female patients.
MALE PATIENTS:
Case study no.1: SHAIKH MAKBUBHAI
Traits Total Score Patient Score
Emotional Stability 15 08
Adjustment 40 18
Self-Concept 15 07
*This table indicts that MAKBULBHAI‘s all score are law in which his adjustment is very poor.
Case study no.2: RATHOR VIKRAMBHAI
Traits Total Score Patient Score
Emotional Stability 15 11
Adjustment 40 21
Self-Concept 15 08
*Patient VIKRAMBHAI‘s score of self-concept is very low. So he is depended on others.
Case study no.3: MAKVANA VIJAYBHAI
Traits Total Score Patient Score
Emotional Stability 15 08
Adjustment 40 25
Self-Concept 15 07
*In this table patient‘s score of emotional stability and self concepts are poor.
Case study no.4: MAKVANA DHARMESHBHAI
Traits Total Score Patient Score
Emotional Stability 15 05

The International Journal of Indian Psychology: Volume: 01 | Issue: 03 | ISSN 2348-5396
© 2014 www.ijip.in April – June 2014 42 | P a g e
Adjustment 40 25
Self-Concept 15 09
*Table no.4 indicates that patient is emotionally disturbed and dependent on others.
Case study no.5: RATHVA SHANABHAI
Traits Total Score Patient Score
Emotional Stability 15 07
Adjustment 40 19
Self-Concept 15 07
*These tables clearly mention that patient‘s mental health is very weak.
Case study no.6: PATELIA RAMESHBHAI
Traits Total Score Patient Score
Emotional Stability 15 07
Adjustment 40 18
Self-Concept 15 09
*PATELIA RAMESHBHAI is also disturbed and upset is his life style, which is mentioned in
this table.
Case study no.:7 SAMBHALIWALA RAHENADBHAI
Traits Total Score Patient Score
Emotional Stability 15 05
Adjustment 40 24
Self-Concept 15 07
*This patient AIDS has affected his emotional balance and his self-concept is also poor.
Case study no.8: GAMIT SANKETBHAI
Traits Total Score Patient Score
Emotional Stability 15 06
Adjustment 40 22
Self-Concept 15 09
*This table is also like another table, that patient is emotionally disturbed and depended.
Case study no.9: TOPIWALA MOHMADBHAI
Traits Total Score Patient Score

The International Journal of Indian Psychology: Volume: 01 | Issue: 03 | ISSN 2348-5396
© 2014 www.ijip.in April – June 2014 43 | P a g e
Emotional Stability 15 07
Adjustment 40 19
Self-Concept 15 07
TOPIWALA MOHMADBHAI is also emotionally disturbed and depended.
Case study no.10: THAKOR TERSHINGBHAI
Traits Total Score Patient Score
Emotional Stability 15 08
Adjustment 40 18
Self-Concept 15 07
Table no 10 also indicates the same result like another table. This patient is also disturbed in
emotionally.
Female Patients:
Case study no.11: MAKVANA JAYESRIBEN
Traits Total Score Patient Score
Emotional Stability 15 08
Adjustment 40 20
Self-Concept 15 05
JAYESRIBEN is emotionally disturbed and her self-concept is poor, which is shown this in
table.
Case study no.12: SHEKH RUKHSHARBEN
Traits Total Score Patient Score
Emotional Stability 15 06
Adjustment 40 23
Self-Concept 15 08
*Here in this table patient is very poor in emotional control and more dependent on others.
Case study no.13: RATHVA SUKHIBEN
Traits Total Score Patient Score
Emotional Stability 15 07
Adjustment 40 20
Self-Concept 15 12

The International Journal of Indian Psychology: Volume: 01 | Issue: 03 | ISSN 2348-5396
© 2014 www.ijip.in April – June 2014 44 | P a g e
*SUKHIBEN‘s score is different than others, even though she is emotionally disrobed.
Case study no.14: THAKOR AMIBEN
Traits Total Score Patient Score
Emotional Stability 15 07
Adjustment 40 19
Self-Concept 15 06
*Table indicants that AMIBEN is also suffering from bad mental health.
Case study no.15: PATELIA RAMILABEN
Traits Total Score Patient Score
Emotional Stability 15 07
Adjustment 40 23
Self-Concept 15 09
*RAMILABEN‘s emotion and self-concept are very poor.
Case study no.16: MAKVANA INDUBEN
Traits Total Score Patient Score
Emotional Stability 15 05
Adjustment 40 18
Self-Concept 15 07
*Patient INDUBEN is also disturbed like other patients.
Case study no.17: TOPIWALA REHAMATBEN
Traits Total Score Patient Score
Emotional Stability 15 07
Adjustment 40 19
Self-Concept 15 05
*Patient REHAMATBEN is more dependent on others.
Case study no.18: RATHOR RAZANBEN
Traits Total Score Patient Score
Emotional Stability 15 07
Adjustment 40 21
Self-Concept 15 09

The International Journal of Indian Psychology: Volume: 01 | Issue: 03 | ISSN 2348-5396
© 2014 www.ijip.in April – June 2014 45 | P a g e
*RAZANBEN is suffering from emotional disturbance and dependency.
Case study no.19: BHIL KAILASHBEN
Traits Total Score Patient Score
Emotional Stability 15 06
Adjustment 40 27
Self-Concept 15 06
*This table indicates clearly that patient is mal adjusted with her life style.
Case study no.20: BHIL MANJULABEN
Traits Total Score Patient Score
Emotional Stability 15 09
Adjustment 40 17
Self-Concept 15 08
*Here is also the same result, which is indicated in other table.
TABLE OF GENDER DIFFERENCE
Table no.1: Total score of Male and Female AIDS patients. (t value).
Group Mean SD SEM T Standard of
difference
Male 36.40 2.76 0.87 0.83
N.S
1.18
Female 34.90 5.04 1.59
This table indicts that there is no significant difference in mental health of males and females.
0
50
100
150
200
250
Emotional steblility Adjustment self-Concept
MALE
FEMALE

The International Journal of Indian Psychology: Volume: 01 | Issue: 03 | ISSN 2348-5396
© 2014 www.ijip.in April – June 2014 46 | P a g e
Table no.2: Difference of Emotional stability in male and female.
Group mean SD SEM T Standard of
difference
Male 7.00 1.76 0.56 0.16
N.S
0.657
Female 6.90 1.10 1.35
There is no much difference in emotional stability of males and females.
Table no.3: difference of Adjustment in males and females.
Group mean SD SEM T Standard of
difference
Male 21.60 3.13 0.99 0.66
N.S
1.360
Female 20.70 2.95 0.93
This table of adjustment proves that male and females are equal.
Emotional stability
male
female
Adjustment
male
female

The International Journal of Indian Psychology: Volume: 01 | Issue: 03 | ISSN 2348-5396
© 2014 www.ijip.in April – June 2014 47 | P a g e
Table no.4: Difference of Self-concept in male and female.
Group mean SD SEM T Standard of
difference
Male 8.50 1.35 0.43 2.90
N.S
0.552
Female 6.90 1.10 0.35
There is no difference in Self-concept of male and female.
SIGNIFICANCE OF RESEARCH
This study of AIDS patients has proved that all the patients are emotionally disturbed and
their self-concept is very weak. Their daily life adjustment is normal. All the patients are under
the treatment and they take tablet of ART. At present when this study was done they will live
more than two to five years.
Final conclusion of this research is that the all patients‘ mental health is disturbed due to
illness. They are more dependent on others. So they always require help, sympathy, love and
care. I request the whole society to behave in good manner with all ADIS patients.
At last if we take care properly and consciously, than we will remove this decease from
whole world.
Self-Concept
male
female

The International Journal of Indian Psychology: Volume: 01 | Issue: 03 | ISSN 2348-5396
© 2014 www.ijip.in April – June 2014 48 | P a g e
*HIV related infections most frequently encountered in India
Bacterial Viral Fungal Parasitic Other
illnesses
Tuberculosis Herpes simplex
virus infection
Candidacies Cryptosporidiosis AIDS
dementia
complex
Bacterial
respiratory
infections
Oral hairy
leukoplakia
Cryptosporidiosis Microsporidiosis Invasive
cervical
cancer
Varicella zoster
virus disease
Pneumocystis
jiroveci
pneumonia
Isosporiasis Non-hodgkin
lymphoma
Salmonella
infection
Cytomegalovirus
disease
Penicilliosis Giardiasisww
stongyloides
Human papilloma
virus infection
Toxoplasmosis
*Rare infections include those due to Bartonella henselae, Rhodococcus equii, atypical
mycobacterioses and human herpesvirus (HHS)-8 infections.
020406080
Opportunistic infections among patients with AIDS in India
Opportunistic infections among patients with AIDS in India

The International Journal of Indian Psychology: Volume: 01 | Issue: 03 | ISSN 2348-5396
© 2014 www.ijip.in April – June 2014 49 | P a g e
2012 UN Report (India):
New HIV cases among adults have declined by half in India since 2000, according to a
new UN report which praised India‘s contribution to AIDS response through manufacture of
generic antiretroviral drugs.
Though rate of HIV transmission in Asia is slowing down, at least 1,000 new infections
among adults continue to be reported in the continent every day in 2011.
An estimated 360,000 adults were newly infected with HIV in Asia in 2011, considerably
fewer than 440,000 estimated for 2001, a new UNAIDS report has said.
―This reflects slowing HIV incidence in the larger epidemics, with seven countries
accounting for more than 90 per cent of people (in Asia) living with HIV – China, India,
Indonesia, Malaysia, Myanmar, Thailand and Vietnam,‖ the report ‗Together We Will End
AIDS‘ said.
The UNAIDS lauded India for doing ―particularly well‖ in halving the number of adults
newly infected between 2000 and 2009 and said some smaller countries in Asia like Afghanistan
and Philippines are experiencing increases in the number of people acquiring HIV infection.
0102030405060708090
100
Presenting symptoms and sings in patients with AIDS in India
Presenting symptoms and sings in patients with AIDS in India

The International Journal of Indian Psychology: Volume: 01 | Issue: 03 | ISSN 2348-5396
© 2014 www.ijip.in April – June 2014 50 | P a g e
It said a total 1.7 million people had died across the world due to AIDS related illness. In
India, the figure for such deaths stood at 170,000 in 2009. The report says India has contributed
enormously to the AIDS response.
―With 80 per cent of these drugs being generics purchased in India, several billion dollars
have been saved over the past five years. The country is also committed to new forms of
partnership with low-income countries through innovative support mechanisms and South?
South cooperation,‖ the UNAIDS report says.
It also points out that India already provides substantial support to neighboring countries
and other Asian countries – in 2011, it allocated USD 430 million to 68 projects in Bhutan across
key socio-economic sectors, including health, education and capacity-building. In 2011 at Addis
Ababa, the Government of India further committed to accelerating technology transfer between
its pharmaceutical sector and African manufacturers.
“We want AIDS free Generation…”
REFERENCE
1. Arun Kumar Singh and Alpana Sen Gupta, ‘MHB’, National Psychological Corporation,
2005
2. Cunha, Burke (2012). Antibiotic Essentials 2012 (11 ed.). Jones & Bartlett Publishers. p.
303. ISBN 9781449693831.
3. Diseases and disorders.. Tarrytown, NY: Marshall Cavendish. 2008. p. 25. ISBN 978-0-
7614-7771-6.
4. Elliott, Tom (2012). Lecture Notes: Medical Microbiology and Infection. John Wiley &
Sons. p. 273. ISBN 978-1-118-37226-5.
5. Evian, Clive (2006). Primary HIV/AIDS care: a practical guide for primary health care
personnel in a clinical and supportive setting (Updated 4th ed.). Houghton [South Africa]:
Jacana. p. 29. ISBN 978-1-77009-198-6.
6. K.Jhon, ‘Project of mission is to change the course of this HIV/AIDS pandemic through a
unique and comprehensive focus on women’, http://www.thewellproject.org, 2012

The International Journal of Indian Psychology: Volume: 01 | Issue: 03 | ISSN 2348-5396
© 2014 www.ijip.in April – June 2014 51 | P a g e
7. K.Sujatha Rao, ‘Guidelines of Prevention and Management of Common Opportunistic
Infections/Malignancies among HIV-Infected Adult and Adolescent’, NACO, 2007
8. Larke, N (2010 May 27 – Jun 9). "Male circumcision, HIV and sexually transmitted
infections: a review". British journal of nursing (Mark Allen Publishing) 19 (10): 629–34.
PMID 20622758
9. Ministry of Health & Family Welfare Government of India, ‘ATG for HIV-Infected
Adults and Adolescents Including Post-exposure Prophylaxis’, NACO, 2007
10. National AIDS Control Organisation of India approves TeachAIDS curriculum".
TeachAIDS. 15 January 2010. Retrieved 9 January 2011.
11. Vrajlal K., Sapovadia. "Controlling Hiv/AIDS – a Judicial Measure, Recommendations
by Supreme Court of India". Retrieved 13 January 2013.
12. Walker, BD (2007 Aug–Sep). "Elite control of HIV Infection: implications for vaccines
and treatment". Topics in HIV medicine : a publication of the International AIDS Society,
USA 15 (4): 134–6. PMID 17720999
13. WHO case definitions of HIV for surveillance and revised clinical staging and
immunological classification of HIV-related disease in adults and children. (PDF).
Geneva: World Health Organization. 2007. pp. 6–16. ISBN 978-92-4-159562-9.
14. WIKIPEDIA, ‘HIV/AIDS’, en.wikipedia.org/wiki/HIV/AIDS, 2012

The International Journal of Indian Psychology: Volume: 01 | Issue: 03 | ISSN 2348-5396
© 2014 www.ijip.in April – June 2014 52 | P a g e
Self Compassion and Emotional Intelligence of Engineering and
Dental College Students
Dr. Thiyam Kiran Singh*, Ms. Niharika Saini**
Abstract
Total samples of 60 were collected out of which 15 boys and 15 girls were engineering
students and the remaining 15 boys and 15 girls were dental students. They were collected using
simple random method from different departments of engineering of Amity University Rajasthan
(AUR) and Jaipur dental college to compare self compassion & emotional intelligence between
Engineering and Dental college students using emotional intelligence scale and self compassion
scale. The result found no difference in self compassion of Engineering and Dental students but
there is difference in traits of emotional intelligence of boys of Engineering and Dental student.
Again the result also found significant difference in overall comparison of Engineering and
Dental students in the area of emotional intelligence which proclaim that Engineering students
are better in emotional intelligence than Dental students.
Key Words: Self Compassion, Emotional intelligence, Engineering, Dental.
Introduction
Compassion is a feeling of deep sympathy and sorrow for another who is stricken by
misfortune, accompanied by a strong desire to alleviate the suffering. There is an aspect of
compassion which regards a quantitative dimension, such that individual's compassion is often
given a property of "depth," "vigour," or "passion." More vigorous than empathy, the feeling
commonly gives rise to an active desire to alleviate another's suffering. It is often, though not
inevitably, the key component in what manifests in the social context as altruism (Kang, 2010).
*Assistant Professor and Clinical Psychologist, Dept. of Psychology, AIBAS, Amity University
Rajasthan, Jaipur, Rajasthan
**M. Phil Student, Clinical Psychology Trainee at Dept. of Psychology, AIBAS, Amity
University Rajasthan, Jaipur, Rajasthan

The International Journal of Indian Psychology: Volume: 01 | Issue: 03 | ISSN 2348-5396
© 2014 www.ijip.in April – June 2014 53 | P a g e
Self compassion is extending compassion to one’s self in instances of perceived
inadequacy, failure or general suffering .Neff has defined self compassion as being composed of
three main components –self kindness, common humanity and mindfulness.
Emotional intelligence (EI) refers to the ability to perceive, control and evaluate
emotions. Some researchers suggest that emotional intelligence can be learned and strengthened,
while others claim it is an inborn characteristic. The ability to express and control our own
emotions is important but so is our ability to understand, interpret and respond to the emotions of
others. Psychologists refer to this ability as emotional intelligence and some experts even suggest
that it can be more important than IQ (Cherry, 2014). Many researchers have been conducted on
compassion and emotional intelligence on many different groups of population but the study on
Engineering and Dental student populations are very rare. So this study will definitely
enlightened about the psychological impact of compassion and EI on Engineering and Dental
students. The implications of this study and its findings are potentially important to the process
of teaching and learning. Understanding student's study approaches enables teachers to know
basic ideas about their strategies of teaching and learning activities in order to help students
improve their academic performance in relation to emotional intelligence.
Methodology
Objective:
To study the relationship between Self Compassion and Emotional Intelligence in college
students of professional courses of dental and engineering.
Hypothesis:
1. There will be significant difference between Engineering and Dental students on Self
Compassion
2. There will be significant difference between Engineering and Dental students on Emotional
Intelligence
SAMPLE:
A total of 60 students were collected out of which 15 are male Engineer students, 15 are female
Engineering students, 15 are male Dental students and remaining 15 are female Dental students.

The International Journal of Indian Psychology: Volume: 01 | Issue: 03 | ISSN 2348-5396
© 2014 www.ijip.in April – June 2014 54 | P a g e
INCLUSION CRITERIA:
1. Male and female students of Engineering and Dental.
2. Those who can give their consent for study.
EXCLUSION CRITERIA:
1. Students who are not studying engineering and Dental.
2. Those who can’t give their consent for study.
Tools Used
1. Emotional Intelligence:
Emotional Intelligence Scale (EIS; Schutte et al., 1998). The EIS is a 33-item, 5-point (1
= strongly disagree to 5 = strongly agree) self-report measure of emotional intelligence based on
Salovey and Mayer's (1990) theoretical model of emotional intelligence. This unifactor scale
asks respondents to indicate their level of agreement with each item, and the possible range of
scores for the EIS is 33 to 165. The EIS was validated on a sample of participants who were
recruited from a variety of settings, including university students and individuals from
community settings. In the validation study, the EIS was found to be positively correlated with
attention to feelings, clarity of feelings, mood repair, and optimism, and was reported to be
negatively related to pessimism, alexithymia, depression and impulsivity (Schutte et al., 1998).
Moreover, psychotherapists were found to have higher mean scores on the EIS than a group of
female prisoners and a group of individuals in a substance abuse treatment program. Women in
the validation study also scored significantly higher than male respondents. The EIS is reported
to have good predictive and discriminate validity. Internal consistency reliabilities in the
validation sample ranged from .87 to .90, and a test-retest reliability coefficient of .78 was
computed (Schutte et al., 1998). In this study, the Cronbach's alpha for the EIS was .87.
2. Self Compassion:
The Self Compassion Scale (SCS) was designed by Neff (2003) to measure self
compassion in individuals. The SCS has been used in a number of studies within the past decade
amid developments in the applications of meditation and mindfulness in western psychology.

The International Journal of Indian Psychology: Volume: 01 | Issue: 03 | ISSN 2348-5396
© 2014 www.ijip.in April – June 2014 55 | P a g e
The result has been a growing interest in the topic of self-compassion and its relationship to
psychological functioning and phenomena. Since 2003, scores of studies have used the SCS as a
measure of self-compassion with respect to a variety of psychological phenomena, measures, and
tests. These findings will be discussed in detail in the sections to follow. The SCS is informed by
Buddhist psychology and understanding of the self. This is evident in the phrasing of items on
the scale and the structure of the measure. Furthermore, during its development factor analysis
dictated that it be divided into six subscales including: self-kindness, self-judgment, common
humanity, isolation, mindfulness and over-identification. Thus, the six subscales are the result of
both theoretical and empirical findings. A total SCS score and subscale scores can be derived
from the measure providing detail regarding the construct and its theoretical makeup. Self-
Compassion Scale demonstrates good construct reliability and validity (Neff, 2003)
.
PROCEDURE
A total sample of 60 were collected randomly out of which 15 boys and 15 girls were
Engineering students and the remaining 15 boys and 15 girls were Dental students. After taking
permission from authorities of University and College samples were collected from different
departments of Engineering of Amity University Rajasthan, Jaipur and Dental College, Jaipur.
All the participants were given consent form to read before participation in the study. They were
administered emotional intelligence scale and self compassion scale to assess their overall
domains of emotional intelligence and self compassion.
Statistical Analysis:
Statistical analyses were done with the help of statistical methods of mean, standard
deviation and t- test.
Result:
Table - 1 shows Comparison between boys groups and between girls groups of
engineering and dental students. The result found no significant in both the groups of boys and
girls of engineering and dental students. Table 2 shows the comparison between boys groups and
between girls groups of engineering and dental students on Emotional Intelligence. The result
find significant (t=2.16*, P < 0.05) under the groups of boys which indicate that engineering

The International Journal of Indian Psychology: Volume: 01 | Issue: 03 | ISSN 2348-5396
© 2014 www.ijip.in April – June 2014 56 | P a g e
boys students are more sound in emotional intelligence than dental boys students. Table 3 shows
comparison between overall engineering and dental students on Self compassion. The result
found no significant difference. Table 4 shows comparison between overall engineering and
dental students on Emotional intelligence. The result find significant (t=2.43*, P < 0.05) which
indicate engineering students are better in terms of emotional intelligence then dental students.
DISCUSSION:
The study found significant in comparison under the groups of boys on emotional
intelligence which indicate that engineering boys students are comparatively more better in
emotional intelligence than dental boys students. It may be because engineering students require
more academic achievements. Accordingly, Ataabadi et al. (2014) found in their study that there
is meaningful and positive relationship between emotional intelligence and academic
achievement. On the other hand supportively, Winter and Dodou (2011) found in their study that
high academic performance in physics, chemistry and mathematics would probably be a more
useful predictor of overall academic performance in engineering. In another study of Skipper and
Brandenburg (2013) Soft skills such as emotional intelligence are viewed as effective ways to
distinguish potential high-performance workers. It is posited that high performing engineering
students will also exhibit more proficiency at these ‘soft skills’ than engineering students with
more modest academic success. The purpose of their study was to examine the relationship
between Emotional Intelligence and academic performance and examine the potential difference
in Emotional Intelligence with respect to demographic and experiential characteristics. The result
found a positive connection between the amount of academic achievement and higher Emotional
Intelligence scores.
The study also found significant in comparison between overall (Boys and Girls)
engineering students and dental students on Emotional intelligence which indicate engineering
students are better in emotional intelligence then dental students. This may be because high
cognitive ability is required for engineer students in work for success. Similarly, Rindermann et
al (2014) found in their study that engineers in order to become a successful engineers they
require high cognitive abilities especially for work in research and development. Supportively,
Sprunck (2013) found Emotional Intelligence is a key success factor for software engineers in
business and private life. As Software Engineers emotions are usually not main focus in daily

The International Journal of Indian Psychology: Volume: 01 | Issue: 03 | ISSN 2348-5396
© 2014 www.ijip.in April – June 2014 57 | P a g e
work. Engineers require to work with others in teams as users and customers. Mostly they have
no technical background and come from complete different domains. In another study of Ng,
Cheng, Check, & Goh, (2013) the Engineering and IT students have higher Emotional Quotient
as compared to Management student. The implications of these findings are potentially important
to the process of teaching and learning. Understanding student's study approaches enables
instructors to fine tune their strategies of teaching and learning activities in order to help students
improve their academic performance.
CONCLUSION
From the above study it is concluded that there is no difference in self compassion of
Engineering and Dental students. There is significant difference in emotional intelligence
between boys groups of Engineering and Dental students. Again there is significant difference in
overall comparison of Engineering and Dental students in the area of emotional intelligence
which proclaim that Engineering students are better in emotional intelligence than Dental
students. On the other side there is also no significant difference in self compassion and
emotional intelligence between girls groups of Engineering and Dental streams.
REFRENCES:
1. Ataabadi, S., Yusefi, Z.,& Moradi, A. (2014). Predicting academic achievement among
deaf students: emotional intelligence, social skills, family communications and self-
esteem. European Journal of Research on Education, 2(1) ,35-46. Retrieved from:
http://iassr.org/rs/020105.pdf on 30/03/2014.
2. Cherry, K. (2014). What Is Emotional Intelligence?.Retrieved from:
http://psychology.about.com/od/personalitydevelopment/a/emotionalintell.htm on
1/4/2014.
3. Kang, R. (2010). Compassion. Retrieved from:
http://rannykang.blogspot.in/2010/08/compassion.html on 1/4/2014.
4. Neff, K. D. (2003). The development and validation of a scale to measure self-
compassion. Self and Identity 2 (3), 223–250.
5. Ng, L.N., Cheng, L.T., Check, Y.L., & Goh, W.W. (2013). Examining the Influence of
Emotional Intelligence on Students' Study Approaches and Academic Performance.

The International Journal of Indian Psychology: Volume: 01 | Issue: 03 | ISSN 2348-5396
© 2014 www.ijip.in April – June 2014 58 | P a g e
International Proceedings of Economics Development & Research, 44, 146. Retrieved
from: http://connection.ebscohost.com/c/articles/83377001/examining-influence-
emotional-intelligence-students-study-approaches-academic-performance on 30/3/2014.
6. Rindermann, H., Baumeister, A.E., & Groper, A. (2014). Cognitive abilities of Emirati
and German engineering university students. Journal of Bio Social Science, 46 (2), 199-
213.
7. Salovey, P., & Mayer, J. D. (1990). Emotional intelligence. Journal of Imagination,
Cognition, and Personality, 9, 185-211.
8. Schutte, N. S., Malouff, J. M., Hall, L. E., Haggerty, D. J., Cooper, J. T., Golden, C. J., &
Dornheim, L. (1998). Development and validation of a measure of emotional
intelligence. Personality and Individual Differences, 25, 167-177.
9. Skipper, C.O., & Brandenburg, S. (2013). Emotional intelligence and academic
performance of engineering students. Engineering Project Organization Journal,3 (1),13-
21. Retrieved from:
http://www.tandfonline.com/doi/abs/10.1080/21573727.2012.738669?journalCode=tepo2
0#.UzgAtCe6bXR on 30/3/2014.
10. Sprunck, M. (2013). Emotional Intelligence in Software Engineering. Retrieved from:
http://www.sw-engineering-candies.com/blog-1/emotional-intelligence-in-software-
engineering on 30/3/2013.
11. Winter, J.C.F. DE., & Dodou, D. (2011). Predicting Academic Performance in
Engineering Using High School Exam Scores. International Journal of Engineering
Education, 27(6), 1343-1351. Retrieved from
http://www.3me.tudelft.nl/fileadmin/Faculteit/3mE/Over_de_faculteit/Afdelingen/BioMe
chanical_Engineering/Organisatie/Medewerkers/Winter/doc/19_ijee2519ns.pdf 0n
30/3/2014.

The International Journal of Indian Psychology: Volume: 01 | Issue: 03 | ISSN 2348-5396
© 2014 www.ijip.in April – June 2014 59 | P a g e
Tables:
Table -1: Comparison between boys groups and between girls groups of engineering and
dental students on self compassion Scale.
Group
Boys
Girls
Engineering
MEAN SD T MEAN SD T
2.97
0.31
0.09
3.14
0.42
0.77
Dental 2.98 0.27 3.04 0.33
* Significant at 0.05 level
** Significant at 0.01 level
Table 2: Comparison between boys groups and between girls groups of engineering and
dental students on Emotional Intelligence.
Group Boys Girls
Engineeri
ng
MEAN SD T MEAN SD t
4.99
0.97
2.16*
4.6
0.48
1.38
Dental 4.3 0.79 4.27 0.70
* Significant at 0.05 level
** Significant at 0.01 level

The International Journal of Indian Psychology: Volume: 01 | Issue: 03 | ISSN 2348-5396
© 2014 www.ijip.in April – June 2014 60 | P a g e
Table - 3: comparison between overall (Boys and Girls) engineering and dental students on
Self compassion
Group MEAN SD t
Engineering 3.05 0.36
0.5
Dental 3.01 0.3
* Significant at 0.05 level
** Significant at 0.01 level
Table-4: Comparison between overall (Boys and Girls) engineering and dental students on
Emotional intelligence
* Significant at 0.05 level
** Significant at 0.01 level
Group MEAN SD t
Engineering 4.79 0.72
2.43*
Dental 4.28 0.74

The International Journal of Indian Psychology: Volume: 01 | Issue: 03 | ISSN 2348-5396
© 2014 www.ijip.in April – June 2014 61 | P a g e
Does Marital Adjustment and Psychological Well-Being Differences
in Working and Non-Working Female?
Garima Gupta*, Neha Nafis**
Abstract The present study intends to examine marital adjustment and psychological well-being
among working and non-working women. The study was carried out on a purposive sample of 40
participants. Marital adjustment inventory and Ruff’s Medium Form of Psychological Well-
Being Scale was administered on forty working and non-working female participants. Results
revealed that working and non-working women did not differ from each other on marital
adjustment as well as on psychological well-being but on few dimensions of psychological
wellbeing. The findings have been discussed in the light of relevant research evidences.
Introduction: - Marriage is by far the most important personal relationship for any person and
has been described as the most intimate, delicate and far-reaching relationship between man and
woman. The stability and continuity of a marriage is important not just to the members of the
marital dyad, but to their family and community as a whole. Traditionally, in Indian culture,
people expected their marriages to be arranged by their elder extended kin who continued to play
a significant role in the couple’s lives. Marriage has been discussed in terms of the
interdependence between two individuals (Lewin, 1948) and what happens to one individual is
likely to influence the other. As a function of the interdependence in relationship, the nature of
the relationship may undergo transformation to accommodate the changes in the partner’s health
and behavioral status (Kerns & Turk, 1985).The intimate relationship between husband and
wives are the cornerstones of interpersonal behavior which not only provide the social context in
which people lives but also influence their well-being (Jones & Perlrnan, 1991).
Marital adjustment seems complex than it may appear. Basically, in marriage, two
persons adjust to each other's sensory, motor, emotional and intellectual capacities. On the
personality level they must adjust together to their total environment, including such matters as a
new household, children, provision and preparation of food, relatives, friends, relations and work
(Fonseca, 1966).
*Dr. Garima Gupta, A N Sinha Institute of Social Studies, Patna- 80000.
** Student, Vasanta College for Women, Rajghat, Varanasi-221005.

The International Journal of Indian Psychology: Volume: 01 | Issue: 03 | ISSN 2348-5396
© 2014 www.ijip.in April – June 2014 62 | P a g e
The success of marital life much depends upon the success in marital adjustment by the
husband and wife. Marital maladjustment results in conflicts and tensions and many a time
divorce.
Several studies have studied marital adjustment in working and non-working women. For
example, Nathawat and Mathur (1993) found that working women reported significantly better
marital adjustment and subjective wellbeing than housewives; they also scored higher than
housewives in general health, life satisfaction and self-esteem measures. Iloyd (1980) found that
socioeconomic status is a contributing factor for marital adjustment, and believed that higher
income to be a significant factor. Similar findings have been supported by Adegoke (1987) and
Rogers and May (2003) who reported that working class women are generally more satisfied
with their lives than non-working women. However, the difference between these findings could
be attributed to cultural differences.
However, certain studies have reported contradictory findings. Kausar (2003) studied the
effect of personality traits and socio-economic status on marital adjustment in working women
and found no difference between marital adjustment of working women of low, middle and high
socio-economic background and attributed that personality trait could be the factor liable for the
marital adjustment in working and non-working female rather being the socio-economic factor.
Similar non-significant marital differences in working and non-working women of Port Harcourt
metropolis was reported by Nigeria- Tamunoimama Jamabo and Ordu (2012).
Marital adjustment and psychological wellbeing is related to each other. Psychological
wellbeing is particularly viewed as a positive functioning of an individual and is described as the
quality of life of a person. It includes what laypeople call “Happiness”, “peace”, “fulfillment”
and “life satisfaction”. Ryff (1991) states that convergence of similar features of positive
psychological functioning constitutes the core dimensions of psychological wellbeing and these
dimensions are autonomy, environmental mastery, personal growth, positive relations with
others purpose in life and self- acceptance. Ryff (1989)extensively explored the meaning of
psychological wellbeing and thought that wellbeing could be made sense by breaking it down
into six dimensions each of which contributing to people’s experience of wellbeing. Each
dimension of psychological well-being articulates different challenges as they strive to function
positively. The present study focuses on wellbeing from the perspective of eudemonic approach
which emphasize meaning and self-actualization and defines wellbeing in terms of the degree to

The International Journal of Indian Psychology: Volume: 01 | Issue: 03 | ISSN 2348-5396
© 2014 www.ijip.in April – June 2014 63 | P a g e
which person is fully functioning. Kumar (2006) observes that conceptions of well-being are
integrally related to how one views the nature of man and what perspective is valued. Increase in
women’s participation in labor force over the past few decades have led to increased interest in
the effects of employment on women’s well-being. Women employment has been investigated as
either beneficial (role enhancement hypothesis) or detrimental (role strain hypothesis) to
women’s psychological well-being. Women employment may be associated with better
psychological functioning. This effect may be mediated by the over absorption of one’s time and
resources within a particular identity role (Elgar & Chester, 2007).
Psychological wellbeing particularly in labor market and more specifically in the context
of women employees has received much attention. The occupation is one of the most important
factors which bring a lot of changes in the life of women. The occupation brings along with it
many expectations, pressures, time demands and commitments which may affect the mental
health of women. The relationships between occupation and mental health of women have been
studied by several researchers. Thakur and Misra (1999) studied the well-being experiences of
196 employed and 54 unemployed women. It was found that the unemployed women received
significantly more social support, in spite of that, the well-being measures indicating mental
health was better in employed women. Erlandson (2006) examined psychological wellbeing in
working with full time and part time jobs and reported that full time employed women having
positive attitude about employment reported better psychological well-being than their
counterparts. Sahu and Rath (2003) studies self-efficacy and wellbeing in working and non-
working women in urban areas and found positive correlation between self-efficacy and
wellbeing and added that marriage employment and parenthood are associated with good mental
and physical health. Rastogi and Kashyap (2001) reported better mental health of employed
woman.
However, other contradictory findings have reported poor psychological wellbeing of
working women. For example, some other researchers are of this view that the life of working
women has been viewed, as problematic period of one’s life as compared to non-working
women. One of the Indian survey demonstrated a statistics’ which indicates that 80% of working
women psychological state is not well in working women in Karnataka experiencing frustration
and stress(14.22% in 1971, and 25.68% in 2001). Further, another study conducted by Ramesh
(2009) on working and non-working women demonstrated that non-working women are more
The International Journal of Indian Psychology: Volume: 01 | Issue: 03 | ISSN 2348-5396
© 2014 www.ijip.in April – June 2014 64 | P a g e
adjusted than working women-emotionally, socially and health wise. Non-working women have
more life satisfaction than working women. Similar findings have been reported by Hashmi,
Khurshid, and Hassan (2007).
On the other hand, a comparative study was done on the psychological symptoms
observed in the working women and housewives were assessed on the psychological symptoms
scanning scale and findings showed that anxiety, phobia, paranoia and psychosomatic subscales
points and average of symptoms were significantly higher in the housewives(Cilli, et al., 2000).
The overview of the literature suggests working class of women are more satisfied and
adjusted in their marital life (Nathawat & Mathur, 1993; Rogers & May, 2003). As far as the
psychological wellbeing is concerned, lack of consensus seems about the findings, some
researchers are of this view that psychological wellbeing is better in employed woman (Sahu &
Rath, 2003; Thakur & Misra, 1999) while others hold different view (Cilli et al., 2000).
It is evident through the literature that in the present era of globalization and
industrialization, women are educated and work keeping their interest in mind. This not only
provides recognition to the women but also adds their recognition to the society. However, due
to this women esp. employed faces many problems. They had adjustment relationship problem
with the family members, children and work place and especially with their married life. They
face stress because of multiplicity of worked performed by them, which in turn affects their well-
being too. Thus, to know the nature of marital adjustment and psychological well-being in
working and non-working women, the present study makes an attempt to examine the marital
adjustment and psychological well-being of working and non-working women.
Method
Sample:
The present study was carried out on a sample of 40 couples with the marital life ranging from of
10 to 15 years residents of Varanasi city, India. Twenty working women and twenty non-
working women along with their spouses participated in the present study. All the couples were
selected from middle class socio-economic strata with a minimum qualification (68.7%
graduation and 31.3% post-graduation) belonging to the urban (77.5%) and rural (22.5%) area.
Sixty percent of couples belonged from joint family while, 40% were from nuclear family. The
newly married couples were excluded from the present study because the new marriage itself

The International Journal of Indian Psychology: Volume: 01 | Issue: 03 | ISSN 2348-5396
© 2014 www.ijip.in April – June 2014 65 | P a g e
puts a number of adjustment demands on the couples. Mean age of working and nonworking
female was 34.52.
Tools:
Following is a brief description of the tool used in the present study along with its psychometric
properties. The self-report inventory were used in the present research and in addition to the
personal data sheet were used that collected demographic information such as name, age, gender,
education, socio-economic status, nature of job, class of job, job-timing, nature of the family,
ecological area –urban/rural etc. of the participants.
Marital Adjustment Inventory
Marital adjustment was measured by Marital adjustment inventory developed by Har
Mohan Singh was used to measure the quality of a relationship between two persons who
are married. It is a self-report scale consisted of 20 items consisting 10 point rating
scores. The reliability and validity of this inventory was found satisfactory.
Psychological well-being
Psychological wellbeing was measured by using Ryff’s (1989) medium form that consists
of a series of 54 statements reflecting the six areas of psychological wellbeing: autonomy,
environmental mastery, personal growth, positive relations with others, and purpose in
life and self-acceptance. Respondents rate statements on a scale of 1 to 6, with 1
indicating strong disagreement and 6 indicating strong agreement. The reliability for each
dimension varied between 0.86 and 0.91. Correlation coefficients with 20-item parent
scale for each varies between 0.83 and 0.99 indicate higher level of validity for the scale.
For each category, a high score indicates that a respondent has a mastery of that area in
her life. Conversely a low score shows that the respondent struggles to feel comfortable
with that particular concept.
Procedure: The above-mentioned scale was used to assess marital adjustment of the working
and non-working women and their spouses. The participants were selected purposively. The
scale was given to each participant individually and was administered as per the standard
instructions printed with scale. However, in any case, instructions related to the marital
adjustment inventory was clearly explained to each participant and their queries (if any) were
properly attended. In addition to it, each participant was requested to ensure that they have
responded to each and every item of the test booklet. The confidentiality of their responses was

The International Journal of Indian Psychology: Volume: 01 | Issue: 03 | ISSN 2348-5396
© 2014 www.ijip.in April – June 2014 66 | P a g e
assured to them. The complete self-report scale was scored as per the standard scoring procedure
and data was analyzed by using appropriate statistics. The independent t-test was performed to
test the present hypothesis of the study.
Results In order to address the objective of the present study, independent sample t-test was calculated
and the findings have been tabulated.
Table 1 Mean, SD and t values indicating differences between working and non-working
females on marital adjustment and various dimensions as well as total score of psychological
well-being
Working females
(N=20)
Non-working
females
(N=20)
Measures Mean SD Mean SD t-value df sig
Marital adjustment 44.25
17.42 52.05 16.82 1.440 38 .158
Autonomy (dimension of
psychological wellbeing)
10.55
2.911
10.05 3.734
.472 38 .639
Positive relation with
others (dimension of
psychological wellbeing)
10.40 3.530
9.10 2.732
1.302 38 .201
Purpose in life (dimension
of psychological wellbeing)
10.35
3.110
10.90
2.231
.643 38 .524
Self-acceptance (dimension
of psychological wellbeing)
9.95
3.154
9.30
2.342 .740 38 .464
Environmental mastery
(dimension of
psychological wellbeing)
9.25
1.832
8.10 2.198
1.797 38 .080
Personal growth
(dimension of
psychological wellbeing)
8.20
2.191
9.30 3.585
1.171 38 .249
Total Psychological
Wellbeing
58.40
9.058
56.15 6.991
.879 38 .385
Perusal of the Table 1 reveals that mean of working and non- working female is 44.25
and 52.05 respectively which indicates that non-working female scored higher on marital
adjustment and is adjusted than working female. The t value was calculated for the significance

The International Journal of Indian Psychology: Volume: 01 | Issue: 03 | ISSN 2348-5396
© 2014 www.ijip.in April – June 2014 67 | P a g e
of mean differences and non-significant differences have been observed (t = 1.440, df = 38, p=
0.158) indicating that working female does not differ from non-working female on the measure
of marital adjustment. This pattern of findings suggest that both working and non-working
female are adjusted well in their married life. Similarly, on the measure of psychological well-
being no significant differences have been noted on the total as well as various dimension of
psychological wellbeing (p<.05).
Table 2 Mean, SD and t values indicating differences between spouse of working females and
spouse of non-working females on marital adjustment and various dimensions as well as total
score of psychological wellbeing
Spouse of working females (N=20)
Spouse of non-working females
(N=20)
Measures Mean SD Mean SD t-value df sig
Marital adjustment 54.7 19.22 55.00 19.81 .049 38 .961
Autonomy (dimension of
psychological wellbeing)
9.95 2.64 9.30 2.77 .758 38 .453
Positive relation with
others (dimension of
psychological wellbeing)
11.35 3.43 9.05 2.83 2.308 38 .027
Purpose in life
(dimension of
psychological wellbeing)
10.85 2.87 11.05 3.01 .215 38 .831
Self-acceptance
(dimension of
psychological wellbeing)
9.45 2.81 8.95 2.48 .595 38 .555
Environmental mastery
(dimension of
psychological wellbeing)
8.15 1.84 8.70 1.65 .992 38 .327
Personal growth
(dimension of
psychological wellbeing)
8.30 2.43 9.95 2.16 2.268 38 .029
Total Psychological
Wellbeing
58.05 8.01 57.55 6.40 .218 38 .829

The International Journal of Indian Psychology: Volume: 01 | Issue: 03 | ISSN 2348-5396
© 2014 www.ijip.in April – June 2014 68 | P a g e
Perusal of the Table 2 reveals that mean of marital adjustment in spouses of working
female and spouses of non-working female is 54.7 and 55.00 respectively. The t-value was
calculated for the significance of mean differences and non-significant differences have been
observed (t = .049, df = 38, p = .961) indicating that both spouses of working and non-working
female does not differ from each other on measure of marital adjustment. This pattern of finding
suggests that both spouses of working and non-working females are adjusted equally well in their
married life. However, on the measure of psychological wellbeing spouses of working and non-
working female were found to differ significantly on the dimension of positive relation with
others(mean spouses of working women = 10.40 and mean spouse of non-working female =
9.10, t = 2.308, df = 38, p = .027) and personal growth(mean spouses of working women = 8.30
and mean spouse of non-working female= 9.95, t = 2.268, df = 38, p = .029). Rest of the
dimension and total scores were found to be non-significant on the measure of psychological
wellbeing (p<.05). These findings suggest that souses of working women are able to perceive
more positive relation with others than their counterparts, while, spouses of non-working females
perceive better chance of personal growth than the spouses of working females.
Discussion The objective of the study was to explore the nature of marital adjustment and
psychological well-being in working and non-working female as well as their in spouses too. The
findings suggest that both working and non-working women have similar marital adjustment and
psychological well-being. However, the working woman differ in reflecting positive relation
with others and personal growth as compared to non-working woman. Several researchers are
also in line with the present finding who have reported no differences in the marital adjustment
in working or non-working women (Pish-ghadam, Bakhshipour, & Ebrahim, 2013; Jamabo&
Ordu, 2012). Further, in a different study, Kausar (2003) studied personality traits and socio-
economic status as predicators of marital adjustment in working women and found no difference
between marital adjustment of working women of low, middle and high socio-economic
background and attributed that personality trait could be the factor liable for the marital
adjustment in working and non-working female rather being the socio-economic factor.
Therefore, it was deduced that marital adjustment of working class women was not dependent on
their socio-economic background; rather the personality trait of the woman was considered as a
prominent factor in her marital adjustment. Similarly, Jamabo and Ordu(2012) reported non-

The International Journal of Indian Psychology: Volume: 01 | Issue: 03 | ISSN 2348-5396
© 2014 www.ijip.in April – June 2014 69 | P a g e
significant differences in marital adjustment in working and non-working women of Port
Harcourt metropolis in Nigeria. Hence, can be said that marriage is a universal concept for all
and a developed system that cannot be affected by any other and husbands having the spouse
working or doing only household chores (housewife) does not make any difference in the modes
of adjustment to home, health, social, emotional and occupation spheres of life.
Taking both findings together, it can be speculated that the working and non-working
women enjoy equal marital adjustment, which entails that women being paid employed whether
in public or private sector, been an entrepreneur or full time house wife does not disrupt a
woman’s family. Therefore, the degree of marital adjustment of a woman depends on how she
handles her family for example, paying attention to her husband, children and their need and also
communication/interaction in the home and the society at large. One factor for the observed
finding can be attributed to education, that despite the environmental pressures in home and
outside home, both employed and non-employed women can always create a healthy atmosphere
for their marital adjustment. In fact, education enhances marital adjustment of women which also
implies that literacy contributes to marital adjustment. Education enhances marital adjustment
via enhancing their communication skills, enabling them to talk over their problems/sources of
conflict, enhance their reasoning ability and ability to logically arrive at solutions to conflicts.
For marriage, it is usually said that marriage is an Art, an “Art of Understanding One’s Mate”,
becoming an intimate part of the people one know and the things that surround them; entering
into a kind of “oneness” with their environment. The happiness in any marriage is an outcome of
joyous unification of heart and head, i.e. needs intelligence, love and determination (D'souza,
1975, p.18). Marriage is composed of understanding of the meaning of marriage and deep desire
to be loyal to each other for life. Many people see marriage as a beginning of a life of growing
and expanding happiness.
Thus, the dyadic adjustment in married life largely depends on several factors, such as,
mutual understanding, faithfulness, love-affection (Clark, Fitness, & Brissette, 2000), sexual
satisfaction, and valuing to each other. Kumar (1986) identified most prominent factors in his
study responsible for happily married life. He interviewed happily married couples to identify
factors which contributed to happiness in marriage, and found higher degree of agreement in
both husbands and wives responses. Sexual satisfaction, proper understanding, right marital
attitudes, faithfulness and giving importance to each other, companionship, love and affection,

The International Journal of Indian Psychology: Volume: 01 | Issue: 03 | ISSN 2348-5396
© 2014 www.ijip.in April – June 2014 70 | P a g e
were most important factors in marital happiness. Three factors on which the two groups agreed
are sexual satisfaction, faithfulness and giving importance. Thus, the present findings can be
interpreted that marriage adjustment is about several things that makes it possible.
The another finding of the present study is that it working women and non-working
women did not differ significantly on psychological wellbeing however, they differ only positive
relation with others and personal growth; As working women reported better positive relation
with others and personal growth. Several findings are in line who has reported better
psychological wellbeing in employed women (Erlandson, 2006, Thakur & Misra, 1999). One of
the reason for this can be attributed to the employment. As researchers have suggested that
employment provides women better opportunity to be self-dependent and therefore, one could
expect that working women may have better psychological well-being. The reason why
psychological well-being was equal among both working and non-working female could be job
nature and working conditions of women that contribute to their experience of psychological
well-being but not the paid employment that contributes to the psychological well-being of
working. Hence, promoting psychological well-being of employed women requires co-operation
of people at individual, community, government and at the societal level at large and so with the
non-working female too. Further, this speculation has been confirmed by other researchers. For
instance, when happiness or satisfaction are used as indices of well-being, employed and non-
employed women typically do not differ significantly (Serlin, 1980). These findings, however,
refer to the effects of employment per se and do not take into account qualitative aspects of the
paid worker role.
It can be said, taking the whole picture of the present study that in our Indian society
both, men and women play a pivotal role and their roles may be defined based on their cultural
values and societal norms. Marriage is considered to be most fundamental of all social ties. Thus,
Cohen laboratory studies (1997, 2003), suggest that “human beings with good friendship
networks can repel the simple common cold, are particularly suggestive. How marriage works its
magic remains mysterious. If an answer can be found, it may unlock the puzzle of exactly how
the mind and body are intertwined”. Education and employment brings tremendous qualitative
changes in women’s and their husbands’ marital adjustment. Highly educated and employed
women and their husbands are more socially adjusting than their corresponding counterparts.

The International Journal of Indian Psychology: Volume: 01 | Issue: 03 | ISSN 2348-5396
© 2014 www.ijip.in April – June 2014 71 | P a g e
Thus, education and employment is a new age mantra for Indian women to improve the level of
marital adjustment among them and their husbands.
Some limitations and issues for future research should be noted. The sample included
small and purposively selected sample, any generalization of the results should be made with
caution. Sample of present investigation was drawn only from Varanasi. Further research would
be conducted in other states or metro cities, which will cater to the sample of different
backgrounds. Thus, study on wider and varied population may provide richer and more valuable
information’s. The future study must include large data-base including employed women of
other professions (Doctors, Engineers, Lawyers, Factory workers, Managers etc.)
References
1. Adegoke, A. A. (1987). Female labour force participation and marriage happiness: A
study of selected women in Ilorin and Ibadan. Nig. J. Guid. Couns. 3(1), 132-140.
2. Cilli, A. S, Kaya, N. et al. (2000). A Comparative study on the psychological symptoms
observed in the working women and house wives.Family Research and application center
Public Health branch, 8, 342-345.
3. Cohen, S., Doyle, W. J., Skoner,D. P., Rabin, B. S. & Gwaltney, J. M. (1997). “Social
Ties and Susceptibility to the Common Cold”. Journal of the American Medical
Association, 277, 1940-1944.
4. Cohen, S., Doyle, W. J., Turner, R., Alper, C. M. & Skoner, D. P. (2003). “Sociability
and Susceptibility to the Common Cold”. Journal of the American Medical Association,
14, 389-395.
5. Elgar, K., & Chester, A. (2007). The mental health implication of maternal employment:
Australian Journal for the Advancement of Mental Health, 6, 1-9.
6. Erlandson. (2006). Levels of complexity in patterns of daily occupations. Journal
ofOccupational Science, 13, 27-36.
7. Fonseca, Ana. (2009). Transferencia Condicionadas, Estrategias de Combate al Hambre
yla desnutrición en América Latina y el Caribe, Roma: FAO.
8. Hashmi, H. A., Khurshid, M. & Hassan, I. (2007). Marital Adjustment, Stress and
Depression among Working and Non-Working Married Women. Internet Journal of
Medical Update, 2(1), 19-26.

The International Journal of Indian Psychology: Volume: 01 | Issue: 03 | ISSN 2348-5396
© 2014 www.ijip.in April – June 2014 72 | P a g e
9. Iloyd, S. (1980). The individual marriage and family. California: Wadsworth Publishing
Company.
10. Jamabo, T. N. & Ordu, S. N. (2012). Marital adjustment of working class and non-
working class women in Port Harcourt metropolis, Nigeria. International Journal of
Psychology and Counselling,4(10), 123-126.
11. Kausar A (2003). Personality traits and socioeconomic status as predicators of marital
adjustment in working women. PhD thesis submitted to the University of Karachi,
Karachi.
12. Kumar, S. K. K. (2006). Happiness and wellbeing in Indian tradition. Psychological
Studies, 51, 105-112.
13. Lewin, K. (1948). Resolving social conflicts; selected papers on group dynamics.
Gertrude W. Lewin (ed.). New York: Harper & Row.
14. Nathawat, S. S. & Mathur, A. (1993). Marital Adjustment and Subjective Well- Being in
India Educated Housewives and Working Women. The Journal of Psychology, 127(3),
353-358.
15. Rastogi, R. & Kashyap, K., (2001). A study of occupational stress and mental health
among married working women. J. Com. Guid.Res., 18(2), 189-196.
16. Rogers, S. J., & May, D. C. (2003). Spillover between marital quality and job
satisfaction: Long-term patterns and gender differences. J. Marriage Fam. 65(2), 482-496.
17. Ryff, C. (1991). The structure of psychological wellbeing. Journal of Personality and
Social Psychology, 69, 719-727.
18. Ryff, C. (1989). Scales of psychological wellbeing. Journal of personality and social
psychology, 57, 1069-1081.
19. Sahu, F. M., & Rath, S. (2003). Self-efficacy and wellbeing in working and non-working
women. Psychology and Developing Societies, 15, 187-198.
20. Thakar, G. & Misra, G. (1999). Daily hassles, wellbeing and social support: experiences
of employed women in India. Psychol. Studies, 44(3), 69-76.
21. Turk, D.C. & Kerns, R.D. (1985). Health, Illness and Families. New York: Wiley.

The International Journal of Indian Psychology: Volume: 01 | Issue: 03 | ISSN 2348-5396
© 2014 www.ijip.in April – June 2014 73 | P a g e
Stress Management among Teaching & Non - Teaching Staff
Pooja Verma*, Dr. Ravindra Kumar**
Abstract
The main objective of the present investigation is to examine the stress management
among teaching and non teaching staff. A sample of 30 participants (15=Teaching & 15 Non
Teaching) was drawn randomly drawn from the population. Stress Management Scale (SMS) by
Dr. Pushpraj Singh & Anjali Srivastava was used for data collection. Data was collected by face
to face interview method from the target population from different education institute of
Ghaziabad city. Mean, standard deviation and t-test were calculated for the analysis of data.
Results indicate that there is no significant difference among Teaching and Non-teaching staff
participants in relation to stress management. Result revealed that Non teaching participants have
higher mean score on stress management in compare to teaching participants. In simple terms it
can be said that Non teaching participants have higher stress management.
Keywords: Stress, Stress management, teaching and non teaching.
Introduction
People experience lot of stress in their life and also at work place. Kyriacou (2001) define
stress as an „unpleasant emotional state fraught with tension, frustration, anxiety and emotional
exhaustion‟. Stress is very unpleasant state which brings lot of tension frustration and irritation
which is affects on work, relationships and daily life style. Lazarus (1999) defines “transactional
approach to stress incorporating an interactive relationship between the person and the
environment”. Stress is silent killer which does not allow people to have good bond between the
people and the environment. People feel their surrounding is burden to them, which become
difficult to manage. Stress as the psychological, physiological and behavioral response of an
individual seeking to adopt and adjust to both the internal and external pressures (Olley; 1999).
Various departments, groups and external environment factors affect individual behavior.
Minimal level of stress is required for organizations to operate effectively.
*Student, PGDGCP, Indian Institute of Psychology, Noida (U.P.) INDIA
**Assistant Professor, Dept of Psychology, Mewar University, Chittorgarh (Rajasthan)
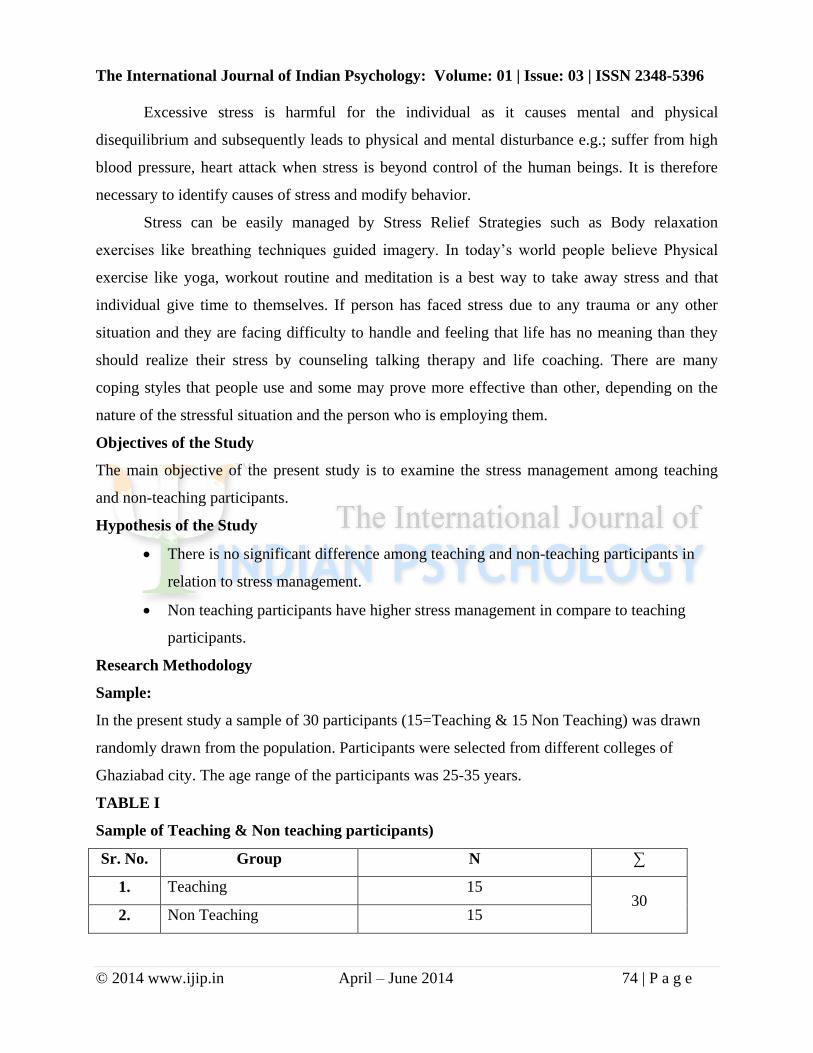
The International Journal of Indian Psychology: Volume: 01 | Issue: 03 | ISSN 2348-5396
© 2014 www.ijip.in April – June 2014 74 | P a g e
Excessive stress is harmful for the individual as it causes mental and physical
disequilibrium and subsequently leads to physical and mental disturbance e.g.; suffer from high
blood pressure, heart attack when stress is beyond control of the human beings. It is therefore
necessary to identify causes of stress and modify behavior.
Stress can be easily managed by Stress Relief Strategies such as Body relaxation
exercises like breathing techniques guided imagery. In today‟s world people believe Physical
exercise like yoga, workout routine and meditation is a best way to take away stress and that
individual give time to themselves. If person has faced stress due to any trauma or any other
situation and they are facing difficulty to handle and feeling that life has no meaning than they
should realize their stress by counseling talking therapy and life coaching. There are many
coping styles that people use and some may prove more effective than other, depending on the
nature of the stressful situation and the person who is employing them.
Objectives of the Study
The main objective of the present study is to examine the stress management among teaching
and non-teaching participants.
Hypothesis of the Study
There is no significant difference among teaching and non-teaching participants in
relation to stress management.
Non teaching participants have higher stress management in compare to teaching
participants.
Research Methodology
Sample:
In the present study a sample of 30 participants (15=Teaching & 15 Non Teaching) was drawn
randomly drawn from the population. Participants were selected from different colleges of
Ghaziabad city. The age range of the participants was 25-35 years.
TABLE I
Sample of Teaching & Non teaching participants)
Sr. No. Group N ∑
1. Teaching 15 30
2. Non Teaching 15

The International Journal of Indian Psychology: Volume: 01 | Issue: 03 | ISSN 2348-5396
© 2014 www.ijip.in April – June 2014 75 | P a g e
Tool Used:
In the present study Stress Management Scale (SMS) developed by Dr. Pushpraj Singh &
Anjali Srivastava was used for data collection. This scale has 30 items. Reliability of the scale is
0.79 and the validity of the scale is 0.83.
Procedure of data collection:
Data collection was done using random sampling. In the first phase all the participants
were briefed about how to fill up the questionnaire in the scale. The inventories were distributed
to participants. The general instructions were given to participants to complete the inventories.
Filled questionnaires were collected from participants for statistical analysis of data.
Statistical Analyses:
Mean, standard deviation and t-test were calculated for the analysis of data.
Statistical Analyses and Interpretation
The main objective of the present investigation is to examine the stress management
among teaching and non teaching staff participants. Mean, S.D and t-test was applied for
statistical analysis of data. All the calculations were calculated manually.
TABLE II
Mean, S.D., t-value of Teaching & Non-teaching participants
Sr. N. Group N Mean S.D. t-value Sig
1. Teaching Participants 15 108.13 10.39 0.85 NS
2. Non-Teaching Participants 15 111.4 10.55
The result from table II shows that Non-teaching participants mean is 111.4 and S.D. is
10.55 while teaching participants mean is 108.13 and S.D. 10.39. Teaching staff have lower
score than Non -teaching staff. The t-value is 0.85. In simple terms it can be said that Non
teaching group have high stress management in compare to teaching group

The International Journal of Indian Psychology: Volume: 01 | Issue: 03 | ISSN 2348-5396
© 2014 www.ijip.in April – June 2014 76 | P a g e
GRAPHICAL PRESENTATION (Stress Management: Teaching × Non-teaching
participants) Figure: I
DISCUSSION & CONCLUSION
The results show that non teaching participants have higher stress management. It may be
due to have a multitasking type of work conditions. Organizational stress affects the teacher's
psychological, physical and behavioral responses. It is therefore appropriate that teachers and the
senior management teams of schools study to understand themselves and others better through a
greater awareness of the stress involved in teaching (Hayward, 1993). Dunham (1984) specify
how employers have a statutory duty to make sure that working environments in schools do not
adversely affect employee‟s health. According to the Guardian (2002) and recent appeals to
reduce awards for stress at work, employees feeling under pressure have a responsibility to
inform their employees. non-teaching staff have many responsibility ,the special focus are laid
on observation of working condition, pay scale , working hours, over work, monotonous state of
work, expertise and skill required to deliver for their work time. Studies indicates that they have
pressure although they enjoy their teaching work, if they are getting bore in teaching than they
can‟t teach properly. In conclusion we can say that there is high stress management in non
teaching conditions. It may be due to have a multitasking nature of work conditions.
LIMITATIONS OF CURRENT STUDY:
1. Sample of the present study has been taken very short; it should be replicate on a large
sample.
2. More variable should be analyse in furthered research such as organizational setting, age,
gender, types of working schedule etc.
0
20
40
60
80
100
120
N Mean S.D.
non teching staff
teaching staff

The International Journal of Indian Psychology: Volume: 01 | Issue: 03 | ISSN 2348-5396
© 2014 www.ijip.in April – June 2014 77 | P a g e
REFERANCES:
1. Dunham, J. (1984) Stress in Teaching. London: Croom Helm Ltd.
2. Guardian, (2002) Judges Curb Stress Cases. Guardian, 6 February.
3. Hayward, R. (1993) Teacher stress in the primary school: an identification and
description of stressors. Educational Bulletin, 37 (1) pages 3-20.
4. Kyriacou, C. (2001) Teacher stress: Directions for future research. Educational Review,
Volume 53, pp 27-35.
5. Lazarus, R. (1999) Stress and Emotion: A New Synthesis. NY: Springer
6. Oley B.O. (1999) Boredom, Fatigue and Stress. In: KS Balogun, KA Obasan (Eds.):
Understanding Organizational Behaviour: A socio-psychological perspective. Ago-
Iwoye: Center for Sandwich Programmes, pp. 156-174.

The International Journal of Indian Psychology: Volume: 01 | Issue: 03 | ISSN 2348-5396
© 2014 www.ijip.in April – June 2014 78 | P a g e
Academic achievement of college students and their locus of
control
Ruhanshi Mathur*
ABSTRACT
The main aim of the study was to find out whether the locus of control of the individuals, of
college going age, has any effect on their academic performances or not. The objective was to
conduct a comparative study of the academic achievement and locus of control of college
students. The researcher tried to gather a fair response from the total of 60 subjects between
the age group of 18-21. The subjects were chosen randomly within the Pandit Deendayal
Petroleum University. This study did not include effect of gender on the responses, as the
locus of control is more of a cognitive drive which is independent from the gender specific
ideology of the subjects. The research instruments used were Locus of control inventory
(which reflects the way in which students feel about what happens in their academic
institutions) and Life experience inventory (which reflects the experiences of life). The
subjects were made to fill both the questionnaires and then the items were scored and results
were analyzed. The scores were given to the subjects’ response based on the norms provided.
Thereby each questionnaire response was scored and subjects were divided into two groups,
namely, High on Internality (I) and Low on Internality (E). Further to this, the subjects were
made to supply their overall academic performance grade, which was further analysed for
each of the two groups. The two groups showed a clear indication that the group with high
internality had a better Mean of their overall performance grade,7.40, whereas the latter
showed a weak overall performance grade of 5.93. Also, the two groups showed a well
correlation of the type of locus of control as per the locus of control inventory and life
experience inventory (0.97), depicting a true locus of control that the subjects follow as per
their experiences of life and the way they perceive about their academia in the college. The
Mean and Standard deviation of the scores of the two groups were 30,19 and 5,6 respectively.
Whereas the Life experience inventory showed a Mean of 17 and 10.
Recommendations: Increase the sample size as that proved to be a limitation to this study.
Further more tests could prove a better result for a larger sample size.
A study across ages and socio-economic group is also possible and might give different
results.
KEY WORDS: Internality, Locus, Correlation, Cognitive, Academia
*Student, Pandit Deendayal Petroleum University, Ahmedabad, Gujarat

The International Journal of Indian Psychology: Volume: 01 | Issue: 03 | ISSN 2348-5396
© 2014 www.ijip.in April – June 2014 79 | P a g e
INTRODUCTION
In personality psychology, locus of control refers to the extent to which individuals believe
that they can control events that affect them. Understanding of the concept was developed
by Julian B. Rotter in 1954, and has since become an aspect of personality studies. A person's
"locus" (Latin for "place" or "location") is conceptualised as either internal (the person
believes they can control their life) or external (meaning they believe that their decisions and
life are controlled by environmental factors which they cannot influence).
Individuals with a high internal locus of control believe that events in their life derive
primarily from their own actions; for example, when receiving test results, people with an
internal locus of control would praise or blame themselves and their abilities, whereas people
with a high external locus of control would praise or blame the teacher or the test.
Locus of control has generated much research in a variety of areas in psychology. The
construct is applicable to fields such as educational psychology, health psychology or clinical
psychology. There will probably continue to be debate about whether specific or more global
measures of locus of control will prove to be more useful. Careful distinctions should also be
made between locus of control (a concept linked with expectancies about the future) and
attributional style (a concept linked with explanations for past outcomes), or between locus of
control and concepts such as self-efficacy. The importance of locus of control as a topic in
psychology is likely to remain quite central for many years.
Locus of control has also been included as one of four dimensions of core self-evaluations –
one's fundamental appraisal of oneself – along with neuroticism, self-efficacy, and self-
esteem. In a follow-up study, Judge et al. (2002) argued the concepts of locus of control,
neuroticism, self-efficacy and self-esteem measured the same, single factor. The concept of
core self-evaluations was first examined by Judge, Locke, and Durham (1997), and since has
proven to have the ability to predict several work outcomes, specifically, job satisfaction and
job performance.
Various studies have been conducted across the globe to understand and establish a
correlation between academic achievement and locus of control. The results of majority of
the studies show that academic achievement is significantly affected by the locus of control
of individuals. . The aim of this study is to reconfirm and re-establish the correlations
between the variables.Locus of control is the personal belief about the extent to which one's
behaviors influence a specific outcome (Rotter, 1966).[1]
Rotter (1975) cautioned that internality and externality represent two ends of a continuum,
not an either/or typology. Internals tend to attribute outcomes of events to their own control.
People who have internal locus of control believe that the outcomes of their actions are
results of their own abilities. Internals believe that their hard work would lead them to obtain
positive outcomes.They also believe that every action has its consequence, which makes them
accept the fact that things happen and it depends on them if they want to have control over it
or not. Externals attribute outcomes of events to external circumstances. People that have
external locus of control believe that many things that happen in their lives are out of their
control. They believe that their own actions are a result of external factors that are beyond
their control. Rotter in his study suggested that people that have external locus of control
have four types of beliefs which include the following: powerful others such as doctors,

The International Journal of Indian Psychology: Volume: 01 | Issue: 03 | ISSN 2348-5396
© 2014 www.ijip.in April – June 2014 80 | P a g e
nurses, fate, luck and a belief that the world is too complex to predict its outcomes. People
that have external locus of control tend to blame others for the outcomes rather than
themselves.
Rotter described internals as individuals who believe that success or failure is due to their
own efforts, while externals are those who believe that the reinforcers in life are controlled by
luck, chance, or powerful others. Externals see little impact of their own efforts on the
amount of reinforcement they receive. Numerous studies about factors associated with
academic performance have identified contextual and social characteristics of students as
important factors. These factors include family, peers, school, and community.[2]
Julian
Rotter is credited for introducing the concept of Locus of Control. His work was largely
based off the work of Albert Bandura, who developed the social learning theory. Rotter
explains that humans can interpret events as being either a result of one’s own actions or
external factors. He goes on to suggest that whether or not people believe a situation or event
is under their own control will influence their reward expectancy and behaviour.[5]
Previous studies have also documented two psychosocial factors, locus of control and self-
efficacy, as important predictors of academic performance of college students. Students who
believe they are responsible for their own behavior are described as having an internal locus
of control. Those who believe that other factors such as luck, fate, chance, or powerful others
determine their life outcomes, rather than their own behavior are described as having an
external locus of control. [3]
Jones and colleagues (1995) also found a relationship between Locus of Control and study
skills. A study by Onwuegbuzie and Daley (1998) showed that those with very good study
skills tended to have an internal academic Locus of Control. Richardson (1995) found, in a
sample of Caribbean students, that internality was more prominent in older students
compared to younger students. Janssen and Carton (1999) showed that internal students in
their samples began work on tasksmore promptly than externals, and turned assignments in
sooner. Skinner (2003) suggests that the Academic Locus of Control scale can be an
important tool forcounselors working with college-bound students with learning disabilities,
as it can be used tomonitor Locus of Control and perhaps assist in a shift toward internality.
METHODOLOGY
For the purpose of this study the target audience selected was between the age group of 18-
21. A sample of 60 college students was randomly chosen from Pandit Deendayal Petroleum
University, Ahmedabad city, engineering and arts stream mixed. The researcher used two
questionnaires namely locus of control (loco) inventory and Life experience inventory. Each
subject was required to fill both these questionnaires one after the other. The first
questionnaire is locus of control inventory. The locus of control orientations are reflected in
the way people feel about what happens in their academic institutions, how much of the
control they show fromjust a mere Chance/Luck (EC), or from other factors that includes
environment, parents, other people, friends etc (EO). It measures 3 dimensions –

The International Journal of Indian Psychology: Volume: 01 | Issue: 03 | ISSN 2348-5396
© 2014 www.ijip.in April – June 2014 81 | P a g e
I(internality),E(others) and E(chance). This questionnaire consisted of 30 questions and a 5
point scale was used in scoring responses. The subject was required to read the question and
choose the most appropriate option.The responses were thereby scored as per the norm
provided and the subjects were grouped initially in the three groups as per their scores in I,
EO and EC. Thereafter the Mean and standard deviation of the I and E scores was found. And
the ranges were fixed as per Mean±1/2 Std.dev. Firstly the subjects with I>E were grouped as
Internal and External respectively. Thereafter on the basis of the ranges, they were re-
grouped as having Internal Locus or External Locus. The other questionnaire – life
experience inventory , was based on the experiences of people in their lives. It consisted of 25
pairs of proverbs with 2 response sets of each. The subject was required to encircle the most
appropriate answer. The responses were scored as per the norm given and their mean and
standard deviation was found. The Mean was 16, and thus people with scores above 15 were
grouped as High on Internality and the ones less than 13 as Low on Internality. There was no
time limit for both the questionnaires. After the grouping was done, the correlation found
between the subjects between their two questionnaires to establish their validity of responses.
Then the overall academic performance index of each subject was mapped against them, and
the Mean scores of both the groups were found to establish the comparison between the
performance of the two groups.
RESULTS AND DISCUSSIONS
Table 1. Comparision of Performance and Locus of Control
I EO EC
Mean 30 19 16
Std. Dev 4 5 7
Upper Range (Mean+(1/2)Std) 33 22 20
Lower Range (Mean-(1/2)Std) 28 17 13
Table 2. Mean, standard deviation and ranges for I, EO and EC scores
Correlation Coefficient (
E ) 0.97563
Correlation Coefficient (
I ) 0.97997
Table 3. Correlation between the External and Internal Subjects of Loco and Life Experience
The table 1. Shows the strong relation between the internal locus group people with a higher
average academic grade. The table 2. Shows the mean, and standard deviation of the scores of
I, EO and EC, these values were used to form the upper range and lower range as per the
norms to classify the subjects as per their locus of control. Then a strong correlation
coefficient in table 3 shows the validity of the responses of the subjects as per both the
Sl. No. Group Mean of Academic Grade
1. Internal Locus Group 7.40
2. External Locus Group 5.93

The International Journal of Indian Psychology: Volume: 01 | Issue: 03 | ISSN 2348-5396
© 2014 www.ijip.in April – June 2014 82 | P a g e
questionnaires. Because of high correlation, we found that the subjects with high internality
in the life experience inventory were also the internal locus subjects in the loco inventory
questionnaire.
CONCLUSIONS
As it is evident from the analysis from table 1. that the average overall academic performance
score for the subjects with an Internal locus of control/high on internality is more than that of
those with an External locus of Control/low on internality. It can thus be concluded on the
basis of the above research made that, college going students with an internal locus of control
can be expected to perform better in their academics and also have a positive attitude towards
life. Whereas the ones with an external locus of control are expected not to perform as well as
the previous case.
However, having concluded to this doesn’t totally prove the High Internality people to always
be the achievers or the low internality people to be less successful. The study limits to a small
number of subjects. Also, the subjects with a diversified socio-economic conditions could
display a slightly changed results.
Still, as mostly seen, even this research points towards a good relation between the academic
performance and Internal Locus of control.
RECOMMENDATIONS AND LIMITATIONS
There were various limitations found to this study. Firstly, Its age specific since its targeting
only a particular age group ,i.e., college students (18-25), so it limits from getting a broader
view of the subject. Also there will be an unbiased ratio between the genders while
conducting the study.
Another problem is the Genuineness of the responses ,i.e., whether the person is responding
and filling the questionnaire in an uninterested manner or not, affects the end result. The
sample size taken for this study was 60. This probably could have been a limitation for our
study since the sample size was too small to represent the population
REFERENCES:
1. [1]College Student Journal Publisher: Project Innovation (Alabama) Audience:
Academic Format: Magazine/Journal Subject: Education Copyright: COPYRIGHT
2007 Project Innovation (Alabama) ISSN: 0146-3934
2. [2]Murphy, 1986; Bisnaire et al., 1990; Caldas & Bankston, 1997; Halle et al., 1997;
Israel & Hartless, 2001; Shumow & Miller; 2001; Henderson & Mapp, 2002; Furrer
& Skinner, 2003; and Pratts, 2004). ProQuest Dissertations and Theses, 2009
3. [3],[4]Renea Yates,ProQuest Dissertations and Theses, 2009, Dissertation

The International Journal of Indian Psychology: Volume: 01 | Issue: 03 | ISSN 2348-5396
© 2014 www.ijip.in April – June 2014 83 | P a g e
4. [5] Hoffmann, M. & Schenk, J. (1985). The logic of operationalization of the locus-
of-control concept of Rotter: Examination of the bipolarity of internal external
control. Diagnostica, 31, 93-104
5. Carlson, N.R., et al. (2007). Psychology: The Science of Behaviour - 4th Canadian
ed.. Toronto, ON: Pearson Education Canada.
6. Dormann, C.; Fay, D.; Zapf, D.; Frese, M. (2006). "A state-trait analysis of job
satisfaction: On the effect of core self-evaluations". Applied Psychology: an
International Review 55 (1): 27–51.doi:10.1111/j.1464-0597.2006.00227.x.
7. Furnham & Steele (1993). Measuring Locus of Control: A critique of general,
children's, health- and work-related Locus of Control questionnaires. British Journal
of Psychology, 84, 443-479
8. Hashway, R. M. (1990). Academic Locus of Control and the collegiate experience.
Research & Teaching in Developmental Education, 7, 45-54.
9. Ibrahim, A. M. (1996). A cross-cultural validation of Trice's academic Locus of
Control scale for college students in an Omani sample. Perceptual and Motor Skills,
83, 823-829.
10. Iskender, M. & Akin, A. (2010). Social self-efficacy, academic Locus of Control, and
internet addiction. Computers and Education, 54, 1101-1106
11. Janssen, T. & Carton, J. S. (1999). The effects of Locus of Control and task difficulty on
procrastination. Journal of Genetic Psychology, 160, 436-442.
12. Jones, C. H., Slate, J. R. & Marini, I. (1995). Locus of Control, social interdependence
academic preparation, age, study time, and the study skills of college students. Research in
the Schools, 2, 5-62.
13. Judge, T. A.; Locke, E. A.; Durham, C. C. (1997). "The dispositional causes of job
satisfaction: A core evaluations approach". Research in Organizational Behavior 19: 151–188.
14. Judge, Timothy A.; Erez, Amir; Bono, Joyce E.; Thoresen, Carl J. (1 January 2002). "Are
measures of self-esteem, neuroticism, locus of control, and generalized self-efficacy
indicators of a common core construct?". Journal of Personality and Social
Psychology 83 (3): 693–710.doi:10.1037/0022-3514.83.3.693. PMID 12219863.
15. Ogden, E. P. & Trice, A. D. (1986). The predictive validity of the Academic Locus of Control
Scale for college students: Freshman outcomes. Journal of Social Behavior and Personality, 1,
649-652.
16. Training Instruments For Hrd And Od (Book + Cd), 2/E, Pareek, 162-165.
17. Onwuegbuzie, A. J. & Daley, C. E. (1998). Study skills of undergraduates as a function of
academicLocus of Control, self-perception, and social interdependence. Psychological
Reports, 83, 595-598.
18. Richardson, A. G. (1995). Academic Locus of Control of university students: A Caribbean
case study. Perceptual and Motor Skills, 81, 1388-1390.
19. Skinner, A. L. (2003). Using Locus of Control to improve self-determination and outcomes
for consumers with learning disabilities. Journal of Applied Rehabilitation Counseling, 34,
27-32.
20. Trice, A. (1985). An academic Locus of Control scale for college students. Perceptual and
Motor Skills, 61, 1043-1046
21. Trice, A. et al. (1987). Concurrent validity of the Academic Locus of Control Scale.
Educational and Psychological Measurement, 47, 483-486

The International Journal of Indian Psychology: Volume: 01 | Issue: 03 | ISSN 2348-5396
© 2014 www.ijip.in April – June 2014 84 | P a g e
Yoga in Relation to its Psychophysical Impact
Dr. Shailesh Raval*
Introduction
Yoga is widely practiced as a means to promote physical, psychological and spiritual
well-being. While a number of studies have documented the efficacy of yoga for functioning in
healthy individuals and those experiencing illness or pain, bio-psychosocial effects have not been
detailed. We propose an analogue between the physical, psychological and spiritual effects of
practice as support in yoga traditions, and the bio-psychosocial model of health.
To this end, we present a review and conceptual model of the potential bio-psychosocial
benefits of yoga, which may provide clues regarding the possible mechanisms of action of yoga
upon well-being. Physical systems activated through yoga practice include musculoskeletal,
cardiopulmonary, autonomic nervous system and endocrine functioning. Psychological benefits
include enhanced coping, self-efficacy and positive mood. Spiritual mechanisms that can be
understood within a Western medical model include acceptance and mindful awareness. We
present empirical evidence that supports the involvement of these domains. However, additional
well-conducted research is required to further establish the efficacy of yoga for heal research is
required to further establish the efficacy of yoga for health states, and to understand how posture,
breath and meditative activity affect the body, mind and spirit.
People who suffer from high blood pressure often wonder if there are ways to lower
blood pressure naturally. Well, indeed, there is. Diet and exercise are already well-known
remedies for high blood pressure. Less well known, perhaps, is that yoga offers natural therapy
for high blood pressure as well. Numerous studies show that yoga therapy can be a great remedy
for high blood pressure, with results showing up in as little as twelve weeks.
Definition of Yoga:
Patanjali’s famous definition of yoga is “yogaschittavrittinirodhah”, which means “yoga
is the removal of the fluctuations of the mind”. Chitta is mind, vrittis are thought impulses,
nirodah is removal.
*Smt. Sadguna C. U. Arts College for Girls. Lal Darwaja, Ahmedabad, Gujarat.

The International Journal of Indian Psychology: Volume: 01 | Issue: 03 | ISSN 2348-5396
© 2014 www.ijip.in April – June 2014 85 | P a g e
Bhagavad Gita, a main yoga text, the first time the word yoga appears it is as a solution
Krishna offers Arjuna for overcoming his inability to participate in his life. Yoga is clear,
discerning, totally voluntary, dynamic participation in one’s life. Yoga is sacrifice that elevates
us, motivates us, actively engages us and does so in a manner that is harmonious to all
other living beings.
Physiological benefits of yoga:
Sleep pattern is improved. Yoga normalizes weight. Energy levels increase. Immunity
increases. Pulse rate decreases. Blood pressure decreases.
Psychological benefits of yoga:
Concentration is improved. Attention focus is improved. Memory is enhanced. Mood
swings get stable. Social skills improve. Poise and steadiness grow.
What is blood pressure?
As per oxford dictionary “Blood pressure is the pressure of the blood in the circulatory
system, often measured for diagnosis since it is closely related to the force and rate of the
heartbeat and the diameter and elasticity of the arterial walls:”
"Blood pressure" usually refers to the arterial pressure of the systemic circulation. During
each heartbeat, blood pressure varies between a maximum (systolic) and a minimum (diastolic)
pressure.
The table on the right shows the classification of blood pressure adopted by the Indian
Heart Association for adults who are 18 year and older.
Classification of blood pressure for adults
Category systolic, mmHg diastolic, mmHg
Hypotension < 90 < 60
Desired 90–119 60–79
Pre-hypertension 120–139 80–89
Stage 1 Hypertension 140–159 90–99
Stage 2 Hypertension 160–179 100–109
Hypertensive Emergency ≥ 180 ≥ 110

The International Journal of Indian Psychology: Volume: 01 | Issue: 03 | ISSN 2348-5396
© 2014 www.ijip.in April – June 2014 86 | P a g e
What is anxiety?
A.P.A. says that “Anxiety is an emotion characterized by feelings of tension, worried
thoughts and physical changes like increased blood pressure.”
Anxiety is an unpleasant state of inner turmoil, often accompanied by nervous behavior,
such as pacing back and forth, somatic complaints and rumination. It is the subjectively
unpleasant feelings of dread over something unlikely to happen,
Subtypes of anxiety disorders are phobias, social anxiety, obsessive-compulsive behavior,
and Posttraumatic stress disorder. The physical effects of anxiety may include heart
palpitations, tachycardia, muscle weakness and tension, fatigue, nausea, chest pain,
shortness, headache, stomach aches, or tension headaches. As the body prepares to deal with a
threat, blood pressure, heart rate, perspiration, blood flow to the major muscle groups are
increased, while immune and digestive functions are inhibited (the fight response). External signs
of anxiety may include pallor, sweating, trembling, and papillary. For someone who suffers
anxiety this can lead to a panic attack. "Anxiety" could be defined as agony, dread, terror, or
even apprehension.
Objective:
“The purpose of this study was to measure the effects of Yoga techniques in context to
anxiety and blood pressures”.
Variables of the study:
The present study involves anxiety and blood pressure level as dependent variable and
yoga techniques as independent variable.
Hypothesis:
In relation to this study, there is null hypothesis obtained by the researcher. There are no
positive effects of yoga on anxiety and blood pressure.
Sample:
The present study was conducted at yoga village at Shilaj, Ahmadabad. The total sample
of the study was 48 male and female of age range is 23 to 67years.
Method:
For the purpose of this study, 48 male and female of various ages were selected. The
purposive sampling method was chosen for this study. Two parameter were selected, Anxiety
and Blood pressure.

The International Journal of Indian Psychology: Volume: 01 | Issue: 03 | ISSN 2348-5396
© 2014 www.ijip.in April – June 2014 87 | P a g e
Anxiety was measure by Sinha’s Comprehensive Anxiety Test (SCAT): developed by
A.K.P Sinha and L.N.K Sinha in (1995).
Reliability:
The coefficient of reliability was determined by using the Product moment correlation
was 0.85 and by using Spearman Brown Formula was 0.92. Both the values ensure a high
reliability of the test.
Validity:
The coefficient of validity was 0.62, which is significant beyond 0.01Level of
confidence. Higher the scores show higher the anxiety. Observation was taken during the time
gap of one month and positive impact was observed.
Variables of the study:
The present study involves anxiety and blood pressure level as dependent variable and
yoga techniques as independent variable.
This was resulted as per the tables under here:
Analysis:
Anxiety
Gender Before After
Male (18) High 11 5
Normal 7 13
Female(30) High 17 14
Normal 13 16
Total 48 48

The International Journal of Indian Psychology: Volume: 01 | Issue: 03 | ISSN 2348-5396
© 2014 www.ijip.in April – June 2014 88 | P a g e
Blood pressure
Classification of blood pressure for adults Before After
Male Female Male Female
Category systolic, mmHg diastolic, mmHg
Hypotension < 90 < 60 0 0 0 0
Desired 90–119 60–79 2 11 7 18
Pre-hypertension 120–139 80–89 6 8 4 5
Stage 1 Hypertension 140–159 90–99 9 7 6 4
Stage 2 Hypertension 160–179 100–109 1 4 1 3
Hypertensive
Emergency ≥ 180 ≥ 110
0 0 0 0
Total 18 30 18 30
61.11%
38.89%
56.67%
43.33%
27.78%
72.22%
46.67%
53.33%
0.00%
10.00%
20.00%
30.00%
40.00%
50.00%
60.00%
70.00%
80.00%
male high male normal Female high Femal normal
Before yoga After yoga

The International Journal of Indian Psychology: Volume: 01 | Issue: 03 | ISSN 2348-5396
© 2014 www.ijip.in April – June 2014 89 | P a g e
Result and discussion:
The above table indicates that there was a difference. In this relation to our null hypothesis, it has
been clearly rejected. The result says that there is positive significance of yoga and meditation
techniques is quiet effective in healing of anxiety and blood pressure.
Reference:
1. Brown Rp. Gerbarg PL. (Aug.2005) Sudarshnkriya Yogic Brathing in the Treatment of
stress, Anxiety, and Depression. Journal of Alternative and Complimentary Medicine.
2. Granath J. Ingvarson S. Von Thiele U. Lundberg U. (2006). Stress management: a
randomized study of cognitive behavioural therapy and yoga.
3. Barbee, J. G. (1998). Mixed symptoms and syndromes of anxiety and depression:
Diagnostic, prognostic, and etiologic issues. Annals of Clinical Psychiatry, 10:15–29.
0%
11%
33%
50%
6%0% 0%
39%
22%
33%
6% 0%
0%
37%
27% 23%13%
0% 0%
60%
17% 13% 10% 0%
0%
10%
20%
30%
40%
50%
60%
70%
Blood Pressure
Before yoga After yoga

The International Journal of Indian Psychology: Volume: 01 | Issue: 03 | ISSN 2348-5396
© 2014 www.ijip.in April – June 2014 90 | P a g e
4. Regier, D. A., Rae, D. S., Narrow, W. E., Kaelber, C. T., &Schatzberg, A. F. (1998).
Prevalence of anxiety disorders and their co morbidity with mood and addictive
disorders. British Journal of Psychiatry. Supplement, 34: 24–28.
5. WebMD University course "Eating Well: A Start Towards Healthy Living" with Wendy
Oliver-Piatt, MD. WebMD University Course "Fitness Goals" with Wendy Oliver-Piatt,
MD. WebMD University Course "Your Fitness Options" with Wendy Oliver-Piatt, MD.
WebMD Feature "Yoga: Fitness from the Inside Out" by Lynda Liu and William
Collinge.

The International Journal of Indian Psychology: Volume: 01 | Issue: 03 | ISSN 2348-5396
© 2014 www.ijip.in April – June 2014 91 | P a g e
Adjustment and health care awareness among youths of
Rajkot district
Mohit M. Pandya*, Dr. D. J. Bhatt**
ABSTRACT
The purpose of present study was to find out correlation between the youths‟ adjustment
and their health care awareness. The said sample was 240 both males and females in equal numbers
was selected through random sampling. Adjustment Inventory & Health Care Awareness Inventory
are tailor-made instruments, having sufficient reliability and validity. For the purpose of analysis,
The Karl-Pearans „r‟ technique was used. Present study reveals the result that there is significant
positive correlation between the youths‟ Adjustment and their Health Care Awareness. The authors
suggest that there is a need to explore the rural and the urban youths‟ correlation in the line of
above study.
KEY WORDS: - Adjustment and Health care awareness.
* M.A., M.Phil, Department of Psychology, Saurashtra, University, Rajkot, India
**Professor and Head Department of Psychology Saurashtra University Rajkot-360005

The International Journal of Indian Psychology: Volume: 01 | Issue: 03 | ISSN 2348-5396
© 2014 www.ijip.in April – June 2014 92 | P a g e
INTRODUCTION
Health care for the youth happiness, health, satisfaction, enjoy peace of mind, physical exercise,
regular eating, adequate sleep, etc .should adopt identical. As defined by World Health
Organization (WHO 1946), it is a “State of complete physical, mental, and social well being and
not merely the absence of disease or infirmity”. Young people may also adjust the way work
involves adjusting the present study, young adults, and health care awareness are associated with
mutual that the studies also made clear. “Adjustment refers to Change in ourselves and our
environment to satisfy our needs and to meet with our demands as well as to establish satisfactory
relation with others” (Eastward Atwater).
Harlow, Lisa, Weiner, Jennifer, Adams, Jerome, Grebstein, Lawrence. (1995). Psychological
adjustment of college student from families of divorce. Positive parent- Child relationships and the
smooth relationship of parents are the strongest indicators of the favorable adjustment of children
from divorced families to college life. According to an examination of the variable groupings which
influenced college adjustment, 'inside family' variables are the strongest predictors of healthy
adjustment compared with 'outside family' variables such as negative life events and social support
and 'individual' variables which include age at the time of divorce and gender.
R.L. BHARSAKHALE (2013) A study of marriage attitude and adjustment among art and
science faculty students by employing a sample of 140 subjects in which 70 subjects were Arts
faculty were Arts faculty (35 Male and 35 Female) and 70 subjects were Science faculty (35 Male
and 35 Female) with age ranging from 21 to 24 years located From Aurangabad District were
selected. The Marriage Attitude scale. This scale was developed and standardized by Pramod
Kumar and An Adjustment Inventory (for school and College pupils). This scale was developed and
standardized by Dr.Penni Jain. A factorial design was used; since there were two independent
variables i.e. Faculty and Gender. A 2x2 factorial design was used to analyzing the data. It was

The International Journal of Indian Psychology: Volume: 01 | Issue: 03 | ISSN 2348-5396
© 2014 www.ijip.in April – June 2014 93 | P a g e
found that the Science faculty students have positive marriage attitude from the arts faculty students
and Science faculty students have good adjustment than arts faculty students.
Priti Lata and G.L.Yadav (2011) A Study of Youth Problems, Family Relationship &
Certain Psychological Aspects Like Impulsiveness In Relation To „Academic Achievement of
Teen-aged Girls in the Present Era. In the modern era when all the parents desire to see their
children, including girls, highly placed, it becomes the topic of at most concern to evaluate their
'Academic Achievement' in relation to familial, social and personal perspective. It is during
adolescence that many changes occurs that strongly influence the development of career
preferences and aspirations and thus struggle for 'Academic Achievement' Hence, the present study
was designed to study the status of 'Family Relationship', ' Youth Problems' and 'Impulsiveness' in
'Teen-aged School' and „college Girls‟ and their relationship with Academic Achievement.
Kim, Sooyeon; Brody, Gene H. (2005) Longitudinal Pathways to Psychological Adjustment
among Black Youth Living in Single-Parent Households. A 5-wave model linking family and
maternal functioning to youth psychological adjustment was tested with 139 single-mother-headed
African American families with young adolescents (mean age = 11 years at recruitment) living in
the rural South. Structural equation modeling indicated that an accumulation of family risk factors
at Wave 1 was linked with maternal psychological functioning at Wave 2, which forecast
competence-promoting parenting practices at Wave 3. These parenting practices indirectly forecast
youth externalizing and internalizing behaviors 2 years later at Wave 5, through youth self-
regulation at Wave 4. The hypothesized model was retested, controlling for Wave 1 youth
externalizing and internalizing behaviors. All paths remained significant, indicating that the model
accounted for change in youth psychological adjustment across 4 years. Thus, it becomes clear that
the above studies youth adjustment and health care awareness are associated with each other.

The International Journal of Indian Psychology: Volume: 01 | Issue: 03 | ISSN 2348-5396
© 2014 www.ijip.in April – June 2014 94 | P a g e
METHOD
Study method is presented below.
OBJECTIVES:-
To check correlation between adjustment and health care awareness of Rajkot District
youths.
HYPOTHESIS:-
There is no correlation between adjustment and health care awareness of Rajkot district
youths.
SAMPLE:-
The respondents of the present study 240 young people randomly selected from various
areas in Rajkot district. In present research the total sample consisted of 120 male and 120 female
Rajkot district were chosen.
TOOLS:-
1. REVISED ADJUSTMENT INVENTORY (RAI)
The revised adjustment scale was made by Pramodakumara (1997). Giving a total of 40
statements. These statements answer 'yes' or 'no' is given in. Its main purpose is to understand the
person's general adjustment. In this scale statement no. 33 are positive and others statements are
negative. The questionnaire Reliability and validity of this scale was high.
2. HEALTH CARE AWARENESS INVENTORY
The health care awareness scale was made by Dr. D. J. Bhatt and Dr. K. N. Jhalodiya
(2009). Giving a total of 40 statements. Statements for each 'yes', „neutral‟ and 'no' alternatives.
Including 1, 2, 3, 5, 7, 8, 9, 10, 11, 12, 13, 14, 16, 18, 19, 20, 21, 26, 29, 30, 31, 34, 35, 36, 40
Order statements were formative nature. The 4, 6, 15, 17, 22, 23, 24, 25, 27, 28, 32, 33, 37, 38, 39
was the number one form of negative statements. The questionnaire Reliability is 0.89 and Validity
is 0.93 established by the author.

The International Journal of Indian Psychology: Volume: 01 | Issue: 03 | ISSN 2348-5396
© 2014 www.ijip.in April – June 2014 95 | P a g e
PROCEDURE:-
In this research two test were administrated individually as well as on young people, which
collecting data for the study before attempting the questionnaire the subjects were requested to read
the instruction carefully and follow them in true spirits. While the data collection was completed
then‟ „r‟ was used to check correlations.
RESULTS AND DISCUSSION
Table-1
Correlation calculation between Youth adjustment and youth health care awareness of
Rajkot district youths.
Concluded from the table is that the adjustment and health care awareness a positive
correlation of 0.32 between the occurs. Moderately positive correlations that can be called. Around
youth health care awareness and adjustment meaningful correlation between the occurs. Hypothesis
is therefore to be rejected and the conclusion is that the health care awareness and adjustment are
associated with each other. Means that if one increases the other will increase.
CONCLUSION
The study presented in Rajkot district youth health care awareness and adjustment of which
are connected to each other in check. Meaningful result was found. Variable moderately correlation
Sr. no.
Variables
N
df
r
Sig.
Levels
1.
Youth
adjustment
240
239
0.32
0.01
2.
Youth health
care awareness
240
239

The International Journal of Indian Psychology: Volume: 01 | Issue: 03 | ISSN 2348-5396
© 2014 www.ijip.in April – June 2014 96 | P a g e
was seen between the two. Thus, Youth adjustment and Youth health care awareness is correlated
with each other moderately solid. Be the case.
REFERENCES
1. Antonovsky, A. (1979), Health, stress and coping: New perspectives on mental and physical
well being, San Francisco.
2. Atwater, E. (1995). Psychology for living: Adjustment, growth and behavior Today, New
Delhi: Prentice Hall.
3. Dr. B. A. Parikh, Individual adaptation of Psychology, Eastwood Atwater. (2003)
Psychology of Adjustment, Kim, Sooyeon; Brody, Gene H. Journal of Family Psychology,
Vol 19(2), Jun 2005, 305-313. Doi: 10.1037/0893-3200.19.2.305
4. Marks, D.F.Murray, M.Evans, B.Willing, (2001) Health psychology: Theory, Research and
practice, New Delhi: Sage Publications.
5. Pritilata and G.L.Yadav, International Referred Research Journal, December, 2011. ISSN-
0974-2832, RNI-RAJBIL 2009/29954; VoL.III *ISSUE-35
6. R.L.Bharsakhale, Golden Research Thoughts Volume 2, Issue. 12, June. 2013, ISSN:-2231-
5063
7. Tejpreet Kaur Kang & S.K.Bawa, (1999). Attitude of young adults towards Marriage (Vol.
30, No.1 39- 42)

The International Journal of Indian Psychology: Volume: 01 | Issue: 03 | ISSN 2348-5396
© 2014 www.ijip.in April – June 2014 97|P a g e
Stress and sexual dysfunction among call center employees
Dr. V.D. Kasture*
INTRODUCTION
The call center community often defines itself as an industry, with numerous national and
international call centers. But there has some dispute among researchers as to whether it is
appropriate to refer such thing as the „call center industry‟. Bain and Taylor (1999) argue that it
is more appropriate to use the term „sector‟ as call centers are found across a wide range of
industries and may be similar primarily in terms of their core technologies. Belt, Richardson and
Websler (2000) agreed that call centers are not an „industry‟ as the term generally defined, but
rather represent certain ways of delivering various services using the telephone and computer
technologies across traditional industry boundaries.
The basic reason by which employees getting stress in their routine life is nonstop mobile
calling, duty to make interaction with customer and complete the target within the time, threat
and intensity, make the employees stressful and depressed. Dollard, Dormann, Boyd and Wine
field (2003) assessed two unique stressors associated with the human service work i.e emotional
dissonance, the need to hide negative emotions and client related social stressors. The latter may
involve disproportionate customer expectations and verbally aggressive customers. These
stressors affect all human service workers, even though they may vary in the extent to which
their work involves lasting relationship with customers. They argued that social support and
training designed to develop „role separation‟ are crucial resources needed to help human service
workers cope with the unique stressors of their job. The key stressors in call centers are:
*Associate Professor, Shivaji College, Kannad, Dr. BAMU University, Aurangabad, Maharashtra

The International Journal of Indian Psychology: Volume: 01 | Issue: 03 | ISSN 2348-5396
© 2014 www.ijip.in April – June 2014 98|P a g e
1. Nature of job:
The primary source of stress reported is inherent to the nature of the job spending all day
on the phone dealing with the people one another day after day is difficult. Knights and Mccabe
(2003) took a different approach to stress in the work place.
2. Quality/quantity conflict:
Call centers are rooted in contradictory tensions and structural paradoxes and confront a
number of tradeoffs on that basis. There set a context for attitudes towards the organization and
can impose conflicting role requirements of agents.
3. Intensity:
The third central stressor in call center work is intensity. As Bain (2001) argues „far from
beginning either in terminal decline or on the wane, Taylorism in conjunction with a range of
either control mechanisms is not only alive, well and deeply embedded in the call center labor
process but its malevolent influence appears spreading to previously cincharted territory.‟
4. Targets:
There is a fourth feature of some call center work that may engender stress performance
targets.
A city based survey of women in the reproductive age group has found that work related stress is
playing havoc with women sexual health and affecting their chances of conceiving. International
studies in the past have linked stress and sexual dysfunction and infertility among women. Stress
hormones released by adrenal gland affect the entire reproductive system. 90% of women were
found to suffer from some kind of menstrual irregularity (working at corporate jobs). Those
enduring stress for long time including long working hours and unrealistic deadlines had
amenorrhea. A study from the university of Berkeley in 2009 showed that stress hormones
released by the adrenal gland affect the entire reproductive system.
In Mumbai study done by homoeopathy looked at 125 women with the problem relating to their
monthly ovulation cycle. Some not had menses for a few months while some had heavy

The International Journal of Indian Psychology: Volume: 01 | Issue: 03 | ISSN 2348-5396
© 2014 www.ijip.in April – June 2014 99|P a g e
bleeding. All of them were working women and had high level of cortical, stress hormone, said
doctor. Stress has several physical manifestations in women life.
METHOD
Sample:
The samples of the present study consist of 100 female employees working in call centers.
Tool:
1. Occupational stress scale
2. Brief sexual function inventory
Procedure:
In the present study 100 females were selected from the call center in Pune, 50 from
international and 50 from domestic call center.
Result and Interpretation:
In this research the results are under Mean, SD and t ratio of employees from Domestic and
International call centers on stress and sexual dysfunction.
Table 1:
Call center Stress Mean SD t value
Domestic 136.3 21.2
5.33** International 143.3 11.6
Table 2:

The International Journal of Indian Psychology: Volume: 01 | Issue: 03 | ISSN 2348-5396
© 2014 www.ijip.in April – June 2014 100|P a g e
Call center
(sexual Dysfunction)
Mean SD t value
Domestic 19.7 2.43 1.12
International 28.5 3.81 0.86
The result indicates that employees working in two different call centers differ significantly.
This research results revealed that female employees from international call centers show high
stress score and high sexual dysfunction than domestic call center employees, which means the
female employees from international call center differed significantly (t=5.26, p=<0.01) than
domestic call center female employees.
Results obtained from t test showed that female employees from domestic and international call
center differed significantly with one another onstress scores and sexual dysfunction. The reason
is that international call center employees have more work stress as compare to that with
domestic one. This due to heavy work load, not enough time for social interaction and
completion of work within a given period of time. The work culture is more strict and systematic
as compared to domestic one. International studies in the past have linked stress t sexual
dysfunction and infertility among women.
The overall results of the present study suggest the need for stress management programs for
reducing the stress and developing positive thinking among young female employees working in
call centers.
Reference
1. Belt, V. Richardson, R and Webster J(2000) women work in the information
economy; the case of telephone call centers, Information, communication and
society,3,366-385.
2. Brown, W.A (1998) The placebo effect, scientific American Magazine, 9278:1, 90-
95.
3. Dollard, M.F, Dormann, C., Boyd C.M. and Winefield, H.R.(2003), Unique aspects
of stress in human service work Australian Psychologist, 38, 84-91.

The International Journal of Indian Psychology: Volume: 01 | Issue: 03 | ISSN 2348-5396
© 2014 www.ijip.in April – June 2014 101|P a g e
4. Knights D. and Mccabe D.(2003) Governing through Teamwork: Reconstituting
subjectivity in a call center. Journal of management studies, 40 1587-1611.
5. Lankshear, G. Cook, P. Mason, D. Coats, S. Button, G.(2001) notes and issues “Call
canter employees responses to electronic monitoring: some research findings”, work
employment and society 15, 595-605.
6. Norman, K.Nilsson, T. and Hagberg M(2004) working conditions and health among
female and male employees at a call center in Sweden, American Journal 01-
Industrial Medicine , 46, 55-62.
7. Taylor P and Bain P (1999) An assembly line in the head ; work and employees
relationship in call center, Industrial Relation journal 30(2), 101-117.

The International Journal of Indian Psychology: Volume: 01 | Issue: 03 | ISSN 2348-5396
© 2014 www.ijip.in April – June 2014 102 | P a g e
Depression among B.Ed college students
Ramesh O. Prajapati*
ABSTRACT
Aim of the research is to find out the depression among B.ed College students, So, investigator
selected two groups one is male and other is female, both groups have 120 students. In each group
has 60 male and other one groups has 60 female students. Data were collected from different
collages of v.v.nagar city. Scale was use for data collection is personal datasheet and depression
scale developed by A.T. Back (1967), 2x2 factorial design was used and data were analysis by
ANOVA test. Result show, There is significant difference between the depression among male and
female B.ed college student. There is significant difference between the depression among urban
and rural B.ed college student. There is significant difference between the effect of interaction on
depression among type of sex and type of area of B.ed college student.
INTRODUCTION
Everyone has experienced feelings of depression at one time or another. Each
person‟s experience of depression is different as there is a wide variety of symptoms. Many
people feel down occasionally, or go through bad patches, but have areas in their lives that
make them feel good, and like things about themselves. For some people though, life is more
of a struggle. They feel bad about themselves and their lives in most ways. At times they feel
complete despair. If you feel like this, then you may be depressed.
What is depression?
Depression is prolonged and persistent mood which can color and interfere with many
aspects of one‟s life. It is characterized by feelings of worthlessness, excessive guilt,
loneliness, sadness, hopelessness, self-doubt and guilt. Suicidal thoughts may also be present.
Normal everyday depression can last for a few minutes to a few days. We‟ve all felt these-
*Ph.D Student, Department of Psychology, S.P.University, V.V.Nagar, Gujarat.

The International Journal of Indian Psychology: Volume: 01 | Issue: 03 | ISSN 2348-5396
© 2014 www.ijip.in April – June 2014 103 | P a g e
periods of being “down” or “sad”. These feelings are a normal part of being human. On the
other hand, depression that becomes intense and lasts for extended periods of time is beyond
the everyday sort. For this more severe depression you need to consider getting help.
What may cause people to be depressed?
Significant loss
Feeling a lost of control over life events
Unrealistic expectations
Disappointment
Negative thinking
Symptoms of depression
Emotional symptoms
Sadness
Anxiety
Guilt
Anger
Mood swings
Helplessness
Hopelessness
Physical symptoms
Sleeping too much or too little
Over-eating or loss of appetite
Constipation
Weight loss or gain
Irregular menstrual cycle
Gradual loss of sexual desire
Behavioral symptoms
Crying for no apparent reason
Withdrawal from other people and new situations
Getting angry easily
Being unmotivated to set or meet goals
Loss of interest in one‟s physical appearance

The International Journal of Indian Psychology: Volume: 01 | Issue: 03 | ISSN 2348-5396
© 2014 www.ijip.in April – June 2014 104 | P a g e
Loss of interest in activities which were once of
interest
Turning to drugs or alcohol
How to help a depressed person
Do not tell the person that you know what
She/he is feeling. This may make them angry.
Be supportive and patient
Let the person know that you are concerned and that you will be there for them.
Encourage the person to seek professional
Help if symptoms persistent and seem to
Interfere with activities for daily living.
AIMS OF THE STUDY:
1. To study of the Depression among male and female B.ed college student.
2. To study the Depression among urban and rural B.ed college student.
3. To study of the effect of interaction on Depression among type of sex and type of area B.ed
college student.
HYPOTHESIS:-
1. There is no difference between the depression among male and female B.ed college
students.
2. There is no difference between the depression among urban and rural B.ed college student.
3. There is no interaction effect of the depression among type of sex and type of area of B.ed
college student.
METHODS AND MATERIALS
Sample:
Sample in this study consist of 120 subjects the sample were selected in different B.ed
colleges in V.V.Nagar. In survey of V.V.Nagar we had got the information about the male
and the female staying in urban and rural area. The students which were randomly selected in
their 60 were urban area and 60 were rural area. From that 30 male and 30 female used to

The International Journal of Indian Psychology: Volume: 01 | Issue: 03 | ISSN 2348-5396
© 2014 www.ijip.in April – June 2014 105 | P a g e
study by staying in urban area and the other 30 male and 30 female were used to study by
staying rural area.
TOOLS:
The following tools were used in the present study.
1. Personal datasheet:
A personal datasheet developed by the investigator was used to collect information
about type of sex and type of area of B.ed college student.
2. Depression scale
Depression scale was developed by A.T. Back (1967), was used to measure
depression. These are 21 sentences in this scale. All at the sentence had a four option A,B,C,
and D. And it can also choosing more than one option. Simple scoring of this scale its A for
0, B for 1, C for 2, and D for 3 respectively. Author has satisfied validity and reliability of
this scale.
STATISTICAL ANALYSIS:
In this study „F‟ test was used for statistical analysis.
RESULT AND DISCUSSION:
Summary of 2X2 analysis of variance based of Depression of B.ed college student with
respect to type of sex and type of area.
Table-1 (N=120)
Source of variance Sum of
square
Df Mean sum of
square
F
(A) Sex 1353.41 1 1353.41 28.89 0.01**
(B) Area 285.21 1 285.21 6.09 0.05*
(AXB)Sex X Area 357.07 1 357.07 7.62 0.01**
SSW(Error) 5433.90 116 46.84
SST 7429.59 119
Mean score of difference of mean of Depression of B.ed college student with respect of type
of sex and type of area.

The International Journal of Indian Psychology: Volume: 01 | Issue: 03 | ISSN 2348-5396
© 2014 www.ijip.in April – June 2014 106 | P a g e
Table 2 (N=120)
Independent variable N Mean Difference
Male A1 60 13.07 3.08
Female A2 60 16.15
UrbunB1 60 11.25 6.72
Rural B2 60 17.97
According to table No. 1 it is observed that “F” value of Depression of male and
female b.ed student is 28.89 which is significant difference even at 0.01 levels. Looking at
the table No.2 it can be seen mean score of Depression of male and female are 13.07 and
16.15. The difference between them is 3.08 from there result. It can be said there is
significant difference in Depression among male and female of B.ed student and null
hypothesis is rejected. And result shows there is high Depression in female than male B.ed
college student.
According to table No. 1 it is observed that “F” value of Depression of urban and
rural B.ed student is 6.09 which is significant difference even at 0.05 levels. Looking at the
table No.2 it can be seen mean score of Depression of urban and rural are 11.25 and 17.97.
The difference between them is 6.72 from there result. It can be said there is significant
difference in Depression among male and female of B.ed student and null hypothesis is
rejected. And result shows there is high Depression in rural areas than urban area‟s B.ed
college student.
According to table No. 1 it is observed that “F” value of Depression of sex and area of
b.ed student is 7.62 which is significant difference even at 0.01 levels. The mean value is due
to uncertainty situation and its show minimum of size. There is significant interaction effect
between sex and area. So Null Hypothesis is rejected.
CONCLUSION:
1. There is high Depression in female than male B.ed college student.
2. There is high Depression in rural areas than urban area‟s B.ed college student.
3. There is significant difference between the effect of interaction on Depression among
type of sex and type of area of B.ed college student.
Reference:

The International Journal of Indian Psychology: Volume: 01 | Issue: 03 | ISSN 2348-5396
© 2014 www.ijip.in April – June 2014 107 | P a g e
Back A.T., (1967). Manual of depression scale.
Copeland, Mary., (1992). The Depression Work book.
Rowe, Dorothy., (1991). Breaking the bonds: understanding depression.
Rowe, Dorothy., (1991). Depression: the way out of your prison.

The International Journal of Indian Psychology: Volume: 01 | Issue: 03 | ISSN 2348-5396
© 2014 www.ijip.in April – June 2014 108 | P a g e
Ectomorphic and Endomorphic Personality: A Study of Emotional
Quotient among Women
Urvashi Sharma*, Dr. Ravindra Kumar**
ABSTRACT
The main objective of the present study is to examine the Emotional Quotient (sensitivity,
conscientiousness, empathy and adaptability) among ectomorphic and endomorphic personality
women. A sample of 30 participants (15 ectomorphy personality & 15 Endomorphic personality
types) was drawn randomly from the population. Emotional quotient scale by Prof. N. K. Chadha
was used for data collection. Data was collected by a face to face interview method. Mean,
standard deviation and‘t’ test were the statistics calculated. The results indicate that there is no
significant difference between ectomorphic and endomorphic women in relation to sensitivity,
conscientiousness, empathy and adaptability. Results revealed that ectomorphic women have
higher sensitivity, empathy and adaptability. On the other hand, the endomorphic women have
higher conscientiousness.
KEYWORDS: Personality, Ectomorphic personality, endomorphic personality, emotional
quotient, sensitivity, sensitivity, conscientiousness, empathy and adaptability
INTRODUCTION
Concept of Emotions & Emotional Quotient: Emotions are the internal events that coordinate
many psychological subsystems including psychological response, cognitions and conscious
awareness. They are being viewed as signals that provide Information direct attention and
facilitate attainment of goal and are seen as organizing processes that enable people to think and
behave adoptively. Emotion Quotient (EQ) is the measurement of EI, EQ measures skills those-
*Student, PGDGCP, Indian Institute of Psychology, Noida (U.P.) INDIA
**Assistant Professor, Department of Psychology, Mewar University, Chittorgarh (Rajasthan)

The International Journal of Indian Psychology: Volume: 01 | Issue: 03 | ISSN 2348-5396
© 2014 www.ijip.in April – June 2014 109 | P a g e
cognition and ones emotions in solving problems that confront you. EQ can be learned,
developed and improved. EQ decides how you interact with people in your life. It therefore has a
profound bearing on both your success and happiness. A person with high EQ will know how to
make an individual work by appealing to his emotions and reason. Goleman summarized five
E.Q. domains:
Knowing your Emotions
Managing your Emotions
Motivating your Emotions
Recognized and understanding other people Emotions
Managing relationship EI managing the Emotion others
The main foundation of EQ includes self awareness optimism and empathy which may develop
early in life. Other foundation of EQ developed only through experience such as perception,
Persuasiveness and tact. EQ approach helps an individual to reach out of their fullest emotional
potential. Right IQ guides, individual towards processing the right values behavior and emotion.
The right emotional Intelligence, IQ in business and life can be understood by a four corner
stone. Model explains by Copper (1997) this model assumes EI as out of the realm of
psychological analysis and philosophical theories and moves into the realm of direct knowing
exploration and application.
Concept of Personality: In the 1940’s William Herbert Sheldon associated body types with
human temperament types. He claimed that a body type could be linked with the personality of
that person. He says that a fat person with a long bone structure tends to have an outgoing and
more relaxed personality. While a more muscular body typed person is more active and
aggressive. A slim or scrawny personality with thin muscles is usually characterized a quiet or
fragile, he split up these body personality types into three categorized called somato types.
Sheldon has categorized the following types of personality:
(i) Ectomorphic Personality: An Ectomorphic is the complete opposite of the
endomorphic physically they have narrow shoulders, thin legs and arms, little fat on
the body , a narrow face and narrow chest. They may eat just as much as the
endomorphic but never seem to gain any weight. They always stay skinny personality
wise. They tend to be self-conscious socially anxious, artistic, thoughtful, quiet and
selves and are an afraid to branch out.

The International Journal of Indian Psychology: Volume: 01 | Issue: 03 | ISSN 2348-5396
© 2014 www.ijip.in April – June 2014 110 | P a g e
(ii) Mesomorphic Personality: The Mesomorphic is between the endomorphic and thin
ectomorphy. They have an attractive and desirable body physically they tend to have
a large head and broad shoulders with a narrow waist. They have a strong muscular
body and strong arms and legs and little fat on the body. They work for the body they
have so that they could have an attractive body psychologically the Mesomorphic is
adventurous and courageous. They are not afraid to break out and do new things with
new people they are assertive and commutative and have a desire to have power and
be dominant they love taking risks and chance in life.
(iii) Endomorphic Personality: An endomorphic somato types is also known as a
niscerotonic. The characteristic trait of these somato types usually includes being
relaxed, tolerant, comfortable and sociable, psychologically. They are also fun-
loving-good humored even tempered and they love food and affection: The
Endomorphic is physically round. They have wide a hips and narrow shoulders that
give pears nape. They tend to have a lot of extra fat on their body on their arms and
things. They have skinny ankles and wrists that make the rest of their body look even
bigger.
OBJECTIVES OF STUDY
The objectives of the present study are to examine the Sensitivity, Conscientiousness, Empathy
and Adaptability among Ectomorphic and Endomorphic personality women.
HYPOTHESIS OF THE STUDY
H01. There is no significant different among Ectomorphic and Endomorphic personality women
in relation to sensitive.
H02. There is no significant among Ectomorphic and Endomorphic personality women in
relation to Conscientiousness.
H03. There is no significant difference among Ectomorphic and Endomorphic personality
women in relation to Empathy.
H04. There is no significant difference among Ectomorphic and Endomorphic personality
women in relation to Adoptability.

The International Journal of Indian Psychology: Volume: 01 | Issue: 03 | ISSN 2348-5396
© 2014 www.ijip.in April – June 2014 111 | P a g e
RESEARCH METHODOLOGY
Sample:
The sample consisted of 30 Ectomorphic and Endomorphic personality women (15 Ectomorphic
& 15 Endomorphic) from Ghaziabad city. Age range of women’s 19 to 40 Years.
TABLE I
Sample of Ectomorphic & Endomorphic personality women
Sr. No. Group N ∑
1 Ectomorphic Women 15 30
2 Endomorphic Women 15
Tools Used:
Emotional Quotient Scale (Dr. N. K. Chadha): The E.Q. scale comprises seventy three items
related four areas of Emotional viz. Sensitivity, Conscientiousness, Empathy and Adaptability.
The responses to be given in four dimensions responses indicate Emotional intelligence. There is
no time limit, yet it takes about one day to complete the test. It is a paper pencil questionnaire
which can be administrated on an individual or a group of individuals. The scale has seventy
three items test reliability was computed after a lapse of 6 weeks. The obtained was 0.89 and
validity of the scale was obtained by correlating it with the Emotional Intelligence test developed
by Chadha 2001. The validity was found to be 0.78 which indicated that the present test is valid.
Procedure of Data Collection:
The inventories were distributed participants. The subjects were given general instruction to
complete the inventory purpose of study was made clear to the participant help was provided to
the participant in case. They found any of the items difficult to comprehend. Data was collected
by face to face interview method filled questionnaires were collected from subject for further
processing.
Statistical Analysis of Data:
In the present study mean, SD and T-test was applied for statistical analysis of data.

The International Journal of Indian Psychology: Volume: 01 | Issue: 03 | ISSN 2348-5396
© 2014 www.ijip.in April – June 2014 112 | P a g e
ANALYSIS AND INTERPRETATION
The main objectives of the present study are to examine the EQ viz. Sensitivity,
Conscientiousness, Adoptability and Empathy among Ectomorphic and Endomorphic personality
women. Mean, S.D. and t-test was applied for statistical analyses of data.
TABLE II
Mean, S.D., t-value of Ectomorphic and Endomorphic personality women
Sensitivity (S): Ectomorphic × Endomorphic
Sr. No. Group N Mean S.D. t-value Sig
1 Ectomorphic 15 63.8 9.84 0.73 N S
2 Endomorphic 15 61.33 8.11
The result indicate that Ectomorphic personality women have higher mean score in relation to
sensitivity (M=63.8, SD=9.84) in compared to Endomorphic personality women (M=61.33,
SD=8.11). So we can say that Ectomorphic personality women have higher sensitivity in their
personality but there is not found any significant difference (t=0.73) among ectomorphic
endomorphic personality women in relation to sensitivity.
TABLE III
Mean, S.D., t-value of Ectomorphic and Endomorphic personality women
Conscientiousness (C): Ectomorphic × Endomorphic
Sr. No. Group N Mean S.D t-value Sig
1 Ectomorphic 15 45.93 8.2 0.08 N S
2 Endomorphic 15 46.2 9.38
The result indicate that Endomorphic personality women have higher mean score in relation to
Conscientiousness (M=46.2, SD=9.38) in compared to Ectomorphic personality women
(M=45.93, SD=8.2). So we can say that Ectomorphic personality women have higher
conscientiousness in their personality but there is not found any significant difference (t=0.08)
among ectomorphic endomorphic personality women in relation to conscientiousness.

The International Journal of Indian Psychology: Volume: 01 | Issue: 03 | ISSN 2348-5396
© 2014 www.ijip.in April – June 2014 113 | P a g e
TABLE IV
Mean, S.D., t-value of Ectomorphic and Endomorphic personality women
Empathy (E): Ectomorphic × Endomorphic
Sr. No. Group N Mean S.D. t-value Sig
1 Ectomorphic 15 56.4 11.49 1.00 N S
2 Endomorphic 15 52.73 7.45
The result indicate that Ectomorphic personality women have higher mean score in relation to
Empathy (M=56.4, SD=11.49) in compared to Endomorphic personality women (M=52.73,
SD=7.45). So we can say that Ectomorphic personality women have higher Empathy in their
personality but there is not found any significant difference (t=1.00) among ectomorphic
endomorphic personality women in relation to Empathy.
TABLE V
Mean, S.D., t-value of Ectomorphic and Endomorphic personality women
Adoptability (A): Ectomorphic × Endomorphic
Sr. No. Group N Mean S.D. t Sig
1 Ectomorphic 15 43.13 5.6 0.98 N S
2 Endomorphic 15 40.95 6.18
The result indicate that Ectomorphic personality women have higher mean score in relation to
Adoptability (M=43.13, SD=5.6) in compared to Endomorphic personality women (M=40.95,
SD=6.18). So we can say that Ectomorphic personality women have higher Adoptability in their
personality but there is not found any significant difference (t=0.98) among ectomorphic
endomorphic personality women in relation to Adoptability.
RESULT AND DISCUSSION
The research shows that the characteristics shown by individuals not matching with their
physical structure as it were discussed by Sheldon in his personality theory. The main conclusion
emerged from the analyses of data is that there is no significant difference of EQ (sensitivity,
Empathy, Adoptability) among Ectomorphic and Endomorphic personality women. In simple
terms it can be concluded that Ectomorphic personality women have higher sensitivity, Empathy

The International Journal of Indian Psychology: Volume: 01 | Issue: 03 | ISSN 2348-5396
© 2014 www.ijip.in April – June 2014 114 | P a g e
and adoptability in their personality while Endomorphic women have higher conscientiousness
in their personality.
REFERENCES:
1. Cooper, R and Sawaf, A. (1997) Executive EQ, New York, Orient Book.
2. Goleman, D (1995) Emotion Intelligence. Why it can matter more than IQ, New York,
Banthan
3. Goleman, D (1995) Emotional Intelligence, New York. Bnathan Book
4. Herrnstein, R and Murray. C. (1994) The Ball Curve, Intelligence and class in American
life, New York. Free press
5. https://sites.google.com/site/psychology personality period 8/home/type and
traittheories/sheldon-s-personality-theory.
6. Mayur, Dipaola, M and Salovey. P. (1990) Perceiving affective context in ambiguous
Vishal Stimuli, A component of Emotion Intelligence. Journal of Personality Assessment
(54) pp- 770-81
7. Salovey. P. and Mayer. J. (1990) Emotion Intelligence Imagination, Cognition and
Personality 9 pp- 185-211

The International Journal of Indian Psychology: Volume: 01 | Issue: 03 | ISSN 2348-5396
© 2014 www.ijip.in April – June 2014 115 | P a g e
The Development of Distributive Justice: Does Type of
Schooling really matter?
Dr. Rita Karmakar*, Prof. Anjali Ghosh**
ABSTRACT
Distributive justice is the normative principle designed to guide the allocation of
resources among the members of a community. Distributive justice in the context of
reward allocation mainly deals with various determinants of preference for specific
justice (allocation) rules, such as equity (merit), equality, need and seniority (Deutsch,
1985; Homans, 1961; Leventhal, 1980). The present study has been undertaken to
determine the role of age, gender and type of schooling on the development of
distributive justice of children. Participants of the study were 200 children (100 from
missionary and 100 from non-missionary schools) belonging to Kolkata district, West
Bengal. The results indicated the role of type of schooling and age on the development of
distributive justice of adolescents. Pre adolescents generally prefer equality as justice
criteria whereas adolescents generally prefer merit as their justice criteria. Effect of type
of schooling is prominent among pre-adolescents.
KEY WORDS: Distributive Justice, Preadolescents, adolescents, Missionary and Non-
missionary schools.
* Indian Institute of Management (IIM), Calcutta
** Indian Statistical Institute, Calcutta

The International Journal of Indian Psychology: Volume: 01 | Issue: 03 | ISSN 2348-5396
© 2014 www.ijip.in April – June 2014 116 | P a g e
INTRODUCTION
Distributive justice relates to the perceived fairness of reward allocation. It plays a
critical role in guiding individuals‟ behavior, regulating social interactions and
maintaining the structure and functions of society as a whole. The following four
allocation rules are most common in the field of distributive justice research (Deutsch,
1985). Equity rule – rewards are distributed proportionally to individual contributions;
equality rule – everyone‟s reward is identical regardless of individual contributions;
seniority rule – outcomes are distributed proportionally to seniority (age) and need rule
– outcomes are distributed proportionally to individual needs.
A bulk of researches has shown that the development justice concept depends on
age. Studies on age and distributive justice have reported developmental trends suggested
by developmental theorists. These studies have reported that younger children (under 6
years of age) generally follow either self-interest or strict equality, children
(approximately 6-12 years) adopt an “ordinal equity” approach and children (13 years
onwards) follow “proportional equity” approach (Leventhal & Anderson, 1970; Lane &
Coon, 1972; Hook & Cook, 1979) at the time of resource allocation. Some studies have
shown the departures from the trends as suggested by developmental theorists. These
studies have indicated that preschool and kindergarten children prefer equality and
sometimes follow equity norm when appropriate instructions are given (Leventhal, Popp
& Sawyer, 1973; Lerner, 1974; Nelson & Dweck, 1977). Studies conducted in Indian
context on school students have shown a preference for equality over need and equity by
Indian subjects (Sinha, Hassan, Carment & Krishnan, 1986; Krishnan, 1987). Another
study in Indian context has revealed that children (approximately 9-12 years) generally
follow equality and children (approximately 13-15 years) adopt merit as a justice rule
(Ghosh & Karmakar, 2005). Studies examining the role of gender on the pattern of
distributive justice have revealed that generally girls prefer equality while boys prefer
equity (Benton, 1971; Kahn, O'Leary, Krulewitz, & Lamm, 1980; Major & Deaux, 1982).
Except these demographic variables, the development of distributive justice is assumed to
be influenced by school atmosphere and pattern of teaching in schools. In missionary

The International Journal of Indian Psychology: Volume: 01 | Issue: 03 | ISSN 2348-5396
© 2014 www.ijip.in April – June 2014 117 | P a g e
schools, there is a provision for moral teaching whereas in the non-missionary schools
there is no such teaching given to children, but little is known about the impact of school
experiences on distributive justice development.
AIMS OF THE STUDY
The present study aims to find out -
(a) To study the role of age in the formation of distributive justice of children. For
this purpose, preadolescents and adolescents have been selected in the present
study.
(b) To study the role of gender in the formation of distributive justice of children. For
this purpose, boys and girls have been selected in the present study.
(c) To study the role of type of schooling in the formation of distributive justice of
children. For this purpose, children studying in missionary and non missionary
schools have been selected in the present study.
METHODOLOGY
Sample:
Participants of this cross-sectional study were 200 school children (100 from missionary
and 100 from non-missionary) belonging to Kolkata districts of West Bengal. Boys and girls
were kept equal in the sample and their age range varied from 10-16 years with a mean age of
13.07 years (SD= 2.87). Students below the mean age were considered as pre adolescents and at
or above mean were considered as adolescents. A stratified random sampling method was used
for the selection of type of schooling (missionary and non-missionary) for the study. A random
sampling method was used for selecting schools from each stratum (missionary and non-
missionary). Six schools (three from each stratum) were taken as sample for the present study.
From selected schools, students of two different age groups were selected by using simple
random sampling without replacement (SRSWOR). The students were from middle socio
economic status.

The International Journal of Indian Psychology: Volume: 01 | Issue: 03 | ISSN 2348-5396
© 2014 www.ijip.in April – June 2014 118 | P a g e
Tools used:
The following tools were used in this study:
Personal Data sheet: Certain personal information about respondents included in the sample of
research is useful and important for research. Here also, for collecting such important
information, personal data sheet was prepared. With the help of this personal data sheet, the
information about age, gender, type of schooling and total monthly income of family were
collected.
Distributive Justice Scale (DJS):
For assessing distributive justice of the children, Distributive Justice Scale (DJS)
of Enright, Franklin and Manheim (1980) was administered. This scale is based on
Damon‟s theory (1980, 1981) of distributive justice. According to Damon (1980, 1981),
the development of distributive justice follows a six stage of progression. At Level 0-A,
self-interest is the governing distributive criteria; at Level 0-B, self-interest is backed up
with an appeal to external, physical and observed features, such as size, age and gender.
At Level 1-A, notion of strict equality governs sharing and the ideas of merit, deserving
and reciprocity emerge at Level 1-B. At Level 2-A, one attempts to balance between
competing claims to merit by working out some equitable compromises and special
circumstances such as recipient‟s need, etc., while judging fairness. At the highest level,
i.e. Level 2-B, the compromise between equity (merit) and reciprocity is worked out in
the light of the demands of the situation or the larger goals and purposes of the group.
The DJS is a standardized and objectively scored paired-comparison test. Each
participant is presented with 15 social dilemmas. For each dilemma, there are two
alternative choices, given by means of two pictures accompanied by statements,
representing two different stages of DJS to be compared. These 15 dilemmas cover all the
2
6 = 15 possible paired comparisons. For each dilemma (or pair of pictures with
statements), the participant is asked which picture better ends the story. The order of

The International Journal of Indian Psychology: Volume: 01 | Issue: 03 | ISSN 2348-5396
© 2014 www.ijip.in April – June 2014 119 | P a g e
presentation of the dilemma is randomized, and within each dilemma, the decision as to
which one would be presented first is also randomized to control the order effects. Three
dilemmas are repeated to check for consistency. The repeated pairs are presented in
reverse order of their original pairings to control for primacy or recency effects. The
dominant stage chosen by a participant in all these 15 dilemmas gives the observed DJS
for the participant. In case of tie with two stages, the one chosen while comparing these
two particular stages is the DJS score. A similar mechanism is there to break a tie
involving more than two stages. These six stages are denoted by Stage 0, Stage 0.5, Stage
1, Stage 1.5, Stage 2 and Stage 2.5. The numbers have nothing to do with the magnitude
of the stages except the ordering between them. These six stages are similar to Damon‟s
six levels of distributive justice as described above. Some minor modifications with the
permission of the author have been made in the scale to suit the Indian context. The test –
retest reliability coefficient is 0.76 and internal consistency coefficient is 0.73.
Statistical Analyses:
In this study, Independent „t‟ test and three way (2X2X2) Analysis of Variance
(ANOVA) were used for statistical analysis.
RESULT AND DISCUSSION
The data collected from boys and girls of missionary and non-missionary school
were first scored and then different analyses were carried out to see the impact of
different variables. The results are presented in the following sections:
Distributive justice by type of schooling
Means, standard deviations (SDs) and independent t tests were calculated in order
to find out whether the children of missionary and non-missionary schools differ
significantly with respect to their distributive justice and the result is presented in Table
1.

The International Journal of Indian Psychology: Volume: 01 | Issue: 03 | ISSN 2348-5396
© 2014 www.ijip.in April – June 2014 120 | P a g e
Table 1: Means, Standard Deviations (SD) and t-value of distributive justice of children
studying in missionary and non-missionary schools
Age Group Mean SD t-value
Missionary (N=100) 2.05 1.02 3.32**
Non-Missionary (N=100) 1.58 0.98
Note. ** Significant at 0.01 level.
Table 1 indicates that children of missionary schools are significantly higher on
distributive justice than their non-missionary counterparts. This result indicates the
potential impact of the school context on distributive justice. Children of missionary
schools tend to choose need (Stage 2) over any other principles of distributive justice
whereas merit (Stage 1.5) is being preferred by children of non-missionary schools.
Distributive justice by age
Data were also collected from different age group of children. To determine
whether pre adolescents and adolescents differ significantly with respect to distributive
justice means, standard deviations (SDs) and independent t test were calculated and the
result is presented in the following table:
Table-2: Means, Standard Deviations (SD) and t-value of distributive justice pre-
adolescents and adolescents.
Group Mean SD t –value
Pre-adolescent (N=110) 1.18 0.50 4.72**
Adolescents (N=90) 1.61 0.78
Note. ** Significant at 0.01 level.
It is revealed in Table 2 that mean score of distributive justice of pre-adolescents
differ significantly from adolescents. Pre-adolescents tend to prefer equality (Stage 1)
whereas merit (Stage 1.5) is being preferred by adolescents.

The International Journal of Indian Psychology: Volume: 01 | Issue: 03 | ISSN 2348-5396
© 2014 www.ijip.in April – June 2014 121 | P a g e
Distributive justice by gender
To determine whether boys and girls differ significantly with respect to
distributive justice means, standard deviations (SDs) and independent t test were
calculated and the result is presented in Table 3.
Table-3: Means, Standard Deviations (SD) and t-value of distributive justice boys and
girls
Group Mean SD t –value
Boys (N=100) 1.48 0.70 1.43
Girls (N=100) 1.61 0.58
It is revealed from above table that the mean distributive justice of girls is slightly
greater than boys. The mean difference of distributive justice scores between boys and
girls is not statistically significant.
To determine the interaction effect of type of schooling, age and gender on
distributive justice, three-way ANOVA (2x2x2) was carried out and the results are
presented in the following table:
Table 4: 2 X 2 X 2 ANOVA of distributive justice.
Source variable df Sum of squares (SS) Mean SS F ratio
Type of school (A) 1 10.50 10.50 23.86**
Age (B) 1 7.58 7.58 17.23**
Gender (C) 1 0.78 0.78 1.77
A X B 1 7.78 7.78 17.68**
A X C 1 1.07 1.07 2.43
B X C 1 0.89 0.89 2.02
A X B X C 1 1.87 1.17 2.65
Within group error 192 83.95 0.44 -----
Note. ** Significant at 0.01 level.
Table 4 indicates that type of schooling, age and interaction between these two
variables play a crucial role in the development of distributive justice. It can be seen from

The International Journal of Indian Psychology: Volume: 01 | Issue: 03 | ISSN 2348-5396
© 2014 www.ijip.in April – June 2014 122 | P a g e
Table 1 and 2 that children of missionary schools are significantly higher than their non-
missionary counterparts and adolescents are significantly higher on distributive justice
than pre-adolescents. The closer scrutiny on the interaction effect reveals that type of
schooling has significant effect only on pre-adolescents. Most of the pre-adolescents
studying in missionary schools tend to choose equality (stage 1) whereas those studying
in non-missionary schools are more likely to prefer self interest principle (Stage 0.5) of
distributive justice. Adolescents of missionary and non-missionary schools do not differ
significantly with respect to distributive justice. The probable reason for this is that
understanding of justice concepts by pre-adolescents is directly linked to their everyday
experiences and instructions given in the educational institutions.
CONCLUSIONS
From the findings of the present study the following conclusions may be drawn-
(1) The type of schooling (missionary and non-missionary) has significant impact on
the development of distributive justice especially on preadolescents. The obtained
result throws better light on the influence of knowledge on justice concepts and
system of teaching in missionary and non-missionary schools. The study also
reveals that preadolescents are more open to receive information given in schools
whereas justice concepts are already being developed by the time one reaches
adolescence.
(2) Preadolescents are more likely to prefer equality principle of justice in order to
maintain interpersonal harmony whereas adolescents tend to prefer merit.
(3) Gender does not play any significant role in the development of distributive
justice.
LIMITATIONS OF THE STUDY
The sample was drawn from West Bengal state only hence it can be not
generalised.

The International Journal of Indian Psychology: Volume: 01 | Issue: 03 | ISSN 2348-5396
© 2014 www.ijip.in April – June 2014 123 | P a g e
While selecting the sample religion (Hindu, Muslim etc), type of area (rural,
urban and semi-urban), family type (joint, nuclear and extended) are not taken
in to consideration, so religion, type of area and family type wise difference
cannot be inferred from the data.
Home environment also plays a crucial role in developing justice concepts. A
study including this variable may give some other directions.
IMPLICATION OF THE STUDY
In spite of having all the limitations, the present study has some implications:
The findings of the study explicitly bring about the pattern of distributive justice
in pre-adolescents and adolescents. Factors such as age, type of schooling are
some of the main governing sources in the formation of justice concepts. School
atmosphere may contribute significantly towards building up the justice concepts
especially among preadolescents because their concepts can easily be moulded by
the instructions given in the schools.
In every school there should be some provision for teaching values and justice
concepts which ultimately facilitate the development of values, concern for
others, sense of cooperation and moral character of children which in turn help to
develop healthy personality and good citizen of country.
REFERENCES
1. Benton, A. A. (1971). Productivity, distributive justice, and bargaining among
children. Journal of Personality and Social Psychology. 18, 68-78.
2. Damon, W. (1980). Patterns of change in children‟s social reasoning: A two-year
longitudinal study. Child Development, 51, 1010-17.
3. Damon,W. (1981). The development of justice and self-interest during childhood.
In M.J. Lerner, & S.C. Lerner. (Eds.), The justice motive in social behavior (pp.
57-72). New York & London: Plenum Press.
4. Deutsch, M. (1985). Distributive justice. New Haven, CT: Yale University Press.
5. Enright, R. D., Franklin, C. C., & Manheim, L. A. (1980). Children‟s distributive
justice reasoning: A standardized and objective scale. Developmental Psychology,
16, 193–202.

The International Journal of Indian Psychology: Volume: 01 | Issue: 03 | ISSN 2348-5396
© 2014 www.ijip.in April – June 2014 124 | P a g e
6. Ghosh, A., and Karmakar, R. (2005). Distributive Justice and Parent- child
Relationship in School Students. In A. Hussain, S. Hussain, and Md. H.R. Khan
(Eds). Applied Indian Psychology: New Perspectives. 19-31, New Delhi, Global
Vision Publishing House.
7. Homans, G.C. (1961). Social behavior: Its elementary forms. New York:
Harcourt, Brace & World.
8. Hook, J. G., & Cook, T. D. (1979). Equity theory and the cognitive ability of
children. Psychological Bulletin, 86(3), 429-445.
9. Kahn, A., O'Leary, V. E., Krulewitz, J. E., & Lamm, H. (1980). Equity and
equality: Male and female means to a just end. Basic and Applied Social
Psychology, 1, 173-197.
10. Krishnan, L. (l987). Equality and equity in reward distribution in an Indian
setting. Psychological Studies, 32(2), 97-103.
11. Lane, I. M., & Coon, R. C. (1972). Reward allocation in preschool children. Child
Development, 43, 1382-1389.
12. Lerner, M.J. (1974). The justice motive: “Equity” and “Parity” among children.
Journal of Personality and Social Psychology, 29(4), 539-550.
13. Leventhal, G. S. (1980). What should be done with equity theory? In K. Gergen,
M.Greenberg, & R.Willis (Eds.), Social exchange theory (pp. 27-55). New York:
Plenum Press.
14. Leventhal, G. S., Popp, A. L., & Sawyer, L. (1973). Equity or equality in
children‟s allocation of reward to other persons? Child Development, 44 (4), 753-
763.
15. Leventhal, G.S., & Anderson, D. (1970). Self interest and the maintenance of
equity. Journal of Personality and Social Psychology, 15, 57-62.
16. Major, B., & Deaux, K. (1982). Individual differences in justice behavior. In J. L.
Greenberg, & R. L. Cohen (Eds.), Equity and justice in social behavior. New
York: Academic Press.
17. Nelson, S. A., & Dweck, C. S. (1977). Motivation and competence as
determinants of young children‟s reward allocation. Developmental Psychology,
13(3), 192-197.
18. Sinha, J. B. P., Hassan, A., Carment, D. W., & Krishnan, L. (1986). Allocator-
recipient closeness, nature of reward and resource allocation rule preference in
India. Unpublished study.

The International Journal of Indian Psychology: Volume: 01 | Issue: 03 | ISSN 2348-5396
© 2014 www.ijip.in April – June 2014 125 | P a g e
T. V. serial and Aggression
Mr. Pravin A Baviskar*, Dr. N. D. Mundada**,
ABSTRACT-
The present study was conducted to see the effect of violent t.v.serial on aggression level among
the secondary school going students of Jalgaon city. Buss and Perrys Aggression Questionnaire
was used to measure the aggression level of the adolescent. For this study a sample of 140
students of age range 14-16 years studying in 9th
and 10th
classes were selected from different
school of Jalgaon city.
KEY WORD- Aggression, Violent T.V. Serial, Adolescent.
INTRODUCTION-
The effect of violent television serial and programmed on the human behavior,
personality and aggression of the adolescent is the extremely sensitive and anxious subjects.
Various types of destructive thoughts rise in the minds of the adolescent. It is due to the broad
cast of television violent serial which teach immoral things, disastrous things, robbery, fighting
with each -other, kidnapping cases etc. Through serial. The behavior becomes extremely
attacking through such serials, obliviously it reflects in the psychological attitude. It also affects
the aggression, there is no basic communication between parent child relationships and day by
day it is being shattered. This question has disturbed me lot so & have chosen the concerned
topic for my research.
*Research Fellow, Dept of Psychology, S. S. M. M. College Pachora, Dist Jalgaon. (MS)
**Ph.D.Guide, Dept of Psychology, S. S. M. M. College, Pachora, Dist Jalgaon. (MS)

The International Journal of Indian Psychology: Volume: 01 | Issue: 03 | ISSN 2348-5396
© 2014 www.ijip.in April – June 2014 126 | P a g e
During research on the effect of television on the adolescent the question such as, why do
the children watch television? What is the reason behind watching television? Etc comes in my
mind. If I try to answer the question above cited? May say that television is a medium of
entertainment. Psychologically, television releaser the stress & tension of daily routine, anxiety,
tiresomeness, it also provides dreams completeness of unfinished wishes of human being. The
adolescent can compare their personality with the hero & heroines of the television serial. Some
of the children watch television to get educated. It adds general knowledge and develops
intellectual capacity. It is proved through research that as the preparation of the watching
television grows, the question of choice arises and automatically the children turn to words their
favorite program me.
ADOLESCENT-
Adolescence word come from Latin word adolescere meaning “To grow up” is a transitional
stage of physical and psychological human development generally occurring between puberty
and legal adulthood. It is a period of storm and stress. Adolescence has to adjust with their own
changes in personality on one side and the changing socioeconomic environment on the other
side some adolescent find it difficult to adjust normally with these change and experience some
problem which are characteristics of this depending stage.
Adolescence period is most closely associated with the teenage years although it’s physical,
psychological and cultural expressions can begin earlier and end later.
TELEVISION SERIAL
Definition-
Serial describes something that forms a series or is produced in multiple parts.
A serial is something written or performed in parts.
Aggression-
Any form of behavior that is intended to harm or injure some person, oneself, or an
object.
A feeling of hostility that arouses thoughts of attack.

The International Journal of Indian Psychology: Volume: 01 | Issue: 03 | ISSN 2348-5396
© 2014 www.ijip.in April – June 2014 127 | P a g e
Scholars have defined aggression from diver’s perspective. However, there appears to be a
consensus that aggression is a deliberate act intended to cause harm to another
person.Bernstein,Penner,Clarke & Roy(2006;721) defined aggression as “an act that is intended
to cause harm to another person” , Colman (2003) defined aggression as “a behavior whose
primary or sole purpose or function is to injure physically or psychologically” Myers(2005) in
his own submission defined aggression as physically or verbal behavior intended to hurt
someone” Berhm,Kassin & Fein(2005) “Aggression as behavior that is intended to harm another
individual.
Based on the above definition aggression refers to any act that hurts, harms or destroyed which
must be intended or deliberates.
TYPES OF AGGRESSION
Physical aggression-
Physical aggression is hostile from of aggression. Its aim is to cause body damage. It includes
fighting, kicking, hair pulling, molesting, biting, pushing, shooting etc.
Verbal aggression-
Verbal aggression includes acts such as insulting with bad language, displaying anger,
threatening and swearing to cause emotional and psychological pain.
Hostility-
Hostile aggression takes place when the aggressor primary intension is to harm the victim as a
result of anger.
Aggression -
Aggression behavior is intended to harm another individual. Aggression refer to any act that
hurts, harm or destroys which must be intended or deliberate.
One of the earliest and most well-known studies was conducted by Bandura in 1963. He had a
group of children. They viewed a TV video of a model that kicked and punished an inflated

The International Journal of Indian Psychology: Volume: 01 | Issue: 03 | ISSN 2348-5396
© 2014 www.ijip.in April – June 2014 128 | P a g e
plastic doll. After the viewing, the children were placed in a playroom with other children who
had not seen the video. Those that saw the video displayed significantly more aggressive
behaviour than those who didn't.
Present research study researcher comparing children who watched a violent short film with
those who watched a non-violent one, the first group is consistently found to behave more
aggressively towards each other (Bjorkqvist, 1985; Josephson, 1987)
Media violence is recognized as a potential contributor to the increase of antisocial attitudes in
children and adolescents (Ledingham, Ledingham, & Richardson, 1993).
Joy, Kimball, Zabrack ,1986; Williams, 1986, One of the most convincing studies compared
the incidence of aggressive behaviour among children both before and two years after TV was
introduced into the Canadian community where they resided. There was a significant increase in
both physical and verbal aggression after two years of viewing TV.
Bushman & Huesmann, 2001;Comstock, 1980; Geen, 1990; Geen & Thomas, 1986;
Huesmann, Moise, & Podolski, 1997. The consistent finding from such randomized
experiments is that youths who watch violent scenes subsequently display more aggressive
behavior, aggressive thoughts, or aggressive emotions than those who do not.
AIM OF THE STUDY-
The aim of the present study is effect of violent T.V. Serial on aggression in adolescents of
Jalgaon city.
OBJECTIVE OF THE STUDY-
This study is guided by the following objectives-
To find out the effect of violent t.v.serial on the aggression of male female adolescent.
To find out the effect of Non violent t. v. serial on the aggression of male female
adolescent.
HYPOTHESIS OF THE STUDY-
Main hypothesis of the study are:

The International Journal of Indian Psychology: Volume: 01 | Issue: 03 | ISSN 2348-5396
© 2014 www.ijip.in April – June 2014 129 | P a g e
There is significant difference in aggression between boys & girls adolescents.
There is significant difference in aggression between the adolescents who watch violent t.
v. serial and the adolescents who watch non violent t. v. serial.
VARIABLE OF THE STUDY-
Independent Variables – 1) Boys and Girls
2) Violent and Non Violent serial
Dependent Variables - 1) Score of Aggression
METHODOLOGY-
Sample-
The sample consists of 140 adolescents (70 boys and 70 girls) of various schools of jalgaon city.
Their age range was 14 to 16 years. Sample was selected of simple random sampling.
Experimental Design-
The present study investigation is designed as 2x2 factorial design will be used. As well as to
study an influence of TV serial and sex difference on aggression.
Tools-
For measuring the some independent variables and the dependent variable following
standardized tests and scale were used.
Aggression Questionnaire-(1992)
This questionnaire was constructed and standardized by Perry and Buss. This questionnaire
consists of 29 items and each item is provided with five alternatives. There is no time limit to
this questionnaire. However the subject has to work as fast as he/she can. The reliability of the
questionnaire reported by author was 0.82. The validity of the questionnaire was 0.74
The aggression questionnaire consists of four factor, Physical aggression (PA), Verbal
aggression (VA), Anger (A), and Hostility (H).The two questions with the asterisk are reverse
scored. The total score for the aggression is the sum of the factor scores.

The International Journal of Indian Psychology: Volume: 01 | Issue: 03 | ISSN 2348-5396
© 2014 www.ijip.in April – June 2014 130 | P a g e
RESULT AND DISCUSSION-
In this part investigator has explained the result related to statistical analysis and hypothesis
Hypothesis – 1- There is significant difference in aggression between boys & girls
adolescents.
Table no- 1- Aggression and Gender
Gende
r Mean N
Std.
Deviation
Std. Error
mean
Mean
Difference
t Level of
significant
Girls
71.9571 70 11.53751 1.37900 9.31429
5.459
0.01
Boys 81.2714 70 8.40449 1.00453 9.31429
Above table no-1- is presenting the aggression among both male and female students.
Investigator has selected 70 girls and 70 boys for study. The obtained t value is 5.459. So, we can
say that there is significant difference of Aggression in boys and girls students and its hypothesis
accepted.
Hypothesis – 2 - There is significant difference in aggression between the adolescents
who watch violent t. v. serial and the adolescents who watch non violent t. v. serial.

The International Journal of Indian Psychology: Volume: 01 | Issue: 03 | ISSN 2348-5396
© 2014 www.ijip.in April – June 2014 131 | P a g e
Table no- 2- Aggression and T.V Serial
T.V.
Serial Mean N Std. Deviation
Std .Error
mean
Mean
difference
t Level of
significa
nt
Violent
77.014
3
70 11.21269 1.34017 0.80000 0.426 N.S
Non-
Violent
76.214
3
70 11.03209 1.31859 0.80000
Above table no-2- is presenting the aggression among both Violent serial and Non-violent
serials. Investigator has selected 70 adolescent viewing violent TV serial and 70 adolescent
viewing non-violent TV. serial for study. The obtained t value is 0.426. So, we can say that there
is no significant difference of Aggression in adolescent who watch violent t. v. serial and the
adolescents who watch non violent t. v. serial and its hypothesis rejected.
Major finding of the study & Conclusion-
In this study, result has been discussed. Investigator has studied an influence of sex difference on
aggression of the students. Result show that sex difference indicates significant influence on
aggression but it indicates they did not significant difference on aggression in adolescent who
watch violent t.v.serial and the adolescents who watch non violent t. v. serial. This study shows
that boy’s students are more aggressive than girl’s students. There is no significant difference in
aggression between the adolescent who watch both T.V. serials.

The International Journal of Indian Psychology: Volume: 01 | Issue: 03 | ISSN 2348-5396
© 2014 www.ijip.in April – June 2014 132 | P a g e
REFERENCES –
1. Erickson, E. (1936) Childhood and society (2nd
ed) New York, Norton.
2. Hurlock, E.B.(1972) Child Development, New York, McGraw-Hill.
3. Anderson, C.A.& Huesmann, L.R. (2003). Human aggression: A social-cognitive view.
In M.A. Hogg & J. Cooper (Eds.), Handbook of Social Psychology (pp. 296-323).
London: Sage Publications.
4. Baron, R.T. (1998) Social Psychology, PHI Publications
5. Morgan .C.T. (2001) Introduction to Psychology, Tata McGraw Hill Publications
6. Ker linger .F.N. (2007) Foundation of Behavioral Research, 2nd
ed
Delhi, Surjeet
Publications
Journal-
1. Anderson, C.A.& Dill, K.E. (2000).Video games and aggressive thoughts, feelings, and
behavior in the laboratory and in life. Journal of Personality and Social Psychology, 78,
772-790.
2. Jonathan N.O.(2013) Physical and verbal aggression among adolescent secondary school
students in rivers state of Nigeria. British Journal of Education 62-73

The International Journal of Indian Psychology: Volume: 01 | Issue: 03 | ISSN 2348-5396
© 2014 www.ijip.in April – June 2014 133 | P a g e
A Study of Academic Stress among Senior Secondary Students
Kartiki Porwal*, Dr. Ravindra Kumar**
ABSTRACT
The main objective of the present study is to examine the academic stress among senior
secondary students. The total participants of the study were 30 (15 male and 15 female). All
students belong to 12th standard studying in Noida. The Data was collected through standardized
Academic Stress Questionnaire (ASQ) by Akram, Mohd Ilyas Khan and Sahiba Baby. Mean,
Standard deviation and T-test were conducted for analysis of data. Result indicates that there is
significant difference among boys and girls in relation to academic stress. Result revealed that
senior secondary boys have higher academic stress in compare to girls.
KEYWORDS: Stress, Academic Stress, senior secondary boys and girls.
INTRODUCTION:
Academic stress is the anxiety and stress that comes from schooling and education .There is a lot
of pressure that comes along with pursuing their education. Students report experiencing
academic stress at predictable times each semester with the greatest sources of academic stress
resulting from taking and studying for exams, grade competition, and the large amount of content
to master in a small amount of time(Abouserie, 1994).There are lot of stress related to studies,
homework, tests, reading, tuition and other academic competitions student faces a lot of stress
due to imbalance of academic and social performance and time management for extracurricular
activities from education. Academic stress is especially high in the students who are unable to
maintain balance between their academic, family, and friend, social and academic activities in
life. Stress is very common as they are more worried about their carrier. Student stress level also
depends a lot on attitude of teachers towards them. Fear of academic failure related to these tasks
is a definite stressor (Kolko, 1980). If a teacher is friendly then the student has less stress while-
*M.A Student, Indian Institute of Psychology, Noida, Uttar Pradesh
**Assistant Professor, Department of Psychology, Mewar University, Chittorgarh, Rajasthan

The International Journal of Indian Psychology: Volume: 01 | Issue: 03 | ISSN 2348-5396
© 2014 www.ijip.in April – June 2014 134 | P a g e
talking to them related to their academics. Whereas teachers who are not very friendly then
students doesn’t feel that comfortable due to fear which generally arises due to stress. This
phenomenon has created certain dependable situations among students. In such situation a
student depends more on tuition rather than school teachers. If the tuition- teacher is not able to
understand the problem of the student than it leads to stress level so high that the student slowly
starts to lose interest in studies. The stress level among students varies when work is given as
challenges or threat. The pressure to perform well in the examination or test and time allocated
makes academic environment very stressful. Erkutlu & Chafra (2006) explained that if the work
is given as the challenge then the stress level lowers due to the competition among the students
to achieve the target provided if the work is given in small amount and if the completion of work
is not required in an allocated time. Whereas if the work is given and student are threatened to
complete the work in a limited time then the stress level in students is found to be very high and
only few student are able to complete the given task. The stress levels of student vary according
to behavior of teachers and according to the school environment. The stress level of students
studying in schools which promote or give importance to co-curricular activities such as sports,
dance, music, swimming art is low as compared to student studying in school which don’t
promote these co-curricular activities instead they promote co-curricular activity related to
education such as debate, quiz, speech etc and general feeling among such school are that sports
is rubbish and are less focused and promoted.
Now a day’s yoga, kung fu, karate etc are being introduced to minimize the stress level among
the students .The yoga plays an important role in keeping the stress level down and also helps to
improve the concentration power in students. Moreover, importance should b given to the above
mentioned co-curricular activities more and more over stress level will automatically become
low when students are healthy. So, such steps should be taken by schools to improve the
performance of their students with a friendly environment.
OBJECTIVE OF THE STUDY:
The main objective of the study is to examine the academic stress among senior secondary
students.

The International Journal of Indian Psychology: Volume: 01 | Issue: 03 | ISSN 2348-5396
© 2014 www.ijip.in April – June 2014 135 | P a g e
HYPOTHESIS OF THE STUDY:
There is no significant difference among senior secondary boys and girls in relation to academic
stress.
RESEARCH METHODOLOGY:
Sample
The research sample consisted of thirty participants divided into two groups. Group A consists of
15 girls and Group B consists of 15 boys of senior secondary school. All belong to the secondary
level age 17-19 years. All participants were from school of Noida.
Table I
Sample of Senior Secondary Boys and Girls
Sr. No. Group N ∑
1. Boys 15 30
2. Girls 15
Tools used
The data was collected through standardized “Academic stress questionnaire” by Mohad Akram,
Mohd Ilyas Khan and Sahiba baby. This tool has only 36 items. There was no time limit of the
test. Reliability of the test is 0.829 and the validity of the test is 0.41 to 0.88.
Procedure of Data Collection
There were 30 participants selected from the school of Noida. The data was collected with the
help of the teachers. Detailed instruction were given to all the participants, how to fill the scoring
sheet. Participants have done the test in peaceful environment with full concentration.
STATISTICAL ANALYSES AND RESULT:
The entire data were coded for analyses the data, statistics and t-test for mean difference were
applied to measure stress management scale. All the calculations were calculated manually.

The International Journal of Indian Psychology: Volume: 01 | Issue: 03 | ISSN 2348-5396
© 2014 www.ijip.in April – June 2014 136 | P a g e
Table II
Mean S.D and T-value of Senior Secondary Boys and Girls.
Sr. No. Group N Mean S.D T-test Sig
1. Boys 15 64.46 8.02 3.23 S
2. Girls 15 57.66 7.59
The results show that boys have higher scores on academic stress than girls. Boys mean is
(M= 64.46, SD=8.02) in relation to Academic stress. Results represent that boys have more
academic stress in their academic work in compare to girls (M=57.66, SD=7.59). It may be due
to have a lot of diverse work pressure than the girls. The t-value is 3.23 which is significant. So,
here we reject Null Hypothesis (H0).
DISCUSSION AND CONCLUSION:
It is generally found that stress level have been found more in boys than girl as shown in the
study. Boys have more stress due to the fact that parents have a feeling that boys are more
capable of handling their property and business including other household and social
responsibility, family has higher expectation from the males to excel in life, rather than girls.
Due to this fact parents expect more from boys rather as compared to girls , which is a major
cause of increasing stress level in boys. Youth suicide, however, is only the tip of the iceberg,
which masks the generalized anxiety and depression experienced by many high school students.
Studies Conducted in Korea and Japan have found that students who experience academic stress.
Express their distress in a variety of ways, including in terms of depression, anxiety, and Somatic
symptoms (Lee & Larson, 1996; Schoolland, 1990) Some students are not capable of handling so
much stress and they find it easier to die rather than living a life full of stress. As a result suicide
rate among youth is increasing at a fast rate. Moreover parent’s expectation on their children is
increasing day by day which is another cause of increasing stress level among youth. For
example parents wish that his son or daughter should become engineer or doctor without
knowing their children ambitions like he or she may have interest in other fields but parents
pressurize their children to fulfill their wish. Sometime the parents are influenced by the society
in which they are living. All these factors affect boys more than girls as boys are believed to
settle or manage a family

The International Journal of Indian Psychology: Volume: 01 | Issue: 03 | ISSN 2348-5396
© 2014 www.ijip.in April – June 2014 137 | P a g e
LIMITATION OF THE STUDY:
A limited number of subjects have been considering in this research. For a more profound
evaluation higher number of subjects from diverse backgrounds is more welcome step. Students
of 12th class go through huge and diverse social academic changes and are susceptible to
numerous behavioral changes. Taking notice of these changes is the biggest challenge.
REFERENCES:
1. Abouserie, R. (1994). Sources and levels of stress in relation to locus of control and self
esteem in university students, Educational Psychology, 14 (3) pp-323-330
2. Carveth, J.A., Gesse, T., & Moss, N. (1996). Survival strategies for nurse Midwifery
students, Journal of Nurse-Midwifery, 41 (1) 50-54
3. Erkutlu HV, Chafra J (2006). Relationship between leadership power bases and job stress
of subordinates: example from boutique hotels, Management Research News, 29 (5) pp-
285-297
4. Kolko, David J. (1980). Stress Management Techniques for Graduate Students: Cognitive
Coping, Problem Solving and Time Management, The South-eastern Psychological
Association, March, 1980, Washington, D.C. ED 192 230.

The International Journal of Indian Psychology: Volume: 01 | Issue: 03 | ISSN 2348-5396
© 2014 www.ijip.in April – June 2014 138 | P a g e
A study of Adjustment Problem among working women and non
working women
Kachchhi Parvati K*.
ABSTRACT
The main purpose was to find out the main difference between working and non working women
in adjustment problem. The total sample consisted 200 women in working non working women.
The research tool for Bell‟s adjustment inventory. Here „t„ test was applied to check the
significance of difference in adjustment problem. The study revealed the working women and
non working women were adjustment well especially from „social, emotional and Health
adjustment. The results showing that working women are more adjustment in terms of Health,
Social and Emotional adjustment than non working women.
INTRODUCTION:
The average person when asked “What do you want life?” will answer in words
synonymous with happiness. This in Psychological language mans the pursuit of satisfactions of
his various needs as they become active each day we must have built up habits, attitudes and
trains that are appropriate. To be as successful public speaker or athlete, for example, we must
have learned the necessary skill.
In the modern worlds changing pattern of society, technological development have
resulted in more and Indian women to be educated and taking up occupations, At the same time
they cannot separated them salves from various responsibilities of family and at the social front.
A women has to play multiple roles. Thus complexity increases if she is a working women. They
have to balance home as well as the job. This overload causes in them stress and strain. The
changing status pattern of Indian working women not only influences their societal role at the
same time but also their attitudes behavior and their personality. The problems of working
women are various types such as psychosocial and professional.
METHOD:
Objectives: Objectives of the study are as under to
1. To check the significant difference between the Health, adjustment of working and
non working women.
2. To check the significant difference between the social adjustment of working and non
working women.
3. To check the significant difference between the Emotional adjustment of working and
non working women.
*Associate Professor, Shree Devmani Arts & Commerce College, Visavadar – 362 130,
GUJARAT

The International Journal of Indian Psychology: Volume: 01 | Issue: 03 | ISSN 2348-5396
© 2014 www.ijip.in April – June 2014 139 | P a g e
Hypothesis:
1. There is no significant difference between the Health adjustment of working and non
working women.
2. There is no significant difference between the social adjustment of working and non
working women.
3. There is no significant difference between the emotional adjustment of working and
non working women.
Sample: The purpose of present investigation randomly samples selection system has been
adopted in this system 200 women. Out of 300 has been selected randomly. In 200
Samples there are 100 working women and 100 non working women.
Tools: To collect the data investigator will use following tools. Bell‟s adjustment inventory
was used the investigate adjustment among working and non working women.
Results and discussion:
Table of mean so and„ t ‟ value of working and non working women in terms of Health,
Social and Emotional adjustment.
Variable Category of
women
n (N) mean SD ‘t’ Value sig
Health Working 100 18.08 6.53 3.62 0.01
Non working 100 20.80 9.01
Social Working 100 17.90 6.81 5.09 0.01
Non working 100 13.44 4.56
Emotional Working 100 22.09 8.10 2.28 0.05
Non working 100 19.11 6.05
Conclusions:
1. Working women are more adjustment in Health than non working women.
2. Working women are more positive adjustment in social than non working women.
3. Working women are more adjustment in emotional then non working women.
Table show health adjustment of working and non working women. It has been found
that there is significant difference among them with respect to health adjustment (t = 3.62<0.01).
It may be brave working women are diet and health conscious than non working women.
Social adjustment is found in better working women then non working women (mean
value of working women = 17.90 mean value of non working women = 13.44) the calculated „ t ‟
value is 5.09, this may be due to more social networking of working women at the job aria than
non working women.

The International Journal of Indian Psychology: Volume: 01 | Issue: 03 | ISSN 2348-5396
© 2014 www.ijip.in April – June 2014 140 | P a g e
Emotional adjustment is again better in working women. The calculated„ t ‟ value is 2.28
working women go outside their home may have strong social net working to desire share their
feelings, worries similarly they are economically independent and have a sense of identity in he
society. This makes them emotionally and socially more secure than non working women.
References:
1. Alport, F.H. (1924), Social psychology, Boston Hought in miffin pp 235 – 276.
2. Bogardus, E.S. (1931), Fundamentals of social psychology new jourks.
3. Kapoor pramila (1970) marriage and working women in India Delhi : Vikas publishing
house.
4. Schultz, Linda bag (1978), Role preference congenity and marital satisfaction Diss abst
30, P 57 – 47.

The International Journal of Indian Psychology: Volume: 01 | Issue: 03 | ISSN 2348-5396
© 2014 www.ijip.in April – June 2014 141 | P a g e
Adolescence at Risk: An Overview
Shaik Ali*
ABSTRACT
Today, 1.2 billion adolescents stand at the crossroads between childhood and the adult world. Around 243
million of them live in India. About one-quarter of India’s population are adolescents.(UNICEF). As they
stand at these crossroads, so do societies at large – the crossroads between losing out on the potential of a
generation or nurturing them to transform society. Adolescence is considered as a period of transition
from childhood to adulthood. It is characterized by rapid physical growth, significant physical, emotional,
psychological and spiritual changes. Adolescents – young people between the ages of 10 and 19 years are
often thought of as a healthy group. Nevertheless, many adolescents do die prematurely due to accidents,
suicide, violence, pregnancy related complications and other illnesses that are either preventable or
treatable. Many more suffer chronic ill-health and disability. In addition, many serious diseases in
adulthood have their roots in adolescence. For example, tobacco use, sexually transmitted infections
including HIV, poor eating and exercise habits, lead to illness or premature death later in life. Like adults,
adolescents can experience emotions, thoughts, and behaviors that are distressing, disruptive, and
disabling. Because many of these problems are precursors to much more disabling disorders during later
life, mental and behavioral problems in childhood and adolescence represent a very high cost to society in
both human and financial terms. The problems of adolescents are multi- dimensional in nature and require
holistic approach. This paper aims to reveal the various problems of the adolescence in India. It also
makes an attempt to locate the significance of measures from a strategic perspective. The present study is
based upon secondary sources.
Key words: Development, Health, Policy, Substance abuse, and Violence.
INTRODUCTION:
Adolescence is the second decade of life. It is a period of great physical and psychological change. It also
brings changes in social interactions and relationships. It is a time of opportunity, but also of risk.
Adolescence is the window of opportunity to set the stage for a healthy and productive adulthood and to
reduce the likelihood of health problems in the years to come. Yet it can entail risk, as a period when
health problems that have serious immediate consequences can occur or when problem behaviors that
have serious adverse effects on health in the future can be initiated. There are sound public health,
economic and human rights reasons for investing in the health and development of adolescents. Greater
investment in adolescent health would help prevent the estimated 1.4million deaths that occur each year
among 10-19 year olds due to road traffic accidents, complications during pregnancy and child birth,
suicide, violence, and HIV/AIDS. It would also improve the health and well-being of many millions of
adolescents who
*Lecturer in Sociology, Government Pre-University College, Kavital. Tq: Manvi. Dt:Raichur. Karnataka

The International Journal of Indian Psychology: Volume: 01 | Issue: 03 | ISSN 2348-5396
© 2014 www.ijip.in April – June 2014 142 | P a g e
experience health problems such as depression or anemia; and promote the adoption of behaviors that
help prevent health problems later in life, such as cardiovascular diseases and lung cancer resulting from
physical inactivity and tobacco use initiated during adolescence. Finally, investing in adolescent health
can prevent problems in the next generation, such as prematurity and low-birth weight in infants born to
very young mothers. There is growing recognition of the economic benefits of investing in the healthy
development of adolescents, and the economic costs of not doing so. In 2002, the UN General Assembly
Special Session on Children recognized the need for the "development and implementation of national
health policies and programmers for adolescents, including goals and indicators, to promote their physical
and mental health”. Almost all Member States are signatories to the UN Convention on the Rights of the
Child, which clearly states that adolescents have the right to obtain the health information and services
they need to survive, grow and develop to their full potential.
Adolescents – young people between the ages of 10 and 19 years – are often thought of as a healthy
group. Nevertheless, many adolescents do die prematurely due to accidents, suicide, violence, pregnancy
related complications and other illnesses that are either preventable or treatable. Many more suffer
chronic ill-health and disability. In addition, many serious diseases in adulthood have their roots in
adolescence. For example, tobacco use, sexually transmitted infections including HIV, poor eating and
exercise habits, lead to illness or premature death later in life. Like adults, adolescents can experience
emotions, thoughts, and behaviors that are distressing, disruptive, and disabling. Because many of these
problems are precursors to much more disabling disorders during later life, mental and behavioral
problems in childhood and adolescence represent a very high cost to society in both human and financial
terms. Estimates vary, but globally it seems that 15 to 20% of all children/adolescents have one or more
mental or behavioral disorders, and some studies have shown prevalence even greater than 20%. When
young people have mental problems, they are at higher risk for abuse and neglect, suicide, substance use,
school failure, violence and criminal activities, mental illness in adulthood, and health-jeopardizing
impulsive behaviors. The present paper is based upon secondary sources.
Overview:
Caught in the web of transition from childhood to adulthood, the adolescents and youth between 10 and
24 years of age are most acutely affected by such unprecedented, and often unmanageable, changes. The
swiftly-changing global conditions are placing a great strain on the young people, modifying their
behavior and relationships and exacerbating their health problems. In the late ‘80s that the world
community formally recognized how seriously the health of young people impacts on the health and
development future generations. With the further realization that the current and future health of young
people depends very much on their own actions, choices and behaviors, the World Health Assembly
passed a special resolution in May 1989 to highlight these issues. This resolution urged Member States to
give acceptable programmers and services to meet these needs. It also emphasized the role of families and
communities, and most importantly, the young themselves. Thereafter, the International Conference on
Population and Development (ICPD) in Cairo in 1994 also emphasized the special needs of adolescents
and youth. Since then there have been some activities carried out by nongovernmental organizations
relating to a few aspects of adolescent health. But countries and communities are, by and large, neglecting
this critical age group. There are still virtually no special programmers or services to prepare this
vulnerability for a healthy adulthood.

The International Journal of Indian Psychology: Volume: 01 | Issue: 03 | ISSN 2348-5396
© 2014 www.ijip.in April – June 2014 143 | P a g e
In 2003, the Committee of the Convention on the Rights of the Child (CRC) issued a General Comment
in which the special health and development needs and rights of adolescents and young people were
recognized. These are further supported by the Convention on the Elimination of Discrimination Against
Women (CEDAW) and the Right to Health. However, prevention strategies and prompt interventions can
reduce morbidity and mortality, and allow children and adolescents to develop into responsible,
contributing adults. In today's fast changing world, adolescents - people between the ages of 10 and 19
years - face a range of health and social challenges. Many adolescents make the transition to adulthood in
good health while some others do not. In addition, many serious diseases in adulthood have their roots in
behaviors initiated during adolescence. Public health response in needed to address their specific health
needs to ensure that they realize their fullest potential and are able to contribute to national development.
The World Health Organization has identified the following.
• Most young people are healthy. However, More than 2.6 million young people aged 10 to 24 die
each year, mostly due to preventable causes.
• About 16 million girls aged 15 to 19 give birth every year. Young people, 15 to 24 years old,
accounted for 40% of all new HIV infections among adults in 2009. An estimated 150 million
young people use tobacco. Approximately 430 young people aged 10 to 24 die every day through
interpersonal violence. Road traffic injuries cause an estimated 700 young people to die every day
(WHO).
• A much greater number of young people suffer from illnesses which hinder their ability to grow
and develop to their full potential.
Health Issues affecting young people:
The World Health Organization (WHO) has identified some of the main health issues affecting young
people and is described below:
Early pregnancy and childbirth:
About 16 million girls aged 15 to 19 years give birth every year - roughly 11% of all births worldwide.
The vast majority of adolescents’ births occur in developing countries. The risk of dying from pregnancy-
related causes is much higher for adolescents than for older women. The younger the adolescent, the
greater the risk. Unintended pregnancy (both unplanned and unwanted) among adolescents is a common
public health problem worldwide. Repeat pregnancies in this group also occur frequently and are related
to increased risks of adverse outcomes for adolescent mothers and their babies. Pregnancy and childbirth-
related deaths are the number one killers of 15–19-year-old girls worldwide, with nearly 70 000 annual
deaths. At least 2 million more young women are left with a chronic illness or disability, which may bring
them life-long suffering, shame, or abandonment. Physically immature and often with few resources, the
youngest first-time mothers are most at risk. Moreover, each year 2.2–4 million adolescents resort to
unsafe abortion. Ninety-nine per cent of maternal deaths occur in the developing world, most of which (an
overwhelming 74 %) are preventable.

The International Journal of Indian Psychology: Volume: 01 | Issue: 03 | ISSN 2348-5396
© 2014 www.ijip.in April – June 2014 144 | P a g e
HIV/AIDS
Fifteen to 24 year olds accounted for an estimated 40% of all new HIV infections among adults
worldwide in 2009. Every day, 2400 more young people get infected and globally there are more than 5
million young people living with HIV/AIDS. Young people need to know how to protect themselves and
have the means to do so. This includes condoms to prevent sexual transmission of the virus and clean
needles and syringes for those who inject drugs. Currently, only 36% of young men and 24% of young
women have the comprehensive and correct knowledge they need to protect themselves from acquiring
the virus.
Malnutrition
Many boys and girls in developing countries enter adolescence undernourished, making them more
vulnerable to disease and early death. Conversely, overweight and obesity (another form of malnutrition
with serious health consequences and important longer term financial implications for health systems) are
increasing among young people in both low- and high-income countries.
Mental health
In any given year, about 20% of adolescents will experience a mental health problem, most commonly
depression or anxiety. The risk is increased by experiences of violence, humiliation, devaluation and
poverty, and suicide is one of the leading causes of death in young people.
Tobacco use
The vast majority of tobacco users worldwide began when they were adolescents. Today an estimated 150
million young people use tobacco. This number is increasing globally, particularly among young women.
Half of those users will die prematurely as a result of tobacco use.
Harmful use of alcohol
Harmful drinking among young people is an increasing concern in many countries. Alcohol use starts at a
young age: 14% of adolescent girls and 18% of boys aged 13–15 years in low- and middle-income
countries are reported to use alcohol. It reduces self-control and increases risky behaviours. It is a primary
cause of injuries (including those due to road traffic accidents), violence (especially domestic violence)
and premature deaths.
Violence
Violence is one of the leading causes of death among young people, particularly males: an estimated 430
young people aged 10 to 24 years die every day through interpersonal violence. For each death, an
estimated 20 to 40 youths require hospital treatment for a violence-related injury.
Injuries
Unintentional injuries are a leading cause of death and disability among young people. Road traffic
injuries take the lives of a staggering 700 young people every day.

The International Journal of Indian Psychology: Volume: 01 | Issue: 03 | ISSN 2348-5396
© 2014 www.ijip.in April – June 2014 145 | P a g e
THE INDIAN SCENARIO:
A large number of adolescents in India are out of school, malnourished, get married early, working in
vulnerable situations, and are sexually active. They are exposed to tobacco or alcohol abuse. In India,
Jobs are shrinking at an alarming rate. Privatization and globalization have further aggravated the
problem instead of generating employment; they have rendered millions of hands idle. It is caused by the
rapid growth of population, the slow economic growth and the defective education system.
Unemployment people easily become criminals. They disturb internal peace in the country and tempt
aggressive countries to invade it. It is caused by the rapid growth of population, the slow economic
growth and the defective education system. Unemployment people easily become criminals. They disturb
internal peace in the country and tempt aggressive countries to invade it.
These various factors have made adolescence to be scared of. India has huge population which has
triggered number of problems arising out of it. The population, more particularly adolescence has been
diminished due to several reasons. They are sometime go into the hands of organized criminals or
suffered from disorganized family rooting into the unwanted situations. For instance, girls are made to
jump into the prostitution. It affects their physical and mental health. Many adolescent girls become
brides, get pregnant, and have children before they are physically, emotionally, and socially mature
enough to be mothers. Married or unmarried, adolescent girls become pregnant for different reasons. For
some, pregnancy is accidental and the results of experimenting with sexuality or of lack of knowledge
about how to prevent conception. Others seek pregnancy and motherhood to achieve adult status or fill an
emotional void. But most adolescent pregnancies have little to do with choice or mistake. Globally, the
majority of adolescent girls who become pregnant are married and pressured to have a child. For others,
pregnancy often results from abusive, forced, or coerced sex (WHO). The situation in India is not out of it.
The problem of child labor is also mounting at the alarming rate which affects the physical, emotional and
mental health of the children and adolescents.
STRATEGIC PERSPECTIVES:
Many technical and political agencies at the global, regional and national levels have been implementing
a variety of interventions with diverse approaches to address a wide range of factors related to unintended
pregnancies among adolescents. The goals of these agencies have included, among others: helping
adolescents to change psychosocial risk and protective factors involving sexuality; increasing teens´
knowledge about risks and consistent and safe use of contraceptives; and skills training to support their
social inclusion and personal development.
At the present time, stakeholders ranging from teens ´parents, health-care providers, teachers, and policy-
makers need to understand better how to set up programmes that can be practical, evidence-based,
culturally appropriate, acceptable for adolescents, and that can guarantee good results in terms of the
goals to be achieved to the satisfaction of all those involved, principally adolescents. The Strategic
perspectives in the context of India are as follows:
• The programmes and policies for adolescents should focus on their constructive development.

The International Journal of Indian Psychology: Volume: 01 | Issue: 03 | ISSN 2348-5396
© 2014 www.ijip.in April – June 2014 146 | P a g e
• Counseling in psychological, academic performance, health areas, and career guidance.
• Provision of economic and social opportunities to involve all of them in some constructive
activities at the college and community level with less competition and more with a sense of co-
operation.
• Youth clubs should be established in the community as platforms to exhibit their inner qualities.
• Awareness programmes should be conducted about the impact of bad habits.
CONCLUSION:
There is great need to promote adolescent development to achieve the progress of the nation. The
adolescents should be encouraged to participate in educational and economically viable activities which
will enable them to actively involved in the process of national development. There is a need for
preventive and curative mental health care for adolescents and support appropriate community action. The
programmes for adolescents should focus on the development of inter-personal communication skills,
counseling in psychological, academic and health areas, career guidance and provision of economic and
social opportunities to involve all of them in some constructive activities at the school and community
level with less competition and more with a sense of co-operation. This can be achieved by Competency
Building as a part of redefining measures from a strategic perspective.
REFERENCES:
1. C. Eugene Walker; Michael C. Roberts(2001), 'Handbook of Clinical Child Psychology'. John
Wiley & Sons. New York.
2. Erik H. Erikson,(1994), 'Identity: Youth and Crisis'.W. W. Norton & Company. New York.
3. http://www.who.int/topics/adolescent_health/en/. Retrieved 12.05.2014.
4. Inge Seiffge-Krenke Universitat Mainz,(1998),'Adolescents Health: A Developmental
Perspective'. Lawrence Erlbaum Associates publishers,New Jersey London.
5. R Paruthi, PK Dutta (2002), 'Reproductive and child health programme', Indian Public Health
Journal,Volume 46 | Issue 3-Sep.
6. www.google.com. Retrieved 12.05.2014.

The International Journal of Indian Psychology: Volume: 01 | Issue: 03 | ISSN 2348-5396
© 2014 www.ijip.in April – June 2014 147 | P a g e
An assessment of role stress experienced by management students in
India- Suggestive measures and strategies
Dr.Neeta Sinha*
INTRODUCTION:
Consistent increase in the rate of psychosomatic and mental diseases and the feeling of
dissatisfaction with life in general among majority of people in present day world very well
reflects the ill consequences for high psychosocial stress being experienced by the present
generation. In the recent years while on one hand the quality of life has increased on the other
hand the stresses involved too have gone up. Stress thus becomes inevitable in life, and with
increasing problems, aspirations and uncertainties associated with socio-economic, political and
cultural upheavals, it is only likely to increase.
Of late we have seen that there has been a movement towards greater accountability and
transparency in higher education and therefore consideration of student issues becomes
imminent. Today, every university administrator is aware of the challenges that higher education
faces. Some of the traditional challenges are financial and managerial while the other
contemporary challenges are how to strike a balance between knowledge and information. One
of the most challenging aspects for current higher education institutes thus becomes proliferation
of roles that members have to undertake during their everyday educational practice.
Stress has become an everyday word being used in the modern day world, yet remarkably few
people use the term stress in a proper manner or even bother to attempt for a clear cut definition
of the term stress. In Psychology stress refers to a „state of organism resulting from some
interaction with the environment.‟ The term stress has been originally derived from Latin, where
it indicates hardship, strain, adversity or afflictions. Various terms have been used synonymously
with stress, anxiety, frustrations, conflicts, tension, pressure and strain.
Assistant Professor, Dept. of Psychology, School of Liberal Studies, Pandit Deendayal
Petroleum University, Raisan, Gandhinagar, Gujarat.

The International Journal of Indian Psychology: Volume: 01 | Issue: 03 | ISSN 2348-5396
© 2014 www.ijip.in April – June 2014 148 | P a g e
Stress is a natural physiological mechanism that protects humans from danger since it acts as a
precursor. The moment stress occurs, the human body prepares for quick action by releasing
hormones that increase alertness and focus (National Institutes of Health [NIH], 2007). However,
if the source of stress does not disappear, stress hormones can persist in the body. But if a
stressful situation persists for a long period of time it may lead to a wide range of physical and
psychological illnesses, such as obesity, gastrointestinal disorders, cardiovascular disorders, skin
disorders, anxiety attacks, and depression (Everly & Lating, 2002; NIH, 2007; Weidner, 2000).
which may affect some students adversely (Wright, 1967).
Stress may be defined as a response brought about by various external events (Selye, 1976) and
can be viewed as a positive or negative experience. Fontana (1989) defines stress as a demand
made upon the adaptive capacities of the mind and the body. There has been considerable
amount of research on the stress levels of Engineering and Medical students and organizational
stress, but not much work has been done on the stress levels of management students. And
management being one of the most sought after courses today, the need for the study arises.
Hence in this study an attempt has been made to determine the stressors affecting the
management students in their day to day life and the methods to cope with them to help them
become effective managers in future. Students are subjected to different kinds of stressors, such
as the pressure of academics with an obligation to succeed, an uncertain future and difficulties of
integrating into the system. The students also face social, emotional and physical and family
problems which may affect their learning ability and academic performance. Too much stress
can cause physical and mental health problems, reduce students‟ self-esteem and may affect
students academic achievement. In recent years there is a growing appreciation of the stresses
involved in management training. Being able to effectively cope with stress can be the first step
to preventing psychological distress and development of a serious illness.
OBJECTIVE:
Management Education is an important component in overall education system in India and
plays a vital role in bringing out socio-economic development of the country. Many management
institutes have come up over the last few years in the country set up both by the private sector

The International Journal of Indian Psychology: Volume: 01 | Issue: 03 | ISSN 2348-5396
© 2014 www.ijip.in April – June 2014 149 | P a g e
and government institutions. And with the mushrooming population it becomes all the more
easily to attract students. Obtaining a technical or management degree is considered very
prestigious by the burgeoning middle class and is supposed to add to the upward mobility of the
families in this status conscious society. Also once the male child has a good job he would be
able to take up the financial responsibilities of the family, and for the female child a good degree
is considered to be a passport to a good match. However many a times it so happens that the
infrastructure and facilities may not be up to the mark and the students may not be able to get as
good a job or position despite all the investments in terms of time, money etc. and this is where
stress starts to set in. Over the past few years we have seen many reports in the media related to
stress syndromes of the students. However not much work has been done on the stress levels of
management students in India hence this study was undertaken to examine the levels of role
stress among management students.
LITERATURE SURVEY
From their studies Kahn & Quinn, 1970: 41 conclude that role stress not only leads to tension
and emotional reaction but also affects interpersonal relationships and leads to physical and
psychological well being of an individual and his/her potential role/performance.
A number of studies have been conducted on role stress in organizations (for example, Kapur,
1969; Pestonjee & Pareek, 1997; Pattanayak, 2003; Aziz, 2003). Schuler et al. (1977) evaluate
the impact of role stresses in organizations and maintain that they have been associated with
negative work outcomes. Aziz (2004) investigates the intensity of organizational role stress
among women information technology professional in the Indian private sector. He finds a
difference in level of stress experienced by married and unmarried employees on several role
stressors.
Stress among college students
The academic, socio-psychological and financial concerns that the students have are typical in
nature. These years tend to be a period of immense change and adjustments in a young adult‟s
life. This is the time when students have probably moved out of their homes for the first time
leaving behind the sheltered life they have been so used to. They tend to form a new support
system with their peers. The new intellectual rigors and academic demands that they are facing
now in the professional courses are quite different from their earlier exposures. Many of these

The International Journal of Indian Psychology: Volume: 01 | Issue: 03 | ISSN 2348-5396
© 2014 www.ijip.in April – June 2014 150 | P a g e
professional courses are self –financed hence they tend to pose a heavy demand on home
finances and more often than not the students have to take recourse to loans to finance the higher
education. Any student has to play several roles and try and satisfy all the parties concerned –
The role may be that of a good student with good academic performance, an ideal son/daughter
with respect for family tradition, culture and values. In our Indian setup the student is also
expected to take care of the family and help financially once he is settled with a decent job. He
is also expected to be in tune with the times so as to be able to participate in student‟s activities
and be in stride with his peers. The different expectations and roles place many conflicting and
even vague demands on his personality. These factors are likely to contribute to distress among a
relatively large proportion of students, especially when coupled with the uncertainty of future
employment opportunities and a fear of not meeting parental and social expectations
Management course in particular poses heavy demands on students in terms of time, money and
other resources. They are also faced with new intellectual rigors and academic challenges that
they may not have experienced earlier. Then there is the uncertainty of future employment
opportunities and fear of not meeting social and family expectations. The students experience
time pressure, social maladjustments, friendship issues, developmental challenges and romantic
upheavals in their lives causing them stress at different points of time.
In a study conducted by Rakesh Kumar Agrawal and Shailendera Singh Chahar 2007” they
explore the extent and types of role stresses present among the engineering and management
students in India. The findings reveal that students are experiencing role overload, role
stagnation and self-role distance. Male students experience higher levels of role stagnation than
female students. However, no significant differences could be observed on any of the role
stressors between first year students and their seniors, or between management and engineering
students. The results are indicative of the social and educational environment prevailing in the
country
A study was conducted by Pestonjee D M & Mishra Prabhat Kumar 1998, to examine the nature
of role stress and job satisfaction among doctors, and to explore the relationship between these
variables. To attain the objectives of the study, two psychometric instruments the
Organizational Role Stress Scale (Pareek, 1983) and the Employees S-D Inventory (Pestonjee,

The International Journal of Indian Psychology: Volume: 01 | Issue: 03 | ISSN 2348-5396
© 2014 www.ijip.in April – June 2014 151 | P a g e
1981) were administered to the sample population to obtain data pertaining to role stress and job
satisfaction variables. The data were analyzed in terms of the t-test and coefficients of
correlation. Results of the study revealed no significant differences between the two groups
except in the case of management area of job satisfaction and inter-role distance (IRD)
dimension of role stress. Further, job satisfaction variables correlated negatively with all the
dimensions of role stress.
“Organizational Role Stress among Indian IT Professionals” by Mohsin Aziz, 2003, wherein he
has used the ORS Scale to measure the Role Stress of IT professional in India. According to
Aziz, the mean ORS score of 70.16 confirms that information technology professionals are
experiencing fairly high organizational role stress. He further adds that the role stressors that
emerged as the top three contributors to overall organizational role stress were RIN, RS, and
IRD, respectively.
Pestonjee D M & Singh 1987, in another study attempted to explore the interrelationship
between job satisfaction areas and different factors of role stresses in EDP managers and system
analysts from Public and Private computer organizations. For this „ORS Scale‟ and “Job
Satisfaction Inventory‟ were administered. The findings revealed that EDP managers and system
analysts of both, public and private organizations differ significantly in their perception of job
area and management area of satisfaction. They also differ significantly on inter-role distance. In
some comparison groups, they differed significantly in role stress factors like role expectation
conflict, role overload, resource inadequacy, role stagnation and overall role stress
PRESENT STUDY:
For the present study 219 students were taken from a B Grade management school, (B-School)
where most entrants have an average academic performance and majority hailed from small
cities or big towns of India who have moved to Ahmedabad for pursuing management studies.
They were graduates from different disciplines with little or no work experience and few
students had taken education loan and therefore the expectation out of the course was high.
The students in self-financed, second rung B-schools are academically average and hail from
diverse cultural and economic background. The sample consisted of students hailing from

The International Journal of Indian Psychology: Volume: 01 | Issue: 03 | ISSN 2348-5396
© 2014 www.ijip.in April – June 2014 152 | P a g e
different parts of the country most of them having moved away from their families for the first
time.
The Organizational Role Stress (ORS Scale-students version) was used to determine the
sources of stress among management students. Role can be defined as a set of functions which an
individual performs in response to the expectations of the significant members of a social system
and his own expectations about the position that he occupies (Pareek, 1993). Stress is built up in
the concept of role. Whenever there is conflict between the self, the role under question and other
roles that the person occupies, or where there is incompatibility amongst expectations by
Individual or significant others, there is a potential for role stress. A role stress has been defined
as „anything about an organizational role that produces adverse consequences for the individual‟
(Kahn & Quinn, 1970: 41). Role is an obligation concept in which there are expectation from
both the senders side and occupants side. The term "stress" will be used here to refer to such
terms and concepts as strain and pressure. The concept of role is vital for the integration of the
individual with an organization. The organization has its own structure and goals similarly the
individual has his personality and needs (motivations). All these aspects interact with each other
and to some extent get integrated into a role. Role is also a central concept in work motivation as
it is only through this that the individual and organization interact with each other. Each
individual occupies and plays several roles. The focus on roles can be useful in planning
organizational effectiveness hence the concept of role assumes much importance. The concept of
role and its two related aspects, role space and role set, have a built-in potential for conflict and
stress
Role Space has three main variables: self, the role under question, and the other roles one
occupies. Any conflict among these is referred to as role space conflict. These conflicts may take
several forms as Inter-Role Distance, Self/Role Conflict, Role-Expectation Conflict, Personal
Inadequacy, and Role Stagnation.
Role set is the role system within the organization of which roles are part and by which
individual roles are defined. Role set conflicts take the forms of Role Ambiguity, Role Overload,
Role Erosion, Resource Inadequacy, and Role Isolation. The above dimensions of conflict are
worth considering in relation to organizational role stress

The International Journal of Indian Psychology: Volume: 01 | Issue: 03 | ISSN 2348-5396
© 2014 www.ijip.in April – June 2014 153 | P a g e
The 10 dimensions of the ORS Scale thus are:
1. Self –Role Distance (SRD)
2. Role Stagnation (RS)
3. Inter Role Distance (IRD)
4. Role Isolation (RI)
5. Role Ambiguity (RA)
6. Role Expectation Conflict (REC)
7. Role Overload (RO)
8. Role Erosion (RE)
9. Resource Inadequacy (RIn)
10. Personal Inadequacy (PIn)
DISCUSSION:
Though analysis of data on the basis of these variables does not show any significant
statistical difference on any of the role stressor which means that the groups of role
occupants in the management education system find themselves struggling equally to meet
the varied role demands. But on relative comparison the responses on the various
dimensions can help in identifying possible stressors for college students which can
eventually help in developing stress intervention programs for business school. Hence on
the basis of the findings we shall discuss the various stressors and the possible associated
factors that are presumed to be causing these.
The findings of this study suggest as seen fig.1 that students are experiencing Role Stress,
wherein Role Overload (RO - 12%) and Inter Role Distance(IRD -12%) have emerged as the
most potent stressors followed by Personal Inadequacy(PIN- 11%) . The stressor having the
least effect on the students was found to be Role Ambiguity (RA- 8%) which means the
students are quite clear on the various expectations that the people have on them. They are clear
on their activities, responsibilities, priorities, norms and general expectations. They are aware
what they are supposed to do at what point of time.

The International Journal of Indian Psychology: Volume: 01 | Issue: 03 | ISSN 2348-5396
© 2014 www.ijip.in April – June 2014 154 | P a g e
Fig.1
Role overload – 12% (RO) develops when the role occupant feels that there are too many
expectations from „significant‟ others in his role set. The students experience role overload in
both its aspects – qualitative and quantitative. Possible reasons for high role overload within the
students include the academic rigors and demands of the professional courses which the students
were pursuing. Role overload is measured when questions are asked to students as to whether
they can finish the work given to them during a modified work day and whether the amount of
work they do might interfere with how well it is done. Role overload usually occurs when there
are large variations in the expected output and delegation or assistance-ship cannot be sought.
The academic burden seems very high to the students because, as already mentioned they come
from varying academic backgrounds (like arts, science commerce with almost no previous
exposure to any area of management, are academically average and to meet up with the market
expectations and feedback, the course structure is designed such that industry requirement is met,
which makes the course modules rigorous. Secondly, the methodology and scheme of continuous
evaluation is also very different from the conventional academic method that the students have
been used to uptill their graduation days. The pattern of assessment varies from presentations to
Inter Role Distance12%
Role Stagnation10%
Role Expectation
Conflict9%Role Erosion
10%
Role Orverload12%
Role Isolation9%
Personal Inadequacy11%
Self-Role Distance
10%
Role Ambiguity8%
Resource Inadequacy (Rin)9%
Inter Role Distance
Role Stagnation
Role Expectation Conflict
Role Erosion
Role Orverload
Role Isolation
Personal Inadequacy
Self-Role Distance
Role Ambiguity
Resource Inadequacy (Rin)

The International Journal of Indian Psychology: Volume: 01 | Issue: 03 | ISSN 2348-5396
© 2014 www.ijip.in April – June 2014 155 | P a g e
quizzes, written assignments to projects to ensure a holistic and 360 evaluation process. Many
were also struggling to meet up with the standards they had set for themselves to satisfy their
own dreams and that of their parents. Extracurricular activities too added to role overload being
experienced by students. Therefore irrespective of their earlier academic performance and
gender, the course workload distinctly stood out as the highest source of stress
Inter Role Distance - 12%(IRD) has also been experienced among the majority of the students.
It occurs when an individual occupies more than one role thus resulting in conflicts. Such inter
role conflicts are quite frequent in a modern society where the students are increasingly
occupying multiple roles in various groups. For.eg. A student faces conflict between his role as a
student where he has to perform well academically vs. his other roles towards family where he is
expected to be an ideal son/daughter and in future share the family burden both financially and
emotionally. He/she has to be in tune with the times to be accepted by his peers and at the same
time be an active participant in students‟ activities. The demand on the time of students would be
incompatible with the curriculum demands. To meet up with the demands of the course and
recruitment, new responsibilities and staying away from home, the students‟ life-style undergoes
a drastic change. And in this juggling of new roles he frequently finds himself/ herself very
stressed out.
Personal Inadequacy -11% (PIN) has equally come up as a source of stress affecting majority
of students. Students‟ experiences Personal Inadequacy wherein he student feels he is not well
equipped in terms of knowledge, skills or training to perform the tasks assigned to him
adequately. Or maybe since he has not had the time to prepare for the assigned role for effective
performance hence he is experiencing stress. Also the medium of instruction being English may
students from vernacular backgrounds with very little exposure to English had to put in extra
hours simply to comprehend what was being taught and then to express their thoughts
accordingly. Additionally, increased need for heightened interpersonal skills to cope up with the
demand of management education contributes to stress among students. The focus of
management education is developing student‟s aptitude beyond the academic boundaries to
prepare them for a real life corporate situation which includes conflict resolution and team work.

The International Journal of Indian Psychology: Volume: 01 | Issue: 03 | ISSN 2348-5396
© 2014 www.ijip.in April – June 2014 156 | P a g e
Inability to establish healthy relationships within the group and respond positively to group
dynamics adds to the increased stress levels of the students.
Role Stagnation -10% (RS): feeling of being stuck in the same role. As an individual grows
older, he also grows in the role that he occupies in the organization. With an individual‟s
advancement the role changes; and with his change in role the need for taking on a new role
becomes crucial. This problem of role growth becomes acute when an individual who has
occupied a role for a long time enters another role in which he feels less secure. The new role
demands that an individual outgrows the previous one and takes charge of the new role
effectively, which is bound to produce some stress during the period of transition. In the present
academic rigors the students are so preoccupied with the jobs at hand that they hardly have time
to go beyond the academic necessities hence many a times they feel that they are not learning the
required skills other than academics to be able to be a better fit in the corporate world. This
corresponds to the major stressor Role Overload wherein they hardly have the time to cater to
personal intellectual growth. They are more focused towards trying to complete the academic
requirements with comprehension, and at times without comprehension just because they have to
do it.
Role Expectation Conflicts: - 9% (REC)
When there is conflicting expectation or demands by different role senders (persons having
expectation from the roles) the role occupant experiences this type of stress. The conflicting
expectation may be from peers, seniors, parents and teachers etc. Here in management education
too it so happens that the students are faced with various conflicting demands from various
groups of people around. And to satisfy these conflicting demands it becomes a real tough task.
The students are at cross road as to whom to satisfy and whom not. They don‟t want to
antagonize any person and at the same time it is too challenging to meet all demands, it is asking
for too much and this causes the students some real stress.
All other factors like Role Expectation Conflict (REC), Role Erosion (RE), Role Isolation (RI),
Self-Role Distance (SRD) and Resource Inadequacy (RI) have a moderate effect on the stress
levels of students in management institutions and the students over a period of time are able to
cope up on their own.

The International Journal of Indian Psychology: Volume: 01 | Issue: 03 | ISSN 2348-5396
© 2014 www.ijip.in April – June 2014 157 | P a g e
Suggestive Measures and Strategies
The changes taking place in the Indian economy and the world over have made the management
jobs very attractive and lucrative over the past decade. The social upliftment as a result of a good
management degree coupled with lack of alternative career options has been ascribed as a factor
leading to students pursuing management in hordes even though their own aptitude may be more
suited to their professions like art, culture, literature or humanities. The suggested remedies
therefore would be:
Identification of aptitude:
Many a times students join management courses without giving a thought to the development of
their own uniqueness hence during the course and even after wards they consider themselves to
be gross misfits, inadequate to compete in the corporate arena, leading to lower self esteem and
self concept. They feel socially rejected and isolated. All this leads to deeper psycho-social
issues which needs to be addressed.
In India today, students have good opportunities to join professional degrees like Engineering,
Management and Computers which provide with lucrative career opportunities but at the same
time the student should seek a career or vocation according to his or her aptitude or nature and
not due to social or family pressures.
Career guidance:
The parents should understand and accept their children as they are and not have unrealistic
expectation from them. Proper career guidance needs to be given and the students should select
their careers accordingly. During the process of selection we should look for people who are
more thoughtful, more aware, more sensitive, more flexible and more adaptive capable of being
mounded into global executives.
Integration of knowledge:
Research shows that the three elements required to build managerial capabilities are, knowledge,
skills and attributes. With knowledge an individual is able to identify, analyze and develop
workable solutions. He can communicate well and understand and assimilate the concepts of one
functional area of business to another. Of late a growing need has been seen towards the
inclusion of business management topics in other programs as well.
The International Journal of Indian Psychology: Volume: 01 | Issue: 03 | ISSN 2348-5396
© 2014 www.ijip.in April – June 2014 158 | P a g e
Attitude Building since childhood:
The attributes that help an individual become an effective leader are integrity, commitment to
learning, reflective and creative thinking. Hence if we can integrate the process of attribute
building into our curriculum right from school days the transition of an individual into any
stream would be very smooth.
Modification of the Education System:
The findings of several studies suggest that there is an immediate need to modify education
system wherein emphasis is not just on academics (text book learning) but more towards
application of skills developed through these professional courses from the very beginning and
the ability of the individual to adapt to the circumstances.
Integrating skills sets with the curriculum:
The focus on development of non-cognitive skills would include developing Interpersonal skills,
social and oral communication, and flexibility. The students need to be imparted with
administrative skills from the beginning itself, which implies – organizing, planning, decision
making and creativity. The students also need to be sensitized towards the tolerance of
uncertainty and resistance to stress. College festivals and socially relevant projects are an
important part of management students life in India which helps the students develop all the
above competencies hence the onus of making the students understand the importance of college
festivals and helping them take an active part in it lies on the management of the institution and
the faculties.
Financial Rearrangement:
Another study done on management students also suggests that work overload and pressure of
loan repayment is too much hence the need of the hour is that courses be so designed that
students feel least pressure and at the same time learn effective management skills in a conducive
environment.
Emotional Support:
Research has shown that social and emotional support helps a person to effectively cope with
stress. Persons maintaining close interpersonal relationships with friends and family are able to
use more approach strategies. Social support includes material support (providing resources) and
emotional support (listening to the person and encouraging him)

The International Journal of Indian Psychology: Volume: 01 | Issue: 03 | ISSN 2348-5396
© 2014 www.ijip.in April – June 2014 159 | P a g e
Hence it is recommended to incorporate training on coping strategies for stress management of
students so that they are able to face the stressors of the corporate world effectively and take it in
its stride.
The world going global it poses great challenges on future managers towards learning to cope
effectively to come out with flying colours and take the world by the storm. One of the primary
goals of management education is help students prepare for the real world (Lordan 1996). As
facilitators therefore it becomes our major responsibility to help reduce these stressors by
changing the system At the same time training our students and also making them understand,
that with competition rising on all fronts the stressors have to be accepted as a part of our
professional world but at the same time they need to develop coping strategies because in this
world only the fittest survive.
REFERENCES:
1. Aziz Mohsin “Organizational role stress among Indian Information Technology
professionals” Asian-Pacific Newsletter on occupational health and safety, Volume 10,
number 2, July 2003
2. Aziz, M. (2004). Role stress among women in the Indian information technology
sector.,Women in Management Review, 19(7), 356–363
3. Hussin Wan WMA, Ahmad.S, Ahmad Sheikh MS, “Stress Management and its effect on
the performance of young site engineers and Land Surveyors in Malaysia” Pranjana, Vol.7
No.1 Jan-July,2004, Pg.77-89.
4. Mathur N.Ajeet and Salmi Anja, “The Politics of Disharmony in Management of Gender
Differences” Vikalpa, Vol.31, No.3, July-September 2006, pp.81-93. Agrawal Rakesh
Kumar l and Singh Chahar Shailendra “Examining Role stress among technical students in
India” „Springer Netherlands -Social Psychology of Education, Vol 10, No. 1 March 2007
5. Pareek Udai, “Training Instruments in HRD and OD” Tata McGraw-Hill Publishing
Limited, 2nd
Edition, 2002.
6. Pastey S. Geeta, Aminbhavi A Vijayalaxmi, “Impact of Emotional Maturity on Stress and
Self Confidence of Adolescents”
http://www.jiaap.org/index.php?option=com_content&task=view&id=35&Itemid=5

The International Journal of Indian Psychology: Volume: 01 | Issue: 03 | ISSN 2348-5396
© 2014 www.ijip.in April – June 2014 160 | P a g e
7. Rao K; Moudud S; Subbakrishna DK, “Appraisal of stress and coping behaviour in college
students” 2000 Jan- Jul; 26(1-2): 5-13:
http://www.jiaap.org/index.php?option=com_content&task=view&id=35&Itemid=5
8. Pestonjee, D.M. & Pareek, U. (1997). Studies in organizational role stress and coping.
a. Jaipur: Rawat
9. Pestonjee D M & Mishra Prabhat Kumar, 1998. "Role Stress and Job Satisfaction Amongst
Doctors," IIMA Working Papers1998-09-04, Indian Institute of Management Ahmedabad,
Research and Publication Department. http://ideas.repec.org/p/iim/iimawp/1998-09-
04.html
10. Rich A.Gregory “Role overload among undergraduate college students” Working Paper
submitted August 28, 2007
11. Saxena meena and Saxena Arun “Role of Simlations – College festivals in developing
managerial skills” The Icfian Journal of Management Research, Vol.5, No.11, 2006.

The International Journal of Indian Psychology: Volume: 01 | Issue: 03 | ISSN 2348-5396
© 2014 www.ijip.in April – June 2014 161 | P a g e
Mental Health among Married and Unmarried Women
Alpesh B. Kotar*
Abstract
The main purpose of this research was to find out the main difference between married
and unmarried women‟s mental health. The total sample consists of 60 women (30 married and
30 unmarried women). Sample was taken from Bhavnagar city. Scale was use for data collection
is mental health scale by Dr. A. K. Shreevastav and Dr. Jagdish (1983). Data was analyzed by „t‟
test. Result show, there is significant difference between the married and unmarried women.
Introduction
The present time is an era of Science and Technology, which extends many more
facilities to mankind. But today the quantum of mental tension has increased. God has granted
body and mind to mankind. A human being consumes good food to maintain the body in good
condition. As the body remains healthy, similarly the mind should also remain healthy. Hence,
man should perform mental exercise. The mankind has to continuously struggle because of
unemployment, corruption and other problems in present times, which affects his mental health.
Many problems arise during the life of man, but he should face them, then only he is called
healthy by mind. Just like physical health of an individual is good, similarly his mental health
should also be good.
More recently, the concept of mental health has received added significance because of
changing societal complexity and global problems. Traditionally, the absence of negative mental
states such as depression and anxiety present a picture of mental health, with the emergence of
health Psychology, Psychologists, have indicated presence of positive aspects like achievement,
personal competence autonomy etc as more important criteria of mental health. Involvement is a
central life interest. Show according to Cochin. “Positive Mental Health is the key of person‟s
cohesive development.”
“Mental health is the adjustment of human being to the world and to each other with a
maximum of effectiveness and happiness” Menninger (1945)
“Mental health includes precautionary steps to prevent mental illness, and though growth
can be seen in mental health” Walter.J.Coville
*Assistant Professor, Department of Psychology, Nandkunvarba Mahila Arts College,
Bhavnagar

The International Journal of Indian Psychology: Volume: 01 | Issue: 03 | ISSN 2348-5396
© 2014 www.ijip.in April – June 2014 162 | P a g e
“In individual view or societal view or in any kind of behavioral growth which requires a
great strength to solve the problem is mental health” Hadley
Aims of the study
The main aims of the present study are as under;
To study the mental health among the married and unmarried women.
Hypothesis
There is no significant difference between in mental health of the married and unmarried
women.
Research Methodology
Variables
(1) Independent Variables
(1) Married women
(2) Unmarried women
(2) Dependent Variables:
(1) Mental Heal
Sample
Sample in this study consisted of 60 subjects having 30 married and 30 unmarried women
from Bhavnagar city.
Tools Used
The following tools were used in the present study;
(1) Personal Data Sheet
A personal data sheet developed by the investigator was used to collect information about
types of marriage states.
(2) Mental Health Scale
Mental health questionnaire by A.K. Shreevastav and Dr. Jagdish (1983) was used for
data collection. This scale is reliability of 0.75 and validity of 0.54.

The International Journal of Indian Psychology: Volume: 01 | Issue: 03 | ISSN 2348-5396
© 2014 www.ijip.in April – June 2014 163 | P a g e
Statistical Analysis
In this study„t‟ test was used for statistical analysis.
Result and Discussion
Showing the mean difference between the two groups as married and unmarried
women in terms of their mental health.
Variable Group N Mean SD T Significant
Mental
Health
(1) Married 30 123.37 20.38 5.27* 0.01
(2) Unmarried 30 118.10 14.93
*P<0.01
The above table shows the mean difference between two groups in terms of mental
health. The mean for the married women is 123.37 and SD 20.38, as well as the mean of
Unmarried women is 118.10 and SD 14.93. The obtained ‟t‟ is 5.27, that is significant at 0.01
level. Hence it is concluded that there is significant difference between married and unmarried
women in terms of their mental health. Since the high score of mental health indicates good
mental health, married women show good mental health than unmarried women. This result
rejected the hypothesis that “there is no significant difference between the mental health of the
married and unmarried women”.
Conclusion
There is significant mean difference between the mental health of the married and
unmarried women.
Reference
Basu, S. “mental health concerns for Indian women 2004 India
Bhatt.D.J. (1992). Mental health inventory, department of Psychology saurashtra
university, Rajkot.
Bollou, M. and Gabalar, N.W. (1985). Feminist position on mental health. Springfield,
IL: Charles c Thomas.
Davar, B.V. (1999). Mental health of Indian women: APA feminist agenda New Delhi,
sage.
Denier, E. (1984). Subjective well-being Psychological Bulletin, 95, 542-575.

The International Journal of Indian Psychology: Volume: 01 | Issue: 03 | ISSN 2348-5396
© 2014 www.ijip.in April – June 2014 164 | P a g e
Mohan R. (1993). „Three shifts Rotation and worker‟s mental health‟, Indian journal of
clinical Psychology, vol.10, PP. 369-72.
Raju, M.V.R, “Health Psychology & Counseling”, 1st edition-2009, Discovery publishing
house Pvt. CTD. New Delhi, page no.33.
Srivastva, S.K.1997, "developing Human Relation and Ethnic Understanding."
Proceeding of the 2nd ASIAN and 33rd IAAP International Conference 26-28 February.

